Pdia4 regulates β‐cell pathogenesis in diabetes: molecular ...
21
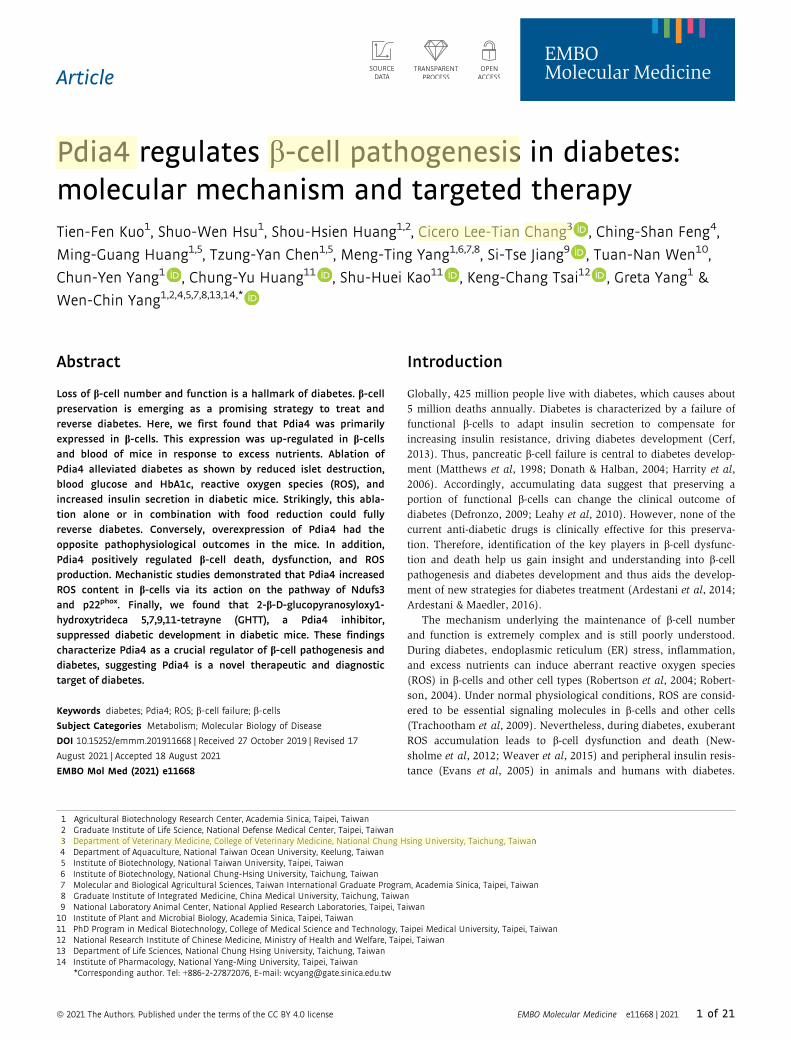
Article Pdia4 regulates b-cell pathogenesis in diabetes: molecular mechanism and targeted therapy Tien-Fen Kuo 1 , Shuo-Wen Hsu 1 , Shou-Hsien Huang 1,2 , Cicero Lee-Tian Chang 3 , Ching-Shan Feng 4 , Ming-Guang Huang 1,5 , Tzung-Yan Chen 1,5 , Meng-Ting Yang 1,6,7,8 , Si-Tse Jiang 9 , Tuan-Nan Wen 10 , Chun-Yen Yang 1 , Chung-Yu Huang 11 , Shu-Huei Kao 11 , Keng-Chang Tsai 12 , Greta Yang 1 & Wen-Chin Yang 1,2,4,5,7,8,13,14,* Abstract Loss of b-cell number and function is a hallmark of diabetes. b-cell preservation is emerging as a promising strategy to treat and reverse diabetes. Here, we first found that Pdia4 was primarily expressed in b-cells. This expression was up-regulated in b-cells and blood of mice in response to excess nutrients. Ablation of Pdia4 alleviated diabetes as shown by reduced islet destruction, blood glucose and HbA1c, reactive oxygen species (ROS), and increased insulin secretion in diabetic mice. Strikingly, this abla- tion alone or in combination with food reduction could fully reverse diabetes. Conversely, overexpression of Pdia4 had the opposite pathophysiological outcomes in the mice. In addition, Pdia4 positively regulated b-cell death, dysfunction, and ROS production. Mechanistic studies demonstrated that Pdia4 increased ROS content in b-cells via its action on the pathway of Ndufs3 and p22 phox . Finally, we found that 2-b-D-glucopyranosyloxy1- hydroxytrideca 5,7,9,11-tetrayne (GHTT), a Pdia4 inhibitor, suppressed diabetic development in diabetic mice. These findings characterize Pdia4 as a crucial regulator of b-cell pathogenesis and diabetes, suggesting Pdia4 is a novel therapeutic and diagnostic target of diabetes. Keywords diabetes; Pdia4; ROS; b-cell failure; b-cells Subject Categories Metabolism; Molecular Biology of Disease DOI 10.15252/emmm.201911668 | Received 27 October 2019 | Revised 17 August 2021 | Accepted 18 August 2021 EMBO Mol Med (2021)e11668 Introduction Globally, 425 million people live with diabetes, which causes about 5 million deaths annually. Diabetes is characterized by a failure of functional b-cells to adapt insulin secretion to compensate for increasing insulin resistance, driving diabetes development (Cerf, 2013). Thus, pancreatic b-cell failure is central to diabetes develop- ment (Matthews et al, 1998; Donath & Halban, 2004; Harrity et al, 2006). Accordingly, accumulating data suggest that preserving a portion of functional b-cells can change the clinical outcome of diabetes (Defronzo, 2009; Leahy et al, 2010). However, none of the current anti-diabetic drugs is clinically effective for this preserva- tion. Therefore, identification of the key players in b-cell dysfunc- tion and death help us gain insight and understanding into b-cell pathogenesis and diabetes development and thus aids the develop- ment of new strategies for diabetes treatment (Ardestani et al, 2014; Ardestani & Maedler, 2016). The mechanism underlying the maintenance of b-cell number and function is extremely complex and is still poorly understood. During diabetes, endoplasmic reticulum (ER) stress, inflammation, and excess nutrients can induce aberrant reactive oxygen species (ROS) in b-cells and other cell types (Robertson et al, 2004; Robert- son, 2004). Under normal physiological conditions, ROS are consid- ered to be essential signaling molecules in b-cells and other cells (Trachootham et al, 2009). Nevertheless, during diabetes, exuberant ROS accumulation leads to b-cell dysfunction and death (New- sholme et al, 2012; Weaver et al, 2015) and peripheral insulin resis- tance (Evans et al, 2005) in animals and humans with diabetes. 1 Agricultural Biotechnology Research Center, Academia Sinica, Taipei, Taiwan 2 Graduate Institute of Life Science, National Defense Medical Center, Taipei, Taiwan 3 Department of Veterinary Medicine, College of Veterinary Medicine, National Chung Hsing University, Taichung, Taiwan 4 Department of Aquaculture, National Taiwan Ocean University, Keelung, Taiwan 5 Institute of Biotechnology, National Taiwan University, Taipei, Taiwan 6 Institute of Biotechnology, National Chung-Hsing University, Taichung, Taiwan 7 Molecular and Biological Agricultural Sciences, Taiwan International Graduate Program, Academia Sinica, Taipei, Taiwan 8 Graduate Institute of Integrated Medicine, China Medical University, Taichung, Taiwan 9 National Laboratory Animal Center, National Applied Research Laboratories, Taipei, Taiwan 10 Institute of Plant and Microbial Biology, Academia Sinica, Taipei, Taiwan 11 PhD Program in Medical Biotechnology, College of Medical Science and Technology, Taipei Medical University, Taipei, Taiwan 12 National Research Institute of Chinese Medicine, Ministry of Health and Welfare, Taipei, Taiwan 13 Department of Life Sciences, National Chung Hsing University, Taichung, Taiwan 14 Institute of Pharmacology, National Yang-Ming University, Taipei, Taiwan *Corresponding author. Tel: +886-2-27872076, E-mail: [email protected] ª 2021 The Authors. Published under the terms of the CC BY 4.0 license EMBO Molecular Medicine e11668 | 2021 1 of 21
Transcript of Pdia4 regulates β‐cell pathogenesis in diabetes: molecular ...
Article
Pdia4 regulates b-cell pathogenesis in diabetes:molecular mechanism and targeted therapyTien-Fen Kuo1, Shuo-Wen Hsu1, Shou-Hsien Huang1,2, Cicero Lee-Tian Chang3 , Ching-Shan Feng4,
Ming-Guang Huang1,5, Tzung-Yan Chen1,5, Meng-Ting Yang1,6,7,8, Si-Tse Jiang9 , Tuan-Nan Wen10,
Chun-Yen Yang1 , Chung-Yu Huang11 , Shu-Huei Kao11 , Keng-Chang Tsai12 , Greta Yang1 &
Wen-Chin Yang1,2,4,5,7,8,13,14,*
Abstract
Loss of b-cell number and function is a hallmark of diabetes. b-cellpreservation is emerging as a promising strategy to treat andreverse diabetes. Here, we first found that Pdia4 was primarilyexpressed in b-cells. This expression was up-regulated in b-cellsand blood of mice in response to excess nutrients. Ablation ofPdia4 alleviated diabetes as shown by reduced islet destruction,blood glucose and HbA1c, reactive oxygen species (ROS), andincreased insulin secretion in diabetic mice. Strikingly, this abla-tion alone or in combination with food reduction could fullyreverse diabetes. Conversely, overexpression of Pdia4 had theopposite pathophysiological outcomes in the mice. In addition,Pdia4 positively regulated b-cell death, dysfunction, and ROSproduction. Mechanistic studies demonstrated that Pdia4 increasedROS content in b-cells via its action on the pathway of Ndufs3and p22phox. Finally, we found that 2-b-D-glucopyranosyloxy1-hydroxytrideca 5,7,9,11-tetrayne (GHTT), a Pdia4 inhibitor,suppressed diabetic development in diabetic mice. These findingscharacterize Pdia4 as a crucial regulator of b-cell pathogenesis anddiabetes, suggesting Pdia4 is a novel therapeutic and diagnostictarget of diabetes.
Keywords diabetes; Pdia4; ROS; b-cell failure; b-cells
Subject Categories Metabolism; Molecular Biology of Disease
DOI 10.15252/emmm.201911668 | Received 27 October 2019 | Revised 17
August 2021 | Accepted 18 August 2021
EMBO Mol Med (2021) e11668
Introduction
Globally, 425 million people live with diabetes, which causes about
5 million deaths annually. Diabetes is characterized by a failure of
functional b-cells to adapt insulin secretion to compensate for
increasing insulin resistance, driving diabetes development (Cerf,
2013). Thus, pancreatic b-cell failure is central to diabetes develop-
ment (Matthews et al, 1998; Donath & Halban, 2004; Harrity et al,
2006). Accordingly, accumulating data suggest that preserving a
portion of functional b-cells can change the clinical outcome of
diabetes (Defronzo, 2009; Leahy et al, 2010). However, none of the
current anti-diabetic drugs is clinically effective for this preserva-
tion. Therefore, identification of the key players in b-cell dysfunc-tion and death help us gain insight and understanding into b-cellpathogenesis and diabetes development and thus aids the develop-
ment of new strategies for diabetes treatment (Ardestani et al, 2014;
Ardestani & Maedler, 2016).
The mechanism underlying the maintenance of b-cell number
and function is extremely complex and is still poorly understood.
During diabetes, endoplasmic reticulum (ER) stress, inflammation,
and excess nutrients can induce aberrant reactive oxygen species
(ROS) in b-cells and other cell types (Robertson et al, 2004; Robert-
son, 2004). Under normal physiological conditions, ROS are consid-
ered to be essential signaling molecules in b-cells and other cells
(Trachootham et al, 2009). Nevertheless, during diabetes, exuberant
ROS accumulation leads to b-cell dysfunction and death (New-
sholme et al, 2012; Weaver et al, 2015) and peripheral insulin resis-
tance (Evans et al, 2005) in animals and humans with diabetes.
1 Agricultural Biotechnology Research Center, Academia Sinica, Taipei, Taiwan2 Graduate Institute of Life Science, National Defense Medical Center, Taipei, Taiwan3 Department of Veterinary Medicine, College of Veterinary Medicine, National Chung Hsing University, Taichung, Taiwan4 Department of Aquaculture, National Taiwan Ocean University, Keelung, Taiwan5 Institute of Biotechnology, National Taiwan University, Taipei, Taiwan6 Institute of Biotechnology, National Chung-Hsing University, Taichung, Taiwan7 Molecular and Biological Agricultural Sciences, Taiwan International Graduate Program, Academia Sinica, Taipei, Taiwan8 Graduate Institute of Integrated Medicine, China Medical University, Taichung, Taiwan9 National Laboratory Animal Center, National Applied Research Laboratories, Taipei, Taiwan10 Institute of Plant and Microbial Biology, Academia Sinica, Taipei, Taiwan11 PhD Program in Medical Biotechnology, College of Medical Science and Technology, Taipei Medical University, Taipei, Taiwan12 National Research Institute of Chinese Medicine, Ministry of Health and Welfare, Taipei, Taiwan13 Department of Life Sciences, National Chung Hsing University, Taichung, Taiwan14 Institute of Pharmacology, National Yang-Ming University, Taipei, Taiwan
*Corresponding author. Tel: +886-2-27872076, E-mail: [email protected]
ª 2021 The Authors. Published under the terms of the CC BY 4.0 license EMBO Molecular Medicine e11668 | 2021 1 of 21
admin
螢光標示
admin
螢光標示
admin
螢光標示
admin
螢光標示
Autophagy, apoptosis, and necrosis are implicated in b-cell death(Nakamura et al, 2006; Quan et al, 2012). The mitochondrial
electron transport chain (ETC) is thought to be a major machin-
ery for ROS production in b-cells though NADPH oxidase (Nox),
ER oxidoreductin 1 (Ero1), and certain pathways may also be
implicated (Bindokas et al, 2003; Harrity et al, 2006; Leung &
Leung, 2008). In contrast, ROS can be eliminated by antioxidant
proteins such as glutathione peroxidase (Gpx), catalase, and
superoxide dismutases (Sod). In particular, b-cells are more
vulnerable to aberrant ROS than other cell types due to the low
expression level of antioxidant proteins (Lenzen et al, 1996;
Tiedge et al, 1997).
Protein disulfide isomerases (Pdis) in mammals, including eight
typical Pdis with CGHC motifs and 13 atypical Pdis with C/SXXC/S
motifs, represent a family of multifunctional enzymes with oxidore-
ductase and chaperone activities (Maattanen et al, 2006). Most of
the Pdis have an ER retention motif (Ni & Lee, 2007; Galligan &
Petersen, 2012). However, more and more data show that in addi-
tion to being present in the cytosol (ER and other organelles),
Pdis reside in the nuclei and membrane (Turano et al, 2002) and
plasma of different cell types (https://www.proteinatlas.org/
ENSG00000155660-Pdia4/cell). Thus, Pdis are thought to possess
ER-relevant and ER-irrelevant localizations and functions such as
other ER chaperones (Schultz-Norton et al, 2006; Xiong et al, 2012).
This family is presumed to implement their functions via multiple
mechanisms, e.g., the catalysis of disulfide bonds and conforma-
tional maintenance and regulation of their specific interaction part-
ners and substrates (Maattanen et al, 2006; Schultz-Norton et al,
2006). More recently, Pdia1 has been characterized as a molecular
chaperone to activate estrogen receptor via stabilizing the receptor
(Schultz-Norton et al, 2006; Xiong et al, 2012). The role of Pdis in
health and disease is poorly studied (Ni & Lee, 2007; Galligan &
Petersen, 2012) though they might be implicated in infection (Nag-
uleswaran et al, 2005; Ou & Silver, 2006), fertilization (Ellerman
et al, 2006), coagulation (Manukyan et al, 2008), immunity (Garbi
et al, 2006), tumors (Goplen et al, 2006), or cell viability/growth (Li
& Lee, 1991; Severino et al, 2007). Emerging evidence obtained
from yeast and worms suggests that the function of Pdis is not
always redundant (Norgaard et al, 2001; Winter et al, 2007). Pdia4
is structurally unique because it is the largest member with three
GCHC motifs in the family. Unlike Pdia3 (Garbi et al, 2006), Pdia4
is not an essential gene since its knockout mice were shown to
survive without any noticeable phenotype (Almeida et al, 2011; Kuo
et al, 2017). Its expression could be further induced by calcium flux
(Li & Lee, 1991), ER stress (Li & Lee, 1991; Parker et al, 2001) and
hypoxia (Pawar et al, 2011) in tumors. However, like other Pdis,
nothing is known about the role of Pdia4 in diabetes, and its thera-
peutic potential and molecular basis in diabetes has not been deci-
phered.
In this study, we first evaluated the expression level of Pdia4
in the pancreatic islets and sera in mice and humans. Next, mice
with Pdia4 knockout and overexpression were generated to evalu-
ate the impact of Pdia4 on b-cell pathogenesis and diabetes. In
parallel, we elucidated the molecular mechanism of Pdia4 in ROS
generation and b-cell pathogenesis. Finally, we identified 2-b-D-glucopyranosyloxy1-hydroxytrideca 5,7,9,11-tetrayne (GHTT) as a
Pdia4 inhibitor, which was used to assess its anti-diabetic potential
in diabetic mice.
Results
Up-regulation of Pdia4 protein in pancreatic islets and sera ofmouse and human origin in response to excess nutrients
To explore the likely role of Pdis in b-cells, we first compared the
mRNA level of 8 typical Pdis (a1, a2, a3, a4, a5, a6, a13, and a15)
and 2 atypical Pdis (a16 and a19) in Min6 cells, a mouse b-cell line,and mouse islets. The real-time polymerase chain reaction (RT–PCR)
data showed that 4 Pdis (a1, a3, a4, and a6) had a higher transcrip-
tional level than the rest in those cells (Appendix Fig S1A). In marked
contrast, the protein level of Pdia4, but not Pdia1, Pdia3, or Pdia6,
was up-regulated by glucose in Min6 cells (Appendix Fig S1B). This
up-regulation was consistent with the presence of a putative ER stress
responsive element (ERSE) in the Pdia4 promoter (Appendix Fig
S1C). Further, high glucose increased the activity of Pdia4 promoter
in Min6 cells (Appendix Fig S1D). Next, we investigated the expres-
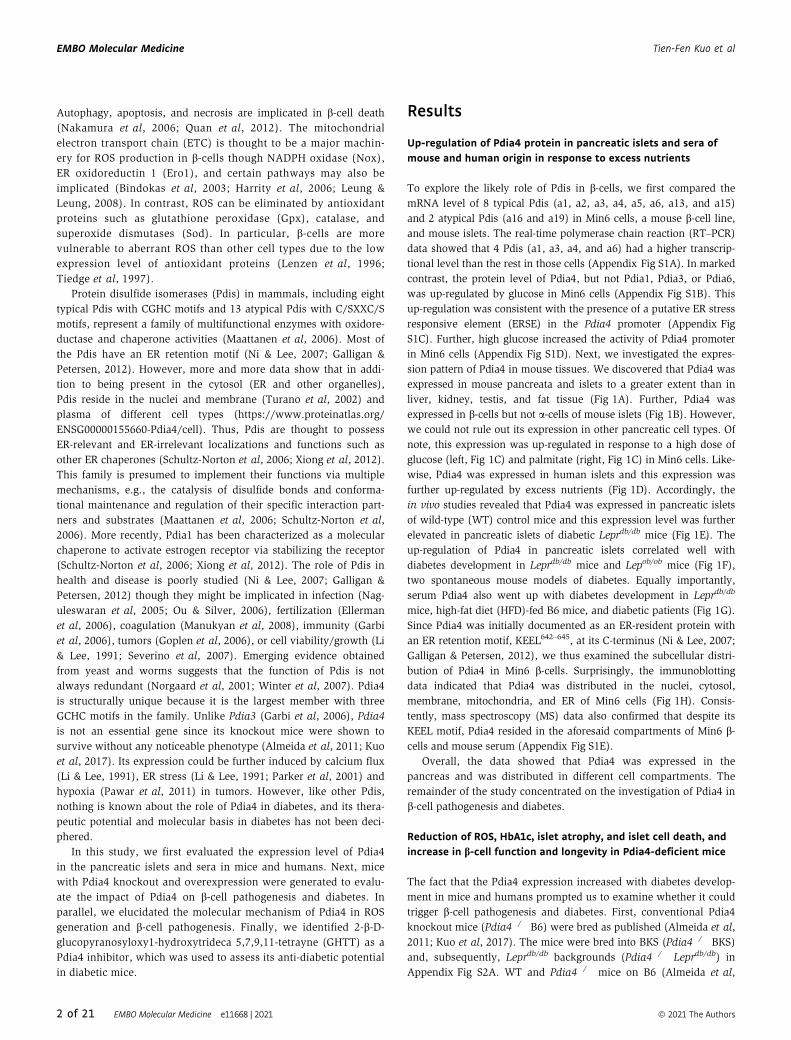
sion pattern of Pdia4 in mouse tissues. We discovered that Pdia4 was
expressed in mouse pancreata and islets to a greater extent than in
liver, kidney, testis, and fat tissue (Fig 1A). Further, Pdia4 was
expressed in b-cells but not a-cells of mouse islets (Fig 1B). However,
we could not rule out its expression in other pancreatic cell types. Of
note, this expression was up-regulated in response to a high dose of
glucose (left, Fig 1C) and palmitate (right, Fig 1C) in Min6 cells. Like-
wise, Pdia4 was expressed in human islets and this expression was
further up-regulated by excess nutrients (Fig 1D). Accordingly, the
in vivo studies revealed that Pdia4 was expressed in pancreatic islets
of wild-type (WT) control mice and this expression level was further
elevated in pancreatic islets of diabetic Leprdb/db mice (Fig 1E). The
up-regulation of Pdia4 in pancreatic islets correlated well with
diabetes development in Leprdb/db mice and Lepob/ob mice (Fig 1F),
two spontaneous mouse models of diabetes. Equally importantly,
serum Pdia4 also went up with diabetes development in Leprdb/db
mice, high-fat diet (HFD)-fed B6 mice, and diabetic patients (Fig 1G).
Since Pdia4 was initially documented as an ER-resident protein with
an ER retention motif, KEEL642–645, at its C-terminus (Ni & Lee, 2007;
Galligan & Petersen, 2012), we thus examined the subcellular distri-
bution of Pdia4 in Min6 b-cells. Surprisingly, the immunoblotting
data indicated that Pdia4 was distributed in the nuclei, cytosol,
membrane, mitochondria, and ER of Min6 cells (Fig 1H). Consis-
tently, mass spectroscopy (MS) data also confirmed that despite its
KEEL motif, Pdia4 resided in the aforesaid compartments of Min6 b-cells and mouse serum (Appendix Fig S1E).
Overall, the data showed that Pdia4 was expressed in the
pancreas and was distributed in different cell compartments. The
remainder of the study concentrated on the investigation of Pdia4 in
b-cell pathogenesis and diabetes.
Reduction of ROS, HbA1c, islet atrophy, and islet cell death, andincrease in b-cell function and longevity in Pdia4-deficient mice
The fact that the Pdia4 expression increased with diabetes develop-
ment in mice and humans prompted us to examine whether it could
trigger b-cell pathogenesis and diabetes. First, conventional Pdia4
knockout mice (Pdia4�/� B6) were bred as published (Almeida et al,
2011; Kuo et al, 2017). The mice were bred into BKS (Pdia4�/� BKS)
and, subsequently, Leprdb/db backgrounds (Pdia4�/� Leprdb/db) in
Appendix Fig S2A. WT and Pdia4�/� mice on B6 (Almeida et al,
2 of 21 EMBO Molecular Medicine e11668 | 2021 ª 2021 The Authors
EMBO Molecular Medicine Tien-Fen Kuo et al
A B
C
E
G H
F
D
Figure 1. Expression and distribution of Pdia4 in pancreatic islets and/or other tissues.
A Total lysates of different mouse organs underwent immunoblotting analysis using anti-Pdia4 and anti-actin antibodies.B Confocal analysis of Pdia4 and insulin (Ins) or glucagon (Gcg) in mouse islets. The tissues were stained with the indicated antibodies and analyzed using a confocal
microscope. Scale bar = 100 lm.C Min6 cells were treated with glucose and palmitate at the indicated dosages. Total lysate underwent immunoblotting analysis using the indicated antibodies.D Human islets were treated with glucose and palmitate at the indicated dosages, followed by immunoblotting analysis.E The islets of WT BKS and diabetic Leprdb/db mice underwent immunoblotting analysis.F IHC analysis of the islets from Leprdb/db and Lepob/ob mice at the indicated ages using anti-Pdia4 antibody and hematoxylin. Scale bar = 100 lm. The dash circles
indicate islet regions.G Sera from wild-type (WT) BKS and Leprdb/db mice, aged 4, 8, and 18 weeks, B6 mice, fed with a normal diet (ND) and a high-fat diet (HFD) for 4 weeks, and humans,
healthy volunteers and diabetic patients (T2D), were quantified for Pdia4 level using an anti-Pdia4 ELISA kit.H Immunoblotting analysis of Pdia4 and markers in the cytosolic (Cyto), nuclear (Nuc), membrane (Mem), mitochondrial (Mito), and ER compartments of Ming 6 cells
using the indicated antibodies.
Data information: Data from 3 experiments (A–E, F and H) and more (G) are presented as the mean � SD. One-way ANOVA test was used for statistical analysis ofdifferences between groups, and P (*) < 0.05; P (**) < 0.01 and P (***) < 0.001 are considered statistically significant. The number of mice (n) is indicated in parentheses.Source data are available online for this figure.
ª 2021 The Authors EMBO Molecular Medicine e11668 | 2021 3 of 21
Tien-Fen Kuo et al EMBO Molecular Medicine
2011; Kuo et al, 2017) and BKS backgrounds (Appendix Fig S2)
were diabetes-free. As expected, Leprdb/db mice spontaneously
developed diabetes by 8 weeks of age and this diabetes became
more severe with age as evidenced by fasting blood glucose (FBG,
Appendix Fig S2A), postprandial blood glucose (PBG, Appendix Fig
S2A), the percentage of glycosylated hemoglobin A1c (HbA1c,
Appendix Fig S2B), glucose tolerance (Appendix Fig S2C), homeo-
static model assessment (HOMA) indices (Appendix Fig S2D), and
diabetic incidence (Appendix Fig S2E). In sharp contrast, Pdia4�/-
�Leprdb/db mice developed borderline diabetes with average FBG
and PBG of around 109 and 289 mg/dl at 24 weeks of age, respec-
tively (Appendix Fig S2A). Closer analysis revealed that 58% of the
Pdia4�/�Leprdb/db mice whose PBG was 137 mg/dl by 24 weeks of
age, were diabetes-free (Pdia4�/�Leprdb/db, Appendix Fig S2E)
compared to the rest (42%) which exhibited slight diabetes with
PBG around 340 mg/dl (Pdia4�/�Leprdb/db, Appendix Fig S2E). The
diabetes-free and diabetic mice had daily food intake of 6.8 and
7.9 g, respectively. Regression analysis indicated a strong correla-
tion between PBG and food intake in Pdia4�/�Leprdb/db mice
(R2 = 0.98, Appendix Fig S2F). Consistently, Pdia4�/�Leprdb/db
mice, given 6.8 g feed/day/mouse from 4 to 24 weeks of age,
showed completely arrested diabetes development (Pdia4�/�Leprdb/db + FR, Appendix Fig S2E). In contrast, a ROS scavenger, vitamin
C, at 375 mg/kg failed to affect diabetes development in Leprdb/db
mice (Leprdb/db + VitC, Appendix Fig S2E). As published (Brem
et al, 2007), Leprdb/db mice showed decreased food intake and PBG
with age over a period of 90 weeks (Appendix Fig S3A and B).
However, Pdia4�/�Leprdb/db mice, aged 55 weeks and over, had
much lower PBG and HbA1c than the age-matched Leprdb/db mice
(Appendix Fig S3B and C). Of note, Pdia4�/�Leprdb/db mice showed
more effective amelioration of diabetes than the age-matched
Leprdb/db mice as shown by water consumption (right, Appendix Fig
S3A), PBG (Appendix Fig S3B), glucose tolerance (Appendix Fig
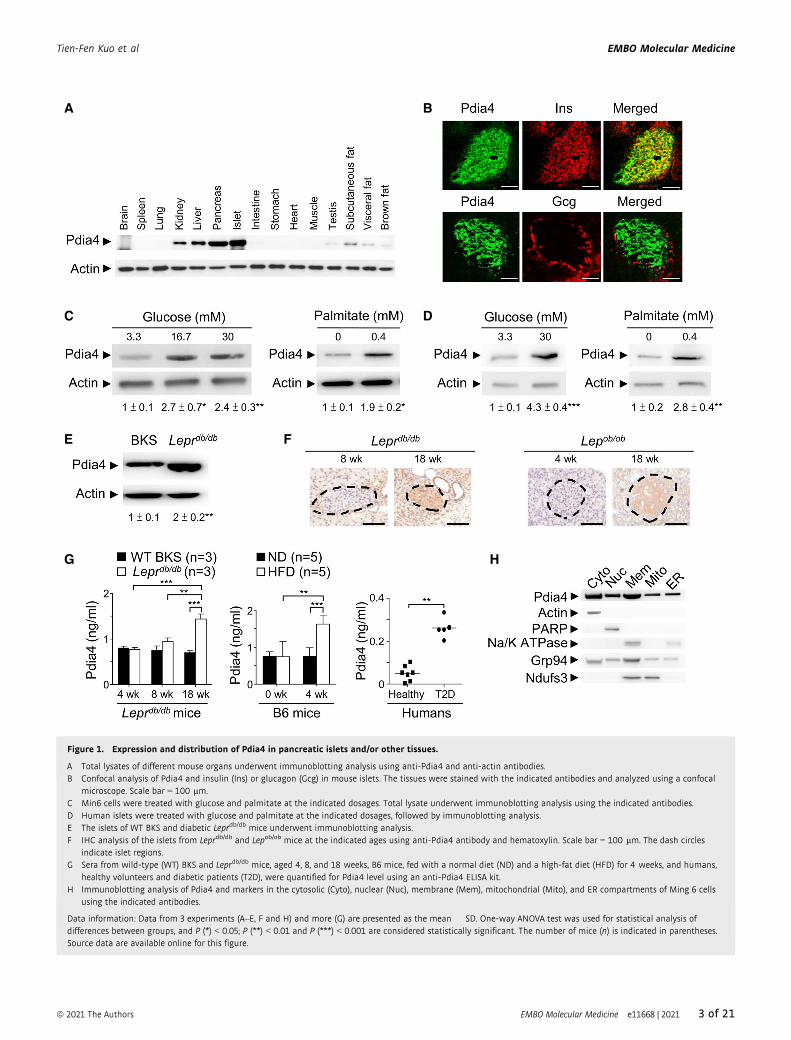
S3D), islet preservation (Appendix Fig S3E), survival rate (top,
Fig 2A), and life span (bottom, Fig 2A). No significant difference in
food intake was observed between Leprdb/db and Pdia4�/�Leprdb/db
mice, from 8 to 90 weeks (left, Appendix Fig S3A). Strikingly, all
the Pdia4�/�Leprdb/db mice became diabetes-free by the age of
55 weeks and beyond, which correlated with decreased food intake
in aged mice (Appendix Fig S3).
We also examined the structure and function of pancreatic islets
in WT and Pdia4�/�mice. Islet size in the four mouse lines aged
18 weeks was in the following ascending order: Leprdb/db mice <
WT BKS mice = Pdia4�/� BKS mice < Pdia4�/�Leprdb/db mice (aIns,Fig 2B). Also of note, the degree of islet atrophy in both mouse
backgrounds correlated with ROS accumulation in islets (dihy-
droethidium (DHE), Fig 2B) and blood (Fig 2C). To investigate
the role of Pdia4 in b-cell proliferation and demise, we checked
cell proliferation and death of mouse islets using 5-bromo-2-
deoxyuridine (BrdU) labeling assays and terminal deoxynucleotidyl
transferase dUTP nick end labeling (TUNEL), respectively. BrdU
data showed no significant difference in cell proliferation of pancre-
atic islets between WT and Pdia4�/� mice on BKS and Leprdb/db
backgrounds irrespective of Pdia4 content (left, Fig 2D). In sharp
contrast, Leprdb/db mice had more TUNEL-positive islet cells, dead
cells, and living cells undergoing proliferation and repair, than
Pdia4�/�Leprdb/db mice, WT, and Pdia4�/� BKS mice (right, Fig 2D).
Both types of assays suggest that Pdia4 is inversely correlated to cell
death in mouse islets. Furthermore, we generated islet-specific Pdia4
knockout mice (Pdia4f/fLeprdb/dbCretg/0) to verify the islet-specific
function of Pdia4 in islets and diabetes (Appendix Fig S4). The
conditional Pdia4 knockout mice (Appendix Fig S4) had similar pre-
clinical parameters to the conventional Pdia4 knockout mice (Fig 2
and Appendix Fig S2) in terms of FBG, PBG, HbA1c, serum insulin,
islet atrophy, ROS, HOMA indices, and glucose tolerance.
Moreover, Pdia4�/� mice had better b-cell function than WT
mice on BKS and Leprdb/db backgrounds as evidenced by HOMA-b(Appendix Fig S2D), serum insulin (Fig 2E), and glucose-stimulated
insulin secretion (GSIS) (Fig 2F). At 8 weeks of age, Leprdb/db and
Pdia4�/�Leprdb/db mice had a high but similar level of serum insulin
compared to a low serum insulin level in WT BKS and Pdia4�/�
BKS mice (8 weeks, Fig 2E). However, at 18 weeks of age and
beyond, Pdia4�/�Leprdb/db mice continued to produce high serum
insulin while Leprdb/db mice gradually lost their serum insulin (18
and 30 weeks, Fig 2E). Consistently, GSIS data indicated that
Pdia4�/� islets had better function than WT islets regardless of
mouse background (Fig 2F). Serum insulin change seemed to reflect
the status of b-cell function and/or insulin resistance.
Taken together, the loss-of-function data suggest that Pdia4 is a
key regulator for b-cell pathogenesis and diabetes.
Increase in diabetes, ROS, HbA1c, and islet atrophy and decreasein b-cell function in Pdia4 transgenic mice
In parallel, a gain-of-function approach was taken to confirm the
role of Pdia4 in diabetes development. Pdia4 transgenic (Pdia4tg/tg)
▸Figure 2. Pdia4 ablation increases survival rate and longevity and reduces islet atrophy, ROS production, and islet cell death, elevates serum insulin, andpotentiates b-cell GSIS in Pdia4�/�Leprdb/db mice.
A Survival rate and life span of WT, Pdia4�/� (KO), and Pdia4tg/tg (TG) mice on Leprdb/db background from birth to 120 weeks (Appendix Figs S2A and S6A).B Pancreata of 18-week-old WT and Pdia4�/� (KO) mice on BKS or Leprdb/db background were stained with anti-insulin (aIns) antibody and dihydroethidium (DHE)
(left). Islet area (lm2) and relative fluorescence intensity (RFI) were quantified (right). Scale bar: 100 lm. The dash circles indicate islet regions.C Serum ROS of the 18-week-old mice (B) were determined.D The same batch mice as in (B) were given water containing BrdU. The BrdU+ cells of the islets were visualized and quantified (BrdU+ labeling). TUNEL-positive cells
in the islets of the mice (B) were visualized and quantified (TUNEL assay). BrdU+ cells per islet area (0.01 mm2) and TUNEL+ cells per islet area (0.05 mm2) areexpressed in arbitrary units (AU). The dash circles indicate islet regions, and the black arrowheads indicate TUNEL+ cells.
E, F ELISA kits were used to quantify serum insulin (E) of the same mice as in (B) and their supernatants of the mouse islets (F) in GSIS assays. High glucose (HG,16.7 mM) or low glucose (LG, 3.3) was used in GSIS assays.
Data information: The number of mice (n) is indicated in parentheses. Data from over three experiments are presented as the mean � SD. Log rank (A) and one-wayANOVA test (B–F) were used for statistical analysis of differences between groups, and P (*) < 0.05; P (**) < 0.01 and P (***) < 0.001 are considered statistically significant.Source data are available online for this figure.
4 of 21 EMBO Molecular Medicine e11668 | 2021 ª 2021 The Authors
EMBO Molecular Medicine Tien-Fen Kuo et al
A
C
E F
D
B
Figure 2.
ª 2021 The Authors EMBO Molecular Medicine e11668 | 2021 5 of 21
Tien-Fen Kuo et al EMBO Molecular Medicine
mice on B6, BKS, and Leprdb/db backgrounds, which expressed a
high level of transgenic Pdia4 in islets, were created and monitored
for diabetes (Appendix Fig S5A). No noticeable phenotypes were
observed in WT and transgenic mice on B6 and BKS backgrounds
(Appendix Figs S5 and S6). HFD-fed B6 mice were used as a murine
model because they are closest to human metabolic syndrome (Hin-
der et al, 2017). However, HFD-fed Pdia4tg/tg B6 mice developed
moderate diabetes as evidenced by BG, HbA1c, GTT, and diabetic
A B
C D E
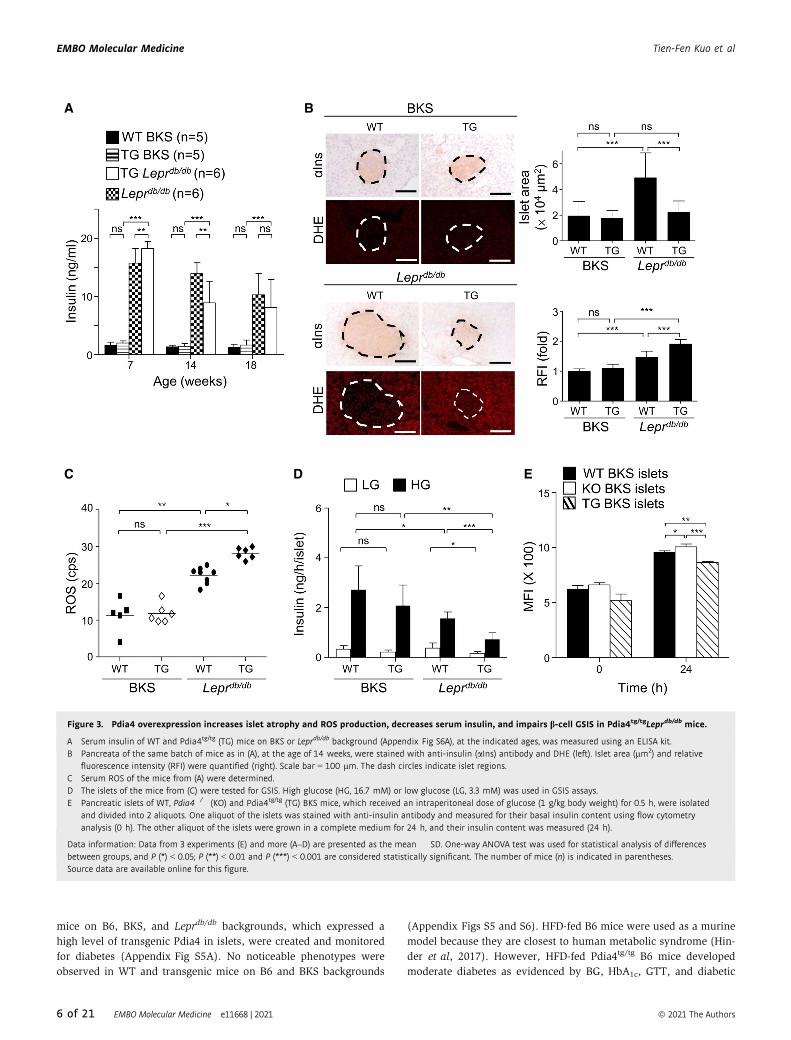
Figure 3. Pdia4 overexpression increases islet atrophy and ROS production, decreases serum insulin, and impairs b-cell GSIS in Pdia4tg/tgLeprdb/db mice.
A Serum insulin of WT and Pdia4tg/tg (TG) mice on BKS or Leprdb/db background (Appendix Fig S6A), at the indicated ages, was measured using an ELISA kit.B Pancreata of the same batch of mice as in (A), at the age of 14 weeks, were stained with anti-insulin (aIns) antibody and DHE (left). Islet area (lm2) and relative
fluorescence intensity (RFI) were quantified (right). Scale bar = 100 lm. The dash circles indicate islet regions.C Serum ROS of the mice from (A) were determined.D The islets of the mice from (C) were tested for GSIS. High glucose (HG, 16.7 mM) or low glucose (LG, 3.3 mM) was used in GSIS assays.E Pancreatic islets of WT, Pdia4�/� (KO) and Pdia4tg/tg (TG) BKS mice, which received an intraperitoneal dose of glucose (1 g/kg body weight) for 0.5 h, were isolated
and divided into 2 aliquots. One aliquot of the islets was stained with anti-insulin antibody and measured for their basal insulin content using flow cytometryanalysis (0 h). The other aliquot of the islets were grown in a complete medium for 24 h, and their insulin content was measured (24 h).
Data information: Data from 3 experiments (E) and more (A–D) are presented as the mean � SD. One-way ANOVA test was used for statistical analysis of differencesbetween groups, and P (*) < 0.05; P (**) < 0.01 and P (***) < 0.001 are considered statistically significant. The number of mice (n) is indicated in parentheses.Source data are available online for this figure.
6 of 21 EMBO Molecular Medicine e11668 | 2021 ª 2021 The Authors
EMBO Molecular Medicine Tien-Fen Kuo et al
incidence in comparison with HFD-fed WT and Pdia4�/� B6 mice
(Appendix Fig S5A–E). Further, HFD-fed Pdia4tg/tg B6 mice had
worse HOMA-b and islet atrophy than HFD-fed WT and Pdia4�/� B6
mice (Appendix Fig S5F and G). Likewise, Pdia4tg/tgLeprdb/db mice
spontaneously developed diabetes by 6 weeks of age, around
2 weeks earlier than the age-matched Leprdb/db controls, and,
finally, both lines reached a profound degree of diabetes as
evidenced by FBG, PBG and HbA1c (Appendix Fig S6A). At 7 weeks
of age, Pdia4tg/tgLeprdb/db mice had a higher level of serum insulin
than Leprdb/db mice (Fig 3A). Afterward, the serum insulin in
Pdia4tg/tgLeprdb/db and Leprdb/db gradually decreased with age (14–
18 weeks, Fig 3A). However, WT and Pdia4tg/tg BKS mice had basal
serum insulin levels that remained unaltered over the lifetime
(Fig 3A). The change in serum insulin was consistent with HOMA
indices (Appendix Fig S6B) and glucose tolerance (Appendix Fig
S6C) in the four mouse lines. Further, we checked the structure and
function of pancreatic islets in WT and Pdia4tg/tg mice on BKS and
Leprdb/db backgrounds. By 14 weeks of age, islet size in the four
mouse lines was (in descending order), Leprdb/db mice > Pdia4tg/tg
Leprdb/db mice = Pdia4tg/tg BKS mice = WT BKS mice (aIns, Fig 3B).
Similar to islet atrophy (aIns, Fig 3B), ROS accumulation in the
islets (DHE, Fig 3B), and sera (Fig 3C) of Pdia4tg/tgLeprdb/db mice
was more pronounced than that seen in the islets and sera of
Leprdb/db, Pdia4tg/tg BKS mice, and WT BKS mice. Moreover,
Pdia44tg/tgLeprdb/db mice had worse b-cell function than Leprdb/db
mice, Pdia4tg/tg BKS, and WT BKS mice as evidenced by in vitro
GSIS assays (Fig 3D) and in vivo HOMA-b (right, Appendix Fig
S6B). Accordingly, flow cytometry analysis showed that the basal
level of insulin content in Pdia4�/� islets was slightly higher than
that of insulin content in WT and Pdia4tg/tg islets (0 h, Fig 3E). Like-
wise, Pdia4�/� islets produced slightly more insulin than WT and
Pdia4tg/tg islets in complete DMEM medium 24 h post-culture (24 h,
Fig 3E). Collectively, the data on Pdia4 overexpression suggest that
Pdia4 promotes b-cell pathogenesis and diabetes.
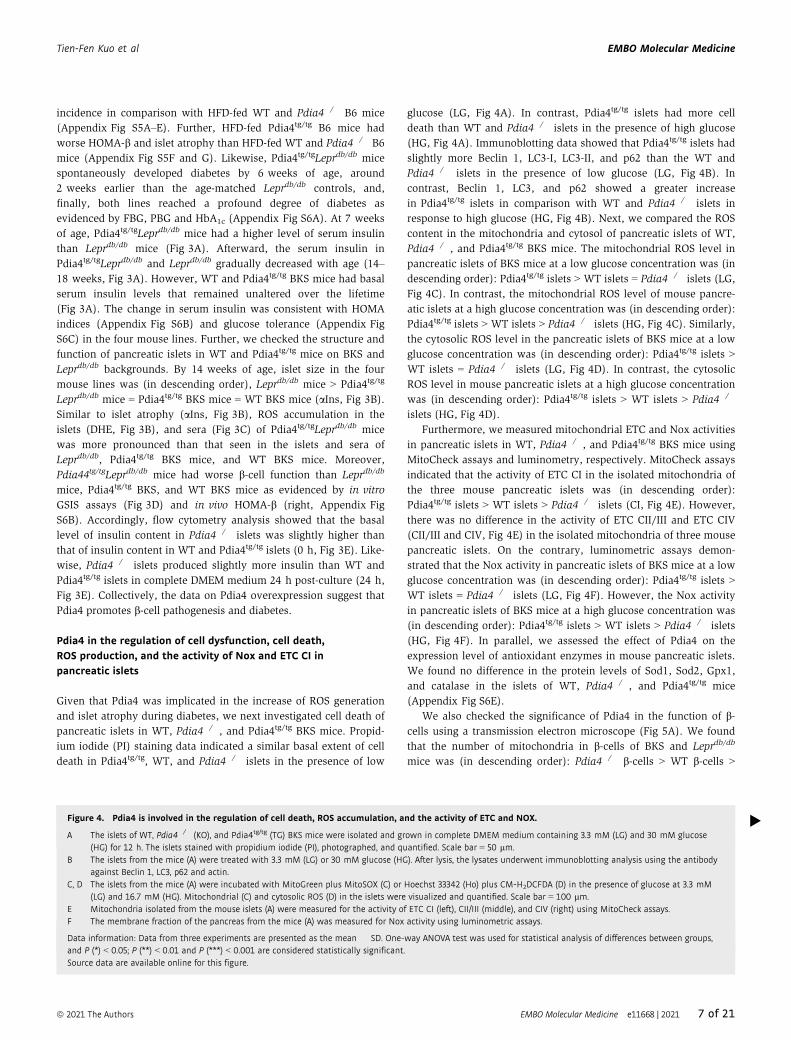
Pdia4 in the regulation of cell dysfunction, cell death,ROS production, and the activity of Nox and ETC CI inpancreatic islets
Given that Pdia4 was implicated in the increase of ROS generation
and islet atrophy during diabetes, we next investigated cell death of
pancreatic islets in WT, Pdia4�/�, and Pdia4tg/tg BKS mice. Propid-
ium iodide (PI) staining data indicated a similar basal extent of cell
death in Pdia4tg/tg, WT, and Pdia4�/� islets in the presence of low
glucose (LG, Fig 4A). In contrast, Pdia4tg/tg islets had more cell
death than WT and Pdia4�/� islets in the presence of high glucose
(HG, Fig 4A). Immunoblotting data showed that Pdia4tg/tg islets had
slightly more Beclin 1, LC3-I, LC3-II, and p62 than the WT and
Pdia4�/� islets in the presence of low glucose (LG, Fig 4B). In
contrast, Beclin 1, LC3, and p62 showed a greater increase
in Pdia4tg/tg islets in comparison with WT and Pdia4�/� islets in
response to high glucose (HG, Fig 4B). Next, we compared the ROS
content in the mitochondria and cytosol of pancreatic islets of WT,
Pdia4�/�, and Pdia4tg/tg BKS mice. The mitochondrial ROS level in
pancreatic islets of BKS mice at a low glucose concentration was (in
descending order): Pdia4tg/tg islets > WT islets = Pdia4�/� islets (LG,
Fig 4C). In contrast, the mitochondrial ROS level of mouse pancre-
atic islets at a high glucose concentration was (in descending order):
Pdia4tg/tg islets > WT islets > Pdia4�/� islets (HG, Fig 4C). Similarly,
the cytosolic ROS level in the pancreatic islets of BKS mice at a low
glucose concentration was (in descending order): Pdia4tg/tg islets >
WT islets = Pdia4�/� islets (LG, Fig 4D). In contrast, the cytosolic
ROS level in mouse pancreatic islets at a high glucose concentration
was (in descending order): Pdia4tg/tg islets > WT islets > Pdia4�/�
islets (HG, Fig 4D).
Furthermore, we measured mitochondrial ETC and Nox activities
in pancreatic islets in WT, Pdia4�/�, and Pdia4tg/tg BKS mice using
MitoCheck assays and luminometry, respectively. MitoCheck assays
indicated that the activity of ETC CI in the isolated mitochondria of
the three mouse pancreatic islets was (in descending order):
Pdia4tg/tg islets > WT islets > Pdia4�/� islets (CI, Fig 4E). However,
there was no difference in the activity of ETC CII/III and ETC CIV
(CII/III and CIV, Fig 4E) in the isolated mitochondria of three mouse
pancreatic islets. On the contrary, luminometric assays demon-
strated that the Nox activity in pancreatic islets of BKS mice at a low
glucose concentration was (in descending order): Pdia4tg/tg islets >
WT islets = Pdia4�/� islets (LG, Fig 4F). However, the Nox activity
in pancreatic islets of BKS mice at a high glucose concentration was
(in descending order): Pdia4tg/tg islets > WT islets > Pdia4�/� islets
(HG, Fig 4F). In parallel, we assessed the effect of Pdia4 on the
expression level of antioxidant enzymes in mouse pancreatic islets.
We found no difference in the protein levels of Sod1, Sod2, Gpx1,
and catalase in the islets of WT, Pdia4�/�, and Pdia4tg/tg mice
(Appendix Fig S6E).
We also checked the significance of Pdia4 in the function of b-cells using a transmission electron microscope (Fig 5A). We found
that the number of mitochondria in b-cells of BKS and Leprdb/db
mice was (in descending order): Pdia4�/� b-cells > WT b-cells >
▸Figure 4. Pdia4 is involved in the regulation of cell death, ROS accumulation, and the activity of ETC and NOX.
A The islets of WT, Pdia4�/� (KO), and Pdia4tg/tg (TG) BKS mice were isolated and grown in complete DMEM medium containing 3.3 mM (LG) and 30 mM glucose(HG) for 12 h. The islets stained with propidium iodide (PI), photographed, and quantified. Scale bar = 50 lm.
B The islets from the mice (A) were treated with 3.3 mM (LG) or 30 mM glucose (HG). After lysis, the lysates underwent immunoblotting analysis using the antibodyagainst Beclin 1, LC3, p62 and actin.
C, D The islets from the mice (A) were incubated with MitoGreen plus MitoSOX (C) or Hoechst 33342 (Ho) plus CM-H2DCFDA (D) in the presence of glucose at 3.3 mM(LG) and 16.7 mM (HG). Mitochondrial (C) and cytosolic ROS (D) in the islets were visualized and quantified. Scale bar = 100 lm.
E Mitochondria isolated from the mouse islets (A) were measured for the activity of ETC CI (left), CII/III (middle), and CIV (right) using MitoCheck assays.F The membrane fraction of the pancreas from the mice (A) was measured for Nox activity using luminometric assays.
Data information: Data from three experiments are presented as the mean � SD. One-way ANOVA test was used for statistical analysis of differences between groups,and P (*) < 0.05; P (**) < 0.01 and P (***) < 0.001 are considered statistically significant.Source data are available online for this figure.
ª 2021 The Authors EMBO Molecular Medicine e11668 | 2021 7 of 21
Tien-Fen Kuo et al EMBO Molecular Medicine
A
B
D
E
F
C
Figure 4.
8 of 21 EMBO Molecular Medicine e11668 | 2021 ª 2021 The Authors
EMBO Molecular Medicine Tien-Fen Kuo et al
A
B
C
Figure 5.
ª 2021 The Authors EMBO Molecular Medicine e11668 | 2021 9 of 21
Tien-Fen Kuo et al EMBO Molecular Medicine
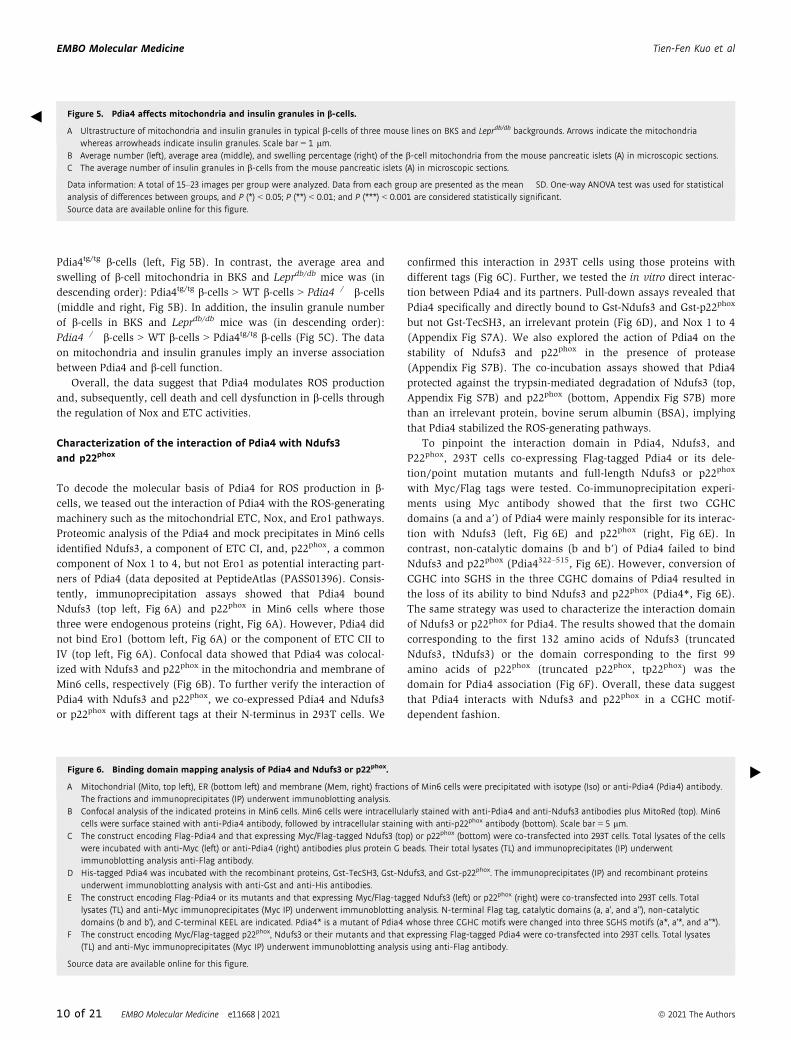
Pdia4tg/tg b-cells (left, Fig 5B). In contrast, the average area and
swelling of b-cell mitochondria in BKS and Leprdb/db mice was (in
descending order): Pdia4tg/tg b-cells > WT b-cells > Pdia4�/� b-cells(middle and right, Fig 5B). In addition, the insulin granule number
of b-cells in BKS and Leprdb/db mice was (in descending order):
Pdia4�/� b-cells > WT b-cells > Pdia4tg/tg b-cells (Fig 5C). The data
on mitochondria and insulin granules imply an inverse association
between Pdia4 and b-cell function.Overall, the data suggest that Pdia4 modulates ROS production
and, subsequently, cell death and cell dysfunction in b-cells throughthe regulation of Nox and ETC activities.
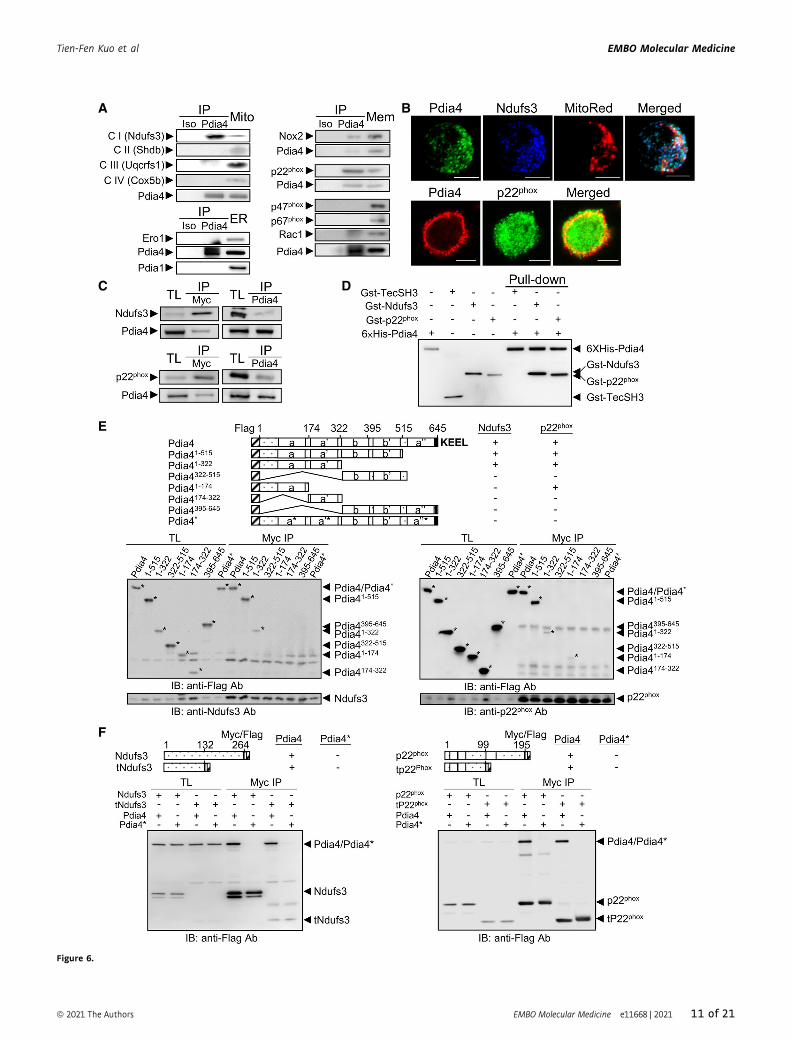
Characterization of the interaction of Pdia4 with Ndufs3and p22phox
To decode the molecular basis of Pdia4 for ROS production in b-cells, we teased out the interaction of Pdia4 with the ROS-generating
machinery such as the mitochondrial ETC, Nox, and Ero1 pathways.
Proteomic analysis of the Pdia4 and mock precipitates in Min6 cells
identified Ndufs3, a component of ETC CI, and, p22phox, a common
component of Nox 1 to 4, but not Ero1 as potential interacting part-
ners of Pdia4 (data deposited at PeptideAtlas (PASS01396). Consis-
tently, immunoprecipitation assays showed that Pdia4 bound
Ndufs3 (top left, Fig 6A) and p22phox in Min6 cells where those
three were endogenous proteins (right, Fig 6A). However, Pdia4 did
not bind Ero1 (bottom left, Fig 6A) or the component of ETC CII to
IV (top left, Fig 6A). Confocal data showed that Pdia4 was colocal-
ized with Ndufs3 and p22phox in the mitochondria and membrane of
Min6 cells, respectively (Fig 6B). To further verify the interaction of
Pdia4 with Ndufs3 and p22phox, we co-expressed Pdia4 and Ndufs3
or p22phox with different tags at their N-terminus in 293T cells. We
confirmed this interaction in 293T cells using those proteins with
different tags (Fig 6C). Further, we tested the in vitro direct interac-
tion between Pdia4 and its partners. Pull-down assays revealed that
Pdia4 specifically and directly bound to Gst-Ndufs3 and Gst-p22phox
but not Gst-TecSH3, an irrelevant protein (Fig 6D), and Nox 1 to 4
(Appendix Fig S7A). We also explored the action of Pdia4 on the
stability of Ndufs3 and p22phox in the presence of protease
(Appendix Fig S7B). The co-incubation assays showed that Pdia4
protected against the trypsin-mediated degradation of Ndufs3 (top,
Appendix Fig S7B) and p22phox (bottom, Appendix Fig S7B) more
than an irrelevant protein, bovine serum albumin (BSA), implying
that Pdia4 stabilized the ROS-generating pathways.
To pinpoint the interaction domain in Pdia4, Ndufs3, and
P22phox, 293T cells co-expressing Flag-tagged Pdia4 or its dele-
tion/point mutation mutants and full-length Ndufs3 or p22phox
with Myc/Flag tags were tested. Co-immunoprecipitation experi-
ments using Myc antibody showed that the first two CGHC
domains (a and a’) of Pdia4 were mainly responsible for its interac-
tion with Ndufs3 (left, Fig 6E) and p22phox (right, Fig 6E). In
contrast, non-catalytic domains (b and b’) of Pdia4 failed to bind
Ndufs3 and p22phox (Pdia4322–515, Fig 6E). However, conversion of
CGHC into SGHS in the three CGHC domains of Pdia4 resulted in
the loss of its ability to bind Ndufs3 and p22phox (Pdia4*, Fig 6E).
The same strategy was used to characterize the interaction domain
of Ndufs3 or p22phox for Pdia4. The results showed that the domain
corresponding to the first 132 amino acids of Ndufs3 (truncated
Ndufs3, tNdufs3) or the domain corresponding to the first 99
amino acids of p22phox (truncated p22phox, tp22phox) was the
domain for Pdia4 association (Fig 6F). Overall, these data suggest
that Pdia4 interacts with Ndufs3 and p22phox in a CGHC motif-
dependent fashion.
◀ Figure 5. Pdia4 affects mitochondria and insulin granules in b-cells.
A Ultrastructure of mitochondria and insulin granules in typical b-cells of three mouse lines on BKS and Leprdb/db backgrounds. Arrows indicate the mitochondriawhereas arrowheads indicate insulin granules. Scale bar = 1 lm.
B Average number (left), average area (middle), and swelling percentage (right) of the b-cell mitochondria from the mouse pancreatic islets (A) in microscopic sections.C The average number of insulin granules in b-cells from the mouse pancreatic islets (A) in microscopic sections.
Data information: A total of 15–23 images per group were analyzed. Data from each group are presented as the mean � SD. One-way ANOVA test was used for statisticalanalysis of differences between groups, and P (*) < 0.05; P (**) < 0.01; and P (***) < 0.001 are considered statistically significant.Source data are available online for this figure.
▸Figure 6. Binding domain mapping analysis of Pdia4 and Ndufs3 or p22phox.
A Mitochondrial (Mito, top left), ER (bottom left) and membrane (Mem, right) fractions of Min6 cells were precipitated with isotype (Iso) or anti-Pdia4 (Pdia4) antibody.The fractions and immunoprecipitates (IP) underwent immunoblotting analysis.
B Confocal analysis of the indicated proteins in Min6 cells. Min6 cells were intracellularly stained with anti-Pdia4 and anti-Ndufs3 antibodies plus MitoRed (top). Min6cells were surface stained with anti-Pdia4 antibody, followed by intracellular staining with anti-p22phox antibody (bottom). Scale bar = 5 lm.
C The construct encoding Flag-Pdia4 and that expressing Myc/Flag-tagged Ndufs3 (top) or p22phox (bottom) were co-transfected into 293T cells. Total lysates of the cellswere incubated with anti-Myc (left) or anti-Pdia4 (right) antibodies plus protein G beads. Their total lysates (TL) and immunoprecipitates (IP) underwentimmunoblotting analysis anti-Flag antibody.
D His-tagged Pdia4 was incubated with the recombinant proteins, Gst-TecSH3, Gst-Ndufs3, and Gst-p22phox. The immunoprecipitates (IP) and recombinant proteinsunderwent immunoblotting analysis with anti-Gst and anti-His antibodies.
E The construct encoding Flag-Pdia4 or its mutants and that expressing Myc/Flag-tagged Ndufs3 (left) or p22phox (right) were co-transfected into 293T cells. Totallysates (TL) and anti-Myc immunoprecipitates (Myc IP) underwent immunoblotting analysis. N-terminal Flag tag, catalytic domains (a, a’, and a’’), non-catalyticdomains (b and b’), and C-terminal KEEL are indicated. Pdia4* is a mutant of Pdia4 whose three CGHC motifs were changed into three SGHS motifs (a*, a’*, and a’’*).
F The construct encoding Myc/Flag-tagged p22phox, Ndufs3 or their mutants and that expressing Flag-tagged Pdia4 were co-transfected into 293T cells. Total lysates(TL) and anti-Myc immunoprecipitates (Myc IP) underwent immunoblotting analysis using anti-Flag antibody.
Source data are available online for this figure.
10 of 21 EMBO Molecular Medicine e11668 | 2021 ª 2021 The Authors
EMBO Molecular Medicine Tien-Fen Kuo et al
A
C
E
F
D
B
Figure 6.
ª 2021 The Authors EMBO Molecular Medicine e11668 | 2021 11 of 21
Tien-Fen Kuo et al EMBO Molecular Medicine
Molecular regulation of ROS generation by Pdia4 inpancreatic b-cells
Furthermore, we wanted to address how Pdia4 controlled b-cell ROSproduction via ETC and Nox pathways. First, a genetic approach
was used to examine the function of Pdia4 in ROS production. The
content of mitochondrial and cytosolic ROS in Min6 GK cells, a
scramble control, Min6 KD cells with Pdia4 knockdown, and Min6
OVE cells with Pdia4 overexpression, was measured using the
MitoSOX and CellROX dyes, respectively. We found that Min6 OVE
A
B
C
D
Figure 7.
12 of 21 EMBO Molecular Medicine e11668 | 2021 ª 2021 The Authors
EMBO Molecular Medicine Tien-Fen Kuo et al
cells had a slight increase in mitochondrial and cytosolic ROS
compared with Min6 GK and Min6 KD cells in response to low
glucose (LG, Fig 7A). Accordingly, Min6 OVE cells had higher ROS
content in the mitochondria and cytosol than Min6 GK and
KD cells in response to high glucose (HG, Fig 7A). However, N-
acetylcysteine (NAC), a ROS scavenger, abolished the increase of
Pdia4-mediated ROS production in the mitochondria and cytosol in
all Min6 lines (HG+NAC, Fig 7A). Next, we assessed the involve-
ment of Ndufs3 and p22phox in ROS production in the mitochondria
and cytosol of Min6 cells. The siRNA experiments showed that
knockdown of Ndufs3 and p22phox reduced the mitochondrial and
cytosolic ROS content in Min6 cells, respectively (Fig 7B).
Next, to test the likely link among Pdia4, Ndufs3, p22phox, and
ROS production, we examined whether overexpression of tNdufs3,
a truncated mutant of Ndufs3 (a.a. 1 to 132), and tp22phox, a trun-
cated mutant of p22phox Ndufs3 (a.a. 1 to 99), interfered with ROS
production in Min6 cells. The data indicated that overexpression of
tNdufs3 and tp22phox caused a significant reduction in mitochondrial
and cytosolic ROS content in Min6 cells at a high glucose
concentration (HG, Fig 7C). However, this reduction was not signifi-
cant at a low glucose concentration (LG, Fig 7C). In parallel, we
overexpressed Ndufs3 and p22phox in Min6 KD cells in which Pdia4
was knocked down. The overexpression of Ndufs3 and p22phox
could restore the mitochondrial and cytosolic ROS production in
Min6 KD cells to a comparable level of ROS production in Min6 GK
cells in the presence of high glucose (HG, Fig 7D). This restoration
was also seen in low glucose (LG, Fig 7D) though it was not statisti-
cally significant. Therefore, the genetic data supported the notion
that Pdia4 up-modulated Ndufs3- and p22phox-mediated ROS genera-
tion via their mutual association.
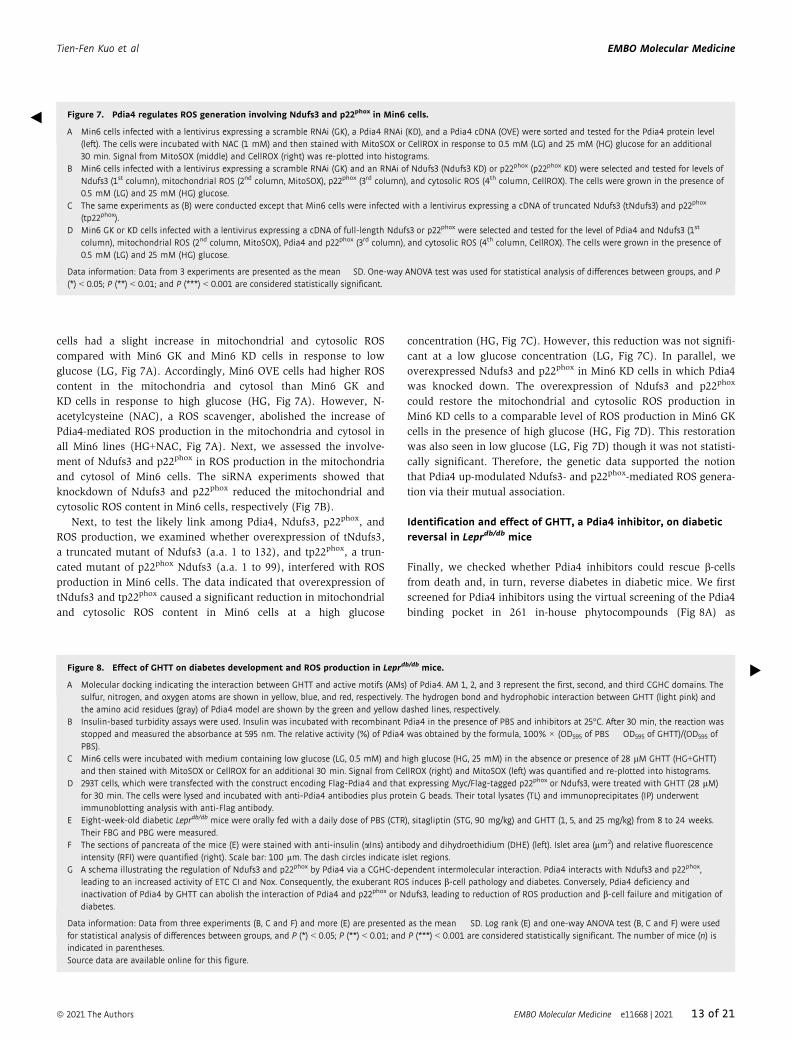
Identification and effect of GHTT, a Pdia4 inhibitor, on diabeticreversal in Leprdb/db mice
Finally, we checked whether Pdia4 inhibitors could rescue b-cellsfrom death and, in turn, reverse diabetes in diabetic mice. We first
screened for Pdia4 inhibitors using the virtual screening of the Pdia4
binding pocket in 261 in-house phytocompounds (Fig 8A) as
◀ Figure 7. Pdia4 regulates ROS generation involving Ndufs3 and p22phox in Min6 cells.
A Min6 cells infected with a lentivirus expressing a scramble RNAi (GK), a Pdia4 RNAi (KD), and a Pdia4 cDNA (OVE) were sorted and tested for the Pdia4 protein level(left). The cells were incubated with NAC (1 mM) and then stained with MitoSOX or CellROX in response to 0.5 mM (LG) and 25 mM (HG) glucose for an additional30 min. Signal from MitoSOX (middle) and CellROX (right) was re-plotted into histograms.
B Min6 cells infected with a lentivirus expressing a scramble RNAi (GK) and an RNAi of Ndufs3 (Ndufs3 KD) or p22phox (p22phox KD) were selected and tested for levels ofNdufs3 (1st column), mitochondrial ROS (2nd column, MitoSOX), p22phox (3rd column), and cytosolic ROS (4th column, CellROX). The cells were grown in the presence of0.5 mM (LG) and 25 mM (HG) glucose.
C The same experiments as (B) were conducted except that Min6 cells were infected with a lentivirus expressing a cDNA of truncated Ndufs3 (tNdufs3) and p22phox
(tp22phox).D Min6 GK or KD cells infected with a lentivirus expressing a cDNA of full-length Ndufs3 or p22phox were selected and tested for the level of Pdia4 and Ndufs3 (1st
column), mitochondrial ROS (2nd column, MitoSOX), Pdia4 and p22phox (3rd column), and cytosolic ROS (4th column, CellROX). The cells were grown in the presence of0.5 mM (LG) and 25 mM (HG) glucose.
Data information: Data from 3 experiments are presented as the mean � SD. One-way ANOVA test was used for statistical analysis of differences between groups, and P(*) < 0.05; P (**) < 0.01; and P (***) < 0.001 are considered statistically significant.
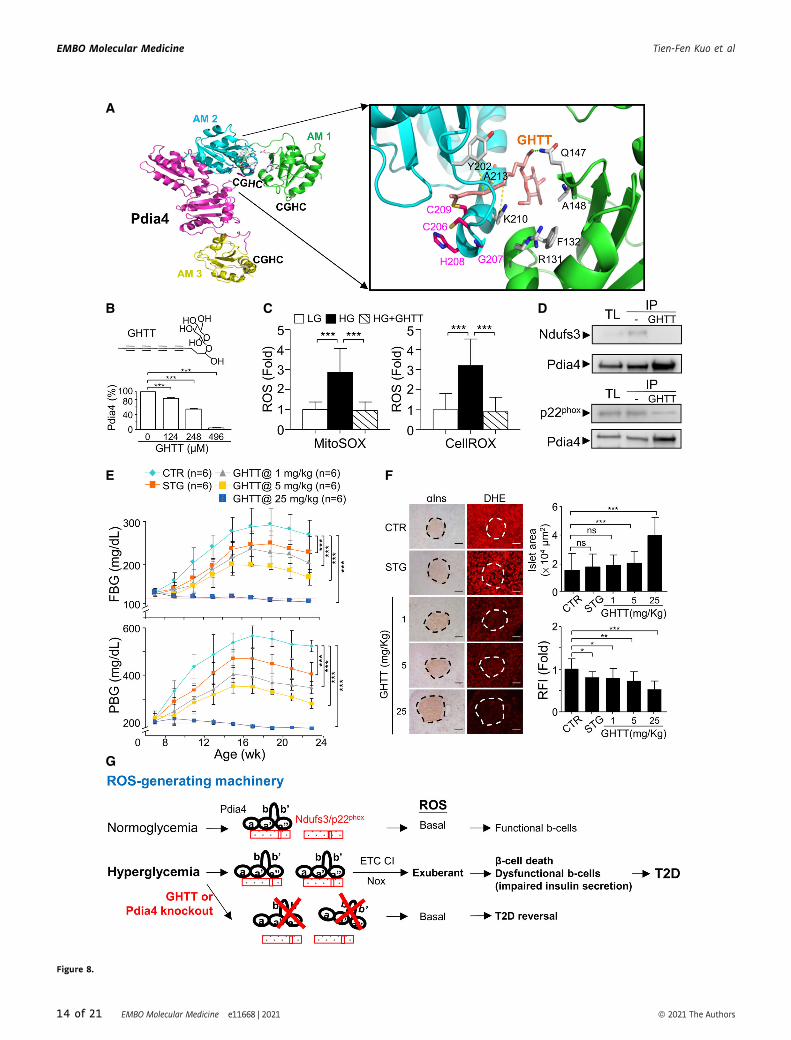
▸Figure 8. Effect of GHTT on diabetes development and ROS production in Leprdb/db mice.
A Molecular docking indicating the interaction between GHTT and active motifs (AMs) of Pdia4. AM 1, 2, and 3 represent the first, second, and third CGHC domains. Thesulfur, nitrogen, and oxygen atoms are shown in yellow, blue, and red, respectively. The hydrogen bond and hydrophobic interaction between GHTT (light pink) andthe amino acid residues (gray) of Pdia4 model are shown by the green and yellow dashed lines, respectively.
B Insulin-based turbidity assays were used. Insulin was incubated with recombinant Pdia4 in the presence of PBS and inhibitors at 25°C. After 30 min, the reaction wasstopped and measured the absorbance at 595 nm. The relative activity (%) of Pdia4 was obtained by the formula, 100% × (OD595 of PBS � OD595 of GHTT)/(OD595 ofPBS).
C Min6 cells were incubated with medium containing low glucose (LG, 0.5 mM) and high glucose (HG, 25 mM) in the absence or presence of 28 lM GHTT (HG+GHTT)and then stained with MitoSOX or CellROX for an additional 30 min. Signal from CellROX (right) and MitoSOX (left) was quantified and re-plotted into histograms.
D 293T cells, which were transfected with the construct encoding Flag-Pdia4 and that expressing Myc/Flag-tagged p22phox or Ndufs3, were treated with GHTT (28 lM)for 30 min. The cells were lysed and incubated with anti-Pdia4 antibodies plus protein G beads. Their total lysates (TL) and immunoprecipitates (IP) underwentimmunoblotting analysis with anti-Flag antibody.
E Eight-week-old diabetic Leprdb/db mice were orally fed with a daily dose of PBS (CTR), sitagliptin (STG, 90 mg/kg) and GHTT (1, 5, and 25 mg/kg) from 8 to 24 weeks.Their FBG and PBG were measured.
F The sections of pancreata of the mice (E) were stained with anti-insulin (aIns) antibody and dihydroethidium (DHE) (left). Islet area (lm2) and relative fluorescenceintensity (RFI) were quantified (right). Scale bar: 100 lm. The dash circles indicate islet regions.
G A schema illustrating the regulation of Ndufs3 and p22phox by Pdia4 via a CGHC-dependent intermolecular interaction. Pdia4 interacts with Ndufs3 and p22phox,leading to an increased activity of ETC CI and Nox. Consequently, the exuberant ROS induces b-cell pathology and diabetes. Conversely, Pdia4 deficiency andinactivation of Pdia4 by GHTT can abolish the interaction of Pdia4 and p22phox or Ndufs3, leading to reduction of ROS production and b-cell failure and mitigation ofdiabetes.
Data information: Data from three experiments (B, C and F) and more (E) are presented as the mean � SD. Log rank (E) and one-way ANOVA test (B, C and F) were usedfor statistical analysis of differences between groups, and P (*) < 0.05; P (**) < 0.01; and P (***) < 0.001 are considered statistically significant. The number of mice (n) isindicated in parentheses.Source data are available online for this figure.
ª 2021 The Authors EMBO Molecular Medicine e11668 | 2021 13 of 21
Tien-Fen Kuo et al EMBO Molecular Medicine
A
B
E
G
F
C D
Figure 8.
14 of 21 EMBO Molecular Medicine e11668 | 2021 ª 2021 The Authors
EMBO Molecular Medicine Tien-Fen Kuo et al
described (Almeida et al, 2011; Kuo et al, 2017). GHTT, one of the
best hits, was tested for Pdia4 activity and had an inhibitory activity
with an IC50 of 358 lM (Fig 8B). Then, we explored the impact of
GHTT on ROS production and ROS-generating pathways. We found
that GHTT lowered ROS in the cytosol and mitochondria of Ming 6
cells (Fig 8C). Furthermore, GHTT reduced the interaction between
Pdia4 and Ndufs3 or p22phox (Fig 8D).
Moreover, we examined the in vivo anti-diabetic effect of GHTT
in new-onset diabetic Leprdb/db mice. As anticipated, 90 mg/kg of
sitagliptin, which was used as a positive control, moderately
reduced FBG and PBG in Leprdb/db mice (STG, Fig 8E). GHTT
normalized diabetes in a dose-dependent manner as evidenced by
FBG (top, Fig 8E), PBG (bottom, Fig 8E), GTT (Appendix Fig S8A),
and HbA1c (Appendix Fig S8B). Accordingly, GHTT dose-
dependently reduced islet atrophy (Fig 8F), islet ROS (Fig 8F), and
serum ROS (Appendix Fig S8C) in Leprdb/db mice. However, sita-
gliptin failed to reduce islet atrophy (Fig 8F). Preservation of the
islets by GHTT was in agreement with HOMA-b (Appendix Fig S8D)
and serum insulin (Appendix Fig S8E). Overall, the data demon-
strated that the Pdia4 inhibitor, GHTT, phenocopied its genetic
knockout in mouse models.
In conclusion, this work suggested that under normoglycemic
conditions, Pdia4 produced a basal level of ROS to maintain b-cellmass and function via its interaction and stabilization of Ndufs3 and
p22phox (Fig 8G). Under hyperglycemic conditions, excess nutrient
up-regulated Pdia4 expression. This up-regulation increased the
activity of Ndufs3 and p22phox, via intermolecular interaction, and,
subsequently, ROS production in b-cells. Consequently, the exuber-
ant ROS resulted in b-cell pathogenesis and diabetes (Fig 8G).
Conversely, Pdia4 inhibitor reversed diabetes via decreased b-cellpathology and ROS production in diabetic animals (Fig 8G). These
findings also revealed the underlying mechanism and function of
Pdia4 in b-cells and diabetes as well as the likely use of Pdia4 inhibi-
tors as an anti-diabetic therapy.
Discussion
Pancreatic b-cell failure is a hallmark of diabetes (Cerf, 2013).
Nevertheless, the mechanism through which this failure occurs is
poorly investigated. In this study, we conducted comprehensive
phenotyping of a previously unrecognized factor, Pdia4, in glucose
homeostasis in two mouse models of obesity-related diabetes. In
mouse models and islet mass, deletion of Pdia4, either globally or in
b-cells, led to protection from hyperglycemia, most likely due to a
decrease in oxidative stress. Enrichment of Pdia4 in the b-cells of
mice resulted in accelerated diabetes development and failure to
accrue islet mass. Consistently, the Pdia4 inhibitor, GHTT, protected
against hyperglycemia in the mouse models. Mechanistically, Pdia4
was shown to interact with Ndufs3 and p22phox in a sequence-
specific fashion. The Pdia4, Ndufs3, and p22phox pathways were
confirmed to dictate ROS production in endocrine b-cells. We
conceptualized these findings as follows: under pathological condi-
tions, excessive Pdia4 and ROS led to b-cell failure and diabetes;
conversely, Pdia4 ablation and inhibition diminished ROS content in
b-cells and, thereby, reduced b-cell failure and diabetes develop-
ment. In essence, exuberant ROS is detrimental to b-cells, and
getting rid of Pdia4 improves ROS.
This work unraveled the molecular mechanism through which
Pdia4 resulted in a decrease in functional b-cell mass during
diabetes. We demonstrated that Pdia4 positively regulated b-celldysfunction/death during diabetes. First, PI staining data indicated
that, consistent with ROS production, Pdia4 promoted cell death in
b-cells (Fig 4A). Furthermore, Pdia4 significantly increased the
expression of two markers, Beclin 1, a key player in the initiation
step of autophagy, and LC3-II, a player in the elongation step of this
process, during autophagy in b-cells (Fig 4B) in agreement with the
literature stating that autophagy is linked to diabetes (Yang et al,
2017). Since b-cell dedifferentiation has been reported to participate
in b-cell failure (Kim-Muller et al, 2016; Efrat, 2019), we also exam-
ined the relationship between Pdia4 and Aldh1a3, a dedifferentia-
tion marker of b-cells. We found that Pdia4 increased the expression
level of Aldh1a3 in islet cells (Appendix Fig S9B). Thus, Pdia4
contributed to cell death in b-cells in a manner that involved autop-
hagy (Fig 4) and dedifferentiation (Appendix Fig S9B) but not JNK
(Appendix Fig S9A) in b-cells. However, we found that Pdia4 did
not affect b-cell proliferation (BrdU, Fig 2D) and differentiation
(PDX1 and MafA, Appendix Fig S9C). In this context, the signifi-
cance and mechanisms of Pdia4 in b-cell physiopathology from the
perspective of dedifferentiation and autophagy are worth further
investigation. We also showed that Pdia4 was associated with
dysfunction in b-cells through GSIS (Figs 2F and 3D), insulin
content (Fig 3E), insulin granules (Fig 5A and C), and mitochon-
drial parameters (Fig 5A and B). This dysfunction could be attrib-
uted to the up-regulation of ROS by Pdia4 because ROS is known to
impair mitochondrial structure/function and insulin production/se-
cretion in b-cells (Gerber & Rutter, 2017). However, Pdia4 failed to
regulate the expression of antioxidant proteins (Appendix Fig S6E).
According to these data, we concluded that Pdia4 increased ROS
and, thereby, caused b-cell dysfunction and death. Mechanistically
speaking, Pdia4 up-regulated ROS accumulation in response to
glucose in b-cells (Fig 7) via the interaction of Pdia4 with Ndufs3
and p22phox, key components of ETC CI and Nox 1-4, respectively
(Fig 6). This intermolecular interaction involved the first two CGHC
motifs of Pdia4 and the N-terminal portion of Ndufs3 or p22phox
(Fig 6). In addition, this interaction seemed to increase the stability
of Ndufs3 or p22phox in the presence of trypsin (Appendix Fig S7B).
We also established the new link between Pdia4, Ndufs3, p22phox,
and ROS production in b-cells based on the interference and comple-
mentation data (Fig 7). Accordingly, disruption of this interaction
by GHTT, the Pdia4 inhibitor, led to decreased ROS in b-cells(Fig 8C and D). Both the genetics and pharmaceutical data are
consistent with several publications that have reported the increased
expression and/or activity of Ndufs3 and p22phox in diabetic patients
and rodents (Huang et al, 2011; Wu et al, 2017). However, a caveat
in the genetics approaches used in this study was that Pdia4 was
deficient or overexpressed from the inception of b-cell development.
In parallel, treatment with GHTT reduced islet atrophy in b-cells(Fig 8F). Pharmaceutical approaches complemented the genetics
approaches in terms of b-cell improvement. Therefore, this work
demonstrates the novel function and molecular basis of the chaper-
one, Pdia4, in b-cells in terms of oxidative stress, dysfunction, and
death and extends our understanding of islet biology.
The findings presented further suggest the potential of Pdia4 to
serve as a therapeutic target for obesity-related diabetes and b-cellpathology. Leprab/db mice and HFD-fed B6 mice were used as mouse
ª 2021 The Authors EMBO Molecular Medicine e11668 | 2021 15 of 21
Tien-Fen Kuo et al EMBO Molecular Medicine
models of diabetes to study the significance of Pdia4 in b-cell failureand diabetes because Leprab/db mice develop severe diabetes while
B6 mice fed a high-fat diet develop moderate diabetes. First, Pdia4
ablation led to a remarkable reduction in diabetes incidence (58%)
in Pdia4�/�Leprdb/db mice aged 24 weeks (Pdia4�/�Leprdb/db,Appendix Fig S2E). This incidence went down to zero in Leprdb/db
mice aged 55 weeks or over (Appendix Fig S3B) presumably
because food consumption decreased with age (Appendix Fig S3A).
Consequently, Pdia4�/�Leprdb/db mice had a better survival rate and
life span than Leprdb/db mice (Fig 2A). Accordingly, GHTT treatment
phenocopied Pdia4 knockout in Leprdb/db mice (Fig 8). Conversely,
Pdia4 overexpression accelerated diabetes in Pdia4tg/tgLeprdb/db mice
and HFD-fed Pdia4tg/tg B6 mice (Appendix Figs S5 and S6). In addi-
tion, Pdia4tg/tgLeprdb/db mice had a worse survival rate and life span
than Leprdb/db mice (Fig 2A). Of note, Pdia4 deficiency and inactiva-
tion also improved b-cell failure and diabetes. The reversal of
diabetes in aged Pdia4�/�Leprdb/db mice most probably came from
reduced b-cell death by Pdia4 and/or replenishment of b-cells (Gao
et al, 2015). Although these findings with Leprdb/db mice are fasci-
nating, their relevance to human diabetes remains tentative. The
role of Pdia4 in HFD-fed B6 mice was further verified because this
model resembles human diabetes more closely than Leprdb/db mice
in terms of disease etiology (Hinder et al, 2017). Both models of
diabetes complemented each other and revealed the importance and
therapeutic potential of Pdia4 for diabetes and b-cell failure. Target-ing Pdia4 and its pathways may thus constitute attractive
approaches for the treatment of b-cell pathogenesis and diabetes
(Leahy et al, 2010).
Oxidative stress is well recognized to play a major role in b-cellphysiopathology and diabetes (Dos Santos et al, 2019). Homeostasis
of ROS is controlled by ROS-generating and ROS-degrading path-
ways. A basal level of ROS is essential for b-cell physiology and
function (Trachootham et al, 2009). However, metabolic overload
stimulates ROS overproduction which impairs insulin secretion and
insulin action during diabetes (Tangvarasittichai, 2015). This
impairment can get worse if antioxidant enzymes are insufficient.
Our current work agrees with the literature stating that elevated
ROS, arising from increased oxidative stress, contributes to b-cellfailure and diabetes development (Lenzen et al, 1996; Tiedge et al,
1997; Robertson, 2004; Robertson & Harmon, 2007). Although the
concept of ROS causing b-cell failure is not a new concept, the
participation of Pdia4 in the Ndufs3 and p22Phox pathways gives
greater understanding of the progression from oxidative stress to b-cell pathology and diabetes. Overall our work can be viewed as
follows: excess nutrients/hyperglycemia ? Pdia4 ? Ndufs3 and
p22phox ? ROS ? b-cell failure and diabetes (Fig 8). ROS acts as a
double-edged mediator of b-cell physiopathology and diabetes.
Thus, antioxidant compounds and enzymes are commonly used to
scavenge excessive ROS during diabetes in pre-clinical and clinical
settings (Robertson, 2004; Robertson & Harmon, 2007; Chang &
Chuang, 2010). However, this approach has frequently failed to
treat diabetes in diabetic mice and patients (Chang & Chuang, 2010)
likely because some ROS might have already exerted its action
before its clearance by antioxidants. In this study, targeting Pdia4
seemed to have some advantage over the using antioxidant
compounds and enzymes because Pdia4 deficiency eliminated the
possibility of diabetes development by lowering ROS production,
different from elimination of ROS by antioxidants, in which the cells
continue to produce ROS through the ROS-generating machinery. So
far, no drugs can clinically cure diabetes (Leahy et al, 2010). Thus,
preserving b-cell number and/or function by intervention in the
Pdia4/Ndufs3/p22Phox pathways is a promising therapy.
With regard to advances in knowledge of Pdia4 in general, Nduf-
s3 and p22phox are recognized as specific partners/substrates of
Pdia4 in ROS-generating pathways in b-cells for the first time in this
study. Pdia4 regulated mitochondrial and cytosolic ROS production
via its binding to Ndufs3 and p22phox, respectively (Figs 4, 6, 7, and
8). Pdia4 served as a chaperone to enhance the stability and/or
activity of mitochondrial Ndufs3 or cytosolic p22phox outside the ER
compartment. Furthermore, the active site and interacting motifs in
Pdia4 and their partners were identified (Fig 6). These findings pave
the way for understanding how a chaperone like Pdia4 is engaged in
regulation of oxidative stress. Pdia4 possesses a C-terminal KEEL
motif and was originally considered to be an ER-resident protein
chaperone that could assist in protein folding. (Ni & Lee, 2007; Galli-
gan & Petersen, 2012). This study pushes the boundary of under-
standing of Pdia4 from purely ER-relevant functions to an
unconventional ER-irrelevant function in b-cells (Figs 1G and H,
and 6B) and supports the novel notion that a chaperone with the ER
retention motif can reach other subcellular compartments for their
physiological needs. Pdia4 is demonstrated to utilize a hitherto
undocumented mechanism to modulate oxidative stress in b-cells.This mechanism is distinguished from those in which ER stress
proteins, antioxidant enzymes, and ser/thr kinases, regulate b-cellfunctions, survival, and/or cell death via modulation of ER stress,
ROS, and phosphorylation (Lei & Vatamaniuk, 2011; Ardestani &
Maedler, 2016; Herbert & Laybutt, 2016). We also figured out the
reason why Pdia4 was named glucose-regulated protein 72 (Fig 1
and Appendix Fig S1). There is an ER stress-response element
(ERSE) present in the Pdia4 promoter that functionally responds to
high glucose (Appendix Fig S1C). One piece of our data also shed
light on the expression of Pdia4 in mouse organs and its distribution
in b-cell compartments. In comparison with other Pdis, Pdia4 was
found to be more specific in terms of substrate specificity and func-
tional non-redundancy (Appendix Fig S7). Finally, the data on the
unique mode of action and substrate specificity proposed that Pdia4,
a non-essential gene, are indeed druggable.
Overall we believe the data presented provide conceptual
advances in Pdia4 research and the application of b-cells and
diabetes. Furthermore, this work presents a compelling case for the
further investigation of Pdia4 as a crucial player of b-cell pathogene-sis and diabetes.
Materials and Methods
Plasmid construction and lentiviral infection
The pLKO.1-GFP lentiviral vectors, GK, KD, OVE, Ndufs3 KD,
p22phox KD, Ndufs3/tNdufs3, and p22phox/tp22phox, contained a
scramble RNAi, a Pdia4 RNAi sequence, a Pdia4 cDNA, a Ndufs3
RNAi sequence, a p22phox RNAi sequence, a full-length/truncated
Ndufs3 cDNA, and a full-length/truncated p22phox cDNA, respec-
tively (Appendix Tables S1 and S2). To produce lentiviral particles,
HEK 293T cells were transfected with lentiviral plasmids plus pack-
aging plasmids using the TransIT-LT1 reagent (Mirus Bio, WI) as
16 of 21 EMBO Molecular Medicine e11668 | 2021 ª 2021 The Authors
EMBO Molecular Medicine Tien-Fen Kuo et al
described elsewhere (Kuo et al, 2017). A FACSAria cell sorter (BD
Biosciences) was used to isolate stable cells for further use. The
plasmids encoding Flag-tagged Pdia4 and its deletion/point muta-
tion mutants, Myc/Flag-tagged Ndufs3, p22phox, and their deletion
mutants were constructed using PCR cloning.
Reagents and cells
DHE, DAPI, CellROX, MitoGreen, MitoRed, MitoSOX, Hochest
33342, and chloromethyl-2’,7’-dichlorodihydrofluorescein diacetate
(CM-H2DCFDA) were purchased from Molecular Probes (Eugene,
OR). Glucose, BSA, trypsin, palmitate, NADPH, and histopaque-
1077 were purchased from Sigma (St. Louis, MO). Lucigenin, and
collagenase P were from Roche (Switzerland). GHTT was purified
as described previously (Almeida et al, 2011; Kuo et al, 2017).
Recombinant proteins, 6×His-Pdia4, Gst-p22phox and Gst-Ndufs3
were purchased from Enzo (Farmingdale, NY). Gst-TecSH3, contain-
ing a SH3 domain of Tec, was produced as published (Kuo et al,
2017). The antibodies used in this study were purchased
(Appendix Table S3). 293T cells (CRL-3216), Min6 cells (Yagi et al,
1995), and pancreatic islets were grown in complete DMEM medium
(Thermo Fisher, Waltham, MA) containing 10% and 20% fetal
bovine serum (FBS), respectively, and 3.3 mM glucose unless indi-
cated otherwise. Human islets were purchased from Lonza (Switzer-
land) and handled according to the protocol of the Academia Sinica
Institutional Review Board (AS-IRB01-14015). Informed consent
was obtained from all human subjects and the experiments
conformed to the principles of the WMA Declaration of Helsinki and
the Department of Health and Human Services Belmont Report.
Generation of conventional knockout mice, conditional knockout,and transgenic mice
B6, BKS (Jackson Laboratory stock No. 000662), and B6.BKS(D)-
Leprdb/J (Jackson Laboratory stock No. 000697) were purchased from
the Jackson laboratory. To generate conventional knockout mice
(Appendix Fig S2), Pdia4 gene targeting vector was first constructed
using a bacterial artificial chromosome (BAC) recombineering strat-
egy. Briefly, a 230-kb Bac clone contains an entire allele of mouse
Pdia4 gene as indicated. The first Neo cassette containing two homol-
ogy arms, two loxP sites ( ) and a Neo gene underwent homologous
recombination and was inserted into the intron 6 of Pdia4 gene in the
Bac. The first Neo cassette in the recombined Bac was popped out by
in vitro incubation with Cre recombinase. The second Neo cassette
containing two homology arms, two frt sites ( ), one loxP site ( ),
and a Neo gene was inserted into the intron 2 of Pdia4 gene in the
Bac. Following linearization, this BAC construct was electroporated
into B6 ES cells. After recombination screening, the targeted ES lines
were selected for blastocyst injection and, in turn, generation of
chimeric mice. Chimeric mice were bred with B6 mice to obtain
Pdia4f/+ mice. Pdia4f/f mice were crossed with EIIa-Cre deleter (Jack-
son Laboratory stock No. 003724) mice to obtain the Pdia4+/� mice
whose exons 3 to 6 were deleted. Sibling mating of Pdia4+/� mice
produced wild-type (Pdia4+/+), Pdia4+/� and Pdia4�/� mice. Alterna-
tively, pdia4f/f mice were crossed with Ins2-Cre deleter mice (Jackson
Laboratory stock No. 003573), a transgenic B6 composed of the
mouse insulin 2 promoter linked to a Cre cDNA to obtain Pdia4f/
fCretg/tg B6 mice, the islet-specific (conditional) knockout mice
(Appendix Fig S4). To generate Pdia4 transgenic mice (Appendix Fig
S5), a vector composed of the human insulin (hINS) promoter linked
to a human Pdia4 cDNA was constructed. A linearized KpnI/DraIII
fragment from this vector was microinjected into the pronuclei of B6
fertilized eggs, followed by oviduct transfer into surrogate mothers.
One line (Pdia4tg/tg mice) was selected and crossed with B6 mice. To
breed B6 background to a Leprdb/db background, the B6 mice with
Pdia4 knockout and overexpression were first crossed with BKS mice
and this backcrossing was repeated until the SNPs of BKS mice were
confirmed as published (Genomics 83 (2004) 902-911). The resultant
mice were then crossed with B6.BKS(D)-Leprdb/J mice in order to
obtain Pdia4�/�Leprdb/db and Pdia4tg/tgLeprdb/db mice. Similarly,
Pdia4f/fCretg/tg B6 mice were bred into BKS mice and crossed with
B6.BKS(D)-Leprdb/J mice in order to obtain Pdia4f/fCretg/tgLeprdb/db
mice. Moreover, Pdia4 knockout, conditional knockout, and trans-
genic mice on Leprdb/db background were analyzed using genetic con-
firmation as published (Mao et al, 2006). The BKS mice were used as
control littermates. All the mouse lines were confirmed using PCR,
Southern blots or immunoblots. All animals had free access to chow
and water, and were maintained at 21–23°C with 12 h light-12 h dark
cycles in the institutional animal facility. The experiments of B6, BKS,
and Leprdb/db females at the indicated ages for diabetes were
approved by the Academia Sinica Institutional Animal Care and
Utilization Committee (11-03-158).
Drug administration and measurement of metabolic parameters
WT, Pdia4�/�, and Pdia4tg/tg B6 mice had free access to a high-fat diet
(60% of fat) from 4 to 28 weeks of age. Their FBG, PBG, and HbA1cwere measured using a glucometer and a DCA 2000 analyzer (Bayer,
Germany) at the indicated ages as published (Chang et al, 2013). Food
intake, water consumption, survival rate, diabetic incidence, and lifes-
pan were monitored weekly. For glucose tolerance test (GTT), the
mice at the indicated ages were fasted for 16 h. The mice received an
intraperitoneal injection with glucose (1 g/kg). The levels of blood
glucose were measured using blood samples taken from the tail vein
at 0, 30, 60, 120, and 180 min after glucose injection with an Elite
glucometer. Homeostatic model assessment of b-cell function (HOMA-
b) and that of insulin resistance (HOMA-IR) were calculated using the
following formulae: HOMA-b = 20 × fasting insulin (mU/ml)/[fasting
glucose (mmol/l) � 3.5] and HOMA-IR = fasting glucose (mmol/
l) × fasting insulin (lU/ml)/22.5. HbA1C, immunohistochemical stain-
ing, serum insulin, and serum ROS were measured as described in the
Materials and Methods section. Alternatively, 8-week-old diabetic
Leprdb/db mice were daily fed with GHTT and sitagliptin at the indi-
cated dosages from 8 to 24 weeks. Their GTT, HbA1c, serum ROS,
HOMA indices, and serum insulin were monitored.
To compare the efficacy of ROS scavenger, vitamin C, and Pdia4
ablation in diabetes, Leprdb/db mice were fed with feed containing a
daily dose of vitamin C at 42, 125, and 375 mg/kg. To assess the
effect of food restriction on diabetes, Pdia4�/�Leprdb/db mice were
given feed (6.8 g/mouse/day). The mice were monitored for their
diabetic incidence based on post-meal glucose.
Measurement of insulin and serum Pdia4
The level of serum insulin was determined by ELISA assays as
published previously (Chang et al, 2013). Alternatively, mouse
ª 2021 The Authors EMBO Molecular Medicine e11668 | 2021 17 of 21
Tien-Fen Kuo et al EMBO Molecular Medicine
pancreata were digested with collagenase P (Roche, Switzerland)
and harvested with histopaque-1077 gradient centrifugation. For
GSIS, mouse pancreatic islets were isolated and pre-incubated in
serum-free oxygen-saturated Krebs-Ringer bicarbonate (KRB)
buffer containing 3.3 mM glucose at 37°C for 30 min. The islets (5
islets/well) were then incubated with KRB buffer containing high
glucose (16.7 mM) or low glucose (3.3 mM) for an additional
30 min. The supernatants were collected for insulin ELISA assays.
To detect the insulin content in pancreatic islets, fasted 14-week-
old WT, Pdia4�/� and Pdia4tg/tg BKS mice were intraperitoneally
injected with glucose (1 g/kg body weight). After 0.5 h, the mouse
islets were isolated and divided into 2 aliquots. One aliquot of the
islets was treated with GolgiPlug, followed by intracellular staining
with an anti-insulin antibody (0 h). The other aliquot of the islets
were grown in complete DMEM medium plus 3.3 mM glucose for
24 h and GolgiPlug was added 6 h before insulin staining. The
islets underwent intracellular staining with an anti-insulin anti-
body (24 h). Both aliquots of the islets underwent flow cytometry
analysis. The level of serum Pdia4 was determined by an ELISA kit
(LSBio, WA).
Real-time poly chain reaction (RT–PCR)
Total RNA of Min6 cells and mouse pancreatic islets were extracted
and converted to cDNA. Real-time RT–PCR was performed with the
above cDNA using the primer sets (Appendix Table S4). The rela-
tive expression level (REL) of typical Pdis versus atypical Pdis was
quantified in relation to the level of L13.
Transmission electron microscopy
Pancreatic islets were isolated from mouse lines, fixed with
formaldehyde, and embedded with resin. The samples underwent
ultramicrotomy, heavy metal staining, and observation under
Tecnai G2 F20 TEM. b-cells were recognized by their typical appear-
ance and photographed. The number and average area of mitochon-
dria and insulin granules in b-cells were quantified using Image J
software.
Immunohistochemical (IHC) analysis
Mouse pancreata were removed and frozen in optimal cutting
temperature medium. For insulin staining, the sections were incu-
bated at 25°C for 30 min with anti-insulin antibody, followed by
diaminobenzidine tetrahydrochloride development. In addition,
DHE was used to stain cytosolic ROS. For BrdU labeling assays, the
mice had free access to water containing BrdU (1 mg/ml) for
23 days. After sacrifice, the pancreatic sections were stained with
anti-BrdU antibody, followed by colorimetric development (BD
Biosciences, San Jose, CA). Alternatively, the pancreatic sections
were subjected to TUNEL assays (Chemicon, Temecula, CA). The
slides were photographed and analyzed using the Axio Vision
program (Carl Zeiss). For cell death, WT, Pdia4�/�, and Pdia4tg/tg
islets were grown in complete DMEM medium containing 3.3 (LG)
and 30 mM glucose (HG) for 12 h. One aliquot of the islets were
stained with PI and quantified. The other aliquot underwent
immunoblotting analysis using the indicated antibodies. For confo-
cal analysis, Min6 cells, stained with the antibody against Pdia4,
p22phox and/or Ndufs3, and mouse islets, stained with the anti-
body against Pdia4, insulin and/or glucagon, were visualized using
confocal microscopy.
Measurement of ROS and the activity of Nox and ETC
Pancreatic islets isolated from the mice were pre-treated with
3.3 mM (LG) and 16.7 mM (HG) glucose for 30 min. The islets were
then incubated with Hochest 33342 plus CM-H2DCFDA or Mito-
Green plus MitoSOX for additional 30 min. Alternatively, Min6 cells
and those infected with lentiviral particles were grown in RPMI
medium in the presence or absence of NAC (1 mM) and GHTT
(10 lg/ml) for 30 min. The cells were then incubated with CellROX
plus Hochest 33342 or MitoGreen plus Mitosox in the presence of
0.5 mM (LG) and 25 mM (HG) glucose for an additional 30 min.
The ROS signal of the islets or cells was recorded using confocal
microscopy and quantified using the Zen software. To measure
serum ROS (Tsai et al, 2011), the sera of mouse tail veins were incu-
bated with lucigenin and monitored using Victor 3 (Perkin Elmer).
Mouse islets were pre-treated with 3.3 mM (LG) and 16.7 mM (HG)
glucose for 30 min. Membrane and mitochondrial fractions of the
islets were prepared with protein extraction kits (Abcam, UK)
according to the manufacturer’s protocol. The membrane fractions
were incubated with lucigenin and NADPH and tested for Nox activ-
ity as published (Minkenberg & Ferber, 1984). The mitochondrial
fractions were measured for the activity of ETC I to IV using Mito-
Check CI, CII/III and CIV kits based on the manufacturer’s guideli-
nes (Cayman, MI).
Immunoblotting analysis
All the cells were lysed with RIPA buffer unless indicated otherwise.
The cell lysates or fractions underwent immunoblotting analysis.
Alternatively, Min6 cells, human islets, and/or mouse islets were
treated with glucose at the indicated dosages or 0.4 mM palmitate
for 48 h. After extensive washing, the cells or islets were either
lysed with RIPA buffer or further fractionated into mitochondrial,
membrane, and cytosolic fractions with Abcam protein extraction
kits. For ER proteins, the cell lysates were subjected to discontinu-
ous sucrose gradients to purify ER organelles using centrifugation,
followed by ER organelle harvest and lysis.
Interaction and domain mapping analysis of Pdia4 with Ndufs3and p22phox
To characterize the in vivo interaction of Pdia4 with Ndufs3,
p22phox, and Ero1, 293T cells were transfected with the plasmid
encoding Flag-tagged Pdia4 or its mutants and the plasmid express-
ing Myc/Flag-tagged p22phox, Myc/Falg-tagged Ndufs3 or their dele-
tion mutants. The mitochondrial, membrane and ER fractions of the
cells were fractionated and precipitated with the indicated antibod-
ies, followed by immunoblotting analysis. The same procedure was
performed to assess the in vivo interaction of Pdis with Ndufs3 and
p22phox. Alternatively, 293T cells transfected with the above plas-
mids were pre-treated with GHTT (10 lg/ml) for 2 h, followed by
the same procedure. For in vitro interaction of Pdia4 with Ndufs3
and p22phox, His-tagged Pdia4 (50 ng) was incubated with an
equimolar amount of Gst-TecSH3 (32 ng), Gst-Ndufs3 (41 ng), or
18 of 21 EMBO Molecular Medicine e11668 | 2021 ª 2021 The Authors
EMBO Molecular Medicine Tien-Fen Kuo et al
Gst-p22phox (33 ng), in vitro. After pull-down with nickel beads, the
precipitates and recombinant proteins underwent immunoblotting
analysis. To test the in vitro interaction of Gst-Pdia4 with His-tagged
Nox1, Nox2, Nox3, and Nox4, the recombinant proteins were incu-
bated for 1 h, followed by an addition of Gst beads. The recombi-
nant proteins and precipitates were subjected to immunoblotting
analysis. To test the protease-mediated regulation of Ndufs3 and
p22phox by Pdia4, His-tagged Pdia4 was incubated with Gst-Ndufs3
and -p22phox in the presence of trypsin/EDTA (0.05%) for 10 min.
The mixture then underwent immunoblotting analysis using the
indicated antibodies.
Dual-luciferase assay
A 1,809 bp fragment of mouse Pdia4 promoter was used to replace
the SV40 promoter upstream of firefly luciferase in pGL3 vector
(Promega, Madison, WI) to generate pPdia4-Luc. The plasmid pb-actin-RL containing the b-actin promoter linked to Renilla luci-
ferase reporter gene was purchased from Promega. Min6 cells
transfected with pPdia4-Luc a construct composed of a Pdia4
promoter linked to a firefly luciferase gene and internal control,
pb-actin-RL plasmid, were incubated with DMEM medium contain-
ing 10% FBS in the presence of 3.3 mM glucose (LG) and 16.7 mM
glucose (HG) for 6 h. Total lysates underwent dual-luciferase
assay. Pdia4 promoter activity is indicated in folds obtained from
the ratio of firefly luciferase activity to Renilla luciferase activity in
the lysates.
Liquid chromatography-mass spectroscopy (LC-MS)
To determine Pdia4 partners related to ROS production in
b-cells, Min6 cells were lyzed with RIPA buffer. The lysates were
precipitated with anti-Pdia4 antibody and isotype antibody. The
precipitates underwent LC-MS analysis, followed by Mascot
database search against the International Protein Index mouse V
3.87 database. Similarly, Min6 cells were fractionated into the
cytosolic, nuclear, membrane, mitochondrial, and ER fractions
as described in the Materials and Methods section. The above
proteins and mouse serum underwent electrophoresis, respec-
tively. The protein bands corresponding to Pdia4 were eluted
from the sodium dodecyl sulfate gel and digested with Asp-N
endopeptidase (NEB, USA) overnight. The peptide mixture
was subjected to LC-MS/MS analysis in the PRM (parallel reac-
tion monitoring) mode using a synthesized Pdia4 peptide
(DEHATKRSRTKEEL) as a standard peptide, followed by identifi-
cation of the target m/z(s) of the peptide precursor and product
ions using Skyline software (MacCoss Lab, University of
Washington).
Statistics
Data from three independent experiments or more are presented as
mean � standard deviation (SD). ANOVA test and log rank were
used for statistical analysis of differences between groups, and P (*)
< 0.05; P (**) < 0.01 and P (***) < 0.001 are considered statistically
significant.
Data availability
The Proteomics data have been deposited in PeptideAtlas with the
accession code PASS01396 (https://db.systemsbiology.net/sbeams/
cgi/PeptideAtlas/PASS_View?identifier=PASS01396). All other data
supporting the findings of this study are available within the paper
or as supplementary Source Data files. Any other additional data
that may be of interest are available from the corresponding author
upon reasonable request.
Expanded View for this article is available online.
AcknowledgementsThe authors thank Prof. J. I. Miyazaki for theMin6 cells and Ms. M. Loney for
editing the manuscript. We thank the Taiwan Mouse Clinic, Taiwan National
RNAi Core Facility, Academia Sinica Advanced Optics Microscope Core Facility
(AS-CFII-108-116) and ICOB Electron Microscope Facility, flow cytometry and
animal facility of the Agricultural Biotechnology Research Center and the
Center of Excellence for the Oceans of the National Taiwan Ocean University
for their technical assistance. This work was supported by the Ministry of
Science and Technology (MOST 103-2320-B-001-003-MY3) and Academia
Sinica (99-CDA-L11), Taiwan.
Author contributionsW-CY conceptualized and supervised this study. T-FK, S-WH, S-HH, CL-TC, C-
SF, M-GH, T-YC, M-TY, T-NW, C-YY, K-CT, GY, and W-CY designed and
performed experiments, analyzed data, interpreted results, and wrote the
manuscript, with input from S-HK, C-YH, and S-TJ.
Paper explained
ProblemA gradual loss of functional pancreatic b-cells is a cardinal feature oftype 2 diabetes. Understanding the cellular and molecular mecha-nisms of b-cell failure is important and may lead to improveddiabetes treatment.
ResultsPdia4 was identified as a key protein for promoting ROS productionand pathogenesis in b-cells during diabetes in Leprdb/db mice andHFD-fed B6 mice. Mechanistically, Pdia4 recruited its partners, Ndufs3and p22phox, to increase ROS generation in the mitochondria andcytosol of b-cells, leading to b-cell failure and the development ofdiabetes. This recruitment involved interaction and stabilization ofNdufs3 and p22phox by interaction with Pdia4. Furthermore, the Pdia4inhibitor abolished the interaction of Pdia4 with its partners and,consequently, reduced ROS production in b-cells and improved b-cellfailure and diabetes symptoms in Leprdb/db mice. Both the geneticsand pharmacological approaches demonstrated that targeting Pdia4can preserve functional b-cells and ameliorate diabetes in mousemodels.
ImpactsThis work illustrates the novel role of the Pdia4/Ndufs3/p22phox
cascade as a central regulator of ROS generation in b-cells and furtherestablishes the new link between the Pdia4/Ndufs3/p22phox cascade,which orchestrates oxidative stress, b-cell failure and diabetes. Admin-istration of a first-in-class Pdia4 inhibitor represents a feasibleapproach for treating b-cell failure during diabetes. The overall find-ings also highlight the potential of targeting Pdia4 to prevent b-cellloss and treat diabetes.
ª 2021 The Authors EMBO Molecular Medicine e11668 | 2021 19 of 21
Tien-Fen Kuo et al EMBO Molecular Medicine
Conflict of interestThe authors declare that they have no conflict of interest.
References
Almeida S, Zhou L, Gao FB (2011) Progranulin, a glycoprotein deficient in
frontotemporal dementia, is a novel substrate of several protein disulfide
isomerase family proteins. PLoS One 6: e26454
Ardestani A, Paroni F, Azizi Z, Kaur S, Khobragade V, Yuan T, Frogne T, Tao W,
Oberholzer J, Pattou F et al (2014) MST1 is a key regulator of beta cell
apoptosis and dysfunction in diabetes. Nat Med 20: 385 – 397
Ardestani A, Maedler K (2016) MST1: a promising therapeutic target to
restore functional beta cell mass in diabetes. Diabetologia 59: 1843 – 1849
Bindokas VP, Kuznetsov A, Sreenan S, Polonsky KS, Roe MW, Philipson LH
(2003) Visualizing superoxide production in normal and diabetic rat islets
of Langerhans. J Biol Chem 278: 9796 – 9801
Brem H, Tomic-Canic M, Entero H, Hanflik AM, Wang VM, Fallon JT, Ehrlich
HP (2007) The synergism of age and db/db genotype impairs wound
healing. Exp Gerontol 42: 523 – 531
Cerf ME (2013) Beta cell dysfunction and insulin resistance. Front Endocrinol
4: 37
Chang YC, Chuang LM (2010) The role of oxidative stress in the pathogenesis
of type 2 diabetes: from molecular mechanism to clinical implication. Am J
Transl Res 2: 316 – 331
Chang CL, Liu HY, Kuo TF, Hsu YJ, Shen MY, Pan CY, Yang WC (2013)
Antidiabetic effect and mode of action of cytopiloyne. Evid Based
Complement Alternat Med 2013: 685642
Defronzo RA (2009) Banting Lecture. From the triumvirate to the ominous
octet: a new paradigm for the treatment of type 2 diabetes mellitus.
Diabetes 58: 773 – 795
Donath MY, Halban PA (2004) Decreased beta-cell mass in diabetes:
significance, mechanisms and therapeutic implications. Diabetologia 47:
581 – 589
Dos Santos JM, Tewari S, Mendes RH (2019) The role of oxidative stress in
the development of diabetes mellitus and its complications. J Diabetes Res
2019: 1 – 3
Efrat S (2019) Beta-cell dedifferentiation in type 2 diabetes: concise review.
Stem Cells 37: 1267 – 1272
Ellerman DA, Myles DG, Primakoff P (2006) A role for sperm surface protein
disulfide isomerase activity in gamete fusion: evidence for the
participation of ERp57. Dev Cell 10: 831 – 837
Evans JL, Maddux BA, Goldfine ID (2005) The molecular basis for oxidative
stress-induced insulin resistance. Antioxid Redox Signal 7: 1040 – 1052
Galligan JJ, Petersen DR (2012) The human protein disulfide isomerase gene
family. Hum Genomics 6: 6
Gao XY, Yan D, Zhao YA, Tao H, Zhou YS (2015) Moderate calorie restriction
to achieve normal weight reverses beta-cell dysfunction in diet-induced
obese mice: involvement of autophagy. Nutr Metab 12: 34 – 43
Garbi N, Tanaka S, Momburg F, Hammerling GJ (2006) Impaired assembly of
the major histocompatibility complex class I peptide-loading complex in
mice deficient in the oxidoreductase ERp57. Nat Immunol 7: 93 – 102
Gerber PA, Rutter GA (2017) The role of oxidative stress and hypoxia in
pancreatic beta-cell dysfunction in diabetes mellitus. Antioxid Redox Signal
26: 501 – 518
Goplen D, Wang J, Enger PO, Tysnes BB, Terzis AJ, Laerum OD, Bjerkvig R
(2006) Protein disulfide isomerase expression is related to the invasive
properties of malignant glioma. Cancer Res 66: 9895 – 9902
Harrity T, Farrelly D, Tieman A, Chu C, Kunselman L, Gu L, Ponticiello R, Cap
M, Qu F, Shao C et al (2006) Muraglitazar, a novel dual (alpha/gamma)
peroxisome proliferator-activated receptor activator, improves diabetes
and other metabolic abnormalities and preserves beta-cell function in db/
db mice. Diabetes 55: 240 – 248
Herbert TP, Laybutt DR (2016) A reevaluation of the role of the unfolded
protein response in islet dysfunction: maladaptation or a failure to adapt?
Diabetes 65: 1472 – 1480
Hinder LM, O’Brien PD, Hayes JM, Backus C, Solway AP, Sims-Robinson C,
Feldman EL (2017) Dietary reversal of neuropathy in a murine model of
prediabetes and metabolic syndrome. Dis Model Mech 10: 717 – 725
Huang X, Sun M, Li D, Liu J, Guo H, Dong Y, Jiang L, Pan QI, Man Y, Wang S
et al (2011) Augmented NADPH oxidase activity and p22phox expression
in monocytes underlie oxidative stress of patients with type 2 diabetes
mellitus. Diabetes Res Clin Pract 91: 371 – 380
Kim-Muller JY, Fan J, Kim YJ, Lee SA, Ishida E, Blaner WS, Accili D (2016)
Aldehyde dehydrogenase 1a3 defines a subset of failing pancreatic beta
cells in diabetic mice. Nat Commun 7: 12631
Kuo TF, Chen TY, Jiang ST, Chen KW, Chiang YM, Hsu YJ, Liu YJ, Chen HM,
Yokoyama KK, Tsai KC et al (2017) Identification of protein disulfide
isomerase a4 as a novel therapeutic target of cancer. Oncogene 36:
5484 – 5496
Leahy JL, Hirsch IB, Peterson KA, Schneider D (2010) Targeting beta-cell
function early in the course of therapy for type 2 diabetes mellitus. J Clin
Endocrinol Metab 95: 4206 – 4216
Lei XG, Vatamaniuk MZ (2011) Two tales of antioxidant enzymes on beta
cells and diabetes. Antioxid Redox Signal 14: 489 – 503
Lenzen S, Drinkgern J, Tiedge M (1996) Low antioxidant enzyme gene
expression in pancreatic islets compared with various other mouse
tissues. Free Rad Biol Med 20: 463 – 466
Leung KK, Leung PS (2008) Effects of hyperglycemia on angiotensin II
receptor type 1 expression and insulin secretion in an INS-1E pancreatic
beta-cell line. JOP 9: 290 – 299
Li XA, Lee AS (1991) Competitive inhibition of a set of endoplasmic
reticulum protein genes (GRP78, GRP94, and ERp72) retards cell growth
and lowers viability after ionophore treatment. Mol Cell Biol 11:
3446 – 3453
Maattanen P, Kozlov G, Gehring K, Thomas DY (2006) ERp57 and PDI:
multifunctional protein disulfide isomerases with similar domain
architectures but differing substrate-partner associations. Biochem Cell Biol
84: 881 – 889
Manukyan D, von Bruehl ML, Massberg S, Engelmann B (2008) Protein
disulfide isomerase as a trigger for tissue factor-dependent fibrin
generation. Thromb Res 122(Suppl 1): S19 – S22
Mao HZ, Roussos EI, Peterfy M (2006) Genetic analysis of the diabetes-prone
C57BLKS/J mouse strain reveals genetic contribution from multiple strains.
Bioph. Biochem. Acta 1762: 440 – 446
Matthews DR, Cull CA, Stratton IM, Holman RR, Turner RC (1998) UKPDS 26:
Sulphonylurea failure in non-insulin-dependent diabetic patients over six
years. UK Prospective Diabetes Study (UKPDS) Group. Diabet Med 15:
297 – 303
Minkenberg I, Ferber E (1984) Lucigenin-dependent chemiluminescence as a
new assay for NAD(P)H-oxidase activity in particulate fractions of human
polymorphonuclear leukocytes. J Immunol Methods 71: 61 – 67
Naguleswaran A, Alaeddine F, Guionaud C, Vonlaufen N, Sonda S, Jenoe P,
Mevissen M, Hemphill A (2005) Neospora caninum protein disulfide
isomerase is involved in tachyzoite-host cell interaction. Int J Parasitol 35:
1459 – 1472
20 of 21 EMBO Molecular Medicine e11668 | 2021 ª 2021 The Authors
EMBO Molecular Medicine Tien-Fen Kuo et al
Nakamura U, Iwase M, Uchizono Y, Sonoki K, Sasaki N, Imoto H, Goto D, Iida
M (2006) Rapid intracellular acidification and cell death by H2O2 and
alloxan in pancreatic beta cells. Free Rad Biol Med 40: 2047 – 2055
Newsholme P, Rebelato E, Abdulkader F, Krause M, Carpinelli A, Curi R (2012)
Reactive oxygen and nitrogen species generation, antioxidant defenses, and
beta-cell function: a critical role for amino acids. J Endocrinol 214: 11– 20
Ni M, Lee AS (2007) ER chaperones in mammalian development and human
diseases. Febs Lett 581: 3641 – 3651
Norgaard P, Westphal V, Tachibana C, Alsoe L, Holst B, Winther JR (2001)
Functional differences in yeast protein disulfide isomerases. J Cell Biol 152:
553 – 562
Ou W, Silver J (2006) Role of protein disulfide isomerase and other thiol-
reactive proteins in HIV-1 envelope protein-mediated fusion. Virology 350:
406 – 417
Parker R, Phan T, Baumeister P, Roy B, Cheriyath V, Roy AL, Lee AS (2001)
Identification of TFII-I as the endoplasmic reticulum stress response
element binding factor ERSF: its autoregulation by stress and interaction
with ATF6. Mol Cell Biol 21: 3220 – 3233
Pawar H, Kashyap MK, Sahasrabuddhe NA, Renuse S, Harsha HC, Kumar P,
Sharma J, Kandasamy K, Marimuthu A, Nair B et al (2011) Quantitative
tissue proteomics of esophageal squamous cell carcinoma for novel
biomarker discovery. Cancer Biol Ther 12: 510 – 522
Quan W, Lim YM, Lee MS (2012) Role of autophagy in diabetes and endoplasmic
reticulum stress of pancreatic beta-cells. Exp Mol Med 44: 81–88
Robertson RP (2004) Chronic oxidative stress as a central mechanism for
glucose toxicity in pancreatic islet beta cells in diabetes. J Biol Chem 279:
42351 – 42354
Robertson RP, Harmon J, Tran PO, Poitout V (2004) Beta-cell glucose toxicity,
lipotoxicity, and chronic oxidative stress in type 2 diabetes. Diabetes 53
(Suppl 1): S119 – S124
Robertson RP, Harmon JS (2007) Pancreatic islet beta-cell and oxidative stress:
the importance of glutathione peroxidase. Febs Lett 581: 3743– 3748
Schultz-Norton JR, McDonald WH, Yates JR, Nardulli AM (2006) Protein
disulfide isomerase serves as a molecular chaperone to maintain estrogen
receptor alpha structure and function. Mol Endocrinol (Baltimore, MD) 20:
1982 – 1995
Severino A, Campioni M, Straino S, Salloum FN, Schmidt N, Herbrand U,
Frede S, Toietta G, Di Rocco G, Bussani R et al (2007) Identification of
protein disulfide isomerase as a cardiomyocyte survival factor in ischemic
cardiomyopathy. J Am Coll Cardiol 50: 1029 – 1037
Tangvarasittichai S (2015) Oxidative stress, insulin resistance, dyslipidemia
and type 2 diabetes mellitus. World J Diabetes 6: 456 – 480
Tiedge M, Lortz S, Drinkgern J, Lenzen S (1997) Relation between antioxidant
enzyme gene expression and antioxidative defense status of insulin-
producing cells. Diabetes 46: 1733 – 1742
Trachootham D, Alexandre J, Huang P (2009) Targeting cancer cells by ROS-
mediated mechanisms: a radical therapeutic approach? Nat Rev Drug
Discov 8: 579 – 591
Tsai P-Y, Ka S-M, Chang J-M, Chen H-C, Shui H-A, Li C-Y, Hua K-F, Chang W-
L, Huang J-J, Yang S-S et al (2011) Epigallocatechin-3-gallate prevents
lupus nephritis development in mice via enhancing the Nrf2 antioxidant
pathway and inhibiting NLRP3 inflammasome activation. Free Rad Biol
Med 51: 744 – 754
Turano C, Coppari S, Altieri F, Ferraro A (2002) Proteins of the PDI family:
unpredicted non-ER locations and functions. J Cell Physiol 193: 154 – 163
Weaver JR, Grzesik W, Taylor-Fishwick DA (2015) Inhibition of NADPH
oxidase-1 preserves beta cell function. Diabetologia 58: 113 – 121
Winter AD, McCormack G, Page AP (2007) Protein disulfide isomerase activity
is essential for viability and extracellular matrix formation in the
nematode Caenorhabditis elegans. Dev Biol 308: 449 – 461
Wu J, Luo X, Thangthaeng N, Sumien N, Chen Z, Rutledge MA, Jing S, Forster
MJ, Yan LJ (2017) Pancreatic mitochondrial complex I exhibits aberrant
hyperactivity in diabetes. Biochem Biophys Rep 11: 119 – 129
Xiong Y, Manevich Y, Tew KD, Townsend DM (2012) S-glutathionylation of
protein disulfide isomerase regulates estrogen receptor alpha stability and
function. Intl Cell Biol 2012: 273549
Yagi N, Yokono K, Amano K, Nagata M, Tsukamoto K, Hasegawa Y, Yoneda R,
Okamoto N, Moriyama H, Miki M et al (1995) Expression of intercellular
adhesion molecule 1 on pancreatic beta-cells accelerates beta-cell
destruction by cytotoxic T-cells in murine autoimmune diabetes. Diabetes
44: 744 – 752
Yang J-S, Lu C-C, Kuo S-C, Hsu Y-M, Tsai S-C, Chen S-Y, Chen Y-T, Lin Y-J,
Huang Y-C, Chen C-J et al (2017) Autophagy and its link to type II
diabetes mellitus. BioMedicine 7: 1
License: This is an open access article under the
terms of the Creative Commons Attribution License,
which permits use, distribution and reproduction in
any medium, provided the original work is properly
cited.
ª 2021 The Authors EMBO Molecular Medicine e11668 | 2021 21 of 21
Tien-Fen Kuo et al EMBO Molecular Medicine


![Trabalho ..Diabetes Mellitus[1]](https://static.fdocument.org/doc/165x107/5571fec049795991699c0766/trabalho-diabetes-mellitus1.jpg)