
OPEN SNAP-- · scientific reports ã 7744 doi.9---1 snap-- c x+ β t d w, l kžčć b x, m g,, i...
14
1 SCIENTIFIC REPORTS | 7: 7744 | DOI:10.1038/s41598-017-08082-y www.nature.com/scientificreports SNAP-25b-deficiency increases insulin secretion and changes spatiotemporal profile of Ca 2+ oscillations in β cell networks Teresa Daraio 1 , Lidija Križančić Bombek 2 , Marko Gosak 2,3 , Ismael Valladolid-Acebes 1 , Maša Skelin Klemen 2 , Essam Refai 1 , Per-Olof Berggren 1 , Kerstin Brismar 1 , Marjan Slak Rupnik 2,4 & Christina Bark 1 SNAP-25 is a protein of the core SNARE complex mediating stimulus-dependent release of insulin from pancreatic β cells. The protein exists as two alternatively spliced isoforms, SNAP-25a and SNAP- 25b, differing in 9 out of 206 amino acids, yet their specific roles in pancreatic β cells remain unclear. We explored the effect of SNAP-25b-deficiency on glucose-stimulated insulin release in islets and found increased secretion both in vivo and in vitro. However, slow photo-release of caged Ca 2+ in β cells within pancreatic slices showed no significant differences in Ca 2+ -sensitivity, amplitude or rate of exocytosis between SNAP-25b-deficient and wild-type littermates. Therefore, we next investigated if Ca 2+ handling was affected in glucose-stimulated β cells using intracellular Ca 2+ -imaging and found premature activation and delayed termination of [Ca 2+ ] i elevations. These findings were accompanied by less synchronized Ca 2+ -oscillations and hence more segregated functional β cell networks in SNAP-25b-deficient mice. Islet gross morphology and architecture were maintained in mutant mice, although sex specific compensatory changes were observed. Thus, our study proposes that SNAP-25b in pancreatic β cells, except for participating in the core SNARE complex, is necessary for accurate regulation of Ca 2+ -dynamics. A controlled insulin secretion from β cells in the islets of Langerhans is essential to preserve healthy levels of blood glucose during basal and stimulated conditions 1 . Glucose-driven insulin secretion is mediated by SNARE proteins (Soluble NSF-attachment Protein (SNAP) REceptors; NSF, N-ethylmaleimide-sensitive fusion protein) and requires an increase in cytosolic Ca 2+2, 3 . When β cells sense, import and metabolize glucose from the blood, molecular processes increase cytosolic levels of Ca 2+ , which activate the SNARE machinery mediating insulin granule fusion with the plasma membrane. Glucose stimulation of β cells normally induces a biphasic response of insulin secretion, consisting of an initial fast first phase lasting a few minutes, followed by a sustained long-lasting second phase characterized by pulsatile insulin release 1, 4, 5 . The excitable β cell expresses essentially the same repertoire of SNARE proteins as neuroendo- crine and neuronal cells 2, 3, 6 . The SNARE complex includes the plasma membrane proteins syntaxin and synaptosomal-associated protein of 25 kD (SNAP-25), and the vesicular protein VAMP/synaptobrevin. SNAP-25 is essential for stimulus-dependent exocytosis and exists as two isoforms, SNAP-25a and SNAP-25b. Alternative splicing between two exons 5 in the Snap25 gene results in two proteins, differing in only 9 out of 206 amino acids 7–9 . Messenger RNAs for both SNAP-25 isoforms are expressed in primary pancreatic β cells and both var- iants support insulin secretion 10, 11 . e functional difference between the two isoforms is not fully understood, however, in mouse brain SNAP-25b forms more stable SNARE complexes than SNAP-25a 12 . Furthermore, in embryonic SNAP-25-deficient chromaffin cells, introduction of exogenous SNAP-25b induces a larger pool 1 The Rolf Luft Research Center for Diabetes and Endocrinology, Department of Molecular Medicine and Surgery, Karolinska Institutet, 171 76, Stockholm, Sweden. 2 Institute of Physiology, Faculty of Medicine, University of Maribor, SI-2000, Maribor, Slovenia. 3 Department of Physics, Faculty of Natural Sciences and Mathematics, University of Maribor, SI-2000, Maribor, Slovenia. 4 Center for Physiology and Pharmacology, Medical University of Vienna, A-1090, Vienna, Austria. Correspondence and requests for materials should be addressed to M.S.R. (email: [email protected]) or C.B. (email: [email protected]) Received: 9 March 2017 Accepted: 4 July 2017 Published: xx xx xxxx OPEN
Transcript of OPEN SNAP-- · scientific reports ã 7744 doi.9---1 snap-- c x+ β t d w, l kžčć b x, m g,, i...
1SCIENTIFIC RepoRts | 7: 7744 | DOI:10.1038/s41598-017-08082-y
www.nature.com/scientificreports
SNAP-25b-deficiency increases insulin secretion and changes spatiotemporal profile of Ca2+oscillations in β cell networksTeresa Daraio1, Lidija Križančić Bombek2, Marko Gosak2,3, Ismael Valladolid-Acebes1, Maša Skelin Klemen2, Essam Refai1, Per-Olof Berggren1, Kerstin Brismar1, Marjan Slak Rupnik2,4 & Christina Bark1
SNAP-25 is a protein of the core SNARE complex mediating stimulus-dependent release of insulin from pancreatic β cells. The protein exists as two alternatively spliced isoforms, SNAP-25a and SNAP-25b, differing in 9 out of 206 amino acids, yet their specific roles in pancreatic β cells remain unclear. We explored the effect of SNAP-25b-deficiency on glucose-stimulated insulin release in islets and found increased secretion both in vivo and in vitro. However, slow photo-release of caged Ca2+ in β cells within pancreatic slices showed no significant differences in Ca2+-sensitivity, amplitude or rate of exocytosis between SNAP-25b-deficient and wild-type littermates. Therefore, we next investigated if Ca2+ handling was affected in glucose-stimulated β cells using intracellular Ca2+-imaging and found premature activation and delayed termination of [Ca2+]i elevations. These findings were accompanied by less synchronized Ca2+-oscillations and hence more segregated functional β cell networks in SNAP-25b-deficient mice. Islet gross morphology and architecture were maintained in mutant mice, although sex specific compensatory changes were observed. Thus, our study proposes that SNAP-25b in pancreatic β cells, except for participating in the core SNARE complex, is necessary for accurate regulation of Ca2+-dynamics.
A controlled insulin secretion from β cells in the islets of Langerhans is essential to preserve healthy levels of blood glucose during basal and stimulated conditions1. Glucose-driven insulin secretion is mediated by SNARE proteins (Soluble NSF-attachment Protein (SNAP) REceptors; NSF, N-ethylmaleimide-sensitive fusion protein) and requires an increase in cytosolic Ca2+2, 3. When β cells sense, import and metabolize glucose from the blood, molecular processes increase cytosolic levels of Ca2+, which activate the SNARE machinery mediating insulin granule fusion with the plasma membrane. Glucose stimulation of β cells normally induces a biphasic response of insulin secretion, consisting of an initial fast first phase lasting a few minutes, followed by a sustained long-lasting second phase characterized by pulsatile insulin release1, 4, 5.
The excitable β cell expresses essentially the same repertoire of SNARE proteins as neuroendo-crine and neuronal cells2, 3, 6. The SNARE complex includes the plasma membrane proteins syntaxin and synaptosomal-associated protein of 25 kD (SNAP-25), and the vesicular protein VAMP/synaptobrevin. SNAP-25 is essential for stimulus-dependent exocytosis and exists as two isoforms, SNAP-25a and SNAP-25b. Alternative splicing between two exons 5 in the Snap25 gene results in two proteins, differing in only 9 out of 206 amino acids7–9. Messenger RNAs for both SNAP-25 isoforms are expressed in primary pancreatic β cells and both var-iants support insulin secretion10, 11. The functional difference between the two isoforms is not fully understood, however, in mouse brain SNAP-25b forms more stable SNARE complexes than SNAP-25a12. Furthermore, in embryonic SNAP-25-deficient chromaffin cells, introduction of exogenous SNAP-25b induces a larger pool
1The Rolf Luft Research Center for Diabetes and Endocrinology, Department of Molecular Medicine and Surgery, Karolinska Institutet, 171 76, Stockholm, Sweden. 2Institute of Physiology, Faculty of Medicine, University of Maribor, SI-2000, Maribor, Slovenia. 3Department of Physics, Faculty of Natural Sciences and Mathematics, University of Maribor, SI-2000, Maribor, Slovenia. 4Center for Physiology and Pharmacology, Medical University of Vienna, A-1090, Vienna, Austria. Correspondence and requests for materials should be addressed to M.S.R. (email: [email protected]) or C.B. (email: [email protected])
Received: 9 March 2017
Accepted: 4 July 2017
Published: xx xx xxxx
OPEN
www.nature.com/scientificreports/
2SCIENTIFIC RepoRts | 7: 7744 | DOI:10.1038/s41598-017-08082-y
of primed vesicles than SNAP-25a, resulting in a higher burst of catecholamine secretion after stimulation13. Additionally, SNAP-25 together with syntaxin binds to the synprint site of voltage-dependent calcium channels, VDCC, potassium channels and G-protein-coupled receptors14–22. Thus, SNAP-25 plays also a role in the regula-tion of Ca2+ dynamics and membrane potential in β cells.
Controlled alterations of intracellular Ca2+ concentrations, [Ca2+]i, play a central role in insulin secretion from β cells. The first phase of insulin release is dependent on local Ca2+-influxes through VDCCs which recruit Ca2+ from endoplasmic reticulum. The sustained long-lasting second phase of rhythmic insulin release is also dependent on a more complex simultaneous intracellular signaling, including changes in ATP levels, phospho-inositides and the release of Ca2+ from intracellular stores23, 24. In healthy islets there exists also an extensive electrical coupling between individual β cells mediated through gap junctions, and these intercellular contacts are connecting hundreds of β cells into a functional network25–28. As a result, the dynamics of electrical activity, [Ca2+]i oscillations and pulsatile insulin secretion are collectively controlled throughout the islet29. Alterations in islet morphology as well as in connexin36-dependent intercellular communication via gap junctions can result in loss of [Ca2+]i coordination, which leads to an impairment of the normal pulsatile pattern of insulin secretion4, 26,
30–32. In several mouse models of diabetes26, 32, 33, in connexin36-null mouse models30, 31 and also in humans with prediabetes34 it has been shown that loss of synchronization in [Ca2+]i oscillations is accompanied by a disruption of glucose sensitivity and impairment of the normal oscillatory pattern of insulin secretion.
Recently, we demonstrated that a genetically engineered mouse mutant expressing normal levels of SNAP-25 but without expressing the SNAP-25b isoform, developed metabolic impairments such as obesity, hyperglycemia, dyslipidemia, adipocyte hypertrophy and liver steatosis, a phenotype resembling the metabolic syndrome which was dramatically exaggerated when combined with a high fat/high carbohydrate diet intervention35. Here we have investigated how the absence of SNAP-25b influenced insulin secretion, as impaired insulin exocytosis by itself can act as a triggering factor for developing disease. We have analyzed the effect of SNAP-25b-deficiency during acute glucose-stimulated insulin secretion, gross islet morphology, Ca2+-dependent exocytosis in individual β cells and glucose-dependent β cell network activity.
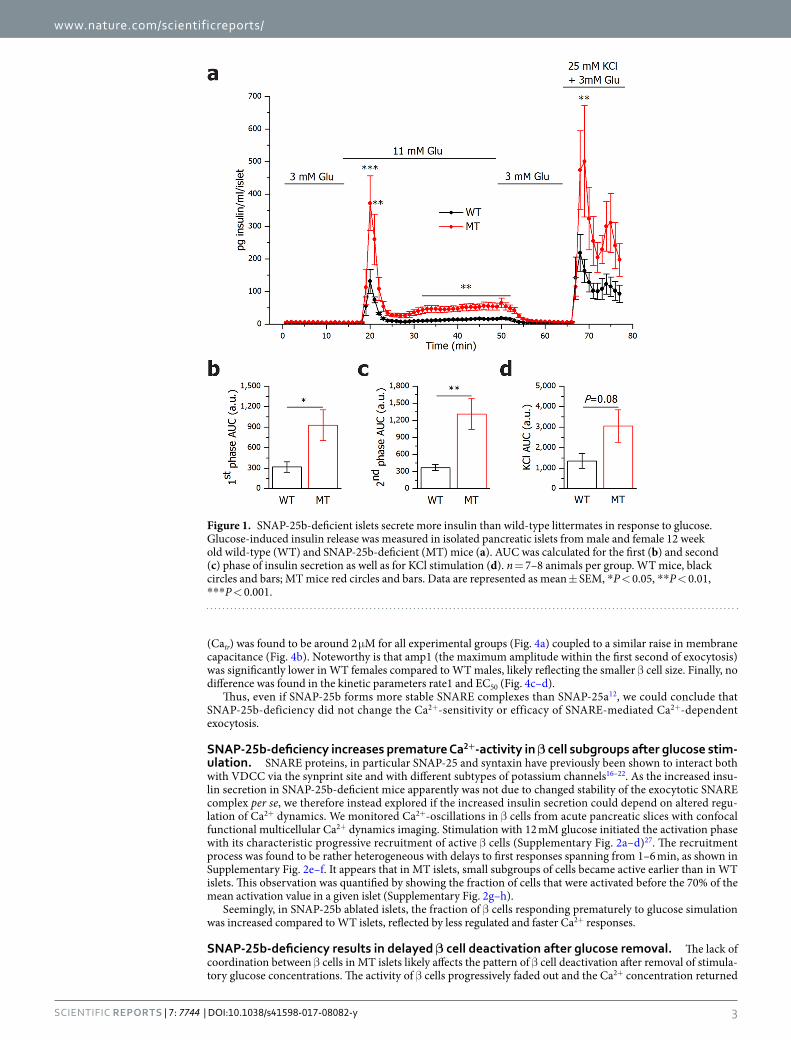
ResultsIslets from SNAP-25b-deficient mice secrete more insulin. We first investigated the role of SNAP-25b-deficiency during glucose-stimulated insulin secretion in isolated pancreatic islets (Fig. 1). As shown in Fig. 1a, glucose stimulation resulted in an overall increased insulin secretion in SNAP-25b-deficient (MT) mice compared to their wild-type (WT) littermates. The area under the curve (AUC) was calculated for the first (Fig. 1b) and second phase (Fig. 1c) of insulin secretion and in MT mice the AUC during both phases was signif-icantly increased compared to WT mice. KCl depolarization had a greater effect on insulin secretion in MT com-pared to WT mice although it was not significantly different (P = 0.08) (Fig. 1d). A similar trend was observed also when female and male mice were analyzed separately (Supplementary Fig. 1).
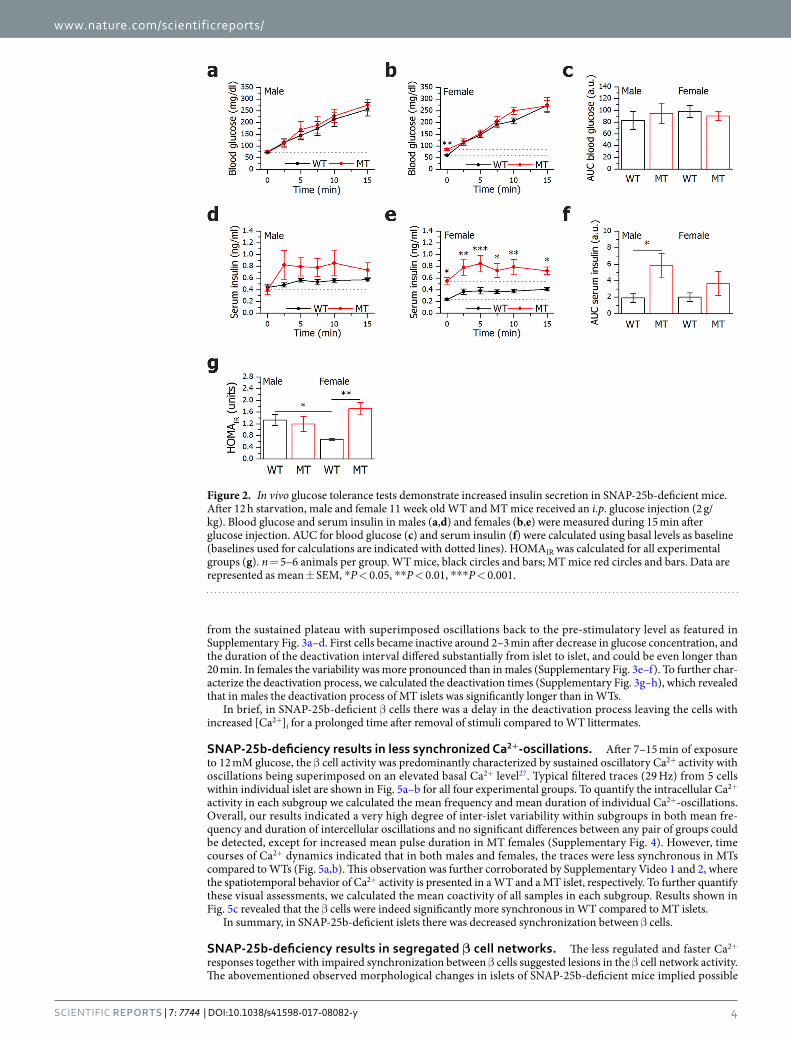
To further confirm whether the facilitated insulin release found in vitro was also present in vivo, we focused on the secretory response within the first 15 min of a glucose tolerance test (GTT) (Fig. 2). Serum levels of insu-lin in MT mice challenged with glucose were higher compared to WTs at 2.5, 5, 7.5, 10 and 15 min after glucose injection (Fig. 2d–e). MT mice had a tendency to respond to glucose with a faster increase in serum insulin (Fig. 2d–e) and AUC above the resting serum insulin level was higher for MTs (Fig. 2f). Blood glucose levels and AUC above the basal glucose levels were comparable in all groups tested (Fig. 2a–c). WT females had consistently lower serum insulin levels compared to WT males and therefore MT females were hyperglycemic and hyperin-sulinemic already at basal conditions compared to WT females (Fig. 2b,e). In fact, the WT females were found to be more sensitive to insulin compared both to WT males and MT females when the HOMAIR was calculated (Fig. 2g). Furthermore, preliminary results from insulin tolerance tests support the HOMAIR measurements (data not shown).
Taken together, SNAP-25b-deficiency increased glucose-stimulated insulin secretion both in vitro and in vivo.
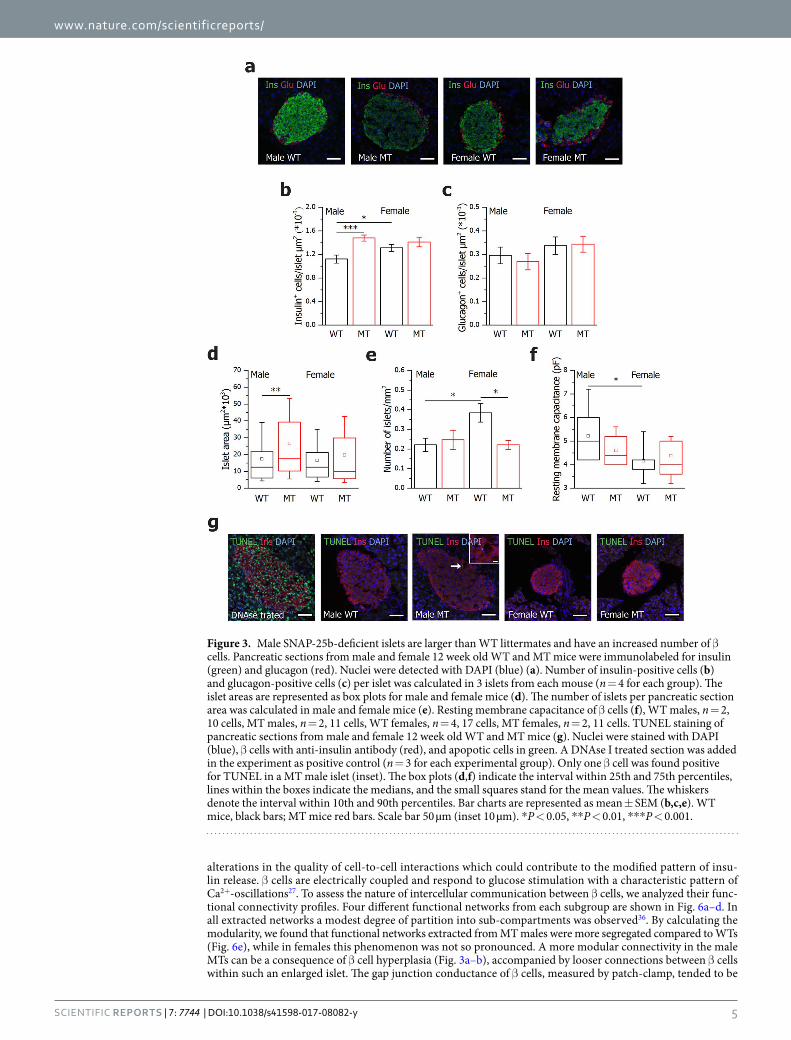
β cell hyperplasia in islets from SNAP-25b-deficient mice. To address the issue of the aforemen-tioned higher insulin secretion after glucose challenge in MT animals, we first explored the appearance of insulin- and glucagon-expressing cells in pancreatic sections by fluorescence immunohistochemistry (Fig. 3a). In islets of SNAP-25b-deficient mice a characteristic spatial distribution of α and β cells as in their WT littermates was found (Fig. 3a). Further analyses showed that MT males had an increased number of insulin-positive cells compared to WTs (Fig. 3b) and the islet size in MT males was significantly larger compared to WT males (Fig. 3d). WT females showed increased number of insulin-positive cells compared to WT males (Fig. 3b), although the individual β cells in the islets of WT females were smaller in size, as determined by membrane capacitance measurements (Fig. 3f). No significant differences were detected in the number of α cells per islet (Fig. 3c). Furthermore, the total number of islets per square millimeter in pancreatic sections was counted and MT females had fewer islets compared to WT females, whereas no difference was present in males (Fig. 3e). WT females were found to have a significantly increased number of islets compared to WT males (Fig. 3e). Although, no signs of an increased rate of apoptosis were found in β cells in MT mice compared to WT mice (Fig. 3g).
In conclusion, MT males displayed β cell hyperplasia which partly can explain the increased insulin release while MT females did not show any major morphological changes of the islets.
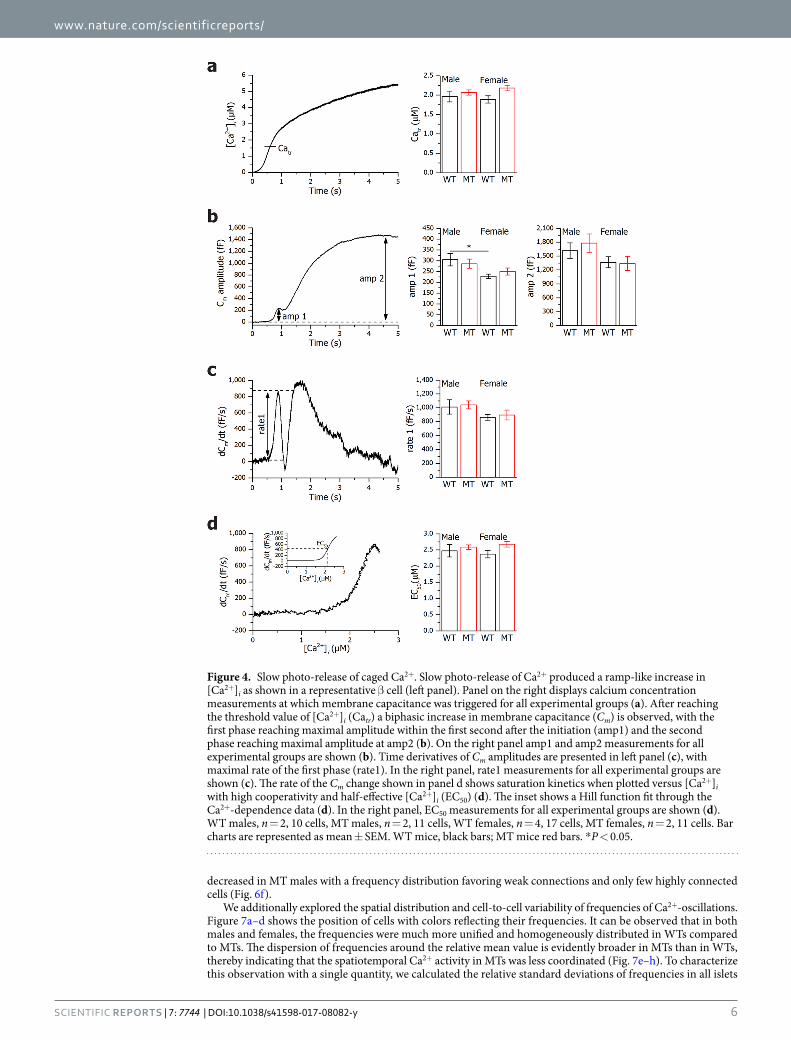
SNAP-25b-deficiency does not affect Ca2+-sensitivity or rate of exocytosis. To explore if the increased insulin secretion found in SNAP-25b-deficient β cells was dependent on less stable SNARE com-plexes that could facilitate exocytosis we performed experiments with slow photo-release of caged Ca2+ (Fig. 4). Unexpectedly, there were no significant differences either in Ca2+-sensitivity, amplitude or rate of exocytosis between WT and MT β cells when [Ca2+]i was elevated (Fig. 4a–d). The Ca2+ concentration triggering exocytosis
www.nature.com/scientificreports/
3SCIENTIFIC RepoRts | 7: 7744 | DOI:10.1038/s41598-017-08082-y
(Catr) was found to be around 2 μM for all experimental groups (Fig. 4a) coupled to a similar raise in membrane capacitance (Fig. 4b). Noteworthy is that amp1 (the maximum amplitude within the first second of exocytosis) was significantly lower in WT females compared to WT males, likely reflecting the smaller β cell size. Finally, no difference was found in the kinetic parameters rate1 and EC50 (Fig. 4c–d).
Thus, even if SNAP-25b forms more stable SNARE complexes than SNAP-25a12, we could conclude that SNAP-25b-deficiency did not change the Ca2+-sensitivity or efficacy of SNARE-mediated Ca2+-dependent exocytosis.
SNAP-25b-deficiency increases premature Ca2+-activity in β cell subgroups after glucose stim-ulation. SNARE proteins, in particular SNAP-25 and syntaxin have previously been shown to interact both with VDCC via the synprint site and with different subtypes of potassium channels16–22. As the increased insu-lin secretion in SNAP-25b-deficient mice apparently was not due to changed stability of the exocytotic SNARE complex per se, we therefore instead explored if the increased insulin secretion could depend on altered regu-lation of Ca2+ dynamics. We monitored Ca2+-oscillations in β cells from acute pancreatic slices with confocal functional multicellular Ca2+ dynamics imaging. Stimulation with 12 mM glucose initiated the activation phase with its characteristic progressive recruitment of active β cells (Supplementary Fig. 2a–d)27. The recruitment process was found to be rather heterogeneous with delays to first responses spanning from 1–6 min, as shown in Supplementary Fig. 2e–f. It appears that in MT islets, small subgroups of cells became active earlier than in WT islets. This observation was quantified by showing the fraction of cells that were activated before the 70% of the mean activation value in a given islet (Supplementary Fig. 2g–h).
Seemingly, in SNAP-25b ablated islets, the fraction of β cells responding prematurely to glucose simulation was increased compared to WT islets, reflected by less regulated and faster Ca2+ responses.
SNAP-25b-deficiency results in delayed β cell deactivation after glucose removal. The lack of coordination between β cells in MT islets likely affects the pattern of β cell deactivation after removal of stimula-tory glucose concentrations. The activity of β cells progressively faded out and the Ca2+ concentration returned
Figure 1. SNAP-25b-deficient islets secrete more insulin than wild-type littermates in response to glucose. Glucose-induced insulin release was measured in isolated pancreatic islets from male and female 12 week old wild-type (WT) and SNAP-25b-deficient (MT) mice (a). AUC was calculated for the first (b) and second (c) phase of insulin secretion as well as for KCl stimulation (d). n = 7–8 animals per group. WT mice, black circles and bars; MT mice red circles and bars. Data are represented as mean ± SEM, *P < 0.05, **P < 0.01, ***P < 0.001.
www.nature.com/scientificreports/
4SCIENTIFIC RepoRts | 7: 7744 | DOI:10.1038/s41598-017-08082-y
from the sustained plateau with superimposed oscillations back to the pre-stimulatory level as featured in Supplementary Fig. 3a–d. First cells became inactive around 2–3 min after decrease in glucose concentration, and the duration of the deactivation interval differed substantially from islet to islet, and could be even longer than 20 min. In females the variability was more pronounced than in males (Supplementary Fig. 3e–f). To further char-acterize the deactivation process, we calculated the deactivation times (Supplementary Fig. 3g–h), which revealed that in males the deactivation process of MT islets was significantly longer than in WTs.
In brief, in SNAP-25b-deficient β cells there was a delay in the deactivation process leaving the cells with increased [Ca2+]i for a prolonged time after removal of stimuli compared to WT littermates.
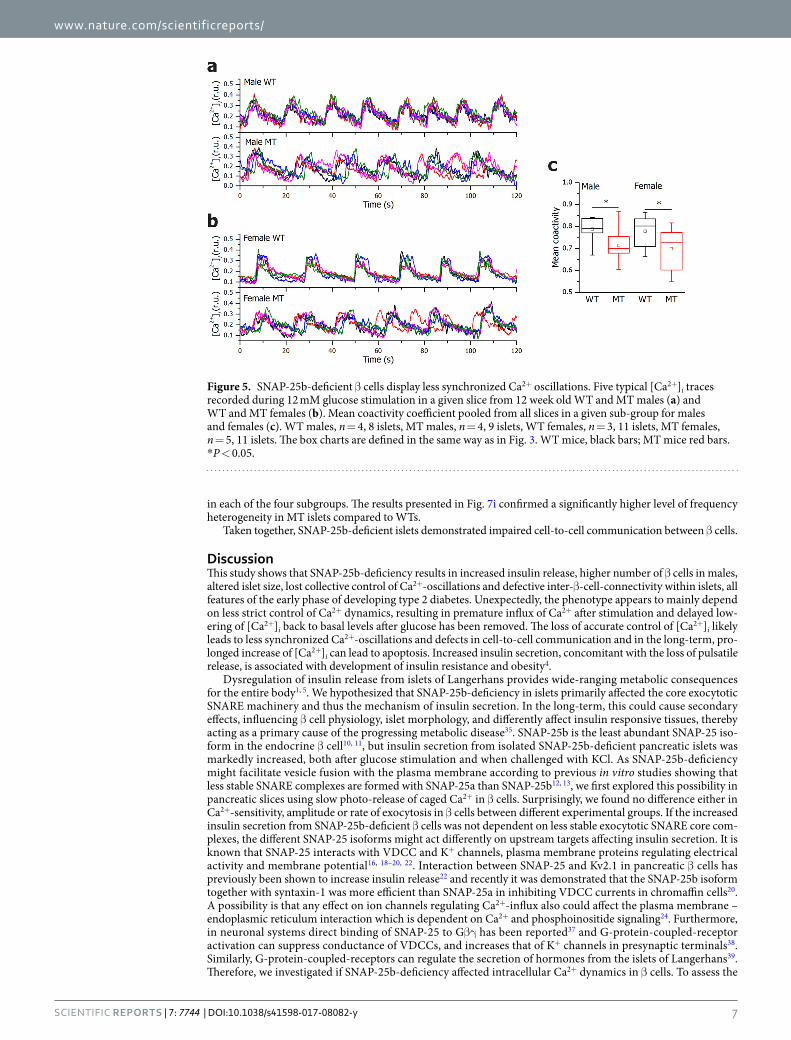
SNAP-25b-deficiency results in less synchronized Ca2+-oscillations. After 7–15 min of exposure to 12 mM glucose, the β cell activity was predominantly characterized by sustained oscillatory Ca2+ activity with oscillations being superimposed on an elevated basal Ca2+ level27. Typical filtered traces (29 Hz) from 5 cells within individual islet are shown in Fig. 5a–b for all four experimental groups. To quantify the intracellular Ca2+ activity in each subgroup we calculated the mean frequency and mean duration of individual Ca2+-oscillations. Overall, our results indicated a very high degree of inter-islet variability within subgroups in both mean fre-quency and duration of intercellular oscillations and no significant differences between any pair of groups could be detected, except for increased mean pulse duration in MT females (Supplementary Fig. 4). However, time courses of Ca2+ dynamics indicated that in both males and females, the traces were less synchronous in MTs compared to WTs (Fig. 5a,b). This observation was further corroborated by Supplementary Video 1 and 2, where the spatiotemporal behavior of Ca2+ activity is presented in a WT and a MT islet, respectively. To further quantify these visual assessments, we calculated the mean coactivity of all samples in each subgroup. Results shown in Fig. 5c revealed that the β cells were indeed significantly more synchronous in WT compared to MT islets.
In summary, in SNAP-25b-deficient islets there was decreased synchronization between β cells.
SNAP-25b-deficiency results in segregated β cell networks. The less regulated and faster Ca2+ responses together with impaired synchronization between β cells suggested lesions in the β cell network activity. The abovementioned observed morphological changes in islets of SNAP-25b-deficient mice implied possible
Figure 2. In vivo glucose tolerance tests demonstrate increased insulin secretion in SNAP-25b-deficient mice. After 12 h starvation, male and female 11 week old WT and MT mice received an i.p. glucose injection (2 g/kg). Blood glucose and serum insulin in males (a,d) and females (b,e) were measured during 15 min after glucose injection. AUC for blood glucose (c) and serum insulin (f) were calculated using basal levels as baseline (baselines used for calculations are indicated with dotted lines). HOMAIR was calculated for all experimental groups (g). n = 5–6 animals per group. WT mice, black circles and bars; MT mice red circles and bars. Data are represented as mean ± SEM, *P < 0.05, **P < 0.01, ***P < 0.001.
www.nature.com/scientificreports/
5SCIENTIFIC RepoRts | 7: 7744 | DOI:10.1038/s41598-017-08082-y
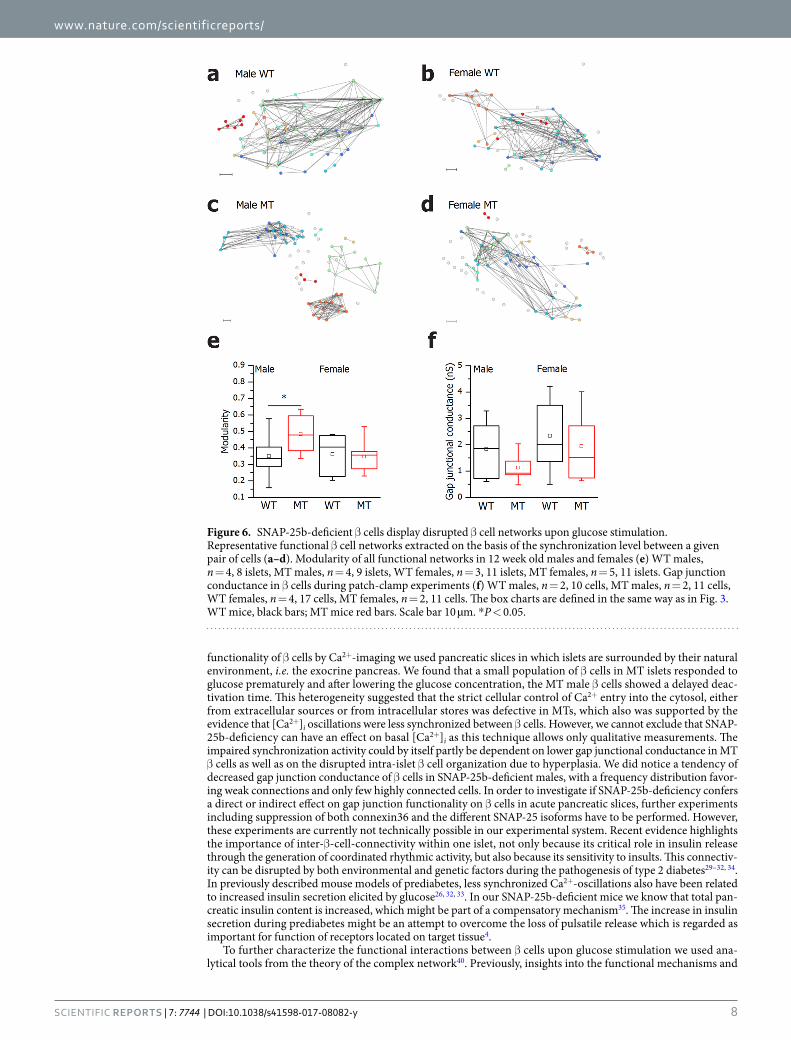
alterations in the quality of cell-to-cell interactions which could contribute to the modified pattern of insu-lin release. β cells are electrically coupled and respond to glucose stimulation with a characteristic pattern of Ca2+-oscillations27. To assess the nature of intercellular communication between β cells, we analyzed their func-tional connectivity profiles. Four different functional networks from each subgroup are shown in Fig. 6a–d. In all extracted networks a modest degree of partition into sub-compartments was observed36. By calculating the modularity, we found that functional networks extracted from MT males were more segregated compared to WTs (Fig. 6e), while in females this phenomenon was not so pronounced. A more modular connectivity in the male MTs can be a consequence of β cell hyperplasia (Fig. 3a–b), accompanied by looser connections between β cells within such an enlarged islet. The gap junction conductance of β cells, measured by patch-clamp, tended to be
Figure 3. Male SNAP-25b-deficient islets are larger than WT littermates and have an increased number of β cells. Pancreatic sections from male and female 12 week old WT and MT mice were immunolabeled for insulin (green) and glucagon (red). Nuclei were detected with DAPI (blue) (a). Number of insulin-positive cells (b) and glucagon-positive cells (c) per islet was calculated in 3 islets from each mouse (n = 4 for each group). The islet areas are represented as box plots for male and female mice (d). The number of islets per pancreatic section area was calculated in male and female mice (e). Resting membrane capacitance of β cells (f), WT males, n = 2, 10 cells, MT males, n = 2, 11 cells, WT females, n = 4, 17 cells, MT females, n = 2, 11 cells. TUNEL staining of pancreatic sections from male and female 12 week old WT and MT mice (g). Nuclei were stained with DAPI (blue), β cells with anti-insulin antibody (red), and apopotic cells in green. A DNAse I treated section was added in the experiment as positive control (n = 3 for each experimental group). Only one β cell was found positive for TUNEL in a MT male islet (inset). The box plots (d,f) indicate the interval within 25th and 75th percentiles, lines within the boxes indicate the medians, and the small squares stand for the mean values. The whiskers denote the interval within 10th and 90th percentiles. Bar charts are represented as mean ± SEM (b,c,e). WT mice, black bars; MT mice red bars. Scale bar 50 µm (inset 10 µm). *P < 0.05, **P < 0.01, ***P < 0.001.
www.nature.com/scientificreports/
6SCIENTIFIC RepoRts | 7: 7744 | DOI:10.1038/s41598-017-08082-y
decreased in MT males with a frequency distribution favoring weak connections and only few highly connected cells (Fig. 6f).
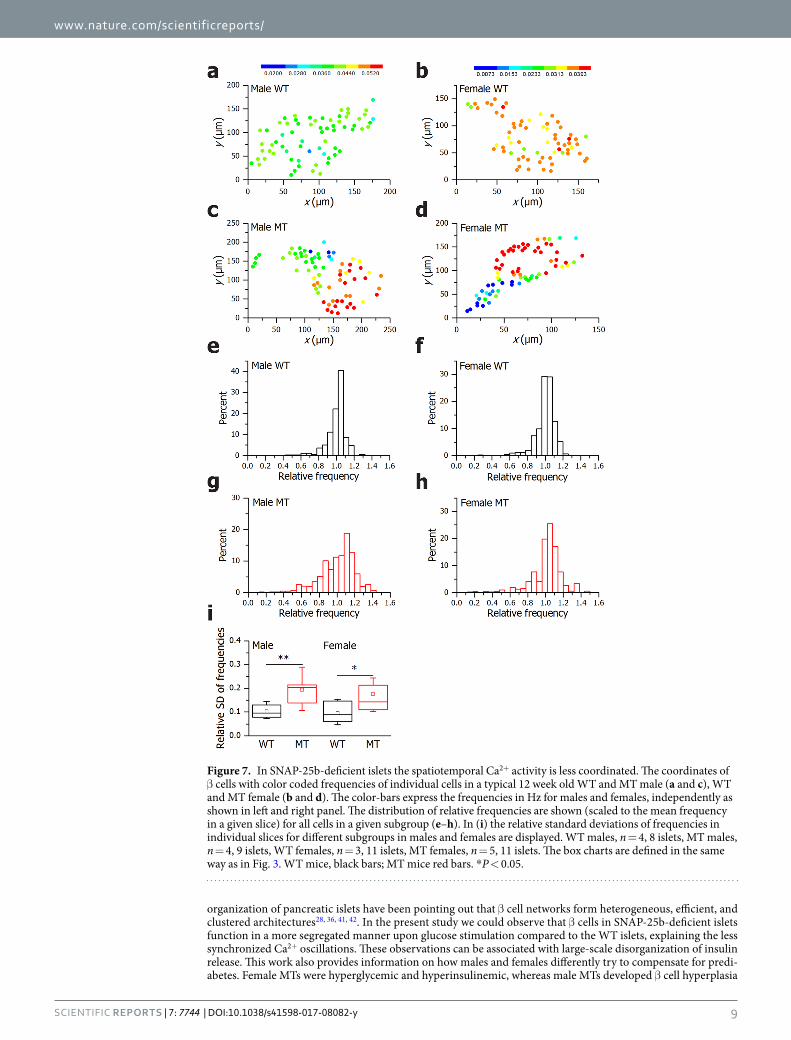
We additionally explored the spatial distribution and cell-to-cell variability of frequencies of Ca2+-oscillations. Figure 7a–d shows the position of cells with colors reflecting their frequencies. It can be observed that in both males and females, the frequencies were much more unified and homogeneously distributed in WTs compared to MTs. The dispersion of frequencies around the relative mean value is evidently broader in MTs than in WTs, thereby indicating that the spatiotemporal Ca2+ activity in MTs was less coordinated (Fig. 7e–h). To characterize this observation with a single quantity, we calculated the relative standard deviations of frequencies in all islets
Figure 4. Slow photo-release of caged Ca2+. Slow photo-release of Ca2+ produced a ramp-like increase in [Ca2+]i as shown in a representative β cell (left panel). Panel on the right displays calcium concentration measurements at which membrane capacitance was triggered for all experimental groups (a). After reaching the threshold value of [Ca2+]i (Catr) a biphasic increase in membrane capacitance (Cm) is observed, with the first phase reaching maximal amplitude within the first second after the initiation (amp1) and the second phase reaching maximal amplitude at amp2 (b). On the right panel amp1 and amp2 measurements for all experimental groups are shown (b). Time derivatives of Cm amplitudes are presented in left panel (c), with maximal rate of the first phase (rate1). In the right panel, rate1 measurements for all experimental groups are shown (c). The rate of the Cm change shown in panel d shows saturation kinetics when plotted versus [Ca2+]i with high cooperativity and half-effective [Ca2+]i (EC50) (d). The inset shows a Hill function fit through the Ca2+-dependence data (d). In the right panel, EC50 measurements for all experimental groups are shown (d). WT males, n = 2, 10 cells, MT males, n = 2, 11 cells, WT females, n = 4, 17 cells, MT females, n = 2, 11 cells. Bar charts are represented as mean ± SEM. WT mice, black bars; MT mice red bars. *P < 0.05.
www.nature.com/scientificreports/
7SCIENTIFIC RepoRts | 7: 7744 | DOI:10.1038/s41598-017-08082-y
in each of the four subgroups. The results presented in Fig. 7i confirmed a significantly higher level of frequency heterogeneity in MT islets compared to WTs.
Taken together, SNAP-25b-deficient islets demonstrated impaired cell-to-cell communication between β cells.
DiscussionThis study shows that SNAP-25b-deficiency results in increased insulin release, higher number of β cells in males, altered islet size, lost collective control of Ca2+-oscillations and defective inter-β-cell-connectivity within islets, all features of the early phase of developing type 2 diabetes. Unexpectedly, the phenotype appears to mainly depend on less strict control of Ca2+ dynamics, resulting in premature influx of Ca2+ after stimulation and delayed low-ering of [Ca2+]i back to basal levels after glucose has been removed. The loss of accurate control of [Ca2+]i likely leads to less synchronized Ca2+-oscillations and defects in cell-to-cell communication and in the long-term, pro-longed increase of [Ca2+]i can lead to apoptosis. Increased insulin secretion, concomitant with the loss of pulsatile release, is associated with development of insulin resistance and obesity4.
Dysregulation of insulin release from islets of Langerhans provides wide-ranging metabolic consequences for the entire body1, 5. We hypothesized that SNAP-25b-deficiency in islets primarily affected the core exocytotic SNARE machinery and thus the mechanism of insulin secretion. In the long-term, this could cause secondary effects, influencing β cell physiology, islet morphology, and differently affect insulin responsive tissues, thereby acting as a primary cause of the progressing metabolic disease35. SNAP-25b is the least abundant SNAP-25 iso-form in the endocrine β cell10, 11, but insulin secretion from isolated SNAP-25b-deficient pancreatic islets was markedly increased, both after glucose stimulation and when challenged with KCl. As SNAP-25b-deficiency might facilitate vesicle fusion with the plasma membrane according to previous in vitro studies showing that less stable SNARE complexes are formed with SNAP-25a than SNAP-25b12, 13, we first explored this possibility in pancreatic slices using slow photo-release of caged Ca2+ in β cells. Surprisingly, we found no difference either in Ca2+-sensitivity, amplitude or rate of exocytosis in β cells between different experimental groups. If the increased insulin secretion from SNAP-25b-deficient β cells was not dependent on less stable exocytotic SNARE core com-plexes, the different SNAP-25 isoforms might act differently on upstream targets affecting insulin secretion. It is known that SNAP-25 interacts with VDCC and K+ channels, plasma membrane proteins regulating electrical activity and membrane potential16, 18–20, 22. Interaction between SNAP-25 and Kv2.1 in pancreatic β cells has previously been shown to increase insulin release22 and recently it was demonstrated that the SNAP-25b isoform together with syntaxin-1 was more efficient than SNAP-25a in inhibiting VDCC currents in chromaffin cells20. A possibility is that any effect on ion channels regulating Ca2+-influx also could affect the plasma membrane – endoplasmic reticulum interaction which is dependent on Ca2+ and phosphoinositide signaling24. Furthermore, in neuronal systems direct binding of SNAP-25 to Gβγ has been reported37 and G-protein-coupled-receptor activation can suppress conductance of VDCCs, and increases that of K+ channels in presynaptic terminals38. Similarly, G-protein-coupled-receptors can regulate the secretion of hormones from the islets of Langerhans39. Therefore, we investigated if SNAP-25b-deficiency affected intracellular Ca2+ dynamics in β cells. To assess the
Figure 5. SNAP-25b-deficient β cells display less synchronized Ca2+ oscillations. Five typical [Ca2+]i traces recorded during 12 mM glucose stimulation in a given slice from 12 week old WT and MT males (a) and WT and MT females (b). Mean coactivity coefficient pooled from all slices in a given sub-group for males and females (c). WT males, n = 4, 8 islets, MT males, n = 4, 9 islets, WT females, n = 3, 11 islets, MT females, n = 5, 11 islets. The box charts are defined in the same way as in Fig. 3. WT mice, black bars; MT mice red bars. *P < 0.05.
www.nature.com/scientificreports/
8SCIENTIFIC RepoRts | 7: 7744 | DOI:10.1038/s41598-017-08082-y
functionality of β cells by Ca2+-imaging we used pancreatic slices in which islets are surrounded by their natural environment, i.e. the exocrine pancreas. We found that a small population of β cells in MT islets responded to glucose prematurely and after lowering the glucose concentration, the MT male β cells showed a delayed deac-tivation time. This heterogeneity suggested that the strict cellular control of Ca2+ entry into the cytosol, either from extracellular sources or from intracellular stores was defective in MTs, which also was supported by the evidence that [Ca2+]i oscillations were less synchronized between β cells. However, we cannot exclude that SNAP-25b-deficiency can have an effect on basal [Ca2+]i as this technique allows only qualitative measurements. The impaired synchronization activity could by itself partly be dependent on lower gap junctional conductance in MT β cells as well as on the disrupted intra-islet β cell organization due to hyperplasia. We did notice a tendency of decreased gap junction conductance of β cells in SNAP-25b-deficient males, with a frequency distribution favor-ing weak connections and only few highly connected cells. In order to investigate if SNAP-25b-deficiency confers a direct or indirect effect on gap junction functionality on β cells in acute pancreatic slices, further experiments including suppression of both connexin36 and the different SNAP-25 isoforms have to be performed. However, these experiments are currently not technically possible in our experimental system. Recent evidence highlights the importance of inter-β-cell-connectivity within one islet, not only because its critical role in insulin release through the generation of coordinated rhythmic activity, but also because its sensitivity to insults. This connectiv-ity can be disrupted by both environmental and genetic factors during the pathogenesis of type 2 diabetes29–32, 34. In previously described mouse models of prediabetes, less synchronized Ca2+-oscillations also have been related to increased insulin secretion elicited by glucose26, 32, 33. In our SNAP-25b-deficient mice we know that total pan-creatic insulin content is increased, which might be part of a compensatory mechanism35. The increase in insulin secretion during prediabetes might be an attempt to overcome the loss of pulsatile release which is regarded as important for function of receptors located on target tissue4.
To further characterize the functional interactions between β cells upon glucose stimulation we used ana-lytical tools from the theory of the complex network40. Previously, insights into the functional mechanisms and
Figure 6. SNAP-25b-deficient β cells display disrupted β cell networks upon glucose stimulation. Representative functional β cell networks extracted on the basis of the synchronization level between a given pair of cells (a–d). Modularity of all functional networks in 12 week old males and females (e) WT males, n = 4, 8 islets, MT males, n = 4, 9 islets, WT females, n = 3, 11 islets, MT females, n = 5, 11 islets. Gap junction conductance in β cells during patch-clamp experiments (f) WT males, n = 2, 10 cells, MT males, n = 2, 11 cells, WT females, n = 4, 17 cells, MT females, n = 2, 11 cells. The box charts are defined in the same way as in Fig. 3. WT mice, black bars; MT mice red bars. Scale bar 10 µm. *P < 0.05.
www.nature.com/scientificreports/
9SCIENTIFIC RepoRts | 7: 7744 | DOI:10.1038/s41598-017-08082-y
organization of pancreatic islets have been pointing out that β cell networks form heterogeneous, efficient, and clustered architectures28, 36, 41, 42. In the present study we could observe that β cells in SNAP-25b-deficient islets function in a more segregated manner upon glucose stimulation compared to the WT islets, explaining the less synchronized Ca2+ oscillations. These observations can be associated with large-scale disorganization of insulin release. This work also provides information on how males and females differently try to compensate for predi-abetes. Female MTs were hyperglycemic and hyperinsulinemic, whereas male MTs developed β cell hyperplasia
Figure 7. In SNAP-25b-deficient islets the spatiotemporal Ca2+ activity is less coordinated. The coordinates of β cells with color coded frequencies of individual cells in a typical 12 week old WT and MT male (a and c), WT and MT female (b and d). The color-bars express the frequencies in Hz for males and females, independently as shown in left and right panel. The distribution of relative frequencies are shown (scaled to the mean frequency in a given slice) for all cells in a given subgroup (e–h). In (i) the relative standard deviations of frequencies in individual slices for different subgroups in males and females are displayed. WT males, n = 4, 8 islets, MT males, n = 4, 9 islets, WT females, n = 3, 11 islets, MT females, n = 5, 11 islets. The box charts are defined in the same way as in Fig. 3. WT mice, black bars; MT mice red bars. *P < 0.05.
www.nature.com/scientificreports/
1 0SCIENTIFIC RepoRts | 7: 7744 | DOI:10.1038/s41598-017-08082-y
and larger islets. The dominance of preferably weak connections and segregated modules of β cells, accom-panying β cell hyperplasia, can result in increased long-term insulin release. Regardless, similar dynamics in glucose-stimulated insulin secretion were observed in both sexes. It seems that MT females were more impaired compared to males, maybe closer to turning the prediabetes phenotype into a full-blown type 2 diabetes5, 35. It is noteworthy that islets from WT females had an increased number of β cells compared to WT males, but that was not associated with increased insulin secretion or changed islet area, as females had smaller β cells. WT females showed increased insulin sensitivity compared to males probably due to different body composition. These responses might be attributed to the compensation of energy demands females would encounter in case of pregnancy43.
Type 2 diabetes is a multifactorial, often polygenetic disease but most of the identified risk genes affect β cell physiology and function44. In addition, several polymorphisms have also been identified in genes that affect insu-lin secretion or metabolic parameters, such as the L-type calcium channel, the KATP channel, G-protein coupled receptors and syntaxin33, 45–48. Furthermore, SNPs in the human gene for Snap25 have been associated with glyce-mic parameters or severity of metabolic syndrome in type 2 diabetes patients49, 50. In this context it is noteworthy, that the metabolic phenotype in our SNAP-25b-deficient mice became severely worsened in combination with a Western diet intervention35. Given that SNAP-25a and SNAP-25b isoforms confer different strength to complex molecular interactions there is a possibility that SNAP-25b-deficiency, or changed expression ratio of the two spliced variants, can in a long-term perspective contribute to development of disease in humans.
In conclusion, our results suggest that SNAP-25b plays an essential role in keeping a tight control of insulin secretion, not only by mediating the release process, but also via regulating Ca2+ dynamics and collective control of Ca2+-oscillations. A detailed investigation of how SNAP-25a and SNAP-25b, alone or in combination with syntaxin, differently interact with separate ion channel subunits, G-protein coupled receptors or other proteins in β cells, is required to fully understand the mechanism behind the impaired Ca2+ handling in SNAP-25b-deficient mice. Our findings that the regulation of Ca2+ dynamics and insulin secretion are controlled via different iso-forms of SNAP-25, at the level of electrical activity, further underlines the importance of considering SNARE protein function outside the context of late exocytotic events. Hopefully this will provide new understandings of how type 2 diabetes can develop and enable the identification of new therapeutic targets.
MethodsAnimals. Generation of SNAP-25b-deficient mice back-crossed on C57BL/6Crl, breeding, maintenance and genotyping were performed as previously described12. SNAP-25b-deficient animals (MT) and wild-type (WT) littermates were euthanized either by CO2 or cervical dislocation. Animal studies were done in accordance with the guidelines from the local authorities, i.e., the Stockholm Northern Animal Experiments Ethics Board, fol-lowing the approval of the Administration of the Republic of Slovenia for Food Safety, Veterinary Sector and Plant Protection (Permit number: 34401–61–2009/2, 34401–46/2014/4, 34401–12/2015/3) and in accordance with Directive 2010/63/EU of the European parliament and of the Council on the Protection of Animals Used for Scientific Purposes.
Islets isolation. After sacrifice, abdomen was accessed via laparotomy and collagenase P (1 mg/ml) (Roche, Mannheim, Germany) diluted in HBSS pH 7.4 (Thermo Scientific, Waltham, MA) was injected into the proxi-mal common bile duct clamped distally at the major duodenal papilla of Vater. After injection, the pancreas was extracted and incubated in HBSS at 37 °C for 30 min without shaking. Ice-cold HBSS (without BSA) was added and 1–2 strokes with 18 G needle was applied to dislodge islets attached to the tissue. After 4 washes (2 with HBSS without BSA and 2 with HBSS 0.5% BSA) islets were hand-picked under a stereo microscope (KL200 LED, Leica, Wetzlar, Germany). Purified islets were transferred into petri dishes containing RPMI-1640 (Thermo Scientific, Waltham, MA, USA) with a final concentration of heat inactivated fetal bovine serum (10%), glutamine (2 mM), penicillin (100 U/ml) and streptomycin (100 μg/ml) (Thermo Scientific, Waltham, MA, USA) and incubated at CO2 (5%) and 37 °C overnight.
Insulin secretion assay and insulin measurement. After overnight incubation, approximately 80 islets from each pancreas were transferred to a chromatograph column (PERI-4.2, BioRep technologies, Miami Lakes, FL, USA) filled with Bio-Gel P-4 (Bio-Rad Laboratories, Hercules, CA, USA) to stabilize them during the perifu-sion. Islets were pre-perifused with NaCl (125 mM), KCl (5.9 mM), CaCl2 (1.28 mM), MgCl2 (1.2 mM), HEPES (25 mM), BSA (0.1%) and glucose (3 mM), pH 7.4 for 45 min at 37 °C. The islets were perifused in the buffer above for 12 min, then sequentially exposed to 11 mM glucose for 35 min followed by 3 mM glucose for 15 min and the protocol finished with 25 mM KCl + 3 mM glucose for 15 min to empty all possible insulin granules. Fractions (50 μl) of the perifusate were collected every min during stimulation in a 96-well plate. The collected fractions were then measured for insulin concentration by the AlphaLISA detection kit (PerkinElmer, Waltham, MA, USA) with a plate reader (EnVision2103, PerkinElmer, Waltham, MA, USA).
Glucose tolerance test and serum insulin levels. Mice were starved overnight for 12 h. One hour before glucose injection, EMLA cream (25 mg lidocaine and 25 mg prilocaine, AstraZeneca, London, United Kingdom) was applied on the tail (to minimize stress) and after 15 min blood glucose was measured. After 45 min mice were injected intraperitoneally with glucose (2 g/kg body weight) and blood glucose levels were determined at 0, 2.5, 5, 7.5, 10, 15 min using a FreeStyle Glucometer (Abbott Diabetes Care, Witney, United Kingdom). Blood was centrifuged for 20 min, 10,000 × g at 4 °C and serum was collected and frozen at −80 °C until use. Serum insulin levels were analyzed using an ultrasensitive mouse insulin ELISA kit (Crystal Chem Inc., Downers Grove, IL, USA). The AUC was calculated using the basal levels of blood glucose and serum insulin as baselines (baselines
www.nature.com/scientificreports/
1 1SCIENTIFIC RepoRts | 7: 7744 | DOI:10.1038/s41598-017-08082-y
used for calculations are indicated with dotted lines) and the HOMAIR was calculated using the formula: fasting insulin (mU/L) × fasting blood glucose (mmol/L)/22.5.
Immunohistochemistry. Mice were transcardially perfused and the pancreas was processed as described previously12. Mounted 16 μm-thick sections were incubated with primary antibodies in a humidified chamber at 4 °C overnight (rabbit anti-glucagon antibody, 1:1,000, BioGenex, Fremont, CA, USA) and guinea pig anti-insulin antibody (1:200, Bio-Yeda, Rehovot, Israel). After washing in PBS (0.01 M) they were incubated with secondary antibodies for 90 min at room temperature (donkey Cy3-conjugated anti-rabbit IgG and donkey FITC-conjugated anti-guinea pig IgG, 1:150 and 1:40 respectively, Jackson Immunoresearch Europe, Suffolk, United Kingdom). Sections were finally incubated with DAPI (1:10,000, Bio-Rad, Hercules, CA, USA) diluted in PBS for 15 min at room temperature and mounted using 2.5% DABCO in glycerol (Sigma-Aldrich, ST. Louis, MO, USA) and stored at −20 °C in darkness. Another set of sections was used for H&E staining (Histolab, Gothenburg, Sweden) and mounted with VectaMount permanent mounting medium (Vector Laboratories Inc., Burlingame, CA, USA). For the detection of apoptotic β cells, sections were processed as according to the commercial kit used (Click-iT Plus TUNEL assay, Thermo Scientific, Waltham, MA) and co-labeled with insulin.
Image acquisition and analysis. The pancreatic sections were examined with Nikon Eclipse E600 flu-orescence microscope with objective lenses 20 × (Nikon, Tokyo, Japan) equipped with appropriate filters and ORCA-ER, C4742–80 digital camera (Hamamatsu Photonics K.K., Shizuoka, Japan), using Hamamatsu Photonics Wasabi 150 software. Images were also acquired by use of upright laser scanning confocal microscope based on a Leica TCS-SP5 II (Leica Microsystems, Wetzlar, Germany), together with long-distance water-dipping objectives (Leica HXC-APO 20 × /0.5, Wetzlar, Germany), and a Leica LAS software (Leica, Wetzlar, Germany). For insulin- and glucagon-expressing cell quantifications, one randomly-chosen pancreatic section/animal was used (n = 4 animals in each experimental group, in each section three islets between 0.1 and 0.02 mm2 were analyzed), each insulin/glucagon positive cell with detectable nucleus was counted and the number of cells was divided by the islet area. Two randomly-chosen H&E stained pancreatic sections/animal were used (n = 4 for all experimental groups) for islet size measurement and number of islet per section. Around 400 islets were counted. All measurements were done with the ImageJ program (National Institutes of Health, Bethesda, MD, USA). For the detection of apoptotic β cells, one randomly-chosen pancreatic section/animal was used (n = 3 animals in each experimental group) and all islets within a section were analyzed.
Tissue slice preparation. Tissue slices were cut from pancreata of 12 week old WT and MT mice as pre-viously described51. Briefly, animals were sacrificed by cervical dislocation and the abdomen was accessed via laparotomy. A low-melting point agarose (1.9%, Lonza Rockland Inc., Rockland, ME, USA) in extracellular solu-tion, ECS, consisting of: NaCl (125 mM), NaHCO3 (26 mM), glucose (6 mM), lactic acid (6 mM), myo-inositol (3 mM), KCl (2.5 mM), Na-pyruvate (2 mM), CaCl2 (2 mM), NaH2PO4 (1.25 mM), MgCl2 (1 mM), ascorbic acid (0.5 mM) at 40 °C was injected into the proximal common bile duct clamped distally at the major duodenal papilla of Vater. Immediately thereafter, the pancreas was cooled using ice-cold ECS and the agarose-permated pancreas was extracted and gently washed with ice-cold ECS. Small tissue blocks (0.1–0.2 cm3 in size) were cut and plunged into the agarose at 40 °C. Individual cubes of cooled agarose containing tissue blocks were glued (Super Attak, Henkel Slovenija d.o.o., Maribor, Slovenia) onto the sample plate of the VT 1000 S vibratome (Leica, Nussloch, Germany). The tissue was cut at 0.05 mm s−1 at 70 Hz into 140 μm-thick slices of a surface area of 20–100 mm2. Throughout preparation and during slicing the tissue was held in an ice-cold ECS continuously bubbled with a gas mixture containing O2 (95%) and CO2 (5%) at barometric pressure to ensure oxygenation and a pH of 7.4. After cutting the slices were collected in 30 ml of HEPES-buffered saline, HBS, consisting of: NaCl (150 mM), HEPES (10 mM), glucose (6 mM), KCl (5 mM), CaCl2 (2 mM), MgCl2 (1 mM); titrated to pH 7.4 at room temperature. All chemicals were obtained from Sigma-Aldrich (St. Louis, MO, USA) unless indicated.
Electrophysiology measurements. Patch pipettes were pulled from borosilicate glass capillar-ies (GC150F-15, Harvard Apparatus, Holliston, MA, USA) using a horizontal pipette puller (P-97, Sutter Instruments, Novato, CA, USA). The pipette resistance was 2–3 MΩ in Cs+-based solution. Fast pipette capaci-tance (Cfast) was compensated in cell-attached mode, slow membrane capacitance (Cslow) and series conduct-ance (Gs) were compensated after establishment of whole-cell mode. Only experiments with Gs > 50 nS were proceeded. Recordings were performed in the standard whole-cell mode via a patch-clamp lock-in amplifier (SWAM IIc, Celica, Slovenia) connected to a PC via A/D converter (16 bit, NI USB-6343, X Series Multifunction DAQ, National Instruments, Austin, TX, USA) and recorded on the PC hard disk using WinWCP V5.1.6 soft-ware (John Dempster, University of Strathclyde, United Kingdom). The same software was used for identify-ing β cells by their Na+ current inactivation properties and for measuring membrane capacitance change after slow photo-release of caged Ca2+, 52. Latter was performed as described previously53. A continuous sine voltage (1600 Hz, 11 mV RMS amplitude) was applied to measure Cm, a parameter that is proportional to membrane surface area54. Resting membrane potential in voltage-clamp mode was −80 mV. The pipette solution used for Ca2+-induced capacitance and current measurements was composed of NP-EGTA (5 mM), CaCl2 (4 mM), mM Fura 6 F (0.1) (Invitrogen, Eugene, OR) together with CsCl (125 mM), HEPES (40 mM), MgCl2 (2 mM), TEA–Cl (20 mM), Na2ATP (2 mM) at pH 7.2 and osmolality 300 ± 10 mOsm. Signal processing and curve fitting was done using Matview (Wise Technologies, Ljubljana, Slovenia) and MATLAB (The MathWorks, Inc., Natick, MA, USA).
Loading of dyes. For [Ca2+]i imaging 8–10 slices were incubated in a petri dish (5 ml) filled with of HBS (3.333 ml) containing Oregon Green 488 BAPTA-1 acetoxymethyl ester calcium fluorescent dye (6 μM, OGB-1, Invitrogen, Eugene, OR, USA), Pluronic F-127 (0.03% w/v) and dimethylsulphoxide (DMSO, 0.12% v/v) for 50 minutes on an orbital shaker (50 turns min−1) at room temperature and protected from light55.
www.nature.com/scientificreports/
1 2SCIENTIFIC RepoRts | 7: 7744 | DOI:10.1038/s41598-017-08082-y
Measurements of cytoplasmic free Ca2+ activity. Ca2+ imaging was performed on a Leica TCS SP5 AOBS Tandem II upright confocal system using a Leica HCX APO L 20x water immersion objective (NA = 1.0). OGB-1 was excited by an argon 488 nm laser and the emitted light was detected by Leica HyD hybrid detector in the range of 500–700 nm (all from Leica Microsystems GmbH, Wetzlar, Germany). The slices were fixed to the bottom of the bath chamber by U-shaped platinum frame with nylonfibers and were continuously perifused with the bubbled ECS at 35–37 °C containing 6 and 12 mM glucose, respectively. To avoid recording from cells in the damaged cut surface, cells lying at least 15 μm below the surface were imaged. To determine the delays in the onsets in the [Ca2+]i after beginning of the stimulation with 12 mM glucose and the delays in deactivation in the [Ca2+]i response after the end of the stimulation with 12 mM glucose images were acquired at a spatial res-olution of 512 × 512 pixels and a temporal resolution of 1 Hz. The total time for 12 mM glucose stimulation was 15–22 min. To determine the frequencies and the durations of calcium oscillations and for the network analysis, images were acquired for 5 min at a spatial resolution of 256 × 256 pixels and a temporal resolution of 29 Hz. Regions of interest were selected based on higher spatial resolution (1024 × 1024) reference images. Time traces were analyzed off-line from regions of interest employing Leica Application Suite Advanced Fluorescence soft-ware (Leica Microsystems GmbH, Wetzlar, Germany), exported and further analyzed to determine the delays in the onsets and delays in deactivation in the [Ca2+]i response using MATLAB (The MathWorks, Inc., Natick, MA, USA). Traces were corrected for photobleaching of the dye employing a combination of linear and single exponential fit as described previously27 and signals expressed as (F – F0)/F0 ratios, where F0 is the initial fluo-rescence intensity and F is the fluorescence signal recorded at an individual time point during the experiment. All recorded time series were digitally band-pass filtered in order to remove noise and artefacts, and then additionally smoothed with an adjacency averaging procedure. To calculate the frequencies and durations of Ca2+ oscillations the onsets and the endings of individual oscillations were defined as the time in which the signal decreases bellow the half of the maximal amplitude in the given oscillation27. In this manner the activity profiles of all cells were binarized, whereby the time between the onset and ending of an oscillation was denoted as 1, whilst 0 otherwise. The cells with a low signal-to-noise ratio in which a firm binarization of the signal was not possible were excluded from further analyses.
Synchronization and functional connectivity of β cells. The level of synchronization among β cells was determined on the basis of binarized Ca2+ activity by means of the coactivity matrix56, whose ij-th element is defined as follows: =Cij Tij
TiTjand reflects synchronization between the i-th and the j-th cell. In Eq. (1) Tij stands for the total coactivity time
in which both cells were simultaneously active and Ti and Tj are the total individual activity time for both cells. If Cij=0 then no correlation between the i-th and j-th cells exists, whilst Cij=1 signifies completely synchronous and aligned dynamics. To describe the global level of synchronization in the whole slice, the mean coactivity was calculated by averaging over all cell pairs. Supplementary Fig. 5 schematically presents how the recorded time series were processed and how the synchronization between β cells was evaluated.
To get a more detailed insight into the intercellular interaction patterns functional connectivity maps were constructed. Two cells were considered to be functionally connected if their activity profiles showed a high enough degree of synchronization, i.e.Cij exceeded a given threshold value. A similar methodology was used for extraction of the functional connectivity patterns elsewhere36, 56, 57. In this study a variable connectivity threshold was used in order to ensure that all examined β cell networks had the same mean number of connections per cell – 6. The segregation of β cell networks was evaluated by calculating a global metric called “modularity”, as proposed by Blondel et al.58. A higher modularity indicated a high degree of sub-compartmentalization, whereas close-to-zero values indicated an integrated and a module-free network36, 59.
Statistical analysis. All statistical analyses were done using GraphPad Prism (GraphPad Software, San Diego, CA, USA). Two-way ANOVA followed by Bonferroni multiple comparisons test; Mann-Whitney and Student’s t test were used to verify statistically significant differences in all our experiments dependently on non-Gaussian or Gaussian distribution, respectively. The level of significance was set at a P value < 0.05.
References 1. Cerasi, E. & Luft, R. The plasma insulin response to glucose infusion in healthy subjects and in diabetes mellitus. Acta Endocrinol.
55, 278–304 (1967). 2. Barg, S. et al. Fast exocytosis with few Ca(2 + ) channels in insulin-secreting mouse pancreatic B cells. Biophys. J. 81, 3308–3323
(2001). 3. Südhof, T. C. The molecular machinery of neurotransmitter release (Nobel Lecture). Angew. Chemie Int. Ed. 53, 12696–12717
(2014). 4. Satin, L. S., Butler, P. C., Ha, J. & Sherman, A. S. Pulsatile insulin secretion, impaired glucose tolerance and type 2 diabetes. Mol.
Aspects Med. 42, 61–77 (2015). 5. Seino, S., Shibasaki, T. & Minami, K. Dynamics of insulin secretion and the clinical implications for obesity and diabetes. J. Clin.
Invest. 121, 2118–2125 (2011). 6. Söllner, T., Bennett, M. K., Whiteheart, S. W., Scheller, R. H. & Rothman, J. E. A protein assembly-disassembly pathway in vitro that
may correspond to sequential steps of synaptic vesicle docking, activation, and fusion. Cell 75, 409–418 (1993). 7. Bark, I. C. Structure of the chicken gene for SNAP-25 reveals duplicated exons encoding distinct isoforms of the protein. J. Mol. Biol.
233, 67–76 (1993). 8. Bark, I. C., Hahn, K. M., Ryabinin, A. E. & Wilson, M. C. Differential expression of SNAP-25 protein isoforms during divergent
vesicle fusion events of neural development. Proc. Natl. Acad. Sci. 92, 1510–1514 (1995). 9. Washbourne, P. et al. Genetic ablation of the t-SNARE SNAP-25 distinguishes mechanisms of neuroexocytosis. Nat. Neurosci. 5,
19–26 (2002). 10. Gonelle-Gispert, C. et al. SNAP-25a and −25b isoforms are both expressed in insulin-secreting cells and can function in insulin
secretion. Biochem. J. 339, 169–165 (1999).
www.nature.com/scientificreports/
13SCIENTIFIC RepoRts | 7: 7744 | DOI:10.1038/s41598-017-08082-y
11. Jeans, A. F. et al. A dominant mutation in Snap25 causes impaired vesicle trafficking, sensorimotor gating, and ataxia in the blind-drunk mouse. Proc. Natl. Acad. Sci. USA 104, 2431–2436 (2007).
12. Johansson, J. U. et al. An ancient duplication of exon 5 in the Snap25 gene is required for complex neuronal development/function. PLoS Genet. 4, e1000278 (2008).
13. Sørensen, J. B. et al. Differential control of the releasable vesicle pools by SNAP-25 splice variants and SNAP-23. Cell 114, 75–86 (2003).
14. Blackmer, T. et al. G protein βγ directly regulates SNARE protein fusion machinery for secretory granule exocytosis. Nat. Neurosci. 8, 421–425 (2005).
15. Gerachshenko, T. et al. Gβγ acts at the C terminus of SNAP-25 to mediate presynaptic inhibition. Nat. Neurosci. 8, 597–605 (2005). 16. Ji, J. et al. Modulation of L-type Ca2+ channels by distinct domains within SNAP-25. Diabetes 51, 1425–1436 (2002). 17. Leung, Y. M. et al. Syntaxin 1A binds to the cytoplasmic C terminus of Kv2.1 to regulate channel gating and trafficking. J. Biol. Chem.
278, 17532–17538 (2003). 18. MacDonald, P. E. et al. Synaptosome-associated protein of 25 kilodaltons modulates Kv2.1 voltage-dependent K(+) channels in
neuroendocrine islet beta-cells through an interaction with the channel N terminus. Mol. Endocrinol. 16, 2452–2461 (2002). 19. Rettig, J. et al. Isoform-specific interaction of the alpha1A subunits of brain Ca2+ channels with the presynaptic proteins syntaxin
and SNAP-25. Proc. Natl. Acad. Sci. USA 93, 7363–7368 (1996). 20. Toft-Bertelsen, T. L., Ziomkiewicz, I., Houy, S., Pinheiro, P. S. & Sørensen, J. B. Regulation of Ca2+ channels by SNAP-25 via
recruitment of syntaxin-1 from plasma membrane clusters. Mol. Biol. Cell 27, 3329–3341 (2016). 21. Yang, S. N. et al. Syntaxin 1 interacts with the L(D) subtype of voltage-gated Ca(2+) channels in pancreatic beta cells. Proc. Natl.
Acad. Sci. USA 96, 10164–10169 (1999). 22. Zhuang, G. Q. et al. SNAP-251-180 enhances insulin secretion by blocking Kv2.1 channels in rat pancreatic islet β-cells. Biochem.
Biophys. Res. Commun. 379, 812–816 (2009). 23. Barker, C. J. & Berggren, P.-O. New horizons in cellular regulation by inositol polyphosphates: Insights from the pancreatic β-cell.
Pharmacol. Rev. 65, 641–669 (2013). 24. Lees, J. A. et al. Lipid transport by TMEM24 at ER–plasma membrane contacts regulates pulsatile insulin secretion. Science 355,
eaah6171 (2017). 25. Benninger, R. K. P., Head, W. S., Zhang, M., Satin, L. S. & Piston, D. W. Gap junctions and other mechanisms of cell-cell
communication regulate basal insulin secretion in the pancreatic islet. J. Physiol. 589, 5453–5466 (2011). 26. Ravier, M. A. et al. Loss of connexin36 channels alters β-cell coupling, islet synchronization of glucose-induced Ca2+ and insulin
oscillations, and basal insulin release. Diabetes 54, 1798–1807 (2005). 27. Stožer, A., Dolenšek, J. & Rupnik, M. S. Glucose-stimulated calcium dynamics in islets of Langerhans in acute mouse pancreas tissue
slices. PLoS One 8, e54638 (2013). 28. Stožer, A. et al. Functional connectivity in islets of Langerhans from mouse pancreas tissue slices. PLoS Comput. Biol. 9, e1002923
(2013). 29. Benninger, R. K. P. & Piston, D. W. Cellular communication and heterogeneity in pancreatic islet insulin secretion dynamics. Trends
Endocrinol. Metab. 25, 399–406 (2014). 30. Speier, S., Gjinovci, A., Charollais, A., Meda, P. & Rupnik, M. Cx36-mediated coupling reduces β-cell heterogeneity, confines the
stimulating glucose concentration range, and affects insulin release kinetics. Diabetes 56, 1078–1086 (2007). 31. Head, W. S. et al. Connexin-36 gap junctions regulate in vivo first- and second-phase insulin secretion dynamics and glucose
tolerance in the conscious mouse. Diabetes 61, 1700–1707 (2012). 32. Irles, E. et al. Enhanced glucose-induced intracellular signaling promotes insulin hypersecretion: Pancreatic beta-cell functional
adaptations in a model of genetic obesity and prediabetes. Mol. Cell. Endocrinol. 404, 46–55 (2015). 33. Notary, A. M., Westacott, M. J., Hraha, T. H., Pozzoli, M. & Benninger, R. K. P. Decreases in gap junction coupling recovers Ca2+ and
insulin secretion in neonatal diabetes mellitus, dependent on beta cell heterogeneity and noise. PLOS Comput. Biol. 12, e1005116 (2016).
34. Hodson, D. J. et al. Lipotoxicity disrupts incretin-regulated human β cell connectivity. J. Clin. Invest. 123, 4182–4194 (2013). 35. Valladolid-Acebes, I. et al. Replacing SNAP-25b with SNAP-25a expression results in metabolic disease. Proc. Natl. Acad. Sci. 112,
E4326–E4335 (2015). 36. Markovič, R. et al. Progressive glucose stimulation of islet beta cells reveals a transition from segregated to integrated modular
functional connectivity patterns. Sci. Rep. 5, 7845 (2015). 37. Zurawski, Z., Rodriguez, S., Hyde, K., Alford, S. & Hamm, H. E. Gβγ binds to the extreme C terminus of SNAP25 to mediate the
action of Gi/o-coupled G protein-coupled receptors. Mol. Pharmacol. 89, 75–83 (2016). 38. Betke, K. M., Wells, C. A. & Hamm, H. E. GPCR mediated regulation of synaptic transmission. Prog. Neurobiol. 96, 304–321 (2012). 39. Amisten, S., Salehi, A., Rorsman, P., Jones, P. M. & Persaud, S. J. An atlas and functional analysis of G-protein coupled receptors in
human islets of Langerhans. Pharmacol. Ther. 139, 359–391 (2013). 40. Barabási, A.-L. The network takeover. Nat. Phys. 8, 14–16 (2011). 41. Gosak, M. et al. The relationship between node degree and dissipation rate in networks of diffusively coupled oscillators and its
significance for pancreatic beta cells. Chaos An Interdiscip. J. Nonlinear Sci. 25, 73115 (2015). 42. Johnston, N. R. et al. Beta cell hubs dictate pancreatic islet responses to glucose. Cell Metab. 24, 389–401 (2016). 43. Rieck, S. & Kaestner, K. H. Expansion of β-cell mass in response to pregnancy. Trends Endocrinol. Metab. 21, 151–158 (2010). 44. Flannick, J. & Florez, J. C. Type 2 diabetes: genetic data sharing to advance complex disease research. Nat. Rev. Genet. 17, 535–549
(2016). 45. Goldlust, I. S. et al. Mouse model implicates GNB3 duplication in a childhood obesity syndrome. Proc. Natl. Acad. Sci. USA 110,
14990–14994 (2013). 46. Olson, T. M. & Terzic, A. Human K(ATP) channelopathies: Diseases of metabolic homeostasis. Pflugers Arch. 460, 295–306 (2010). 47. Reinbothe, T. M. et al. The human L-type calcium channel Cav1.3 regulates insulin release and polymorphisms in CACNA1D
associate with type 2 diabetes. Diabetologia 56, 340–349 (2013). 48. Romeo, S. et al. Search for genetic variants of the SYNTAXIN 1A (STX1A) gene: the −352 A > T variant in the STX1A promoter
associates with impaired glucose metabolism in an Italian obese population. Int. J. Obes. 32, 413–420 (2008). 49. Al-Daghri, N. M. et al. Synaptosomal protein of 25 kDa (Snap25) polymorphisms associated with glycemic parameters in type 2
diabetes patients. J. Diabetes Res. 2016, 8943092 (2016). 50. Chen, Y. et al. Associations between genetic variants and the severity of metabolic syndrome in subjects with type 2 diabetes. Genet.
Mol. Res. 14, 2518–2526 (2015). 51. Speier, S. & Rupnik, M. A novel approach to in situ characterization of pancreatic β-cells. Pflugers Arch. 446, 553–558 (2003). 52. Göpel, S., Kanno, T., Barg, S., Galvanovskis, J. & Rorsman, P. Voltage-gated and resting membrane currents recorded from β-cells in
intact mouse pancreatic islets. J. Physiol. 521(Pt 3), 717–728 (1999). 53. Skelin, M. & Rupnik, M. cAMP increases the sensitivity of exocytosis to Ca2+ primarily through protein kinase A in mouse
pancreatic beta cells. Cell Calcium 49, 89–99 (2011). 54. Neher, E. & Marty, A. Discrete changes of cell membrane capacitance observed under conditions of enhanced secretion in bovine
adrenal chromaffin cells. Proc. Natl. Acad. Sci. USA 79, 6712–6716 (1982).
www.nature.com/scientificreports/
1 4SCIENTIFIC RepoRts | 7: 7744 | DOI:10.1038/s41598-017-08082-y
55. Dolenšek, J., Stožer, A., Skelin Klemen, M., Miller, E. W. & Slak Rupnik, M. The relationship between membrane potential and calcium dynamics in glucose-stimulated beta cell syncytium in acute mouse pancreas tissue slices. PLoS One 8, e82374 (2013).
56. Hodson, D. J., Molino, F., Fontanaud, P., Bonnefont, X. & Mollard, P. Investigating and modelling pituitary endocrine network function. J. Neuroendocrinol. 22, 1217–1225 (2010).
57. Stam, C. J. & van Straaten, E. C. W. The organization of physiological brain networks. Clin. Neurophysiol. 123, 1067–1087 (2012). 58. Blondel, V. D., Guillaume, J.-L., Lambiotte, R. & Lefebvre, E. Fast unfolding of communities in large networks. J. Stat. Mech. Theory
Exp. 2008, P10008 (2008). 59. Newman, M. E. J. Modularity and community structure in networks. Proc. Natl. Acad. Sci. USA 103, 8577–8582 (2006).
AcknowledgementsWe are very grateful to Tomas Hökfelt for sharing his vast knowledge and equipment. We also would like to thank Jurij Dolenšek for customizing scripts for MATLAB analyses, Muhammad Irfan for help with tissue collection, Eva Hagel at Unit for Medical Statistics at Karolinska Institutet for verifying the statistical analyses used, and the staff at our animal facility for taking good care of our animals. This work was supported by the Sven Mattssons Foundation, the Family Erling-Persson Foundation, the Karolinska Institutet funds, the Magnus Bergvalls Foundation, the Gun and Bertil Stohnes Foundation, the Fogelströms Foundation, the Rolf Luft Foundation, Sigurd and Elsa Goljes Foundation and the Slovenian Research Agency (Program P3–0396). T.D. research visits to University of Maribor were supported by a Rolf Luft Fellowship, Fernströms Foundation and KI travel funds for PhD students.
Author ContributionsT.D. designed and performed experiments, analyzed the data and wrote the original draft of the study. M.S.R. and C.B. conceived and supervised the study, oversaw data collection and analyses, reviewed/edited the manuscript and acquired funding. L.K.B. and M.S.K. performed Ca2+-imaging experiments and took care of the mice colony in Maribor, M.G. analyzed and interpreted Ca2+-imaging data and contributed to writing of the manuscript. I.V.A and M.S.K. performed parts of the experiments and contributed data analysis. E.R., P.-O. B. and K.B. provided resources and critically reviewed the manuscript.
Additional InformationSupplementary information accompanies this paper at doi:10.1038/s41598-017-08082-yCompeting Interests: The authors declare that they have no competing interests.Publisher's note: Springer Nature remains neutral with regard to jurisdictional claims in published maps and institutional affiliations.
Open Access This article is licensed under a Creative Commons Attribution 4.0 International License, which permits use, sharing, adaptation, distribution and reproduction in any medium or
format, as long as you give appropriate credit to the original author(s) and the source, provide a link to the Cre-ative Commons license, and indicate if changes were made. The images or other third party material in this article are included in the article’s Creative Commons license, unless indicated otherwise in a credit line to the material. If material is not included in the article’s Creative Commons license and your intended use is not per-mitted by statutory regulation or exceeds the permitted use, you will need to obtain permission directly from the copyright holder. To view a copy of this license, visit http://creativecommons.org/licenses/by/4.0/. © The Author(s) 2017