Analyte Guide 2021 - Bio-Rad
60
Multiplex Suspension Arrays Bio-Plex Multiplex Immunoassays Analyte Guide 2021 Visit bio-rad.com/bioplex for more information. MMP-1 Erk1/2 EGFR TNF-α IFN-β IL-19 IL-10 GM-CSF IL-17A/F IL-12p70 Stat1 TGF-β1 CRP mTOR Akt
Transcript of Analyte Guide 2021 - Bio-Rad
Multiplex Suspension Arrays
Bio-Plex Multiplex Immunoassays
Analyte Guide 2021
Visit bio-rad.com/bioplex for more information.
MMP-1
Erk1/2
EGFR
GSK-3α/β
Erk1/2
TNF-α
JNK
IFN-β
IL-19
IL-10
GM-CSF
IL-17A/F
IL-12p70Stat1
TGF-β1
CRP
mTOR
Akt
p70 S6 K
© 2021 Bio-Rad Laboratories, Inc.
Accelerate Your Research with the Latest Bio-Plex Pro Multiplex Immunoassays New Bio-Plex Pro Human SARS-CoV-2 Serology Assays With the Bio-Plex Pro Human SARS-CoV-2 Serology Assays, you can measure separately IgA, IgG, and IgM antibodies against severe acute respiratory syndrome coronavirus 2 (SARS-CoV-2) nucleocapsid, receptor binding domain (RBD), spike 1 (S1), and spike 2 (S2) antigens. The sensitive and specific Bio-Plex Pro Human SARS-CoV-2 Serology Assays enable you to quickly and easily detect antibody response to specific viral subunits to:
■ Monitor dosing levels and efficacy in preclinical and clinical trials ■ Determine vaccine effectiveness over time through seropositive results during postmarket surveillance ■ Understand local infection and exposure rates in specific areas or institutions
Bio-Plex Pro Assays provide: ■ Reduced turnaround time — Save time and accelerate your discovery with a fast protocol and accurate results ■ Reproducible results — Gain confidence in your experiments with a robust, magnetic bead–based workflow
New Bio-Plex Pro Human SARS-CoV-2 Neutralization Assays The Bio-Plex Pro Human SARS-CoV-2 Neutralization Assays provide you highly precise and specific assays to measure SARS-CoV-2 neutralizing antibodies against two wild types and 11 variants of RBD and S1 protein subunits. These rapid and easy-to-use Bio-Plex Pro Human SARS-CoV-2 Neutralization Antibody Assays enable you to:
■ Assess the efficacy of COVID-19 vaccines and therapies during preclinical and clinical trials ■ Evaluate effectiveness and neutralizing antibody response longevity against variants in different populations ■ Determine SARS-CoV-2 viral exposure and variant distribution rates in populations
Bulletin 6335
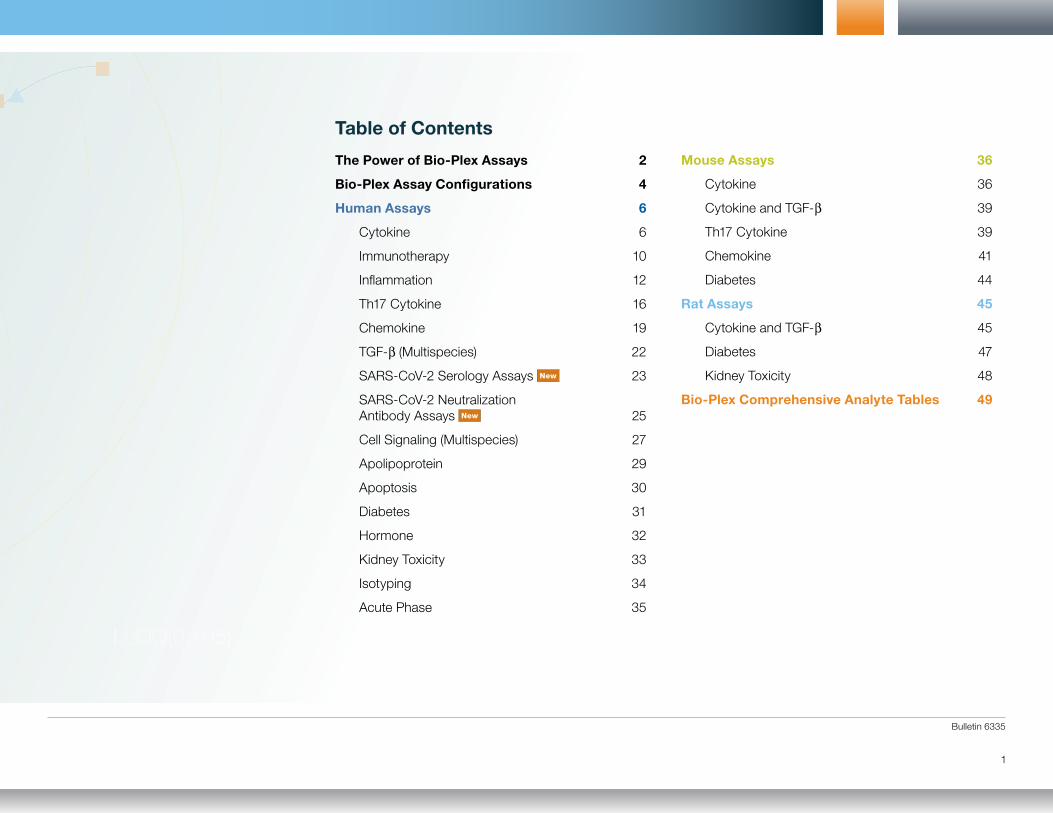
Table of Contents
The Power of Bio-Plex Assays 2
Bio-Plex Assay Configurations 4
Human Assays 6
Cytokine 6
Immunotherapy 10
Inflammation 12
Th17 Cytokine 16
Chemokine 19
TGF-b (Multispecies) 22
SARS-CoV-2 Serology Assays New 23
SARS-CoV-2 Neutralization Antibody Assays New 25
Cell Signaling (Multispecies) 27
Apolipoprotein 29
Apoptosis 30
Diabetes 31
Hormone 32
Kidney Toxicity 33
Isotyping 34
Acute Phase 35
Mouse Assays 36
Cytokine 36
Cytokine and TGF-b 39
Th17 Cytokine 39
Chemokine 41
Diabetes 44
Rat Assays 45
Cytokine and TGF-b 45
Diabetes 47
Kidney Toxicity 48
Bio-Plex Comprehensive Analyte Tables 49
1
© 2021 Bio-Rad Laboratories, Inc.
2
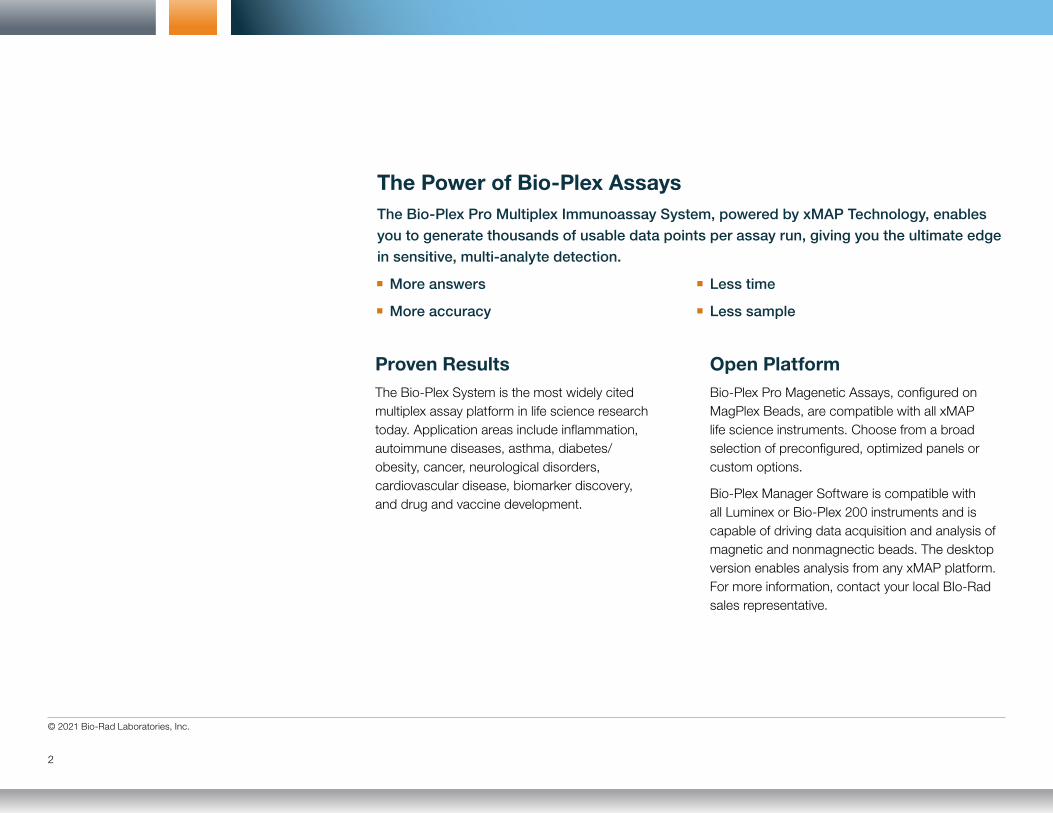
The Power of Bio-Plex Assays The Bio-Plex Pro Multiplex Immunoassay System, powered by xMAP Technology, enables you to generate thousands of usable data points per assay run, giving you the ultimate edge in sensitive, multi-analyte detection.
More answers
More accuracy
Less time
Less sample
Proven Results The Bio-Plex System is the most widely cited multiplex assay platform in life science research today. Application areas include inflammation, autoimmune diseases, asthma, diabetes/obesity, cancer, neurological disorders, cardiovascular disease, biomarker discovery, and drug and vaccine development.
Open PlatformBio-Plex Pro Magenetic Assays, configured on MagPlex Beads, are compatible with all xMAP life science instruments. Choose from a broad selection of preconfigured, optimized panels or custom options.
Bio-Plex Manager Software is compatible with all Luminex or Bio-Plex 200 instruments and is capable of driving data acquisition and analysis of magnetic and nonmagnectic beads. The desktop version enables analysis from any xMAP platform. For more information, contact your local BIo-Rad sales representative.
Bulletin 6335
3
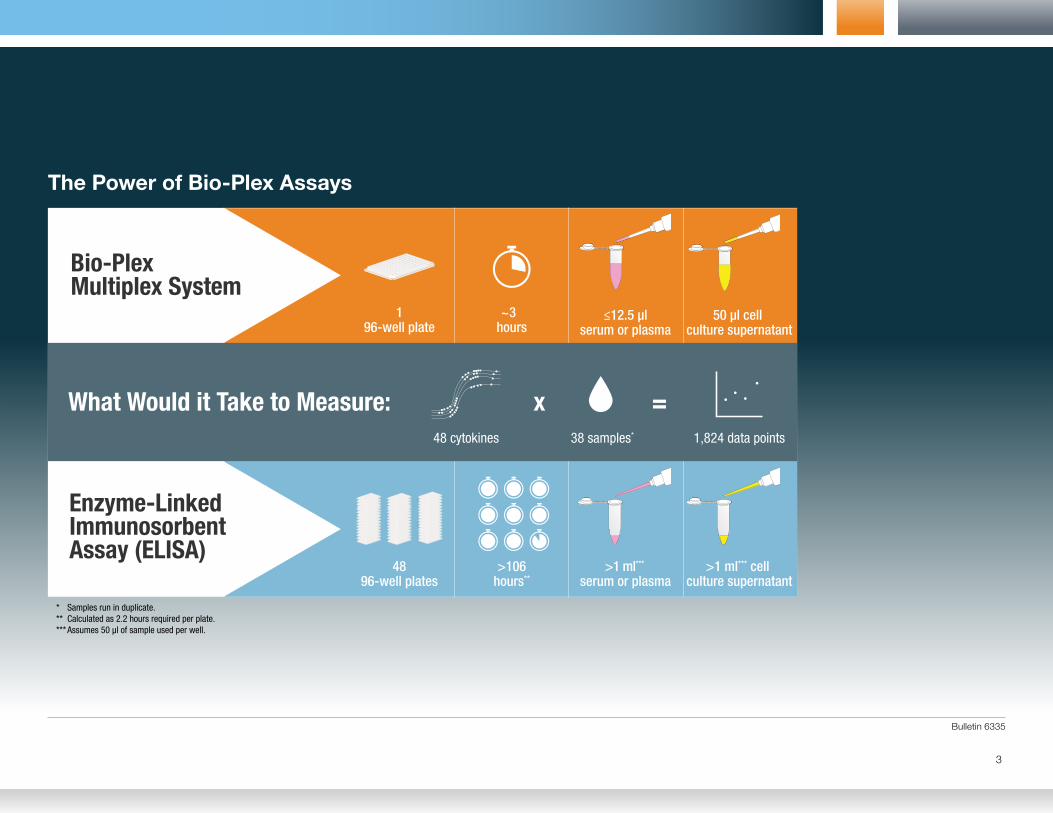
The Power of Bio-Plex Assays
Bio-Plex Multiplex System
Enzyme-Linked Immunosorbent Assay (ELISA)
What Would it Take to Measure: x =48 cytokines 38 samples* 1,824 data points
~3 hours
196-well plate
4896-well plates
>106hours**
50 μl cell culture supernatant
≤12.5 μlserum or plasma
>1 ml*** serum or plasma
>1 ml*** cell culture supernatant
******
Samples run in duplicate.Calculated as 2.2 hours required per plate.Assumes 50 μl of sample used per well.
© 2021 Bio-Rad Laboratories, Inc.
4
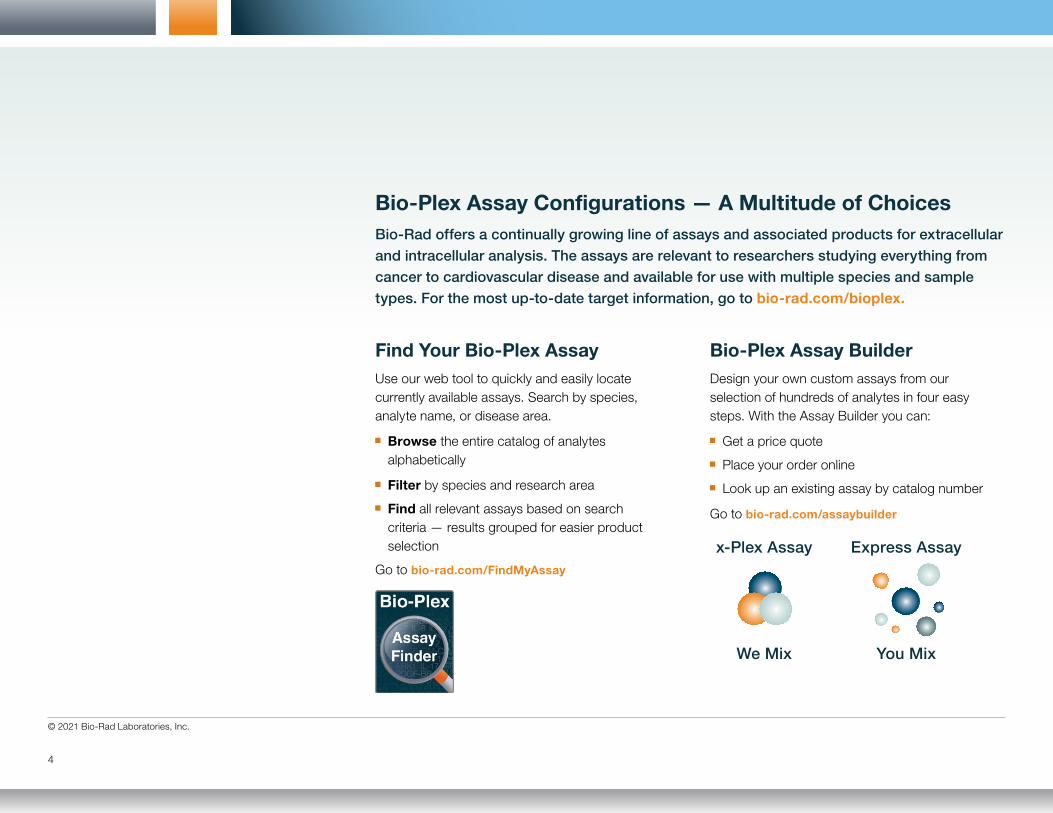
Bio-Plex Assay Configurations — A Multitude of ChoicesBio-Rad offers a continually growing line of assays and associated products for extracellular and intracellular analysis. The assays are relevant to researchers studying everything from cancer to cardiovascular disease and available for use with multiple species and sample types. For the most up-to-date target information, go to bio-rad.com/bioplex.
Find Your Bio-Plex AssayUse our web tool to quickly and easily locate currently available assays. Search by species, analyte name, or disease area.
Browse the entire catalog of analytes alphabetically
Filter by species and research area
Find all relevant assays based on search criteria — results grouped for easier product selection
Go to bio-rad.com/FindMyAssay
Bio-Plex Assay BuilderDesign your own custom assays from our selection of hundreds of analytes in four easy steps. With the Assay Builder you can:
Get a price quote
Place your order online
Look up an existing assay by catalog number
Go to bio-rad.com/assaybuilder
x-Plex Assay
We Mix
Express Assay
You Mix
Bulletin 6335
5
Over 50% of multiplex assays worldwide are run using Bio-Plex Software.
Try Bio-Plex Manager and Bio-Plex Data Pro Software and find out why.
© 2021 Bio-Rad Laboratories, Inc.
6
Bio-Plex Pro Human Cytokine AssaysHuman Assays
bio-rad.com/HumanCytokineScreeningBio-Rad bulletin 7089
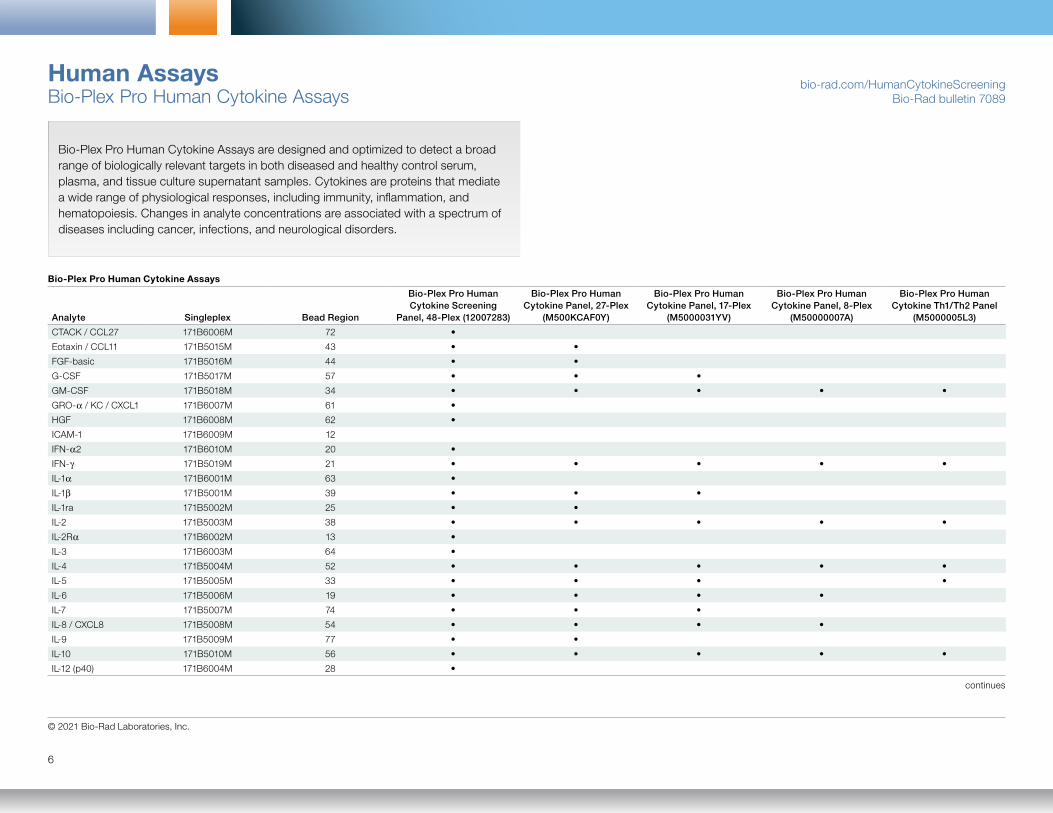
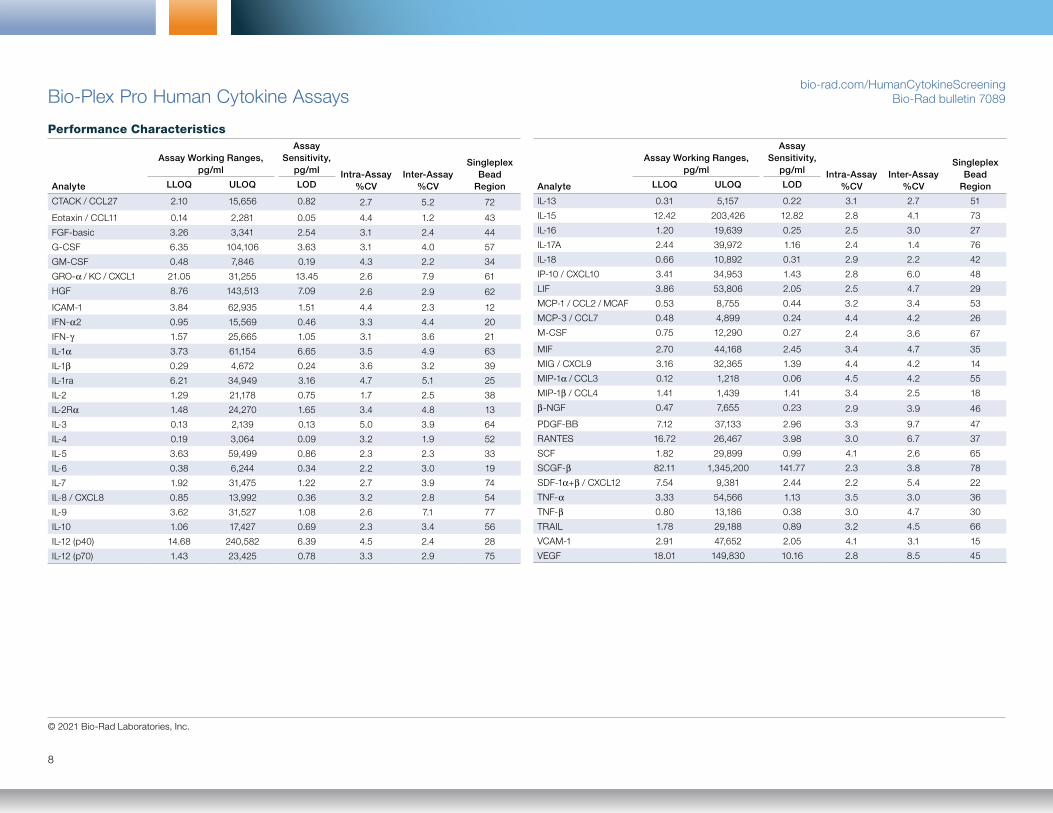
Bio-Plex Pro Human Cytokine Assays are designed and optimized to detect a broad range of biologically relevant targets in both diseased and healthy control serum, plasma, and tissue culture supernatant samples. Cytokines are proteins that mediate a wide range of physiological responses, including immunity, inflammation, and hematopoiesis. Changes in analyte concentrations are associated with a spectrum of diseases including cancer, infections, and neurological disorders.
Bio-Plex Pro Human Cytokine Assays
Analyte Singleplex Bead Region
Bio-Plex Pro Human Cytokine Screening
Panel, 48-Plex (12007283)
Bio-Plex Pro Human Cytokine Panel, 27-Plex
(M500KCAF0Y)
Bio-Plex Pro Human Cytokine Panel, 17-Plex
(M5000031YV)
Bio-Plex Pro Human Cytokine Panel, 8-Plex
(M50000007A)
Bio-Plex Pro Human Cytokine Th1/Th2 Panel
(M5000005L3)
CTACK / CCL27 171B6006M 72 •
Eotaxin / CCL11 171B5015M 43 • •
FGF-basic 171B5016M 44 • •
G-CSF 171B5017M 57 • • •
GM-CSF 171B5018M 34 • • • • •
GRO-a / KC / CXCL1 171B6007M 61 •
HGF 171B6008M 62 •
ICAM-1 171B6009M 12
IFN-a2 171B6010M 20 •
IFN-g 171B5019M 21 • • • • •
IL-1a 171B6001M 63 •
IL-1b 171B5001M 39 • • •
IL-1ra 171B5002M 25 • •
IL-2 171B5003M 38 • • • • •
IL-2Ra 171B6002M 13 •
IL-3 171B6003M 64 •
IL-4 171B5004M 52 • • • • •
IL-5 171B5005M 33 • • • •
IL-6 171B5006M 19 • • • •
IL-7 171B5007M 74 • • •
IL-8 / CXCL8 171B5008M 54 • • • •
IL-9 171B5009M 77 • •
IL-10 171B5010M 56 • • • • •
IL-12 (p40) 171B6004M 28 •
continues
Bulletin 6335
7
Bio-Plex Pro Human Cytokine Assaysbio-rad.com/HumanCytokineScreening
Bio-Rad bulletin 7089
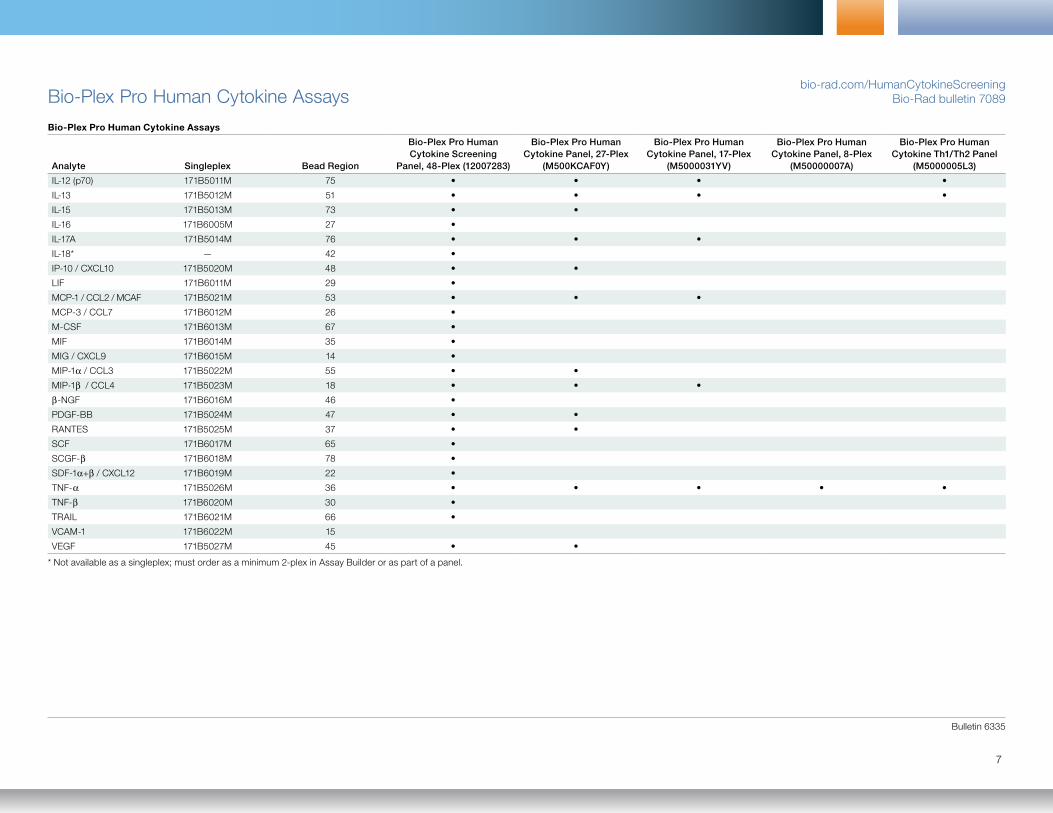
Bio-Plex Pro Human Cytokine Assays
Analyte Singleplex Bead Region
Bio-Plex Pro Human Cytokine Screening
Panel, 48-Plex (12007283)
Bio-Plex Pro Human Cytokine Panel, 27-Plex
(M500KCAF0Y)
Bio-Plex Pro Human Cytokine Panel, 17-Plex
(M5000031YV)
Bio-Plex Pro Human Cytokine Panel, 8-Plex
(M50000007A)
Bio-Plex Pro Human Cytokine Th1/Th2 Panel
(M5000005L3)
IL-12 (p70) 171B5011M 75 • • • •
IL-13 171B5012M 51 • • • •
IL-15 171B5013M 73 • •
IL-16 171B6005M 27 •
IL-17A 171B5014M 76 • • •
IL-18* — 42 •
IP-10 / CXCL10 171B5020M 48 • •
LIF 171B6011M 29 •
MCP-1 / CCL2 / MCAF 171B5021M 53 • • •
MCP-3 / CCL7 171B6012M 26 •
M-CSF 171B6013M 67 •
MIF 171B6014M 35 •
MIG / CXCL9 171B6015M 14 •
MIP-1a / CCL3 171B5022M 55 • •
MIP-1b / CCL4 171B5023M 18 • • •
b-NGF 171B6016M 46 •
PDGF-BB 171B5024M 47 • •
RANTES 171B5025M 37 • •
SCF 171B6017M 65 •
SCGF-b 171B6018M 78 •
SDF-1a+b / CXCL12 171B6019M 22 •
TNF-a 171B5026M 36 • • • • •
TNF-b 171B6020M 30 •
TRAIL 171B6021M 66 •
VCAM-1 171B6022M 15
VEGF 171B5027M 45 • •
* Not available as a singleplex; must order as a minimum 2-plex in Assay Builder or as part of a panel.
© 2021 Bio-Rad Laboratories, Inc.
Performance Characteristics
Assay Working Ranges, pg/ml
Assay Sensitivity,
pg/ml
Intra-Assay %CV
Inter-Assay
%CV
Singleplex Bead
RegionAnalyte LLOQ ULOQ LOD
CTACK / CCL27 2.10 15,656 0.82 2.7 5.2 72
Eotaxin / CCL11 0.14 2,281 0.05 4.4 1.2 43
FGF-basic 3.26 3,341 2.54 3.1 2.4 44
G-CSF 6.35 104,106 3.63 3.1 4.0 57
GM-CSF 0.48 7,846 0.19 4.3 2.2 34
GRO-a / KC / CXCL1 21.05 31,255 13.45 2.6 7.9 61
HGF 8.76 143,513 7.09 2.6 2.9 62
ICAM-1 3.84 62,935 1.51 4.4 2.3 12
IFN-a2 0.95 15,569 0.46 3.3 4.4 20
IFN-g 1.57 25,665 1.05 3.1 3.6 21
IL-1a 3.73 61,154 6.65 3.5 4.9 63
IL-1b 0.29 4,672 0.24 3.6 3.2 39
IL-1ra 6.21 34,949 3.16 4.7 5.1 25
IL-2 1.29 21,178 0.75 1.7 2.5 38
IL-2Ra 1.48 24,270 1.65 3.4 4.8 13
IL-3 0.13 2,139 0.13 5.0 3.9 64
IL-4 0.19 3,064 0.09 3.2 1.9 52
IL-5 3.63 59,499 0.86 2.3 2.3 33
IL-6 0.38 6,244 0.34 2.2 3.0 19
IL-7 1.92 31,475 1.22 2.7 3.9 74
IL-8 / CXCL8 0.85 13,992 0.36 3.2 2.8 54
IL-9 3.62 31,527 1.08 2.6 7.1 77
IL-10 1.06 17,427 0.69 2.3 3.4 56
IL-12 (p40) 14.68 240,582 6.39 4.5 2.4 28
IL-12 (p70) 1.43 23,425 0.78 3.3 2.9 75
Performance Characteristics
Assay Working Ranges, pg/ml
Assay Sensitivity,
pg/ml
Intra-Assay %CV
Inter-Assay
%CV
Singleplex Bead
RegionAnalyte LLOQ ULOQ LOD
IL-13 0.31 5,157 0.22 3.1 2.7 51
IL-15 12.42 203,426 12.82 2.8 4.1 73
IL-16 1.20 19,639 0.25 2.5 3.0 27
IL-17A 2.44 39,972 1.16 2.4 1.4 76
IL-18 0.66 10,892 0.31 2.9 2.2 42
IP-10 / CXCL10 3.41 34,953 1.43 2.8 6.0 48
LIF 3.86 53,806 2.05 2.5 4.7 29
MCP-1 / CCL2 / MCAF 0.53 8,755 0.44 3.2 3.4 53
MCP-3 / CCL7 0.48 4,899 0.24 4.4 4.2 26
M-CSF 0.75 12,290 0.27 2.4 3.6 67
MIF 2.70 44,168 2.45 3.4 4.7 35
MIG / CXCL9 3.16 32,365 1.39 4.4 4.2 14
MIP-1a / CCL3 0.12 1,218 0.06 4.5 4.2 55
MIP-1b / CCL4 1.41 1,439 1.41 3.4 2.5 18
b-NGF 0.47 7,655 0.23 2.9 3.9 46
PDGF-BB 7.12 37,133 2.96 3.3 9.7 47
RANTES 16.72 26,467 3.98 3.0 6.7 37
SCF 1.82 29,899 0.99 4.1 2.6 65
SCGF-b 82.11 1,345,200 141.77 2.3 3.8 78
SDF-1a+b / CXCL12 7.54 9,381 2.44 2.2 5.4 22
TNF-a 3.33 54,566 1.13 3.5 3.0 36
TNF-b 0.80 13,186 0.38 3.0 4.7 30
TRAIL 1.78 29,188 0.89 3.2 4.5 66
VCAM-1 2.91 47,652 2.05 4.1 3.1 15
VEGF 18.01 149,830 10.16 2.8 8.5 45
Bio-Plex Pro Human Cytokine Assaysbio-rad.com/HumanCytokineScreening
Bio-Rad bulletin 7089
8

Bio-Plex Pro Human Cytokine Assaysbio-rad.com/HumanCytokineScreening
Bio-Rad bulletin 7089
Increase Usable Data Points with High Performing Assays
The ability of an assay to detect analytes across a broad range of concentrations is critical. Out-of-range results often mean gaps in data, difficulties in statistical analysis, and repeat experiments.
Bio-Plex Pro Assays are designed to deliver a high level of analyte detectability. Analyte detectability is defined as the percentage of analytes detected within the working assay range for all samples in a study.
For example, in an experiment using the new Bio-Plex Pro Human Cytokine Screening Panel, 48-Plex, the total number of data points that could be generated for the plate is 4,608 (48 analytes per well, 96 wells).
There are many factors that can impact how well analytes are detected within an assay. High-performance assays such as Bio-Plex Pro Panels use optimized reagent chemistry, superior antibodies, and rigorous development and testing methods using real human samples in order to maximize dynamic range and assay sensitivity. This results in fewer out-of-range results and more usable data points for your experiments.
Culture media, cancer serum, stimulated peripheral blood mononuclear cells, whole blood, and HIV plasma samples from six different laboratories were run on the Bio-Plex Pro Human Cytokine Screening Panel, 48-Plex. In these 420 test samples, the average analyte detectability was >80%, meaning less than 20% of data points were outside the working assay range.
100
80
60
40
20
0
IL-1b
G-CSFIL-9
RANTE
S
GRO-a /
KC /
CXCL1
SCF
IL-5
MCP-1 /
CCL2
/ MCAF
IL-15
IL-2R
a
MCP-
3 /
CCL7IL-2
IFN-g
IL-12
(p70
)
VEGF
IFN-a
2
SDF-
1aIL-7
PDGF-
BB
IL-18
Eota
xin /
CCL11
IL-3
MIF
IL-1r
a
GM-C
SF
IL-10
TNF-
a
HGF
SCGF-
b
IL-6
MIP
-1a / C
CL3
IL-16
IL-17
A
M-C
SFIL-4
IP-10IL-13
IL-1a LIF
TNF-
bTR
AIL
IL-8
MIP
-1b /
CCL4
CTACK
b-NGF
Basic
FGF
IL-12
(p40
)
MIG
Analyte
Ana
lyte
det
ecta
bili
ty, %
Bio-Plex Pro Human Cytokine Screening Panel Analyte Detectability
Bulletin 6335
9

© 2021 Bio-Rad Laboratories, Inc.
Bio-Plex Pro Human Immunotherapy Assays bio-rad.com/bio-plex_immunotherapy
Bio-Rad bulletin 7217
10
Performance CharacteristicsAssay Working Range,
pg/mlAssay Sensitivity,
pg/ml Mean Intra-Assay %CV
Mean Inter-Assay %CV
Singleplex Bead RegionAnalyte LLOQ ULOQ LOD
GM-CSF 0.48 7,846 0.19 4.3 2.2 34
IFN-g 1.57 25,665 1.05 3.1 3.6 21
IL-2 1.29 21,178 0.75 1.7 2.5 38
IL-4 0.19 3,064 0.09 3.2 1.9 52
IL-5 3.63 59,499 0.86 2.3 2.3 33
IL-6 0.38 6,244 0.34 2.2 3.0 19
IL-7 1.92 31,475 1.22 2.7 3.9 74
IL-8 / CXCL8 0.85 13,992 0.36 3.2 2.8 54
IL-10 1.06 17,427 0.69 2.3 3.4 56
IL-13 0.31 5,157 0.22 3.1 2.7 51
IL-15 12.42 203,426 12.82 2.8 4.1 73
IL-17A 2.44 39,972 1.16 2.4 1.4 76
IL-18 0.66 10,892 0.31 2.9 2.2 42
IP-10 / CXCL10 3.41 34,953 1.43 2.8 6.0 48
MCP-1 / CCL2 / MCAF 0.53 8,755 0.44 3.2 3.4 53
MIG / CXCL9 3.16 32,365 1.39 4.4 4.2 14
MIP-1a / CCL3 0.12 1,218 0.06 4.5 4.2 55
MIP-1b / CCL4 1.41 1,439 1.41 3.4 2.5 18
RANTES 16.72 26,467 3.98 3.0 6.7 37
TNF-a 3.33 54,566 1.13 3.5 3.0 36
Bio-Plex Pro Human Immunotherapy 20-Plex Panel (12007975)
Analyte Singleplex20-Plex Panel
(12007975)Bead
Region
GM-CSF 171B5018M · 34
IFN-y 171B5019M · 21
IL-2 171B5003M · 38
IL-4 171B5004M · 52
IL-5 171B5005M · 33
IL-6 171B5006M · 19
IL-7 171B5007M · 74
IL-8 / CXCL8 171B5008M · 54
IL-10 171B5010M · 56
IL-13 171B5012M · 51
IL-15 171B5013M · 73
IL-17A 171B5014M · 76
IL-18 — · 42
IP-10 / CXCL10 171B5020M · 48
MCP-1 / CCL2 / MCAF 171B5021M · 53
MIG / CXCL9 171B6015M · 14
MIP-1a / CCL3 171B5022M · 55
MIP-1b / CCL4 171B5023M · 18
RANTES 171B5025M · 37
TNF-a 171B5026M · 36
Bio-Plex Pro Human Immunotherapy Assaysbio-rad.com/bio-plex_immunotherapy
Bio-Rad bulletin 7217
Bulletin 6335
11
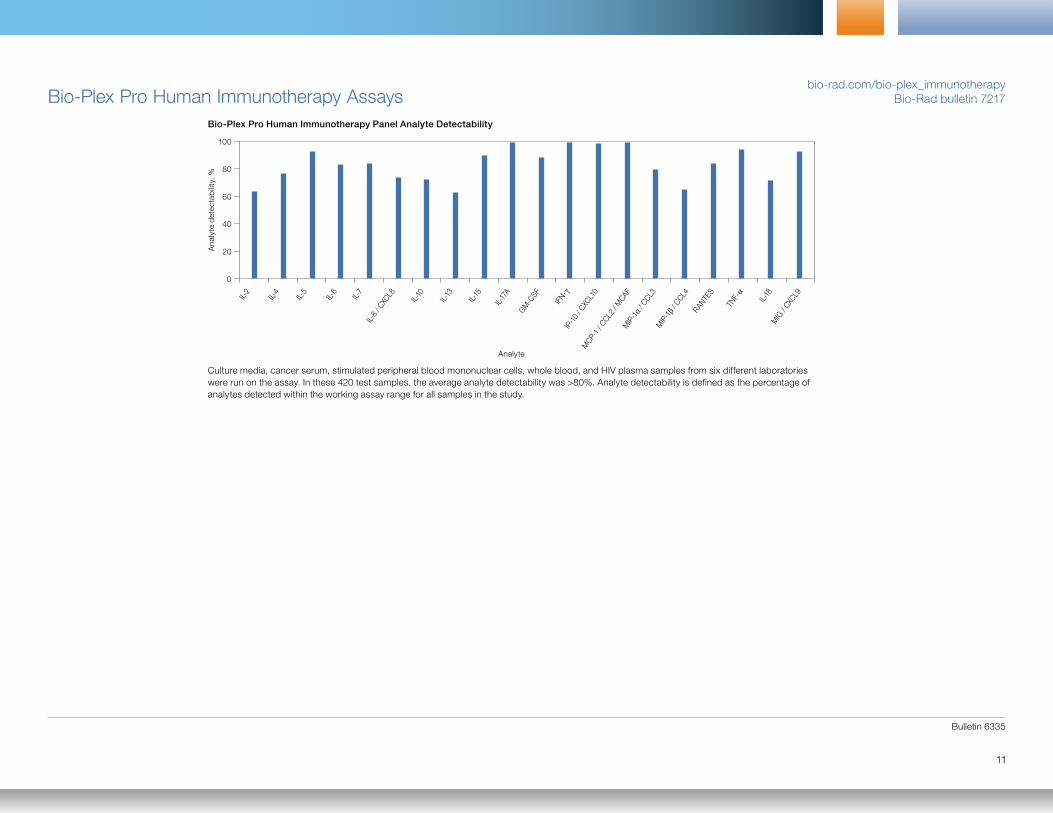
Bio-Plex Pro Human Immunotherapy Panel Analyte Detectability
Culture media, cancer serum, stimulated peripheral blood mononuclear cells, whole blood, and HIV plasma samples from six different laboratories were run on the assay. In these 420 test samples, the average analyte detectability was >80%. Analyte detectability is defined as the percentage of analytes detected within the working assay range for all samples in the study.
Analyte
100
80
60
40
20
0
RANTE
S
IL-5
MCP-
1 / C
CL2 /
MCAF
IL-15IL-2
IFN-gIL-7
IL-18
GM-C
SF
IL-10
TNF-
a
IL-6
MIP
-1a /
CCL3
IL-17
A
IL-4
IP-10
/ CXC
L10
IL-13
IL-8
/ CXC
L8
MIP
-1b /
CCL4
MIG
/ CXC
L9
Ana
lyte
det
ecta
bili
ty, %

© 2021 Bio-Rad Laboratories, Inc.
12
Bio-Plex Pro Human Inflammation Assaysbio-rad.com/inflammation
Bio-Rad bulletin 6625
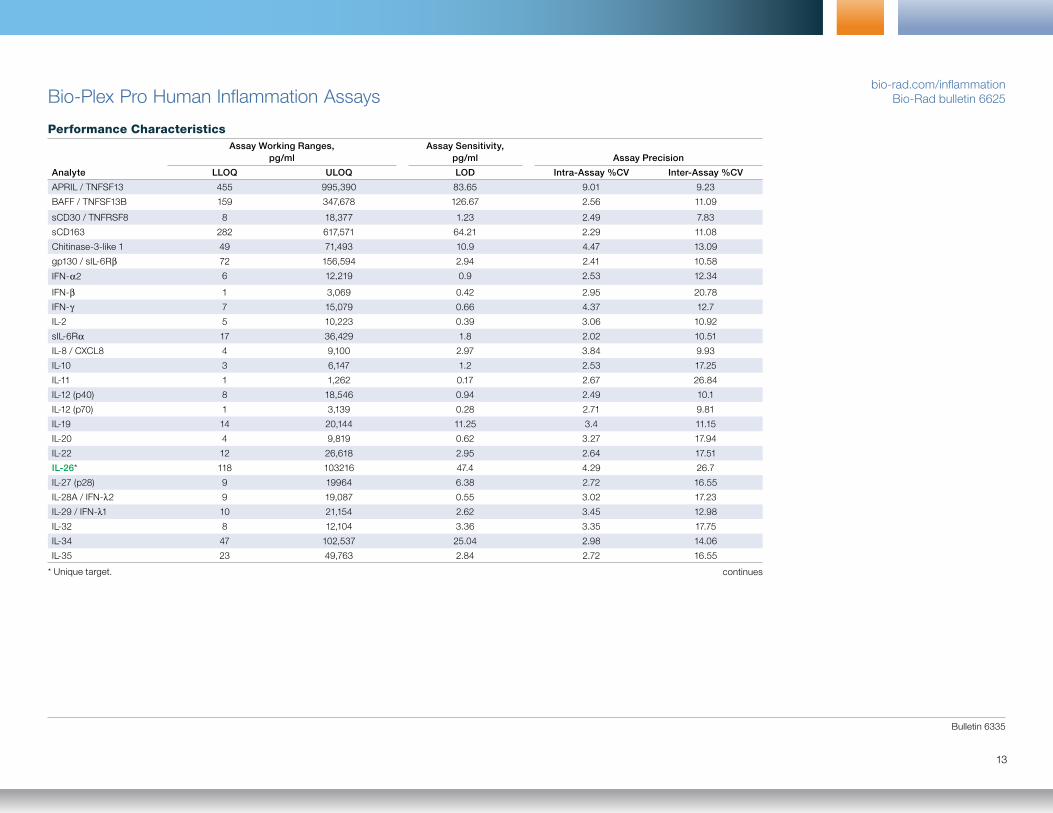
Analyze key human inflammation markers using a comprehensive, high-performance assay. Study TNF superfamily proteins, IFN family proteins, Treg cytokines, and MMPs in a single-well assay, or choose from a selection of subpanels to meet your needs. Custom configurations are also available.
Bio-Plex Pro Human Inflammation Assays
Analyte Singleplex Bead Region
Bio-Plex Pro Human Inflammation Panel, 37-Plex
(171AL001M)
Bio-Plex Pro Human Treg Cytokine Panel, 12-Plex
(171AL003M)
APRIL / TNFSF13 171BL001M 42 •
BAFF / TNFSF13B 171BL002M 37 •
sCD30 / TNFRSF8 171BL003M 53 •
sCD163 171BL004M 46 •
Chitinase-3-like 1 171BL005M 72 •
gp130 / sIL-6Rb 171BL006M 14 •
IFN-a2 171BL007M 20 •
IFN-b 171BL008M 44 •
IFN-g 171BL009M 21 •
IL-2 171BL010M 38 • •
sIL-6Ra 171BL011M 19 •
IL-8 / CXCL8 171BL012M 54 •
IL-10 171BL013M 56 • •
IL-11 171BL014M 39 •
IL-12 (p40) 171BL015M 28 • •
IL-12 (p70) 171BL016M 75 • •
IL-19 171BL017M 29 • •
IL-20 171BL018M 30 • •
IL-22 171BL019M 18 • •
IL-26 171BL020M 22 • •
IL-27 (p28) 171BL021M 13 • •
IL-28A / IFN-l2 171BL022M 66 • •
IL-29 / IFN-l1 171BL023M 33 • •
IL-32 171BL024M 35 •
IL-34 171BL025M 15 •
IL-35 171BL026M 34 • •
LIGHT / TNFSF14 171BL027M 51 •
MMP-1 171BL028M 43 •
MMP-2 171BL029M 26 •
MMP-3 171BL030M 45 •
Osteocalcin 171BL031M 65 •
Osteopontin 171BL032M 77 •
Pentraxin-3 171BL033M 48 •
sTNF-R1 171BL034M 73 •
sTNF-R2 171BL035M 67 •
TSLP 171BL036M 52 •
TWEAK / TNFSF12 171BL037M 62 •
Bulletin 6335
13
Bio-Plex Pro Human Inflammation Assaysbio-rad.com/inflammation
Bio-Rad bulletin 6625
Performance CharacteristicsAssay Working Ranges,
pg/mlAssay Sensitivity,
pg/ml Assay Precision
Analyte LLOQ ULOQ LOD Intra-Assay %CV Inter-Assay %CV
APRIL / TNFSF13 455 995,390 83.65 9.01 9.23
BAFF / TNFSF13B 159 347,678 126.67 2.56 11.09
sCD30 / TNFRSF8 8 18,377 1.23 2.49 7.83
sCD163 282 617,571 64.21 2.29 11.08
Chitinase-3-like 1 49 71,493 10.9 4.47 13.09
gp130 / sIL-6Rb 72 156,594 2.94 2.41 10.58
IFN-a2 6 12,219 0.9 2.53 12.34
IFN-b 1 3,069 0.42 2.95 20.78
IFN-g 7 15,079 0.66 4.37 12.7
IL-2 5 10,223 0.39 3.06 10.92
sIL-6Ra 17 36,429 1.8 2.02 10.51
IL-8 / CXCL8 4 9,100 2.97 3.84 9.93
IL-10 3 6,147 1.2 2.53 17.25
IL-11 1 1,262 0.17 2.67 26.84
IL-12 (p40) 8 18,546 0.94 2.49 10.1
IL-12 (p70) 1 3,139 0.28 2.71 9.81
IL-19 14 20,144 11.25 3.4 11.15
IL-20 4 9,819 0.62 3.27 17.94
IL-22 12 26,618 2.95 2.64 17.51
IL-26* 118 103216 47.4 4.29 26.7
IL-27 (p28) 9 19964 6.38 2.72 16.55
IL-28A / IFN-l2 9 19,087 0.55 3.02 17.23
IL-29 / IFN-l1 10 21,154 2.62 3.45 12.98
IL-32 8 12,104 3.36 3.35 17.75
IL-34 47 102,537 25.04 2.98 14.06
IL-35 23 49,763 2.84 2.72 16.55
* Unique target. continues
© 2021 Bio-Rad Laboratories, Inc.
14
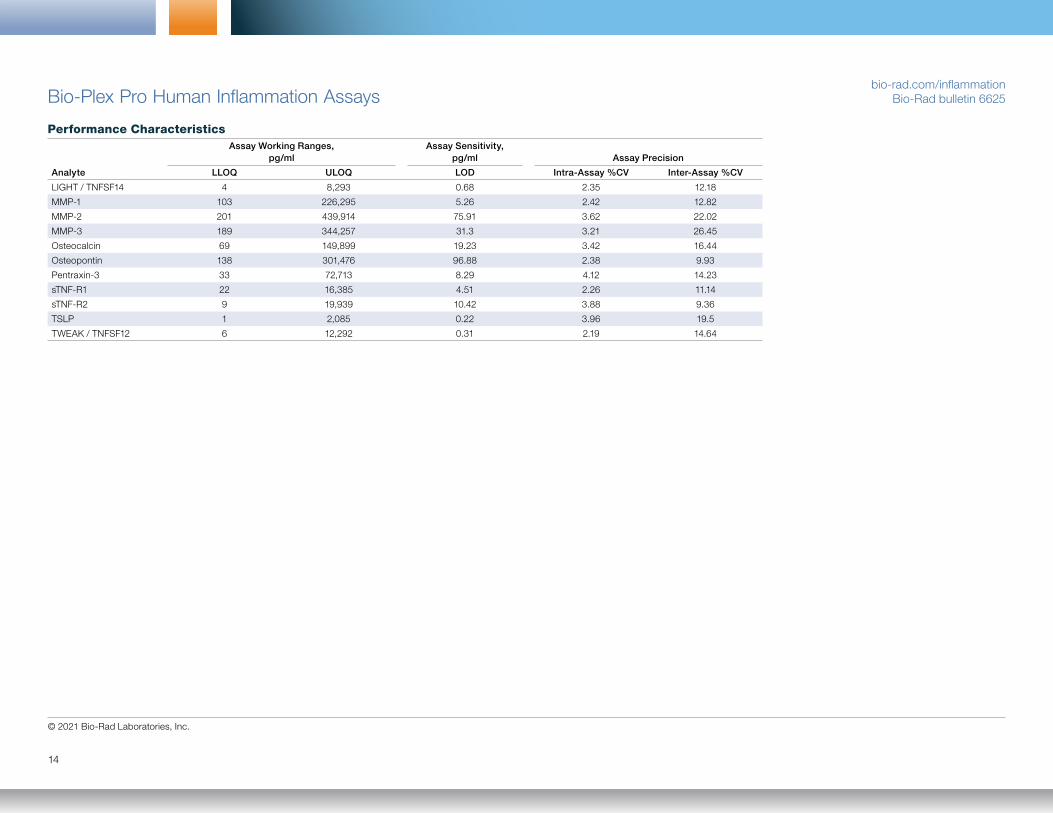
Bio-Plex Pro Human Inflammation Assaysbio-rad.com/inflammation
Bio-Rad bulletin 6625
Performance CharacteristicsAssay Working Ranges,
pg/mlAssay Sensitivity,
pg/ml Assay Precision
Analyte LLOQ ULOQ LOD Intra-Assay %CV Inter-Assay %CV
LIGHT / TNFSF14 4 8,293 0.68 2.35 12.18
MMP-1 103 226,295 5.26 2.42 12.82
MMP-2 201 439,914 75.91 3.62 22.02
MMP-3 189 344,257 31.3 3.21 26.45
Osteocalcin 69 149,899 19.23 3.42 16.44
Osteopontin 138 301,476 96.88 2.38 9.93
Pentraxin-3 33 72,713 8.29 4.12 14.23
sTNF-R1 22 16,385 4.51 2.26 11.14
sTNF-R2 9 19,939 10.42 3.88 9.36
TSLP 1 2,085 0.22 3.96 19.5
TWEAK / TNFSF12 6 12,292 0.31 2.19 14.64
Bulletin 6335
15
Bio-Plex Pro Human Inflammation Assaysbio-rad.com/inflammation
Bio-Rad bulletin 6625
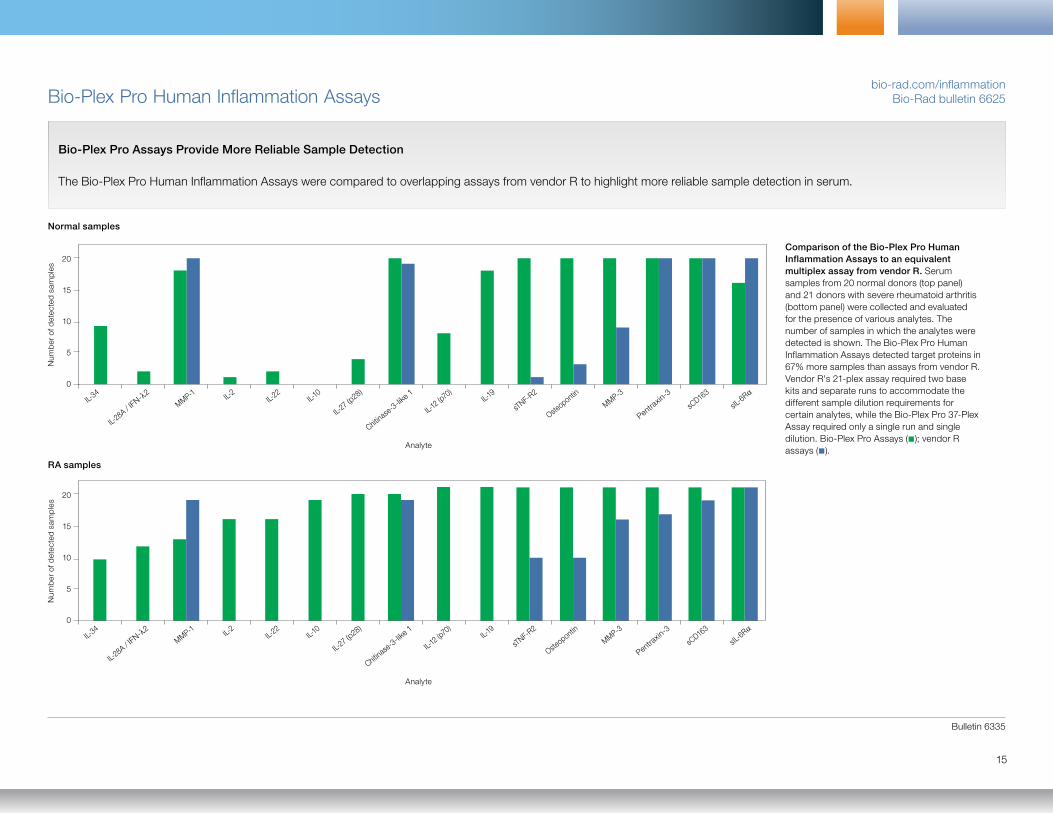
Comparison of the Bio-Plex Pro Human Inflammation Assays to an equivalent multiplex assay from vendor R. Serum samples from 20 normal donors (top panel) and 21 donors with severe rheumatoid arthritis (bottom panel) were collected and evaluated for the presence of various analytes. The number of samples in which the analytes were detected is shown. The Bio-Plex Pro Human Inflammation Assays detected target proteins in 67% more samples than assays from vendor R. Vendor R's 21-plex assay required two base kits and separate runs to accommodate the different sample dilution requirements for certain analytes, while the Bio-Plex Pro 37-Plex Assay required only a single run and single dilution. Bio-Plex Pro Assays ( ); vendor R assays ( ).
20
15
10
5
0
20
15
10
5
0
IL-12 (p
70)
IL-12 (p
70)
sTNF-R2
sTNF-R2
IL-10
IL-10
IL-34
IL-34
sIL-6Ra
sIL-6Ra
sCD16
3
sCD16
3
IL-2
IL-2
IL-28A / I
FN-l2
IL-28A / I
FN-l2
IL-27 (p
28)
IL-27 (p
28)
MMP-3
MMP-3
Pentraxin
-3
Pentraxin
-3
IL-22
IL-22
Osteopontin
Osteopontin
Chitinas
e-3-lik
e 1
Chitinas
e-3-lik
e 1
IL-19
IL-19
MMP-1
MMP-1
Analyte
Analyte
Normal samples
RA samples
Num
ber
of d
etec
ted
sam
ple
sN
umb
er o
f det
ecte
d sa
mp
les
Bio-Plex Pro Assays Provide More Reliable Sample Detection
The Bio-Plex Pro Human Inflammation Assays were compared to overlapping assays from vendor R to highlight more reliable sample detection in serum.
© 2021 Bio-Rad Laboratories, Inc.
16
Bio-Plex Pro Human Th17 Cytokine Assaysbio-rad.com/HumanTh17
Bio-Rad bulletin 6249
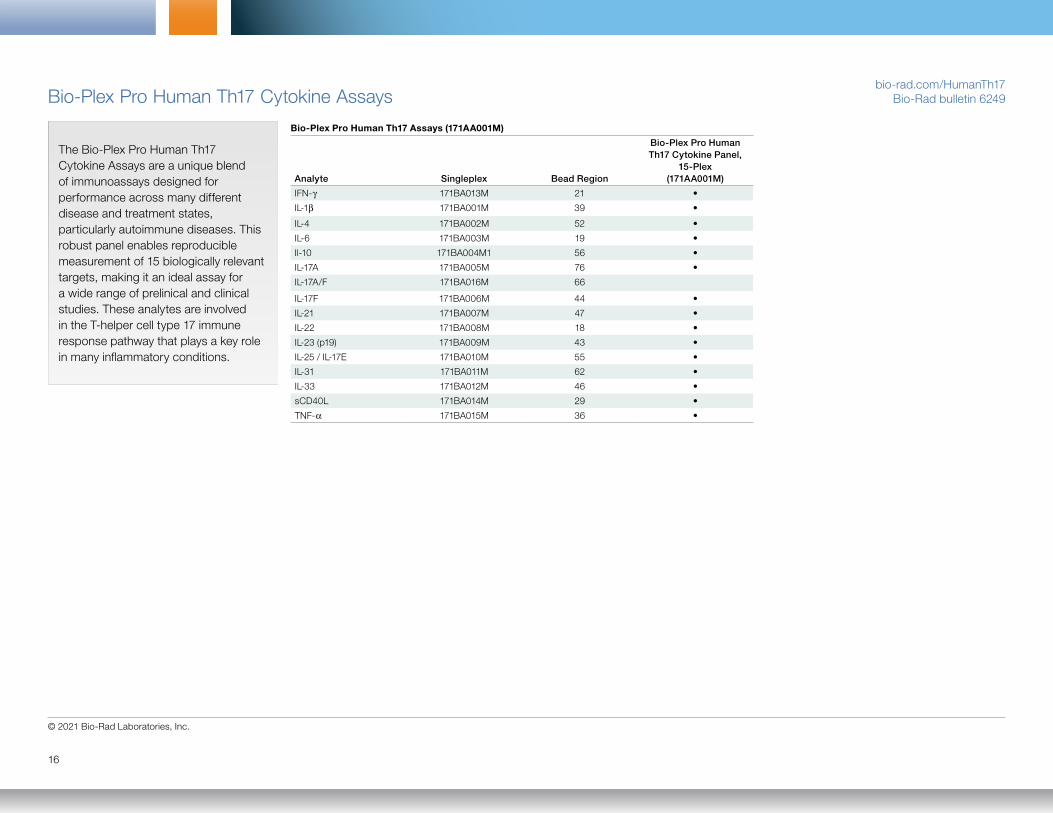
The Bio-Plex Pro Human Th17 Cytokine Assays are a unique blend of immunoassays designed for performance across many different disease and treatment states, particularly autoimmune diseases. This robust panel enables reproducible measurement of 15 biologically relevant targets, making it an ideal assay for a wide range of prelinical and clinical studies. These analytes are involved in the T-helper cell type 17 immune response pathway that plays a key role in many inflammatory conditions.
Bio-Plex Pro Human Th17 Assays (171AA001M)
Analyte Singleplex Bead Region
Bio-Plex Pro Human Th17 Cytokine Panel,
15-Plex (171AA001M)
IFN-g 171BA013M 21 •
IL-1b 171BA001M 39 •
IL-4 171BA002M 52 •
IL-6 171BA003M 19 •
Il-10 171BA004M1 56 •
IL-17A 171BA005M 76 •
IL-17A/F 171BA016M 66
IL-17F 171BA006M 44 •
IL-21 171BA007M 47 •
IL-22 171BA008M 18 •
IL-23 (p19) 171BA009M 43 •
IL-25 / IL-17E 171BA010M 55 •
IL-31 171BA011M 62 •
IL-33 171BA012M 46 •
sCD40L 171BA014M 29 •
TNF-a 171BA015M 36 •
Bulletin 6335
17
Bio-Plex Pro Human Th17 Cytokine Assaysbio-rad.com/HumanTh17
Bio-Rad bulletin 6249
Performance CharacteristicsAssay Working Ranges,
pg/mlAssay Sensitivity,
pg/ml Assay Precision Calibration to WHO/NIBSC
AnalyteAlternate Names LLOQ ULOQ LOD
Intra-Assay %CV
Inter-Assay %CV Factor**
NIBSC Catalog #
IFN-g — 0.7 11,377 0.3 3.4 2.1 1.7 87/586
IL-1b — 0.4 2,877 0.1 1.6 5.4 1.0 86/680
IL-4 — 1.9 7,861 1.9 3.7 10.4 0.7 88/656
IL-6 — 3.1 25,399 2.0 3.1 4.3 1.6 89/548
IL-10 — 3.2 12,923 1.4 3.2 6.0 1.3 93/722
IL-17A IL-17, CTLA8 1.6 25,915 0.8 3.5 5.1 0.4 01/420
IL-17A/F* — 1.62 6,631 1.28 4.3 5.8 — —
IL-17F — 7.5 30,743 3.1 3.9 9.8 — —
IL-21 Za11 15.3 250,446 2.5 3.3 10.3 — —
IL-22 — 2.5 41,572 0.9 3.3 4.3 — —
IL-23 (p19) IL-23A, SGRF 10.7 132,017 5.2 3.9 6.0 — —
IL-25 IL-17E 1.3 21,804 0.8 2.6 4.4 — —
IL-31 — 3.6 58,723 2.1 5.9 10.4 — —
IL-33 — 6.8 55,852 1.6 2.6 6.1 — —
sCD40L CD154 7.7 126,350 4.4 2.9 3.9 — —
TNF-a — 0.3 4,678 0.04 3.2 6.5 0.4 88/786
WHO, World Health Organization; NIBSC, National Institute for Biological Standards and Controls
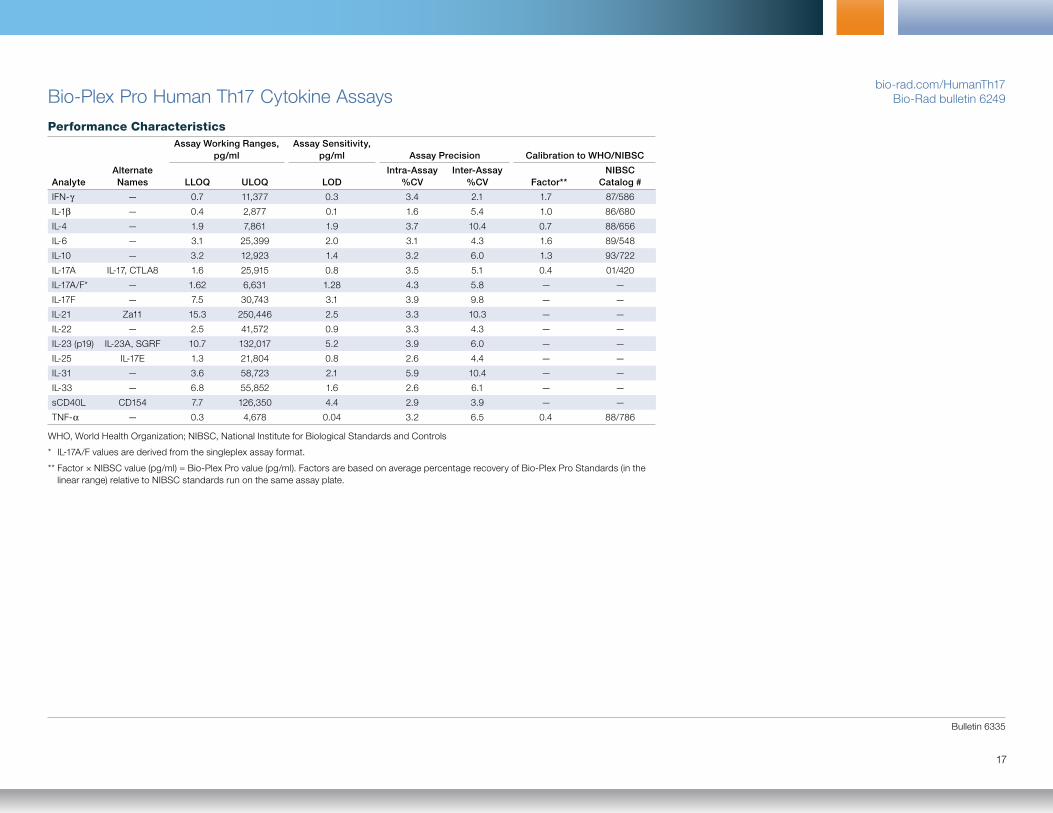
* IL-17A/F values are derived from the singleplex assay format.
** Factor × NIBSC value (pg/ml) = Bio-Plex Pro value (pg/ml). Factors are based on average percentage recovery of Bio-Plex Pro Standards (in the linear range) relative to NIBSC standards run on the same assay plate.
Bio-Plex Pro Human Th17 Cytokine Assaysbio-rad.com/HumanTh17
Bio-Rad bulletin 6249
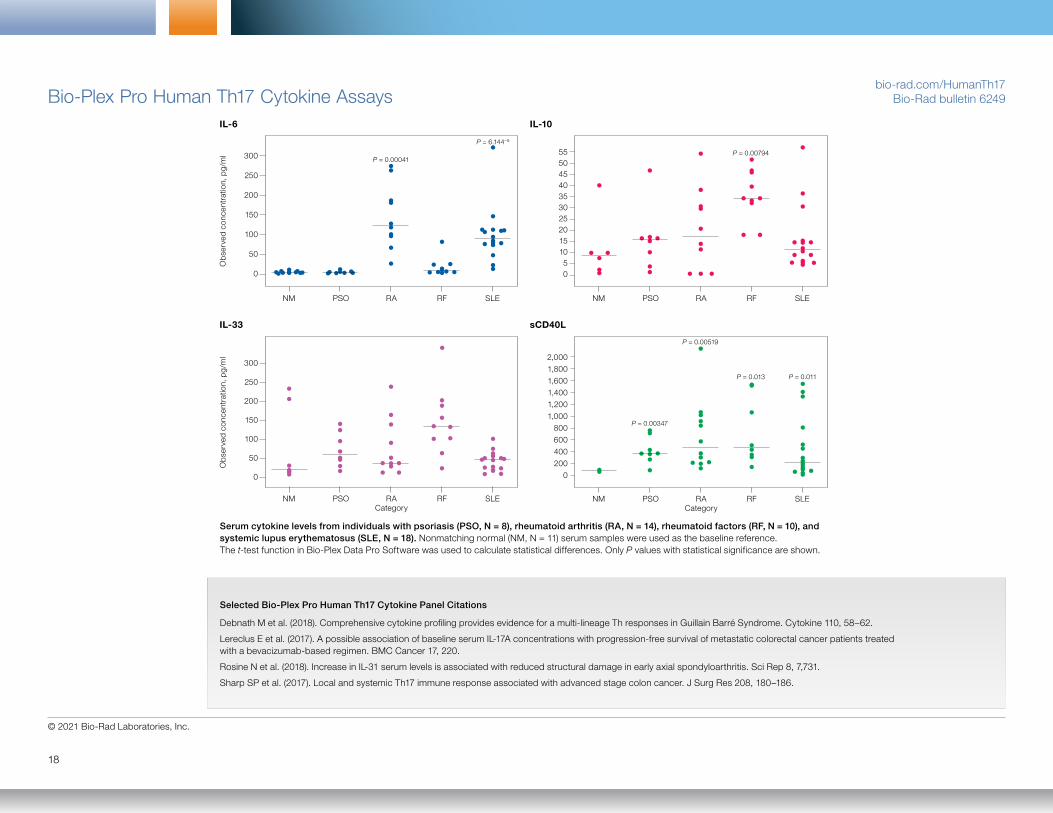
Serum cytokine levels from individuals with psoriasis (PSO, N = 8), rheumatoid arthritis (RA, N = 14), rheumatoid factors (RF, N = 10), and systemic lupus erythematosus (SLE, N = 18). Nonmatching normal (NM, N = 11) serum samples were used as the baseline reference. The t-test function in Bio-Plex Data Pro Software was used to calculate statistical differences. Only P values with statistical significance are shown.
Ob
serv
ed c
once
ntra
tion,
pg/
ml
Ob
serv
ed c
once
ntra
tion,
pg/
ml
NM PSO RA RF SLE
NM PSO RA RF SLE Category
NM PSO RA RF SLE
NM PSO RA RF SLE Category
300
250
200
150
100
50
0
300
250
200
150
100
50
0
5550454035302520151050
2,000
1,800
1,600
1,400
1,200
1,000
800
600
400
200
0
IL-6
IL-33
IL-10
sCD40L
P = 0.00041
P = 0.00519
P = 6.144–5
P = 0.011
P = 0.00794
P = 0.013
P = 0.00347
© 2021 Bio-Rad Laboratories, Inc.
18
Selected Bio-Plex Pro Human Th17 Cytokine Panel Citations
Debnath M et al. (2018). Comprehensive cytokine profiling provides evidence for a multi-lineage Th responses in Guillain Barré Syndrome. Cytokine 110, 58–62.
Lereclus E et al. (2017). A possible association of baseline serum IL-17A concentrations with progression-free survival of metastatic colorectal cancer patients treated with a bevacizumab-based regimen. BMC Cancer 17, 220.
Rosine N et al. (2018). Increase in IL-31 serum levels is associated with reduced structural damage in early axial spondyloarthritis. Sci Rep 8, 7,731.
Sharp SP et al. (2017). Local and systemic Th17 immune response associated with advanced stage colon cancer. J Surg Res 208, 180–186.
Bio-Plex Pro Human Chemokine Assaysbio-rad.com/humanchemokine
Bio-Rad bulletin 6499
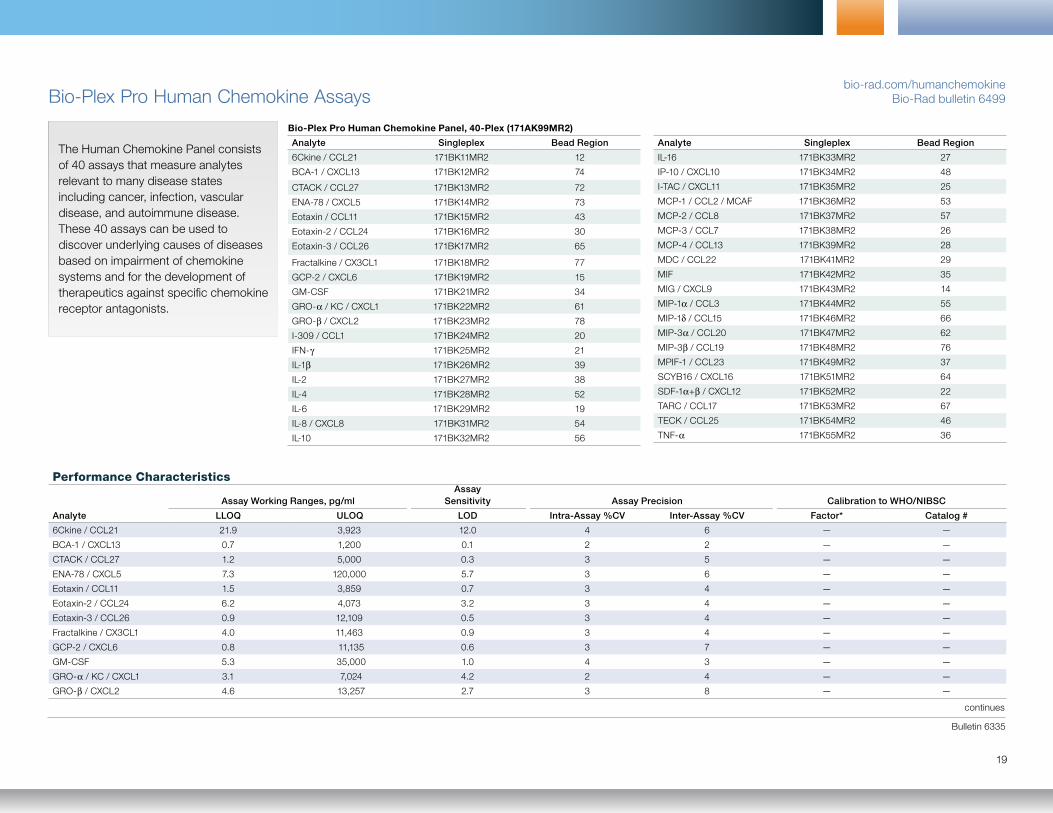
The Human Chemokine Panel consists of 40 assays that measure analytes relevant to many disease states including cancer, infection, vascular disease, and autoimmune disease. These 40 assays can be used to discover underlying causes of diseases based on impairment of chemokine systems and for the development of therapeutics against specific chemokine receptor antagonists.
Bio-Plex Pro Human Chemokine Panel, 40-Plex (171AK99MR2)
Analyte Singleplex Bead Region
6Ckine / CCL21 171BK11MR2 12
BCA-1 / CXCL13 171BK12MR2 74
CTACK / CCL27 171BK13MR2 72
ENA-78 / CXCL5 171BK14MR2 73
Eotaxin / CCL11 171BK15MR2 43
Eotaxin-2 / CCL24 171BK16MR2 30
Eotaxin-3 / CCL26 171BK17MR2 65
Fractalkine / CX3CL1 171BK18MR2 77
GCP-2 / CXCL6 171BK19MR2 15
GM-CSF 171BK21MR2 34
GRO-a / KC / CXCL1 171BK22MR2 61
GRO-b / CXCL2 171BK23MR2 78
I-309 / CCL1 171BK24MR2 20
IFN-g 171BK25MR2 21
IL-1b 171BK26MR2 39
IL-2 171BK27MR2 38
IL-4 171BK28MR2 52
IL-6 171BK29MR2 19
IL-8 / CXCL8 171BK31MR2 54
IL-10 171BK32MR2 56
Bio-Plex Pro Human Chemokine Panel, 40-Plex (171AK99MR2)
Analyte Singleplex Bead Region
IL-16 171BK33MR2 27
IP-10 / CXCL10 171BK34MR2 48
I-TAC / CXCL11 171BK35MR2 25
MCP-1 / CCL2 / MCAF 171BK36MR2 53
MCP-2 / CCL8 171BK37MR2 57
MCP-3 / CCL7 171BK38MR2 26
MCP-4 / CCL13 171BK39MR2 28
MDC / CCL22 171BK41MR2 29
MIF 171BK42MR2 35
MIG / CXCL9 171BK43MR2 14
MIP-1a / CCL3 171BK44MR2 55
MIP-1d / CCL15 171BK46MR2 66
MIP-3a / CCL20 171BK47MR2 62
MIP-3b / CCL19 171BK48MR2 76
MPIF-1 / CCL23 171BK49MR2 37
SCYB16 / CXCL16 171BK51MR2 64
SDF-1a+b / CXCL12 171BK52MR2 22
TARC / CCL17 171BK53MR2 67
TECK / CCL25 171BK54MR2 46
TNF-a 171BK55MR2 36
Bulletin 6335
19
continues
Performance Characteristics
Assay Working Ranges, pg/mlAssay
Sensitivity Assay Precision Calibration to WHO/NIBSC
Analyte LLOQ ULOQ LOD Intra-Assay %CV Inter-Assay %CV Factor* Catalog #
6Ckine / CCL21 21.9 3,923 12.0 4 6 — —
BCA-1 / CXCL13 0.7 1,200 0.1 2 2 — —
CTACK / CCL27 1.2 5,000 0.3 3 5 — —
ENA-78 / CXCL5 7.3 120,000 5.7 3 6 — —
Eotaxin / CCL11 1.5 3,859 0.7 3 4 — —
Eotaxin-2 / CCL24 6.2 4,073 3.2 3 4 — —
Eotaxin-3 / CCL26 0.9 12,109 0.5 3 4 — —
Fractalkine / CX3CL1 4.0 11,463 0.9 3 4 — —
GCP-2 / CXCL6 0.8 11,135 0.6 3 7 — —
GM-CSF 5.3 35,000 1.0 4 3 — —
GRO-a / KC / CXCL1 3.1 7,024 4.2 2 4 — —
GRO-b / CXCL2 4.6 13,257 2.7 3 8 — —
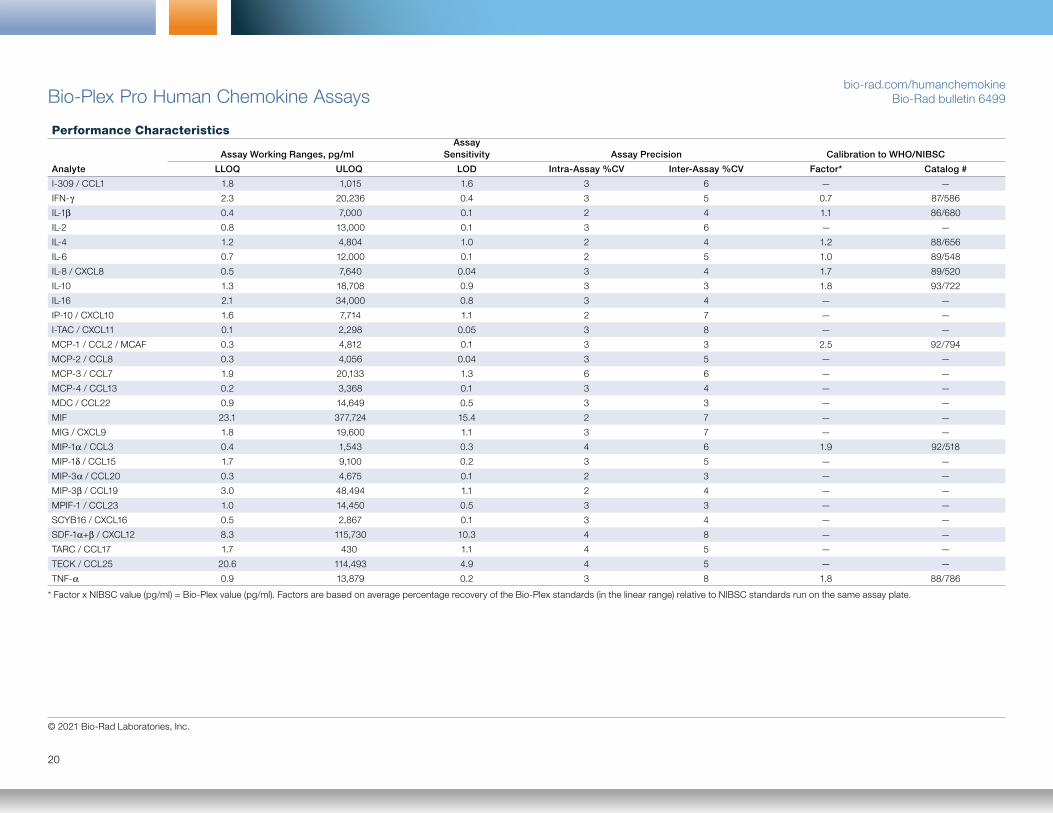
* Factor x NIBSC value (pg/ml) = Bio-Plex value (pg/ml). Factors are based on average percentage recovery of the Bio-Plex standards (in the linear range) relative to NIBSC standards run on the same assay plate.
Bio-Plex Pro Human Chemokine Assaysbio-rad.com/humanchemokine
Bio-Rad bulletin 6499
© 2021 Bio-Rad Laboratories, Inc.
20
Performance Characteristics
Assay Working Ranges, pg/mlAssay
Sensitivity Assay Precision Calibration to WHO/NIBSC
Analyte LLOQ ULOQ LOD Intra-Assay %CV Inter-Assay %CV Factor* Catalog #
I-309 / CCL1 1.8 1,015 1.6 3 6 — —
IFN-g 2.3 20,236 0.4 3 5 0.7 87/586
IL-1b 0.4 7,000 0.1 2 4 1.1 86/680
IL-2 0.8 13,000 0.1 3 6 — —
IL-4 1.2 4,804 1.0 2 4 1.2 88/656
IL-6 0.7 12,000 0.1 2 5 1.0 89/548
IL-8 / CXCL8 0.5 7,640 0.04 3 4 1.7 89/520
IL-10 1.3 18,708 0.9 3 3 1.8 93/722
IL-16 2.1 34,000 0.8 3 4 — —
IP-10 / CXCL10 1.6 7,714 1.1 2 7 — —
I-TAC / CXCL11 0.1 2,298 0.05 3 8 — —
MCP-1 / CCL2 / MCAF 0.3 4,812 0.1 3 3 2.5 92/794
MCP-2 / CCL8 0.3 4,056 0.04 3 5 — —
MCP-3 / CCL7 1.9 20,133 1.3 6 6 — —
MCP-4 / CCL13 0.2 3,368 0.1 3 4 — —
MDC / CCL22 0.9 14,649 0.5 3 3 — —
MIF 23.1 377,724 15.4 2 7 — —
MIG / CXCL9 1.8 19,600 1.1 3 7 — —
MIP-1a / CCL3 0.4 1,543 0.3 4 6 1.9 92/518
MIP-1d / CCL15 1.7 9,100 0.2 3 5 — —
MIP-3a / CCL20 0.3 4,675 0.1 2 3 — —
MIP-3b / CCL19 3.0 48,494 1.1 2 4 — —
MPIF-1 / CCL23 1.0 14,450 0.5 3 3 — —
SCYB16 / CXCL16 0.5 2,867 0.1 3 4 — —
SDF-1a+b / CXCL12 8.3 115,730 10.3 4 8 — —
TARC / CCL17 1.7 430 1.1 4 5 — —
TECK / CCL25 20.6 114,493 4.9 4 5 — —
TNF-a 0.9 13,879 0.2 3 8 1.8 88/786
Bio-Plex Pro Human Chemokine Assaysbio-rad.com/humanchemokine
Bio-Rad bulletin 6499
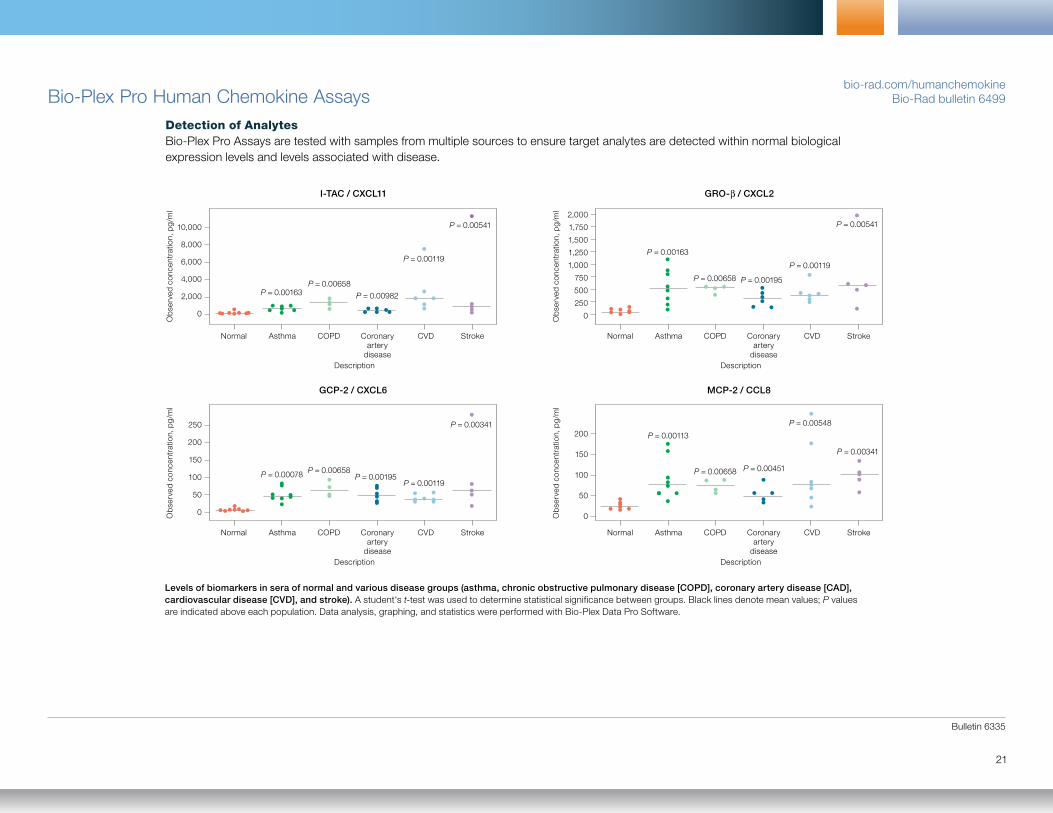
Detection of AnalytesBio-Plex Pro Assays are tested with samples from multiple sources to ensure target analytes are detected within normal biological expression levels and levels associated with disease.
I-TAC / CXCL11
Ob
serv
ed c
once
ntra
tion,
pg/
ml
Normal Asthma COPD CVD StrokeCoronary artery
disease
P = 0.00541
P = 0.00119
10,000
8,000
6,000
4,000
2,000
0
Description
GRO-b / CXCL2
Ob
serv
ed c
once
ntra
tion,
pg/
ml
Normal Asthma COPD CVD StrokeCoronary artery
disease
2,000
1,750
1,500
1,250
1,000
750
500
250
0
Description
P = 0.00163
P = 0.00658 P = 0.00195
P = 0.00119
P = 0.00541
GCP-2 / CXCL6
Ob
serv
ed c
once
ntra
tion,
pg/
ml
Normal Asthma COPD CVD StrokeCoronary artery
disease
250
200
150
100
50
0
Description
P = 0.00078 P = 0.00658P = 0.00195
P = 0.00119
P = 0.00341
MCP-2 / CCL8
Ob
serv
ed c
once
ntra
tion,
pg/
ml
Normal Asthma COPD CVD StrokeCoronary artery
disease
200
150
100
50
0
Description
P = 0.00113
P = 0.00658
P = 0.00548
P = 0.00341
Levels of biomarkers in sera of normal and various disease groups (asthma, chronic obstructive pulmonary disease [COPD], coronary artery disease [CAD], cardiovascular disease [CVD], and stroke). A student's t-test was used to determine statistical significance between groups. Black lines denote mean values; P values are indicated above each population. Data analysis, graphing, and statistics were performed with Bio-Plex Data Pro Software.
P = 0.00163P = 0.00658
P = 0.00982
P = 0.00451
Bulletin 6335
21
© 2021 Bio-Rad Laboratories, Inc.
22
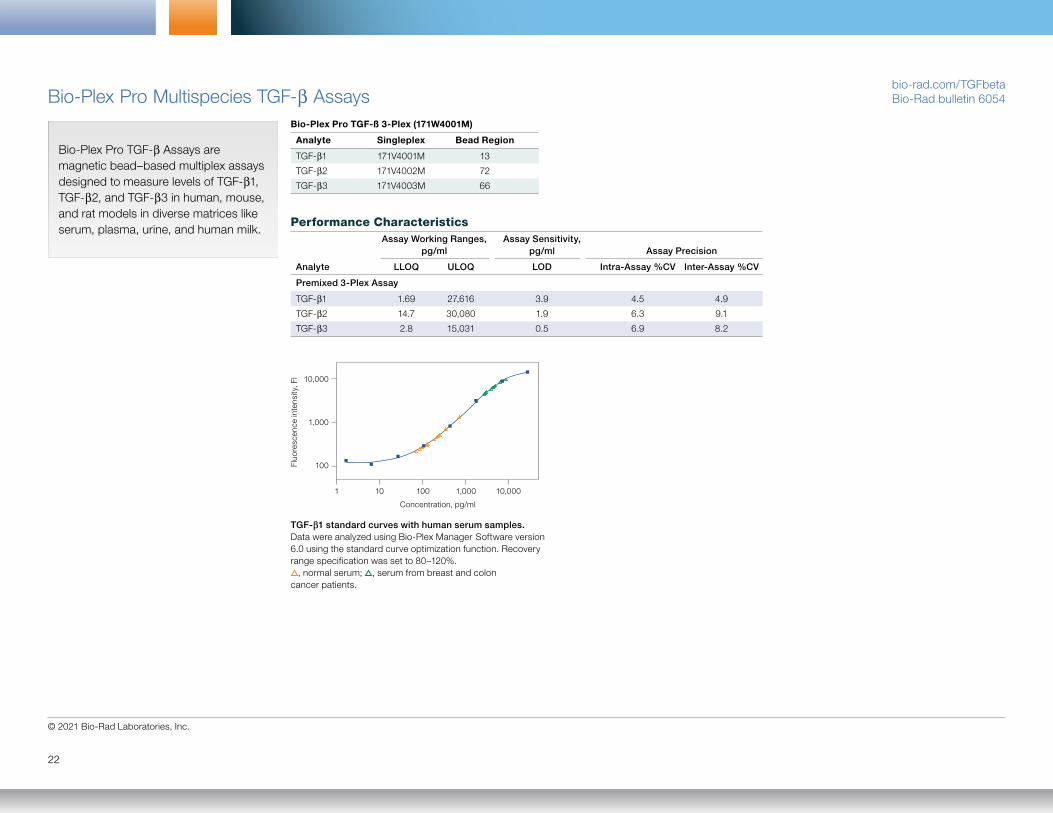
Bio-Plex Pro Multispecies TGF-b AssaysBio-Plex Pro TGF-ß 3-Plex (171W4001M)
Analyte Singleplex Bead Region
TGF-b1 171V4001M 13
TGF-b2 171V4002M 72
TGF-b3 171V4003M 66
bio-rad.com/TGFbetaBio-Rad bulletin 6054
Bio-Plex Pro TGF-b Assays are magnetic bead–based multiplex assays designed to measure levels of TGF-b1, TGF-b2, and TGF-b3 in human, mouse, and rat models in diverse matrices like serum, plasma, urine, and human milk.
TGF-bb1 standard curves with human serum samples. Data were analyzed using Bio-Plex Manager Software version 6.0 using the standard curve optimization function. Recovery range specification was set to 80–120%.
, normal serum; , serum from breast and colon cancer patients.
10,000
1,000
100Fluo
resc
ence
inte
nsity
, FI
Concentration, pg/ml
1 10 100 1,000 10,000
Performance Characteristics
Assay Working Ranges, Assay Sensitivity, pg/ml pg/ml Assay Precision
Analyte LLOQ ULOQ LOD Intra-Assay %CV Inter-Assay %CV
Premixed 3-Plex Assay
TGF-b1 1.69 27,616 3.9 4.5 4.9
TGF-b2 14.7 30,080 1.9 6.3 9.1
TGF-b3 2.8 15,031 0.5 6.9 8.2
Bulletin 6335
23
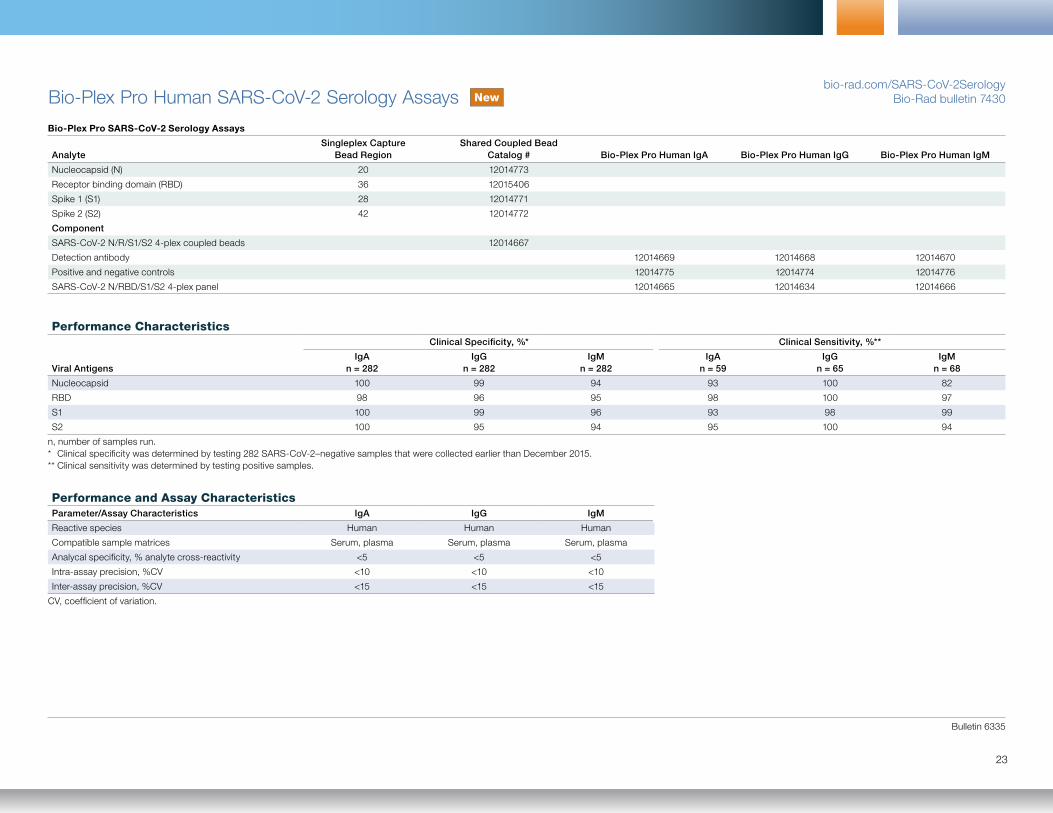
Bio-Plex Pro Human SARS-CoV-2 Serology Assays Newbio-rad.com/SARS-CoV-2Serology
Bio-Rad bulletin 7430
Bio-Plex Pro SARS-CoV-2 Serology Assays
AnalyteSingleplex Capture
Bead RegionShared Coupled Bead
Catalog # Bio-Plex Pro Human IgA Bio-Plex Pro Human IgG Bio-Plex Pro Human IgM
Nucleocapsid (N) 20 12014773
Receptor binding domain (RBD) 36 12015406
Spike 1 (S1) 28 12014771
Spike 2 (S2) 42 12014772
Component
SARS-CoV-2 N/R/S1/S2 4-plex coupled beads 12014667
Detection antibody 12014669 12014668 12014670
Positive and negative controls 12014775 12014774 12014776
SARS-CoV-2 N/RBD/S1/S2 4-plex panel 12014665 12014634 12014666
Performance Characteristics
Viral Antigens
Clinical Specificity, %* Clinical Sensitivity, %**
IgA n = 282
IgG n = 282
IgM n = 282
IgA n = 59
IgG n = 65
IgM n = 68
Nucleocapsid 100 99 94 93 100 82
RBD 98 96 95 98 100 97
S1 100 99 96 93 98 99
S2 100 95 94 95 100 94
n, number of samples run.* Clinical specificity was determined by testing 282 SARS-CoV-2–negative samples that were collected earlier than December 2015.** Clinical sensitivity was determined by testing positive samples.
Performance and Assay Characteristics
Parameter/Assay Characteristics IgA IgG IgM
Reactive species Human Human Human
Compatible sample matrices Serum, plasma Serum, plasma Serum, plasma
Analycal specificity, % analyte cross-reactivity <5 <5 <5
Intra-assay precision, %CV <10 <10 <10
Inter-assay precision, %CV <15 <15 <15
CV, coefficient of variation.
© 2021 Bio-Rad Laboratories, Inc.
24
Anti-RBD IgA
MFI
Sample ID0 100 200 300
20,000
0
22,000
0
Anti-RBD IgG
MFI
Sample ID0 100 200 300
10,000
0
Anti-RBD IgM
MFI
Sample ID0 100 200 300
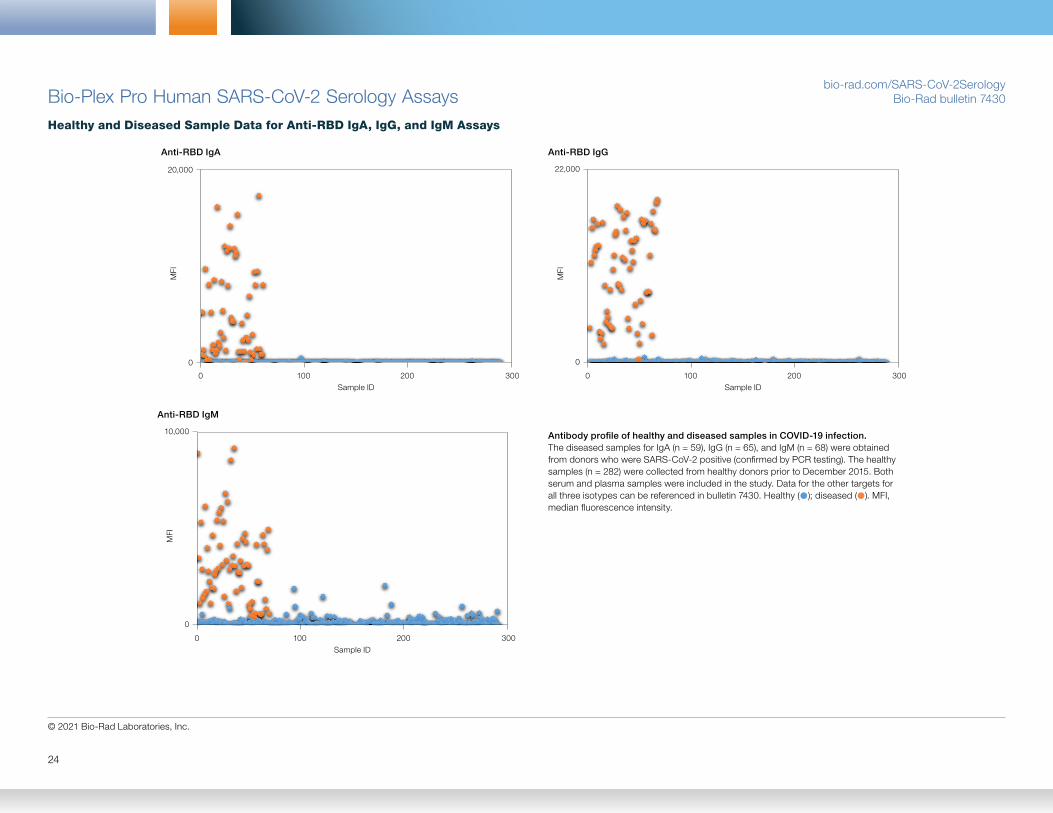
Bio-Plex Pro Human SARS-CoV-2 Serology Assaysbio-rad.com/SARS-CoV-2Serology
Bio-Rad bulletin 7430
Antibody profile of healthy and diseased samples in COVID-19 infection. The diseased samples for IgA (n = 59), IgG (n = 65), and IgM (n = 68) were obtained from donors who were SARS-CoV-2 positive (confirmed by PCR testing). The healthy samples (n = 282) were collected from healthy donors prior to December 2015. Both serum and plasma samples were included in the study. Data for the other targets for all three isotypes can be referenced in bulletin 7430. Healthy (●); diseased (●). MFI, median fluorescence intensity.
Healthy and Diseased Sample Data for Anti-RBD IgA, IgG, and IgM Assays
Bulletin 6335
25
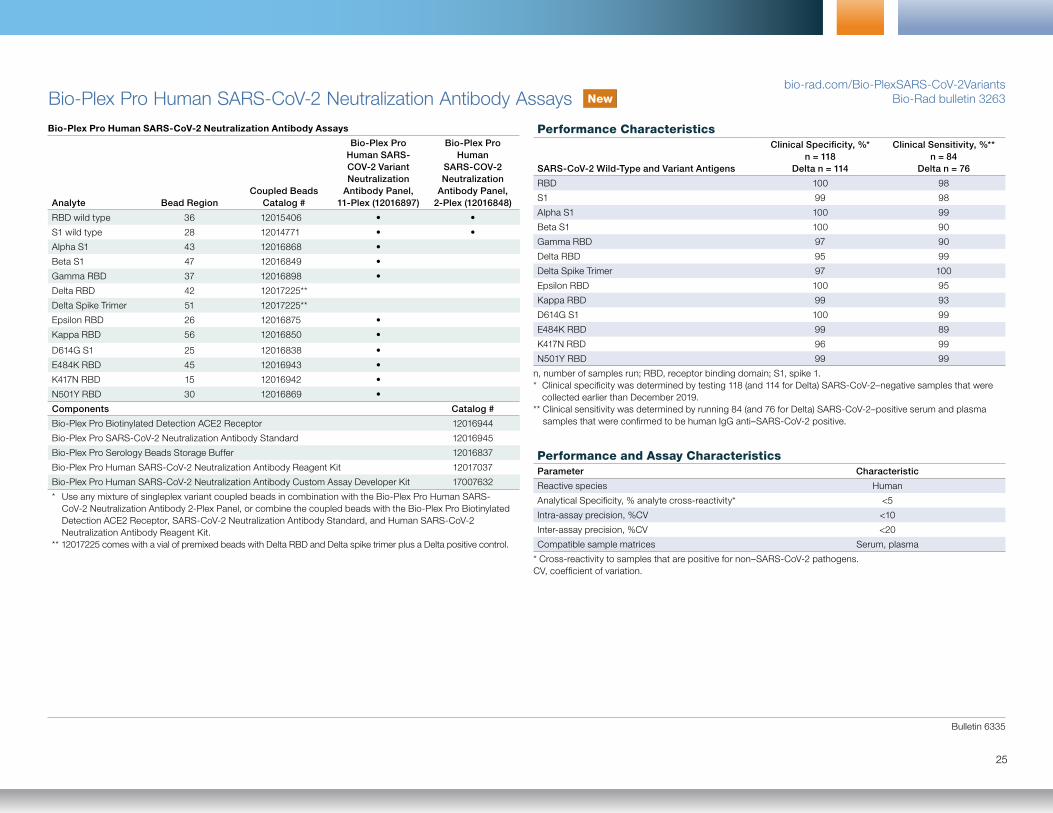
Bio-Plex Pro Human SARS-CoV-2 Neutralization Antibody Assays Newbio-rad.com/Bio-PlexSARS-CoV-2Variants
Bio-Rad bulletin 3263
Bio-Plex Pro Human SARS-CoV-2 Neutralization Antibody Assays
Analyte Bead RegionCoupled Beads
Catalog #
Bio-Plex Pro Human SARS-COV-2 Variant Neutralization
Antibody Panel, 11-Plex (12016897)
Bio-Plex Pro Human
SARS-COV-2 Neutralization
Antibody Panel, 2-Plex (12016848)
RBD wild type 36 12015406 • •
S1 wild type 28 12014771 • •
Alpha S1 43 12016868 •
Beta S1 47 12016849 •
Gamma RBD 37 12016898 •
Delta RBD 42 12017225**
Delta Spike Trimer 51 12017225**
Epsilon RBD 26 12016875 •
Kappa RBD 56 12016850 •
D614G S1 25 12016838 •
E484K RBD 45 12016943 •
K417N RBD 15 12016942 •
N501Y RBD 30 12016869 •
Components Catalog #
Bio-Plex Pro Biotinylated Detection ACE2 Receptor 12016944
Bio-Plex Pro SARS-CoV-2 Neutralization Antibody Standard 12016945
Bio-Plex Pro Serology Beads Storage Buffer 12016837
Bio-Plex Pro Human SARS-CoV-2 Neutralization Antibody Reagent Kit 12017037
Bio-Plex Pro Human SARS-CoV-2 Neutralization Antibody Custom Assay Developer Kit 17007632
* Use any mixture of singleplex variant coupled beads in combination with the Bio-Plex Pro Human SARS-CoV-2 Neutralization Antibody 2-Plex Panel, or combine the coupled beads with the Bio-Plex Pro Biotinylated Detection ACE2 Receptor, SARS-CoV-2 Neutralization Antibody Standard, and Human SARS-CoV-2 Neutralization Antibody Reagent Kit.
** 12017225 comes with a vial of premixed beads with Delta RBD and Delta spike trimer plus a Delta positive control.
Performance Characteristics
SARS-CoV-2 Wild-Type and Variant Antigens
Clinical Specificity, %*n = 118
Delta n = 114
Clinical Sensitivity, %**n = 84
Delta n = 76
RBD 100 98
S1 99 98
Alpha S1 100 99
Beta S1 100 90
Gamma RBD 97 90
Delta RBD 95 99
Delta Spike Trimer 97 100
Epsilon RBD 100 95
Kappa RBD 99 93
D614G S1 100 99
E484K RBD 99 89
K417N RBD 96 99
N501Y RBD 99 99
n, number of samples run; RBD, receptor binding domain; S1, spike 1.* Clinical specificity was determined by testing 118 (and 114 for Delta) SARS-CoV-2–negative samples that were
collected earlier than December 2019.** Clinical sensitivity was determined by running 84 (and 76 for Delta) SARS-CoV-2–positive serum and plasma
samples that were confirmed to be human IgG anti–SARS-CoV-2 positive.
Performance and Assay Characteristics
Parameter Characteristic
Reactive species Human
Analytical Specificity, % analyte cross-reactivity* <5
Intra-assay precision, %CV <10
Inter-assay precision, %CV <20
Compatible sample matrices Serum, plasma
* Cross-reactivity to samples that are positive for non–SARS-CoV-2 pathogens.CV, coefficient of variation.
© 2021 Bio-Rad Laboratories, Inc.
26
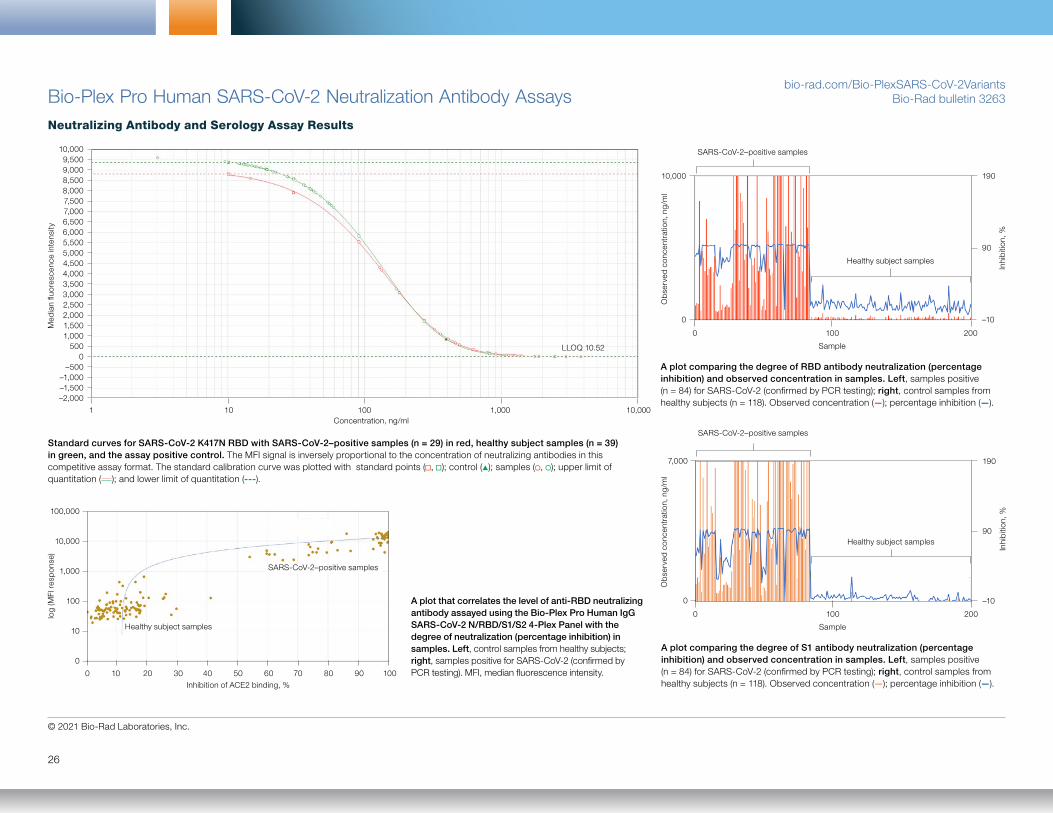
Bio-Plex Pro Human SARS-CoV-2 Neutralization Antibody Assaysbio-rad.com/Bio-PlexSARS-CoV-2Variants
Bio-Rad bulletin 3263
Neutralizing Antibody and Serology Assay Results
A plot that correlates the level of anti-RBD neutralizing antibody assayed using the Bio-Plex Pro Human IgG SARS-CoV-2 N/RBD/S1/S2 4-Plex Panel with the degree of neutralization (percentage inhibition) in samples. Left, control samples from healthy subjects; right, samples positive for SARS-CoV-2 (confirmed by PCR testing). MFI, median fluorescence intensity.
100,000
10,000
1,000
100
10
0
log
(MFI
res
pon
se)
Inhibition of ACE2 binding, %0 10 20 30 40 50 60 70 80 90 100
Healthy subject samples
SARS-CoV-2–positive samples
A plot comparing the degree of RBD antibody neutralization (percentage inhibition) and observed concentration in samples. Left, samples positive (n = 84) for SARS-CoV-2 (confirmed by PCR testing); right, control samples from healthy subjects (n = 118). Observed concentration (—); percentage inhibition (—).
10,000
0
190
90
–10
Sample
0 100 200
Ob
serv
ed c
once
ntra
tion,
ng/
ml
Inhi
biti
on, %
SARS-CoV-2–positive samples
Healthy subject samples
A plot comparing the degree of S1 antibody neutralization (percentage inhibition) and observed concentration in samples. Left, samples positive (n = 84) for SARS-CoV-2 (confirmed by PCR testing); right, control samples from healthy subjects (n = 118). Observed concentration (—); percentage inhibition (—).
7,000
0
190
90
–10
Sample
0 100 200
Ob
serv
ed c
once
ntra
tion,
ng/
ml
Inhi
biti
on, %
SARS-CoV-2–positive samples
Healthy subject samples
Standard curves for SARS-CoV-2 K417N RBD with SARS-CoV-2–positive samples (n = 29) in red, healthy subject samples (n = 39) in green, and the assay positive control. The MFI signal is inversely proportional to the concentration of neutralizing antibodies in this competitive assay format. The standard calibration curve was plotted with standard points (■, ■); control (▲); samples (●, ●); upper limit of quantitation ( ); and lower limit of quantitation (---).
10,0009,5009,0008,5008,0007,5007,0006,5006,0005,5005,0004,5004,0003,5003,0002,5002,0001,5001,000
5000
–500–1,000–1,500–2,000
Concentration, ng/ml
Med
ian
fluor
esce
nce
inte
nsity
LLOQ 10.52
1 10 100 1,000 10,000
Bulletin 6335
27
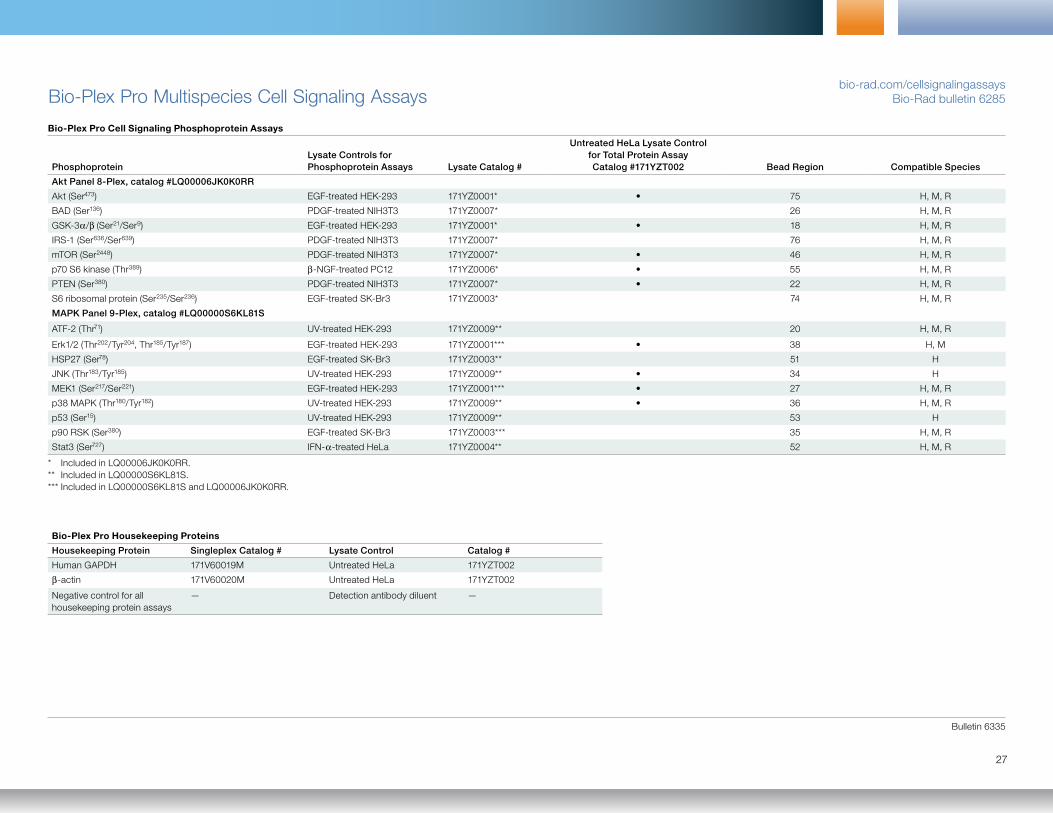
Bio-Plex Pro Multispecies Cell Signaling Assaysbio-rad.com/cellsignalingassays
Bio-Rad bulletin 6285
Bio-Plex Pro Cell Signaling Phosphoprotein Assays
PhosphoproteinLysate Controls for Phosphoprotein Assays Lysate Catalog #
Untreated HeLa Lysate Control for Total Protein Assay Catalog #171YZT002 Bead Region Compatible Species
Akt Panel 8-Plex, catalog #LQ00006JK0K0RR
Akt (Ser473) EGF-treated HEK-293 171YZ0001* • 75 H, M, R
BAD (Ser136) PDGF-treated NIH3T3 171YZ0007* 26 H, M, R
GSK-3a/b (Ser21/Ser9) EGF-treated HEK-293 171YZ0001* • 18 H, M, R
IRS-1 (Ser636/Ser639) PDGF-treated NIH3T3 171YZ0007* 76 H, M, R
mTOR (Ser2448) PDGF-treated NIH3T3 171YZ0007* • 46 H, M, R
p70 S6 kinase (Thr389) b-NGF-treated PC12 171YZ0006* • 55 H, M, R
PTEN (Ser380) PDGF-treated NIH3T3 171YZ0007* • 22 H, M, R
S6 ribosomal protein (Ser235/Ser236) EGF-treated SK-Br3 171YZ0003* 74 H, M, R
MAPK Panel 9-Plex, catalog #LQ00000S6KL81S
ATF-2 (Thr71) UV-treated HEK-293 171YZ0009** 20 H, M, R
Erk1/2 (Thr202/Tyr204, Thr185/Tyr187) EGF-treated HEK-293 171YZ0001*** • 38 H, M
HSP27 (Ser78) EGF-treated SK-Br3 171YZ0003** 51 H
JNK (Thr183/Tyr185) UV-treated HEK-293 171YZ0009** • 34 H
MEK1 (Ser217/Ser221) EGF-treated HEK-293 171YZ0001*** • 27 H, M, R
p38 MAPK (Thr180/Tyr182) UV-treated HEK-293 171YZ0009** • 36 H, M, R
p53 (Ser15) UV-treated HEK-293 171YZ0009** 53 H
p90 RSK (Ser380) EGF-treated SK-Br3 171YZ0003*** 35 H, M, R
Stat3 (Ser727) IFN-a-treated HeLa 171YZ0004** 52 H, M, R
Bio-Plex Pro Housekeeping Proteins
Housekeeping Protein Singleplex Catalog # Lysate Control Catalog #
Human GAPDH 171V60019M Untreated HeLa 171YZT002
b-actin 171V60020M Untreated HeLa 171YZT002
Negative control for all housekeeping protein assays
— Detection antibody diluent —
* Included in LQ00006JK0K0RR.** Included in LQ00000S6KL81S.*** Included in LQ00000S6KL81S and LQ00006JK0K0RR.
© 2021 Bio-Rad Laboratories, Inc.
28
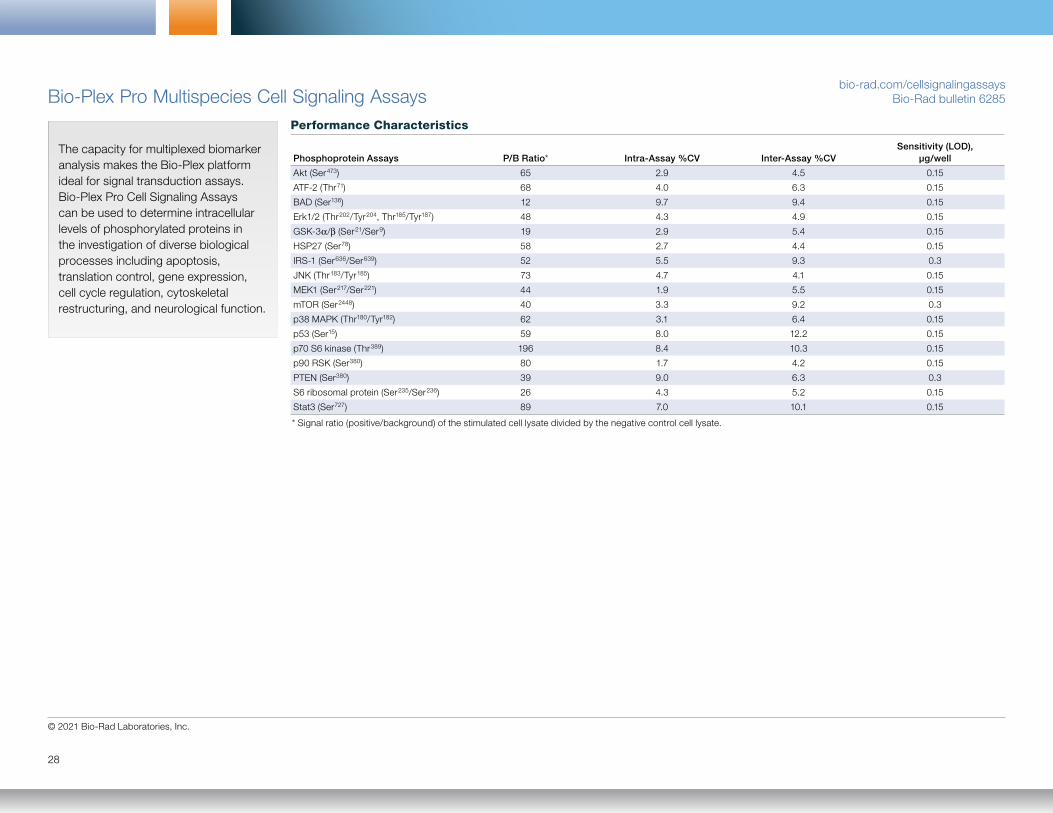
Bio-Plex Pro Multispecies Cell Signaling Assaysbio-rad.com/cellsignalingassays
Bio-Rad bulletin 6285
Performance Characteristics
Phosphoprotein Assays P/B Ratio* Intra-Assay %CV Inter-Assay %CVSensitivity (LOD),
µg/well
Akt (Ser473) 65 2.9 4.5 0.15
ATF-2 (Thr71) 68 4.0 6.3 0.15
BAD (Ser136) 12 9.7 9.4 0.15
Erk1/2 (Thr202/Tyr204, Thr185/Tyr187) 48 4.3 4.9 0.15
GSK-3a/b (Ser21/Ser9) 19 2.9 5.4 0.15
HSP27 (Ser78) 58 2.7 4.4 0.15
IRS-1 (Ser636/Ser639) 52 5.5 9.3 0.3
JNK (Thr183/Tyr185) 73 4.7 4.1 0.15
MEK1 (Ser217/Ser221) 44 1.9 5.5 0.15
mTOR (Ser2448) 40 3.3 9.2 0.3
p38 MAPK (Thr180/Tyr182) 62 3.1 6.4 0.15
p53 (Ser15) 59 8.0 12.2 0.15
p70 S6 kinase (Thr389) 196 8.4 10.3 0.15
p90 RSK (Ser380) 80 1.7 4.2 0.15
PTEN (Ser380) 39 9.0 6.3 0.3
S6 ribosomal protein (Ser235/Ser236) 26 4.3 5.2 0.15
Stat3 (Ser727) 89 7.0 10.1 0.15
The capacity for multiplexed biomarker analysis makes the Bio-Plex platform ideal for signal transduction assays. Bio-Plex Pro Cell Signaling Assays can be used to determine intracellular levels of phosphorylated proteins in the investigation of diverse biological processes including apoptosis, translation control, gene expression, cell cycle regulation, cytoskeletal restructuring, and neurological function.
* Signal ratio (positive/background) of the stimulated cell lysate divided by the negative control cell lysate.
Bulletin 6335
29
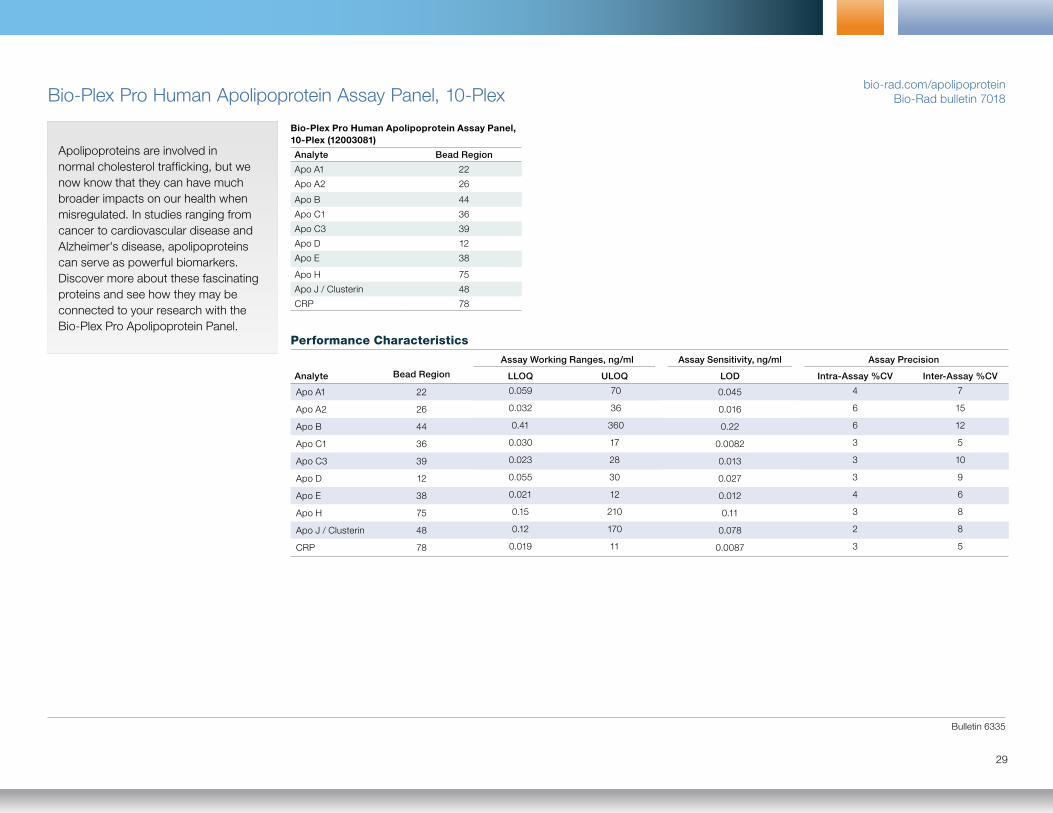
Bio-Plex Pro Human Apolipoprotein Assay Panel, 10-Plex bio-rad.com/apolipoprotein
Bio-Rad bulletin 7018
Apolipoproteins are involved in normal cholesterol trafficking, but we now know that they can have much broader impacts on our health when misregulated. In studies ranging from cancer to cardiovascular disease and Alzheimer's disease, apolipoproteins can serve as powerful biomarkers. Discover more about these fascinating proteins and see how they may be connected to your research with the Bio-Plex Pro Apolipoprotein Panel.
Bio-Plex Pro Human Apolipoprotein Assay Panel, 10-Plex (12003081)
Analyte Bead Region
Apo A1 22
Apo A2 26
Apo B 44
Apo C1 36
Apo C3 39
Apo D 12
Apo E 38
Apo H 75
Apo J / Clusterin 48
CRP 78
Performance Characteristics
Assay Working Ranges, ng/ml Assay Sensitivity, ng/ml Assay Precision
Analyte Bead Region LLOQ ULOQ LOD Intra-Assay %CV Inter-Assay %CV
Apo A1 22 0.059 70 0.045 4 7
Apo A2 26 0.032 36 0.016 6 15
Apo B 44 0.41 360 0.22 6 12
Apo C1 36 0.030 17 0.0082 3 5
Apo C3 39 0.023 28 0.013 3 10
Apo D 12 0.055 30 0.027 3 9
Apo E 38 0.021 12 0.012 4 6
Apo H 75 0.15 210 0.11 3 8
Apo J / Clusterin 48 0.12 170 0.078 2 8
CRP 78 0.019 11 0.0087 3 5

© 2021 Bio-Rad Laboratories, Inc.
30
Bio-Plex Pro Human RBM Apoptosis AssaysBio-Plex Pro RBM Apoptosis Panel 1 (171WAR1CK)
Analyte Bead Region
Bak 74
Bax 27
Lamin B, intact and 45 kD 14
Smac 19
Bio-Plex Pro RBM Apoptosis Panel 2 (171WAR2CK)
Analyte Bead Region
Bad 73
Bax / Bcl-2 dimer 42
Bcl-xL 22
Bim 12
Mcl-1 18
Bio-Plex Pro RBM Apoptosis Panel 3 (171WAR3CK)
Analyte Bead Region
Bcl-xL / Bak dimer 47
Caspase-3, active 57
Mcl-1 / Bak dimer 54
Survivin 20
Performance Characteristics
Assay Working Ranges, ng/ml
Assay Sensitivity, ng/ml Assay Precision
Analyte Bead Region LLOQ ULOQ LOD Intra-Assay %CV Inter-Assay %CV
Panel 1
Bak 74 0.43 630 0.18 6% 14%Bax 27 0.25 255 0.26 10% 19%Lamin B, intact and 45 kD 14 0.057 95 0.044 5% 14%Smac 19 0.16 165 0.075 8% 19%
Panel 2
Bad 73 0.27 200 0.18 5% 9%Bax / Bcl-2 dimer 42 0.47 1020 0.47 7% 9%Bcl-xL 22 0.070 30 0.046 4% 7%Bim 12 0.014 16 0.015 4% 8%Mcl-1 18 0.10 180 0.10 6% 6%
Panel 3
Bcl-xL / Bak dimer 47 0.081 45 0.021 5% 14%Caspase-3, active 57 0.039 50 0.023 6% 8%Mcl-1 / Bak dimer 54 0.33 600 0.27 8% 13%Survivin 20 0.056 50 0.023 6% 8%
Use the Bio-Plex Pro RBM Apoptosis Multiplex Assays for the detection of a highly relevant set of intracellular proteins involved in the commitment, onset, and induction of apoptosis by the intrinsic pathway.
bio-rad.com/apoptosisassaysBio-Rad bulletin 6474
Bulletin 6335
31
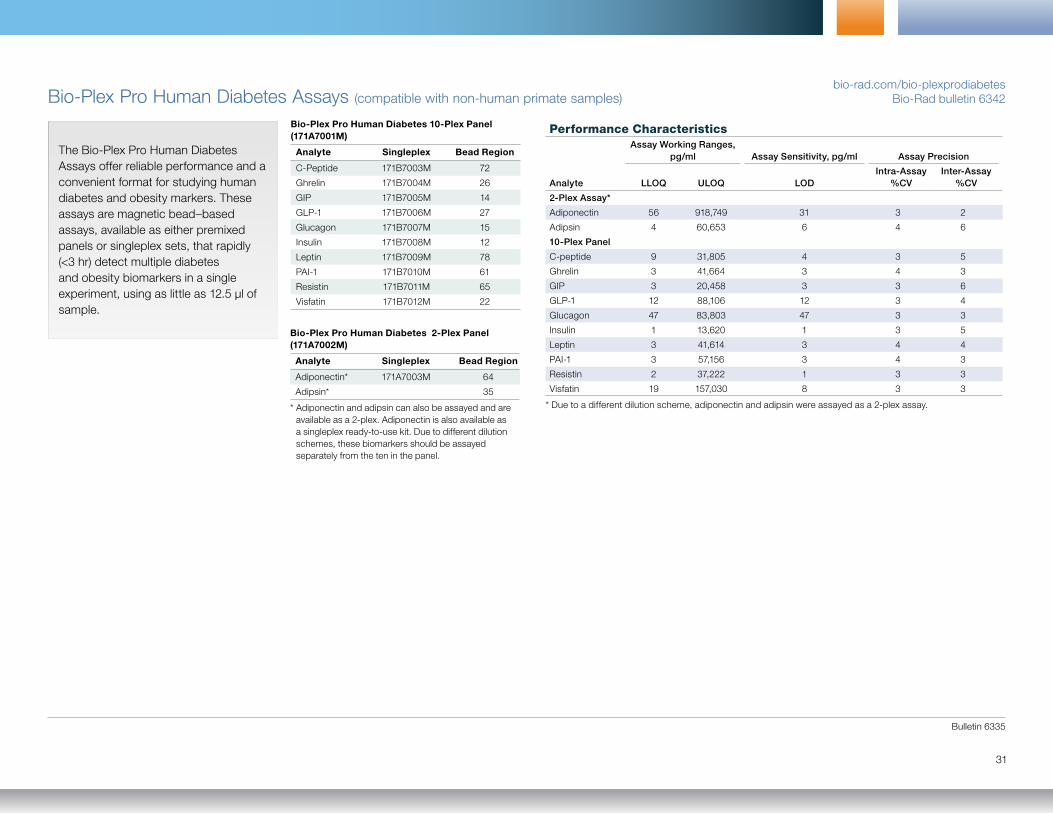
Bio-Plex Pro Human Diabetes Assays (compatible with non-human primate samples)
Bio-Plex Pro Human Diabetes 10-Plex Panel (171A7001M)
Analyte Singleplex Bead Region
C-Peptide 171B7003M 72
Ghrelin 171B7004M 26
GIP 171B7005M 14
GLP-1 171B7006M 27
Glucagon 171B7007M 15
Insulin 171B7008M 12
Leptin 171B7009M 78
PAI-1 171B7010M 61
Resistin 171B7011M 65
Visfatin 171B7012M 22
Bio-Plex Pro Human Diabetes 2-Plex Panel (171A7002M)
Analyte Singleplex Bead Region
Adiponectin* 171A7003M 64
Adipsin* 35
* Adiponectin and adipsin can also be assayed and are available as a 2-plex. Adiponectin is also available as a singleplex ready-to-use kit. Due to different dilution schemes, these biomarkers should be assayed separately from the ten in the panel.
bio-rad.com/bio-plexprodiabetesBio-Rad bulletin 6342
The Bio-Plex Pro Human Diabetes Assays offer reliable performance and a convenient format for studying human diabetes and obesity markers. These assays are magnetic bead–based assays, available as either premixed panels or singleplex sets, that rapidly (<3 hr) detect multiple diabetes and obesity biomarkers in a single experiment, using as little as 12.5 μl of sample.
Performance CharacteristicsAssay Working Ranges,
pg/ml Assay Sensitivity, pg/ml Assay Precision
Analyte LLOQ ULOQ LODIntra-Assay
%CVInter-Assay
%CV
2-Plex Assay*
Adiponectin 56 918,749 31 3 2
Adipsin 4 60,653 6 4 6
10-Plex Panel
C-peptide 9 31,805 4 3 5
Ghrelin 3 41,664 3 4 3
GIP 3 20,458 3 3 6
GLP-1 12 88,106 12 3 4
Glucagon 47 83,803 47 3 3
Insulin 1 13,620 1 3 5
Leptin 3 41,614 3 4 4
PAI-1 3 57,156 3 4 3
Resistin 2 37,222 1 3 3
Visfatin 19 157,030 8 3 3
* Due to a different dilution scheme, adiponectin and adipsin were assayed as a 2-plex assay.
© 2021 Bio-Rad Laboratories, Inc.
32
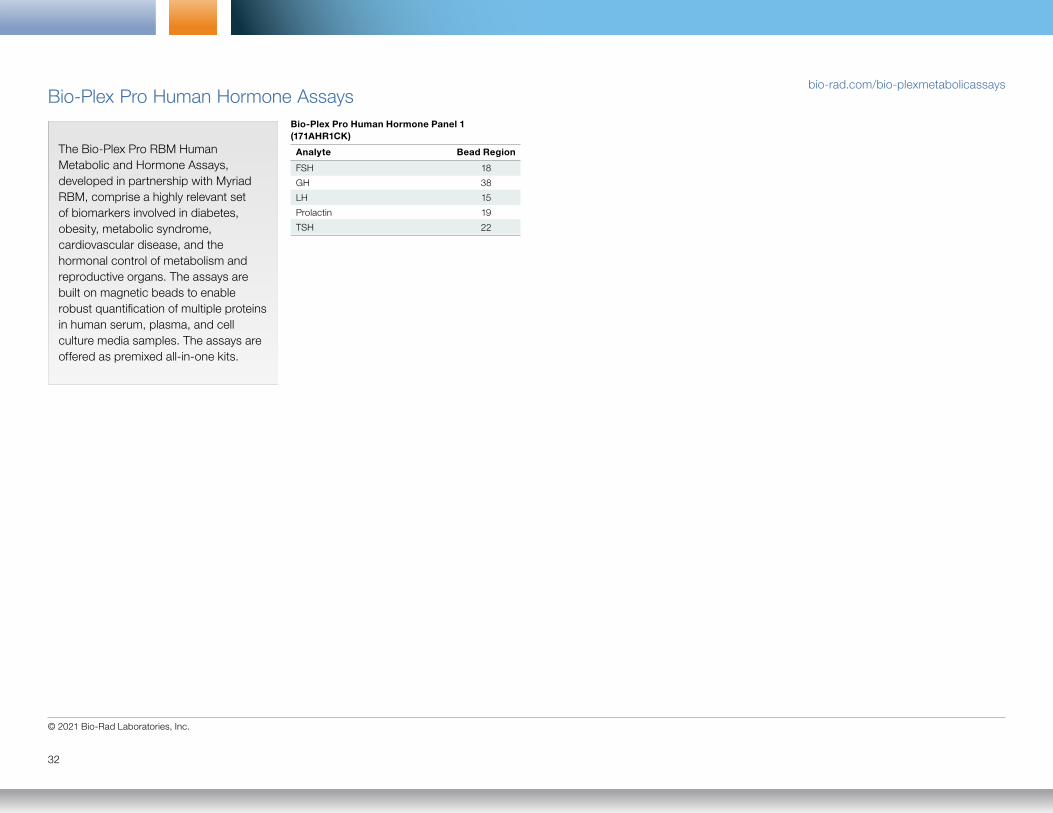
Bio-Plex Pro Human Hormone Assaysbio-rad.com/bio-plexmetabolicassays
Bio-Plex Pro Human Hormone Panel 1 (171AHR1CK)
Analyte Bead Region
FSH 18
GH 38
LH 15
Prolactin 19
TSH 22
The Bio-Plex Pro RBM Human Metabolic and Hormone Assays, developed in partnership with Myriad RBM, comprise a highly relevant set of biomarkers involved in diabetes, obesity, metabolic syndrome, cardiovascular disease, and the hormonal control of metabolism and reproductive organs. The assays are built on magnetic beads to enable robust quantification of multiple proteins in human serum, plasma, and cell culture media samples. The assays are offered as premixed all-in-one kits.
Bulletin 6335
33
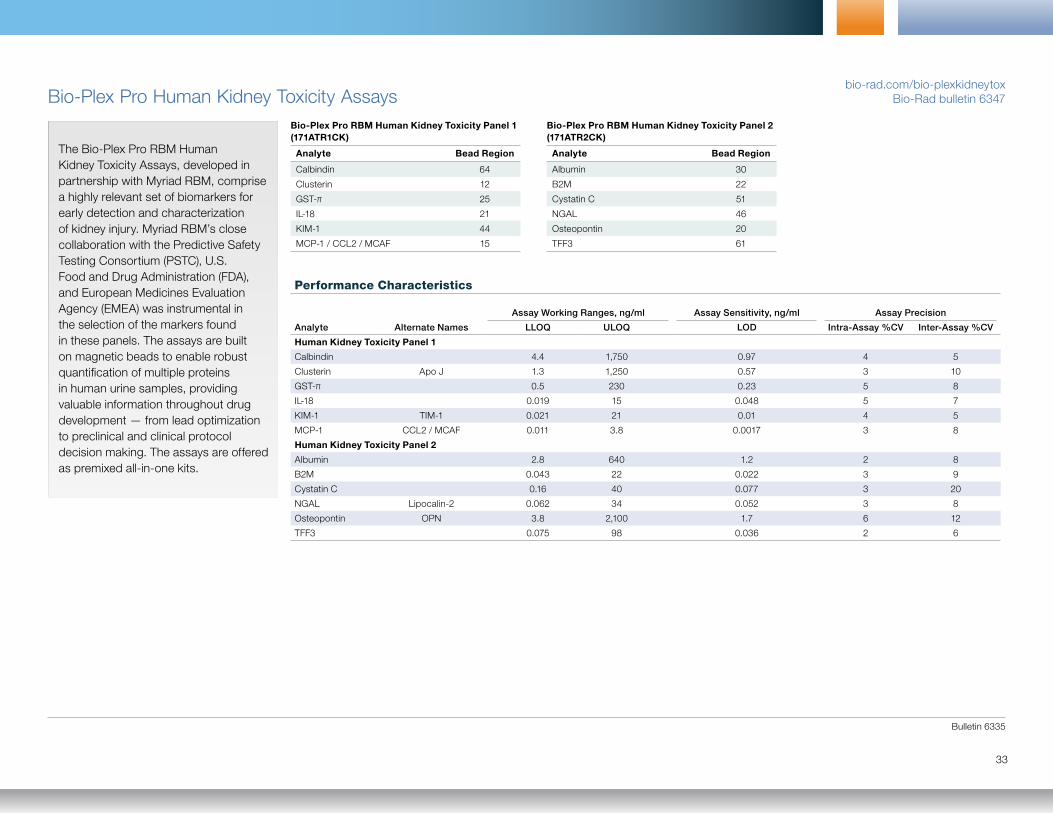
Bio-Plex Pro Human Kidney Toxicity AssaysBio-Plex Pro RBM Human Kidney Toxicity Panel 1 (171ATR1CK)
Analyte Bead Region
Calbindin 64
Clusterin 12
GST-π 25
IL-18 21
KIM-1 44
MCP-1 / CCL2 / MCAF 15
Bio-Plex Pro RBM Human Kidney Toxicity Panel 2 (171ATR2CK)
Analyte Bead Region
Albumin 30
B2M 22
Cystatin C 51
NGAL 46
Osteopontin 20
TFF3 61
bio-rad.com/bio-plexkidneytoxBio-Rad bulletin 6347
The Bio-Plex Pro RBM Human Kidney Toxicity Assays, developed in partnership with Myriad RBM, comprise a highly relevant set of biomarkers for early detection and characterization of kidney injury. Myriad RBM’s close collaboration with the Predictive Safety Testing Consortium (PSTC), U.S. Food and Drug Administration (FDA), and European Medicines Evaluation Agency (EMEA) was instrumental in the selection of the markers found in these panels. The assays are built on magnetic beads to enable robust quantification of multiple proteins in human urine samples, providing valuable information throughout drug development — from lead optimization to preclinical and clinical protocol decision making. The assays are offered as premixed all-in-one kits.
Performance Characteristics
Assay Working Ranges, ng/ml Assay Sensitivity, ng/ml Assay Precision
Analyte Alternate Names LLOQ ULOQ LOD Intra-Assay %CV Inter-Assay %CV
Human Kidney Toxicity Panel 1
Calbindin 4.4 1,750 0.97 4 5
Clusterin Apo J 1.3 1,250 0.57 3 10
GST-π 0.5 230 0.23 5 8
IL-18 0.019 15 0.048 5 7
KIM-1 TIM-1 0.021 21 0.01 4 5
MCP-1 CCL2 / MCAF 0.011 3.8 0.0017 3 8
Human Kidney Toxicity Panel 2
Albumin 2.8 640 1.2 2 8
B2M 0.043 22 0.022 3 9
Cystatin C 0.16 40 0.077 3 20
NGAL Lipocalin-2 0.062 34 0.052 3 8
Osteopontin OPN 3.8 2,100 1.7 6 12
TFF3 0.075 98 0.036 2 6
© 2021 Bio-Rad Laboratories, Inc.
34
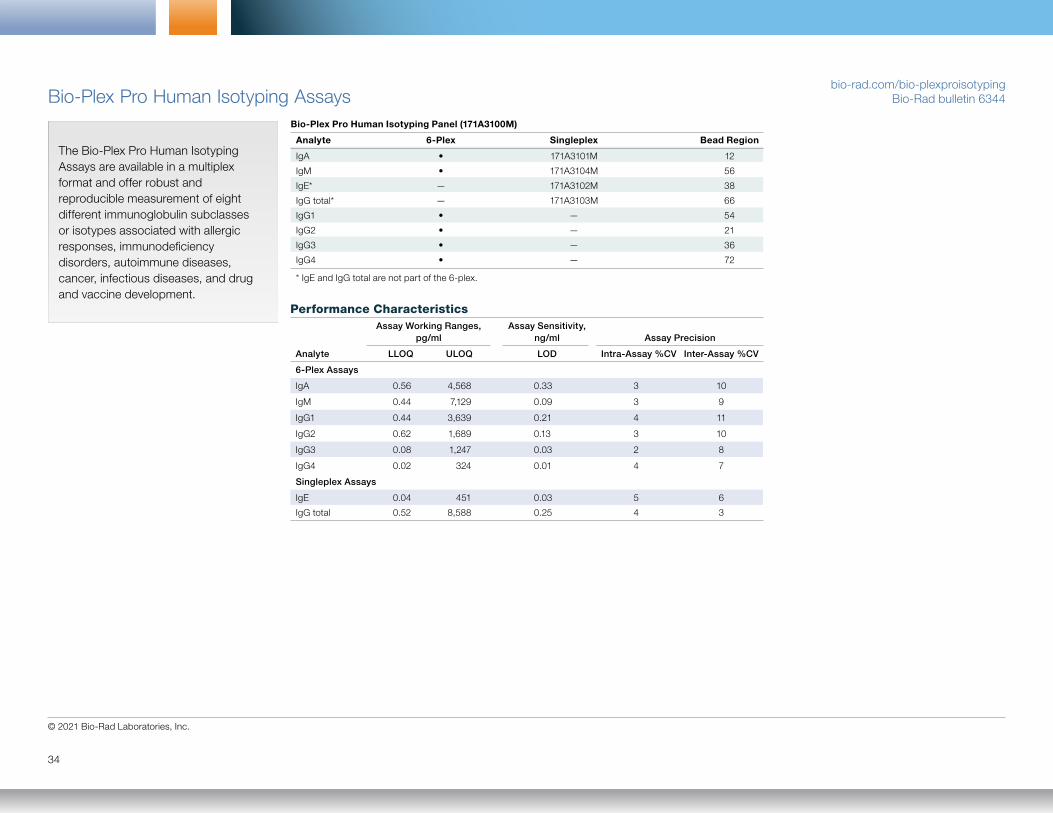
Bio-Plex Pro Human Isotyping AssaysBio-Plex Pro Human Isotyping Panel (171A3100M)
Analyte 6-Plex Singleplex Bead Region
IgA • 171A3101M 12
IgM • 171A3104M 56
IgE* — 171A3102M 38
IgG total* — 171A3103M 66
IgG1 • — 54
IgG2 • — 21
IgG3 • — 36
IgG4 • — 72
* IgE and IgG total are not part of the 6-plex.
Performance Characteristics Assay Working Ranges, Assay Sensitivity, pg/ml ng/ml Assay Precision
Analyte LLOQ ULOQ LOD Intra-Assay %CV Inter-Assay %CV
6-Plex Assays
IgA 0.56 4,568 0.33 3 10
IgM 0.44 7,129 0.09 3 9
IgG1 0.44 3,639 0.21 4 11
IgG2 0.62 1,689 0.13 3 10
IgG3 0.08 1,247 0.03 2 8
IgG4 0.02 324 0.01 4 7
Singleplex Assays
IgE 0.04 451 0.03 5 6
IgG total 0.52 8,588 0.25 4 3
bio-rad.com/bio-plexproisotypingBio-Rad bulletin 6344
The Bio-Plex Pro Human Isotyping Assays are available in a multiplex format and offer robust and reproducible measurement of eight different immunoglobulin subclasses or isotypes associated with allergic responses, immunodeficiency disorders, autoimmune diseases, cancer, infectious diseases, and drug and vaccine development.

Bulletin 6335
35
Bio-Plex Pro Human Acute Phase AssaysBio-Plex Pro Human Acute Phase 4-Plex Panel (171A4C09M)
Analyte Bead Region
CRP 81
Haptoglobin 79
a-2-macroglobin 92
Serum amyloid P (SAP) 98
Performance Characteristics Assay Working Assay Range, ng/ml Sensitivity, ng/ml Dynamic
Analyte LLOQ ULOQQ LOD Ranges,* ng/ml WHO/NIBSC 1 IU = x ng**
CRP 0.01 50 0.004 0.01–125 85/506 3.0 x 10⁶
Haptoglobin 0.1 500 0.07 0.03–500 — —
a-2-macroglobulin 0.5 1,875 0.25 0.5–7,500 — —
SAP 0.1 250 0.063 0.02–250 — —
* Standard curve ranges.** IU, international units.
bio-rad.com/bio-plexproacutephaseBio-Rad bulletin 5650
Disease research involving the study of inflammation, sepsis, cardiovascular disease, and diabetes often requires the measurement of multiple acute phase biomarkers. Bio-Plex Pro Human Acute Phase Assays deliver accurate and reproducible measurements of nine of the most commonly measured biomarkers.
© 2021 Bio-Rad Laboratories, Inc.
36
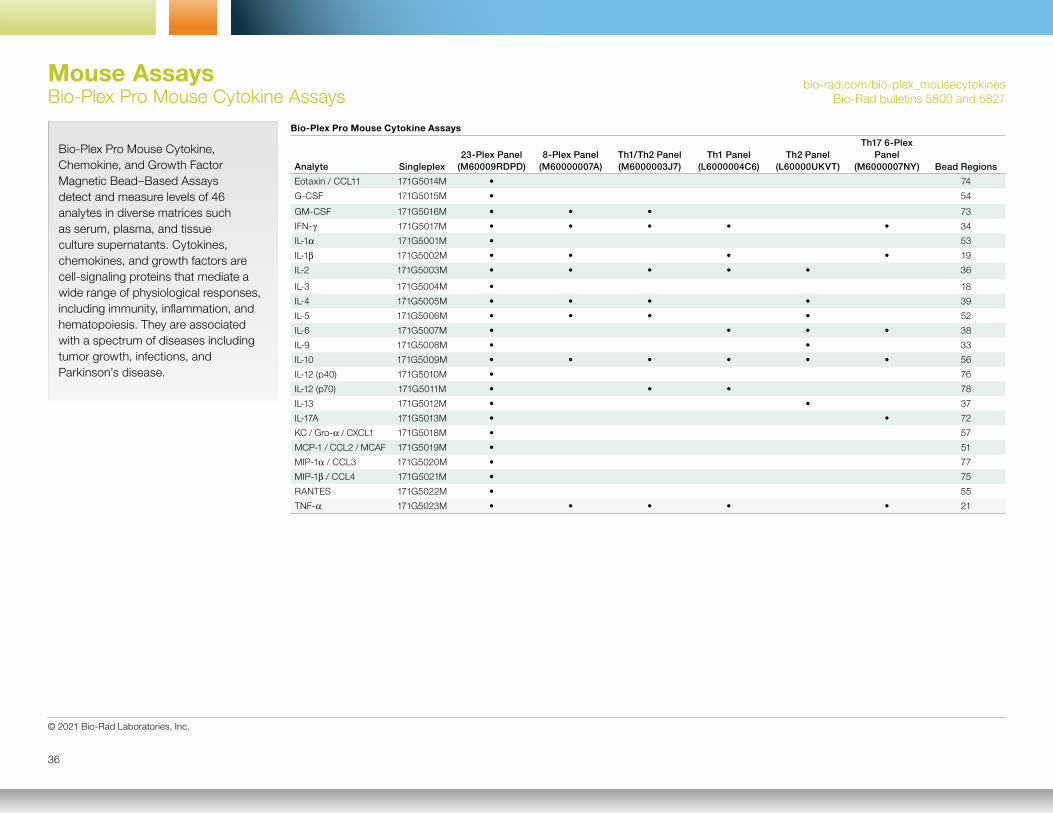
Bio-Plex Pro Mouse Cytokine AssaysMouse Assays
bio-rad.com/bio-plex_mousecytokines Bio-Rad bulletins 5800 and 5827
Bio-Plex Pro Mouse Cytokine, Chemokine, and Growth Factor Magnetic Bead–Based Assays detect and measure levels of 46 analytes in diverse matrices such as serum, plasma, and tissue culture supernatants. Cytokines, chemokines, and growth factors are cell-signaling proteins that mediate a wide range of physiological responses, including immunity, inflammation, and hematopoiesis. They are associated with a spectrum of diseases including tumor growth, infections, and Parkinson’s disease.
Bio-Plex Pro Mouse Cytokine Assays
Analyte Singleplex23-Plex Panel
(M60009RDPD)8-Plex Panel
(M60000007A)Th1/Th2 Panel (M6000003J7)
Th1 Panel (L6000004C6)
Th2 Panel (L60000UKVT)
Th17 6-Plex Panel
(M6000007NY) Bead Regions
Eotaxin / CCL11 171G5014M • 74
G-CSF 171G5015M • 54
GM-CSF 171G5016M • • • 73
IFN-g 171G5017M • • • • • 34
IL-1a 171G5001M • 53
IL-1b 171G5002M • • • • 19
IL-2 171G5003M • • • • • 36
IL-3 171G5004M • 18
IL-4 171G5005M • • • • 39
IL-5 171G5006M • • • • 52
IL-6 171G5007M • • • • 38
IL-9 171G5008M • • 33
IL-10 171G5009M • • • • • • 56
IL-12 (p40) 171G5010M • 76
IL-12 (p70) 171G5011M • • • 78
IL-13 171G5012M • • 37
IL-17A 171G5013M • • 72
KC / Gro-a / CXCL1 171G5018M • 57
MCP-1 / CCL2 / MCAF 171G5019M • 51
MIP-1a / CCL3 171G5020M • 77
MIP-1b / CCL4 171G5021M • 75
RANTES 171G5022M • 55
TNF-a 171G5023M • • • • • 21
Bulletin 6335
37
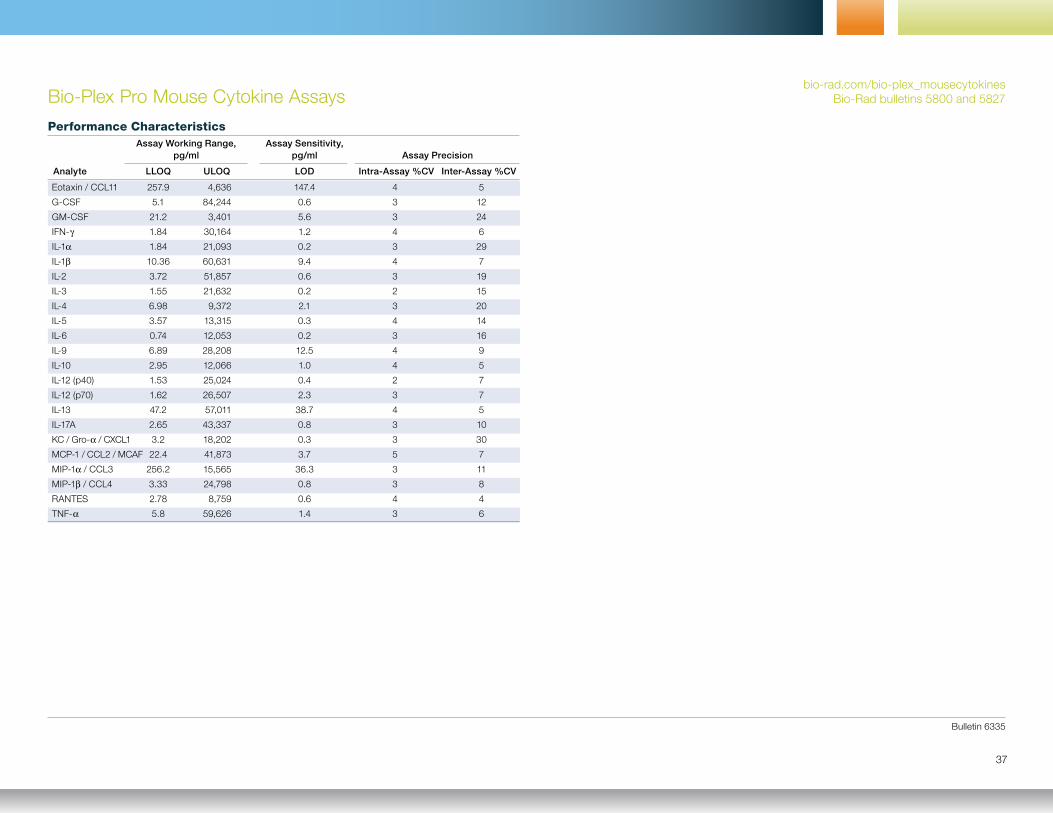
Bio-Plex Pro Mouse Cytokine Assays
Performance Characteristics Assay Working Range, Assay Sensitivity, pg/ml pg/ml Assay Precision
Analyte LLOQ ULOQ LOD Intra-Assay %CV Inter-Assay %CV
Eotaxin / CCL11 257.9 4,636 147.4 4 5
G-CSF 5.1 84,244 0.6 3 12
GM-CSF 21.2 3,401 5.6 3 24
IFN-g 1.84 30,164 1.2 4 6
IL-1a 1.84 21,093 0.2 3 29
IL-1b 10.36 60,631 9.4 4 7
IL-2 3.72 51,857 0.6 3 19
IL-3 1.55 21,632 0.2 2 15
IL-4 6.98 9,372 2.1 3 20
IL-5 3.57 13,315 0.3 4 14
IL-6 0.74 12,053 0.2 3 16
IL-9 6.89 28,208 12.5 4 9
IL-10 2.95 12,066 1.0 4 5
IL-12 (p40) 1.53 25,024 0.4 2 7
IL-12 (p70) 1.62 26,507 2.3 3 7
IL-13 47.2 57,011 38.7 4 5
IL-17A 2.65 43,337 0.8 3 10
KC / Gro-a / CXCL1 3.2 18,202 0.3 3 30
MCP-1 / CCL2 / MCAF 22.4 41,873 3.7 5 7
MIP-1a / CCL3 256.2 15,565 36.3 3 11
MIP-1b / CCL4 3.33 24,798 0.8 3 8
RANTES 2.78 8,759 0.6 4 4
TNF-a 5.8 59,626 1.4 3 6
bio-rad.com/bio-plex_mousecytokinesBio-Rad bulletins 5800 and 5827
© 2021 Bio-Rad Laboratories, Inc.
38
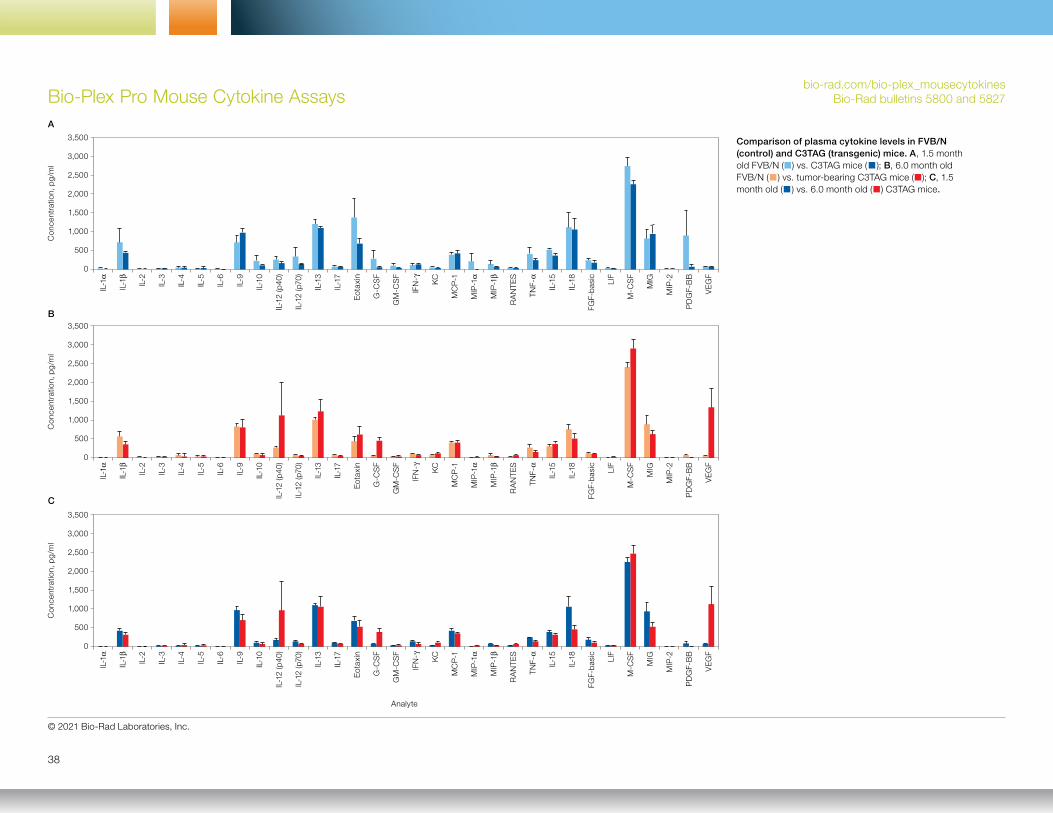
Comparison of plasma cytokine levels in FVB/N (control) and C3TAG (transgenic) mice. A, 1.5 month old FVB/N (■) vs. C3TAG mice (■ ); B, 6.0 month old FVB/N (■ ) vs. tumor-bearing C3TAG mice (■); C, 1.5 month old (■ ) vs. 6.0 month old (■ ) C3TAG mice.
A
Con
cent
ratio
n, p
g/m
l
3,500
3,000
2,500
2,000
1,500
1,000
500
0
IL-1
a
IL-1
b
IL-2
IL-3
IL-5
IL-6
IL-9
IL-1
0
IL-1
2 (p
40)
IL-1
2 (p
70)
IL-1
3
IL-1
7
Eot
axin
G-C
SF
GM
-CS
F
IFN
-g KC
MC
P-1
MIP
-1a
MIP
-1b
TNF-
a
IL-1
8
LIF
MIG
RA
NTE
S
IL-1
5
FGF-
bas
icFG
F-b
asic
FGF-
bas
ic
M-C
SF
MIP
-2
PD
GF-
BB
PD
GF-
BB
PD
GF-
BB
IL-4
VE
GF
B
C
Con
cent
ratio
n, p
g/m
l
IL-1
a
IL-1
b
IL-2
IL-3
IL-5
IL-6
IL-9
IL-1
0
IL-1
2 (p
40)
IL-1
2 (p
70)
IL-1
3
IL-1
7
Eot
axin
G-C
SF
GM
-CS
F
IFN
-g KC
MC
P-1
MIP
-1a
MIP
-1b
TNF-
a
IL-1
8
LIF
MIG
RA
NTE
S
IL-1
5
M-C
SF
MIP
-2
IL-4
VE
GF
Con
cent
ratio
n, p
g/m
l
3,500
3,000
2,500
2,000
1,500
1,000
500
0
Analyte
IL-1
a
IL-1
b
IL-2
IL-3
IL-5
IL-6
IL-9
IL-1
0
IL-1
2 (p
40)
IL-1
2 (p
70)
IL-1
3
IL-1
7
Eot
axin
G-C
SF
GM
-CS
F
IFN
-g KC
MC
P-1
MIP
-1a
MIP
-1b
TNF-
a
IL-1
8
LIF
MIG
RA
NTE
S
IL-1
5
M-C
SF
MIP
-2
IL-4
VE
GF
3,500
3,000
2,500
2,000
1,500
1,000
500
0
Bio-Plex Pro Mouse Cytokine Assaysbio-rad.com/bio-plex_mousecytokines
Bio-Rad bulletins 5800 and 5827
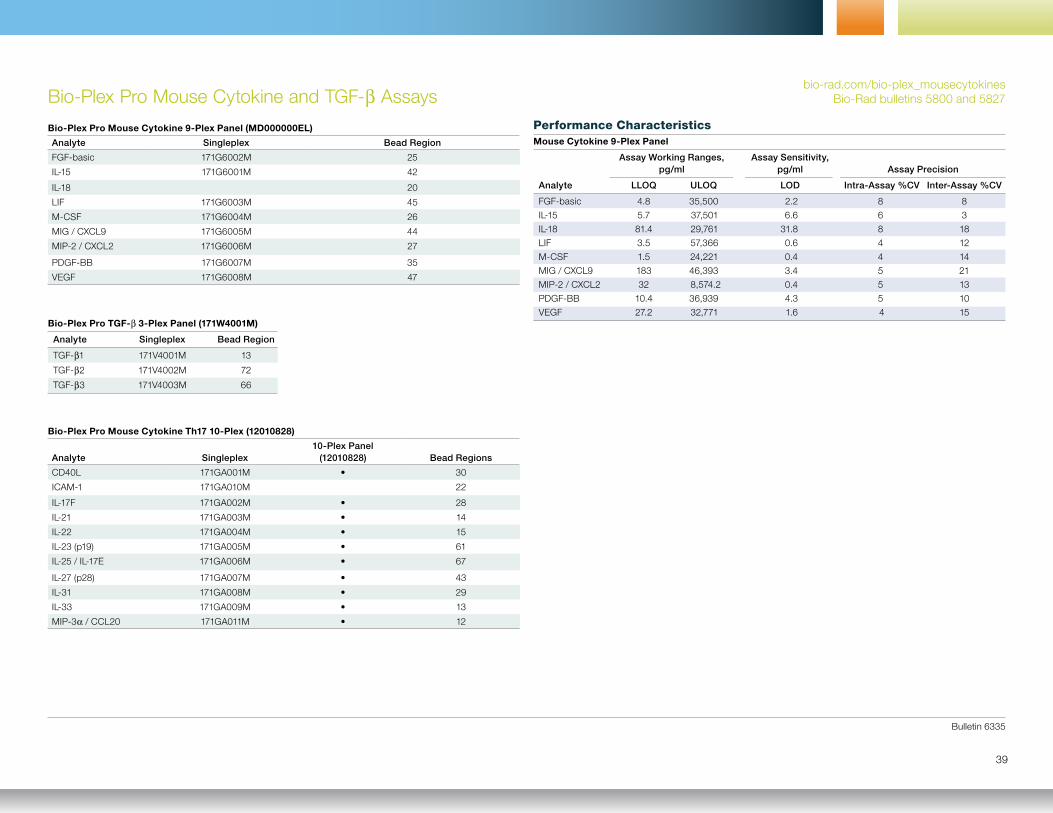
Bio-Plex Pro Mouse Cytokine and TGF-b AssaysPerformance CharacteristicsMouse Cytokine 9-Plex Panel
Assay Working Ranges, Assay Sensitivity, pg/ml pg/ml Assay Precision
Analyte LLOQ ULOQ LOD Intra-Assay %CV Inter-Assay %CV
FGF-basic 4.8 35,500 2.2 8 8
IL-15 5.7 37,501 6.6 6 3
IL-18 81.4 29,761 31.8 8 18
LIF 3.5 57,366 0.6 4 12
M-CSF 1.5 24,221 0.4 4 14
MIG / CXCL9 183 46,393 3.4 5 21
MIP-2 / CXCL2 32 8,574.2 0.4 5 13
PDGF-BB 10.4 36,939 4.3 5 10
VEGF 27.2 32,771 1.6 4 15
bio-rad.com/bio-plex_mousecytokinesBio-Rad bulletins 5800 and 5827
Bio-Plex Pro Mouse Cytokine Th17 10-Plex (12010828)
Analyte Singleplex10-Plex Panel
(12010828) Bead Regions
CD40L 171GA001M • 30
ICAM-1 171GA010M 22
IL-17F 171GA002M • 28
IL-21 171GA003M • 14
IL-22 171GA004M • 15
IL-23 (p19) 171GA005M • 61
IL-25 / IL-17E 171GA006M • 67
IL-27 (p28) 171GA007M • 43
IL-31 171GA008M • 29
IL-33 171GA009M • 13
MIP-3a / CCL20 171GA011M • 12
Bio-Plex Pro Mouse Cytokine 9-Plex Panel (MD000000EL)
Analyte Singleplex Bead Region
FGF-basic 171G6002M 25
IL-15 171G6001M 42
IL-18 20
LIF 171G6003M 45
M-CSF 171G6004M 26
MIG / CXCL9 171G6005M 44
MIP-2 / CXCL2 171G6006M 27
PDGF-BB 171G6007M 35
VEGF 171G6008M 47
Bio-Plex Pro TGF-b 3-Plex Panel (171W4001M)
Analyte Singleplex Bead Region
TGF-b1 171V4001M 13
TGF-b2 171V4002M 72
TGF-b3 171V4003M 66
Bulletin 6335
39
© 2021 Bio-Rad Laboratories, Inc.
40
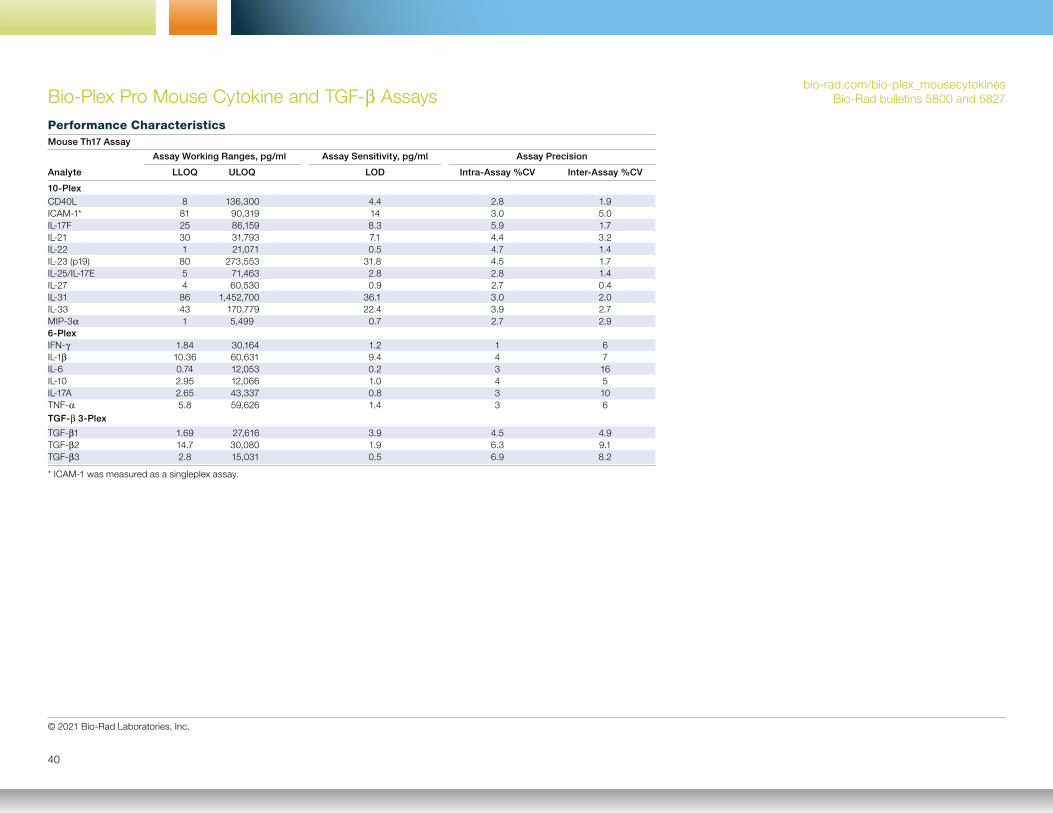
Bio-Plex Pro Mouse Cytokine and TGF-b AssaysPerformance Characteristics
bio-rad.com/bio-plex_mousecytokinesBio-Rad bulletins 5800 and 5827
Assay Working Ranges, pg/ml Assay Sensitivity, pg/ml Assay Precision
Analyte LLOQ ULOQ LOD Intra-Assay %CV Inter-Assay %CV
10-Plex CD40L 8 136,300 4.4 2.8 1.9ICAM-1* 81 90,319 14 3.0 5.0IL-17F 25 86,159 8.3 5.9 1.7IL-21 30 31,793 7.1 4.4 3.2IL-22 1 21,071 0.5 4.7 1.4IL-23 (p19) 80 273,553 31.8 4.5 1.7IL-25/IL-17E 5 71,463 2.8 2.8 1.4IL-27 4 60,530 0.9 2.7 0.4IL-31 86 1,452,700 36.1 3.0 2.0IL-33 43 170,779 22.4 3.9 2.7MIP-3a 1 5,499 0.7 2.7 2.96-Plex IFN-g 1.84 30,164 1.2 1 6IL-1b 10.36 60,631 9.4 4 7IL-6 0.74 12,053 0.2 3 16IL-10 2.95 12,066 1.0 4 5IL-17A 2.65 43,337 0.8 3 10TNF-a 5.8 59,626 1.4 3 6TGF-b 3-Plex
TGF-b1 1.69 27,616 3.9 4.5 4.9TGF-b2 14.7 30,080 1.9 6.3 9.1TGF-b3 2.8 15,031 0.5 6.9 8.2
Mouse Th17 Assay
* ICAM-1 was measured as a singleplex assay.
Bio-Plex Pro Mouse Chemokine Assays bio-rad.com/bio-plex_mousecytokines
Bio-Rad bulletin 7050
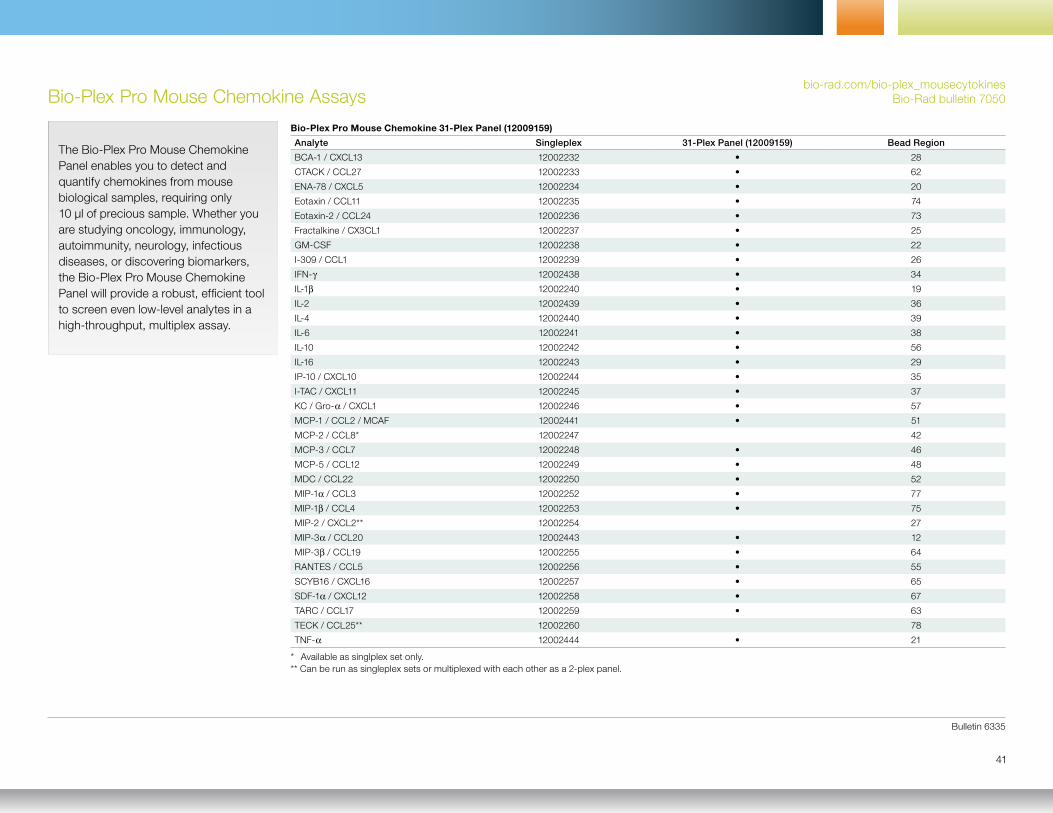
Bio-Plex Pro Mouse Chemokine 31-Plex Panel (12009159)
Analyte Singleplex 31-Plex Panel (12009159) Bead Region
BCA-1 / CXCL13 12002232 • 28
CTACK / CCL27 12002233 • 62
ENA-78 / CXCL5 12002234 • 20
Eotaxin / CCL11 12002235 • 74
Eotaxin-2 / CCL24 12002236 • 73
Fractalkine / CX3CL1 12002237 • 25
GM-CSF 12002238 • 22
I-309 / CCL1 12002239 • 26
IFN-g 12002438 • 34
IL-1b 12002240 • 19
IL-2 12002439 • 36
IL-4 12002440 • 39
IL-6 12002241 • 38
IL-10 12002242 • 56
IL-16 12002243 • 29
IP-10 / CXCL10 12002244 • 35
I-TAC / CXCL11 12002245 • 37
KC / Gro-a / CXCL1 12002246 • 57
MCP-1 / CCL2 / MCAF 12002441 • 51
MCP-2 / CCL8* 12002247 42
MCP-3 / CCL7 12002248 • 46
MCP-5 / CCL12 12002249 • 48
MDC / CCL22 12002250 • 52
MIP-1a / CCL3 12002252 • 77
MIP-1b / CCL4 12002253 • 75
MIP-2 / CXCL2** 12002254 27
MIP-3a / CCL20 12002443 • 12
MIP-3b / CCL19 12002255 • 64
RANTES / CCL5 12002256 • 55
SCYB16 / CXCL16 12002257 • 65
SDF-1a / CXCL12 12002258 • 67
TARC / CCL17 12002259 • 63
TECK / CCL25** 12002260 78
TNF-a 12002444 • 21
* Available as singlplex set only.** Can be run as singleplex sets or multiplexed with each other as a 2-plex panel.
Bulletin 6335
41
The Bio-Plex Pro Mouse Chemokine Panel enables you to detect and quantify chemokines from mouse biological samples, requiring only 10 µl of precious sample. Whether you are studying oncology, immunology, autoimmunity, neurology, infectious diseases, or discovering biomarkers, the Bio-Plex Pro Mouse Chemokine Panel will provide a robust, efficient tool to screen even low-level analytes in a high-throughput, multiplex assay.
© 2021 Bio-Rad Laboratories, Inc.
42
Bio-Plex Pro Mouse Chemokine Assays bio-rad.com/bio-plex_mousecytokines
Bio-Rad bulletin 7050
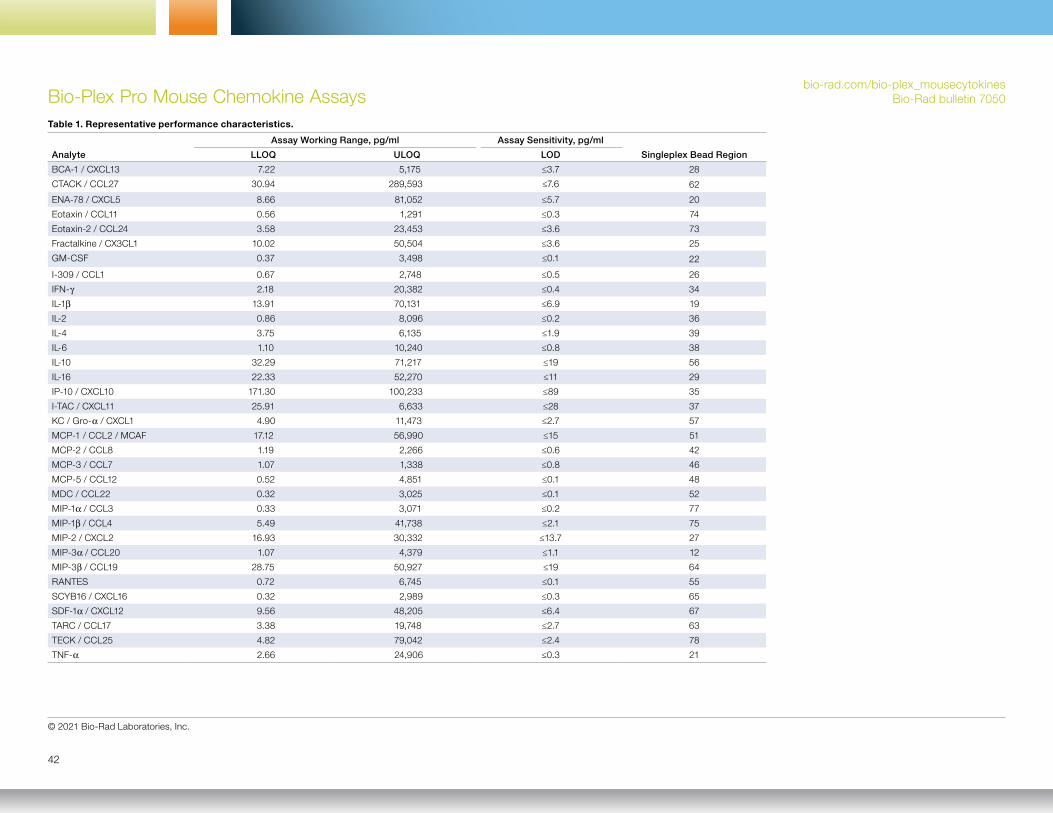
Table 1. Representative performance characteristics.
Assay Working Range, pg/ml Assay Sensitivity, pg/ml
Singleplex Bead RegionAnalyte LLOQ ULOQ LOD
BCA-1 / CXCL13 7.22 5,175 ≤3.7 28
CTACK / CCL27 30.94 289,593 ≤7.6 62
ENA-78 / CXCL5 8.66 81,052 ≤5.7 20
Eotaxin / CCL11 0.56 1,291 ≤0.3 74
Eotaxin-2 / CCL24 3.58 23,453 ≤3.6 73
Fractalkine / CX3CL1 10.02 50,504 ≤3.6 25
GM-CSF 0.37 3,498 ≤0.1 22
I-309 / CCL1 0.67 2,748 ≤0.5 26
IFN-g 2.18 20,382 ≤0.4 34
IL-1b 13.91 70,131 ≤6.9 19
IL-2 0.86 8,096 ≤0.2 36
IL-4 3.75 6,135 ≤1.9 39
IL-6 1.10 10,240 ≤0.8 38
IL-10 32.29 71,217 ≤19 56
IL-16 22.33 52,270 ≤11 29
IP-10 / CXCL10 171.30 100,233 ≤89 35
I-TAC / CXCL11 25.91 6,633 ≤28 37
KC / Gro-a / CXCL1 4.90 11,473 ≤2.7 57
MCP-1 / CCL2 / MCAF 17.12 56,990 ≤15 51
MCP-2 / CCL8 1.19 2,266 ≤0.6 42
MCP-3 / CCL7 1.07 1,338 ≤0.8 46
MCP-5 / CCL12 0.52 4,851 ≤0.1 48
MDC / CCL22 0.32 3,025 ≤0.1 52
MIP-1a / CCL3 0.33 3,071 ≤0.2 77
MIP-1b / CCL4 5.49 41,738 ≤2.1 75
MIP-2 / CXCL2 16.93 30,332 ≤13.7 27
MIP-3a / CCL20 1.07 4,379 ≤1.1 12
MIP-3b / CCL19 28.75 50,927 ≤19 64
RANTES 0.72 6,745 ≤0.1 55
SCYB16 / CXCL16 0.32 2,989 ≤0.3 65
SDF-1a / CXCL12 9.56 48,205 ≤6.4 67
TARC / CCL17 3.38 19,748 ≤2.7 63
TECK / CCL25 4.82 79,042 ≤2.4 78
TNF-a 2.66 24,906 ≤0.3 21
Bulletin 6335
43
Bio-Plex Pro Mouse Chemokine Assays bio-rad.com/bio-plex_mousecytokines
Bio-Rad bulletin 7050
Num
ber
of s
amp
les
det
ecte
dN
umb
er o
f sam
ple
s d
etec
ted
10
9
8
7
6
5
4
3
2
1
0
7
6
5
4
3
2
1
0
GM-CSF
GM-CSF
IL-6
IL-6
MCP-1 / CCL2
MCP-1 / CCL2
IL-2
IL-2
MIP-2 / CXCL2
MIP-2 / CXCL2
RANTES
RANTES
IL-1b
IL-1b
KC / GRO-a / C
XCL1
KC / GRO-a / C
XCL1
MDC / CCL22
MDC / CCL22
MIP-3a / CCL20
MIP-3a / CCL20
IL-4
IL-4
IFN-g
IFN-g
MIP-1a / CCL3
MIP-1a / CCL3
TNF-a
TNF-a
SDF-1a / C
XCL12
SDF-1a / C
XCL12
IL-10
IL-10
MIP-1b / CCL4
MIP-1b / CCL4
Eotaxin / C
CL11
Eotaxin / C
CL11
A
B
Analyte
Analyte
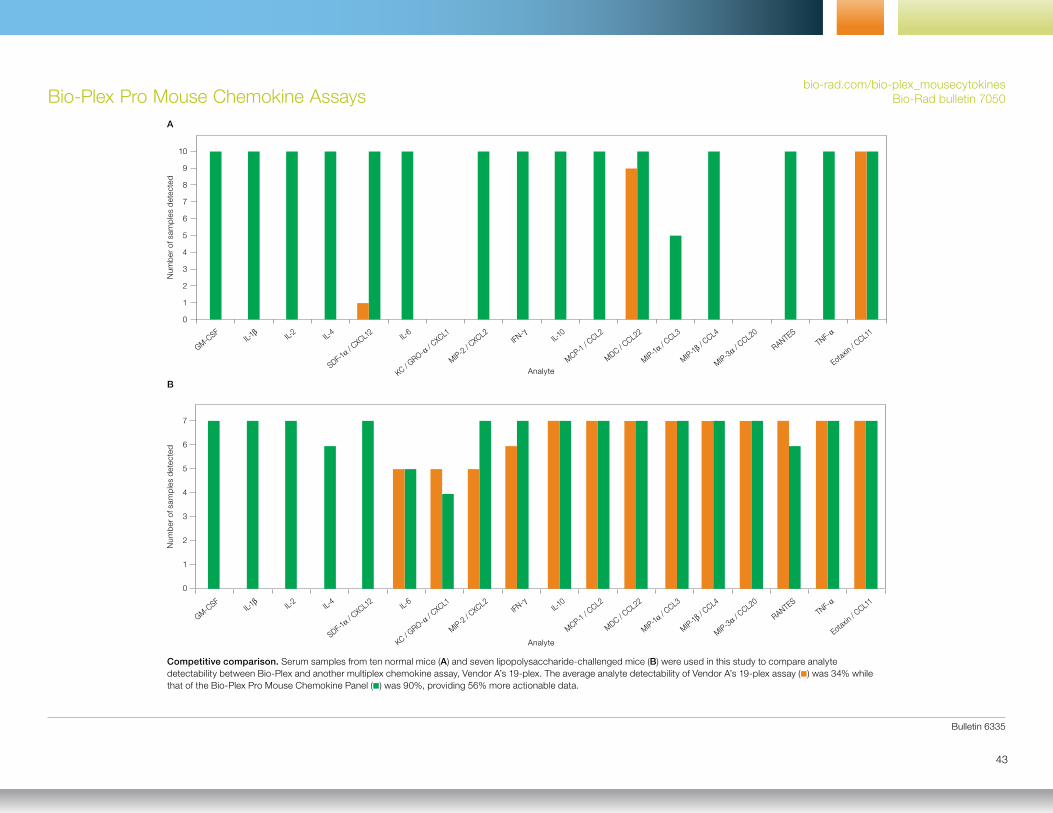
Competitive comparison. Serum samples from ten normal mice (A) and seven lipopolysaccharide-challenged mice (B) were used in this study to compare analyte detectability between Bio-Plex and another multiplex chemokine assay, Vendor A’s 19-plex. The average analyte detectability of Vendor A’s 19-plex assay (■) was 34% while that of the Bio-Plex Pro Mouse Chemokine Panel (■) was 90%, providing 56% more actionable data.
© 2021 Bio-Rad Laboratories, Inc.
44
bio-rad.com/bio-plexprodiabetesBio-Rad bulletin 6342Bio-Plex Pro Mouse Diabetes Assays
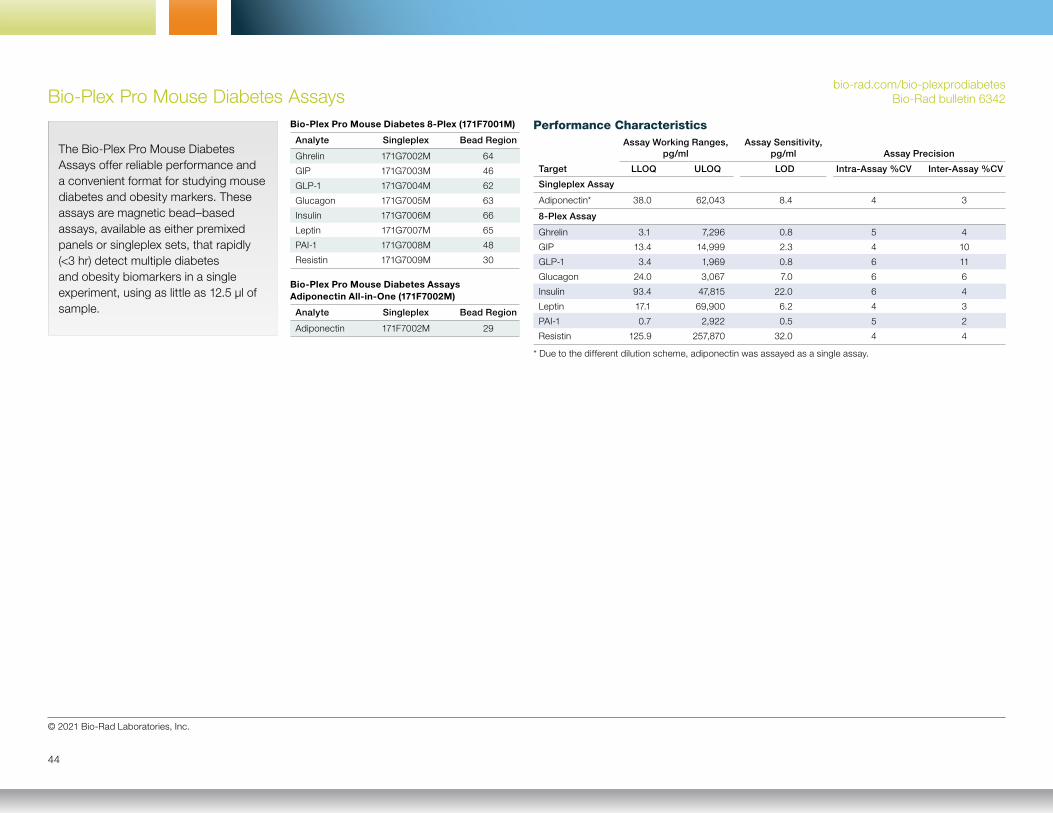
Bio-Plex Pro Mouse Diabetes 8-Plex (171F7001M)
Analyte Singleplex Bead Region
Ghrelin 171G7002M 64
GIP 171G7003M 46
GLP-1 171G7004M 62
Glucagon 171G7005M 63
Insulin 171G7006M 66
Leptin 171G7007M 65
PAI-1 171G7008M 48
Resistin 171G7009M 30
Bio-Plex Pro Mouse Diabetes Assays Adiponectin All-in-One (171F7002M)
Analyte Singleplex Bead Region
Adiponectin 171F7002M 29
Assay Working Ranges, Assay Sensitivity, pg/ml pg/ml Assay Precision
Target LLOQ ULOQ LOD Intra-Assay %CV Inter-Assay %CV
Singleplex Assay
Adiponectin* 38.0 62,043 8.4 4 3
8-Plex Assay
Ghrelin 3.1 7,296 0.8 5 4
GIP 13.4 14,999 2.3 4 10
GLP-1 3.4 1,969 0.8 6 11
Glucagon 24.0 3,067 7.0 6 6
Insulin 93.4 47,815 22.0 6 4
Leptin 17.1 69,900 6.2 4 3
PAI-1 0.7 2,922 0.5 5 2
Resistin 125.9 257,870 32.0 4 4
* Due to the different dilution scheme, adiponectin was assayed as a single assay.
Performance Characteristics
The Bio-Plex Pro Mouse Diabetes Assays offer reliable performance and a convenient format for studying mouse diabetes and obesity markers. These assays are magnetic bead–based assays, available as either premixed panels or singleplex sets, that rapidly (<3 hr) detect multiple diabetes and obesity biomarkers in a single experiment, using as little as 12.5 μl of sample.
Bulletin 6335
45
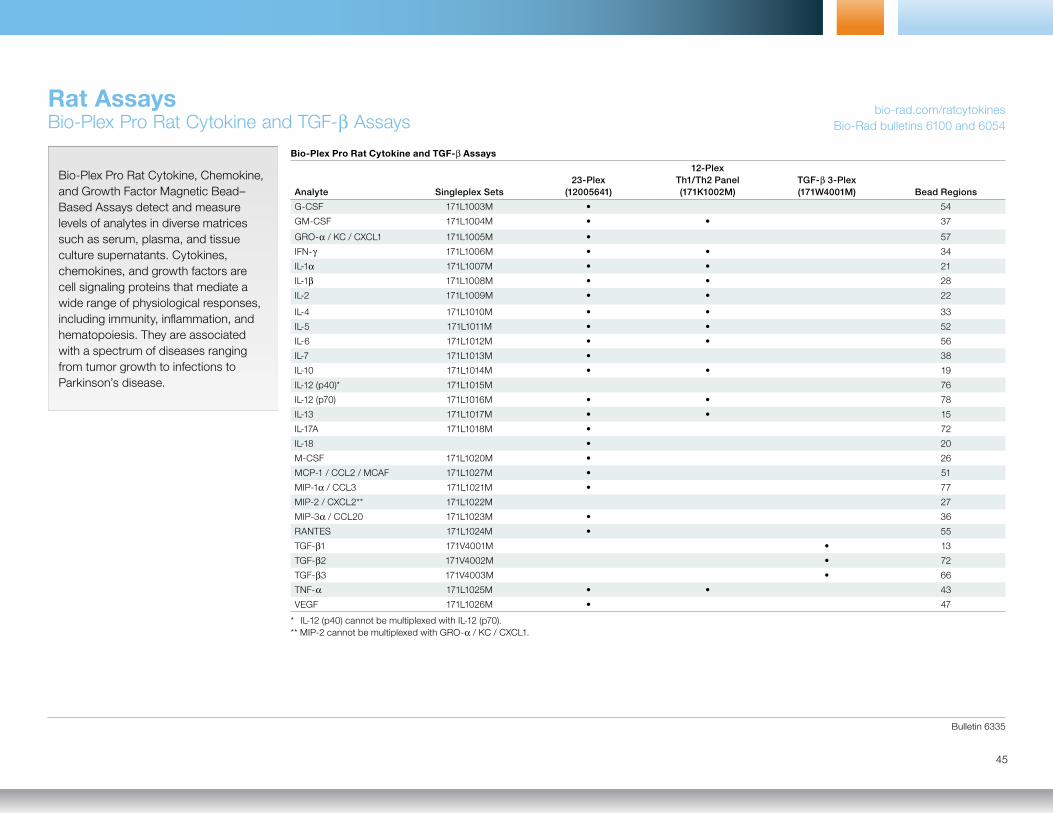
Bio-Plex Pro Rat Cytokine and TGF-b AssaysRat Assays
bio-rad.com/ratcytokinesBio-Rad bulletins 6100 and 6054
Bio-Plex Pro Rat Cytokine, Chemokine, and Growth Factor Magnetic Bead–Based Assays detect and measure levels of analytes in diverse matrices such as serum, plasma, and tissue culture supernatants. Cytokines, chemokines, and growth factors are cell signaling proteins that mediate a wide range of physiological responses, including immunity, inflammation, and hematopoiesis. They are associated with a spectrum of diseases ranging from tumor growth to infections to Parkinson’s disease.
Bio-Plex Pro Rat Cytokine and TGF-b Assays
Analyte Singleplex Sets23-Plex
(12005641)
12-Plex Th1/Th2 Panel (171K1002M)
TGF-b 3-Plex (171W4001M) Bead Regions
G-CSF 171L1003M • 54
GM-CSF 171L1004M • • 37
GRO-a / KC / CXCL1 171L1005M • 57
IFN-g 171L1006M • • 34
IL-1a 171L1007M • • 21
IL-1b 171L1008M • • 28
IL-2 171L1009M • • 22
IL-4 171L1010M • • 33
IL-5 171L1011M • • 52
IL-6 171L1012M • • 56
IL-7 171L1013M • 38
IL-10 171L1014M • • 19
IL-12 (p40)* 171L1015M 76
IL-12 (p70) 171L1016M • • 78
IL-13 171L1017M • • 15
IL-17A 171L1018M • 72
IL-18 • 20
M-CSF 171L1020M • 26
MCP-1 / CCL2 / MCAF 171L1027M • 51
MIP-1a / CCL3 171L1021M • 77
MIP-2 / CXCL2** 171L1022M 27
MIP-3a / CCL20 171L1023M • 36
RANTES 171L1024M • 55
TGF-b1 171V4001M • 13
TGF-b2 171V4002M • 72
TGF-b3 171V4003M • 66
TNF-a 171L1025M • • 43
VEGF 171L1026M • 47
* IL-12 (p40) cannot be multiplexed with IL-12 (p70).** MIP-2 cannot be multiplexed with GRO-a / KC / CXCL1.
© 2021 Bio-Rad Laboratories, Inc.
46
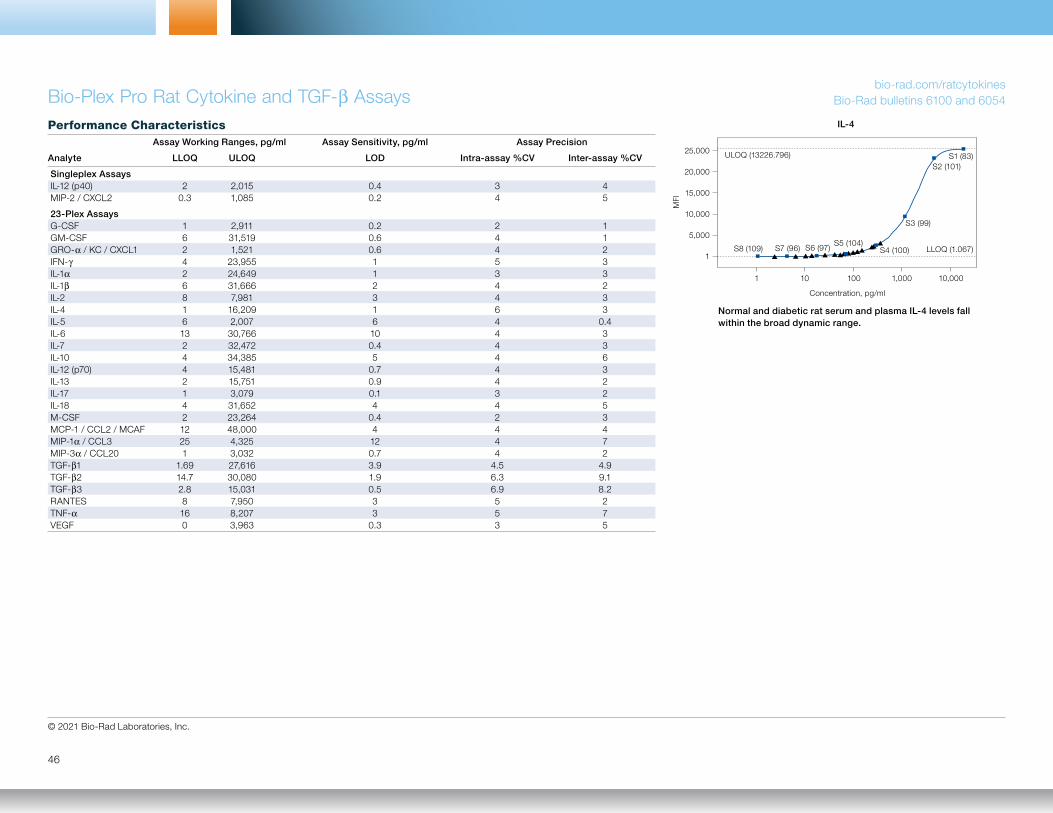
Bio-Plex Pro Rat Cytokine and TGF-b Assaysbio-rad.com/ratcytokines
Bio-Rad bulletins 6100 and 6054
Normal and diabetic rat serum and plasma IL-4 levels fall within the broad dynamic range.
1 10 100 1,000 10,000
Concentration, pg/ml
25,000
20,000
15,000
10,000
5,000
1
MFI
IL-4
ULOQ (13226.796)
LLOQ (1.067)
S1 (83)S2 (101)
S3 (99)
S4 (100)S8 (109) S7 (96) S6 (97)S5 (104)
Performance Characteristics Assay Working Ranges, pg/ml Assay Sensitivity, pg/ml Assay Precision
Analyte LLOQ ULOQ LOD Intra-assay %CV Inter-assay %CV
Singleplex Assays IL-12 (p40) 2 2,015 0.4 3 4 MIP-2 / CXCL2 0.3 1,085 0.2 4 5
23-Plex Assays G-CSF 1 2,911 0.2 2 1 GM-CSF 6 31,519 0.6 4 1 GRO-a / KC / CXCL1 2 1,521 0.6 4 2 IFN-g 4 23,955 1 5 3 IL-1a 2 24,649 1 3 3 IL-1b 6 31,666 2 4 2 IL-2 8 7,981 3 4 3 IL-4 1 16,209 1 6 3 IL-5 6 2,007 6 4 0.4 IL-6 13 30,766 10 4 3 IL-7 2 32,472 0.4 4 3 IL-10 4 34,385 5 4 6 IL-12 (p70) 4 15,481 0.7 4 3 IL-13 2 15,751 0.9 4 2 IL-17 1 3,079 0.1 3 2 IL-18 4 31,652 4 4 5 M-CSF 2 23,264 0.4 2 3 MCP-1 / CCL2 / MCAF 12 48,000 4 4 4 MIP-1a / CCL3 25 4,325 12 4 7 MIP-3a / CCL20 1 3,032 0.7 4 2 TGF-b1 1.69 27,616 3.9 4.5 4.9 TGF-b2 14.7 30,080 1.9 6.3 9.1 TGF-b3 2.8 15,031 0.5 6.9 8.2 RANTES 8 7,950 3 5 2 TNF-a 16 8,207 3 5 7 VEGF 0 3,963 0.3 3 5
Bulletin 6335
47
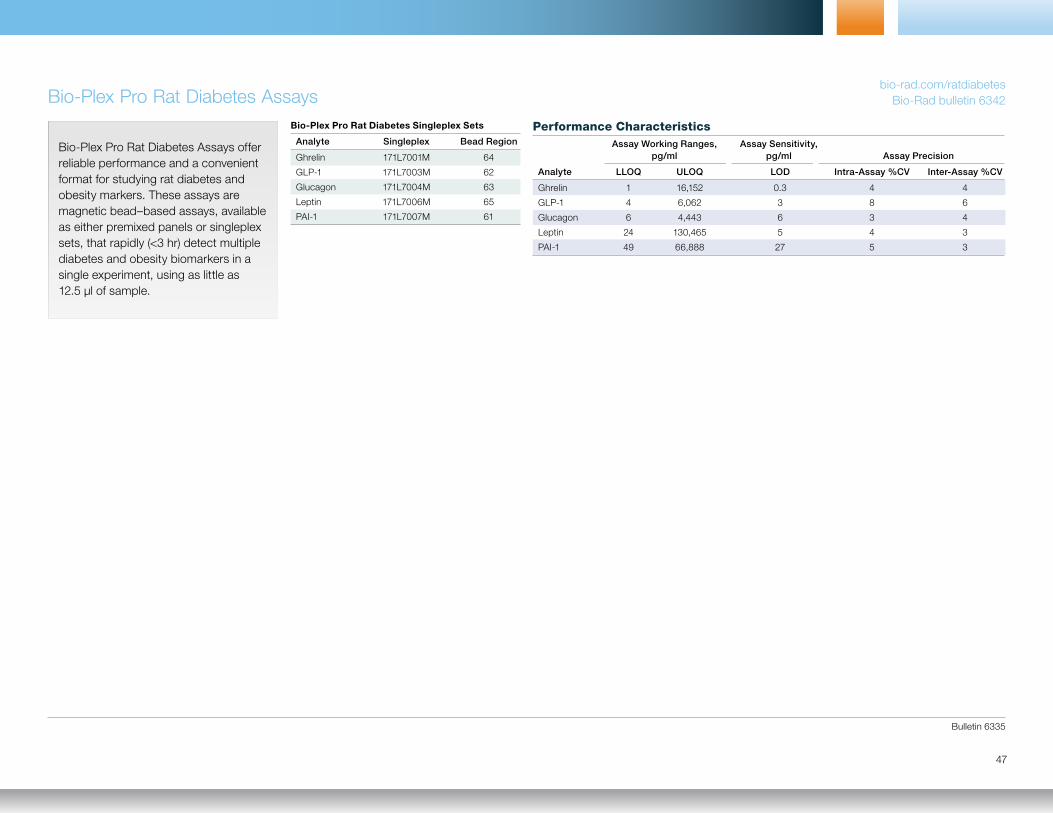
Bio-Plex Pro Rat Diabetes Assaysbio-rad.com/ratdiabetes
Bio-Rad bulletin 6342
Bio-Plex Pro Rat Diabetes Singleplex Sets
Analyte Singleplex Bead Region
Ghrelin 171L7001M 64
GLP-1 171L7003M 62
Glucagon 171L7004M 63
Leptin 171L7006M 65
PAI-1 171L7007M 61
Bio-Plex Pro Rat Diabetes Assays offer reliable performance and a convenient format for studying rat diabetes and obesity markers. These assays are magnetic bead–based assays, available as either premixed panels or singleplex sets, that rapidly (<3 hr) detect multiple diabetes and obesity biomarkers in a single experiment, using as little as 12.5 μl of sample.
Assay Working Ranges, Assay Sensitivity, pg/ml pg/ml Assay Precision
Analyte LLOQ ULOQ LOD Intra-Assay %CV Inter-Assay %CV
Ghrelin 1 16,152 0.3 4 4
GLP-1 4 6,062 3 8 6
Glucagon 6 4,443 6 3 4
Leptin 24 130,465 5 4 3
PAI-1 49 66,888 27 5 3
Performance Characteristics
© 2021 Bio-Rad Laboratories, Inc.
48
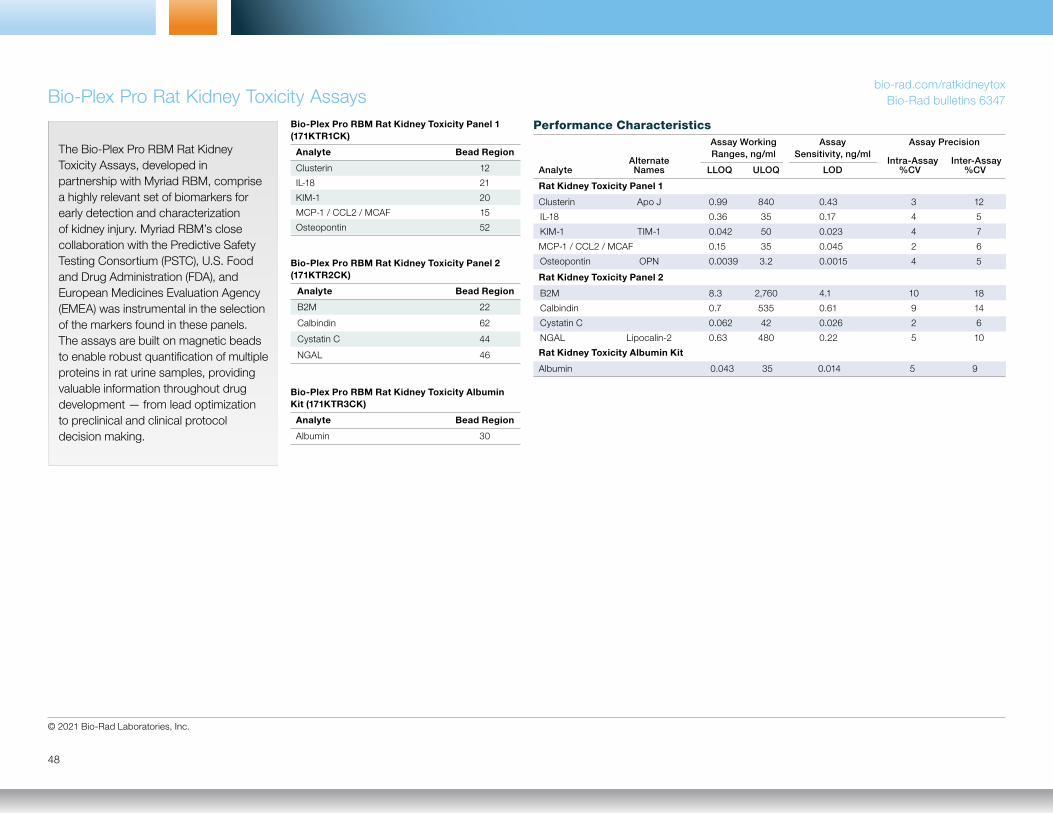
Bio-Plex Pro Rat Kidney Toxicity Assays
Bio-Plex Pro RBM Rat Kidney Toxicity Albumin Kit (171KTR3CK)
Analyte Bead Region
Albumin 30
Bio-Plex Pro RBM Rat Kidney Toxicity Panel 1 (171KTR1CK)
Analyte Bead Region
Clusterin 12
IL-18 21
KIM-1 20
MCP-1 / CCL2 / MCAF 15
Osteopontin 52
Bio-Plex Pro RBM Rat Kidney Toxicity Panel 2 (171KTR2CK)
Analyte Bead Region
B2M 22
Calbindin 62
Cystatin C 44
NGAL 46
Performance Characteristics Assay Working Assay Assay Precision
Alternate Ranges, ng/ml Sensitivity, ng/ml
Intra-Assay Inter-Assay Analyte Names LLOQ ULOQ LOD %CV %CV
Rat Kidney Toxicity Panel 1
Clusterin Apo J 0.99 840 0.43 3 12
IL-18 0.36 35 0.17 4 5
KIM-1 TIM-1 0.042 50 0.023 4 7
MCP-1 / CCL2 / MCAF 0.15 35 0.045 2 6
Osteopontin OPN 0.0039 3.2 0.0015 4 5
Rat Kidney Toxicity Panel 2
B2M 8.3 2,760 4.1 10 18
Calbindin 0.7 535 0.61 9 14
Cystatin C 0.062 42 0.026 2 6
NGAL Lipocalin-2 0.63 480 0.22 5 10
Rat Kidney Toxicity Albumin Kit
Albumin 0.043 35 0.014 5 9
bio-rad.com/ratkidneytoxBio-Rad bulletins 6347
The Bio-Plex Pro RBM Rat Kidney Toxicity Assays, developed in partnership with Myriad RBM, comprise a highly relevant set of biomarkers for early detection and characterization of kidney injury. Myriad RBM’s close collaboration with the Predictive Safety Testing Consortium (PSTC), U.S. Food and Drug Administration (FDA), and European Medicines Evaluation Agency (EMEA) was instrumental in the selection of the markers found in these panels. The assays are built on magnetic beads to enable robust quantification of multiple proteins in rat urine samples, providing valuable information throughout drug development — from lead optimization to preclinical and clinical protocol decision making.
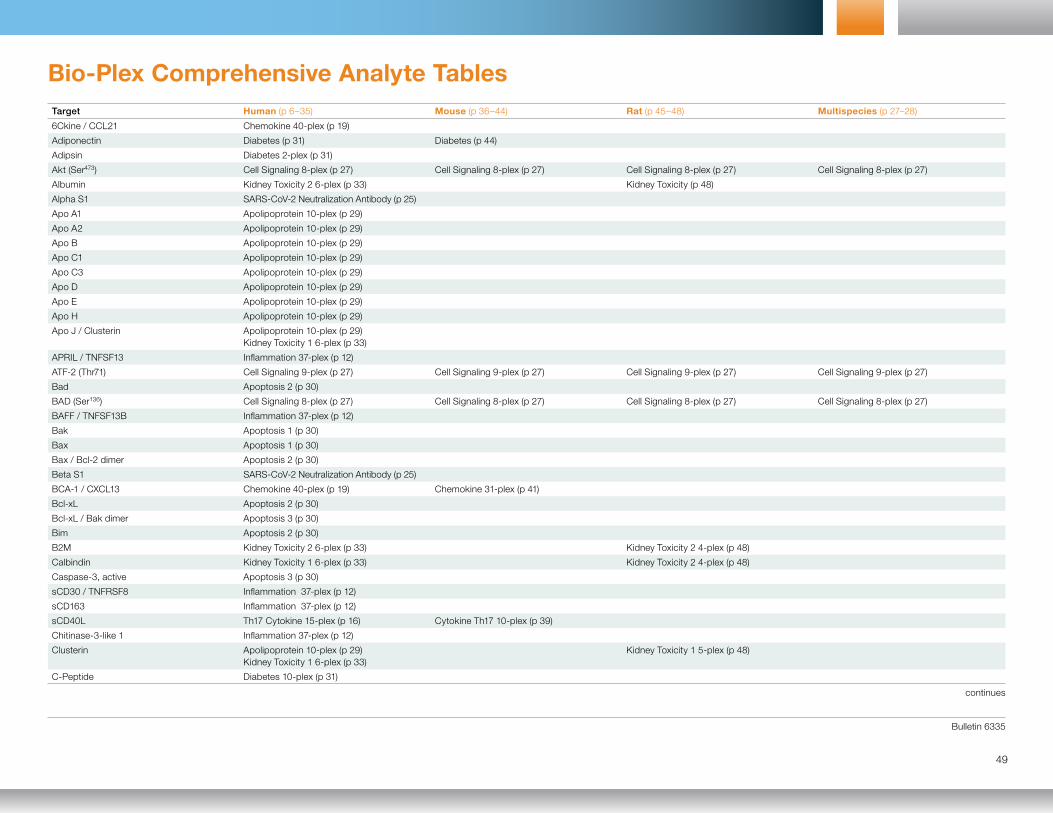
Bulletin 6335
49
Bio-Plex Comprehensive Analyte Tables
continues
Target Human (p 6–35) Mouse (p 36–44) Rat (p 45–48) Multispecies (p 27–28)
6Ckine / CCL21 Chemokine 40-plex (p 19)
Adiponectin Diabetes (p 31) Diabetes (p 44)
Adipsin Diabetes 2-plex (p 31)
Akt (Ser473) Cell Signaling 8-plex (p 27) Cell Signaling 8-plex (p 27) Cell Signaling 8-plex (p 27) Cell Signaling 8-plex (p 27)
Albumin Kidney Toxicity 2 6-plex (p 33) Kidney Toxicity (p 48)
Alpha S1 SARS-CoV-2 Neutralization Antibody (p 25)
Apo A1 Apolipoprotein 10-plex (p 29)
Apo A2 Apolipoprotein 10-plex (p 29)
Apo B Apolipoprotein 10-plex (p 29)
Apo C1 Apolipoprotein 10-plex (p 29)
Apo C3 Apolipoprotein 10-plex (p 29)
Apo D Apolipoprotein 10-plex (p 29)
Apo E Apolipoprotein 10-plex (p 29)
Apo H Apolipoprotein 10-plex (p 29)
Apo J / Clusterin Apolipoprotein 10-plex (p 29) Kidney Toxicity 1 6-plex (p 33)
APRIL / TNFSF13 Inflammation 37-plex (p 12)
ATF-2 (Thr71) Cell Signaling 9-plex (p 27) Cell Signaling 9-plex (p 27) Cell Signaling 9-plex (p 27) Cell Signaling 9-plex (p 27)
Bad Apoptosis 2 (p 30)
BAD (Ser136) Cell Signaling 8-plex (p 27) Cell Signaling 8-plex (p 27) Cell Signaling 8-plex (p 27) Cell Signaling 8-plex (p 27)
BAFF / TNFSF13B Inflammation 37-plex (p 12)
Bak Apoptosis 1 (p 30)
Bax Apoptosis 1 (p 30)
Bax / Bcl-2 dimer Apoptosis 2 (p 30)
Beta S1 SARS-CoV-2 Neutralization Antibody (p 25)
BCA-1 / CXCL13 Chemokine 40-plex (p 19) Chemokine 31-plex (p 41)
Bcl-xL Apoptosis 2 (p 30)
Bcl-xL / Bak dimer Apoptosis 3 (p 30)
Bim Apoptosis 2 (p 30)
B2M Kidney Toxicity 2 6-plex (p 33) Kidney Toxicity 2 4-plex (p 48)
Calbindin Kidney Toxicity 1 6-plex (p 33) Kidney Toxicity 2 4-plex (p 48)
Caspase-3, active Apoptosis 3 (p 30)
sCD30 / TNFRSF8 Inflammation 37-plex (p 12)
sCD163 Inflammation 37-plex (p 12)
sCD40L Th17 Cytokine 15-plex (p 16) Cytokine Th17 10-plex (p 39)
Chitinase-3-like 1 Inflammation 37-plex (p 12)
Clusterin Apolipoprotein 10-plex (p 29) Kidney Toxicity 1 6-plex (p 33)
Kidney Toxicity 1 5-plex (p 48)
C-Peptide Diabetes 10-plex (p 31)
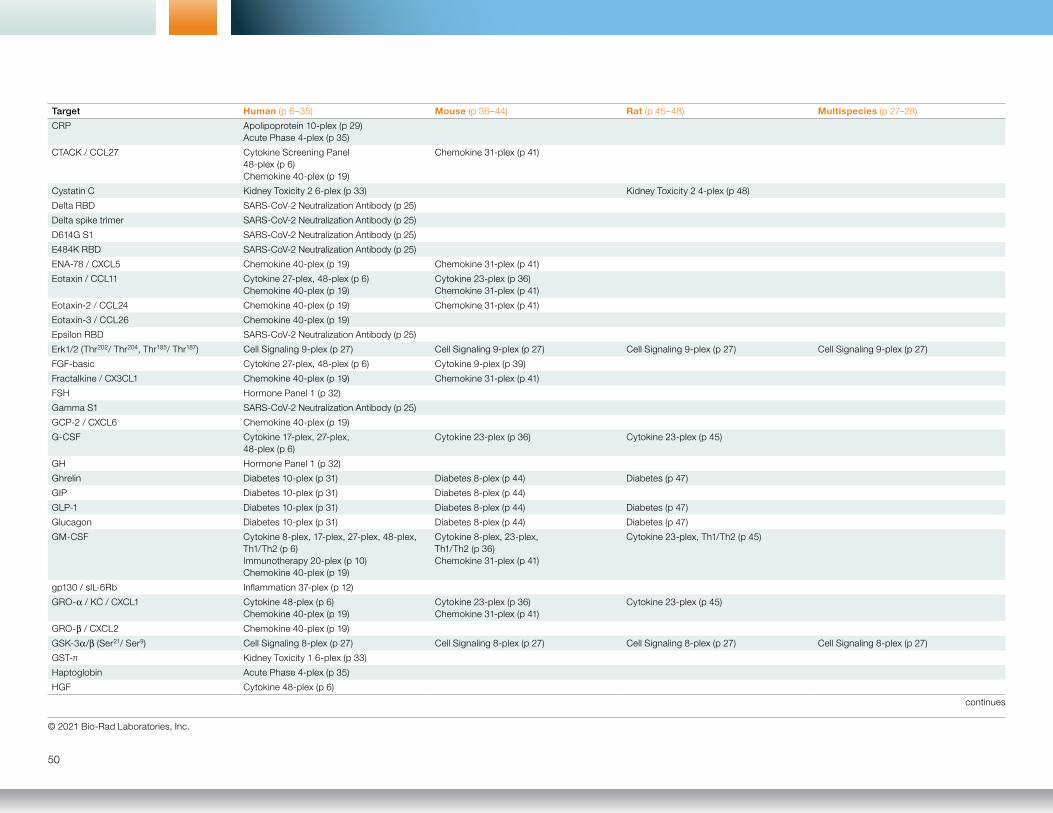
© 2021 Bio-Rad Laboratories, Inc.
continues
50
Target Human (p 6–35) Mouse (p 36–44) Rat (p 45–48) Multispecies (p 27–28)
CRP Apolipoprotein 10-plex (p 29) Acute Phase 4-plex (p 35)
CTACK / CCL27 Cytokine Screening Panel 48-plex (p 6)Chemokine 40-plex (p 19)
Chemokine 31-plex (p 41)
Cystatin C Kidney Toxicity 2 6-plex (p 33) Kidney Toxicity 2 4-plex (p 48)
Delta RBD SARS-CoV-2 Neutralization Antibody (p 25)
Delta spike trimer SARS-CoV-2 Neutralization Antibody (p 25)
D614G S1 SARS-CoV-2 Neutralization Antibody (p 25)
E484K RBD SARS-CoV-2 Neutralization Antibody (p 25)
ENA-78 / CXCL5 Chemokine 40-plex (p 19) Chemokine 31-plex (p 41)
Eotaxin / CCL11 Cytokine 27-plex, 48-plex (p 6)Chemokine 40-plex (p 19)
Cytokine 23-plex (p 36)Chemokine 31-plex (p 41)
Eotaxin-2 / CCL24 Chemokine 40-plex (p 19) Chemokine 31-plex (p 41)
Eotaxin-3 / CCL26 Chemokine 40-plex (p 19)
Epsilon RBD SARS-CoV-2 Neutralization Antibody (p 25)
Erk1/2 (Thr202/ Thr204, Thr185/ Thr187) Cell Signaling 9-plex (p 27) Cell Signaling 9-plex (p 27) Cell Signaling 9-plex (p 27) Cell Signaling 9-plex (p 27)
FGF-basic Cytokine 27-plex, 48-plex (p 6) Cytokine 9-plex (p 39)
Fractalkine / CX3CL1 Chemokine 40-plex (p 19) Chemokine 31-plex (p 41)
FSH Hormone Panel 1 (p 32)
Gamma S1 SARS-CoV-2 Neutralization Antibody (p 25)
GCP-2 / CXCL6 Chemokine 40-plex (p 19)
G-CSF Cytokine 17-plex, 27-plex, 48-plex (p 6)
Cytokine 23-plex (p 36) Cytokine 23-plex (p 45)
GH Hormone Panel 1 (p 32)
Ghrelin Diabetes 10-plex (p 31) Diabetes 8-plex (p 44) Diabetes (p 47)
GIP Diabetes 10-plex (p 31) Diabetes 8-plex (p 44)
GLP-1 Diabetes 10-plex (p 31) Diabetes 8-plex (p 44) Diabetes (p 47)
Glucagon Diabetes 10-plex (p 31) Diabetes 8-plex (p 44) Diabetes (p 47)
GM-CSF Cytokine 8-plex, 17-plex, 27-plex, 48-plex, Th1/Th2 (p 6)Immunotherapy 20-plex (p 10)Chemokine 40-plex (p 19)
Cytokine 8-plex, 23-plex, Th1/Th2 (p 36)Chemokine 31-plex (p 41)
Cytokine 23-plex, Th1/Th2 (p 45)
gp130 / sIL-6Rb Inflammation 37-plex (p 12)
GRO-a / KC / CXCL1 Cytokine 48-plex (p 6)Chemokine 40-plex (p 19)
Cytokine 23-plex (p 36) Chemokine 31-plex (p 41)
Cytokine 23-plex (p 45)
GRO-b / CXCL2 Chemokine 40-plex (p 19)
GSK-3a/b (Ser21/ Ser9) Cell Signaling 8-plex (p 27) Cell Signaling 8-plex (p 27) Cell Signaling 8-plex (p 27) Cell Signaling 8-plex (p 27)
GST-π Kidney Toxicity 1 6-plex (p 33)
Haptoglobin Acute Phase 4-plex (p 35)
HGF Cytokine 48-plex (p 6)
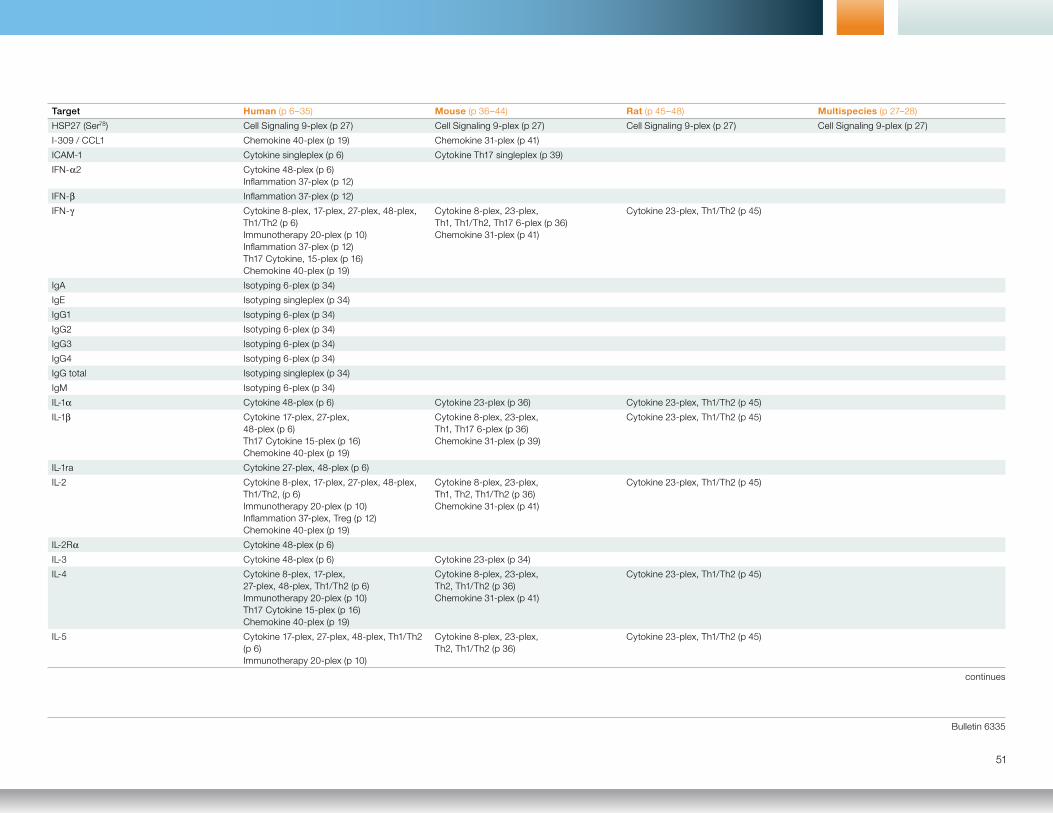
Bulletin 6335
Target Human (p 6–35) Mouse (p 36–44) Rat (p 45–48) Multispecies (p 27–28)
HSP27 (Ser78) Cell Signaling 9-plex (p 27) Cell Signaling 9-plex (p 27) Cell Signaling 9-plex (p 27) Cell Signaling 9-plex (p 27)
I-309 / CCL1 Chemokine 40-plex (p 19) Chemokine 31-plex (p 41)
ICAM-1 Cytokine singleplex (p 6) Cytokine Th17 singleplex (p 39)
IFN-a2 Cytokine 48-plex (p 6)Inflammation 37-plex (p 12)
IFN-b Inflammation 37-plex (p 12)
IFN-g Cytokine 8-plex, 17-plex, 27-plex, 48-plex, Th1/Th2 (p 6)Immunotherapy 20-plex (p 10)Inflammation 37-plex (p 12)Th17 Cytokine, 15-plex (p 16)Chemokine 40-plex (p 19)
Cytokine 8-plex, 23-plex, Th1, Th1/Th2, Th17 6-plex (p 36)Chemokine 31-plex (p 41)
Cytokine 23-plex, Th1/Th2 (p 45)
IgA Isotyping 6-plex (p 34)
IgE Isotyping singleplex (p 34)
IgG1 Isotyping 6-plex (p 34)
IgG2 Isotyping 6-plex (p 34)
IgG3 Isotyping 6-plex (p 34)
IgG4 Isotyping 6-plex (p 34)
IgG total Isotyping singleplex (p 34)
IgM Isotyping 6-plex (p 34)
IL-1a Cytokine 48-plex (p 6) Cytokine 23-plex (p 36) Cytokine 23-plex, Th1/Th2 (p 45)
IL-1b Cytokine 17-plex, 27-plex, 48-plex (p 6)Th17 Cytokine 15-plex (p 16)Chemokine 40-plex (p 19)
Cytokine 8-plex, 23-plex, Th1, Th17 6-plex (p 36)Chemokine 31-plex (p 39)
Cytokine 23-plex, Th1/Th2 (p 45)
IL-1ra Cytokine 27-plex, 48-plex (p 6)
IL-2 Cytokine 8-plex, 17-plex, 27-plex, 48-plex, Th1/Th2, (p 6)Immunotherapy 20-plex (p 10)Inflammation 37-plex, Treg (p 12)Chemokine 40-plex (p 19)
Cytokine 8-plex, 23-plex, Th1, Th2, Th1/Th2 (p 36)Chemokine 31-plex (p 41)
Cytokine 23-plex, Th1/Th2 (p 45)
IL-2Ra Cytokine 48-plex (p 6)
IL-3 Cytokine 48-plex (p 6) Cytokine 23-plex (p 34)
IL-4 Cytokine 8-plex, 17-plex, 27-plex, 48-plex, Th1/Th2 (p 6)Immunotherapy 20-plex (p 10)Th17 Cytokine 15-plex (p 16)Chemokine 40-plex (p 19)
Cytokine 8-plex, 23-plex, Th2, Th1/Th2 (p 36)Chemokine 31-plex (p 41)
Cytokine 23-plex, Th1/Th2 (p 45)
IL-5 Cytokine 17-plex, 27-plex, 48-plex, Th1/Th2 (p 6) Immunotherapy 20-plex (p 10)
Cytokine 8-plex, 23-plex, Th2, Th1/Th2 (p 36)
Cytokine 23-plex, Th1/Th2 (p 45)
continues
51
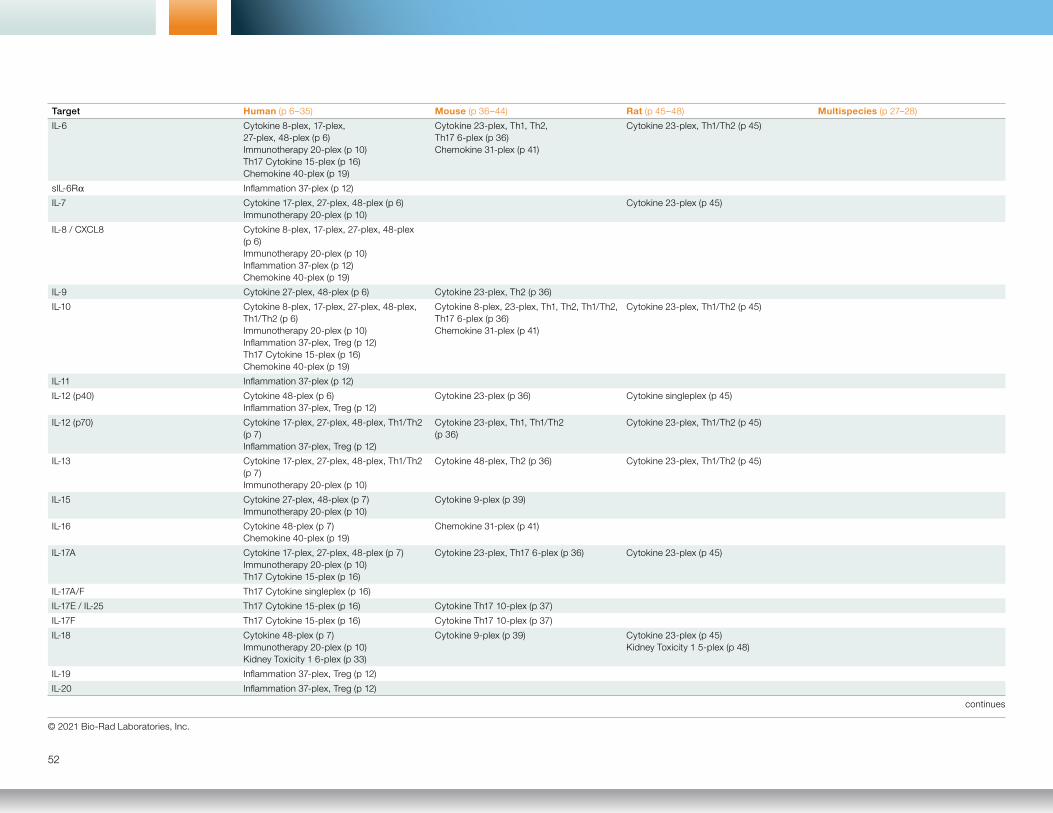
© 2021 Bio-Rad Laboratories, Inc.
Target Human (p 6–35) Mouse (p 36–44) Rat (p 45–48) Multispecies (p 27–28)
IL-6 Cytokine 8-plex, 17-plex, 27-plex, 48-plex (p 6)Immunotherapy 20-plex (p 10) Th17 Cytokine 15-plex (p 16)Chemokine 40-plex (p 19)
Cytokine 23-plex, Th1, Th2, Th17 6-plex (p 36) Chemokine 31-plex (p 41)
Cytokine 23-plex, Th1/Th2 (p 45)
sIL-6Ra Inflammation 37-plex (p 12)
IL-7 Cytokine 17-plex, 27-plex, 48-plex (p 6)Immunotherapy 20-plex (p 10)
Cytokine 23-plex (p 45)
IL-8 / CXCL8 Cytokine 8-plex, 17-plex, 27-plex, 48-plex (p 6) Immunotherapy 20-plex (p 10) Inflammation 37-plex (p 12) Chemokine 40-plex (p 19)
IL-9 Cytokine 27-plex, 48-plex (p 6) Cytokine 23-plex, Th2 (p 36)
IL-10 Cytokine 8-plex, 17-plex, 27-plex, 48-plex, Th1/Th2 (p 6)Immunotherapy 20-plex (p 10)Inflammation 37-plex, Treg (p 12)Th17 Cytokine 15-plex (p 16)Chemokine 40-plex (p 19)
Cytokine 8-plex, 23-plex, Th1, Th2, Th1/Th2, Th17 6-plex (p 36)Chemokine 31-plex (p 41)
Cytokine 23-plex, Th1/Th2 (p 45)
IL-11 Inflammation 37-plex (p 12)
IL-12 (p40) Cytokine 48-plex (p 6)Inflammation 37-plex, Treg (p 12)
Cytokine 23-plex (p 36) Cytokine singleplex (p 45)
IL-12 (p70) Cytokine 17-plex, 27-plex, 48-plex, Th1/Th2 (p 7)Inflammation 37-plex, Treg (p 12)
Cytokine 23-plex, Th1, Th1/Th2 (p 36)
Cytokine 23-plex, Th1/Th2 (p 45)
IL-13 Cytokine 17-plex, 27-plex, 48-plex, Th1/Th2 (p 7)Immunotherapy 20-plex (p 10)
Cytokine 48-plex, Th2 (p 36) Cytokine 23-plex, Th1/Th2 (p 45)
IL-15 Cytokine 27-plex, 48-plex (p 7)Immunotherapy 20-plex (p 10)
Cytokine 9-plex (p 39)
IL-16 Cytokine 48-plex (p 7)Chemokine 40-plex (p 19)
Chemokine 31-plex (p 41)
IL-17A Cytokine 17-plex, 27-plex, 48-plex (p 7)Immunotherapy 20-plex (p 10)Th17 Cytokine 15-plex (p 16)
Cytokine 23-plex, Th17 6-plex (p 36) Cytokine 23-plex (p 45)
IL-17A/F Th17 Cytokine singleplex (p 16)
IL-17E / IL-25 Th17 Cytokine 15-plex (p 16) Cytokine Th17 10-plex (p 37)
IL-17F Th17 Cytokine 15-plex (p 16) Cytokine Th17 10-plex (p 37)
IL-18 Cytokine 48-plex (p 7)Immunotherapy 20-plex (p 10)Kidney Toxicity 1 6-plex (p 33)
Cytokine 9-plex (p 39) Cytokine 23-plex (p 45)Kidney Toxicity 1 5-plex (p 48)
IL-19 Inflammation 37-plex, Treg (p 12)
IL-20 Inflammation 37-plex, Treg (p 12)
continues
52

Bulletin 6335
Target Human (p 6–35) Mouse (p 36–44) Rat (p 45–48) Multispecies (p 27–28)
IL-21 Th17 Cytokine 15-plex (p 16) Cytokine Th17 10-plex (p 39)
IL-22 Inflammation 37-plex, Treg (p 12)Th17 Cytokine 15-plex (p 16)
Cytokine Th17 10-plex (p 39)
IL-23 (p19) Th17 Cytokine 15-plex (p 16) Cytokine Th17 10-plex (p 39)
IL-25 / IL-17E Th17 Cytokine 15-plex (p 16) Cytokine Th17 10-plex (p 39)
IL-26* Inflammation 37-plex, Treg (p 12)
IL-27 (p28) Inflammation 37-plex, Treg (p 12) Cytokine Th17 10-plex (p 39)
IL-28A / IFN-l2 Inflammation 37-plex, Treg (p 12)
IL-29 / IFN-l1 Inflammation 37-plex, Treg (p 12)
IL-31 Th17 Cytokine 15-plex (p 16) Cytokine Th17 10-plex (p 39)
IL-32 Inflammation 37-plex (p 12)
IL-33 Th17 Cytokine 15-plex (p 16) Cytokine Th17 10-plex (p 39)
IL-34 Inflammation 37-plex (p 12)
IL-35 Inflammation 37-plex, Treg (p 12)
Insulin Diabetes 10-plex (p 31) Diabetes 8-plex (p 44)
IP-10 / CXCL10 Cytokine 27-plex, 48-plex (p 7)Immunotherapy 20-plex (p 10)Chemokine 40-plex (p 19)
Chemokine 31-plex (p 41)
IRS-1 (Ser636/ Ser639) Cell Signaling 8-plex (p 27) Cell Signaling 8-plex (p 27) Cell Signaling 8-plex (p 27) Cell Signaling 8-plex (p 27)
I-TAC / CXCL11 Chemokine 40-plex (p 19) Chemokine 31-plex (p 41)
JNK (Thr183/ Tyr185) Cell Signaling 9-plex (p 27) Cell Signaling 9-plex (p 27) Cell Signaling 9-plex (p 27) Cell Signaling 9-plex (p 27)
Kappa RBD SARS-CoV-2 Neutralization Antibody (p 25)
K417N RBD SARS-CoV-2 Neutralization Antibody (p 25)
KC / GRO-a / CXCL1 Cytokine 48-plex (p 6) Chemokine 40-plex (p 19)
Cytokine 23-plex (p 36)Chemokine 31-plex (p 41)
Cytokine 23-plex (p 45)
KIM-1 Kidney Toxicity 1 6-plex (p 33) Kidney Toxicity 1 5-plex (p 48)
Lamin B, intact and 45 kD Apoptosis 1 (p 30)
Leptin Diabetes 10-plex (p 31) Diabetes 8-plex (p 44) Diabetes (p 47)
LH Hormone Panel 1 (p 32)
LIF Cytokine 48-plex (p 7) Cytokine 9-plex (p 39)
LIGHT / TNFSF14 Inflammation 37-plex (p 12)
a-2-macroglobin Acute Phase 4-plex (p 35)
Mcl-1 Apoptosis 2 (p 30)
Mcl-1 / Bak dimer Apoptosis 3 (p 30)
MCP-1 / CCL2 / MCAF Cytokine 17-plex, 27-plex, 48-plex (p 7)Immunotherapy 20-plex (p 10)Chemokine 40-plex (p 19)Kidney Toxicity 1 6-plex (p 33)
Cytokine 23-plex (p 36)Chemokine 31-plex (p 41)
Cytokine 23-plex (p 45)Kidney Toxicity 1 5-plex (p 48)
MCP-2 / CCL8 Chemokine 40-plex (p 19) Chemokine singleplex (p 41)
* Unique target.
continues
53
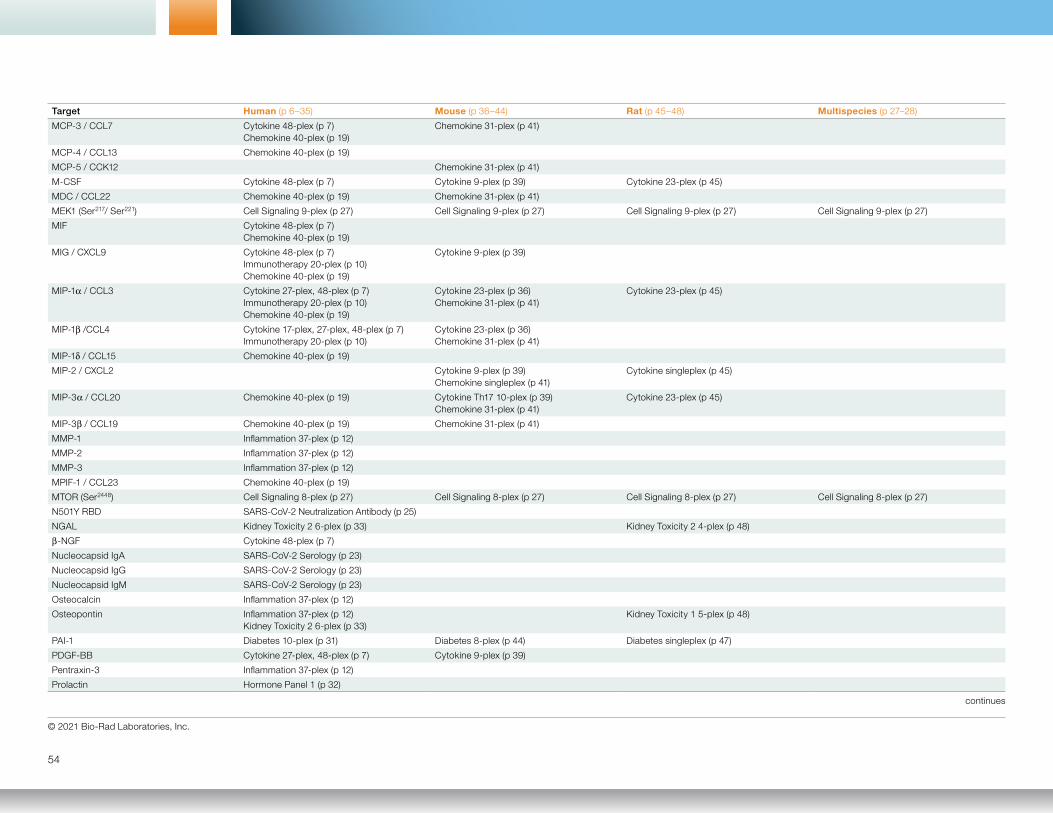
© 2021 Bio-Rad Laboratories, Inc.
Target Human (p 6–35) Mouse (p 36–44) Rat (p 45–48) Multispecies (p 27–28)
MCP-3 / CCL7 Cytokine 48-plex (p 7)Chemokine 40-plex (p 19)
Chemokine 31-plex (p 41)
MCP-4 / CCL13 Chemokine 40-plex (p 19)
MCP-5 / CCK12 Chemokine 31-plex (p 41)
M-CSF Cytokine 48-plex (p 7) Cytokine 9-plex (p 39) Cytokine 23-plex (p 45)
MDC / CCL22 Chemokine 40-plex (p 19) Chemokine 31-plex (p 41)
MEK1 (Ser217/ Ser221) Cell Signaling 9-plex (p 27) Cell Signaling 9-plex (p 27) Cell Signaling 9-plex (p 27) Cell Signaling 9-plex (p 27)
MIF Cytokine 48-plex (p 7)Chemokine 40-plex (p 19)
MIG / CXCL9 Cytokine 48-plex (p 7)Immunotherapy 20-plex (p 10)Chemokine 40-plex (p 19)
Cytokine 9-plex (p 39)
MIP-1a / CCL3 Cytokine 27-plex, 48-plex (p 7)Immunotherapy 20-plex (p 10)Chemokine 40-plex (p 19)
Cytokine 23-plex (p 36) Chemokine 31-plex (p 41)
Cytokine 23-plex (p 45)
MIP-1b /CCL4 Cytokine 17-plex, 27-plex, 48-plex (p 7)Immunotherapy 20-plex (p 10)
Cytokine 23-plex (p 36) Chemokine 31-plex (p 41)
MIP-1d / CCL15 Chemokine 40-plex (p 19)
MIP-2 / CXCL2 Cytokine 9-plex (p 39) Chemokine singleplex (p 41)
Cytokine singleplex (p 45)
MIP-3a / CCL20 Chemokine 40-plex (p 19) Cytokine Th17 10-plex (p 39) Chemokine 31-plex (p 41)
Cytokine 23-plex (p 45)
MIP-3b / CCL19 Chemokine 40-plex (p 19) Chemokine 31-plex (p 41)
MMP-1 Inflammation 37-plex (p 12)
MMP-2 Inflammation 37-plex (p 12)
MMP-3 Inflammation 37-plex (p 12)
MPIF-1 / CCL23 Chemokine 40-plex (p 19)
MTOR (Ser2448) Cell Signaling 8-plex (p 27) Cell Signaling 8-plex (p 27) Cell Signaling 8-plex (p 27) Cell Signaling 8-plex (p 27)
N501Y RBD SARS-CoV-2 Neutralization Antibody (p 25)
NGAL Kidney Toxicity 2 6-plex (p 33) Kidney Toxicity 2 4-plex (p 48)
b-NGF Cytokine 48-plex (p 7)
Nucleocapsid IgA SARS-CoV-2 Serology (p 23)
Nucleocapsid IgG SARS-CoV-2 Serology (p 23)
Nucleocapsid IgM SARS-CoV-2 Serology (p 23)
Osteocalcin Inflammation 37-plex (p 12)
Osteopontin Inflammation 37-plex (p 12)Kidney Toxicity 2 6-plex (p 33)
Kidney Toxicity 1 5-plex (p 48)
PAI-1 Diabetes 10-plex (p 31) Diabetes 8-plex (p 44) Diabetes singleplex (p 47)
PDGF-BB Cytokine 27-plex, 48-plex (p 7) Cytokine 9-plex (p 39)
Pentraxin-3 Inflammation 37-plex (p 12)
Prolactin Hormone Panel 1 (p 32)
continues
54
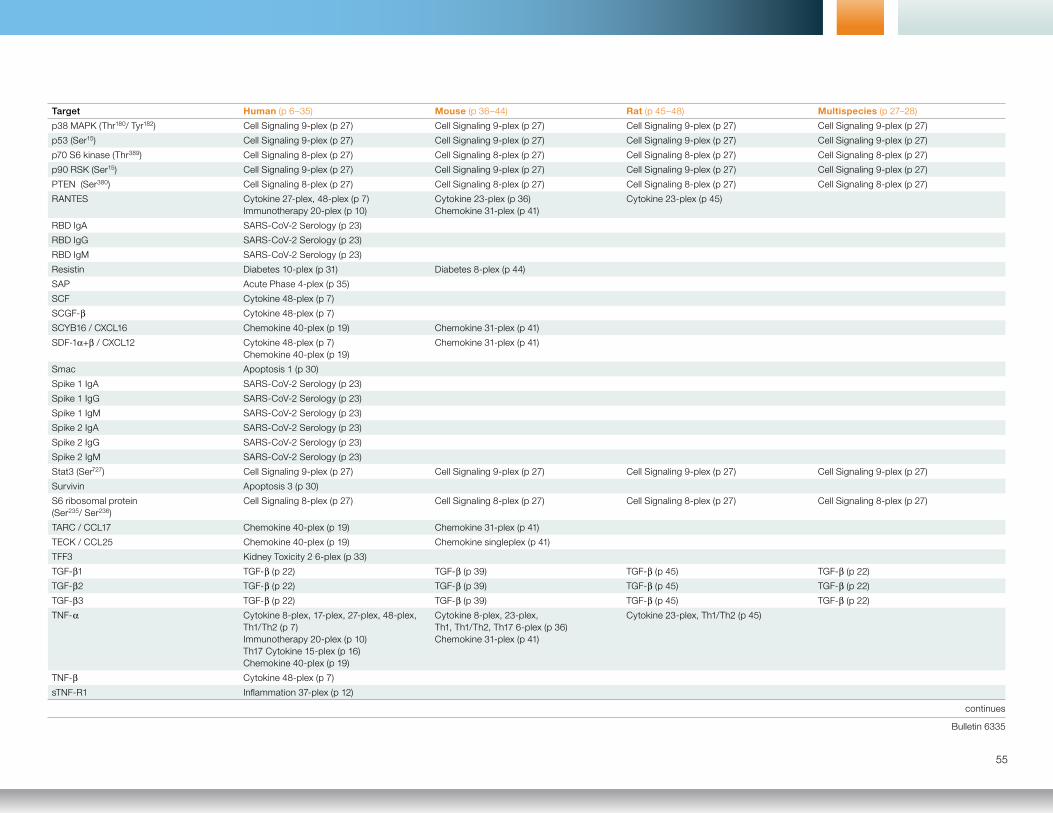
Bulletin 6335
Target Human (p 6–35) Mouse (p 36–44) Rat (p 45–48) Multispecies (p 27–28)
p38 MAPK (Thr180/ Tyr182) Cell Signaling 9-plex (p 27) Cell Signaling 9-plex (p 27) Cell Signaling 9-plex (p 27) Cell Signaling 9-plex (p 27)
p53 (Ser15) Cell Signaling 9-plex (p 27) Cell Signaling 9-plex (p 27) Cell Signaling 9-plex (p 27) Cell Signaling 9-plex (p 27)
p70 S6 kinase (Thr389) Cell Signaling 8-plex (p 27) Cell Signaling 8-plex (p 27) Cell Signaling 8-plex (p 27) Cell Signaling 8-plex (p 27)
p90 RSK (Ser15) Cell Signaling 9-plex (p 27) Cell Signaling 9-plex (p 27) Cell Signaling 9-plex (p 27) Cell Signaling 9-plex (p 27)
PTEN (Ser380) Cell Signaling 8-plex (p 27) Cell Signaling 8-plex (p 27) Cell Signaling 8-plex (p 27) Cell Signaling 8-plex (p 27)
RANTES Cytokine 27-plex, 48-plex (p 7)Immunotherapy 20-plex (p 10)
Cytokine 23-plex (p 36) Chemokine 31-plex (p 41)
Cytokine 23-plex (p 45)
RBD IgA SARS-CoV-2 Serology (p 23)
RBD IgG SARS-CoV-2 Serology (p 23)
RBD IgM SARS-CoV-2 Serology (p 23)
Resistin Diabetes 10-plex (p 31) Diabetes 8-plex (p 44)
SAP Acute Phase 4-plex (p 35)
SCF Cytokine 48-plex (p 7)
SCGF-b Cytokine 48-plex (p 7)
SCYB16 / CXCL16 Chemokine 40-plex (p 19) Chemokine 31-plex (p 41)
SDF-1a+b / CXCL12 Cytokine 48-plex (p 7)Chemokine 40-plex (p 19)
Chemokine 31-plex (p 41)
Smac Apoptosis 1 (p 30)
Spike 1 IgA SARS-CoV-2 Serology (p 23)
Spike 1 IgG SARS-CoV-2 Serology (p 23)
Spike 1 IgM SARS-CoV-2 Serology (p 23)
Spike 2 IgA SARS-CoV-2 Serology (p 23)
Spike 2 IgG SARS-CoV-2 Serology (p 23)
Spike 2 IgM SARS-CoV-2 Serology (p 23)
Stat3 (Ser727) Cell Signaling 9-plex (p 27) Cell Signaling 9-plex (p 27) Cell Signaling 9-plex (p 27) Cell Signaling 9-plex (p 27)
Survivin Apoptosis 3 (p 30)
S6 ribosomal protein (Ser235/ Ser236)
Cell Signaling 8-plex (p 27) Cell Signaling 8-plex (p 27) Cell Signaling 8-plex (p 27) Cell Signaling 8-plex (p 27)
TARC / CCL17 Chemokine 40-plex (p 19) Chemokine 31-plex (p 41)
TECK / CCL25 Chemokine 40-plex (p 19) Chemokine singleplex (p 41)
TFF3 Kidney Toxicity 2 6-plex (p 33)
TGF-b1 TGF-b (p 22) TGF-b (p 39) TGF-b (p 45) TGF-b (p 22)
TGF-b2 TGF-b (p 22) TGF-b (p 39) TGF-b (p 45) TGF-b (p 22)
TGF-b3 TGF-b (p 22) TGF-b (p 39) TGF-b (p 45) TGF-b (p 22)
TNF-a Cytokine 8-plex, 17-plex, 27-plex, 48-plex, Th1/Th2 (p 7)Immunotherapy 20-plex (p 10)Th17 Cytokine 15-plex (p 16)Chemokine 40-plex (p 19)
Cytokine 8-plex, 23-plex, Th1, Th1/Th2, Th17 6-plex (p 36)Chemokine 31-plex (p 41)
Cytokine 23-plex, Th1/Th2 (p 45)
TNF-b Cytokine 48-plex (p 7)
sTNF-R1 Inflammation 37-plex (p 12)
continues
55
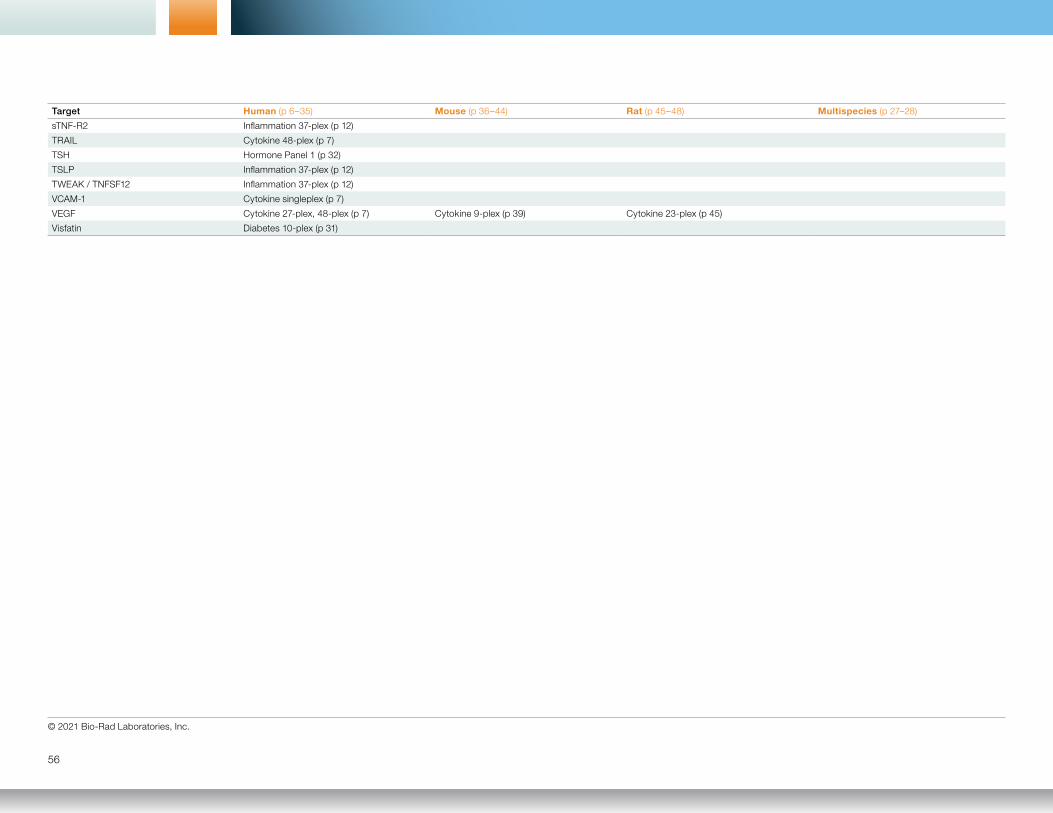
© 2021 Bio-Rad Laboratories, Inc.
Target Human (p 6–35) Mouse (p 36–44) Rat (p 45–48) Multispecies (p 27–28)
sTNF-R2 Inflammation 37-plex (p 12)
TRAIL Cytokine 48-plex (p 7)
TSH Hormone Panel 1 (p 32)
TSLP Inflammation 37-plex (p 12)
TWEAK / TNFSF12 Inflammation 37-plex (p 12)
VCAM-1 Cytokine singleplex (p 7)
VEGF Cytokine 27-plex, 48-plex (p 7) Cytokine 9-plex (p 39) Cytokine 23-plex (p 45)
Visfatin Diabetes 10-plex (p 31)
56
Bulletin 6335
57
Bulletin 6335 Ver H US/EG 21-0798 1221 Sig 0121
Website bio-rad.com USA 1 800 424 6723 Australia 61 2 9914 2800 Austria 00 800 00 24 67 23 Belgium 00 800 00 24 67 23 Brazil 4003 0399 Canada 1 905 364 3435 China 86 21 6169 8500 Czech Republic 00 800 00 24 67 23 Denmark 00 800 00 24 67 23 Finland 00 800 00 24 67 23 France 00 800 00 24 67 23 Germany 00 800 00 24 67 23 Hong Kong 852 2789 3300 Hungary 00 800 00 24 67 23 India 91 124 4029300 Israel 0 3 9636050 Italy 00 800 00 24 67 23 Japan 81 3 6361 7000 Korea 82 2 3473 4460 Luxembourg 00 800 00 24 67 23 Mexico 52 555 488 7670 The Netherlands 00 800 00 24 67 23 New Zealand 64 9 415 2280 Norway 00 800 00 24 67 23 Poland 00 800 00 24 67 23 Portugal 00 800 00 24 67 23 Russian Federation 00 800 00 24 67 23 Singapore 65 6415 3188 South Africa 00 800 00 24 67 23 Spain 00 800 00 24 67 23 Sweden 00 800 00 24 67 23 Switzerland 00 800 00 24 67 23 Taiwan 886 2 2578 7189 Thailand 66 2 651 8311 United Arab Emirates 36 1 459 6150 United Kingdom 00 800 00 24 67 23
Bio-Rad Laboratories, Inc.
Life ScienceGroup
CST antibodies developed and validated for Bio-Plex Phosphoprotein and Total Target Assays.
BIO-RAD and BIO-PLEX are trademarks of Bio-Rad Laboratories, Inc. in certain jurisdictions.
xMAP and Luminex are trademarks of Luminex Corporation.
The Bio-Plex Suspension Array System includes fluorescently labeled microspheres and instrumentation licensed to Bio-Rad Laboratories, Inc. by the Luminex Corporation.
All trademarks used herein are the property of their respective owner.
Download the latest version at bio-rad.com/Bio-Plex/AnalyteGuide