air6
12
‚§√ß°“√»÷°…“¡≈¿“«–∑“ßÕ“°“»Õ—π‡π◊ËÕß¡“®“° “√‚æ≈’‰´§≈‘° Õ–‚√¡“µ‘°‰Œ‚¥√§“√å∫Õπ (PAH) „π∫√√¬“°“»‡¢µ°√ÿ߇∑æ¡À“π§√ 1. °“√®”·π°·≈–ª√‘¡“≥«‘‡§√“–Àå Airborne Polycyclic Aromatic Hydrocarbon (PAH) In Bangkok Urban Air I. Characterization and Quantification Hathairatana Garivait*, Wanna Laowagul* Phaka Sukasem*, Sunthorn Ngod-Ngam* Chongrak Polprasert**, Lars Baetz Reutergardh** ∫∑§—¥¬àÕ æƒµ‘°√√¡¢Õß “√‚æ≈’‰´§≈‘°Õ–‚√¡“µ‘° ‰Œ‚¥√§“√å∫Õπ (PAH) „π∫√√¬“°“»¢÷Èπ°—∫§ÿ≥ ¡∫—µ‘ ∑“ߥâ“πøî ‘° å·≈–‡§¡’¢Õß “√¥—ß°≈à“« ¥—ßπ—Èπ°“√ °√–®“¬µ—«·≈–°“√‡°‘¥ªØ‘°‘√‘¬“¢Õß “√ PAH „π ∫√√¬“°“»„π‡¢µ√âÕπ®÷ßπà“®–·µ°µà“ß®“°∑’ˇ°‘¥¢÷Èπ „π∫√√¬“°“»‡¢µÀπ“« ·µàÕ¬à“߉√°Áµ“¡°“√»÷°…“ 惵‘°√√¡¢Õß “√ PAH „π∫√√¬“°“»‡¢µ√âÕπ¬—ß¡’ Õ¬ŸàπâÕ¬¡“°„πªí®®ÿ∫—π °“√»÷°…“§√—Èßπ’È ‰¥â∑”°“√ ”√«®≈—°…≥– ‡©æ“–¢Õß°“√°√–®“¬µ—«¢Õß “√ PAH „π∫√√¬“°“» ‡¢µ‡¡◊ÕߢÕß°√ÿ߇∑æ¡À“π§√ ‚¥¬§”π÷ß∂÷ß°“√ °√–®“¬µ—«¢Õß “√ PAH „π√Ÿª¢Õß°ä“´·≈–„π *»Ÿπ¬å«‘®—¬·≈–Ωñ°Õ∫√¡¥â“π ‘Ëß·«¥≈âÕ¡ °√¡ à߇ √‘¡§ÿ≥¿“æ ‘Ëß·«¥≈âÕ¡ ‡∑§‚π∏“π’ µ.§≈ÕßÀâ“ Õ.§≈ÕßÀ≈«ß ®.ª∑ÿ¡∏“π’ 12120 ‚∑√. 0-2577-1136 ‚∑√ “√. 0-2577-1138 Environmental Research and Training Center, Department of Environmental Quality Promotion. Technopolis. Klong 5 Klong Luang, Pathumthani 12120 e-mail: [email protected] **Asian Institute of Technology, Pathumthani, Thailand High Performance Liquid Chromatograph Incinerator
-
Upload
department-of-environmental-quality-promotion-thailand -
Category
Documents
-
view
212 -
download
0
description
‚ §√ß°“√»÷ ° …“¡≈¿“«–∑“ßÕ“°“»Õ— π ‡π◊ Ë Õ ß¡“®“° “√‚æ≈’ ‰ ´§≈‘ ° ∫ ∑§— ¥ ¬à Õ High Performance Liquid Chromatograph Incinerator 1. Introduction §-46 »Ÿ π ¬å « ‘ ® — ¬ ·≈–Ωñ ° Õ∫√¡¥â “ π ‘ Ë ß ·«¥≈â Õ ¡ °√¡ à ß ‡ √‘ ¡ §ÿ ≥ ¿“æ ‘ Ë ß ·«¥≈â Õ ¡
Transcript of air6
‚§√ß°“√»÷°…“¡≈¿“«–∑“ßÕ“°“»Õ—π‡π◊ËÕß¡“®“° “√‚æ≈’‰´§≈‘°Õ–‚√¡“µ‘°‰Œ‚¥√§“√å∫Õπ (PAH) „π∫√√¬“°“»‡¢µ°√ÿ߇∑æ¡À“π§√1. °“√®”·π°·≈–ª√‘¡“≥«‘‡§√“–ÀåAirborne Polycyclic Aromatic Hydrocarbon (PAH) In Bangkok Urban AirI. Characterization and Quantification
Hathairatana Garivait*, Wanna Laowagul*
Phaka Sukasem*, Sunthorn Ngod-Ngam*
Chongrak Polprasert**, Lars Baetz Reutergardh**
∫∑§—¥¬àÕ惵‘°√√¡¢Õß “√‚æ≈’‰´§≈‘°Õ–‚√¡“µ‘°
‰Œ‚¥√§“√å∫Õπ (PAH) „π∫√√¬“°“»¢÷Èπ°—∫§ÿ≥ ¡∫—µ‘
∑“ߥâ“πøî ‘° å·≈–‡§¡’¢Õß “√¥—ß°≈à“« ¥—ßπ—Èπ°“√
°√–®“¬µ—«·≈–°“√‡°‘¥ªØ‘°‘√‘¬“¢Õß “√ PAH „π
∫√√¬“°“»„π‡¢µ√âÕπ®÷ßπà“®–·µ°µà“ß®“°∑’ˇ°‘¥¢÷Èπ
„π∫√√¬“°“»‡¢µÀπ“« ·µàÕ¬à“߉√°Áµ“¡°“√»÷°…“
惵‘°√√¡¢Õß “√ PAH „π∫√√¬“°“»‡¢µ√âÕπ¬—ß¡’
Õ¬ŸàπâÕ¬¡“°„πªí®®ÿ∫—π
°“√»÷°…“§√—Èßπ’È ‰¥â∑”°“√ ”√«®≈—°…≥–
‡©æ“–¢Õß°“√°√–®“¬µ—«¢Õß “√ PAH „π∫√√¬“°“»
‡¢µ‡¡◊ÕߢÕß°√ÿ߇∑æ¡À“π§√ ‚¥¬§”π÷ß∂÷ß°“√
°√–®“¬µ—«¢Õß “√ PAH „π√Ÿª¢Õß°ä“´·≈–„π
*»Ÿπ¬å«‘®—¬·≈–Ωñ°Õ∫√¡¥â“π ‘Ëß·«¥≈âÕ¡ °√¡ à߇ √‘¡§ÿ≥¿“æ ‘Ëß·«¥≈âÕ¡ ‡∑§‚π∏“π’ µ.§≈ÕßÀâ“ Õ.§≈ÕßÀ≈«ß ®.ª∑ÿ¡∏“π’ 12120 ‚∑√. 0-2577-1136 ‚∑√ “√. 0-2577-1138Environmental Research and Training Center, Department of Environmental Quality Promotion. Technopolis. Klong 5 Klong Luang, Pathumthani 12120 e-mail: [email protected]**Asian Institute of Technology, Pathumthani, Thailand
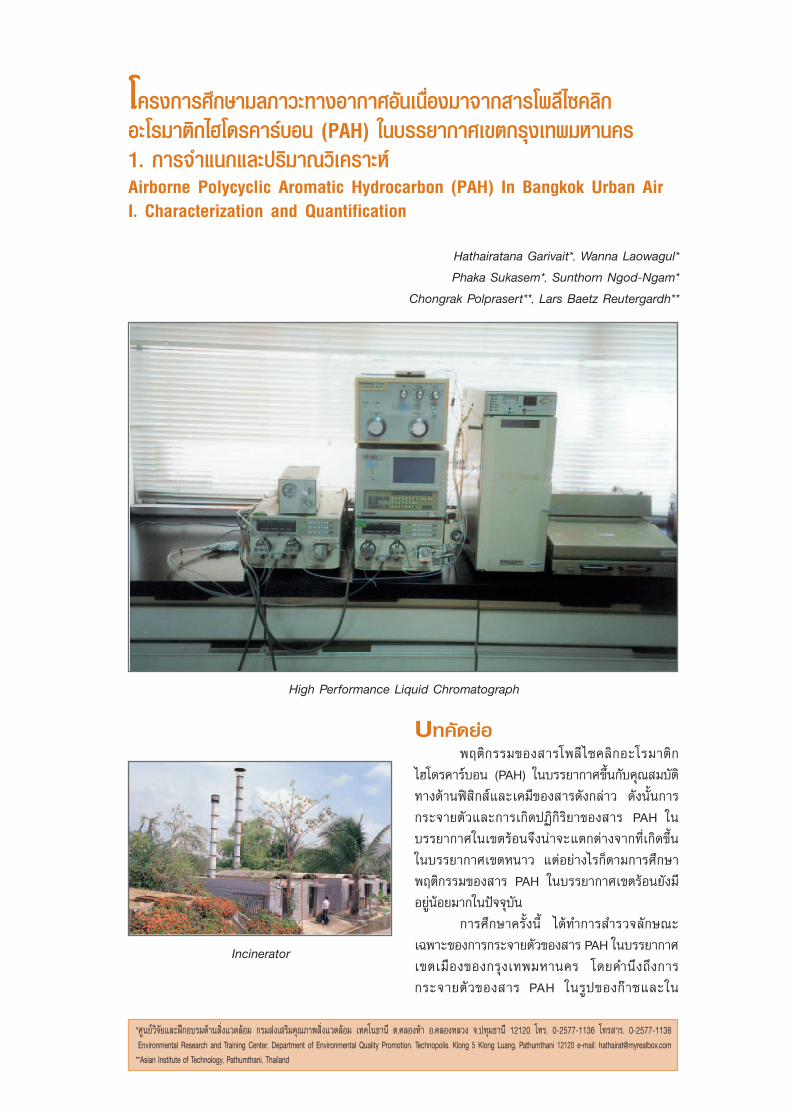
High Performance Liquid Chromatograph
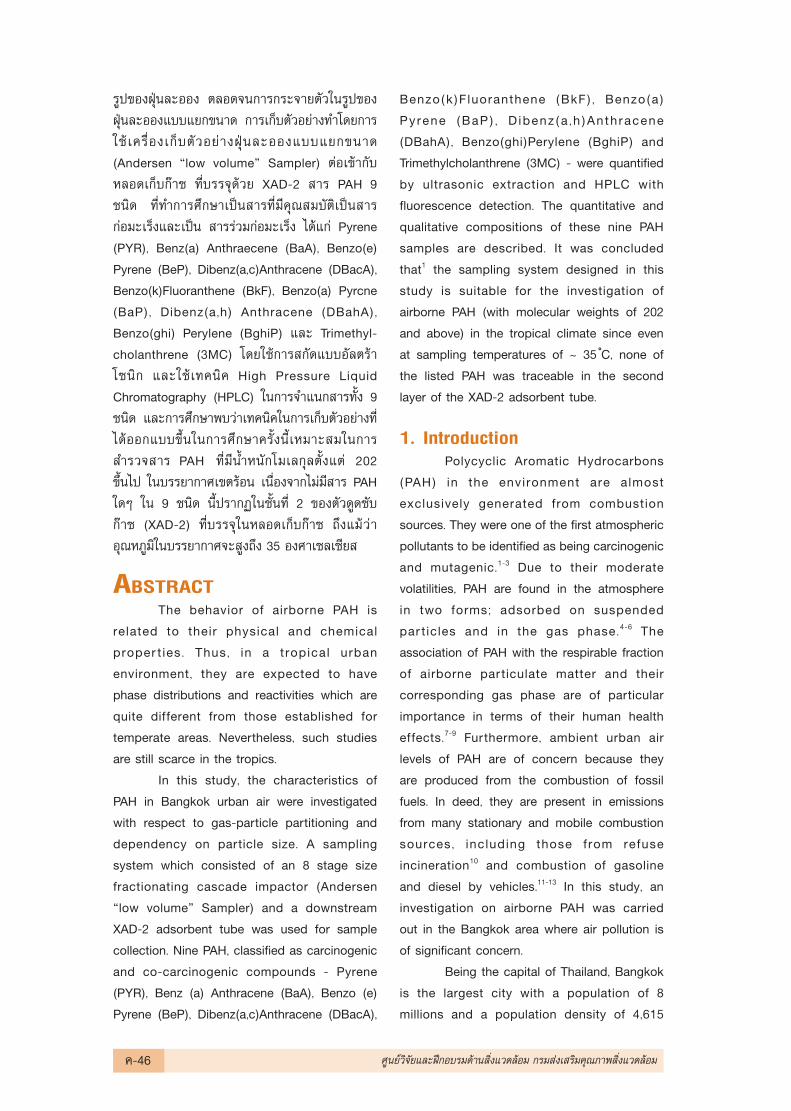
Incinerator
√Ÿª¢ÕßΩÿÉπ≈–ÕÕß µ≈Õ¥®π°“√°√–®“¬µ—«„π√Ÿª¢Õß
ΩÿÉπ≈–ÕÕß·∫∫·¬°¢π“¥ °“√‡°Á∫µ—«Õ¬à“ß∑”‚¥¬°“√
„™â ‡§√◊ËÕ߇°Á∫µ—«Õ¬à“ßΩÿÉπ≈–ÕÕß·∫∫·¬°¢π“¥
(Andersen çlow volumeé Sampler) µàÕ‡¢â“°—∫
À≈Õ¥‡°Á∫°ä“´ ∑’Ë∫√√®ÿ¥â«¬ XAD-2 “√ PAH 9
™π‘¥ ∑’Ë∑”°“√»÷°…“‡ªìπ “√∑’Ë¡’§ÿ≥ ¡∫—µ‘‡ªìπ “√
°àÕ¡–‡√Áß·≈–‡ªìπ “√√à«¡°àÕ¡–‡√Áß ‰¥â·°à Pyrene
(PYR), Benz(a) Anthraecene (BaA), Benzo(e)
Pyrene (BeP), Dibenz(a,c)Anthracene (DBacA),
Benzo(k)Fluoranthene (BkF), Benzo(a) Pyrcne
(BaP), Dibenz(a,h) Anthracene (DBahA),
Benzo(ghi) Perylene (BghiP) ·≈– Trimethyl-
cholanthrene (3MC) ‚¥¬„™â°“√ °—¥·∫∫Õ—≈µ√â“
‚´π‘° ·≈–„™â‡∑§π‘§ High Pressure Liquid
Chromatography (HPLC) „π°“√®”·π° “√∑—Èß 9
™π‘¥ ·≈–°“√»÷°…“æ∫«à“‡∑§π‘§„π°“√‡°Á∫µ—«Õ¬à“ß∑’Ë
‰¥âÕÕ°·∫∫¢÷Èπ„π°“√»÷°…“§√—Èßπ’ȇÀ¡“– ¡„π°“√
”√«® “√ PAH ∑’Ë¡’πÈ”Àπ—°‚¡‡≈°ÿ≈µ—Èß·µà 202
¢÷Èπ‰ª „π∫√√¬“°“»‡¢µ√âÕπ ‡π◊ËÕß®“°‰¡à¡’ “√ PAH
„¥Ê „π 9 ™π‘¥ π’Ȫ√“°Ø„π™—Èπ∑’Ë 2 ¢Õßµ—«¥Ÿ¥´—∫
°ä“´ (XAD-2) ∑’Ë∫√√®ÿ„πÀ≈Õ¥‡°Á∫°ä“´ ∂÷ß·¡â«à“
Õÿ≥À¿Ÿ¡‘„π∫√√¬“°“»®– Ÿß∂÷ß 35 Õß»“‡´≈‡´’¬
ABSTRACTThe behavior of airborne PAH is
related to their physical and chemical
proper t ies. Thus, in a tropical urban
environment, they are expected to have
phase distributions and reactivities which are
quite different from those established for
temperate areas. Nevertheless, such studies
are still scarce in the tropics.
In this study, the characteristics of
PAH in Bangkok urban air were investigated
with respect to gas-particle partitioning and
dependency on particle size. A sampling
system which consisted of an 8 stage size
fractionating cascade impactor (Andersen
çlow volumeé Sampler) and a downstream
XAD-2 adsorbent tube was used for sample
collection. Nine PAH, classified as carcinogenic
and co-carcinogenic compounds - Pyrene
(PYR), Benz (a) Anthracene (BaA), Benzo (e)
Pyrene (BeP), Dibenz(a,c)Anthracene (DBacA),
Benzo(k)Fluoranthene (BkF) , Benzo(a)
Pyrene (BaP) , D ibenz (a ,h )Anth racene
(DBahA), Benzo(ghi)Perylene (BghiP) and
Trimethylcholanthrene (3MC) - were quantified
by ultrasonic extraction and HPLC with
fluorescence detection. The quantitative and
qualitative compositions of these nine PAH
samples are described. It was concluded
that1 the sampling system designed in this
study is suitable for the investigation of
airborne PAH (with molecular weights of 202
and above) in the tropical climate since even
at sampling temperatures of ~ 35 ÌC, none of
the listed PAH was traceable in the second
layer of the XAD-2 adsorbent tube.
1. IntroductionPolycyclic Aromatic Hydrocarbons
(PAH) in the environment are almost
exclusively generated from combustion
sources. They were one of the first atmospheric
pollutants to be identified as being carcinogenic
and mutagenic.1-3 Due to their moderate
volatilities, PAH are found in the atmosphere
in two forms; adsorbed on suspended
par ticles and in the gas phase.4-6 The
association of PAH with the respirable fraction
of airborne particulate matter and their
corresponding gas phase are of particular
importance in terms of their human health
effects.7-9 Furthermore, ambient urban air
levels of PAH are of concern because they
are produced from the combustion of fossil
fuels. In deed, they are present in emissions
from many stationary and mobile combustion
sources, including those from refuse
incineration10 and combustion of gasoline
and diesel by vehicles.11-13 In this study, an
investigation on airborne PAH was carried
out in the Bangkok area where air pollution is
of significant concern.
Being the capital of Thailand, Bangkok
is the largest city with a population of 8
millions and a population density of 4,615
§-46 »Ÿπ¬å«‘®—¬·≈–Ωñ°Õ∫√¡¥â“π ‘Ëß·«¥≈âÕ¡ °√¡ à߇ √‘¡§ÿ≥¿“æ ‘Ëß·«¥≈âÕ¡
inhabitants/km2. Given current growth patterns,
the city will be a megacity in the year 2000.
The city lies in the monsoon zone in which
seasonal monsoon winds and sea breezes
prevail. The city is now facing serious air
pollution problems, since it has been the center
of rapid development in the country during
the past 5 decade. Particulate matter pollution
for particles equal to or less than 10 µm
in diameter (PM10) often exceeds the U.S.
24 hours standard of 150 mg/m3 for days
and weeks at a time. The major origins of
particulate matter pollution could be attributed
to construction activities and motor vehicle
traffic.14
At present, progress in the control of
atmospheric particulate matter in Thailand is
evaluated by calculating the total weight of
material collected by using a standard high
volume technique. This technique has been
applied to both total suspended particulate
matter (since 1981) and PM10 (since 1995).
The PM10 levels in Bangkok urban areas
generally exceeded the Thai ambient air
quality standard value of 120 mg/m3 over a
24 hours period. This severe situation may
reflect the fact that the air pollution control
techniques and/or technologies we have been
using in this area may not be very effective
for the particles in the respirable size range
(< 5 µm). Various issues have recently been
investigated to mitigate the air pollution
in Bangkok, e.g. Air Quality Management
Planning (1991); A Review of Current Air
Quality Standard (1993); Characterization of
ambient Suspended Particulate Matter (SPM)
in the Bangkok Metropolitan Region, BMR
(1996). These studies only emphasized the
quantity and elemental composition of SPM.
Those focus on the carcinogenic substances
such as PAH in airborne particulate matter are
still scarce in this country, even though
statistics on cancer in Thailand from 1988
to 1991 have shown that lung cancer is
the most common form of cancer in both
sexes in areas where the air pollution levels
are considered dangerous.15
On the other hand, many studiesaddressing carcinogenic substances inairborne particulate matter were performedworldwide over 20 years ago. However, mostof them were conducted in temperateenvironments. Although the concentrationsof PAH in urban environments have beenextensively studied, there are very few reportsfrom tropical areas and there is a notablepaucity of data from the Association ofSoutheast Asian Nations (ASEAN) region. Thelevels and distributions of airborne PAH ina tropical environment are expected to bedifferent from those obtained in the temperateones due to differences in type and scale ofemission sources as well as air temperature
In Thailand, the first study of thistype was done by Matsushita et al. (1987).16
Carcinogenic PAHs in airborne particulatein Bangkok, Chiang Mai and Tokyo werecompared. At that time, only total suspendedpar ticulate matter was considered. Theinfluences of the particle size and of thecorresponding gas phase on the PAHcomposition were not documented. Theobjective of this study is to implement anappropriate sampling and analytical techniqueto investigate the amount of airborne PAHwith respect to their particle size dependencyand phase distribution in Bangkok. This aimsto provide an understanding of the environ-mental fate and the extent of human exposureto these substances in a tropical environment.
2. Methods and Materials
2.1 Sampling LocationsTo measure PAH and to characterize
PAH composition with respect to their
gas-particle partitioning and size dependency
in the Bangkok urban area, an urban
residential site, the Office of Environmental
»Ÿπ¬å«‘®—¬·≈–Ωñ°Õ∫√¡¥â“π ‘Ëß·«¥≈âÕ¡ °√¡ à߇ √‘¡§ÿ≥¿“æ ‘Ëß·«¥≈âÕ¡ §-47
Policy and Planning (OEPP), was selected
from the National Air Quality Monitoring
Network in Bangkok. It is located in the urban
center and is surrounded by commercial
buildings, government offices, houses, roads
and expressways. Moreover, there are few
industries within a 10 km radius of the
sampling site. The sampler was placed about
20 meters from the ground on the top of a
7-story building.
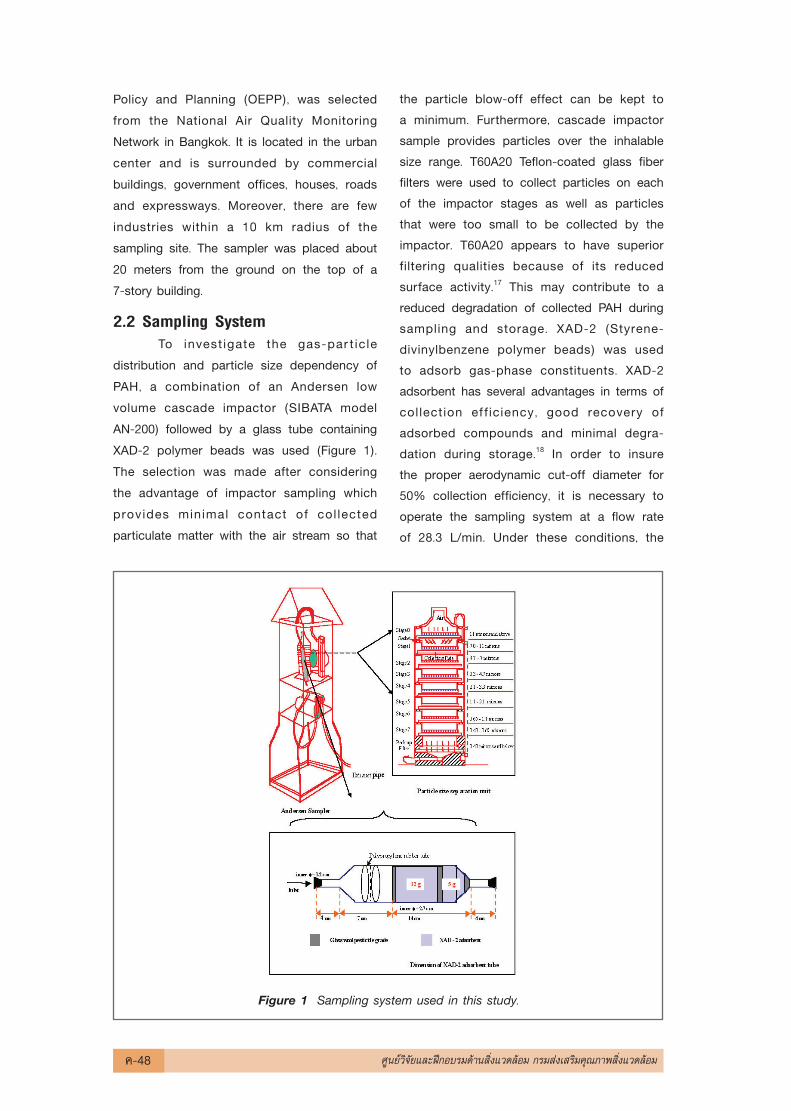
2.2 Sampling SystemTo invest igate the gas-par t ic le
distribution and particle size dependency of
PAH, a combination of an Andersen low
volume cascade impactor (SIBATA model
AN-200) followed by a glass tube containing
XAD-2 polymer beads was used (Figure 1).
The selection was made after considering
the advantage of impactor sampling which
provides minimal contact of col lected
particulate matter with the air stream so that
the particle blow-off effect can be kept toa minimum. Furthermore, cascade impactorsample provides particles over the inhalablesize range. T60A20 Teflon-coated glass fiberfilters were used to collect particles on eachof the impactor stages as well as particlesthat were too small to be collected by theimpactor. T60A20 appears to have superiorfiltering qualities because of its reducedsurface activity.17 This may contribute to areduced degradation of collected PAH duringsampling and storage. XAD-2 (Styrene-divinylbenzene polymer beads) was usedto adsorb gas-phase constituents. XAD-2adsorbent has several advantages in terms ofcollection ef f iciency, good recovery ofadsorbed compounds and minimal degra-dation during storage.18 In order to insurethe proper aerodynamic cut-off diameter for50% collection efficiency, it is necessary tooperate the sampling system at a flow rateof 28.3 L/min. Under these conditions, the
Figure 1 Sampling system used in this study.
§-48 »Ÿπ¬å«‘®—¬·≈–Ωñ°Õ∫√¡¥â“π ‘Ëß·«¥≈âÕ¡ °√¡ à߇ √‘¡§ÿ≥¿“æ ‘Ëß·«¥≈âÕ¡
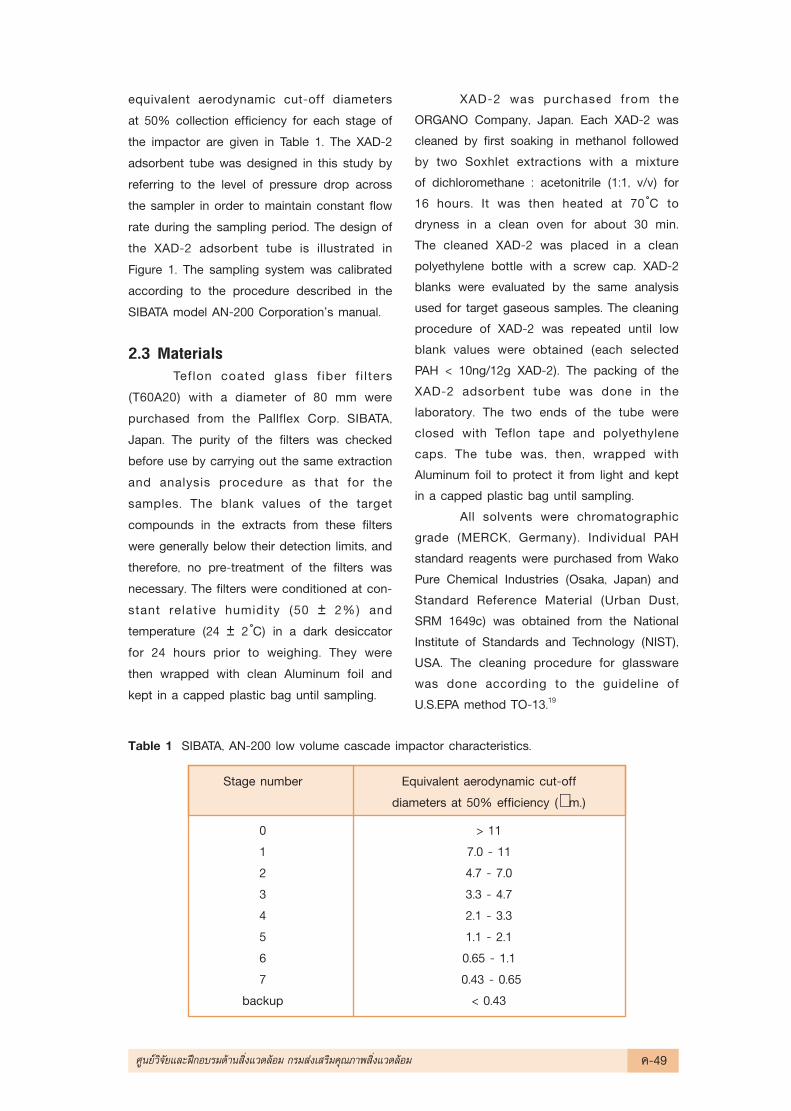
equivalent aerodynamic cut-off diameters
at 50% collection efficiency for each stage of
the impactor are given in Table 1. The XAD-2
adsorbent tube was designed in this study by
referring to the level of pressure drop across
the sampler in order to maintain constant flow
rate during the sampling period. The design of
the XAD-2 adsorbent tube is illustrated in
Figure 1. The sampling system was calibrated
according to the procedure described in the
SIBATA model AN-200 Corporationûs manual.
2.3 MaterialsTeflon coated glass f iber f i l ters
(T60A20) with a diameter of 80 mm were
purchased from the Pallflex Corp. SIBATA,
Japan. The purity of the filters was checked
before use by carrying out the same extraction
and analysis procedure as that for the
samples. The blank values of the target
compounds in the extracts from these filters
were generally below their detection limits, and
therefore, no pre-treatment of the filters was
necessary. The filters were conditioned at con-
stant relative humidity (50 ± 2%) and
temperature (24 ± 2 ÌC) in a dark desiccator
for 24 hours prior to weighing. They were
then wrapped with clean Aluminum foil and
kept in a capped plastic bag until sampling.
XAD-2 was purchased from theORGANO Company, Japan. Each XAD-2 wascleaned by first soaking in methanol followedby two Soxhlet extractions with a mixtureof dichloromethane : acetonitrile (1:1, v/v) for16 hours. It was then heated at 70 ÌC todryness in a clean oven for about 30 min.The cleaned XAD-2 was placed in a cleanpolyethylene bottle with a screw cap. XAD-2blanks were evaluated by the same analysisused for target gaseous samples. The cleaningprocedure of XAD-2 was repeated until lowblank values were obtained (each selectedPAH < 10ng/12g XAD-2). The packing of theXAD-2 adsorbent tube was done in thelaboratory. The two ends of the tube wereclosed with Teflon tape and polyethylenecaps. The tube was, then, wrapped withAluminum foil to protect it from light and keptin a capped plastic bag until sampling.
All solvents were chromatographicgrade (MERCK, Germany). Individual PAHstandard reagents were purchased from WakoPure Chemical Industries (Osaka, Japan) andStandard Reference Material (Urban Dust,SRM 1649c) was obtained from the NationalInstitute of Standards and Technology (NIST),USA. The cleaning procedure for glasswarewas done according to the guideline ofU.S.EPA method TO-13.19
Stage number Equivalent aerodynamic cut-off
diameters at 50% efficiency (µm.)
0 > 11
1 7.0 - 11
2 4.7 - 7.0
3 3.3 - 4.7
4 2.1 - 3.3
5 1.1 - 2.1
6 0.65 - 1.1
7 0.43 - 0.65
backup < 0.43
Table 1 SIBATA, AN-200 low volume cascade impactor characteristics.
»Ÿπ¬å«‘®—¬·≈–Ωñ°Õ∫√¡¥â“π ‘Ëß·«¥≈âÕ¡ °√¡ à߇ √‘¡§ÿ≥¿“æ ‘Ëß·«¥≈âÕ¡ §-49
2.4 Sample Collection and AnalysisTo avoid wet removal of airborne
PAH20, the study was done during the dry
season when SPM pollution in Bangkok is
the most serious.
Sample collection was performed by
drawing air at flow rate of 28.3 L/min. through
the sampling unit. The particulate phase
was defined as that trapped on the filters for
all eight stages of the impactor and the
backup filter in the particle size separation
unit. The corresponding gas phase was
defined as that associated with the two layers
of XAD-2 packed in the adsorbent tube. PAH
were sampled for 24 hours during 23-29
May 1996, resulting in 7 sets of samples.
The exposed filters were folded in half and
wrapped separately in Aluminum foil; then
the set was kept together in a capped plastic
bag, while the exposed XAD-2 adsorbent
tube was capped and put into a capped
plastic bag to reduce contamination. After
collection, the samples were transferred
back to the laboratory where the filters were
dried in a dark desiccator for 24 hours and
weighed 3 times on a 5 decimal place
gram analytical balance. Weight differences
were used to determine the particulate matter
concentration in each particle size range. All
samples were stored at -85 ÌC in the dark
until extraction.
2.5 Chemical Analysis2.5.1 Particle-bound PAH
A very sensitive analytical method
(Matsushita et al., 1994)21 was referred to
determine particulate-PAH concentrations in
this study. This method was developed to
survey indoor PAH pollution. It was appropriate
for this study because sample collection was
performed with an Andersen low volume air
sampler for only 24 hours, hence requiring
high sensitivity. The description of analytical
procedure is outlined as follows:
Two or four circular samples, each of 25 mm
diameter, were punched out from each stage of
the Andersen sampler and cut into small pieces
with ceramic scissors. All pieces were put into
a screw cap centrifuge tube (20 mL) with a
Teflon liner. 15 mL of dichloromethane was
added to the tube. The tube was sealed and
placed in an ultrasonic bath (38 Hz, 250 W)
and sonicated twice for 20 min at 10 ÌC. The
tube was then centrifuged at 3000 rpm for 10
min. 10 ml of supernatant was transferred to
a small test tube, and 30 µL of DMSO
(dimethylsulfoxide) was added to retain PAH.
The test tube was then set in a dry thermostat
unit (Taitec, Model DTU-1B) at about 30 ÌC
and the dichloromethane was evaporated
under a gentle nitrogen stream. The residue
in the test tube was dissolved with 970 mL
of acetonitrile. Finally, the extracted samples
were filtered prior to separation analysis using
a CAMEO II, filter assembly with a 0.22 µm
pore Nylon filter.
2.5.2 Gas phase PAH
Each exposed XAD-2 adsorbent (i.e.
12 g and 5 g) was extracted separately twice
with a 100ml mixture of acetonitrile and
dichloromethane 1:1 (v/v) in an ultrasonic bath
for 20 min at 10 ÌC. The crude extracts were
treated identically to the aerosol extracts.
2.6 Determination of PAHSeparation analysis was performed
on a Shimadzu LC9A High Performance
Liquid Chromatograph (HPLC) with fluores-
cence detection. Excitation and emission
wavelengths were 295 nm and 405 nm,
respectively. A wide bore Octadecyl column
(C18, 5 mm., Wakosil) 4.6 x 250 mm and an
identical pre-column of 50 mm were used.
The mobile phase flow was 1mL/min and
the gradient conditions were: 50% acetonitrile
in water (5 min) followed by, 50% to 85% (20
min, linear), 85% to 100% (20 min, linear),
100% (20 min). The temperature of the columns
§-50 »Ÿπ¬å«‘®—¬·≈–Ωñ°Õ∫√¡¥â“π ‘Ëß·«¥≈âÕ¡ °√¡ à߇ √‘¡§ÿ≥¿“æ ‘Ëß·«¥≈âÕ¡
was maintained at 40 ÌC and a 50 mL
injection volume was used. The two eluents, ac-
etonitrile and water, were filtered through
0.22 µm filters before use. The nine PAH,
classified as carcinogenic and co-carcino-
genic compounds - Pyrene (PYR), Benz(a)
Anthracene (BaA), Benzo(e)Pyrene (BeP),
Dibenz(a,c)Anthracene (DBacA), Benzo(k)
Fluoranthene (BkF), Benzo(a)Pyrene (BaP),
Dibenz(a,h)Anthracene (DBahA), Benzo(ghi)
Perylene (BghiP) and Trimethylcholanthrene
(3MC) - were identified and their concentrations
determined by comparison with a mixture of
authentic standards.
3. Results and Discussion
3.1 Reliability of PAH AnalysisIn the study, nine PAH compounds
were selected as indicators of atmospheric
carcinogenicity and/or mutagenicity. Before the
sampling program, the recovery of PAH on XAD-
2 and on the filters was determined. This
involved spiking six separate XAD-2 adsorbent
(12 grams) and six filters with a working
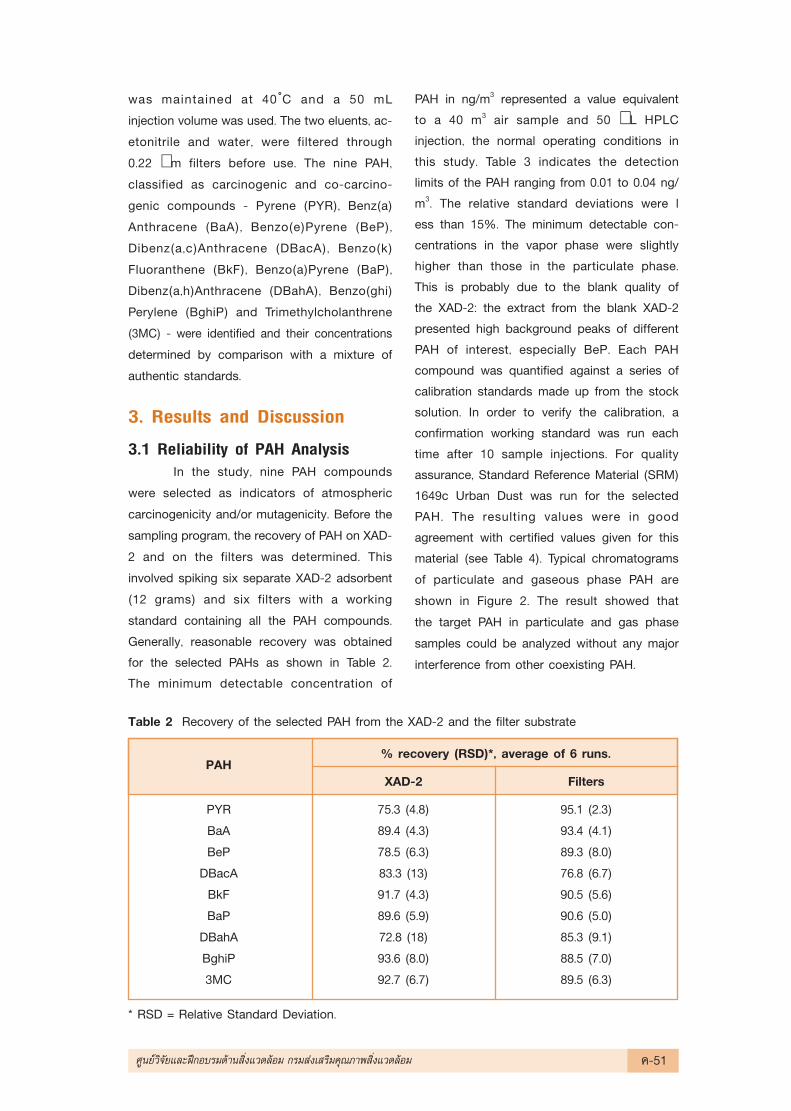
standard containing all the PAH compounds.Generally, reasonable recovery was obtainedfor the selected PAHs as shown in Table 2.The minimum detectable concentration of
PAH in ng/m3 represented a value equivalentto a 40 m3 air sample and 50 µL HPLCinjection, the normal operating conditions inthis study. Table 3 indicates the detectionlimits of the PAH ranging from 0.01 to 0.04 ng/m3. The relative standard deviations were less than 15%. The minimum detectable con-centrations in the vapor phase were slightlyhigher than those in the particulate phase.This is probably due to the blank quality ofthe XAD-2: the extract from the blank XAD-2presented high background peaks of differentPAH of interest, especially BeP. Each PAHcompound was quantified against a series ofcalibration standards made up from the stocksolution. In order to verify the calibration, aconfirmation working standard was run eachtime after 10 sample injections. For qualityassurance, Standard Reference Material (SRM)1649c Urban Dust was run for the selectedPAH. The resulting values were in goodagreement with certified values given for thismaterial (see Table 4). Typical chromatogramsof particulate and gaseous phase PAH are
shown in Figure 2. The result showed that
the target PAH in particulate and gas phase
samples could be analyzed without any major
interference from other coexisting PAH.
Table 2 Recovery of the selected PAH from the XAD-2 and the filter substrate
PAH% recovery (RSD)*, average of 6 runs.
XAD-2 Filters
PYR 75.3 (4.8) 95.1 (2.3)
BaA 89.4 (4.3) 93.4 (4.1)
BeP 78.5 (6.3) 89.3 (8.0)
DBacA 83.3 (13) 76.8 (6.7)
BkF 91.7 (4.3) 90.5 (5.6)
BaP 89.6 (5.9) 90.6 (5.0)
DBahA 72.8 (18) 85.3 (9.1)
BghiP 93.6 (8.0) 88.5 (7.0)
3MC 92.7 (6.7) 89.5 (6.3)
* RSD = Relative Standard Deviation.
»Ÿπ¬å«‘®—¬·≈–Ωñ°Õ∫√¡¥â“π ‘Ëß·«¥≈âÕ¡ °√¡ à߇ √‘¡§ÿ≥¿“æ ‘Ëß·«¥≈âÕ¡ §-51
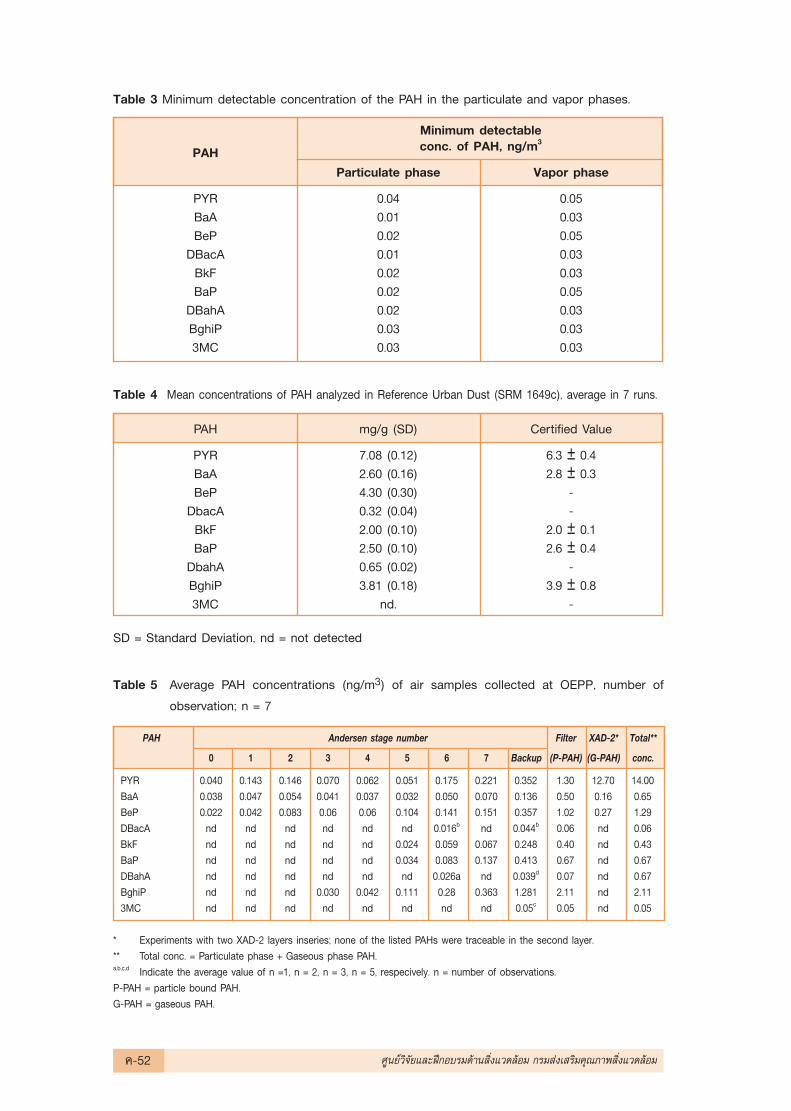
Table 3 Minimum detectable concentration of the PAH in the particulate and vapor phases.
PAH
Minimum detectableconc. of PAH, ng/m3
Particulate phase Vapor phase
PYR 0.04 0.05BaA 0.01 0.03BeP 0.02 0.05
DBacA 0.01 0.03BkF 0.02 0.03BaP 0.02 0.05
DBahA 0.02 0.03BghiP 0.03 0.033MC 0.03 0.03
Table 4 Mean concentrations of PAH analyzed in Reference Urban Dust (SRM 1649c), average in 7 runs.
PAH mg/g (SD) Certified Value
PYR 7.08 (0.12) 6.3 ± 0.4BaA 2.60 (0.16) 2.8 ± 0.3BeP 4.30 (0.30) -
DbacA 0.32 (0.04) -BkF 2.00 (0.10) 2.0 ± 0.1BaP 2.50 (0.10) 2.6 ± 0.4
DbahA 0.65 (0.02) -BghiP 3.81 (0.18) 3.9 ± 0.83MC nd. -
SD = Standard Deviation, nd = not detected
PAH Andersen stage number Filter XAD-2* Total**
0 1 2 3 4 5 6 7 Backup (P-PAH) (G-PAH) conc.
PYR 0.040 0.143 0.146 0.070 0.062 0.051 0.175 0.221 0.352 1.30 12.70 14.00BaA 0.038 0.047 0.054 0.041 0.037 0.032 0.050 0.070 0.136 0.50 0.16 0.65BeP 0.022 0.042 0.083 0.06 0.06 0.104 0.141 0.151 0.357 1.02 0.27 1.29DBacA nd nd nd nd nd nd 0.016b nd 0.044b 0.06 nd 0.06BkF nd nd nd nd nd 0.024 0.059 0.067 0.248 0.40 nd 0.43BaP nd nd nd nd nd 0.034 0.083 0.137 0.413 0.67 nd 0.67DBahA nd nd nd nd nd nd 0.026a nd 0.039d 0.07 nd 0.67BghiP nd nd nd 0.030 0.042 0.111 0.28 0.363 1.281 2.11 nd 2.113MC nd nd nd nd nd nd nd nd 0.05c 0.05 nd 0.05
* Experiments with two XAD-2 layers inseries; none of the listed PAHs were traceable in the second layer.** Total conc. = Particulate phase + Gaseous phase PAH.a,b,c,d Indicate the average value of n =1, n = 2, n = 3, n = 5, respecively. n = number of observations.P-PAH = particle bound PAH.G-PAH = gaseous PAH.
Table 5 Average PAH concentrations (ng/m3) of air samples collected at OEPP, number of
observation; n = 7
§-52 »Ÿπ¬å«‘®—¬·≈–Ωñ°Õ∫√¡¥â“π ‘Ëß·«¥≈âÕ¡ °√¡ à߇ √‘¡§ÿ≥¿“æ ‘Ëß·«¥≈âÕ¡
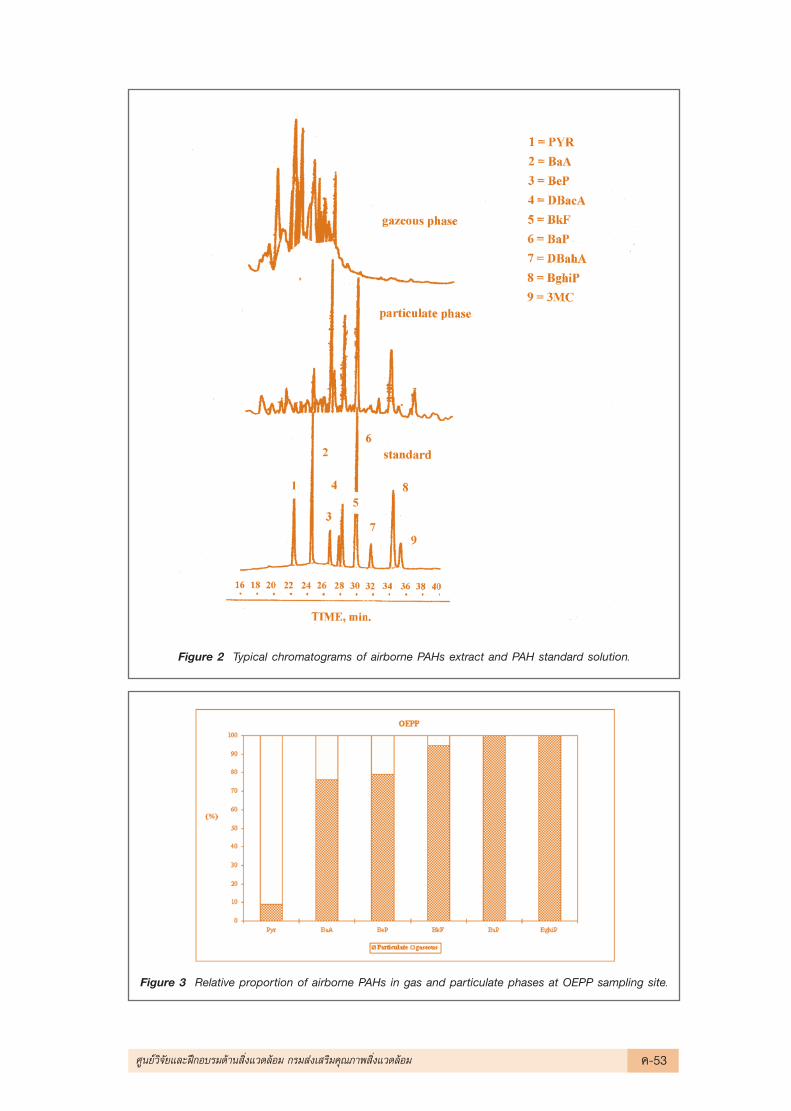
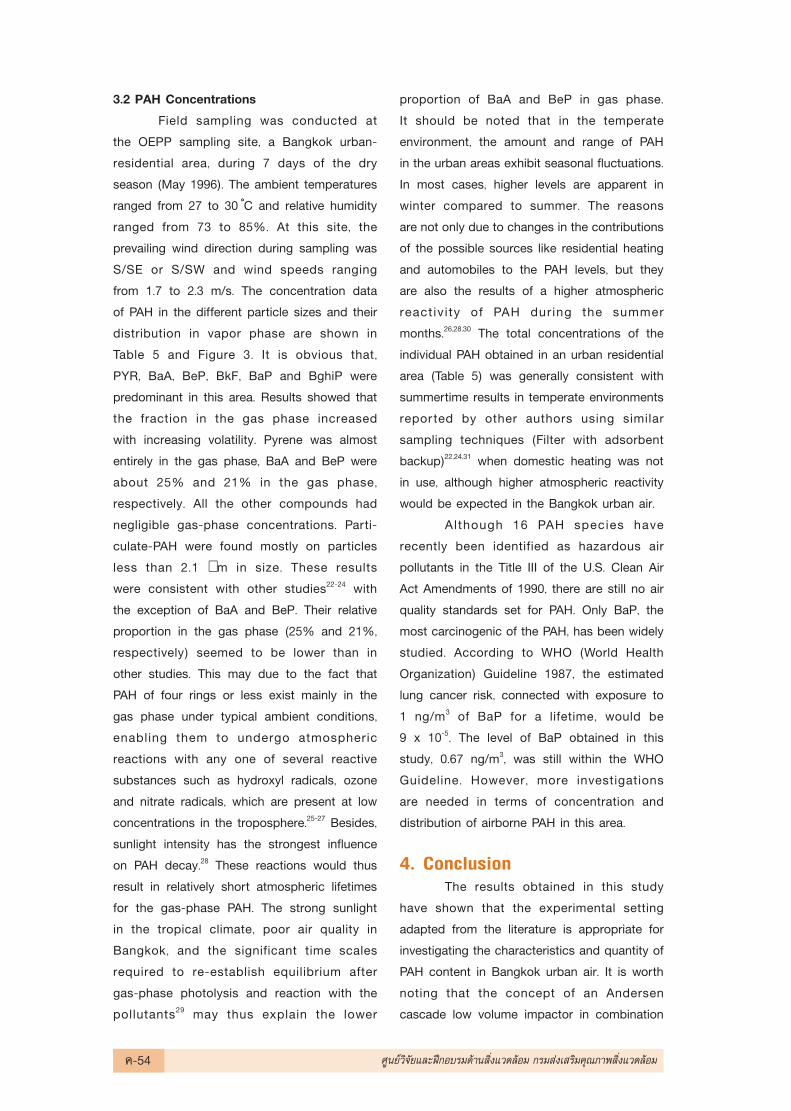
Figure 3 Relative proportion of airborne PAHs in gas and particulate phases at OEPP sampling site.
Figure 2 Typical chromatograms of airborne PAHs extract and PAH standard solution.
»Ÿπ¬å«‘®—¬·≈–Ωñ°Õ∫√¡¥â“π ‘Ëß·«¥≈âÕ¡ °√¡ à߇ √‘¡§ÿ≥¿“æ ‘Ëß·«¥≈âÕ¡ §-53
3.2 PAH Concentrations
Field sampling was conducted at
the OEPP sampling site, a Bangkok urban-
residential area, during 7 days of the dry
season (May 1996). The ambient temperatures
ranged from 27 to 30 ÌC and relative humidity
ranged from 73 to 85%. At this site, the
prevailing wind direction during sampling was
S/SE or S/SW and wind speeds ranging
from 1.7 to 2.3 m/s. The concentration data
of PAH in the different particle sizes and their
distribution in vapor phase are shown in
Table 5 and Figure 3. It is obvious that,
PYR, BaA, BeP, BkF, BaP and BghiP were
predominant in this area. Results showed that
the fraction in the gas phase increased
with increasing volatility. Pyrene was almost
entirely in the gas phase, BaA and BeP were
about 25% and 21% in the gas phase,
respectively. All the other compounds had
negligible gas-phase concentrations. Parti-
culate-PAH were found mostly on particles
less than 2.1 µm in size. These results
were consistent with other studies22-24 with
the exception of BaA and BeP. Their relative
proportion in the gas phase (25% and 21%,
respectively) seemed to be lower than in
other studies. This may due to the fact that
PAH of four rings or less exist mainly in the
gas phase under typical ambient conditions,
enabling them to undergo atmospheric
reactions with any one of several reactive
substances such as hydroxyl radicals, ozone
and nitrate radicals, which are present at low
concentrations in the troposphere.25-27 Besides,
sunlight intensity has the strongest influence
on PAH decay.28 These reactions would thus
result in relatively short atmospheric lifetimes
for the gas-phase PAH. The strong sunlight
in the tropical climate, poor air quality in
Bangkok, and the significant time scales
required to re-establish equilibrium after
gas-phase photolysis and reaction with the
pollutants29 may thus explain the lower
proportion of BaA and BeP in gas phase.
It should be noted that in the temperate
environment, the amount and range of PAH
in the urban areas exhibit seasonal fluctuations.
In most cases, higher levels are apparent in
winter compared to summer. The reasons
are not only due to changes in the contributions
of the possible sources like residential heating
and automobiles to the PAH levels, but they
are also the results of a higher atmospheric
react iv i ty of PAH during the summer
months.26,28,30 The total concentrations of the
individual PAH obtained in an urban residential
area (Table 5) was generally consistent with
summertime results in temperate environments
reported by other authors using similar
sampling techniques (Filter with adsorbent
backup)22,24,31 when domestic heating was not
in use, although higher atmospheric reactivity
would be expected in the Bangkok urban air.
Although 16 PAH species have
recently been identified as hazardous air
pollutants in the Title III of the U.S. Clean Air
Act Amendments of 1990, there are still no air
quality standards set for PAH. Only BaP, the
most carcinogenic of the PAH, has been widely
studied. According to WHO (World Health
Organization) Guideline 1987, the estimated
lung cancer risk, connected with exposure to
1 ng/m3 of BaP for a lifetime, would be
9 x 10⁻⁵. The level of BaP obtained in this
study, 0.67 ng/m3, was still within the WHO
Guideline. However, more investigations
are needed in terms of concentration and
distribution of airborne PAH in this area.
4. ConclusionThe results obtained in this study
have shown that the experimental setting
adapted from the literature is appropriate for
investigating the characteristics and quantity of
PAH content in Bangkok urban air. It is worth
noting that the concept of an Andersen
cascade low volume impactor in combination
§-54 »Ÿπ¬å«‘®—¬·≈–Ωñ°Õ∫√¡¥â“π ‘Ëß·«¥≈âÕ¡ °√¡ à߇ √‘¡§ÿ≥¿“æ ‘Ëß·«¥≈âÕ¡
with XAD-2 adsorbent tube represent a suitable
alternative of obtaining results that takes into
account the phase distribution and the particle
size dependency of airborne PAH. The
collection of the gas phase PAH by the XAD-2
adsorbent tube, specially designed in this
study, was found to be a well-adapted tool for
sampling in tropical climates where sunlight
and temperature conditions are expected to
strongly influence the gas-particle partitioning
of certain PAH. In deed, we noted in this study
that even at the sampling temperatures of
~ 35 ÌC during daytime, none of the listed
PAH (with molecular weights of 202 and
above) was detected in the backup layer of
the XAD-2 adsorbent tube.
5. AcknowledgementsWe gratefully acknowledge Environ-
mental Research and Training Center, Thailand
for the support of this study. The very helpful
advices of Professor H. Matsushita and Dr.
T. Amagai, University of Shizuoka, Japan for
the establishment of the analytical method
are greatly appreciated. We are extremely
grateful to Professor R.M. Kamens and Dr. M. R.
Strommen, University of North Carolina at
Chapel Hill USA, for their very helpful comments.
We also deeply appreciate Pollution Control
Department, Thailand for the support of air
quality monitoring data in Bangkok.
6. References1. International Agency for Research in
Cancer, (1983), IARC Monographs on the
Evaluation of the Carcinogenic Risk of
Chemicals to Humans : Polynuclear Aromatic
Compounds, Part 1., Volume 32, IARC,
Lyon, France.
2. W. R. Gala and J. P. Giesy, (1994), Environ.
Toxico. Chem., 13, pp. 831.
3. R. Van Der Oost, F. Van Schooten, F. Ariese,
H. Heida, K. Satumalay and N. P. E.
Vermerlen, (1994), Environ. Toxico. Chem.,
13, pp. 859.
4. S. O. Baek, R. A. Field, M. E. Goldstone,
P. W. Kirk, J. N. Lester and R. Perry, (1991),
Water, Air and soil Pollution, 60, pp. 279.
5. J. F. Pankow, (1987), Atmos. Environ., 21,
pp. 2275.
6. H. Yamasaki, K. Kuwata and H. Miyamoto,
(1982), Environ. Sci. Technol., 16, pp. 189.
7. R-H. Lin, C-R. Wang and C-S. Li, (1994),
Environment International, 20, pp. 161.
8. K. Nikolaou, P. Masclet and G. Mouvier,
(1984), Sci. Total Environ., 32, pp. 103.
9. D. Grosjean, (1983), Atmos. Environ., 17, pp.
2565.
10. Y. Mamane, (1990), Atmos. Environ., 24A,
pp. 127.
11. T. Nielsen, (1996), Atmos. Environ., 30, pp.
3481.
12. R. Westerholm, U. Stenberg and T. Alsberg,
(1988), Atmos. Environ.,22, pp. 1005.
13. P.S. Pedersen, J. Ingwersen, T. Nielsen
and E. Larsen, (1980), Am.Chem. Soc., 14,
pp. 71.
14. Pollution Control Department, (1998),
Particulate matter abatement strategy for
the Bangkok Metropolitan Area report,
Volume I, Pollution Control Department,
Ministry of Science, Technology, and
Environment. Thailand.
15. International Agency for Research in
Cancer, (1993), IARC Technical Report on
Cancer in Thailand 1988-1991, IARC, 16,
Lyon , France.
16. H. Matsushita, K. Ching-Tang, M. Tabucanon
and S. Kootatep, (1987), Proceedings of
the third Joint Conference of Air Pollution
Studies in Asian Areas, Tokyo, pp. 304.
17. C. S. Davis, P. Fellin and R. Otson, (1987),
JAPCA., 37, pp. 1397.
18. J.C. Chuang, S.W. Hannan and N.K.Wilson,
(1987), Environ. Sci.Technol., 21, pp. 798.
19. US. Environmental Protection Agency, (1988),
»Ÿπ¬å«‘®—¬·≈–Ωñ°Õ∫√¡¥â“π ‘Ëß·«¥≈âÕ¡ °√¡ à߇ √‘¡§ÿ≥¿“æ ‘Ëß·«¥≈âÕ¡ §-55
The determination of Benzo(a)pyrene
(BaP) and other Polynuclear Aromatic
Hydrocarbons (PAHs) in ambient air using
Gas Chromatographic (GC) and High
Performance Liquid Chromatographic
(HPLC) Analysis, US. Environmental
Protection Agency, US. EPA. Method
TO-13.
20. D. L. Poster and J. E. Baker, (1996), Environ.
Sci. Technol., 30, pp. 341.
21. H. Matsushita, Y. Takahashi, S. Azuma, H.
Hiroi and T. Amagai, (1994)Proceeding of
the International Conference on Indoor Air
Quality, International Association for Indoor
Air Quality, Rothenfluh, Switzerland, pp. 236.
22. R. Niehaus, B. Scheulen and H. W. Durbeck,
(1990), Sci. Total Environ., 99, pp. 163.
23. S.O. Baek, M.E. Goldstone, P.W.W. Kirk, J.N.
Lester and R. Perry, (1991), Chemosphere,
22, pp. 503.
24. R.M. Harrison, D.J.T. Smith and L. Luhana,
(1996), Environ. Sci. Technol., 30, pp.825.
25. N. J. Bunce and H. G. Dryfhout, (1992),
Can. J. Chem., 70, pp. 1966.
26. R.M. Kamens, H. Karam, J. Guo, J.M. Perry
and L. Stockburger, (1989), Environ. Sci.
Technol., 23, pp. 801.
27. M. Jang and S. R. McDow, (1997), Environ.
Sci. Technol, 31, pp.1046.
28. R.M. Kamens, Z. Guo, J.N. Fulcher and
D.A. Bell, (1988), Environ. Sci. Technol., 22,
pp. 103.
29. M.R. Strommen and R.M. Kamens, (1997),
Environ. Sci. Technol., 31, pp. 2983.
30. P. Masclet, G. Mouvier and K. Nikolaou,
(1986), Atmos. Environ., 20, pp. 439.
31. C. J. Halsall, P. J. Coleman, B. J. Davis,
V. Burnett, K. S. Waterhouse P. Harding-
Jones and K. C. Jones, (1994), Environ.
Sci. Technol., 28, pp. 2380.
§-56 »Ÿπ¬å«‘®—¬·≈–Ωñ°Õ∫√¡¥â“π ‘Ëß·«¥≈âÕ¡ °√¡ à߇ √‘¡§ÿ≥¿“æ ‘Ëß·«¥≈âÕ¡