noise3
6
°“√»÷°…“§«“¡‡ªìπ‰ª‰¥â„π°“√µ√«®«—¥„π√–¬– —ÈπÊ ”À√—∫°“√µ√«®«—¥‡ ’¬ß „π ¿“«–·«¥≈âÕ¡„π‡¢µ°√ÿ߇∑æ¡À“π§√ Feasibility Study of Short-term Method for Environmental Noise Measurement in Bangkok N.Chansombat*, T.Suksa-ard*, W.Auesongtham*, T.Norach*, P.Sukasem*, M.S.Tabucanon*, H.Tanaka*, P.Areephol**, S.Bualert**, C.Yachoosri**, R.Watananukulkit** ∫∑§—¥¬àÕ „πªí®®ÿ∫—πªí≠À“‡ ’¬ß√∫°«π„πª√–‡∑»‰∑¬ ‰¥â‡ªìπªí≠À“ ”§—≠·≈–∑«’§«“¡√ÿπ·√߇™àπ‡¥’¬«°—∫ ªí≠À“ ‘Ëß·«¥≈âÕ¡Õ◊Ëπ ‚¥¬‡©æ“–Õ¬à“߬‘Ëß„π °√ÿ߇∑æ¡À“π§√ ´÷Ë߇ªìπ»Ÿπ¬å°≈“ߧ«“¡‡®√‘≠∑“ß ¥â“π‡»√…∞°‘®·≈–°“√æ—≤π“ —ß§¡ ¡’‚§√ß°“√‡°‘¥¢÷È𠇪ìπ®”π«π¡“° ‡™à𠂧√ß°“√∑“ߥà«π ∂ππ«ß·À«π √Õ∫πÕ° √–∫∫¢π àß¡«≈™π·≈–‚§√ß°“√ π“¡∫‘π π“π“™“µ‘°√ÿ߇∑æ·Ààß∑’Ë Õß ‡ªìπµâπ ‡æ◊ËÕ√Õß√—∫°“√ ¢¬“¬µ—«¢Õ߇¡◊Õß„πÕ𓧵 ‡æ◊ËÕ∑√“∫ ∂“π°“√≥å ªí≠À“¡≈æ‘…∑“߇ ’¬ß„π‡¢µ°√ÿ߇∑æ¡À“π§√ °√¡ §«∫§ÿ¡¡≈æ‘…‰¥âµ√«®«—¥√–¥—∫‡ ’¬ß‡©≈’ˬ 24 ™—Ë«‚¡ß *»Ÿπ¬å«‘®—¬·≈–Ωñ°Õ∫√¡¥â“π ‘Ëß·«¥≈âÕ¡ °√¡ à߇ √‘¡§ÿ≥¿“æ ‘Ëß·«¥≈âÕ¡ ‡∑§‚π∏“π’ µ.§≈ÕßÀâ“ Õ.§≈ÕßÀ≈«ß ®.ª∑ÿ¡∏“π’ 12120 ‚∑√. 0-2577-1136 ‚∑√ “√. 0-2577-1138 Environmental Research and Training Center, Department of Environmental Quality Promotion. Technopolis. Klong 5, Klong Luang, Pathumthani 12120 e-mail: [email protected] **§≥–«‘∑¬“»“ µ√å ®ÿÓ≈ß°√≥å¡À“«‘∑¬“≈—¬ Sound Level Meter Fig. 1 Map of Measurement Point
-
Upload
department-of-environmental-quality-promotion-thailand -
Category
Documents
-
view
214 -
download
1
description
∫ ∑§— ¥ ¬à Õ ”À√— ∫ °“√µ√«®«— ¥ ‡ ’ ¬ ß „π ¿“«–·«¥≈â Õ ¡„π‡¢µ°√ÿ ß ‡∑æ¡À“π§√ Fig. 1 Map of Measurement Point Sound Level Meter
Transcript of noise3
°“√»÷°…“§«“¡‡ªìπ‰ª‰¥â„π°“√µ√«®«—¥„π√–¬– —ÈπÊ ”À√—∫°“√µ√«®«—¥‡ ’¬ß „π ¿“«–·«¥≈âÕ¡„π‡¢µ°√ÿ߇∑æ¡À“π§√Feasibility Study of Short-term Method for Environmental NoiseMeasurement in Bangkok
N.Chansombat*, T.Suksa-ard*,
W.Auesongtham*, T.Norach*, P.Sukasem*,
M.S.Tabucanon*, H.Tanaka*, P.Areephol**,
S.Bualert**, C.Yachoosri**, R.Watananukulkit**
∫∑§—¥¬àÕ„πªí®®ÿ∫—πªí≠À“‡ ’¬ß√∫°«π„πª√–‡∑»‰∑¬
‰¥â‡ªìπªí≠À“ ”§—≠·≈–∑«’§«“¡√ÿπ·√߇™àπ‡¥’¬«°—∫
ªí≠À“ ‘Ë ß·«¥≈âÕ¡Õ◊Ëπ ‚¥¬‡©æ“–Õ¬à“߬‘Ë ß„π
°√ÿ߇∑æ¡À“π§√ ÷Ë߇ªìπ»Ÿπ¬å°≈“ߧ«“¡‡®√‘≠∑“ß
¥â“π‡»√…∞°‘®·≈–°“√æ—≤π“ —ß§¡ ¡’‚§√ß°“√‡°‘¥¢÷Èπ
‡ªìπ®”π«π¡“° ‡™à𠂧√ß°“√∑“ߥà«π ∂ππ«ß·À«π
√Õ∫πÕ° √–∫∫¢π àß¡«≈™π·≈–‚§√ß°“√ π“¡∫‘π
π“π“™“µ‘°√ÿ߇∑æ·Ààß∑’Ë Õß ‡ªìπµâπ ‡æ◊ËÕ√Õß√—∫°“√
¢¬“¬µ—«¢Õ߇¡◊Õß„πÕ𓧵 ‡æ◊ËÕ∑√“∫ ∂“π°“√≥å
ªí≠À“¡≈æ‘…∑“߇ ’¬ß„π‡¢µ°√ÿ߇∑æ¡À“π§√ °√¡
§«∫§ÿ¡¡≈æ‘…‰¥âµ√«®«—¥√–¥—∫‡ ’¬ß‡©≈’ˬ 24 ™—Ë«‚¡ß
*»Ÿπ¬å«‘®—¬·≈–Ωñ°Õ∫√¡¥â“π ‘Ëß·«¥≈âÕ¡ °√¡ à߇ √‘¡§ÿ≥¿“æ ‘Ëß·«¥≈âÕ¡ ‡∑§‚π∏“π’ µ.§≈ÕßÀâ“ Õ.§≈ÕßÀ≈«ß ®.ª∑ÿ¡∏“π’ 12120 ‚∑√. 0-2577-1136 ‚∑√ “√. 0-2577-1138Environmental Research and Training Center, Department of Environmental Quality Promotion. Technopolis. Klong 5, Klong Luang, Pathumthani 12120 e-mail: [email protected]**§≥–«‘∑¬“»“ µ√å ®ÿÓ≈ß°√≥å¡À“«‘∑¬“≈—¬
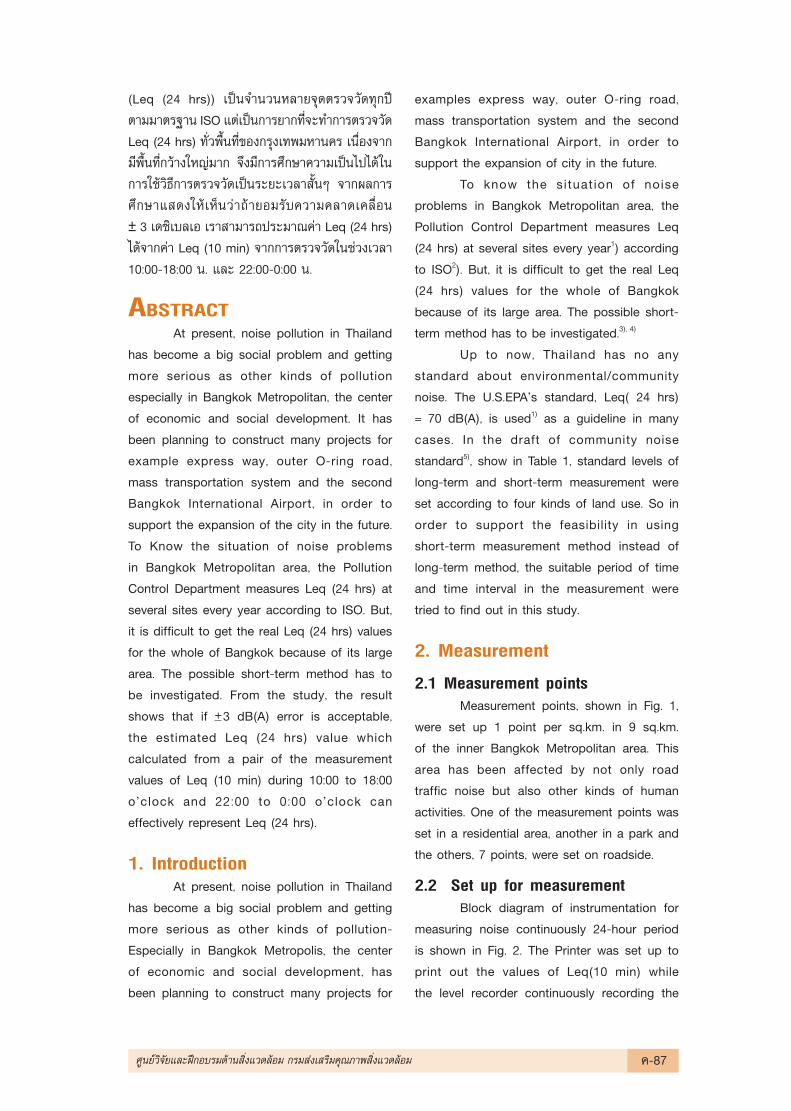
Sound Level Meter
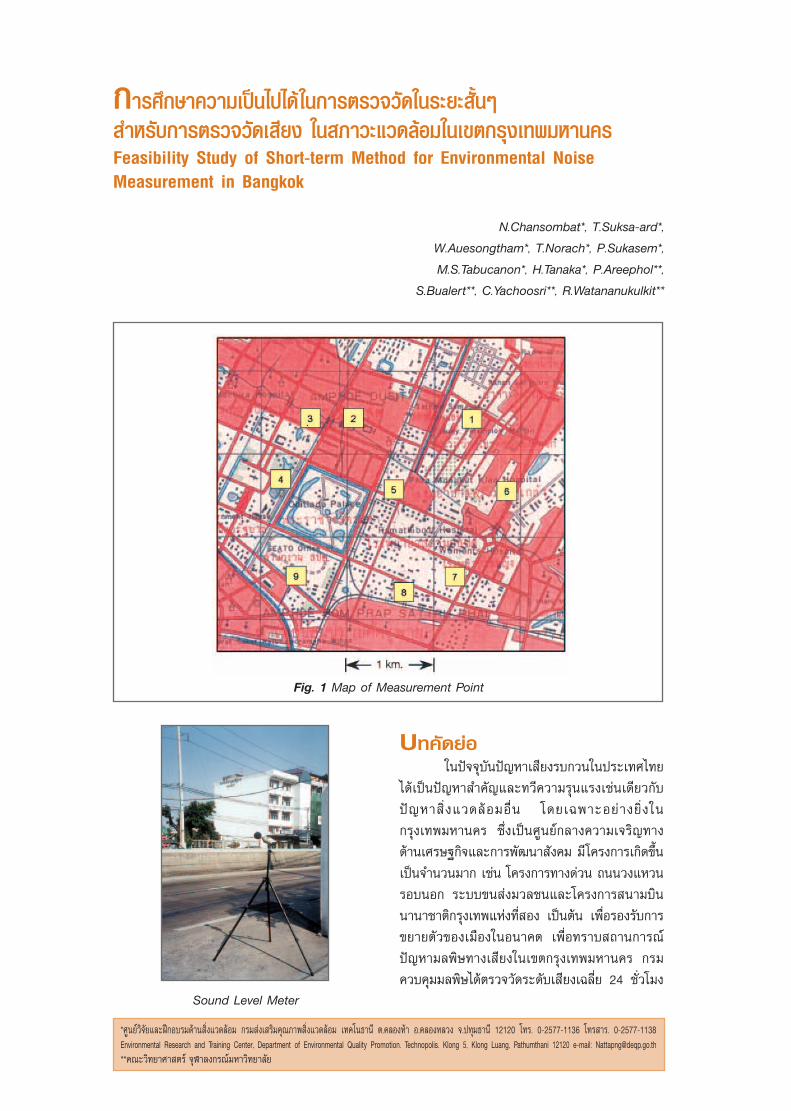
Fig. 1 Map of Measurement Point
(Leq (24 hrs)) ‡ªìπ®”π«πÀ≈“¬®ÿ¥µ√«®«—¥∑ÿ°ªï
µ“¡¡“µ√∞“π ISO ·µà‡ªìπ°“√¬“°∑’Ë®–∑”°“√µ√«®«—¥
Leq (24 hrs) ∑—Ë«æ◊Èπ∑’Ë¢Õß°√ÿ߇∑æ¡À“π§√ ‡π◊ËÕß®“°
¡’æ◊Èπ∑’Ë°«â“ß„À≠à¡“° ®÷ß¡’°“√»÷°…“§«“¡‡ªìπ‰ª‰¥â„π
°“√„™â«‘∏’°“√µ√«®«—¥‡ªìπ√–¬–‡«≈“ —ÈπÊ ®“°º≈°“√
»÷°…“· ¥ß„Àâ‡ÀÁπ«à“∂⓬ա√—∫§«“¡§≈“¥‡§≈◊ËÕπ
± 3 ‡¥´‘‡∫≈‡Õ ‡√“ “¡“√∂ª√–¡“≥§à“ Leq (24 hrs)
‰¥â®“°§à“ Leq (10 min) ®“°°“√µ√«®«—¥„π™à«ß‡«≈“
10:00-18:00 π. ·≈– 22:00-0:00 π.
ABSTRACTAt present, noise pollution in Thailand
has become a big social problem and getting
more serious as other kinds of pollution
especially in Bangkok Metropolitan, the center
of economic and social development. It has
been planning to construct many projects for
example express way, outer O-ring road,
mass transportation system and the second
Bangkok International Airport, in order to
support the expansion of the city in the future.
To Know the situation of noise problems
in Bangkok Metropolitan area, the Pollution
Control Department measures Leq (24 hrs) at
several sites every year according to ISO. But,
it is difficult to get the real Leq (24 hrs) values
for the whole of Bangkok because of its large
area. The possible short-term method has to
be investigated. From the study, the result
shows that if +3 dB(A) error is acceptable,
the estimated Leq (24 hrs) value which
calculated from a pair of the measurement
values of Leq (10 min) during 10:00 to 18:00
oûclock and 22:00 to 0:00 oûclock can
effectively represent Leq (24 hrs).
1. IntroductionAt present, noise pollution in Thailand
has become a big social problem and getting
more serious as other kinds of pollution-
Especially in Bangkok Metropolis, the center
of economic and social development, has
been planning to construct many projects for
examples express way, outer O-ring road,
mass transportation system and the second
Bangkok International Airport, in order to
support the expansion of city in the future.
To know the situat ion of noise
problems in Bangkok Metropolitan area, the
Pollution Control Department measures Leq
(24 hrs) at several sites every year1) according
to ISO2). But, it is difficult to get the real Leq
(24 hrs) values for the whole of Bangkok
because of its large area. The possible short-
term method has to be investigated.3), 4)
Up to now, Thailand has no any
standard about environmental/community
noise. The U.S.EPAûs standard, Leq( 24 hrs)
= 70 dB(A), is used1) as a guideline in many
cases. In the draft of community noise
standard5), show in Table 1, standard levels of
long-term and short-term measurement were
set according to four kinds of land use. So in
order to support the feasibility in using
short-term measurement method instead of
long-term method, the suitable period of time
and time interval in the measurement were
tried to find out in this study.
2. Measurement
2.1 Measurement pointsMeasurement points, shown in Fig. 1,
were set up 1 point per sq.km. in 9 sq.km.
of the inner Bangkok Metropolitan area. This
area has been affected by not only road
traffic noise but also other kinds of human
activities. One of the measurement points was
set in a residential area, another in a park and
the others, 7 points, were set on roadside.
2.2 Set up for measurementBlock diagram of instrumentation for
measuring noise continuously 24-hour period
is shown in Fig. 2. The Printer was set up to
print out the values of Leq(10 min) while
the level recorder continuously recording the
»Ÿπ¬å«‘®—¬·≈–Ωñ°Õ∫√¡¥â“π ‘Ëß·«¥≈âÕ¡ °√¡ à߇ √‘¡§ÿ≥¿“æ ‘Ëß·«¥≈âÕ¡ §-87
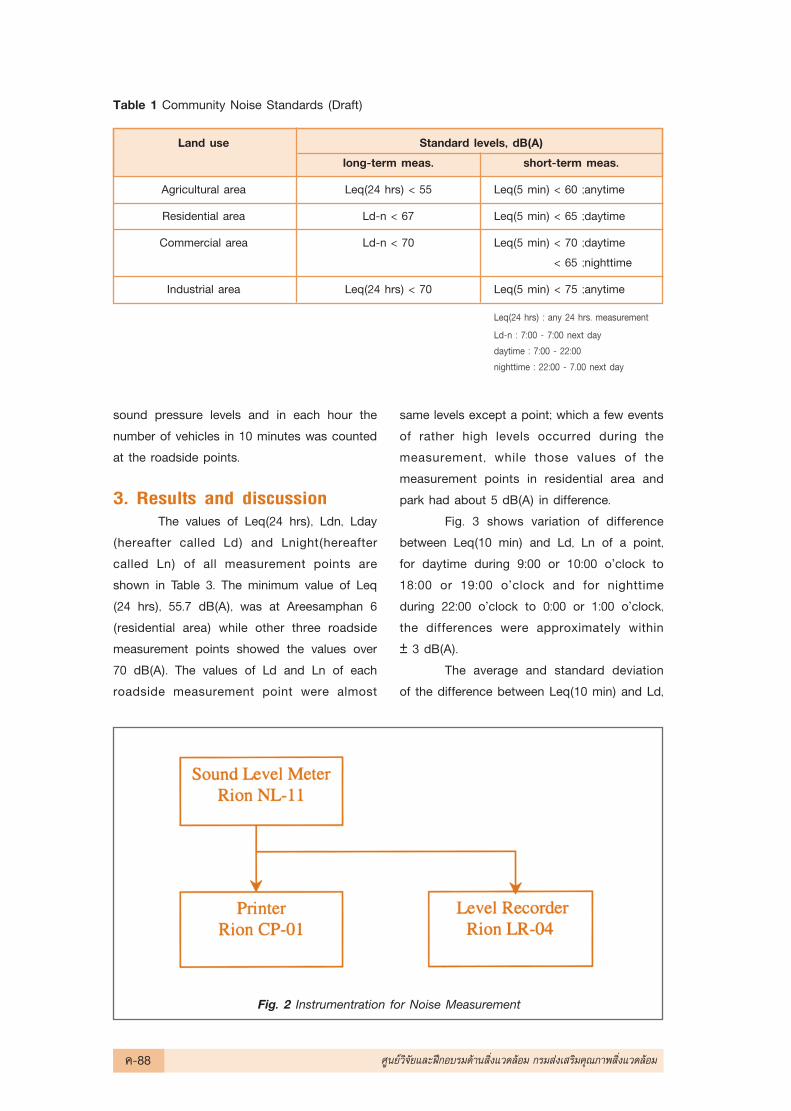
sound pressure levels and in each hour the
number of vehicles in 10 minutes was counted
at the roadside points.
3. Results and discussionThe values of Leq(24 hrs), Ldn, Lday
(hereafter called Ld) and Lnight(hereafter
called Ln) of all measurement points are
shown in Table 3. The minimum value of Leq
(24 hrs), 55.7 dB(A), was at Areesamphan 6
(residential area) while other three roadside
measurement points showed the values over
70 dB(A). The values of Ld and Ln of each
roadside measurement point were almost
same levels except a point; which a few events
of rather high levels occurred during the
measurement, while those values of the
measurement points in residential area and
park had about 5 dB(A) in difference.
Fig. 3 shows variation of difference
between Leq(10 min) and Ld, Ln of a point,
for daytime during 9:00 or 10:00 oûclock to
18:00 or 19:00 oûclock and for nighttime
during 22:00 oûclock to 0:00 or 1:00 oûclock,
the differences were approximately within
± 3 dB(A).
The average and standard deviation
of the difference between Leq(10 min) and Ld,
Table 1 Community Noise Standards (Draft)
Land use Standard levels, dB(A)
long-term meas. short-term meas.
Agricultural area Leq(24 hrs) < 55 Leq(5 min) < 60 ;anytime
Residential area Ld-n < 67 Leq(5 min) < 65 ;daytime
Commercial area Ld-n < 70 Leq(5 min) < 70 ;daytime
< 65 ;nighttime
Industrial area Leq(24 hrs) < 70 Leq(5 min) < 75 ;anytime
Leq(24 hrs) : any 24 hrs. measurement
Ld-n : 7:00 - 7:00 next daydaytime : 7:00 - 22:00nighttime : 22:00 - 7.00 next day
Fig. 2 Instrumentration for Noise Measurement
§-88 »Ÿπ¬å«‘®—¬·≈–Ωñ°Õ∫√¡¥â“π ‘Ëß·«¥≈âÕ¡ °√¡ à߇ √‘¡§ÿ≥¿“æ ‘Ëß·«¥≈âÕ¡
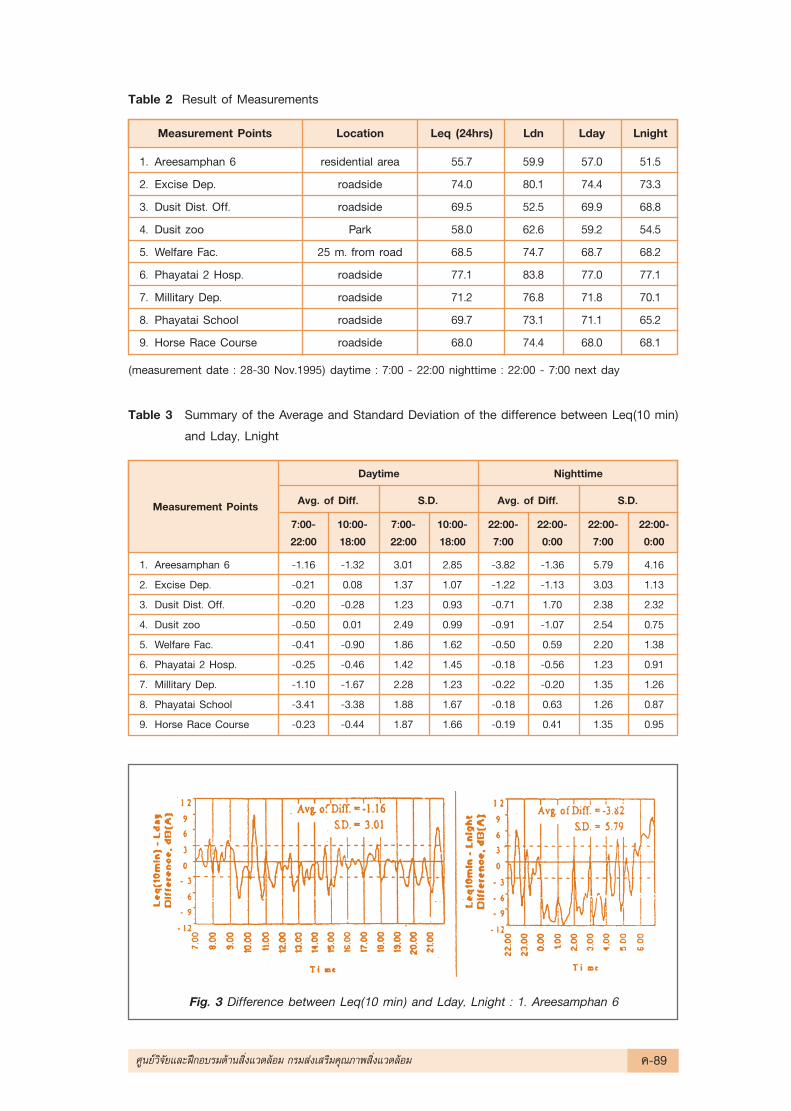
Table 2 Result of Measurements
Measurement Points Location Leq (24hrs) Ldn Lday Lnight
1. Areesamphan 6 residential area 55.7 59.9 57.0 51.5
2. Excise Dep. roadside 74.0 80.1 74.4 73.3
3. Dusit Dist. Off. roadside 69.5 52.5 69.9 68.8
4. Dusit zoo Park 58.0 62.6 59.2 54.5
5. Welfare Fac. 25 m. from road 68.5 74.7 68.7 68.2
6. Phayatai 2 Hosp. roadside 77.1 83.8 77.0 77.1
7. Millitary Dep. roadside 71.2 76.8 71.8 70.1
8. Phayatai School roadside 69.7 73.1 71.1 65.2
9. Horse Race Course roadside 68.0 74.4 68.0 68.1
(measurement date : 28-30 Nov.1995) daytime : 7:00 - 22:00 nighttime : 22:00 - 7:00 next day
Table 3 Summary of the Average and Standard Deviation of the difference between Leq(10 min)
and Lday, Lnight
Measurement Points
Daytime Nighttime
Avg. of Diff. S.D. Avg. of Diff. S.D.
7:00- 10:00- 7:00- 10:00- 22:00- 22:00- 22:00- 22:00-22:00 18:00 22:00 18:00 7:00 0:00 7:00 0:00
1. Areesamphan 6 -1.16 -1.32 3.01 2.85 -3.82 -1.36 5.79 4.16
2. Excise Dep. -0.21 0.08 1.37 1.07 -1.22 -1.13 3.03 1.13
3. Dusit Dist. Off. -0.20 -0.28 1.23 0.93 -0.71 1.70 2.38 2.32
4. Dusit zoo -0.50 0.01 2.49 0.99 -0.91 -1.07 2.54 0.75
5. Welfare Fac. -0.41 -0.90 1.86 1.62 -0.50 0.59 2.20 1.38
6. Phayatai 2 Hosp. -0.25 -0.46 1.42 1.45 -0.18 -0.56 1.23 0.91
7. Millitary Dep. -1.10 -1.67 2.28 1.23 -0.22 -0.20 1.35 1.26
8. Phayatai School -3.41 -3.38 1.88 1.67 -0.18 0.63 1.26 0.87
9. Horse Race Course -0.23 -0.44 1.87 1.66 -0.19 0.41 1.35 0.95
Fig. 3 Difference between Leq(10 min) and Lday, Lnight : 1. Areesamphan 6
»Ÿπ¬å«‘®—¬·≈–Ωñ°Õ∫√¡¥â“π ‘Ëß·«¥≈âÕ¡ °√¡ à߇ √‘¡§ÿ≥¿“æ ‘Ëß·«¥≈âÕ¡ §-89
Ln during 10:00 to 18:00 oûclock and 22:00
to 0:00 oûclock were calculated and compared
to the whole daytime and nighttime values
as shown in Table 3. The values of the
average of the difference of all measurement
points in daytime changed not so much.
On the other hand, most of those values at
nighttime shifted to a little higher because
Leq(10 min) tend to decline from about 1:00
oûclock and rised up about 5:00 oûclock.
And most of the values of the standard
deviation became smaller.
Each pair of Leq(10 min) during 10:00
oûclock to 18:00 oûclock and 22:00 to 0:00
oûclock was calculated to be an estimated Leq
(24 hrs) value, Leq(24 hrs)est, by using the
following formula;
Leq(24 hrs)est = 10 log 1/24(15*10Leq(10 min)day/10
+9*10Leq(10 min)night/10)
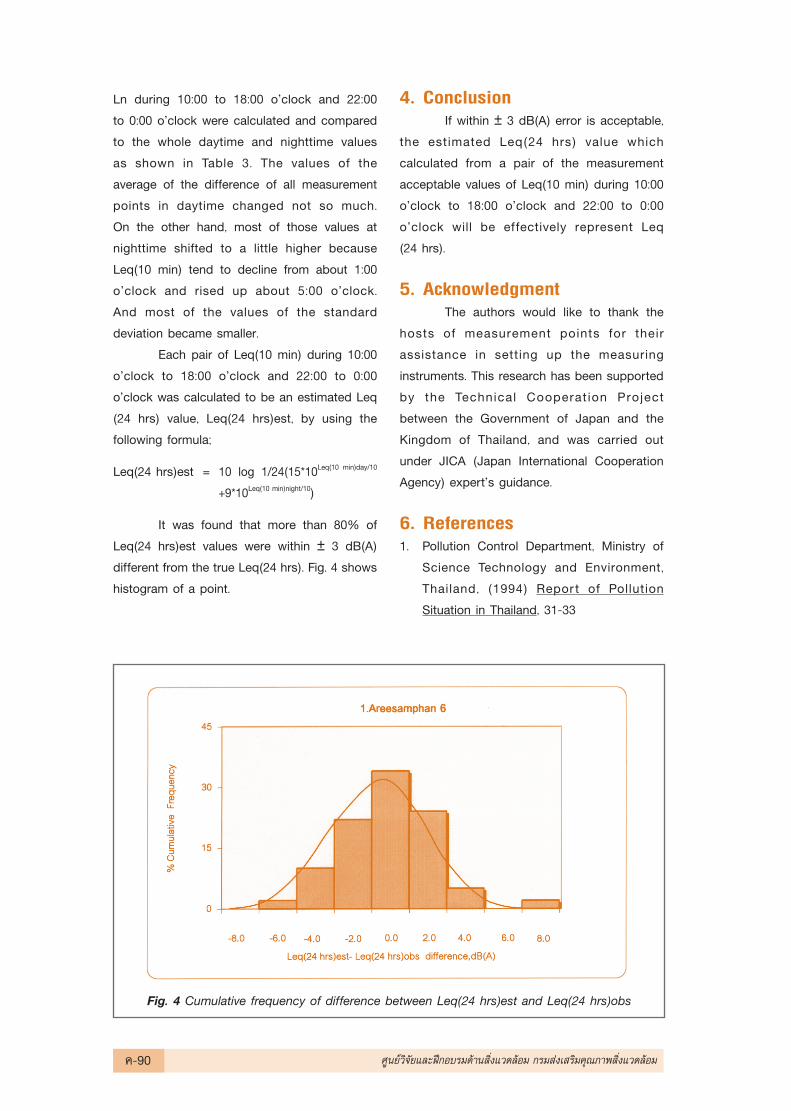
It was found that more than 80% of
Leq(24 hrs)est values were within ± 3 dB(A)
different from the true Leq(24 hrs). Fig. 4 shows
histogram of a point.
4. ConclusionIf within ± 3 dB(A) error is acceptable,
the estimated Leq(24 hrs) value which
calculated from a pair of the measurement
acceptable values of Leq(10 min) during 10:00
oûclock to 18:00 oûclock and 22:00 to 0:00
oûclock will be effectively represent Leq
(24 hrs).
5. AcknowledgmentThe authors would like to thank the
hosts of measurement points for their
assistance in setting up the measuring
instruments. This research has been supported
by the Technical Cooperat ion Project
between the Government of Japan and the
Kingdom of Thailand, and was carried out
under JICA (Japan International Cooperation
Agency) expertûs guidance.
6. References1. Pollution Control Department, Ministry of
Science Technology and Environment,
Thailand, (1994) Repor t of Pollution
Situation in Thailand, 31-33
Fig. 4 Cumulative frequency of difference between Leq(24 hrs)est and Leq(24 hrs)obs
§-90 »Ÿπ¬å«‘®—¬·≈–Ωñ°Õ∫√¡¥â“π ‘Ëß·«¥≈âÕ¡ °√¡ à߇ √‘¡§ÿ≥¿“æ ‘Ëß·«¥≈âÕ¡
2. ISO 1996/1, (1982) Description and
Measurement of Environmental Noise
3. C.M. Harris; (1979) Handbook of Noise
Control, Mcgraw Hill, 35-23-26
4. I . Aoi, G.Hathairatana (ERTC), 1992
Temporal Sampling Techniques for the
measurement of Environmental noise (Total
Measurement time), JICA Final Report
5. National Environment Board, (1993)
Thailand, Community Noise Standard
(Draft)
»Ÿπ¬å«‘®—¬·≈–Ωñ°Õ∫√¡¥â“π ‘Ëß·«¥≈âÕ¡ °√¡ à߇ √‘¡§ÿ≥¿“æ ‘Ëß·«¥≈âÕ¡ §-91