
FLOWCOMAG April 1{2, 2004 SFB 609
20
FLOWCOMAG April 1–2, 2004 SFB 609 Seawater Flow Transition and Separation Control Tom Weier, Thomas Albrecht, Gerd Mutschke, Gunter Gerbeth
Transcript of FLOWCOMAG April 1{2, 2004 SFB 609
FLOWCOMAG
April 1–2, 2004
SFB 609
Seawater Flow Transition and Separation Control
Tom Weier, Thomas Albrecht, Gerd Mutschke, Gunter Gerbeth
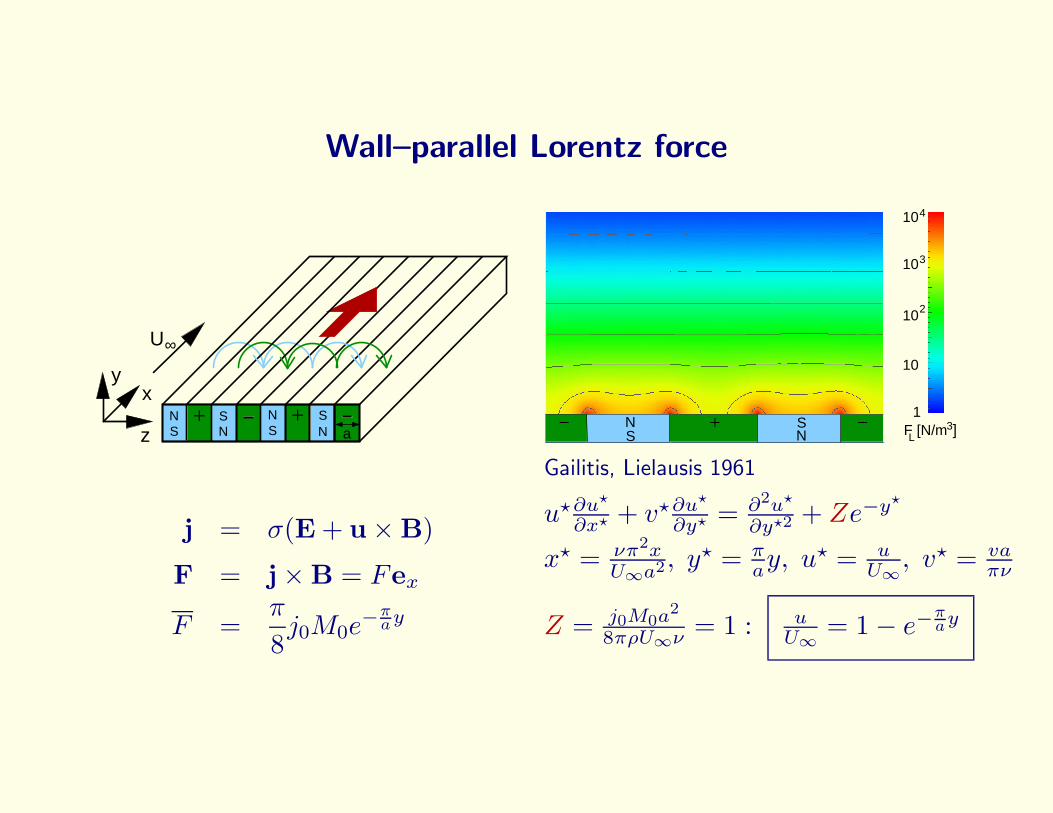
Wall–parallel Lorentz force
NS
SN
NS
SN a
+ +z
xy
∞U
LSN S
N− + −
3
410
10
10
10
2
1F [N/m ]3
j = σ(E + u×B)
F = j×B = Fex
F =π
8j0M0e
−πay
Gailitis, Lielausis 1961
u?∂u?
∂x? + v?∂u?
∂y? = ∂2u?
∂y?2+ Ze−y
?
x? = νπ2xU∞a2, y
? = πay, u
? = uU∞, v
? = vaπν
Z = j0M0a2
8πρU∞ν = 1 : uU∞ = 1− e−πay
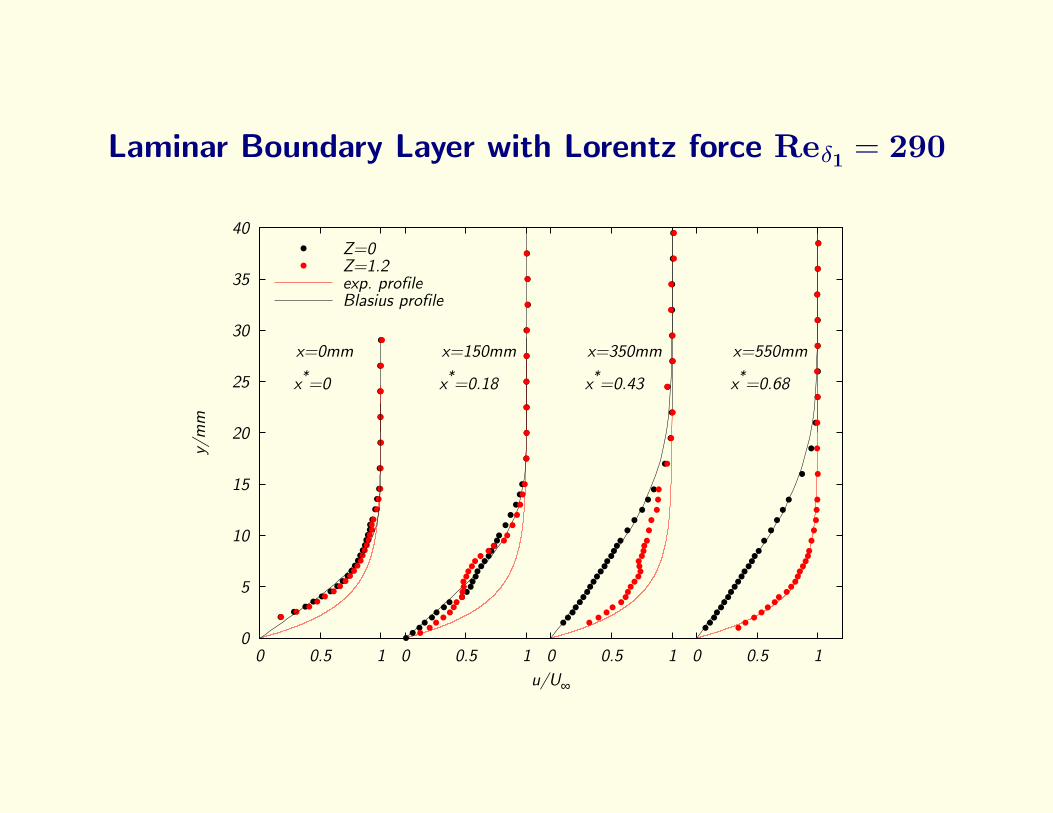
Laminar Boundary Layer with Lorentz force Reδ1 = 290
0
5
10
15
20
25
30
35
40
10.5010.5010.5010.50
y/m
m
u/U∞
x=0mm
x*=0
x=150mm
x*=0.18
x=350mm
x*=0.43
x=550mm
x*=0.68
Z=0Z=1.2exp. profileBlasius profile
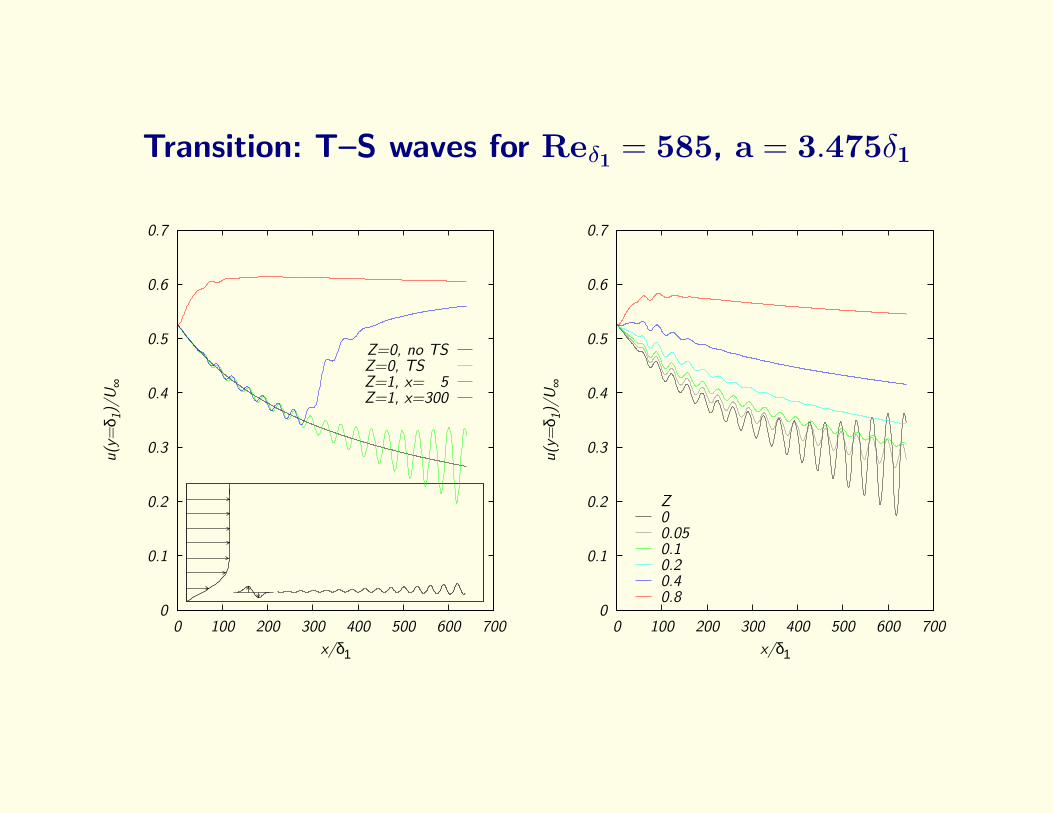
Transition: T–S waves for Reδ1 = 585, a = 3.475δ1
0
0.1
0.2
0.3
0.4
0.5
0.6
0.7
0 100 200 300 400 500 600 700
u(y
=δ 1
)/U
∞
x/δ1
Z=0, no TSZ=0, TSZ=1, x= 5Z=1, x=300
0
0.1
0.2
0.3
0.4
0.5
0.6
0.7
0 100 200 300 400 500 600 700
u(y
=δ 1
)/U
∞
x/δ1
Z00.050.10.20.40.8
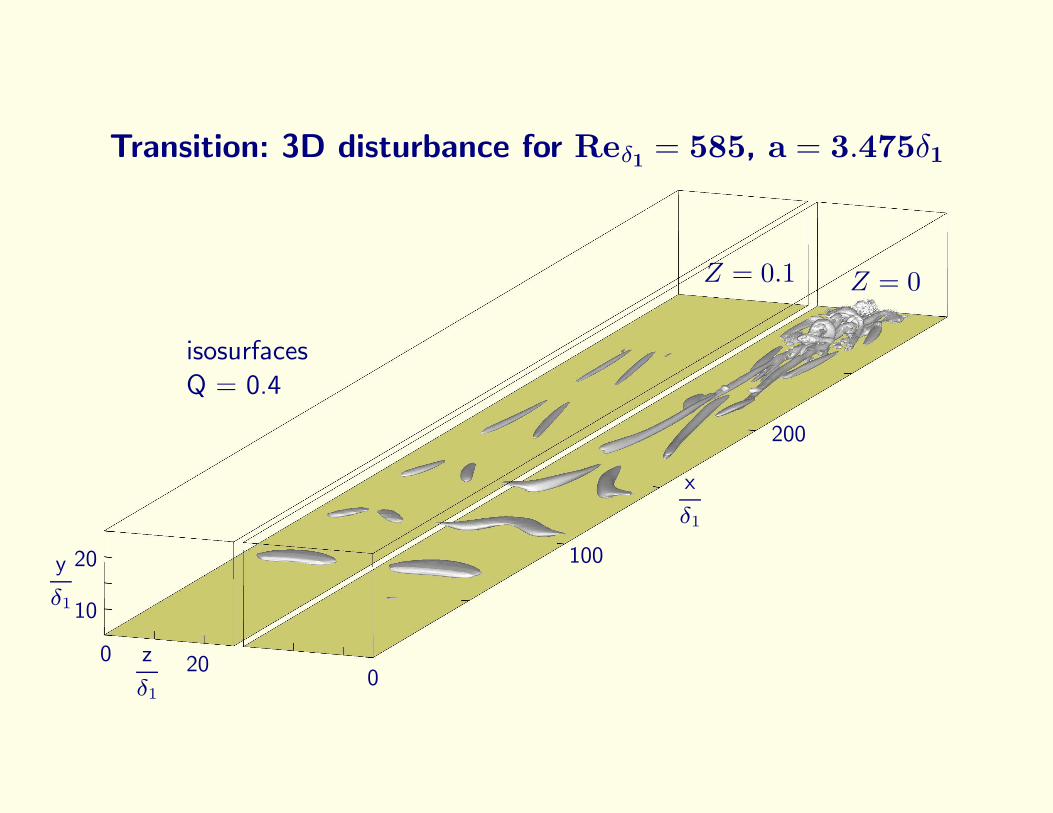
Transition: 3D disturbance for Reδ1 = 585, a = 3.475δ1
z
δ1
0 20
10
20y
δ1
0
100
200
x
δ1
isosurfacesQ = 0.4
Z = 0Z = 0.1
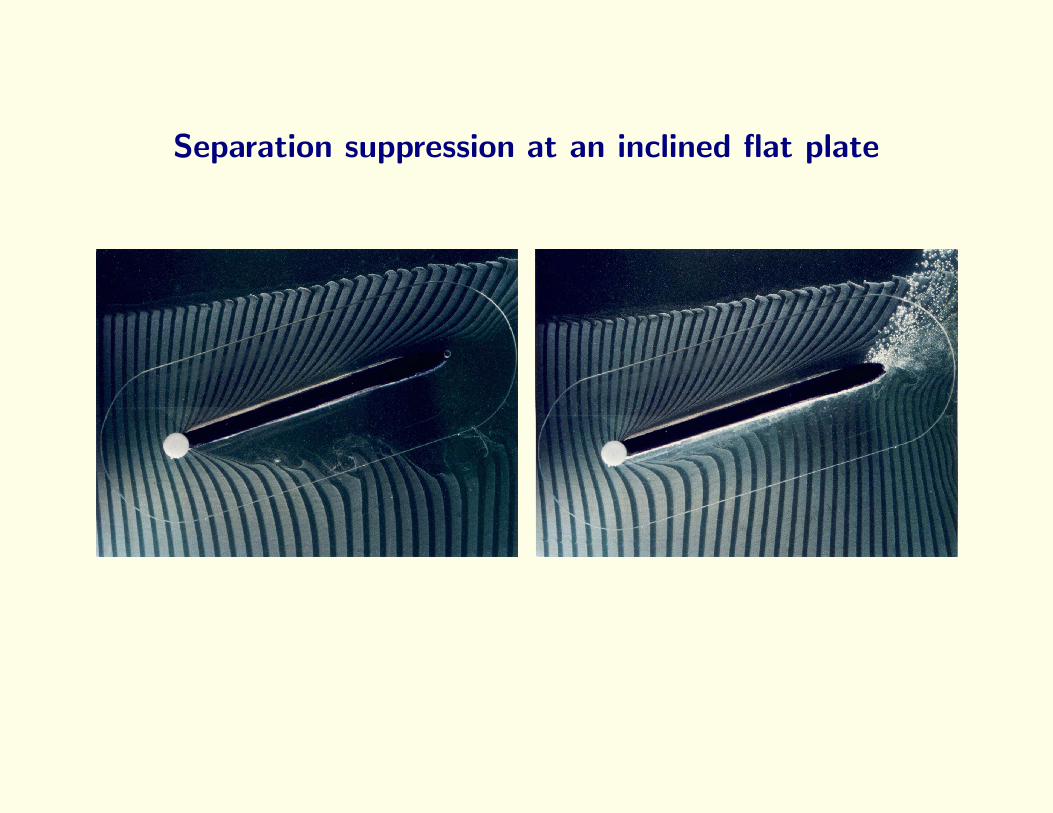
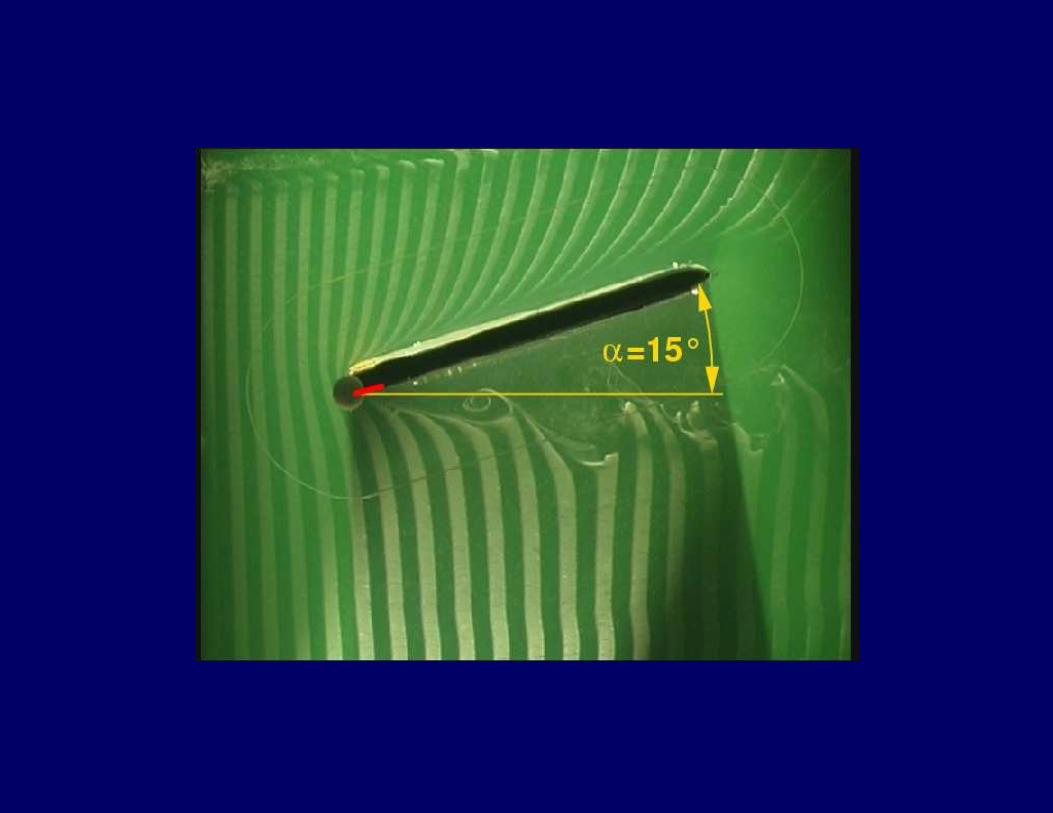
Separation suppression at an inclined flat plate
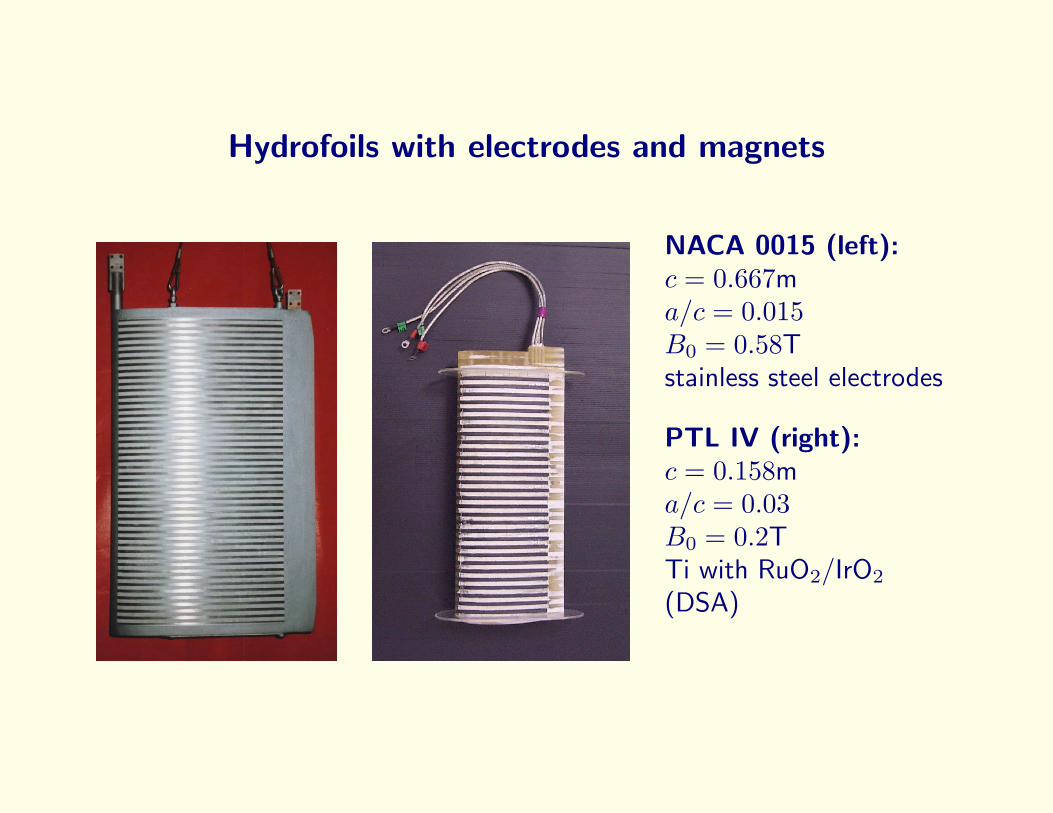
Hydrofoils with electrodes and magnets
NACA 0015 (left):c = 0.667ma/c = 0.015B0 = 0.58Tstainless steel electrodes
PTL IV (right):c = 0.158ma/c = 0.03B0 = 0.2TTi with RuO2/IrO2
(DSA)
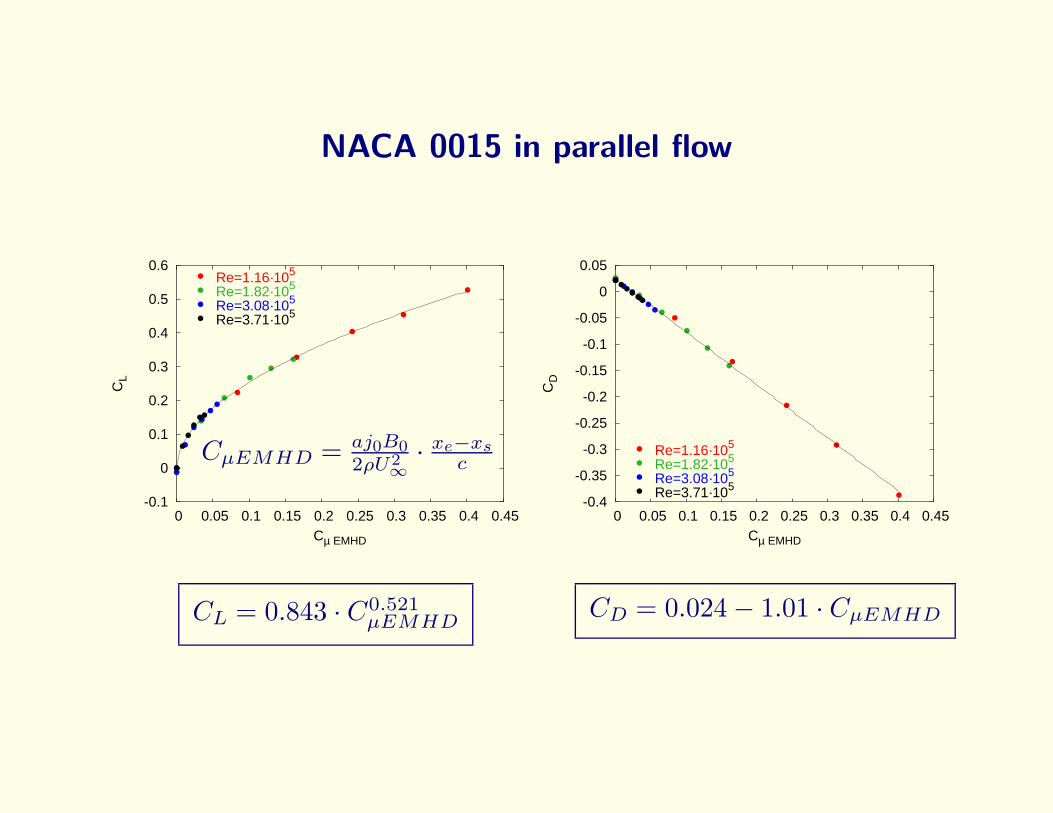
NACA 0015 in parallel flow
CµEMHD = aj0B02ρU2∞
· xe−xsc
-0.1
0
0.1
0.2
0.3
0.4
0.5
0.6
0 0.05 0.1 0.15 0.2 0.25 0.3 0.35 0.4 0.45
CL
Cµ EMHD
Re=1.16·105
Re=1.82·105
Re=3.08·105
Re=3.71·105
CL = 0.843 · C0.521µEMHD
-0.4
-0.35
-0.3
-0.25
-0.2
-0.15
-0.1
-0.05
0
0.05
0 0.05 0.1 0.15 0.2 0.25 0.3 0.35 0.4 0.45
CD
Cµ EMHD
Re=1.16·105
Re=1.82·105
Re=3.08·105
Re=3.71·105
CD = 0.024− 1.01 · CµEMHD
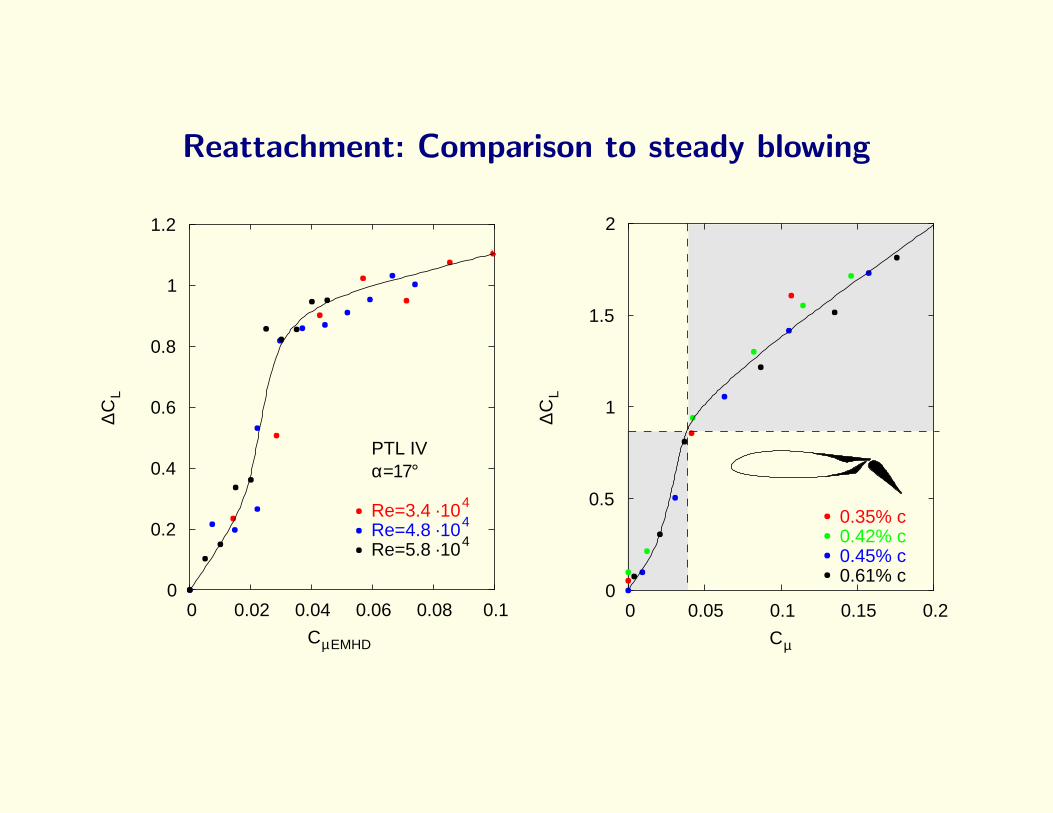
Reattachment: Comparison to steady blowing
0
0.2
0.4
0.6
0.8
1
1.2
0 0.02 0.04 0.06 0.08 0.1
∆CL
CµEMHD
Re=3.4 ·104
Re=4.8 ·104
Re=5.8 ·104
PTL IVα=17° BLC
Circulation Control
0
0.5
1
1.5
2
0 0.05 0.1 0.15 0.2
∆CL
Cµ
0.35% c0.42% c0.45% c0.61% c
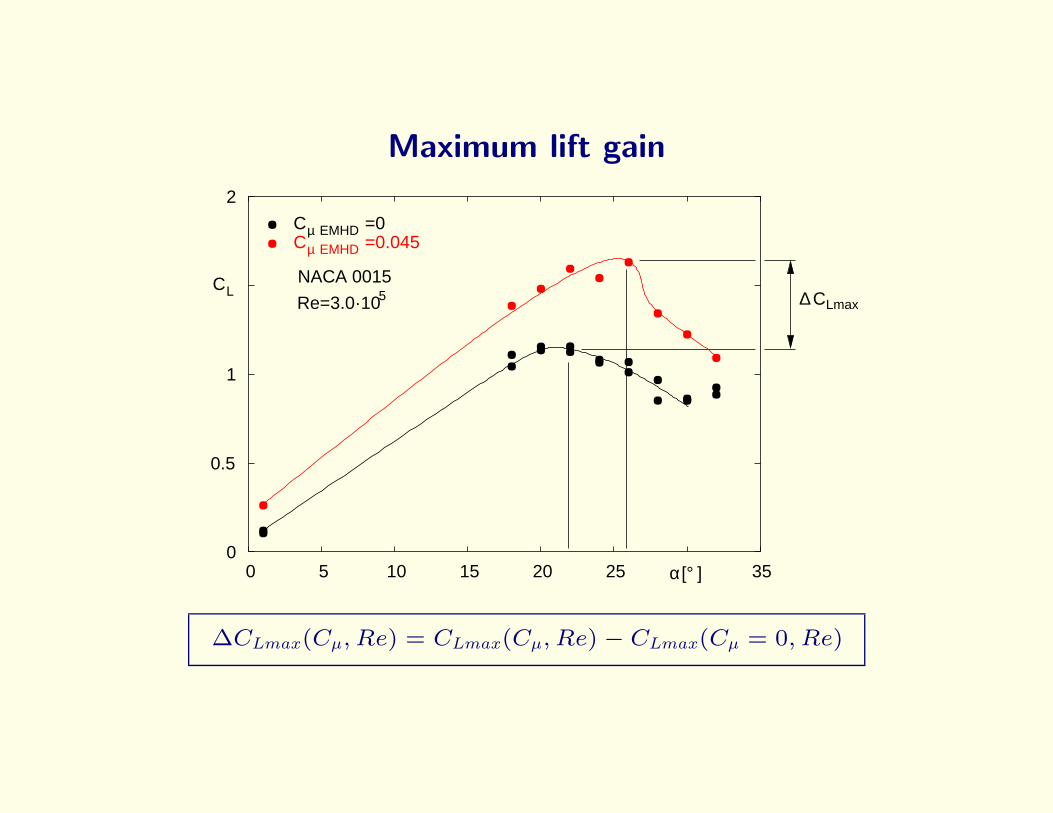
Maximum lift gain
0
0.5
1
2
0 5 10 15 20 25 35
CCL
Lmax
α[°]
Cµ EMHD =0Cµ EMHD =0.045
5Re=3.0·10 ∆NACA 0015
∆CLmax(Cµ, Re) = CLmax(Cµ, Re)− CLmax(Cµ = 0, Re)
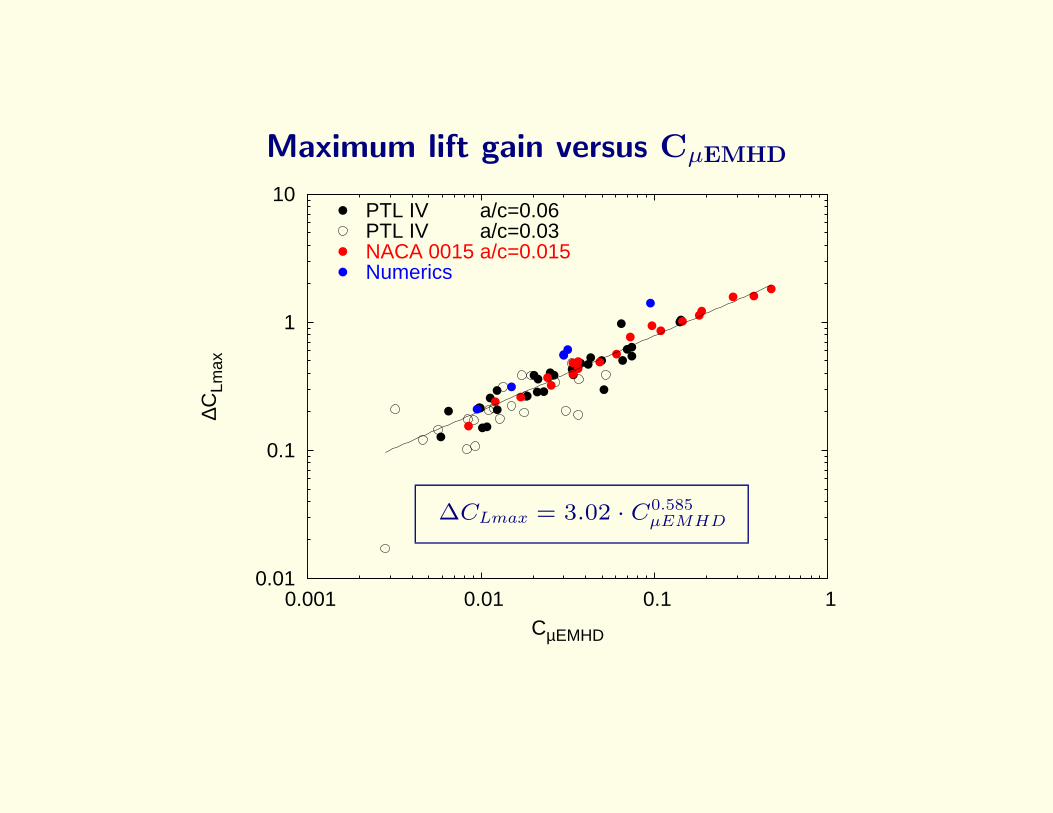
Maximum lift gain versus CµEMHD
∆CLmax = 3.02 · C0.585µEMHD
0.01
0.1
1
10
0.001 0.01 0.1 1
∆CLm
ax
CµEMHD
PTL IV a/c=0.06PTL IV a/c=0.03NACA 0015 a/c=0.015Numerics
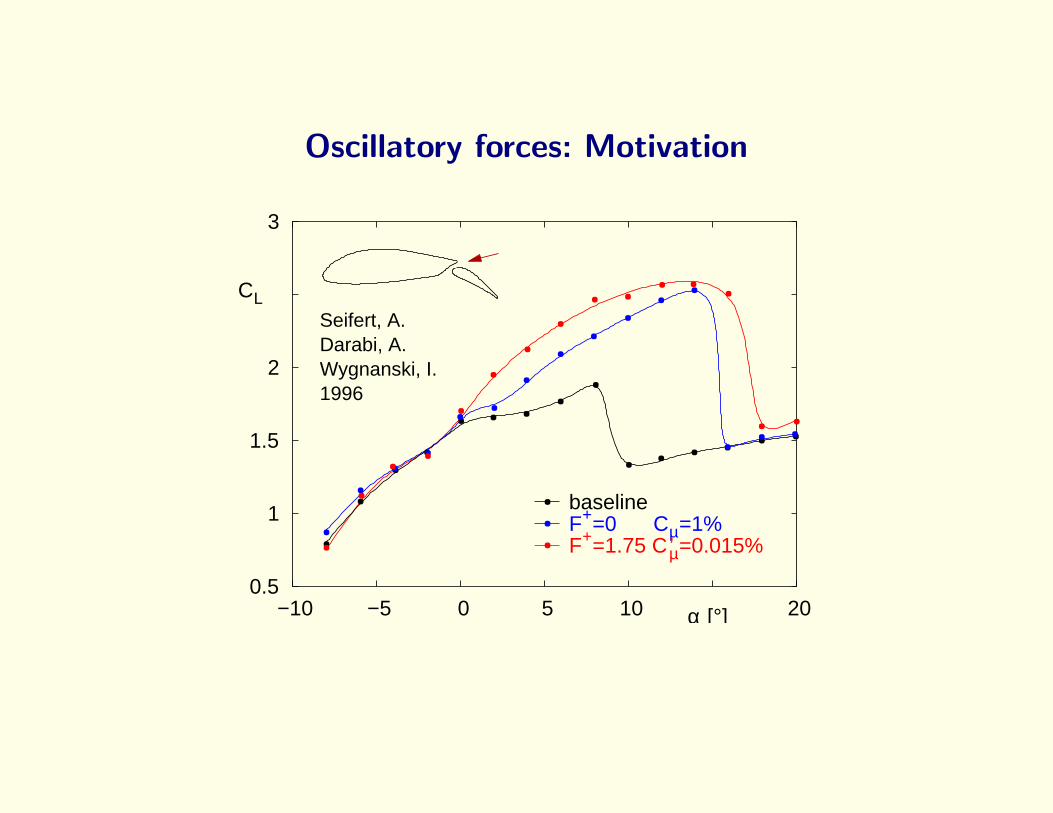
Oscillatory forces: Motivation
0.5
1
1.5
2
3
−10 −5 0 5 10 20
CL
α [°]
baselineF+=0 Cµ=1%F+=1.75 C’µ=0.015%
Darabi, A.Wygnanski, I.1996
Seifert, A.
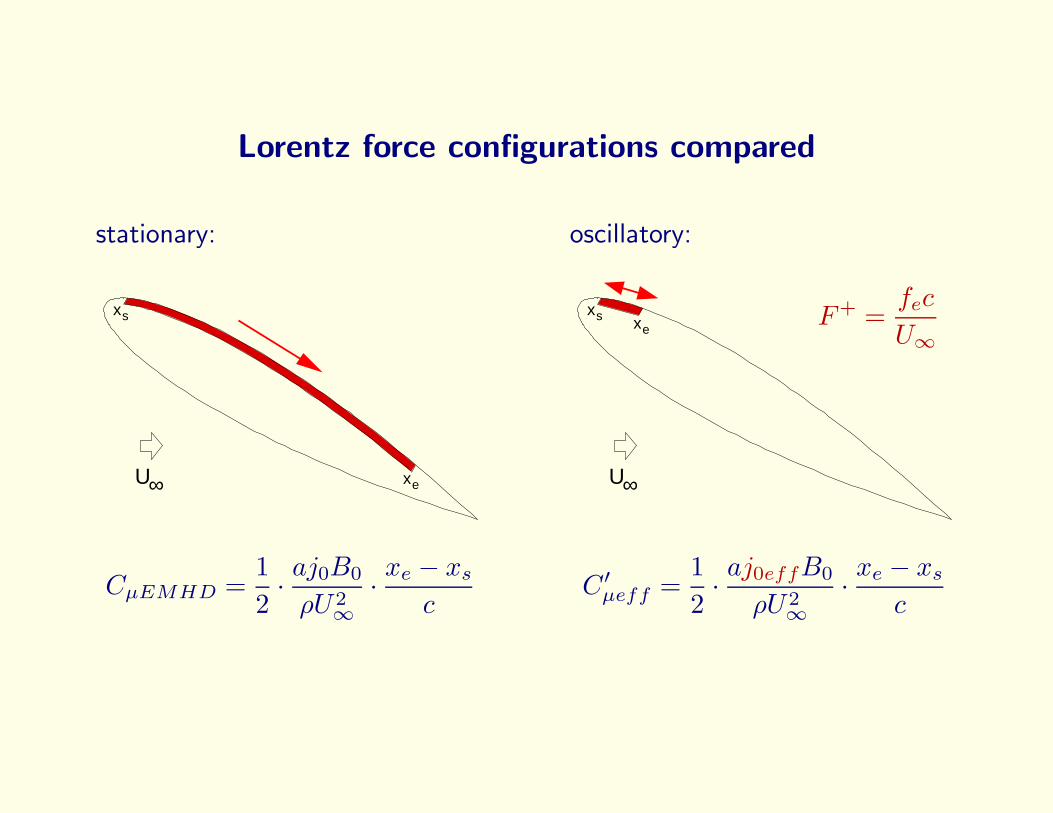
Lorentz force configurations compared
stationary:
U∞
xs
xe
CµEMHD =1
2· aj0B0
ρU2∞· xe − xs
c
oscillatory:
F+ =fec
U∞
U∞
xs xe
C ′µeff =1
2· aj0effB0
ρU2∞· xe − xs
c
,
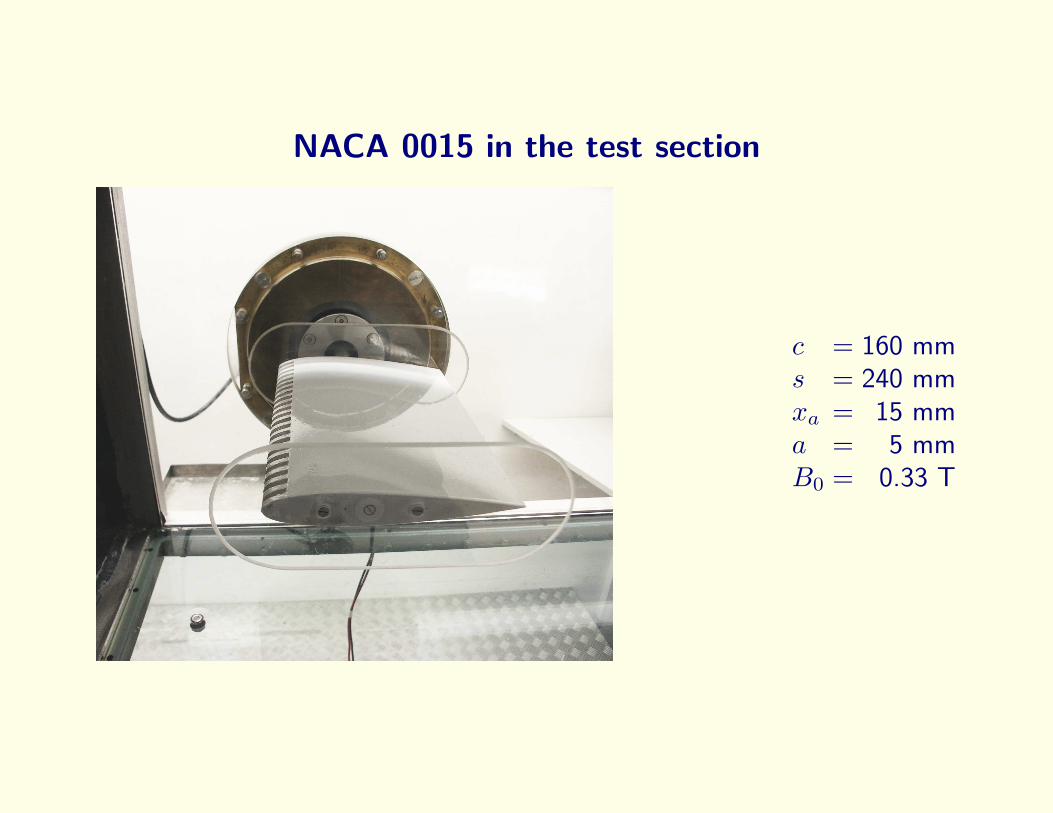
NACA 0015 in the test section
c = 160 mms = 240 mmxa = 15 mma = 5 mmB0 = 0.33 T
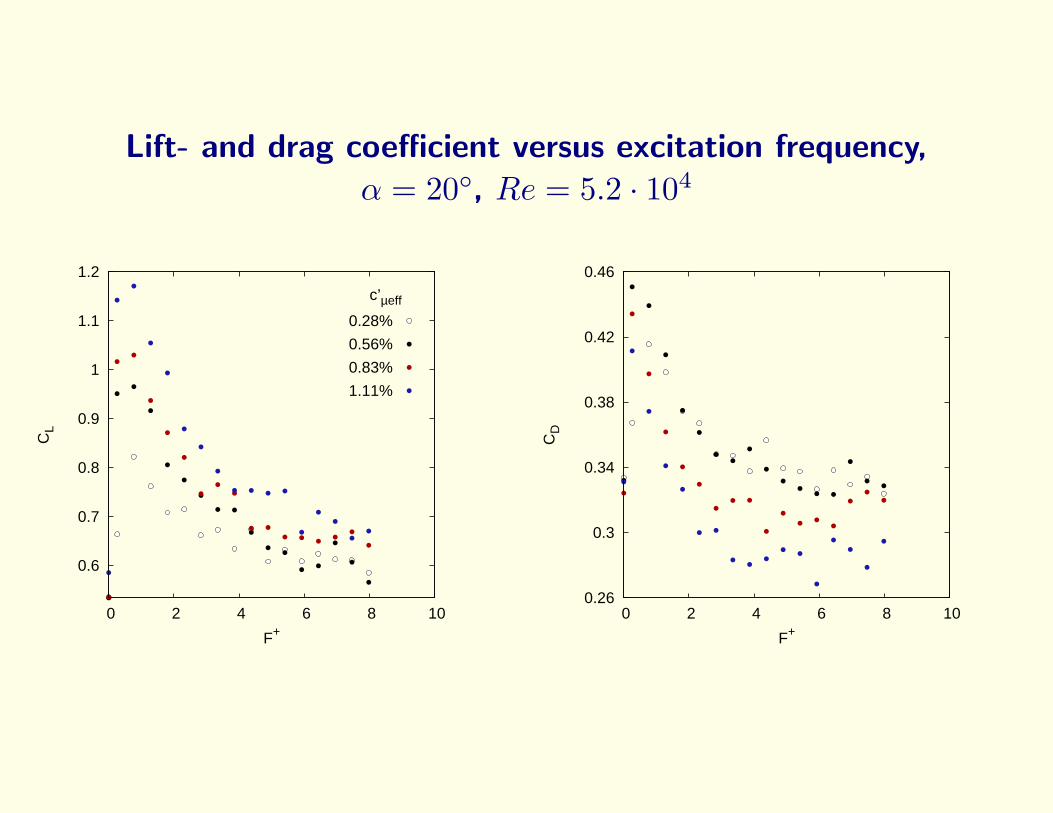
Lift- and drag coefficient versus excitation frequency,
α = 20◦, Re = 5.2 · 104
0.6
0.7
0.8
0.9
1
1.1
1.2
0 2 4 6 8 10
CL
F+
c’µeff
0.28%
0.56%
0.83%
1.11%
0.26
0.3
0.34
0.38
0.42
0.46
0 2 4 6 8 10
CD
F+
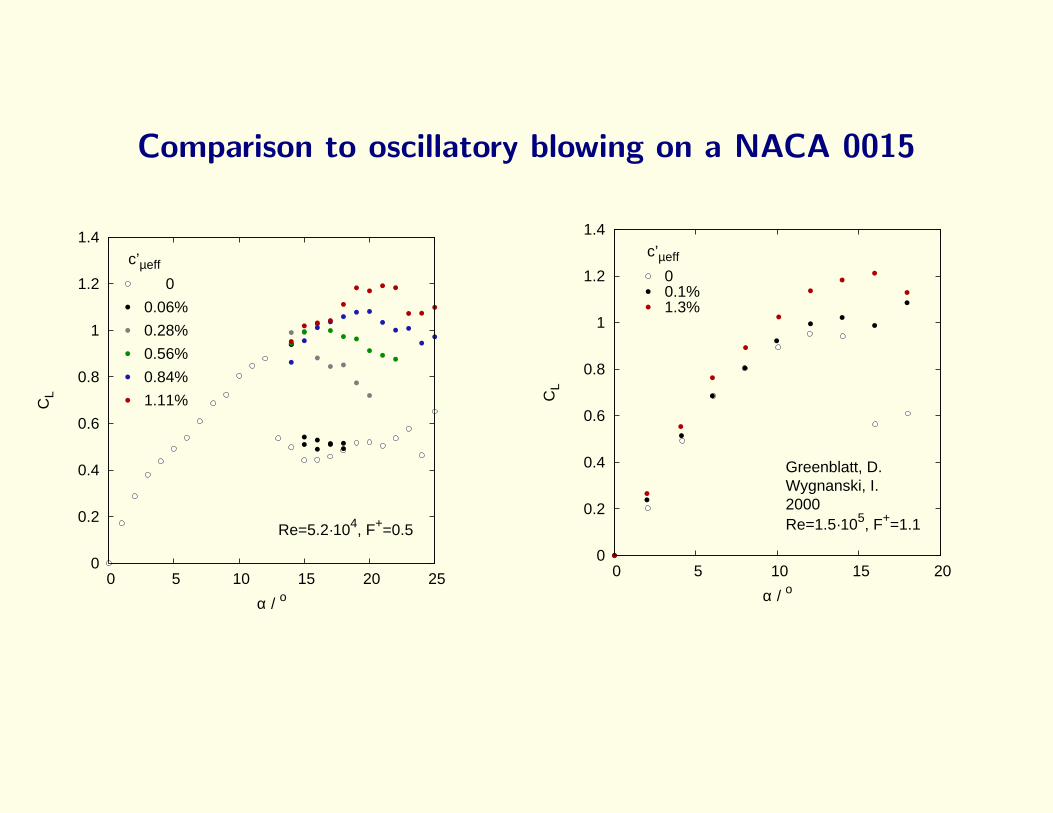
Comparison to oscillatory blowing on a NACA 0015
0
0.2
0.4
0.6
0.8
1
1.2
1.4
0 5 10 15 20 25
CL
α / o
c’µeff
Re=5.2·104, F+=0.5
0
0.06%
0.28%
0.56%
0.84%
1.11%
0
0.2
0.4
0.6
0.8
1
1.2
1.4
0 5 10 15 20C
L
α / o
c’µeff
Greenblatt, D.Wygnanski, I.2000Re=1.5·105, F+=1.1
00.1%1.3%
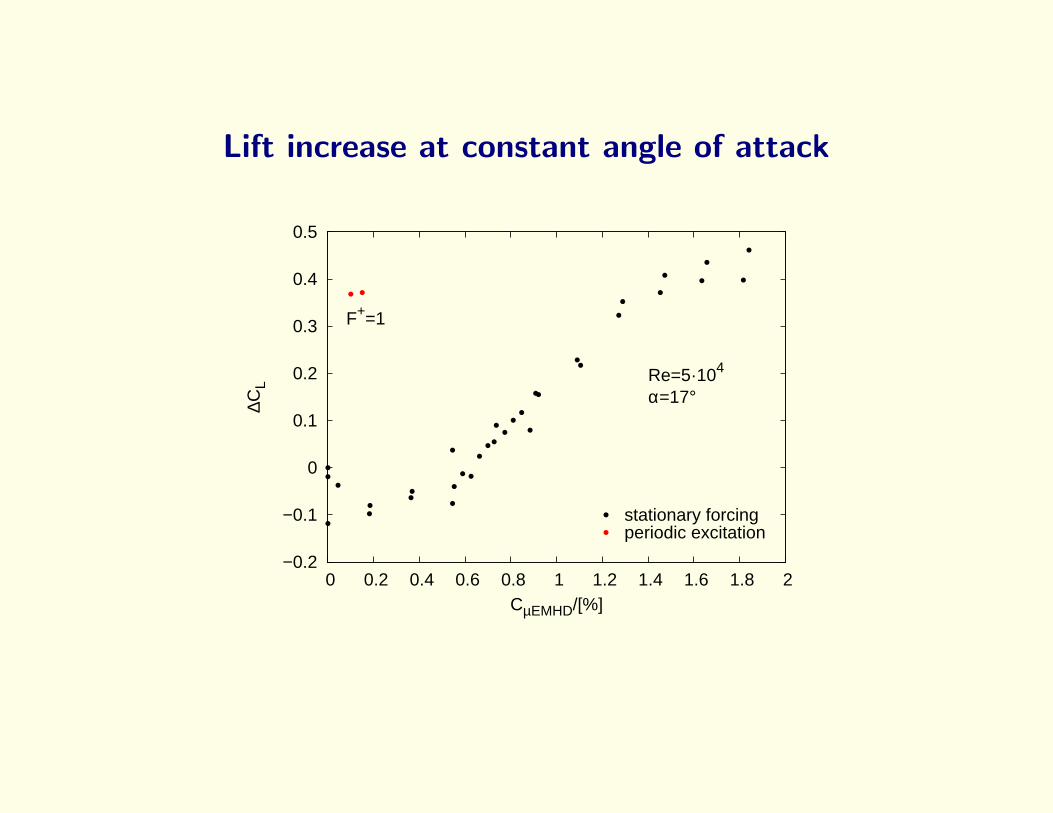
Lift increase at constant angle of attack
−0.2
−0.1
0
0.1
0.2
0.3
0.4
0.5
0 0.2 0.4 0.6 0.8 1 1.2 1.4 1.6 1.8 2
∆CL
CµEMHD/[%]
F+=1
Re=5·104
α=17°
stationary forcingperiodic excitation
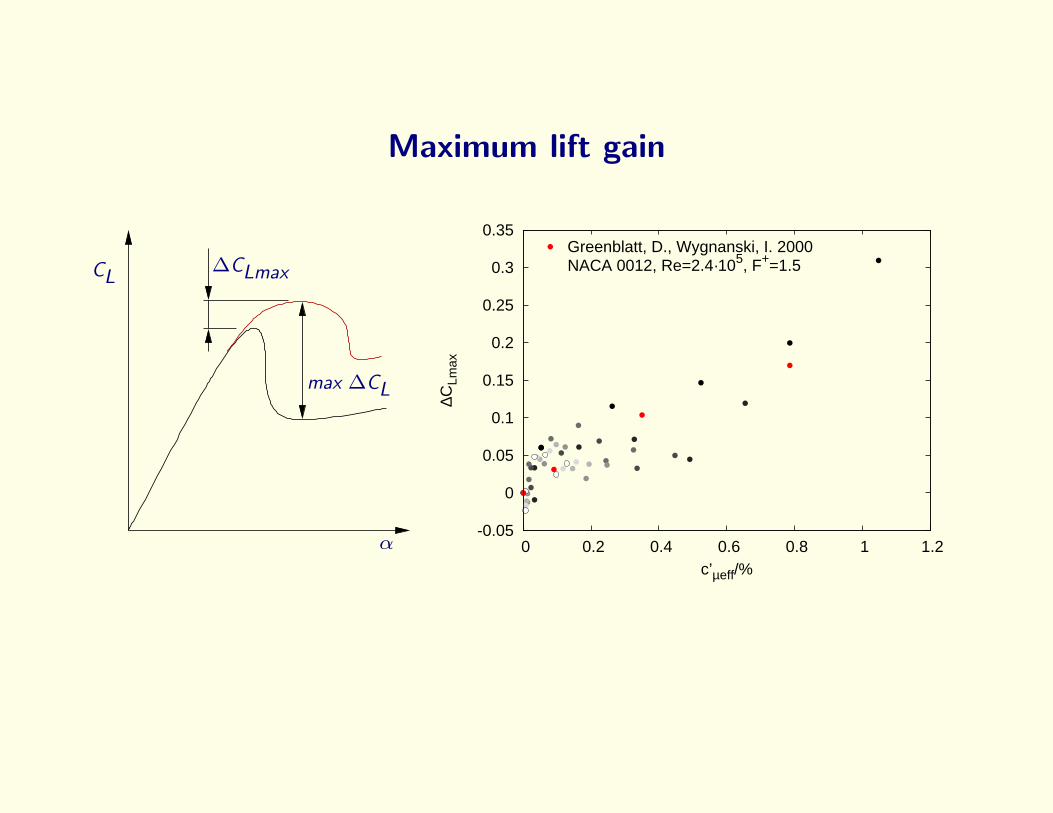
Maximum lift gain
PSfrag replacements
CL
α
max ∆CL
∆CLmax
∆CLcirc-0.05
0
0.05
0.1
0.15
0.2
0.25
0.3
0.35
0 0.2 0.4 0.6 0.8 1 1.2
∆CLm
ax
c’µeff/%
NACA 0012, Re=2.4·105, F+=1.5Greenblatt, D., Wygnanski, I. 2000
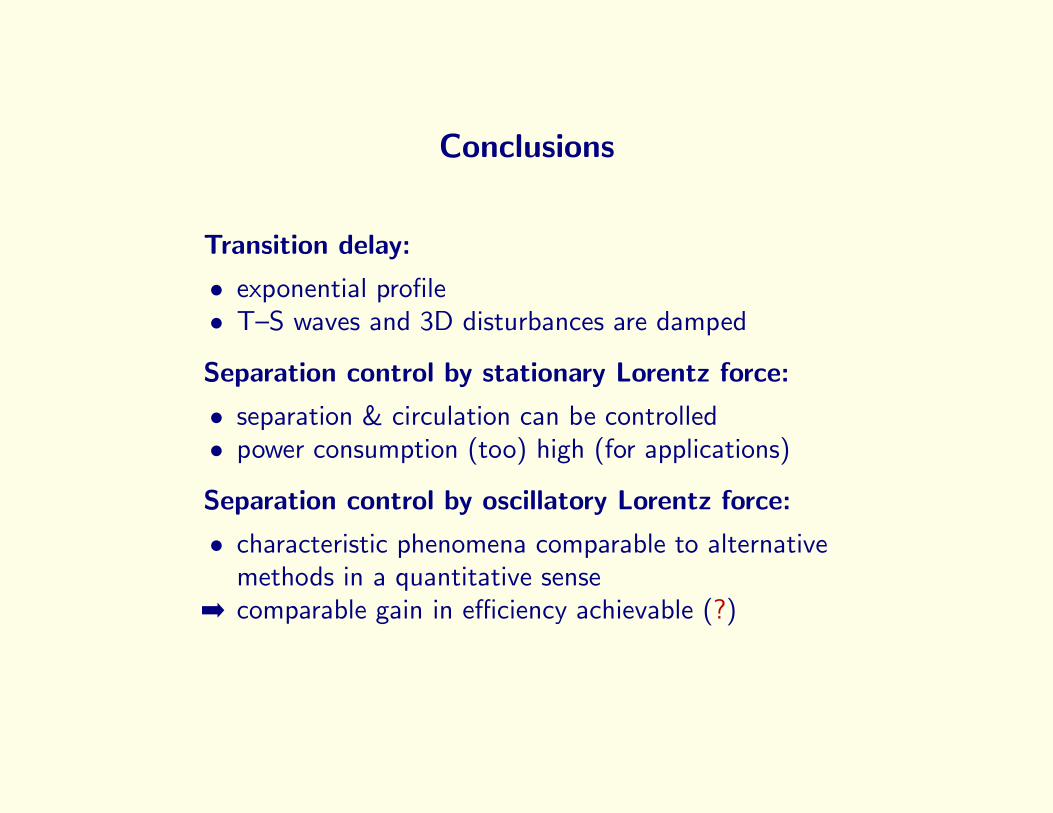
Conclusions
Transition delay:
• exponential profile• T–S waves and 3D disturbances are damped
Separation control by stationary Lorentz force:
• separation & circulation can be controlled• power consumption (too) high (for applications)
Separation control by oscillatory Lorentz force:
• characteristic phenomena comparable to alternativemethods in a quantitative sense
➡ comparable gain in efficiency achievable (?)