Ecole Supérieure de Physique et de Chimie...
89
The travel of heat in solids Kamran Behnia Ecole Supérieure de Physique et de Chimie Industrielles
Transcript of Ecole Supérieure de Physique et de Chimie...
The travel of heat in solids
Kamran Behnia
Ecole Supérieure de Physique et de Chimie Industrielles
Outline
1. Thermal conductivity 2. Thermoelectricity: Seebeck effect 3. Thermoelectricity: Nernst effect
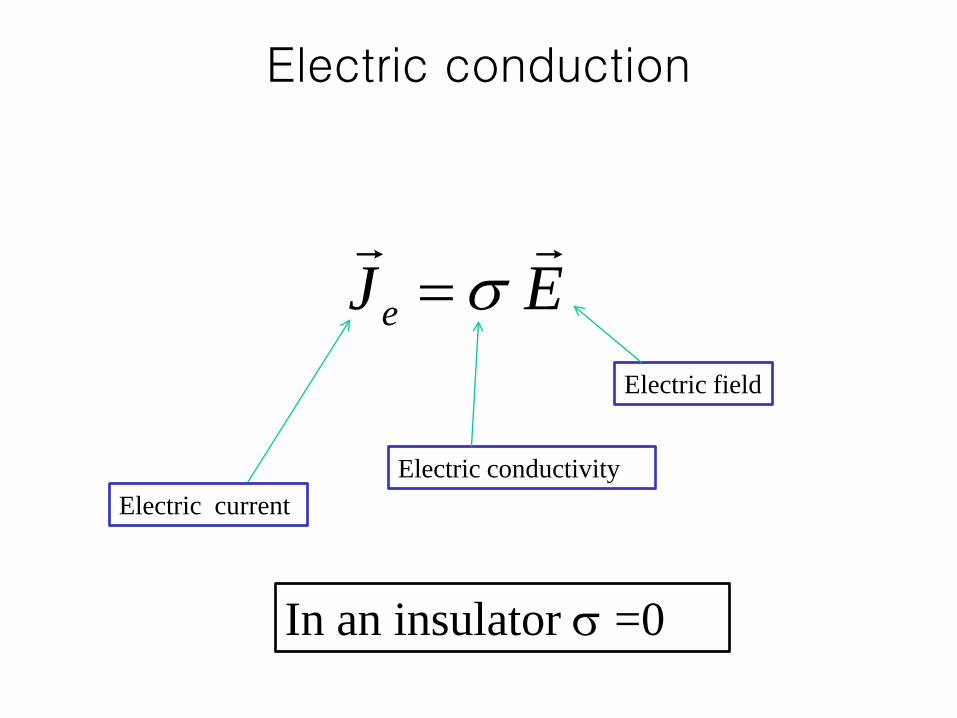
Electric conduction
EJe
σ=
Electric current
Electric field
Electric conductivity
In an insulator σ =0
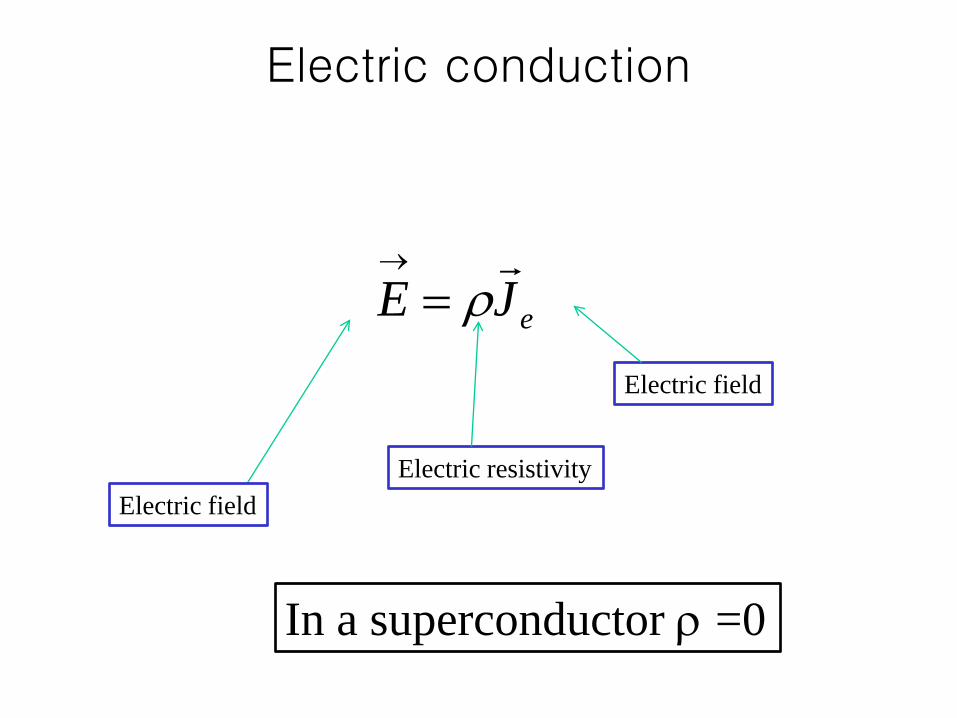
Electric conduction
eJE
ρ=→
Electric field
Electric field
Electric resistivity
In a superconductor ρ =0
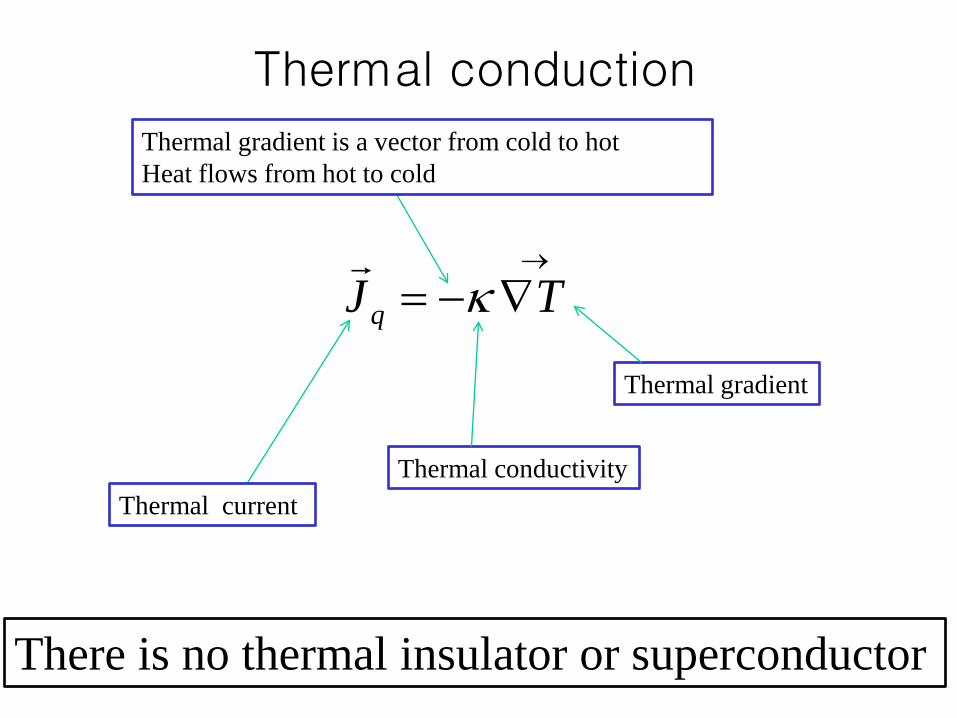
Thermal conduction
→
∇−= TJq κ
Thermal current
Thermal gradient
Thermal conductivity
There is no thermal insulator or superconductor
Thermal gradient is a vector from cold to hot Heat flows from hot to cold
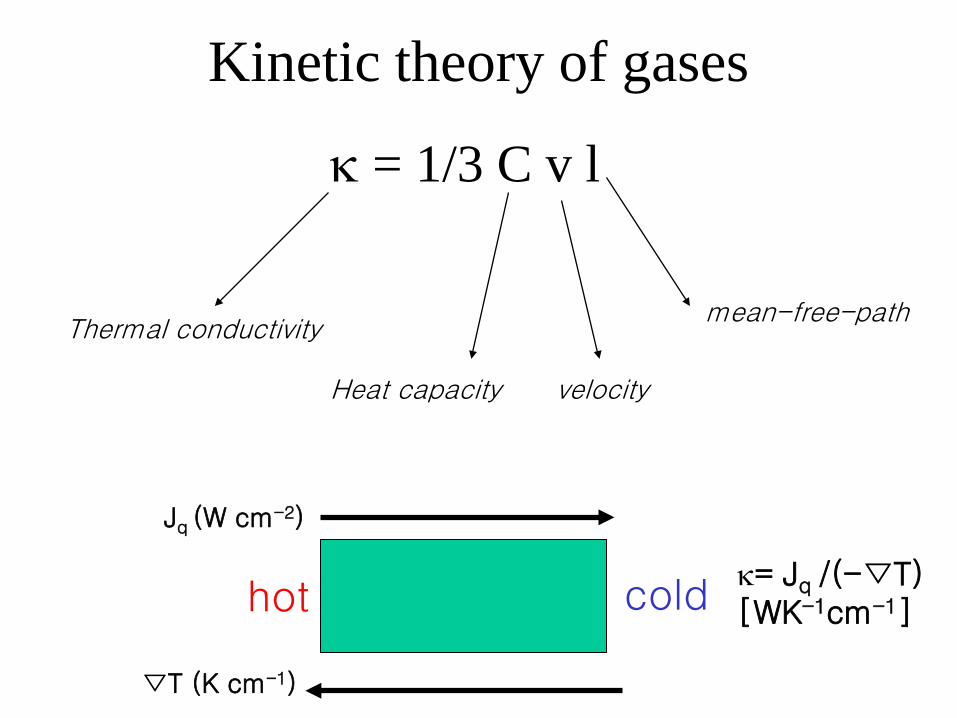
Kinetic theory of gases
κ = 1/3 C v l
Thermal conductivity
Heat capacity velocity
mean-free-path
hot cold
Jq (W cm-2)
∇T (K cm-1)
κ= Jq /(-∇T) [WK-1cm-1]
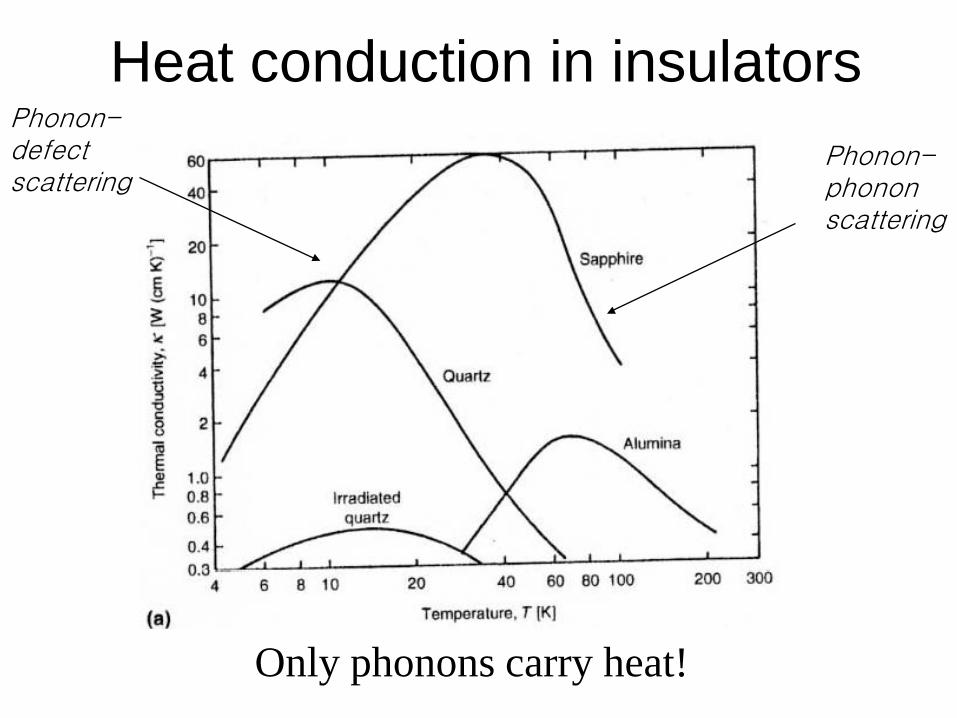
Heat conduction in insulators
Only phonons carry heat!
Phonon-phonon scattering
Phonon- defect scattering
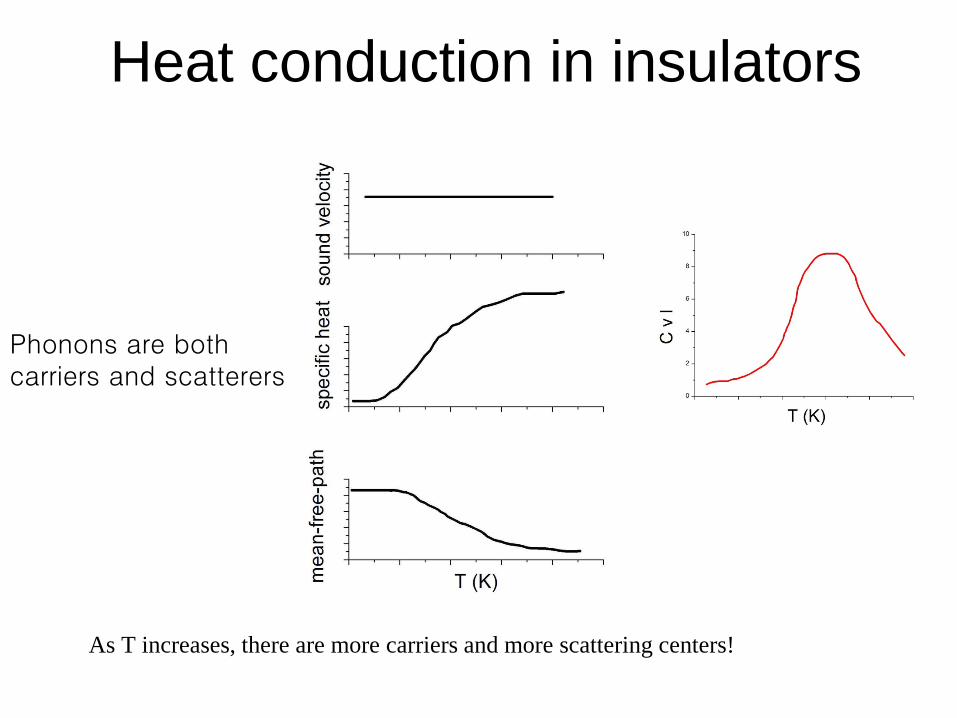
Heat conduction in insulators
As T increases, there are more carriers and more scattering centers!
Phonons are both carriers and scatterers
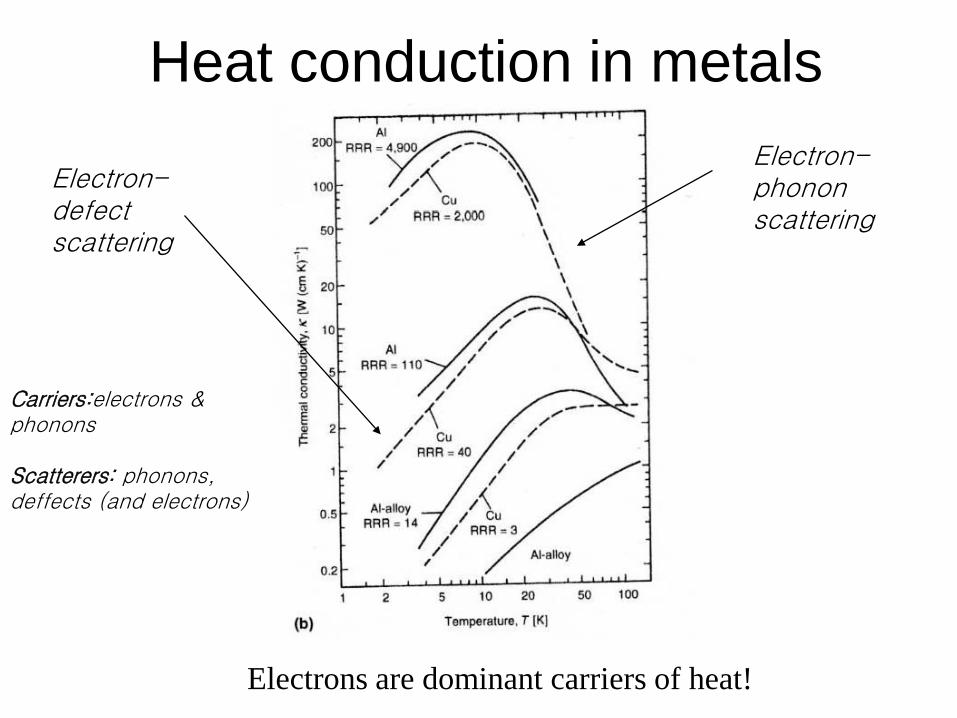
Heat conduction in metals
Electrons are dominant carriers of heat!
Electron-phonon scattering
Electron-defect scattering
Carriers:electrons & phonons Scatterers: phonons, deffects (and electrons)
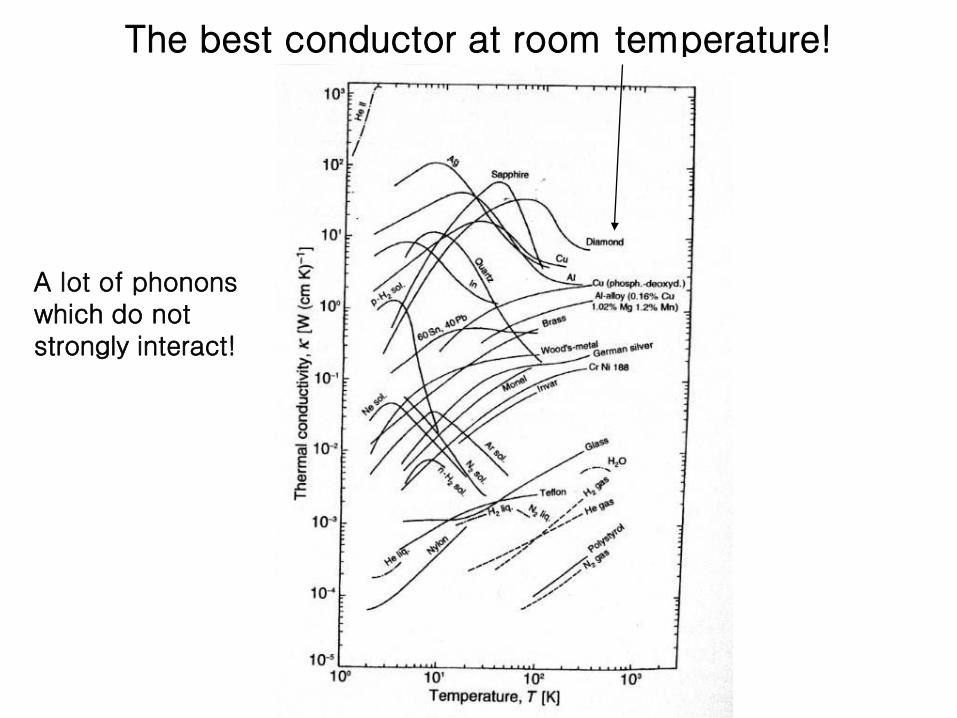
The best conductor at room temperature!
A lot of phonons which do not strongly interact!
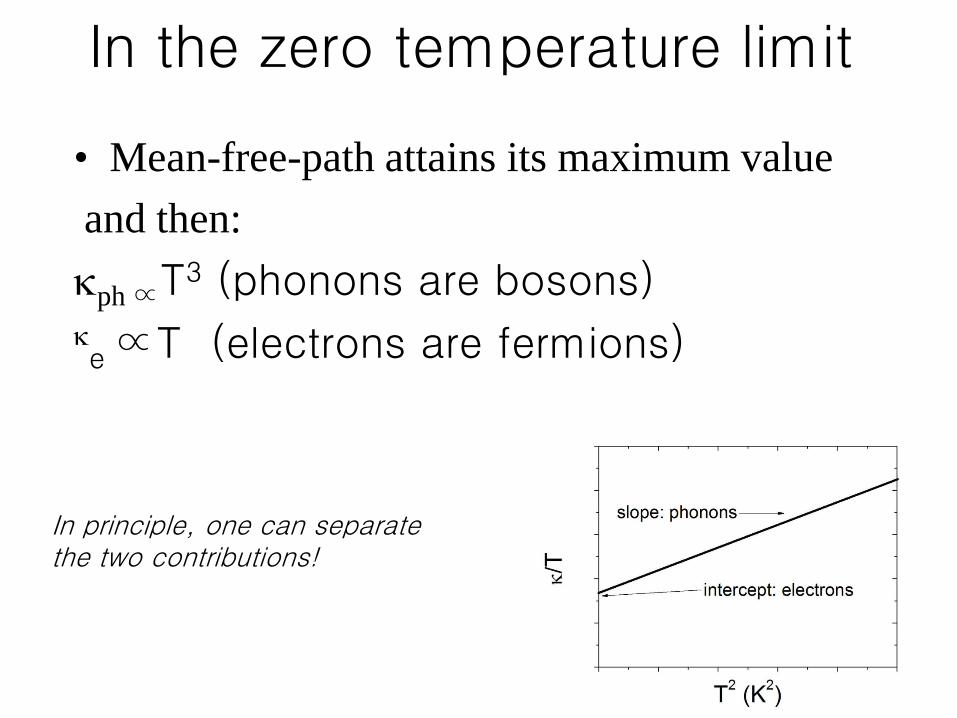
In the zero temperature limit
• Mean-free-path attains its maximum value and then: κph ∝T3 (phonons are bosons) κe ∝T (electrons are fermions)
In principle, one can separate the two contributions!
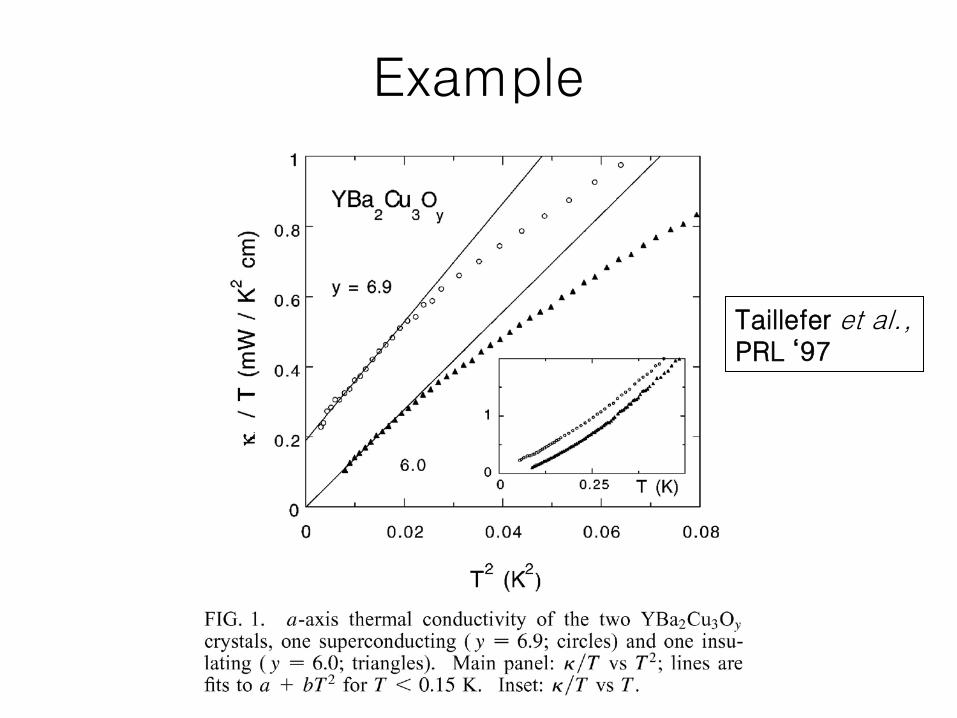
Example
Taillefer et al., PRL ‘97
Thermal conductivity of superconductors
• Above Tc a superconductor is a metal (mobile electrons carry heat!) • Below Tc, mobile electrons condensate in a
macroscopic quantum state: electronic heat carriers vanish!
• A superconductor can be assimilated to a thermal insulator
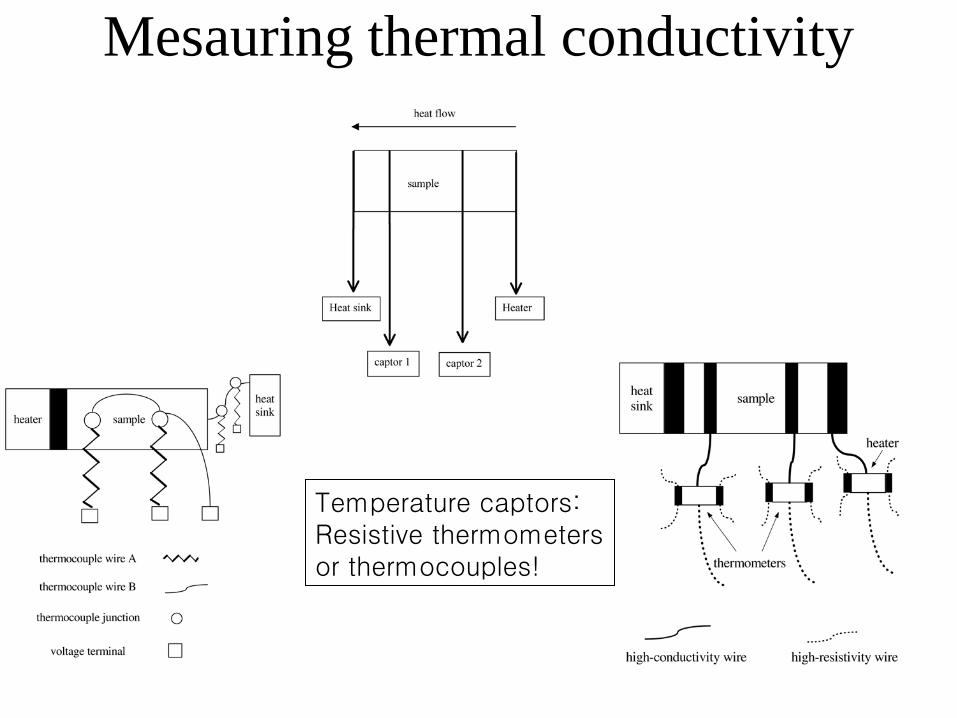
Mesauring thermal conductivity
Temperature captors: Resistive thermometers or thermocouples!
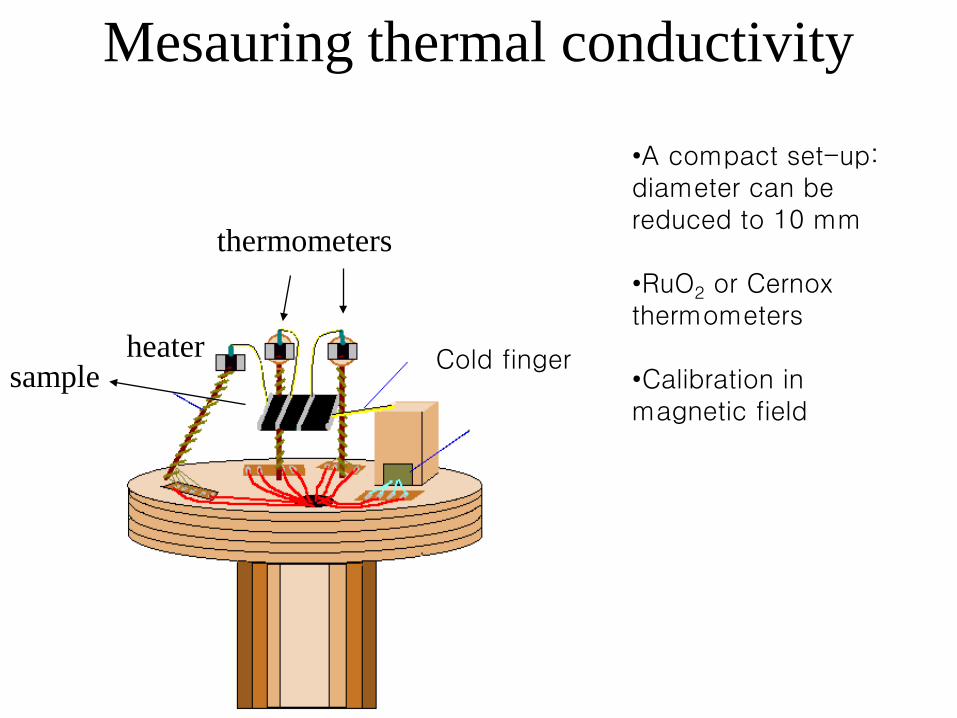
Mesauring thermal conductivity
thermometers
heater sample Cold finger
•A compact set-up: diameter can be reduced to 10 mm
•RuO2 or Cernox thermometers
•Calibration in magnetic field
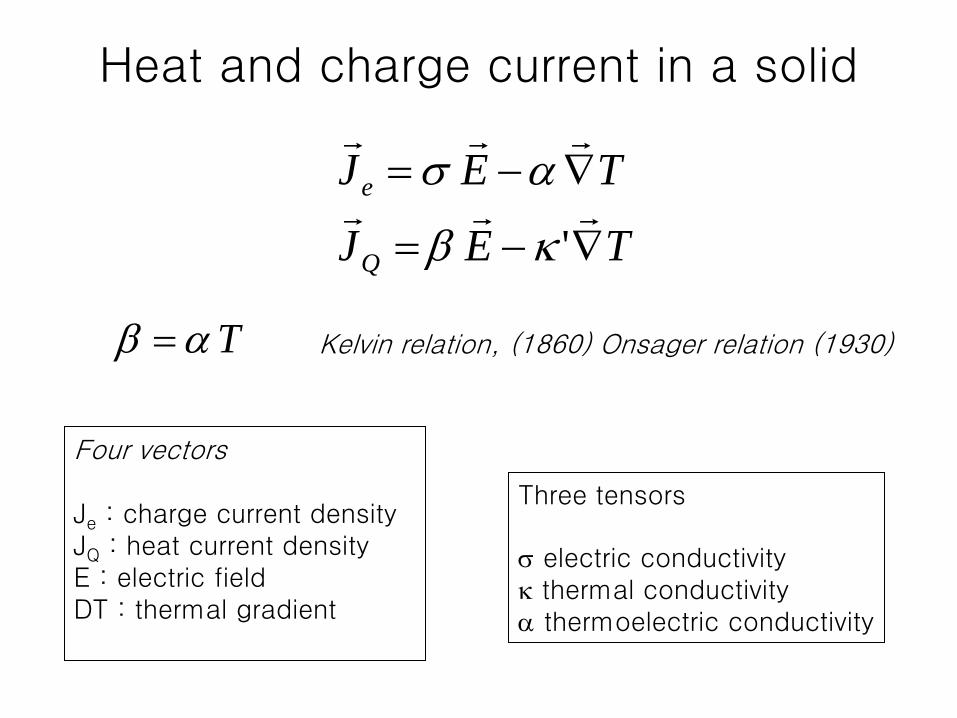
Heat and charge current in a solid
TEJ
TEJ
Q
e
∇−=
∇−=
'κβ
ασ
Three tensors σ electric conductivity κ thermal conductivity α thermoelectric conductivity
Four vectors Je : charge current density JQ : heat current density E : electric field DT : thermal gradient
Tαβ = Kelvin relation, (1860) Onsager relation (1930)
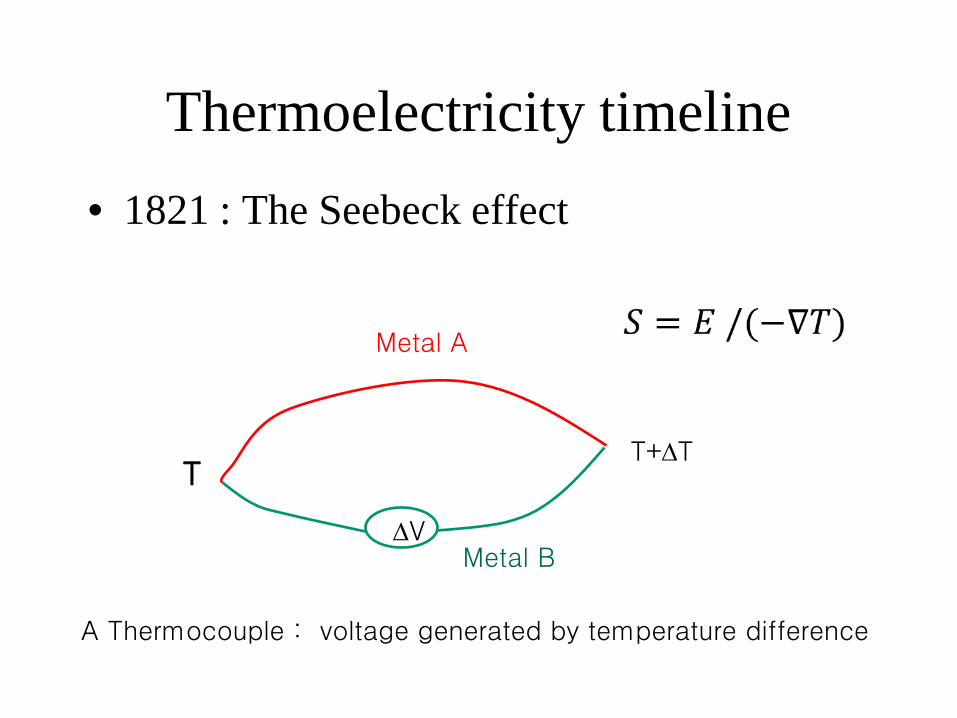
Thermoelectricity timeline • 1821 : The Seebeck effect
Metal A
Metal B ∆V
T T+∆T
A Thermocouple : voltage generated by temperature difference
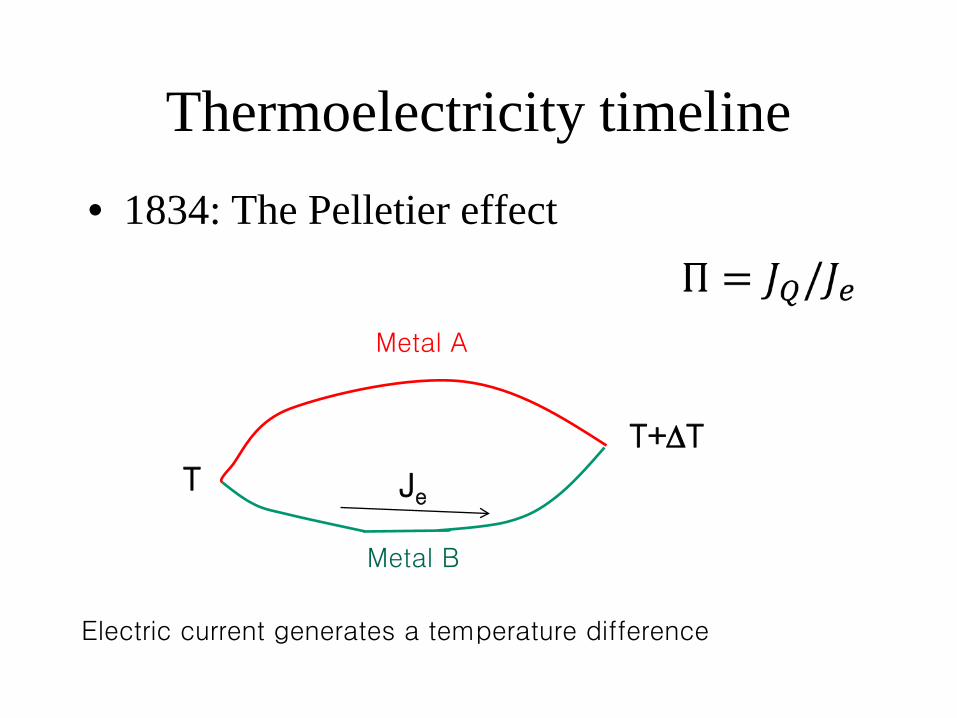
Thermoelectricity timeline • 1834: The Pelletier effect
Metal A
Metal B
T Je
Electric current generates a temperature difference
T+∆T
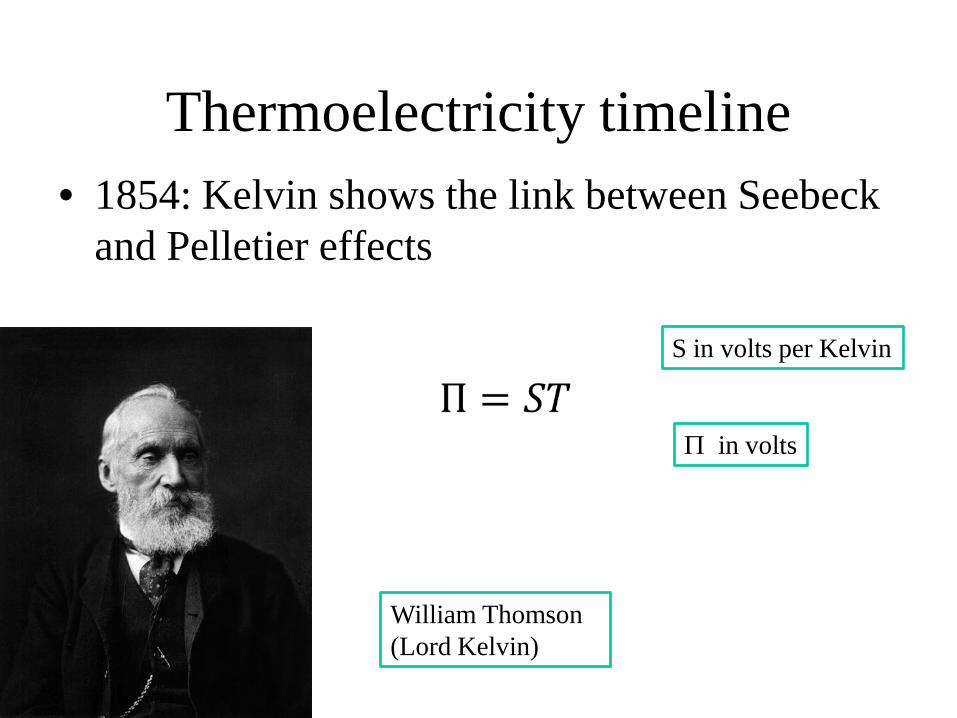
Thermoelectricity timeline • 1854: Kelvin shows the link between Seebeck
and Pelletier effects
Π in volts
S in volts per Kelvin
William Thomson (Lord Kelvin)
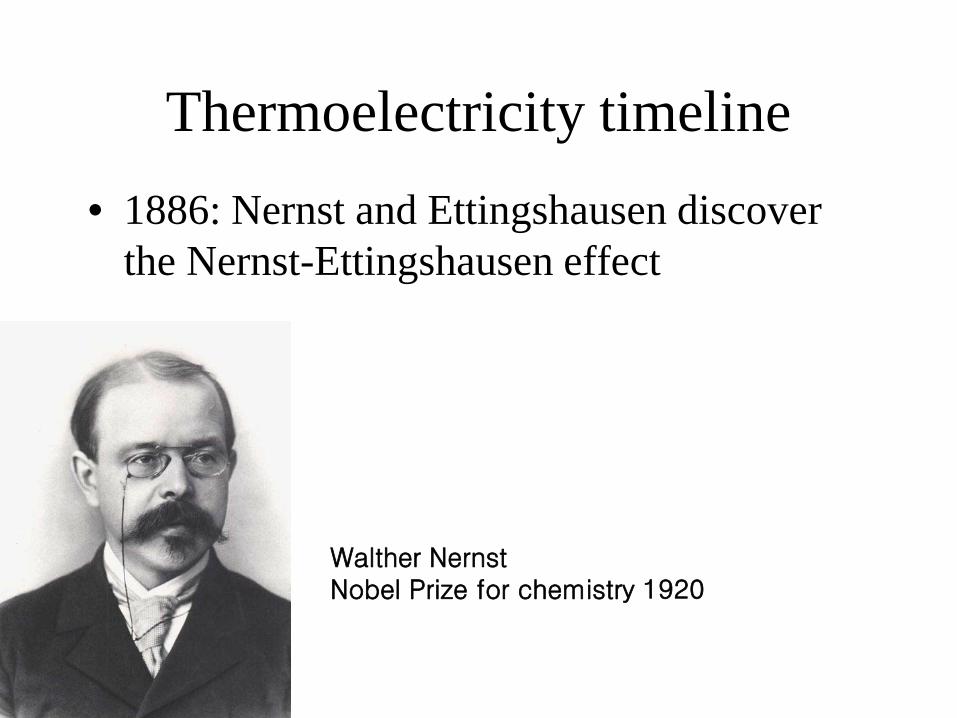
Thermoelectricity timeline • 1886: Nernst and Ettingshausen discover
the Nernst-Ettingshausen effect
Walther Nernst Nobel Prize for chemistry 1920
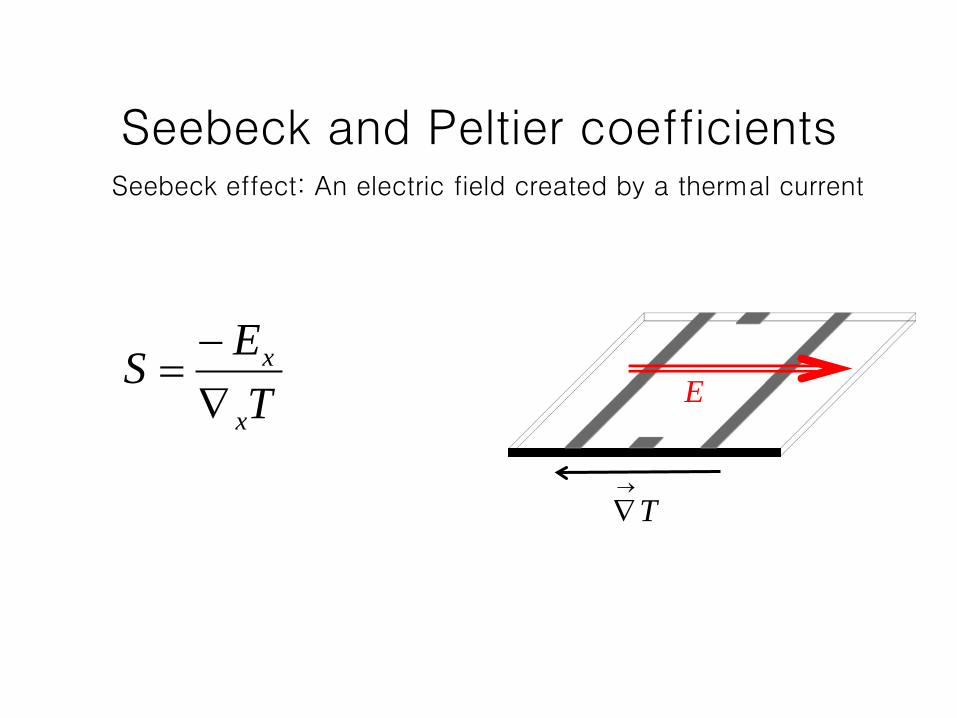
Seebeck and Peltier coefficients
TESx
x
∇−
= E
T→
∇
Seebeck effect: An electric field created by a thermal current
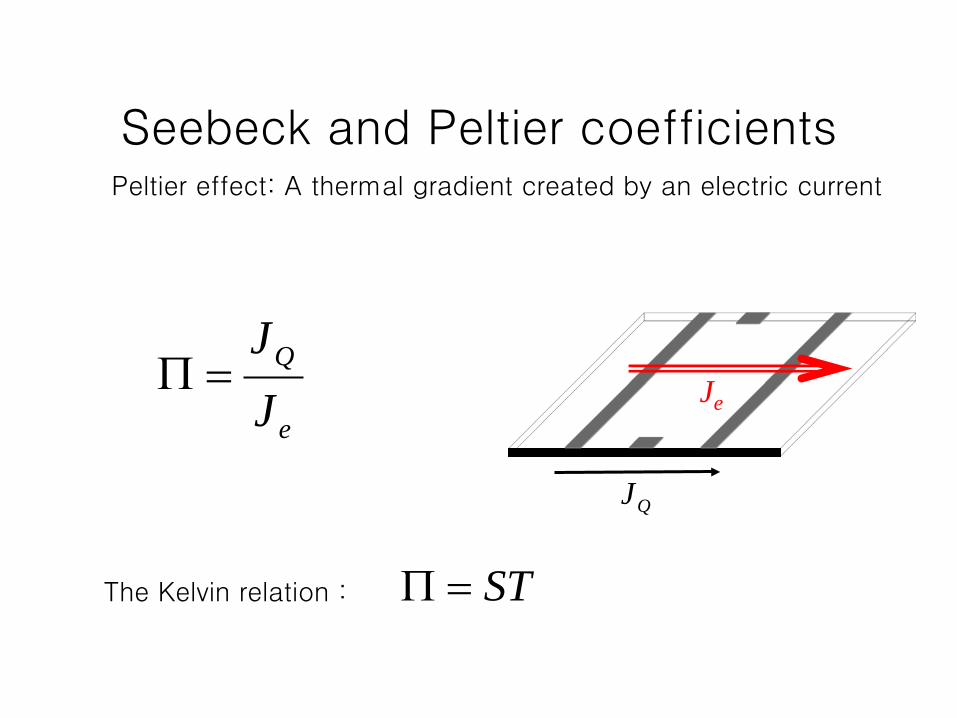
Seebeck and Peltier coefficients
Je
QJ
Peltier effect: A thermal gradient created by an electric current
e
Q
JJ
=Π
ST=ΠThe Kelvin relation :
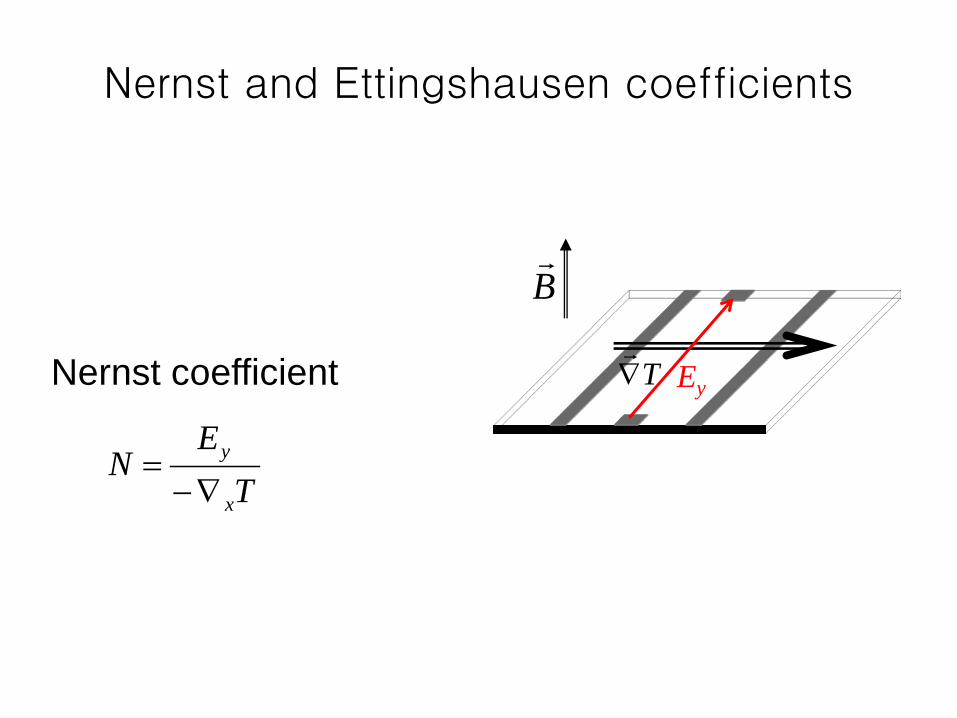
Nernst and Ettingshausen coefficients
Nernst coefficient Ey T∇
B
TE
Nx
y
∇−=
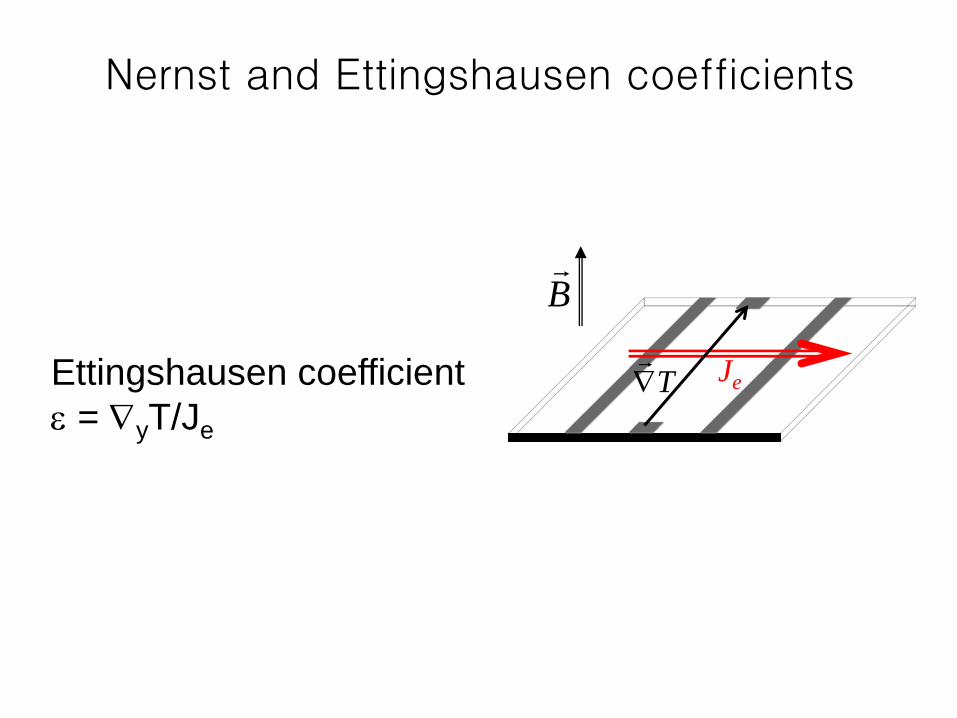
Nernst and Ettingshausen coefficients
Ettingshausen coefficient ε = ∇yT/Je
Je T∇
B
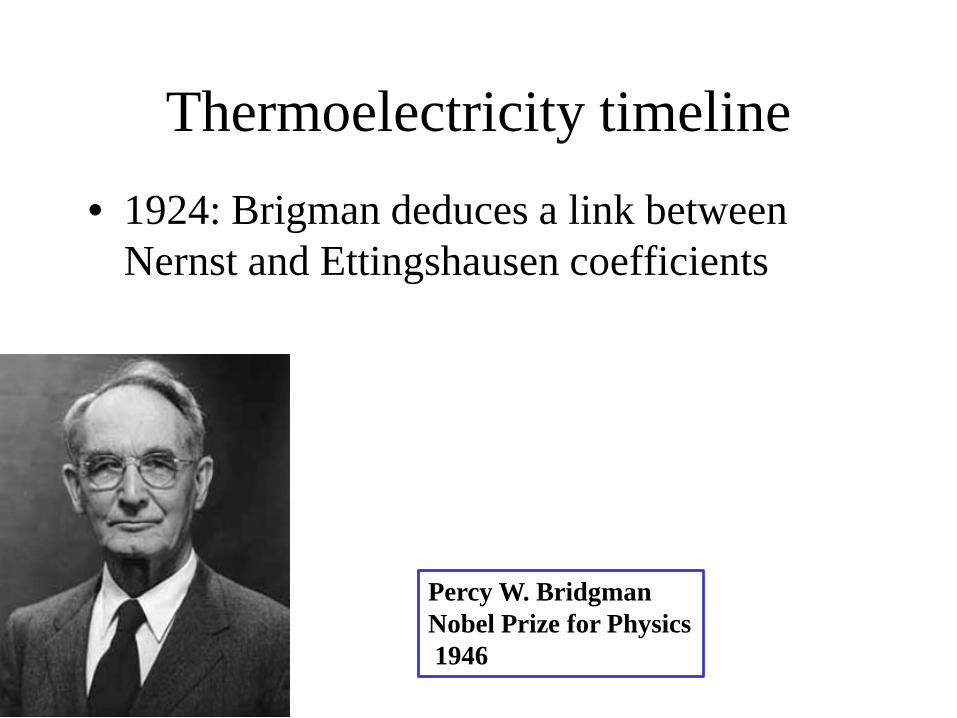
Thermoelectricity timeline • 1924: Brigman deduces a link between
Nernst and Ettingshausen coefficients
Percy W. Bridgman Nobel Prize for Physics 1946
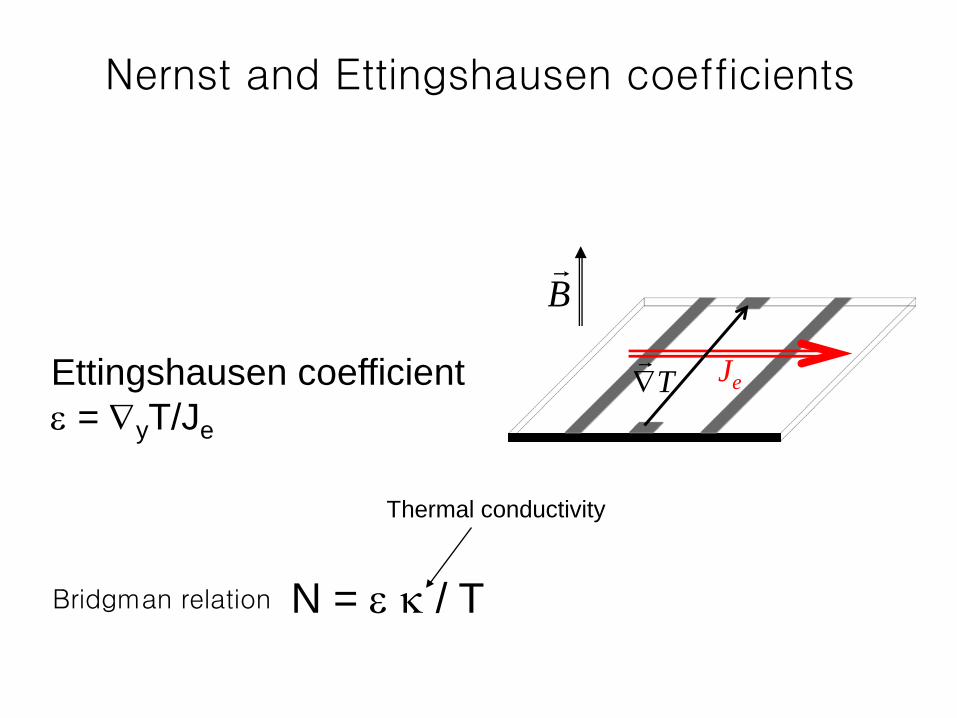
Nernst and Ettingshausen coefficients
N = ε κ / T
Ettingshausen coefficient ε = ∇yT/Je
Je T∇
B
Thermal conductivity
Bridgman relation
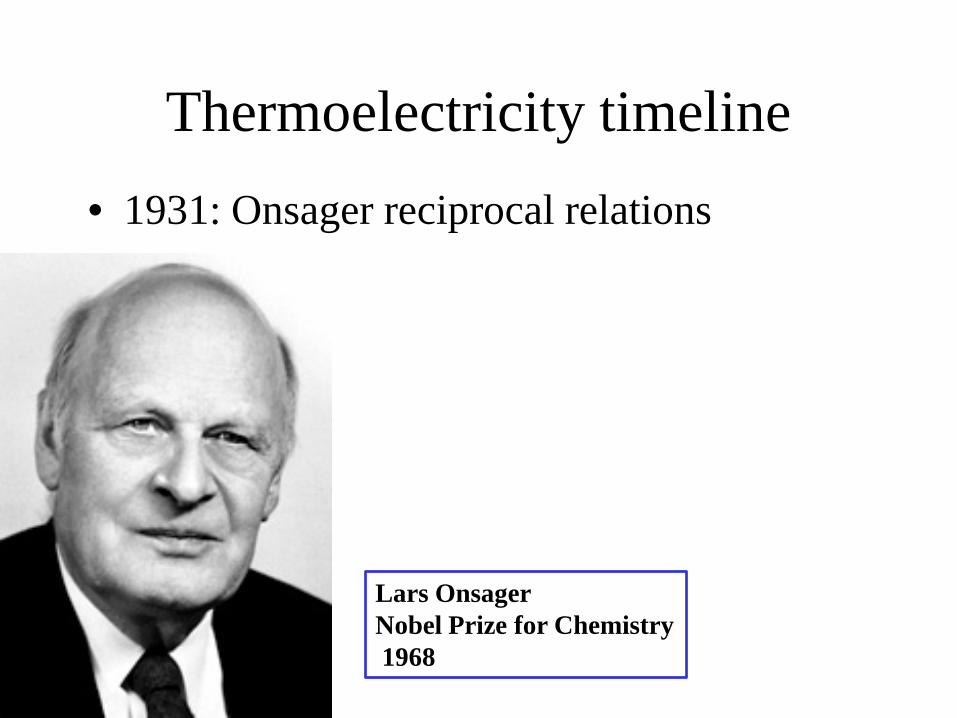
Thermoelectricity timeline • 1931: Onsager reciprocal relations
Lars Onsager Nobel Prize for Chemistry 1968
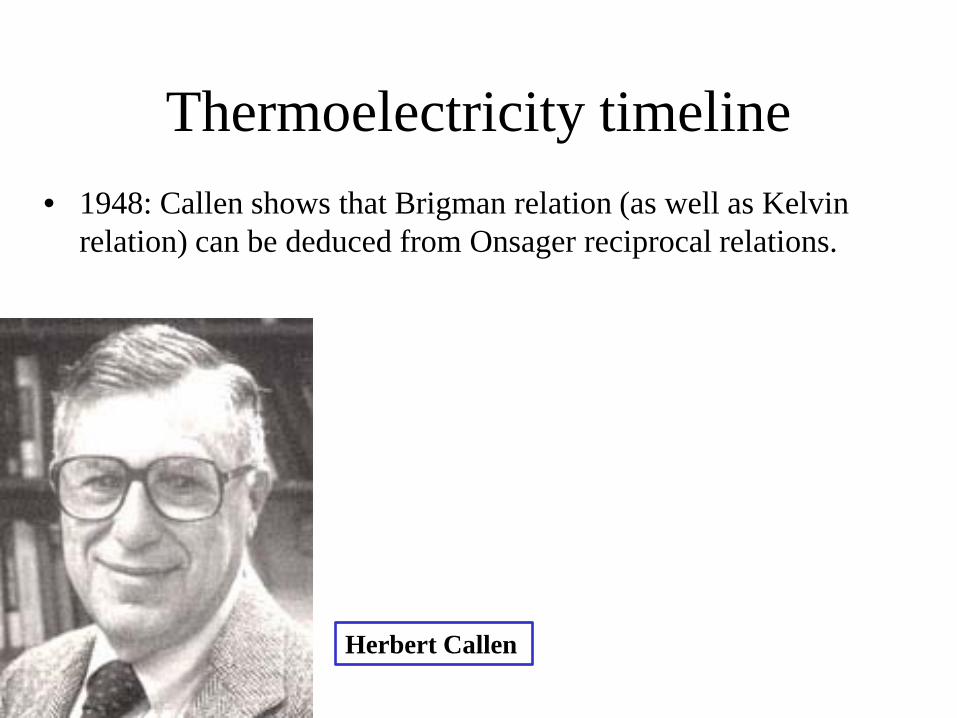
Thermoelectricity timeline • 1948: Callen shows that Brigman relation (as well as Kelvin
relation) can be deduced from Onsager reciprocal relations.
Herbert Callen
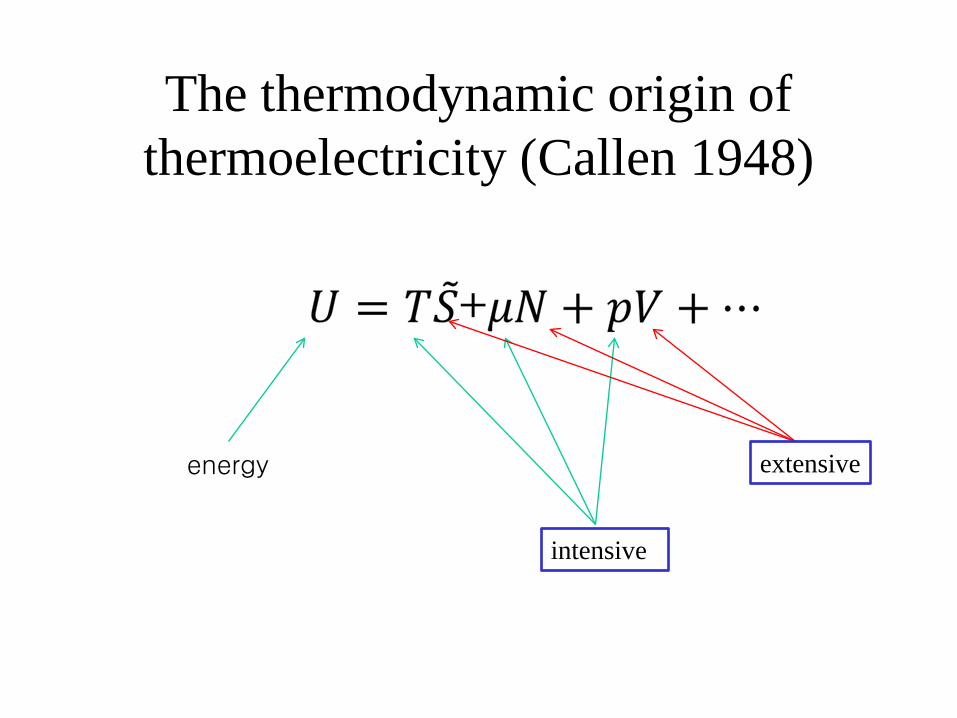
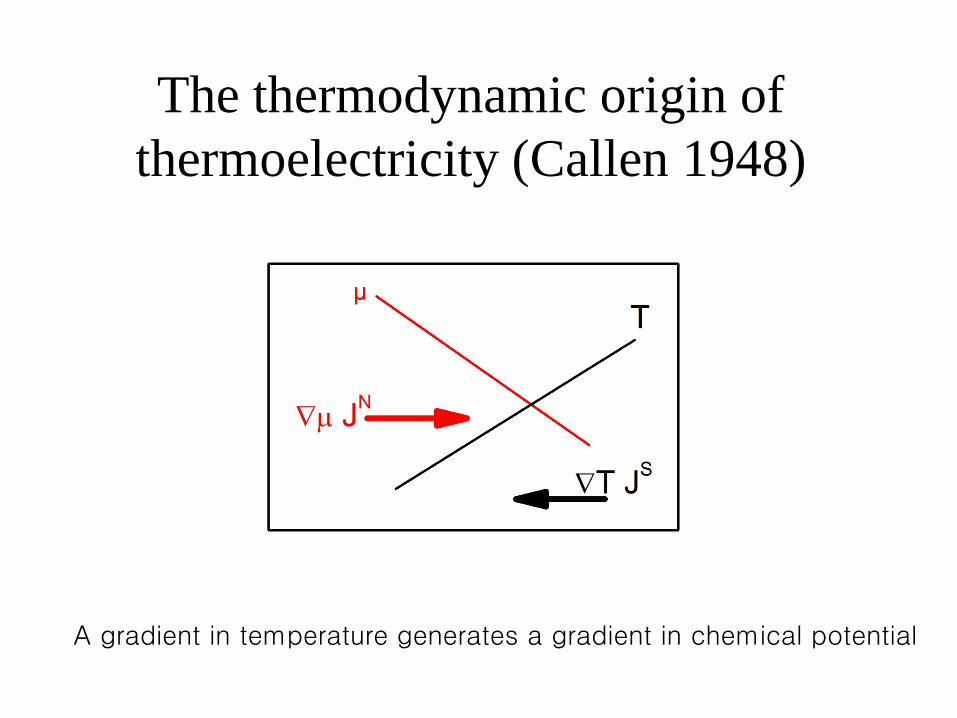
The thermodynamic origin of thermoelectricity (Callen 1948)
energy
intensive
extensive
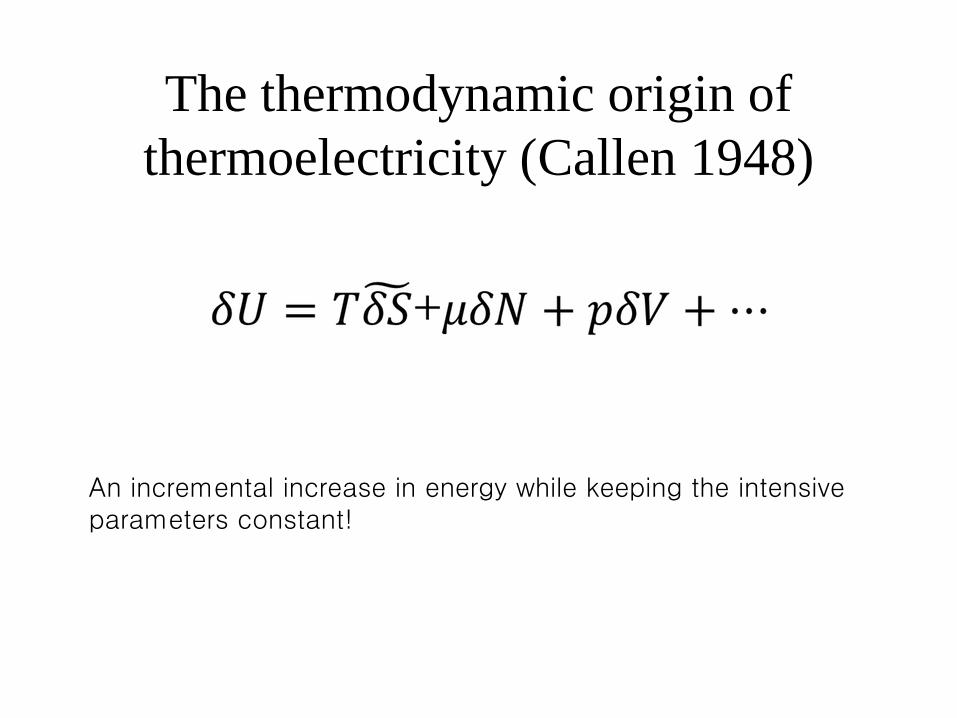
The thermodynamic origin of thermoelectricity (Callen 1948)
An incremental increase in energy while keeping the intensive parameters constant!
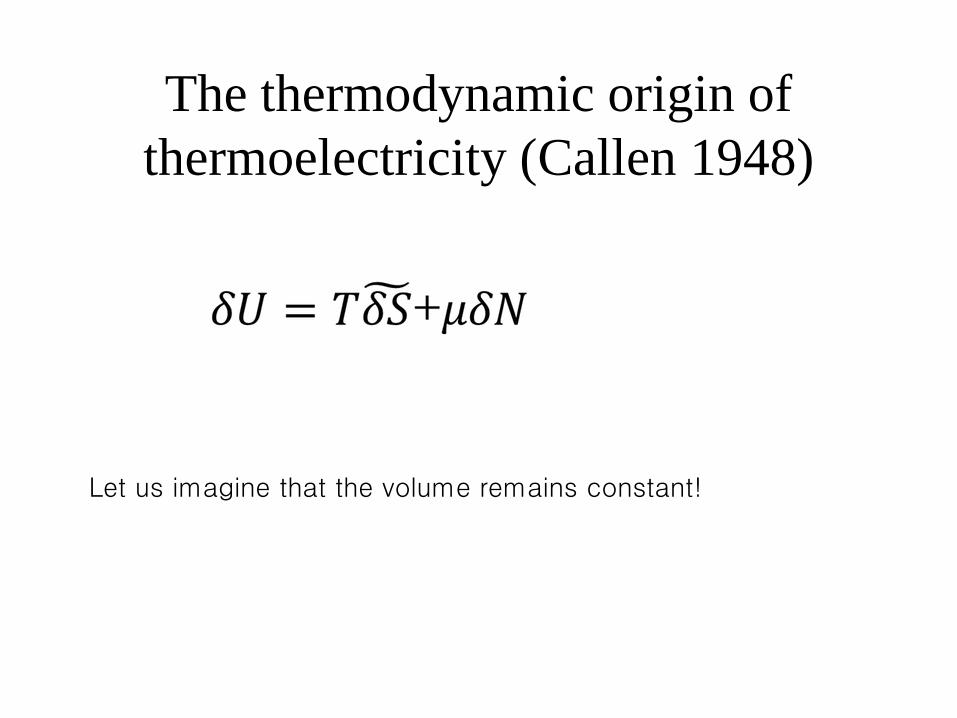
The thermodynamic origin of thermoelectricity (Callen 1948)
Let us imagine that the volume remains constant!
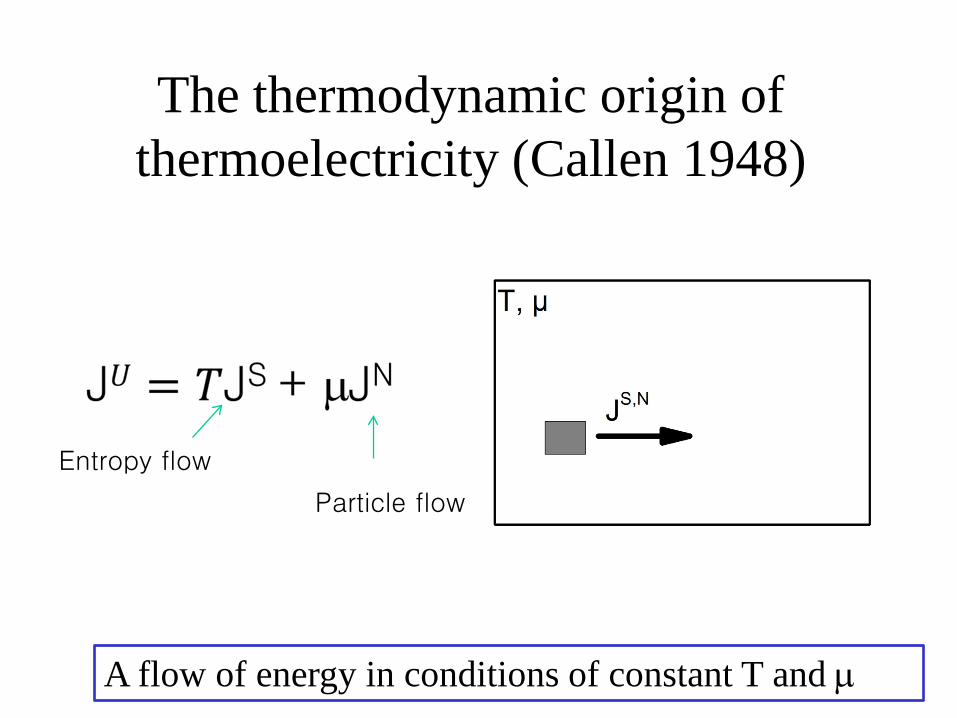
The thermodynamic origin of thermoelectricity (Callen 1948)
A flow of energy in conditions of constant T and µ
Particle flow
Entropy flow
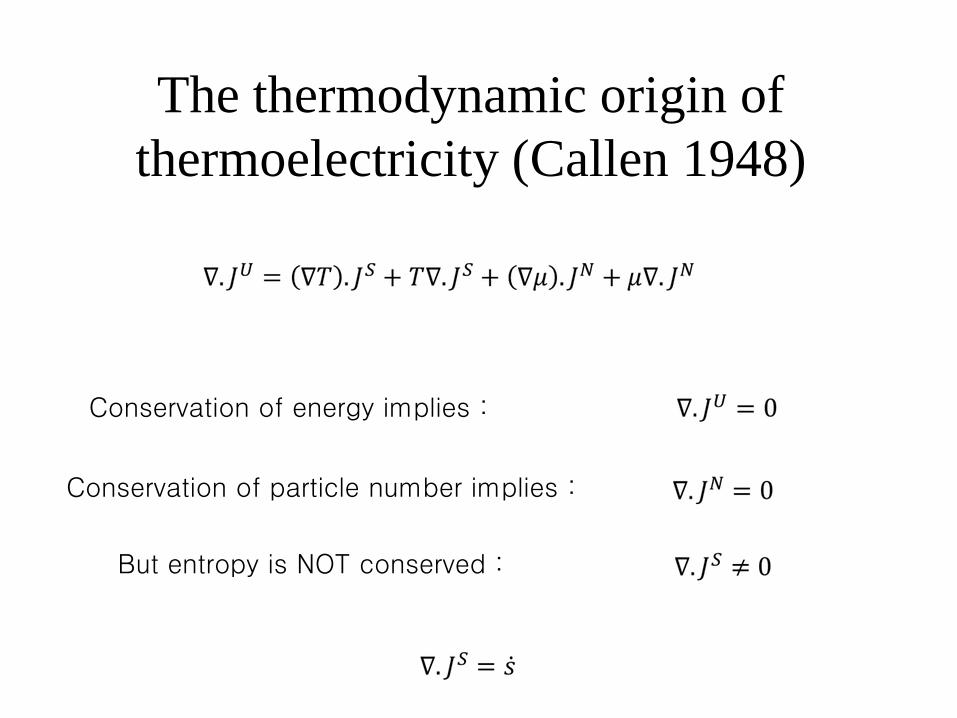
The thermodynamic origin of thermoelectricity (Callen 1948)
Conservation of energy implies :
Conservation of particle number implies :
But entropy is NOT conserved :
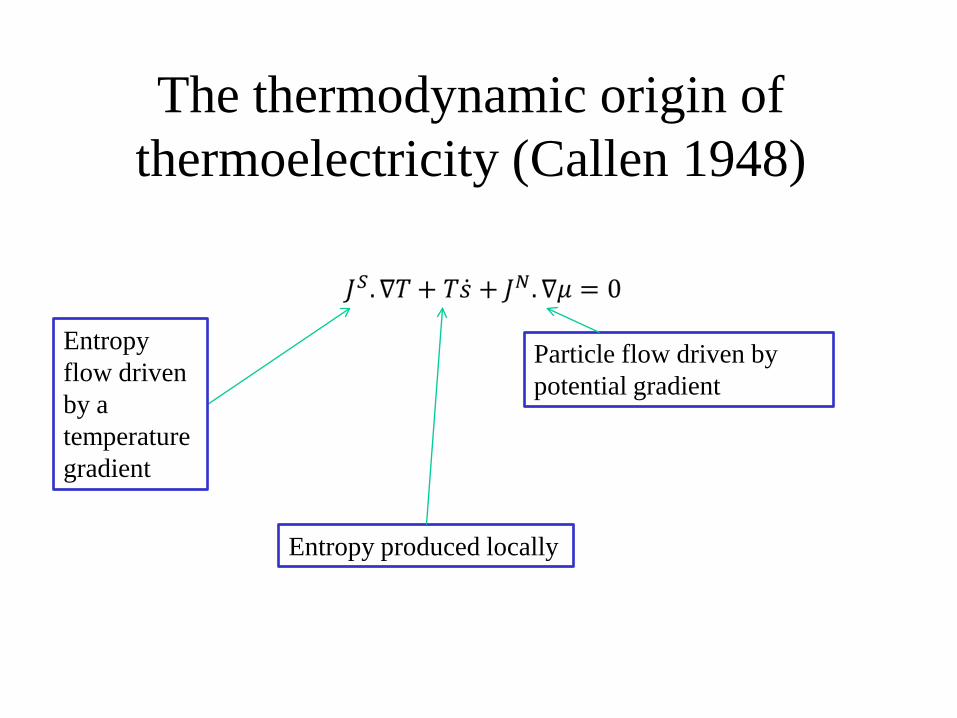
The thermodynamic origin of thermoelectricity (Callen 1948)
Entropy flow driven by a temperature gradient
Entropy produced locally
Particle flow driven by potential gradient
The thermodynamic origin of thermoelectricity (Callen 1948)
A gradient in temperature generates a gradient in chemical potential
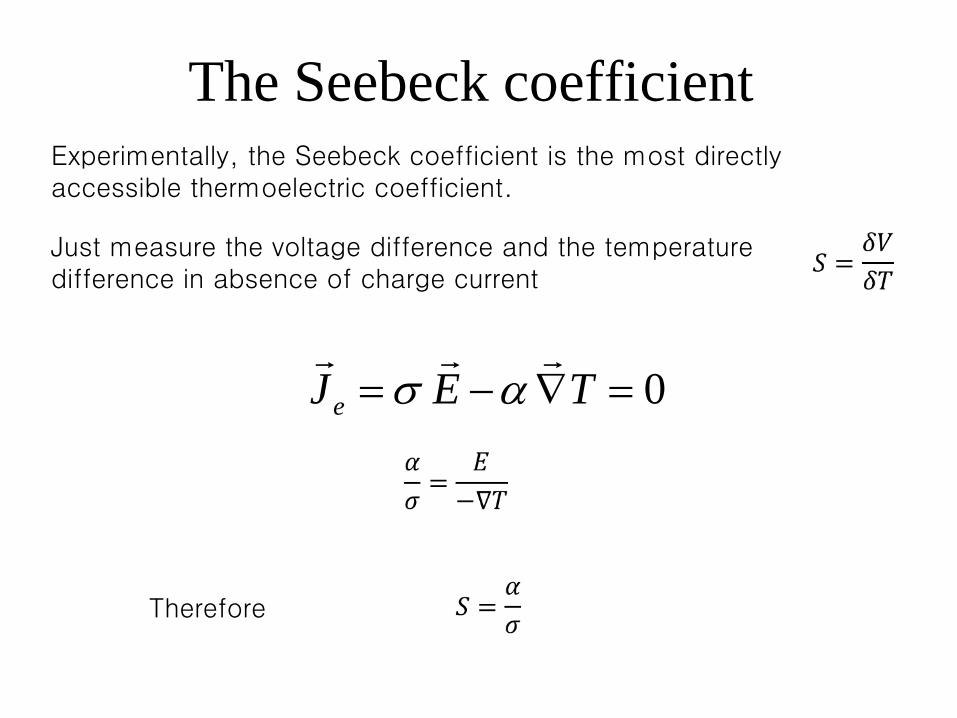
The Seebeck coefficient Experimentally, the Seebeck coefficient is the most directly accessible thermoelectric coefficient.
Just measure the voltage difference and the temperature difference in absence of charge current
0=∇−= TEJe
ασ
Therefore
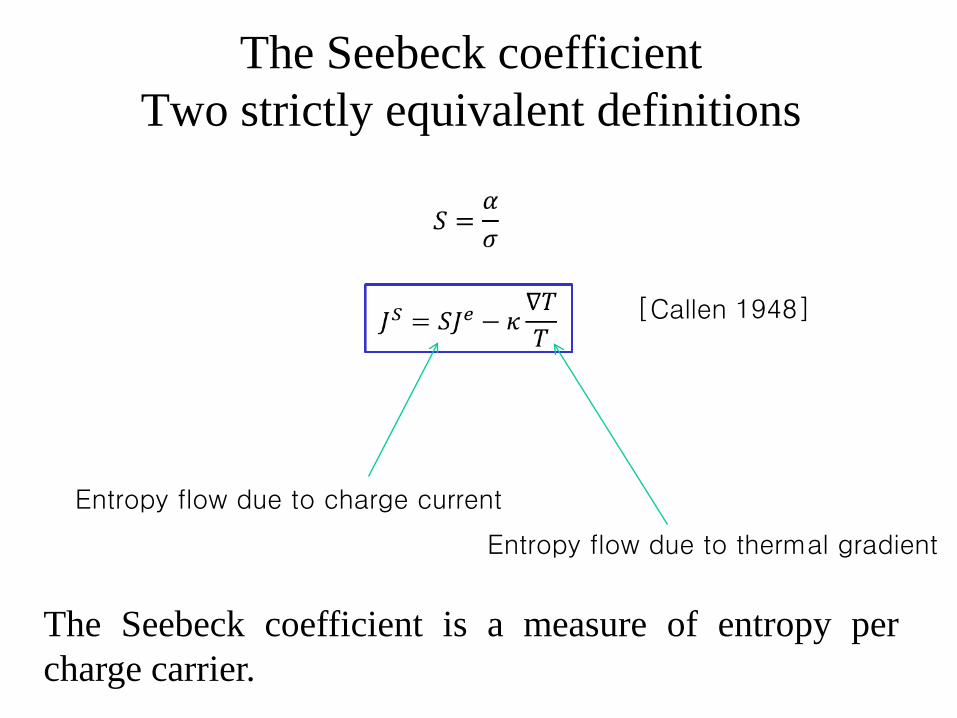
The Seebeck coefficient Two strictly equivalent definitions
Entropy flow due to charge current
Entropy flow due to thermal gradient
The Seebeck coefficient is a measure of entropy per charge carrier.
[Callen 1948]
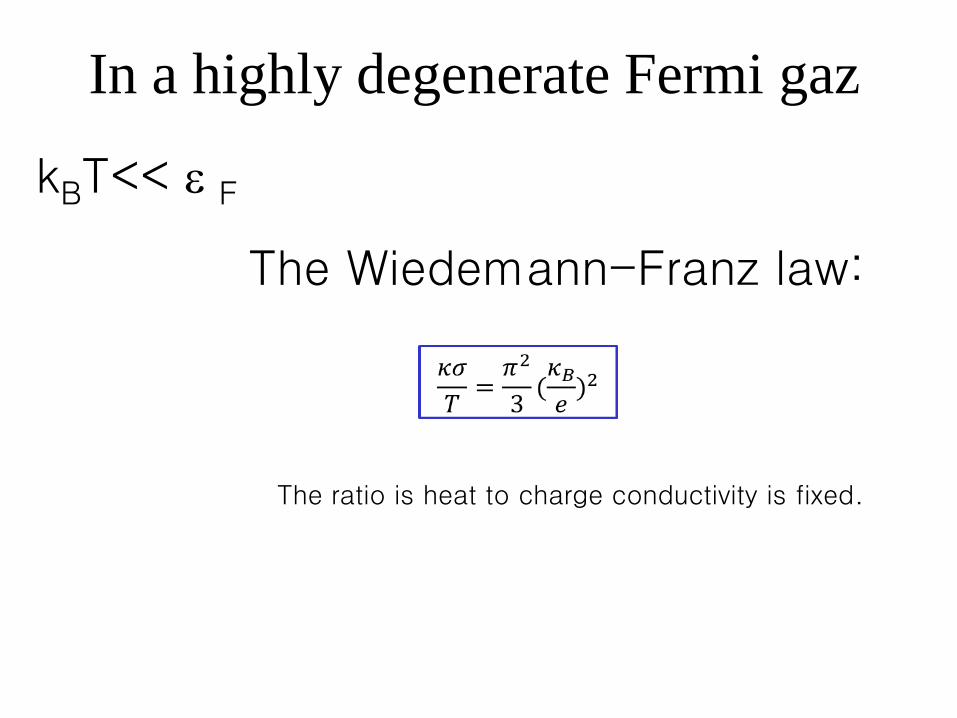
In a highly degenerate Fermi gaz
kBT<< ε F
The Wiedemann-Franz law:
The ratio is heat to charge conductivity is fixed.
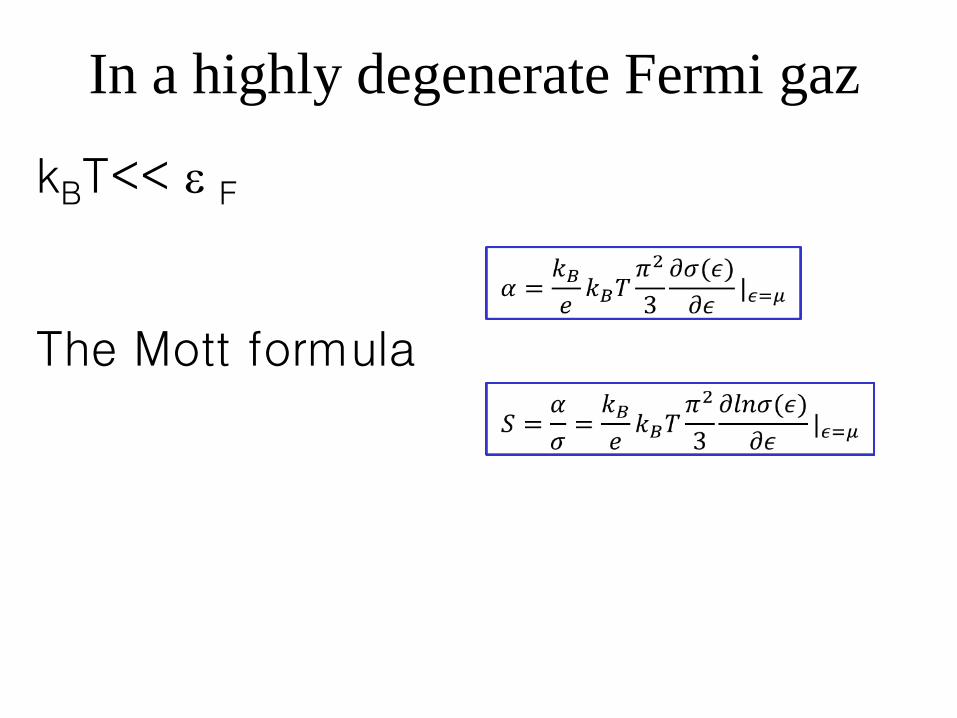
In a highly degenerate Fermi gaz
kBT<< ε F
The Mott formula
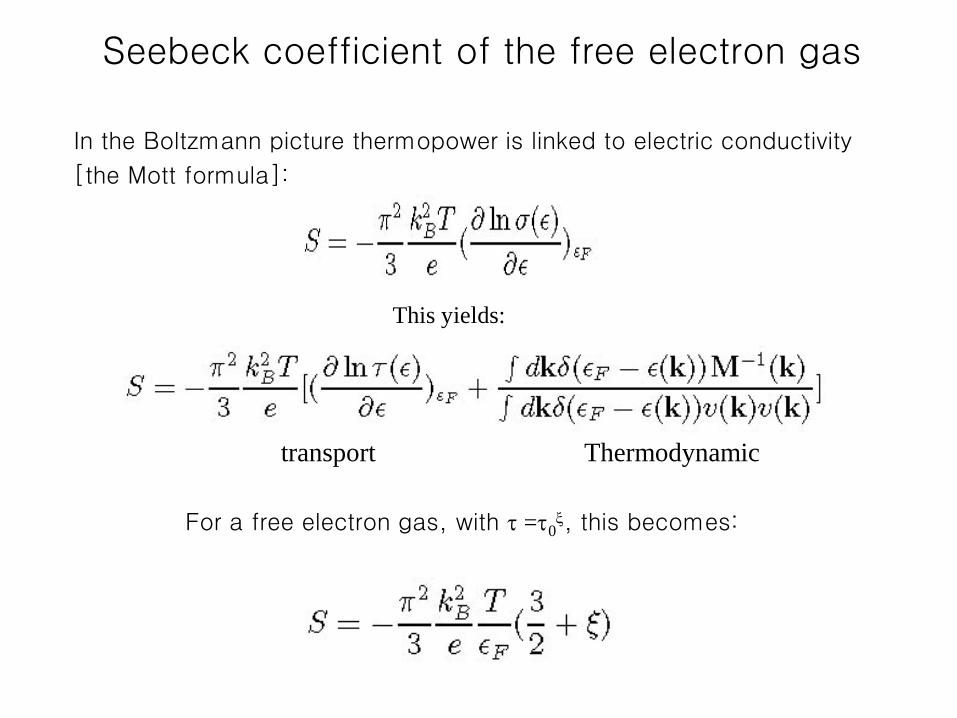
Seebeck coefficient of the free electron gas
In the Boltzmann picture thermopower is linked to electric conductivity
[the Mott formula]:
This yields:
transport Thermodynamic
For a free electron gas, with τ =τ0ξ, this becomes:
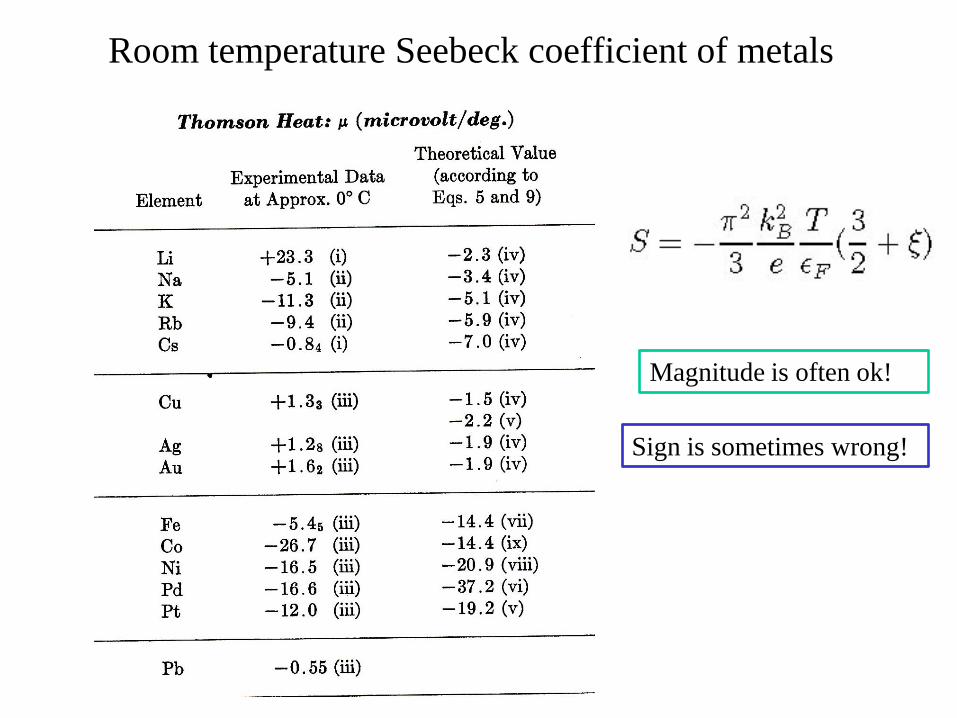
Room temperature Seebeck coefficient of metals
Sign is sometimes wrong!
Magnitude is often ok!
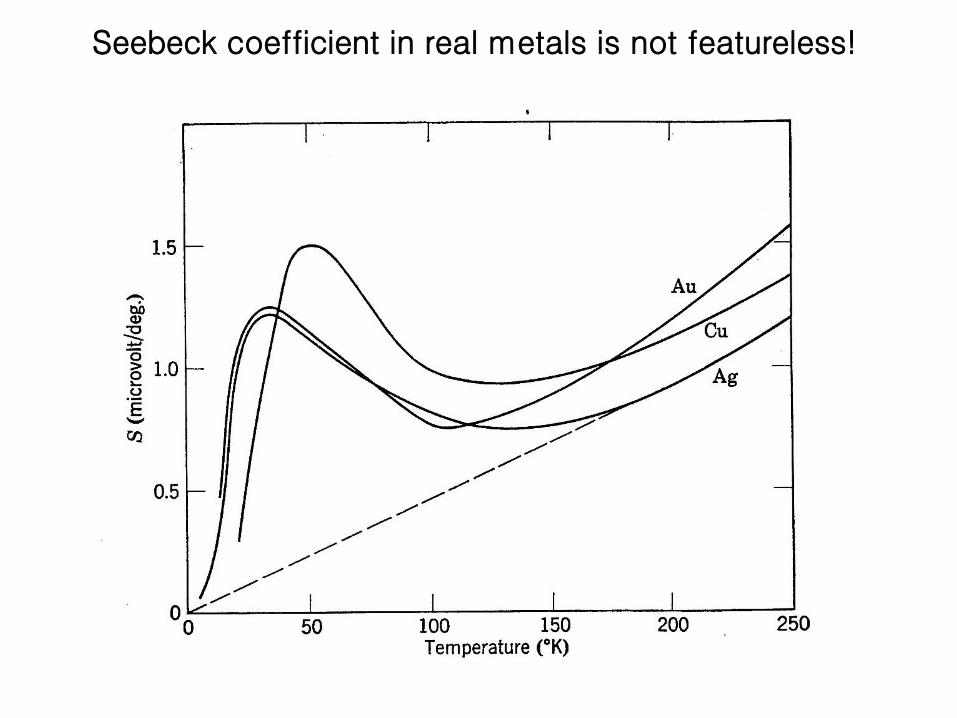
Seebeck coefficient in real metals is not featureless!
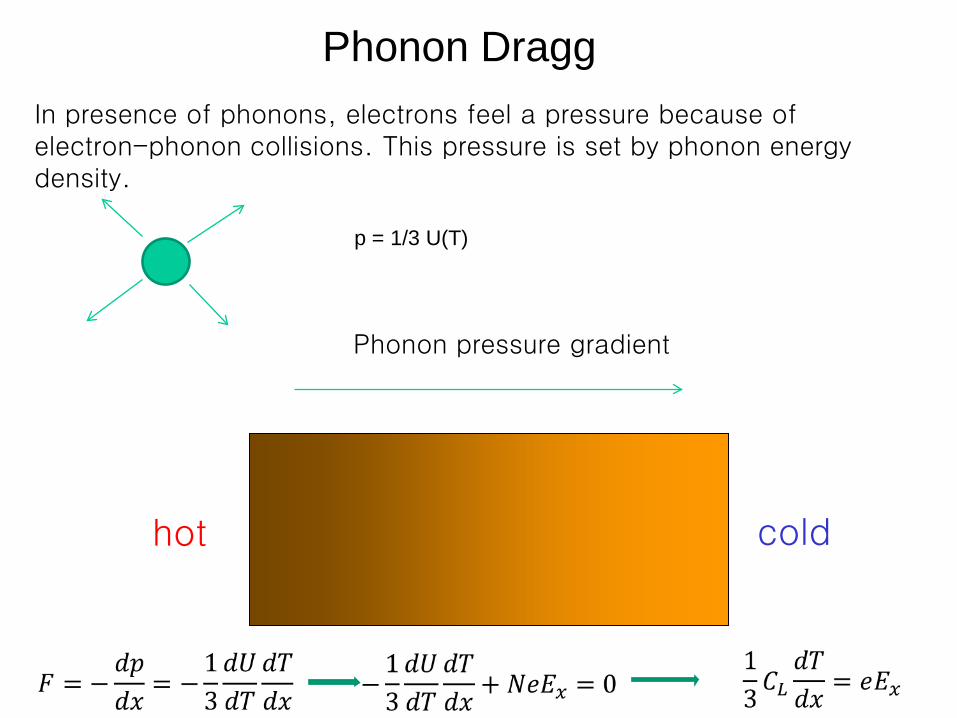
p = 1/3 U(T)
Phonon Dragg
hot cold
Phonon pressure gradient
In presence of phonons, electrons feel a pressure because of electron-phonon collisions. This pressure is set by phonon energy density.
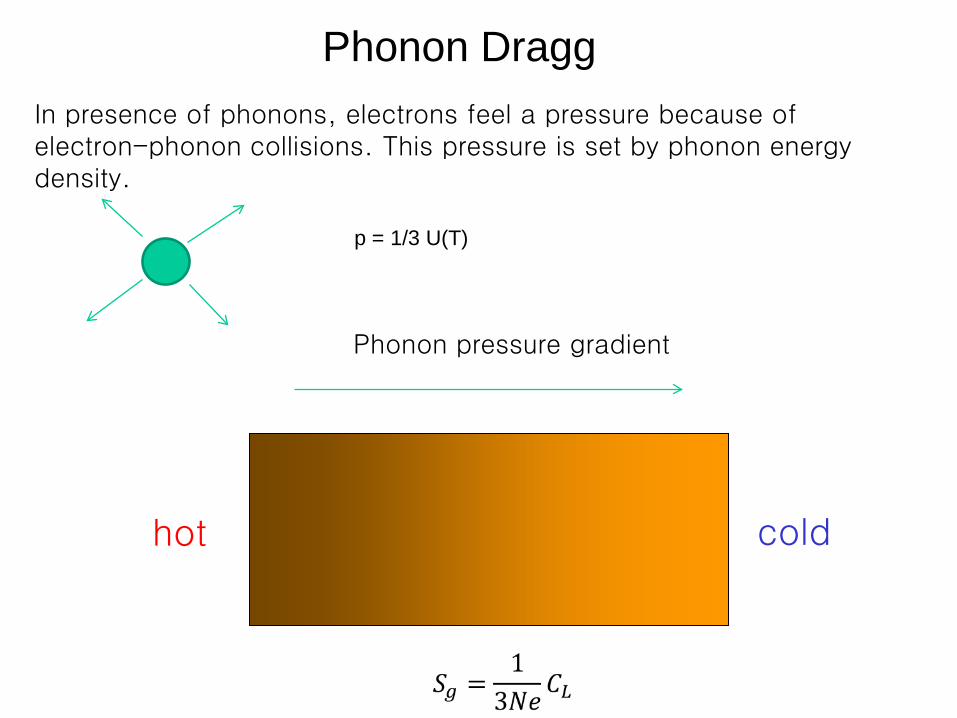
p = 1/3 U(T)
Phonon Dragg
hot cold
Phonon pressure gradient
In presence of phonons, electrons feel a pressure because of electron-phonon collisions. This pressure is set by phonon energy density.
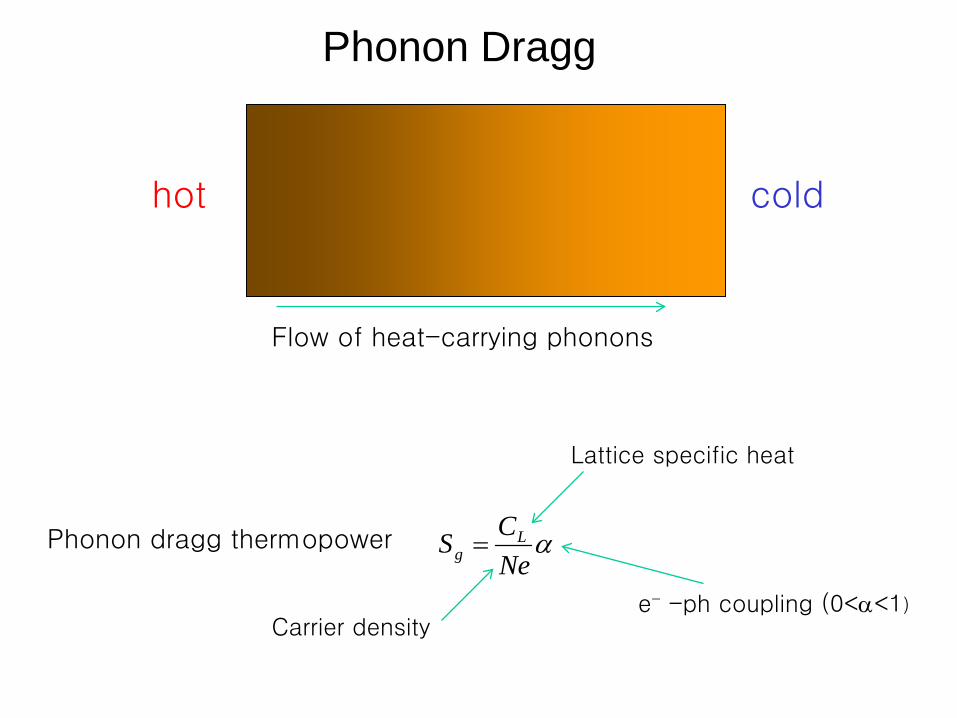
Phonon Dragg
hot cold
Flow of heat-carrying phonons
αNeCS L
g =Phonon dragg thermopower
Lattice specific heat
Carrier density e- -ph coupling (0<α<1)
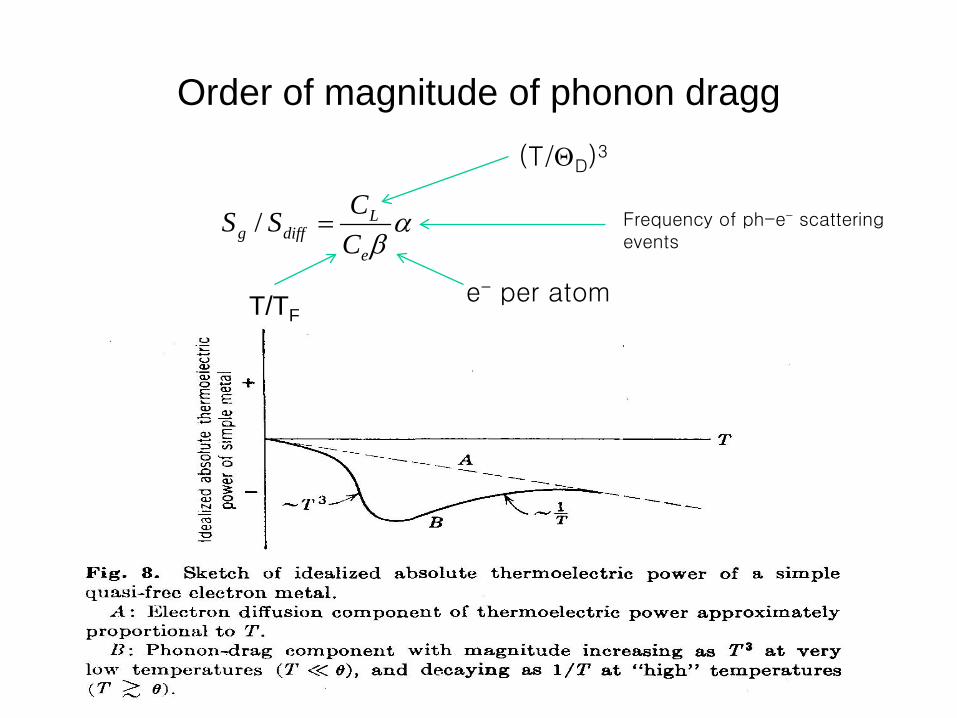
Order of magnitude of phonon dragg
αβe
Ldiffg C
CSS =/
e- per atom
(T/ΘD)3
T/TF
Frequency of ph-e- scattering events
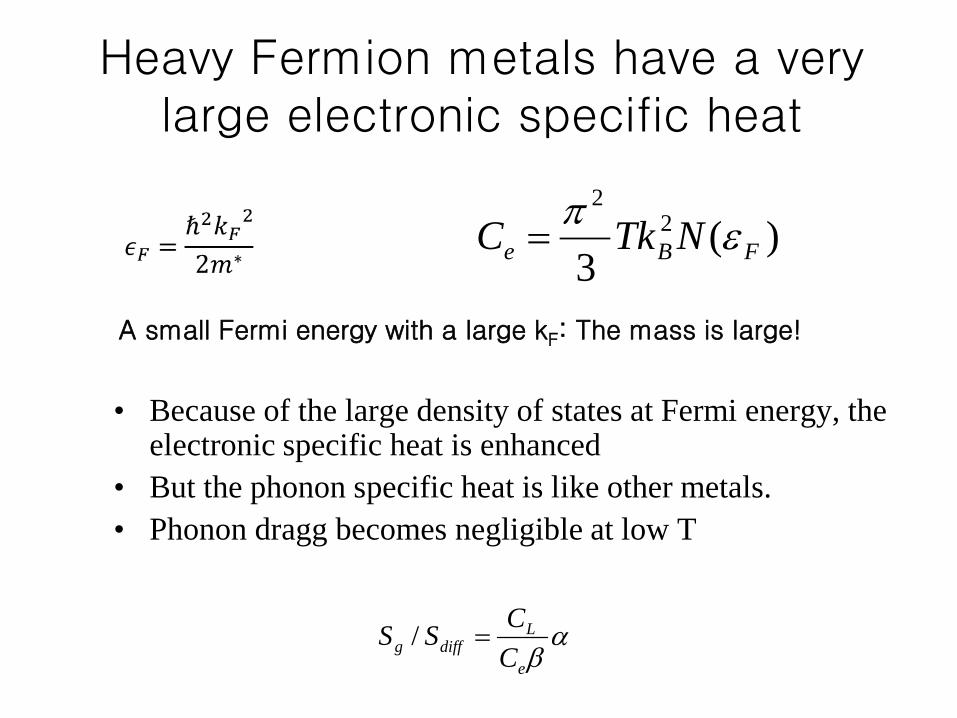
Heavy Fermion metals have a very large electronic specific heat
• Because of the large density of states at Fermi energy, the electronic specific heat is enhanced
• But the phonon specific heat is like other metals. • Phonon dragg becomes negligible at low T
)(3
22
FBe NTkC επ=
αβe
Ldiffg C
CSS =/
A small Fermi energy with a large kF: The mass is large!
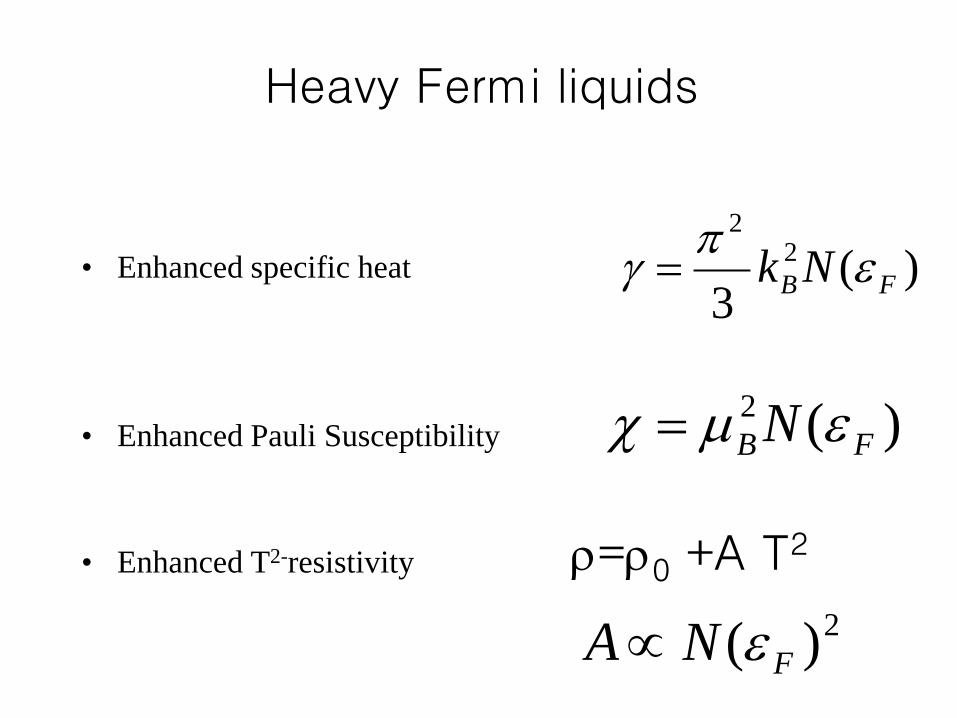
Heavy Fermi liquids
• Enhanced specific heat • Enhanced Pauli Susceptibility
• Enhanced T2-resistivity
)(3
22
FB Nk επγ =
)(2FB N εµχ =
ρ=ρ0 +A T2
2)( FNA ε∝
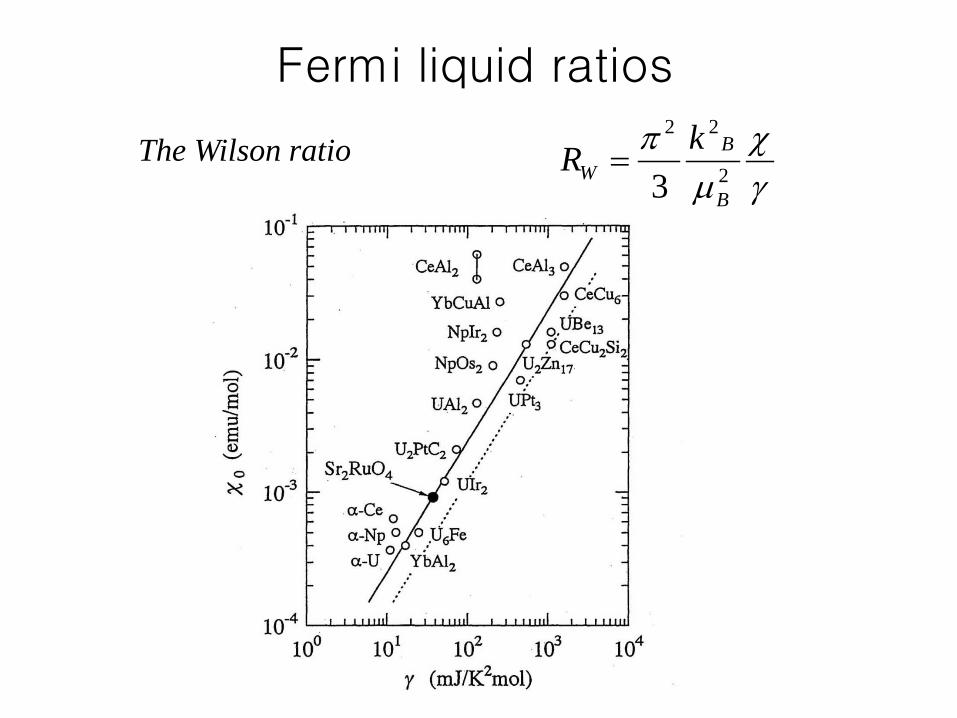
Fermi liquid ratios
The Wilson ratio γχ
µπ
2
22
3 B
BW
kR =
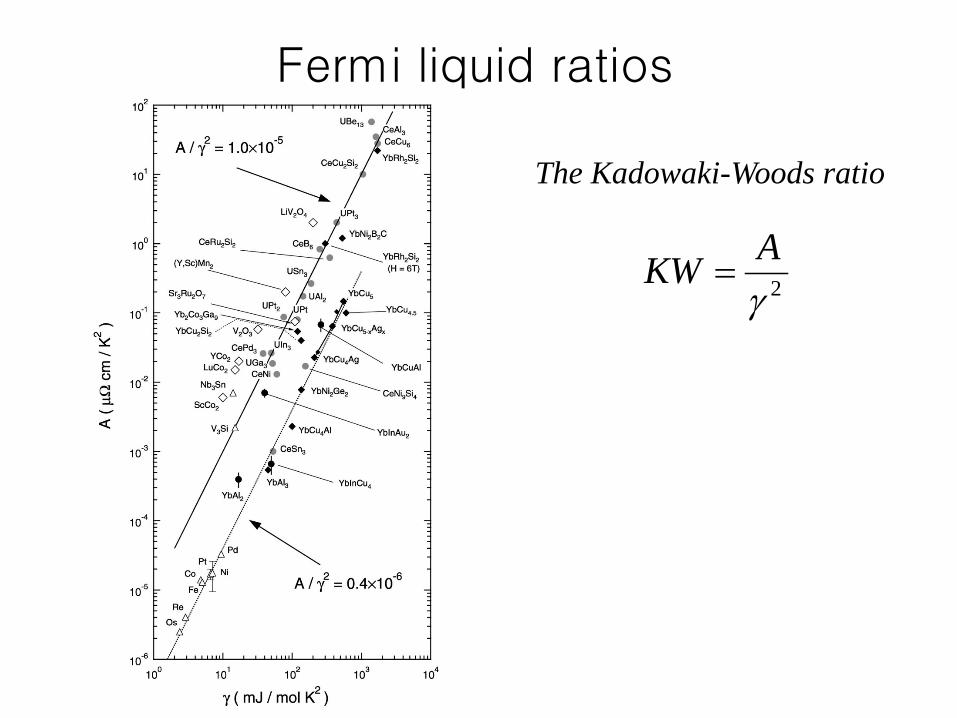
Fermi liquid ratios
The Kadowaki-Woods ratio
2γAKW =
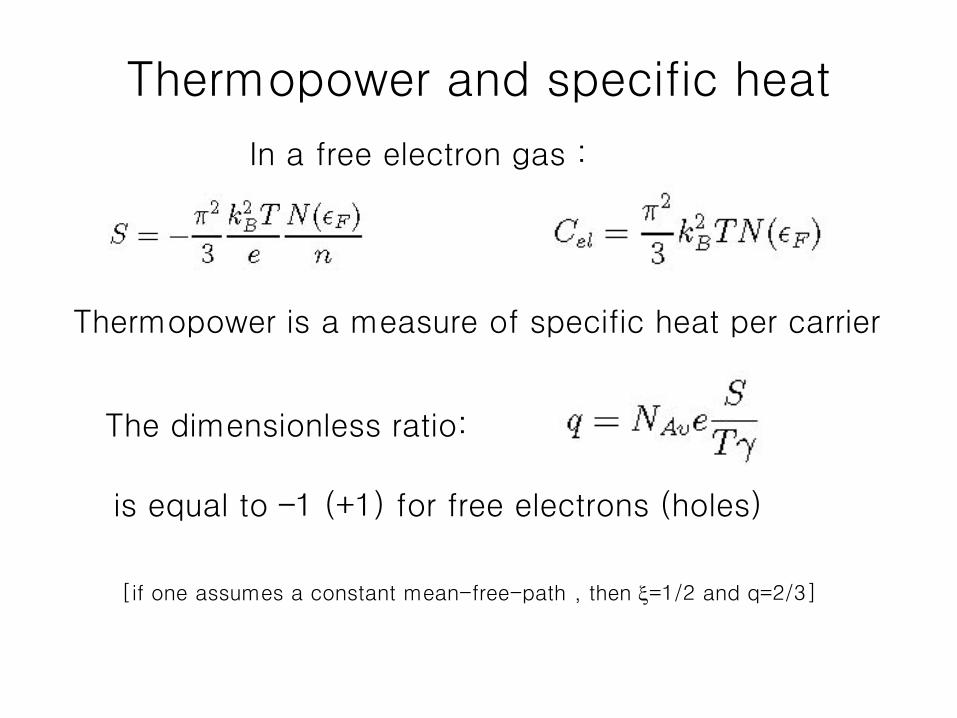
Thermopower and specific heat
In a free electron gas :
Thermopower is a measure of specific heat per carrier
The dimensionless ratio:
is equal to –1 (+1) for free electrons (holes)
[if one assumes a constant mean-free-path , then ξ=1/2 and q=2/3]
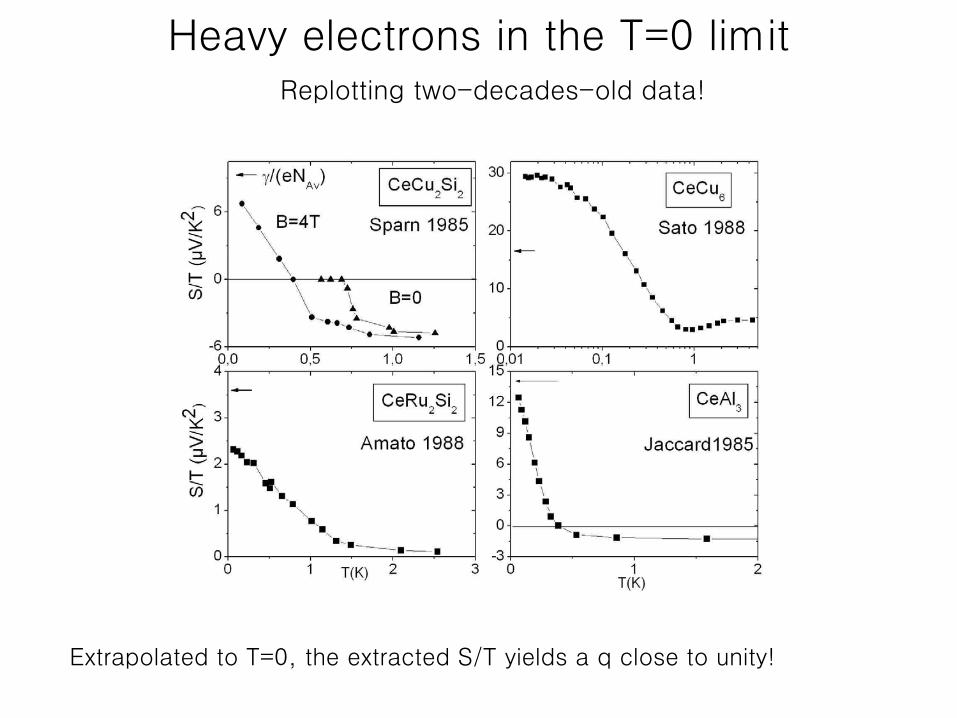
Heavy electrons in the T=0 limit Replotting two-decades-old data!
Extrapolated to T=0, the extracted S/T yields a q close to unity!
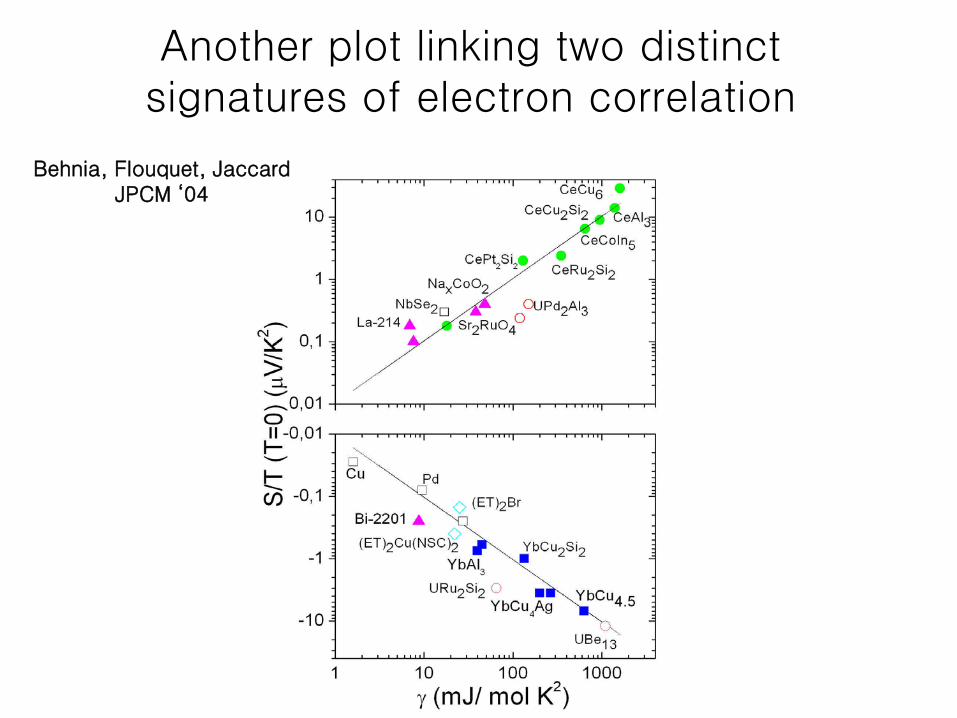
Another plot linking two distinct signatures of electron correlation
Behnia, Flouquet, Jaccard JPCM ‘04
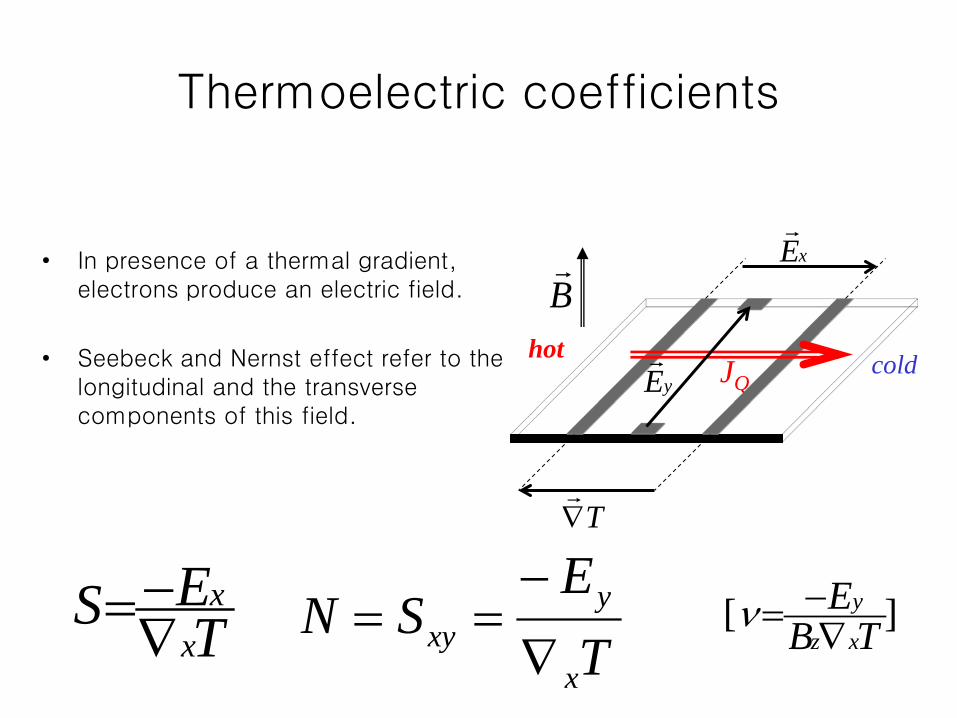
Thermoelectric coefficients
• In presence of a thermal gradient, electrons produce an electric field.
• Seebeck and Nernst effect refer to the longitudinal and the transverse components of this field.
JQ
T∇
xE
yE
B
TESx
x∇−=
TE
SNx
yxy ∇
−== ][ TB
Exz
y
∇−=ν
hot cold
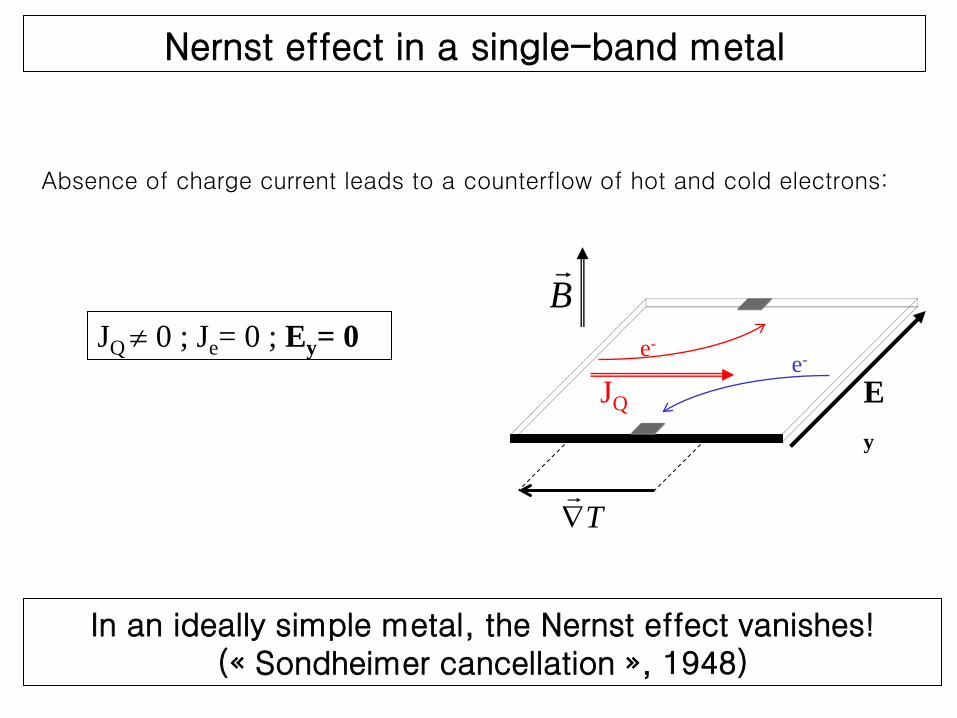
Nernst effect in a single-band metal
Absence of charge current leads to a counterflow of hot and cold electrons:
T∇
B
e- e-
JQ ≠ 0 ; Je= 0 ; Ey= 0
In an ideally simple metal, the Nernst effect vanishes! (« Sondheimer cancellation », 1948)
Ey
JQ
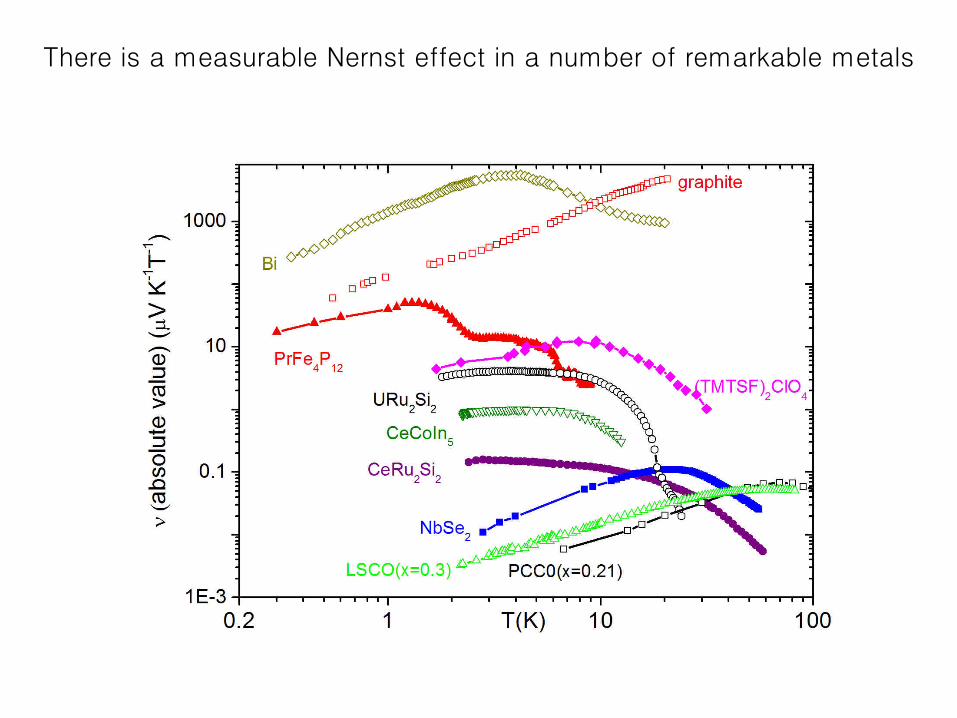
There is a measurable Nernst effect in a number of remarkable metals
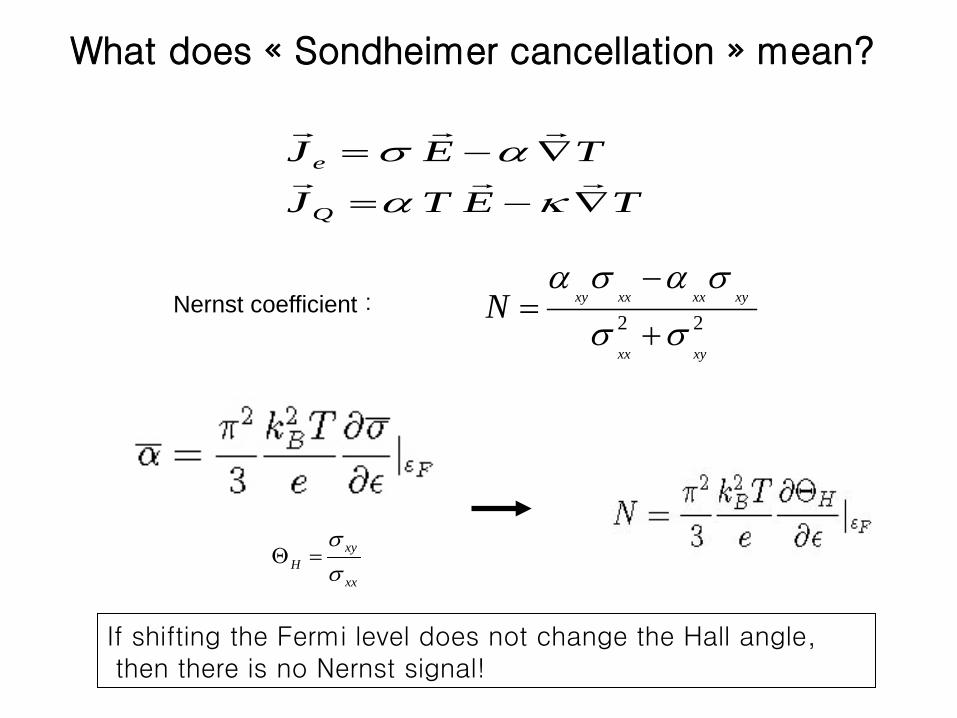
TETJ
TEJ
Q
e
∇−=
∇−=
καασ
22xyxx
xyxxxxxyNσσ
σασα
+
−= Nernst coefficient :
What does « Sondheimer cancellation » mean?
If shifting the Fermi level does not change the Hall angle, then there is no Nernst signal!
xx
xyH σ
σ=Θ
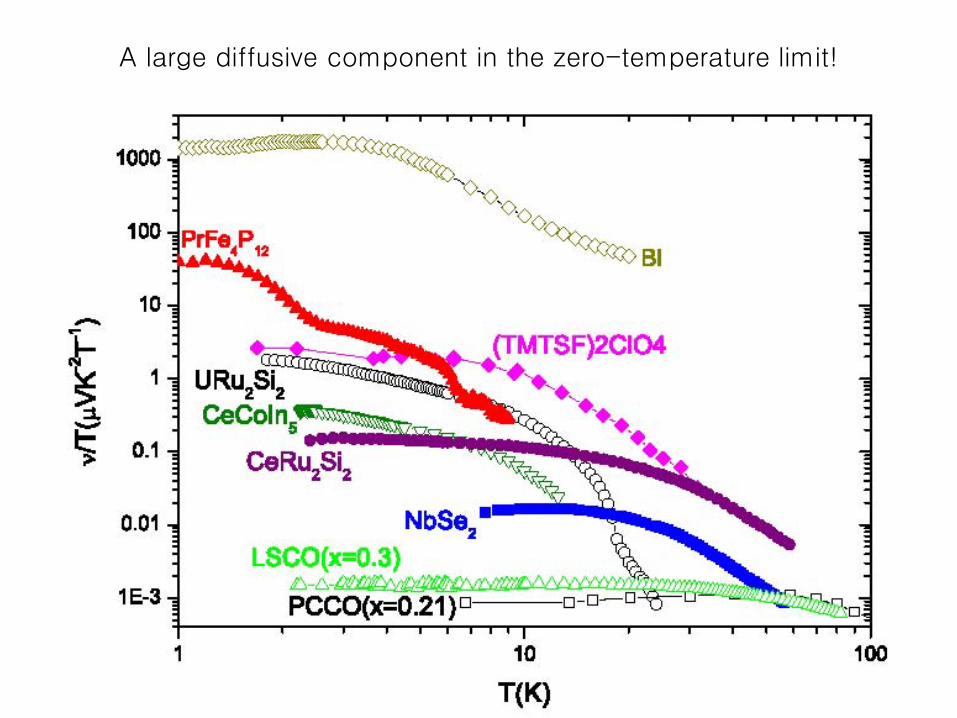
A large diffusive component in the zero-temperature limit!
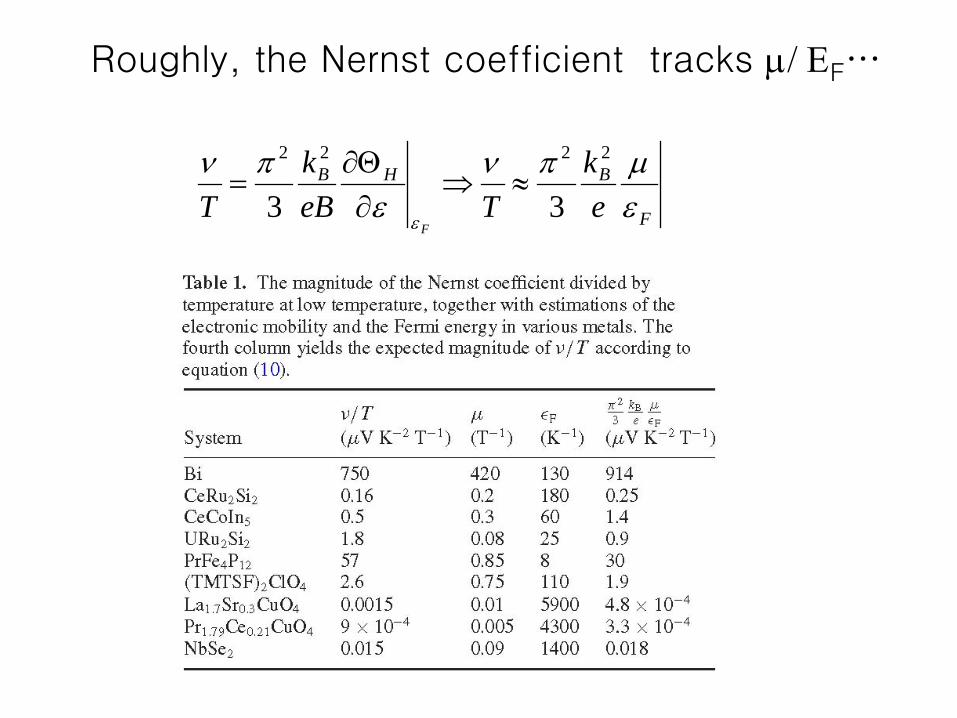
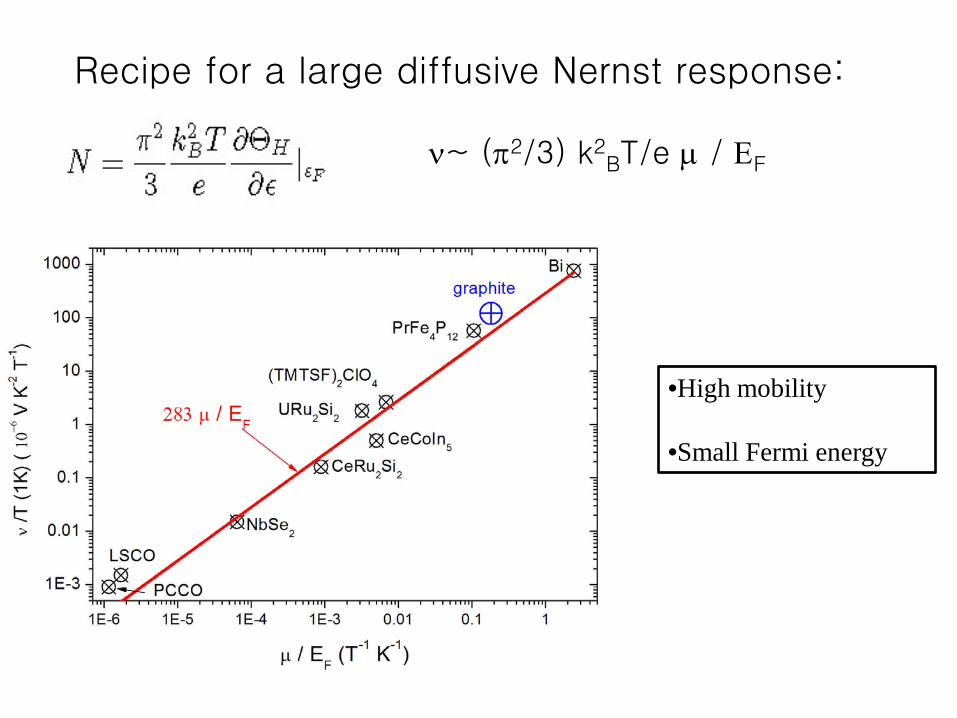
Roughly, the Nernst coefficient tracks µ/ ΕF…
F
BHB
ek
TeBk
TF
εµπν
επν
ε
2222
33≈⇒
∂Θ∂
=
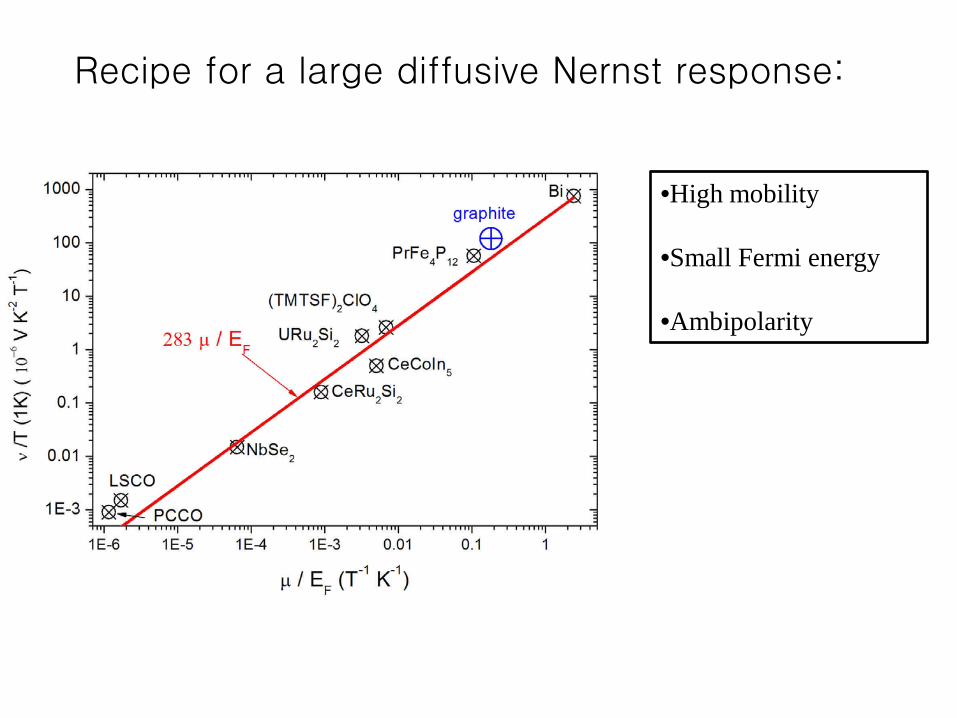
Recipe for a large diffusive Nernst response:
•High mobility
•Small Fermi energy
•Ambipolarity
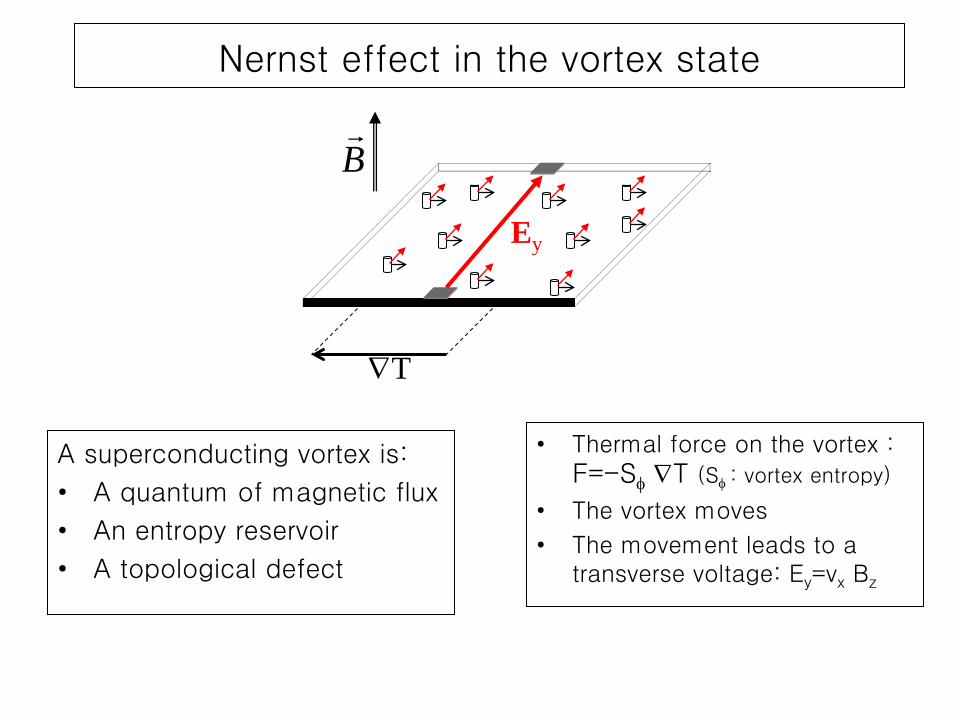
Nernst effect in the vortex state
• Thermal force on the vortex :
F=-Sφ ∇T (Sφ : vortex entropy)
• The vortex moves
• The movement leads to a transverse voltage: Ey=vx Bz
A superconducting vortex is:
• A quantum of magnetic flux • An entropy reservoir • A topological defect
B
Ey
∇T
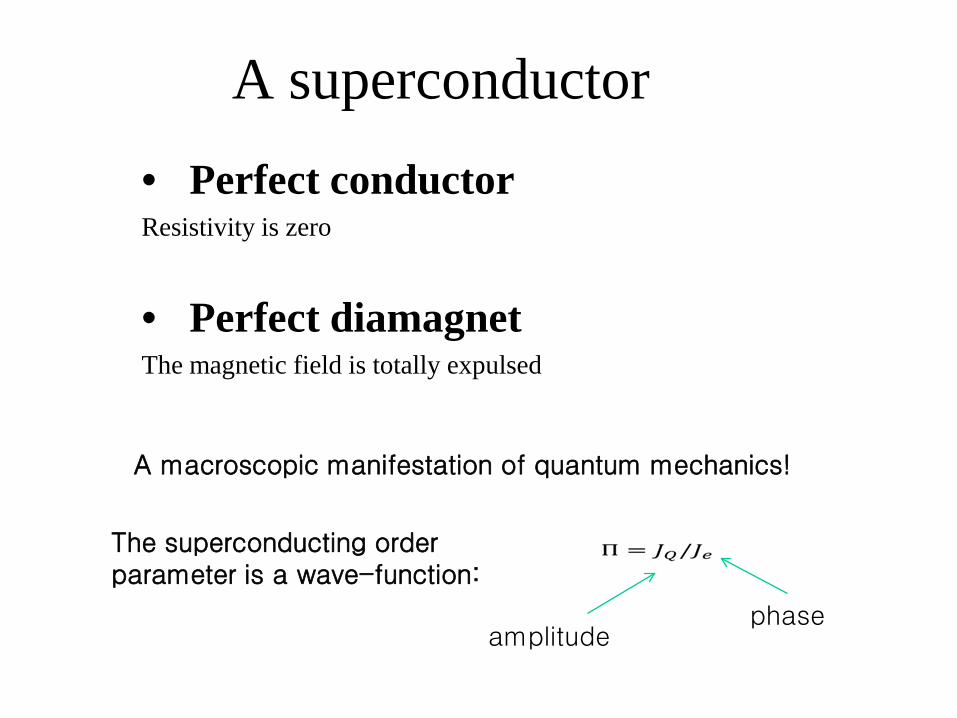
A superconductor • Perfect conductor Resistivity is zero
• Perfect diamagnet The magnetic field is totally expulsed
A macroscopic manifestation of quantum mechanics!
The superconducting order parameter is a wave-function:
amplitude phase
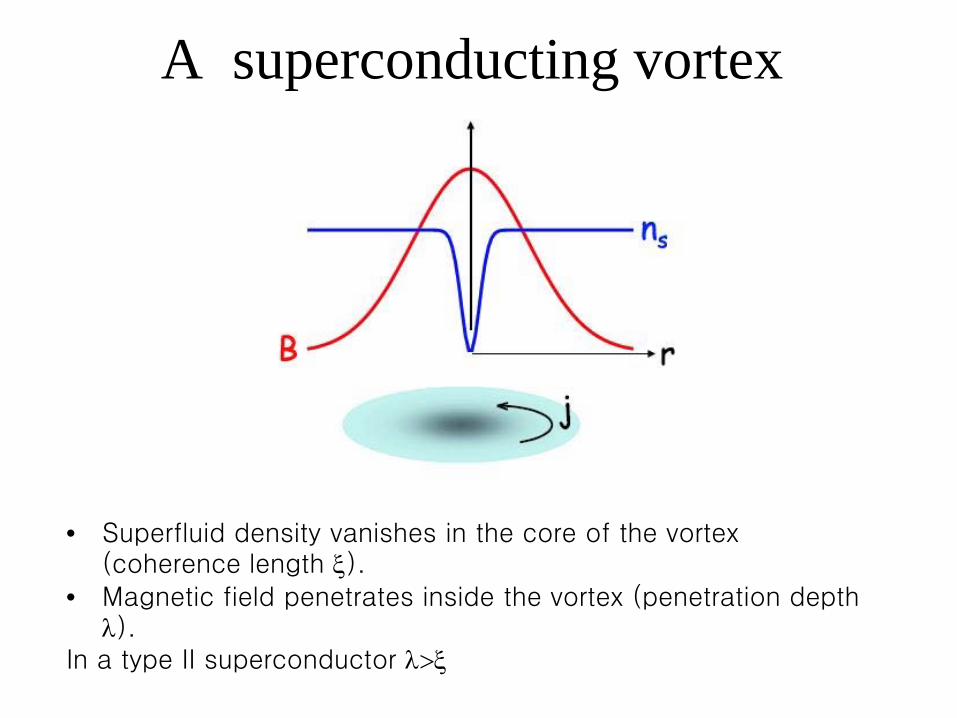
A superconducting vortex
• Superfluid density vanishes in the core of the vortex (coherence length ξ).
• Magnetic field penetrates inside the vortex (penetration depth λ).
In a type II superconductor λ>ξ
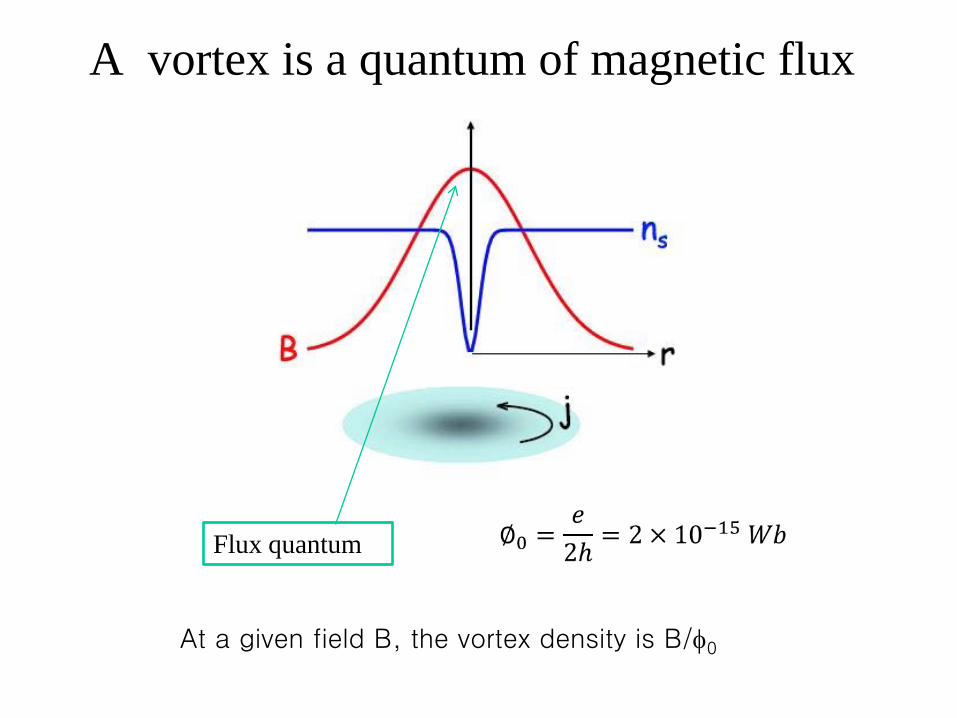
A vortex is a quantum of magnetic flux
Flux quantum
At a given field B, the vortex density is B/φ0
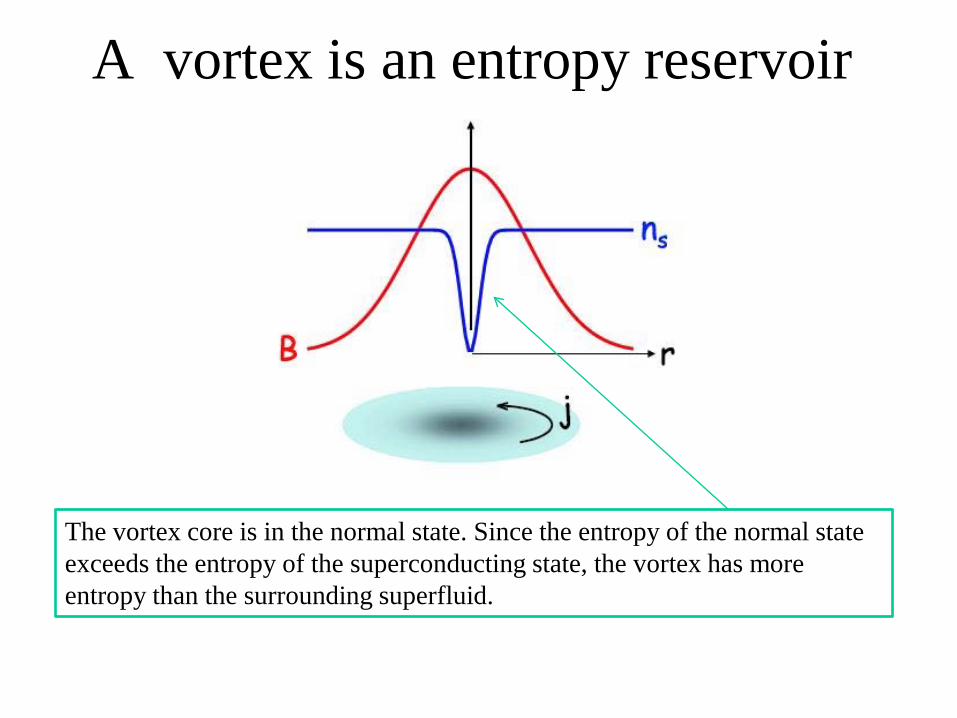
A vortex is an entropy reservoir
The vortex core is in the normal state. Since the entropy of the normal state exceeds the entropy of the superconducting state, the vortex has more entropy than the surrounding superfluid.
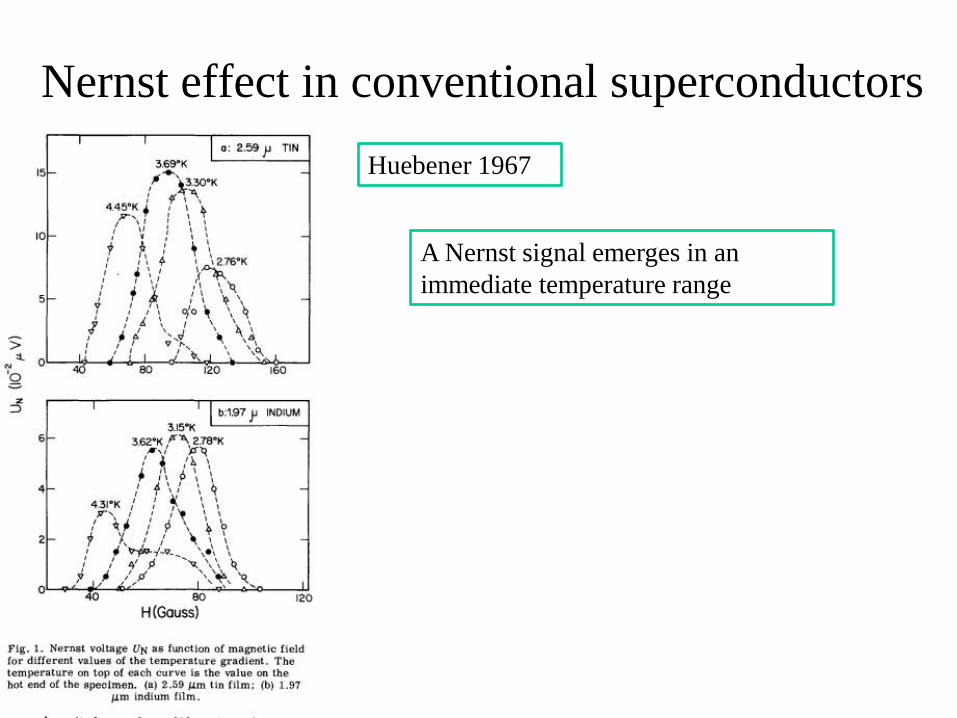
Nernst effect in conventional superconductors
A Nernst signal emerges in an immediate temperature range
Huebener 1967
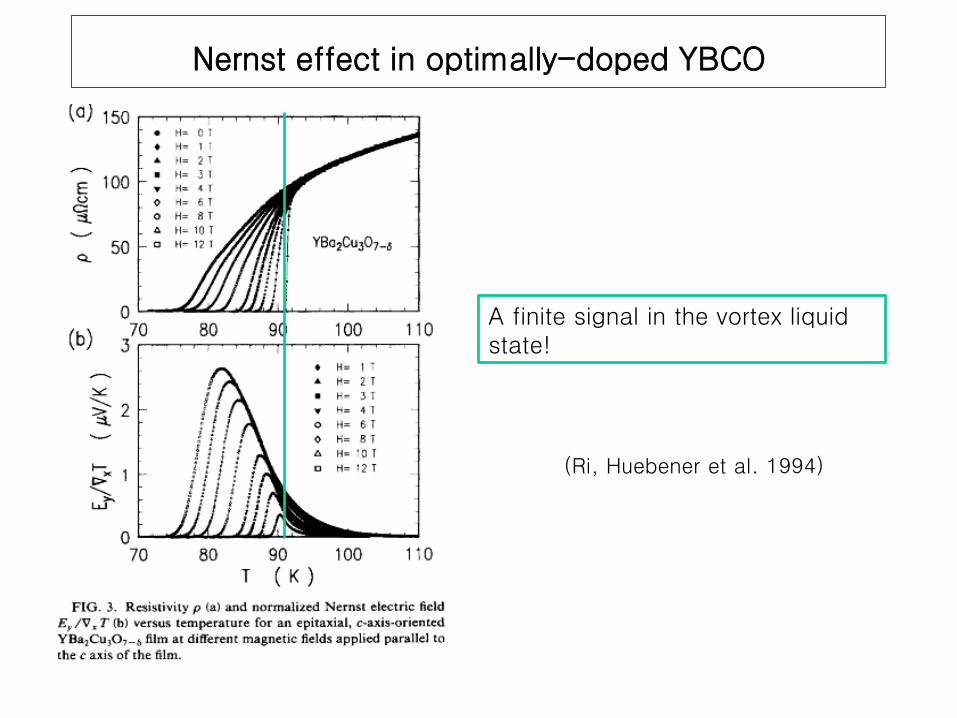
Nernst effect in optimally-doped YBCO
(Ri, Huebener et al. 1994)
A finite signal in the vortex liquid state!
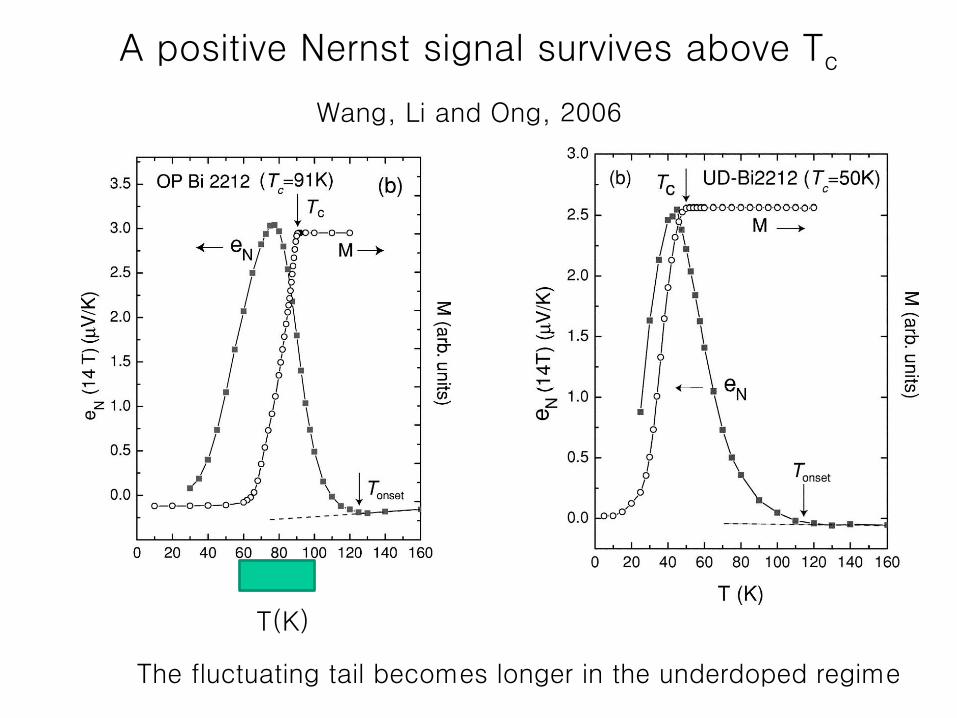
A positive Nernst signal survives above Tc
Wang, Li and Ong, 2006
T(K)
The fluctuating tail becomes longer in the underdoped regime
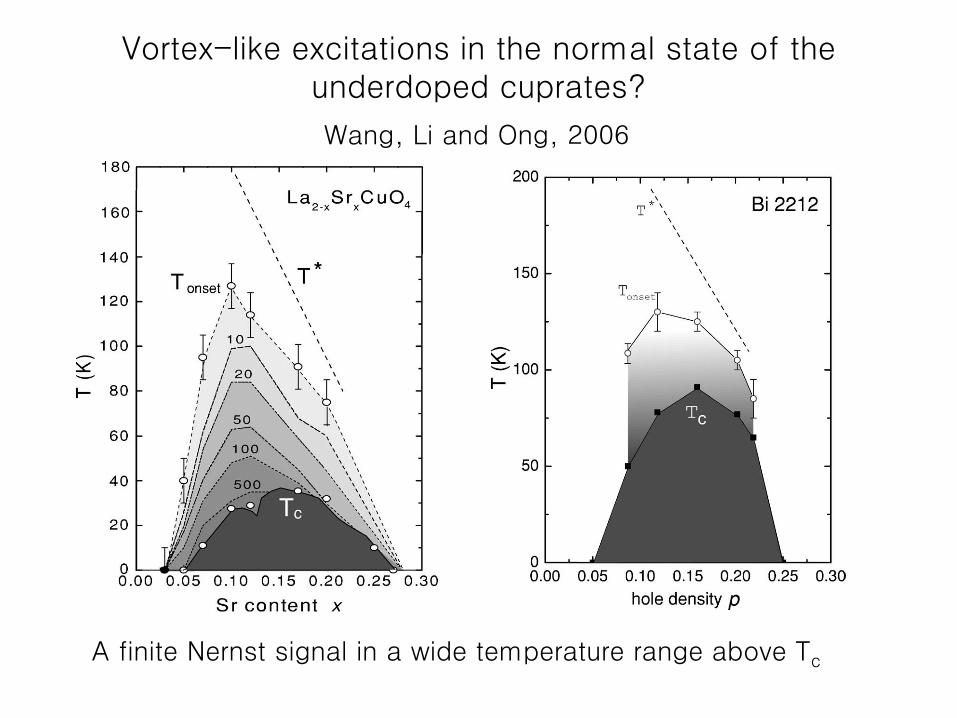
Vortex-like excitations in the normal state of the underdoped cuprates?
A finite Nernst signal in a wide temperature range above Tc
Wang, Li and Ong, 2006
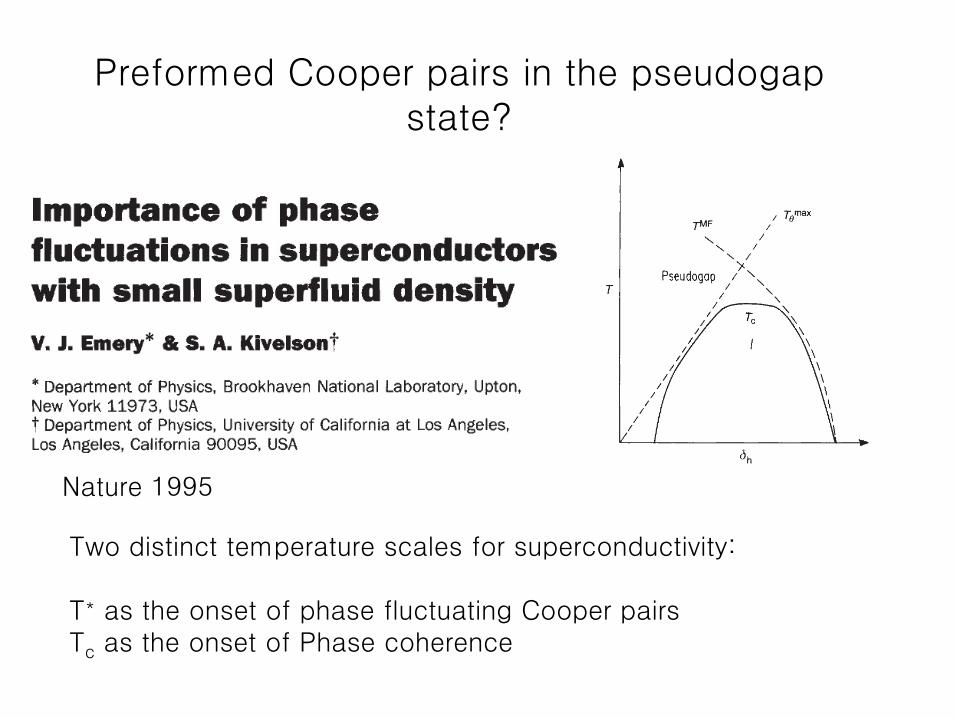
Preformed Cooper pairs in the pseudogap state?
Two distinct temperature scales for superconductivity: T* as the onset of phase fluctuating Cooper pairs Tc as the onset of Phase coherence
Nature 1995
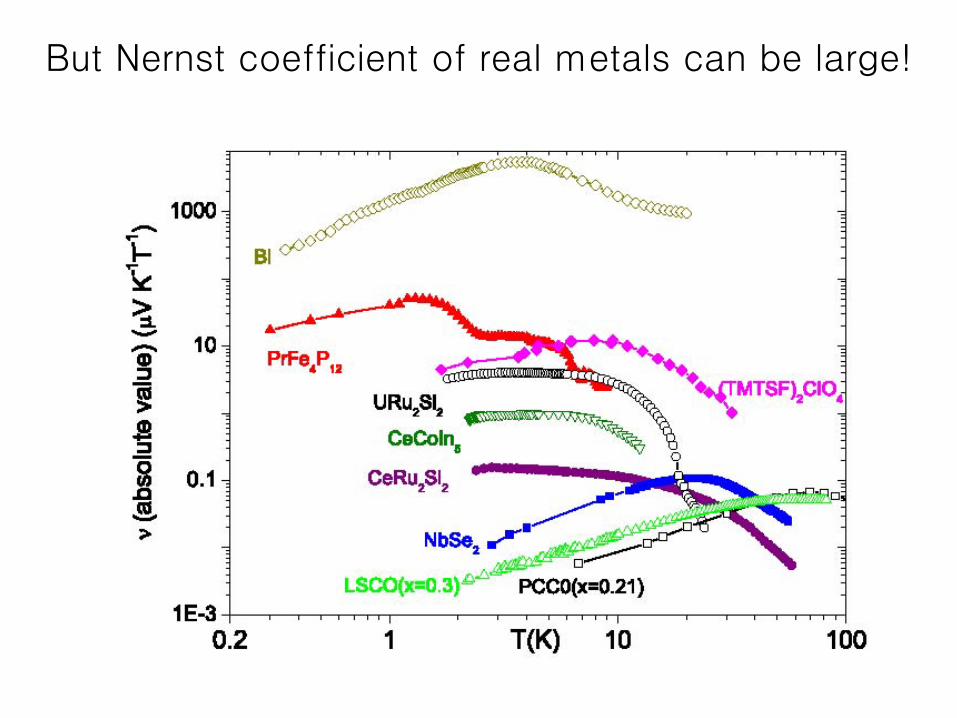
But Nernst coefficient of real metals can be large!
Recipe for a large diffusive Nernst response:
•High mobility
•Small Fermi energy
ν~ (π2/3) k2BT/e µ / ΕF
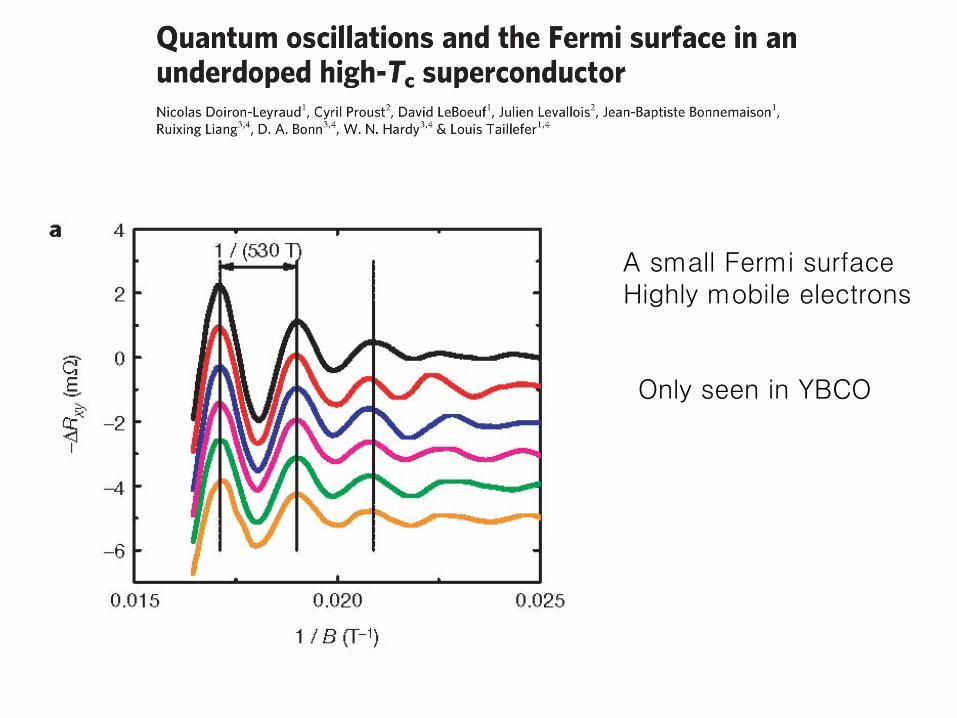
A small Fermi surface Highly mobile electrons
Only seen in YBCO
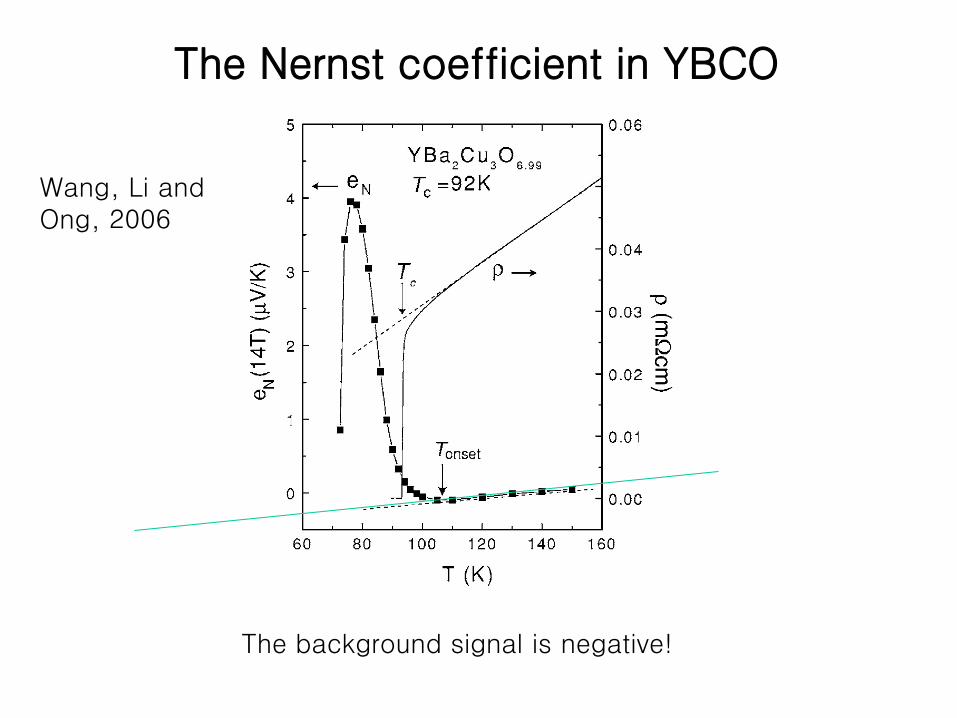
The Nernst coefficient in YBCO
The background signal is negative!
Wang, Li and Ong, 2006
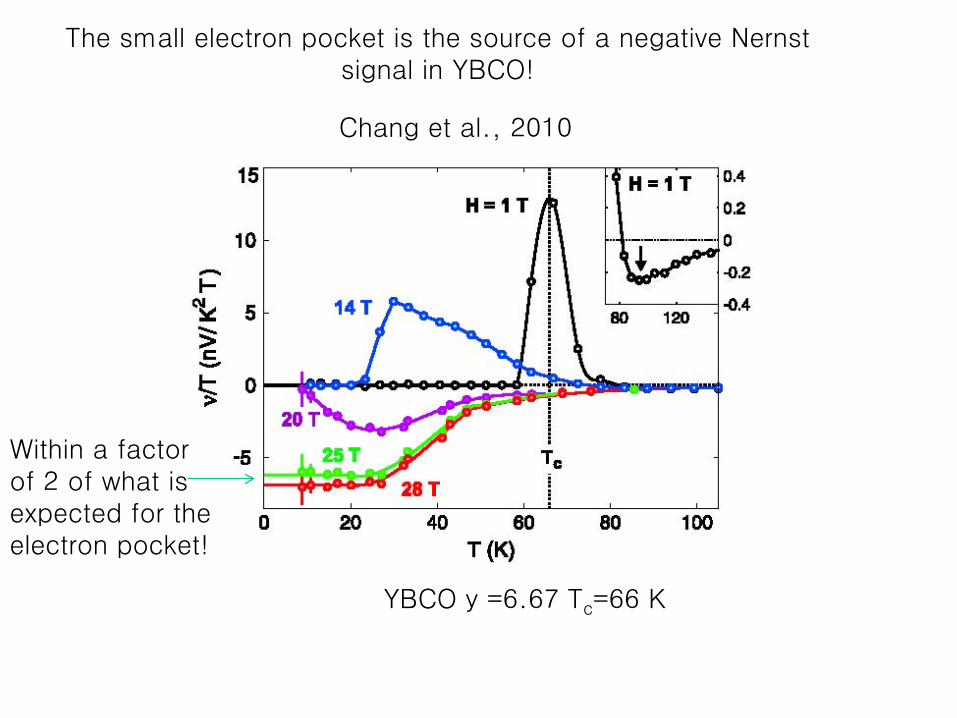
The small electron pocket is the source of a negative Nernst signal in YBCO!
Within a factor of 2 of what is expected for the electron pocket!
Chang et al., 2010
YBCO y =6.67 Tc=66 K
The Nernst effect caused by Gaussian fluctuations of the
superconducting order parameter
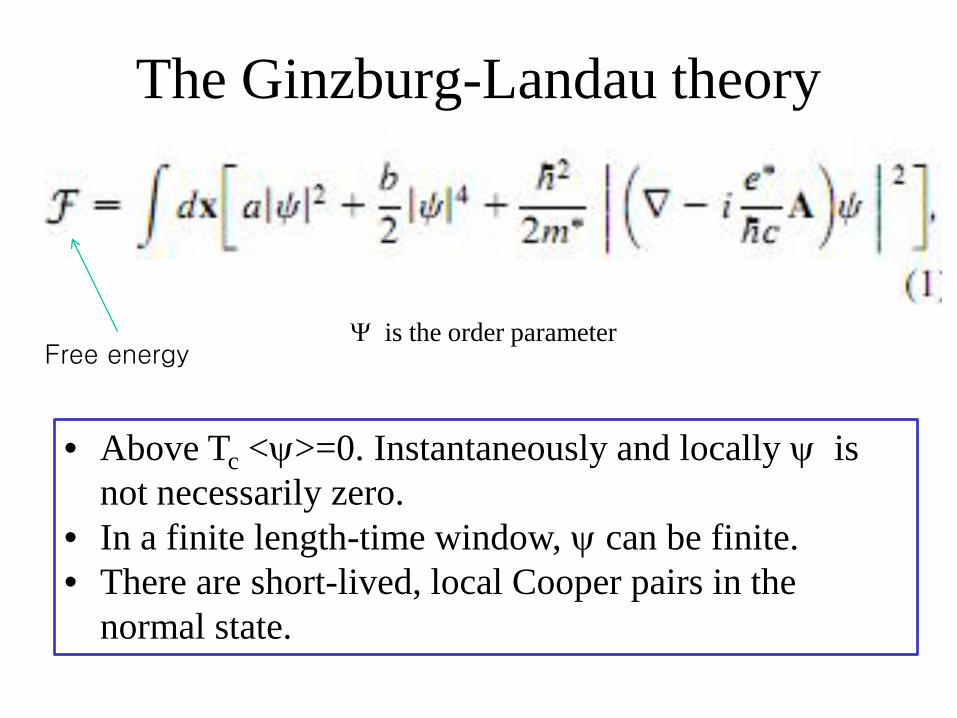
The Ginzburg-Landau theory
Ψ is the order parameter Free energy
• Above Tc <ψ>=0. Instantaneously and locally ψ is not necessarily zero.
• In a finite length-time window, ψ can be finite. • There are short-lived, local Cooper pairs in the
normal state.
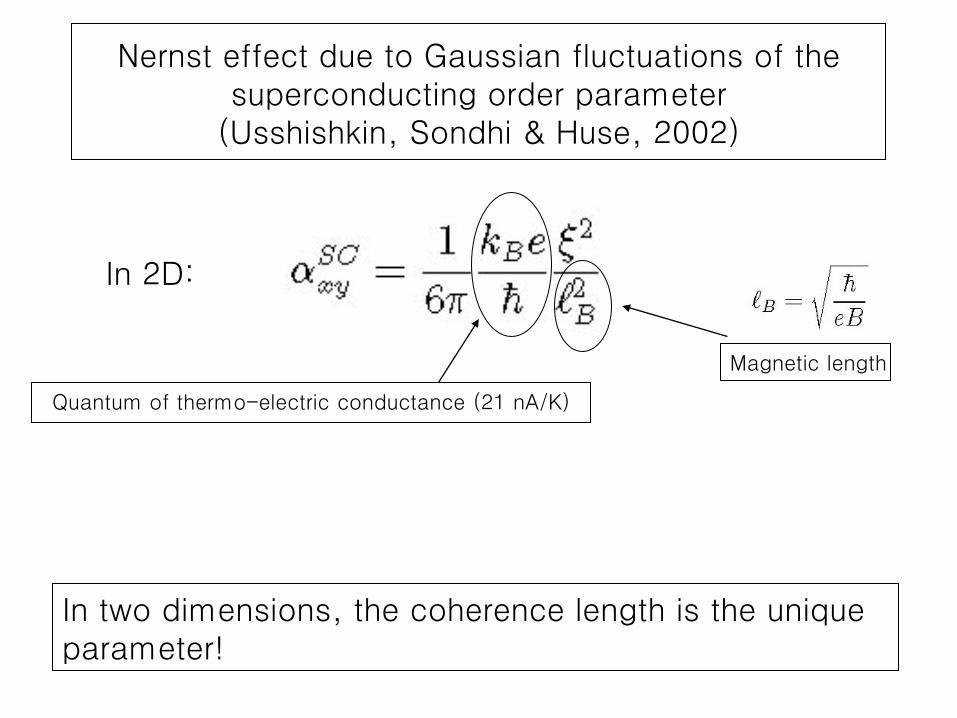
Nernst effect due to Gaussian fluctuations of the superconducting order parameter
(Usshishkin, Sondhi & Huse, 2002)
Quantum of thermo-electric conductance (21 nA/K)
In 2D:
In two dimensions, the coherence length is the unique parameter!
Magnetic length
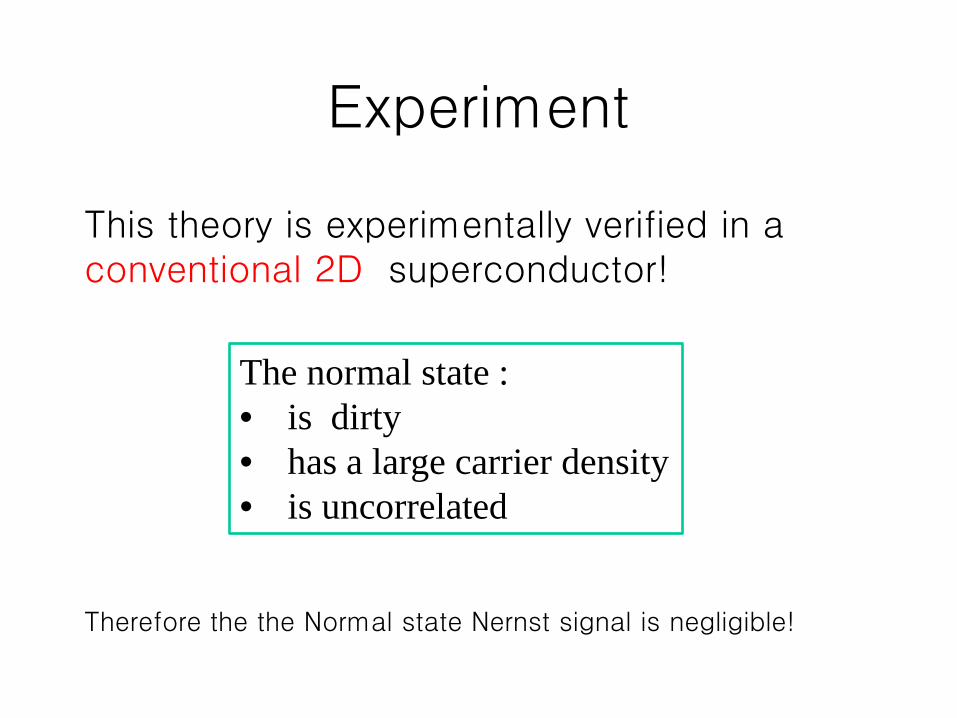
Experiment
This theory is experimentally verified in a conventional 2D superconductor!
The normal state : • is dirty • has a large carrier density • is uncorrelated
Therefore the the Normal state Nernst signal is negligible!
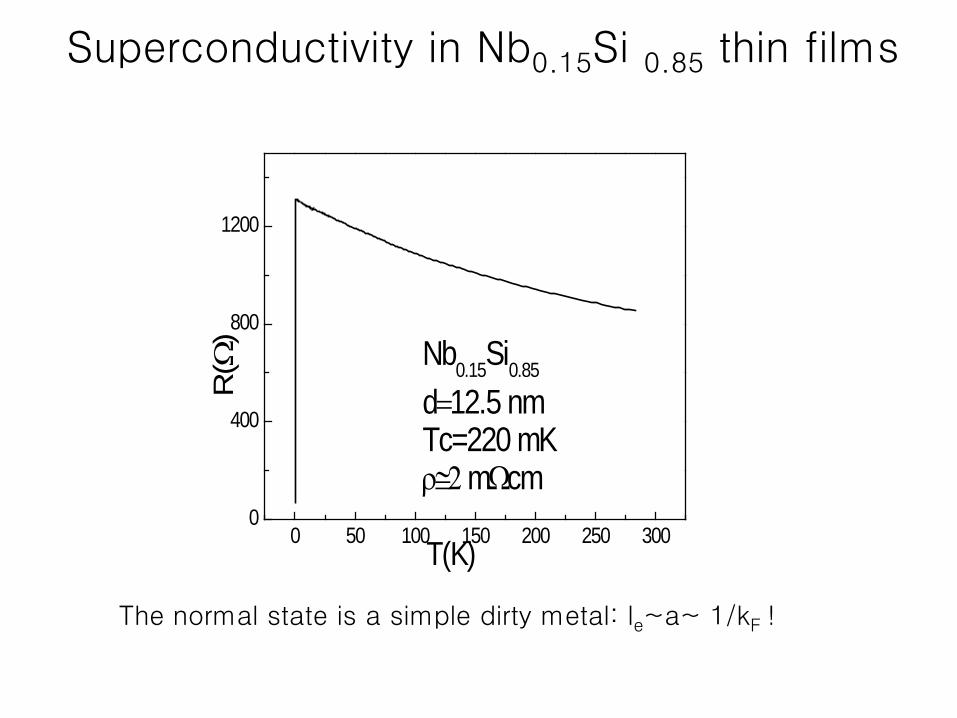
Superconductivity in Nb0.15Si 0.85 thin films
The normal state is a simple dirty metal: le~a~ 1/kF !
0 50 100 150 200 250 3000
400
800
1200
R(Ω
)
T(K)
Nb0.15Si0.85
d=12.5 nmTc=220 mKρ≅2 mΩcm
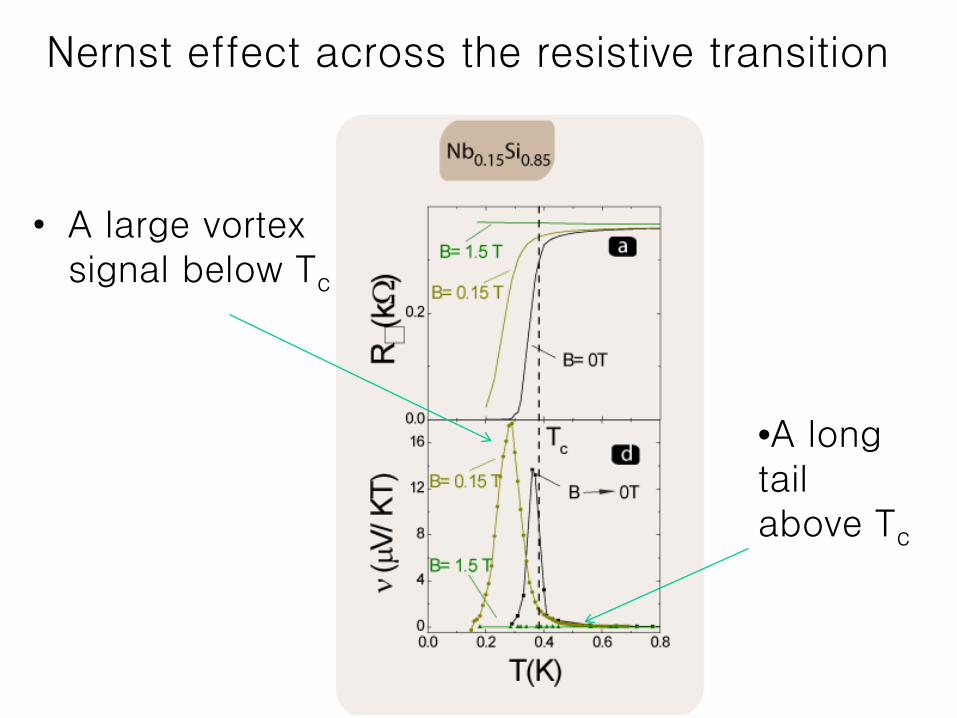
Nernst effect across the resistive transition
• A large vortex signal below Tc
•A long tail above Tc
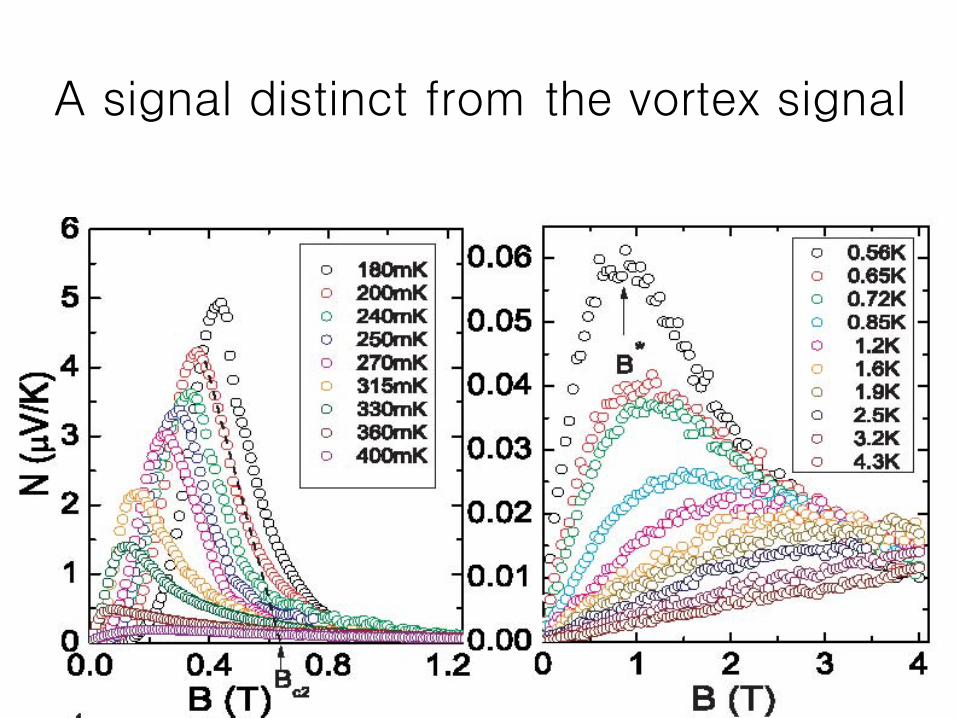
A signal distinct from the vortex signal
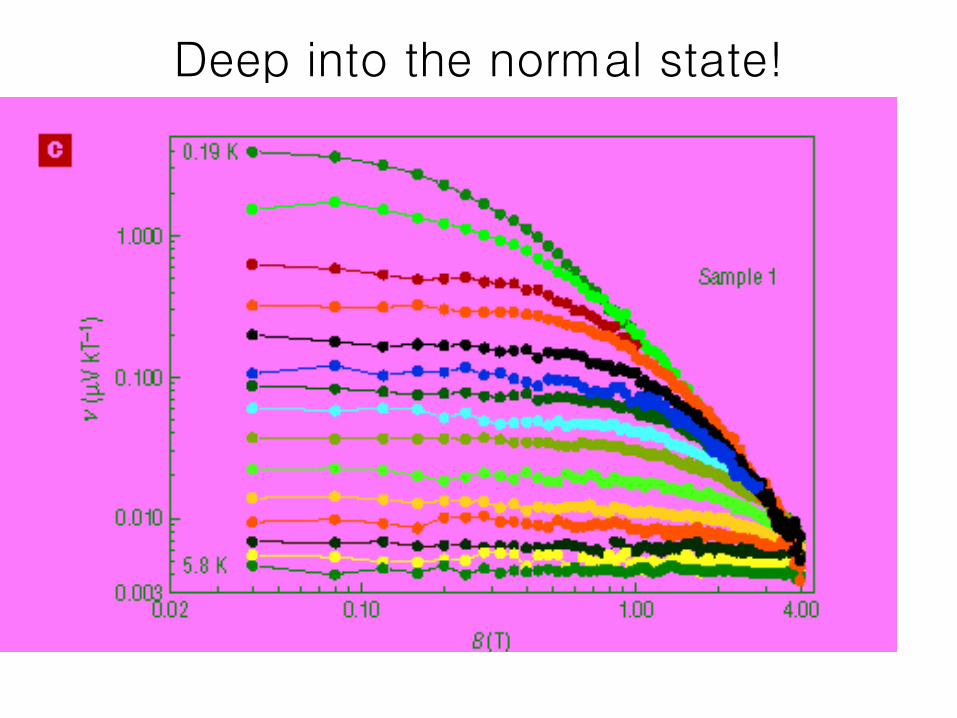
Deep into the normal state!
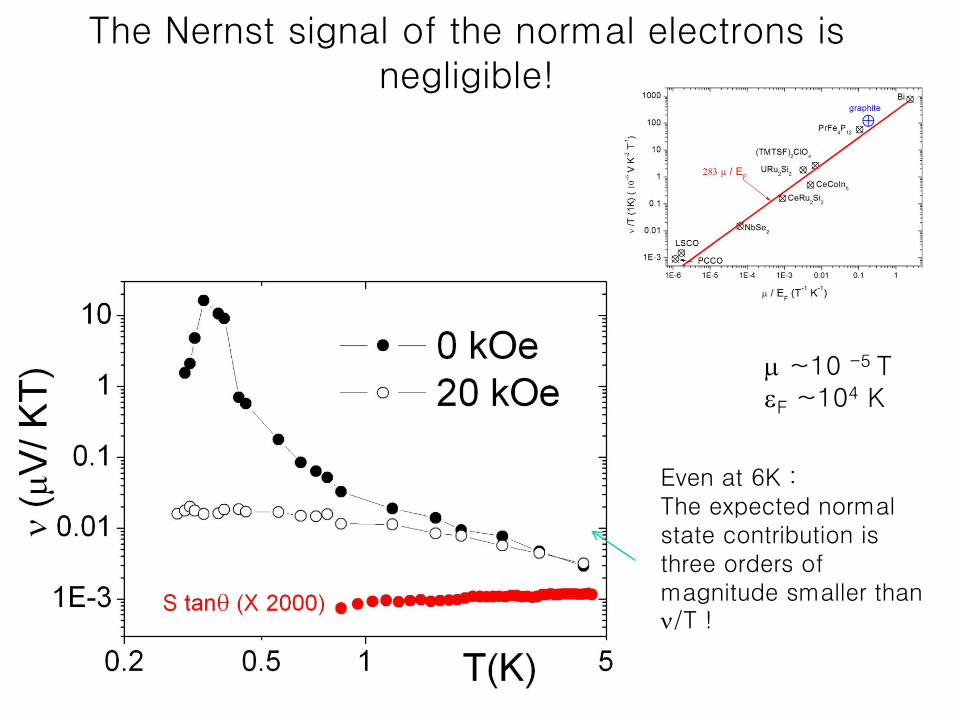
The Nernst signal of the normal electrons is negligible!
Even at 6K : The expected normal state contribution is three orders of magnitude smaller than ν/T !
µ ~10 -5 T εF ~104 K
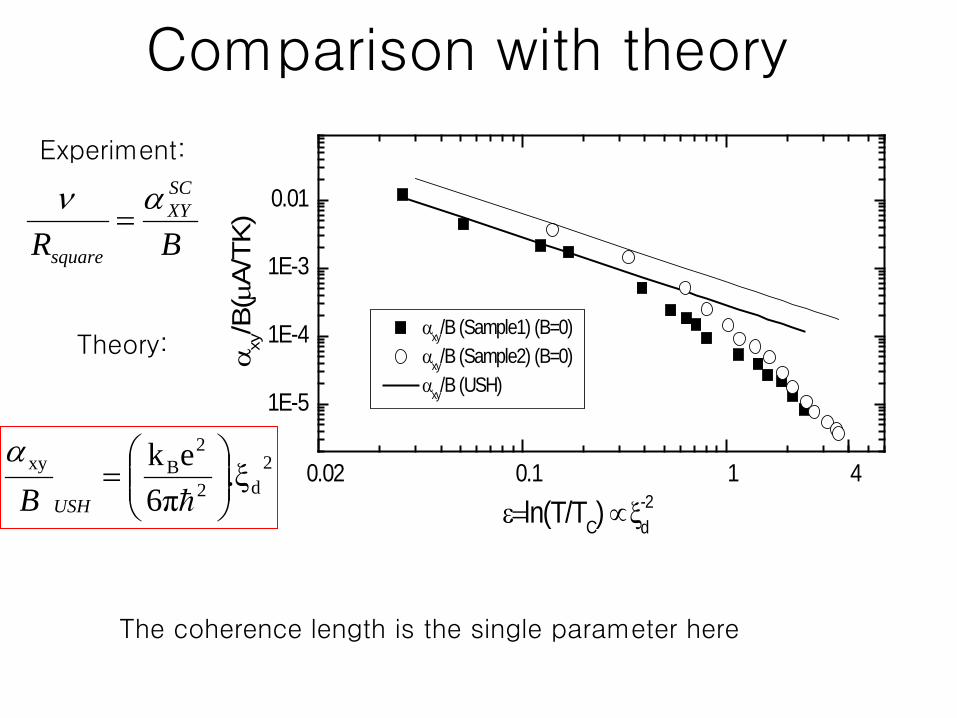
Comparison with theory
0.02 0.1 1 4
1E-5
1E-4
1E-3
0.01
αxy/B (Sample1) (B=0) αxy/B (Sample2) (B=0) αxy/B (USH)
α xy/B
(µA
/TK
)
ε=ln(T/TC) ∝ ξ-2d
2d2
2Bxy .ξ
6πek
=
USHBα
BR
SCXY
square
αν=
Experiment:
Theory:
The coherence length is the single parameter here
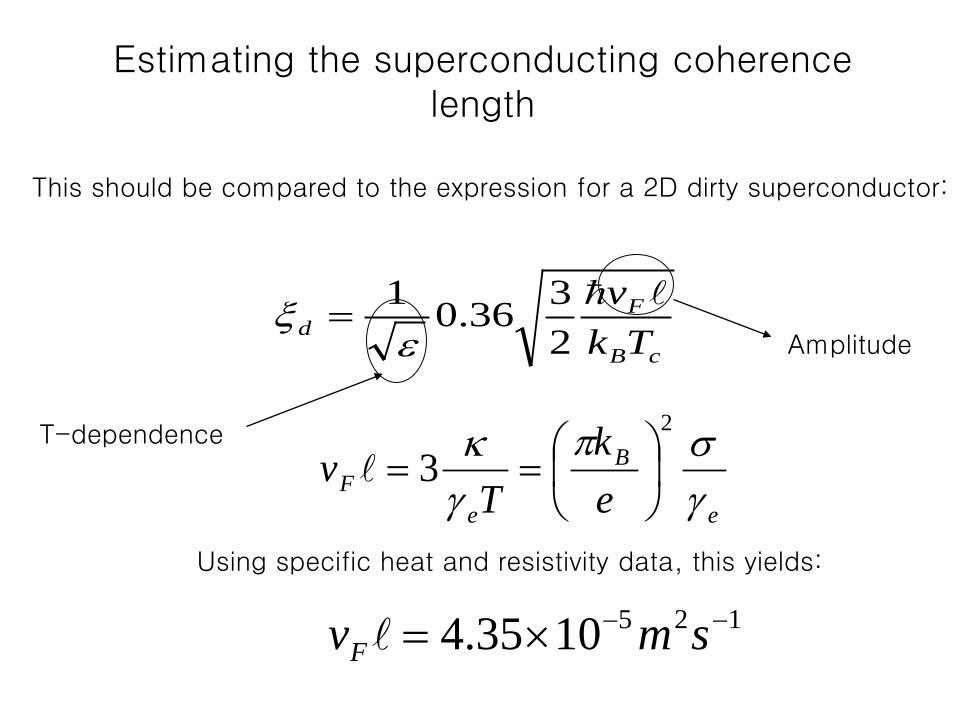
Estimating the superconducting coherence length
cB
Fd Tk
v
2336.01
εξ =
This should be compared to the expression for a 2D dirty superconductor:
T-dependence
Amplitude
e
B
eF e
kT
vγσπ
γκ 2
3
==
Using specific heat and resistivity data, this yields:
1251035.4 −−×= smvF
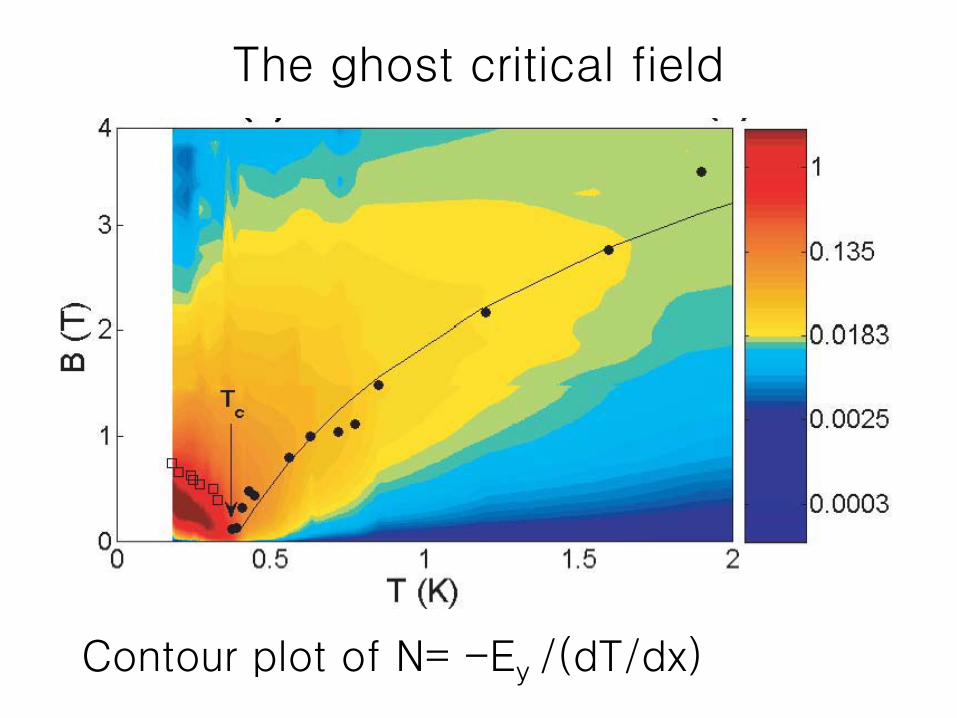
The ghost critical field
Contour plot of N= -Ey /(dT/dx)
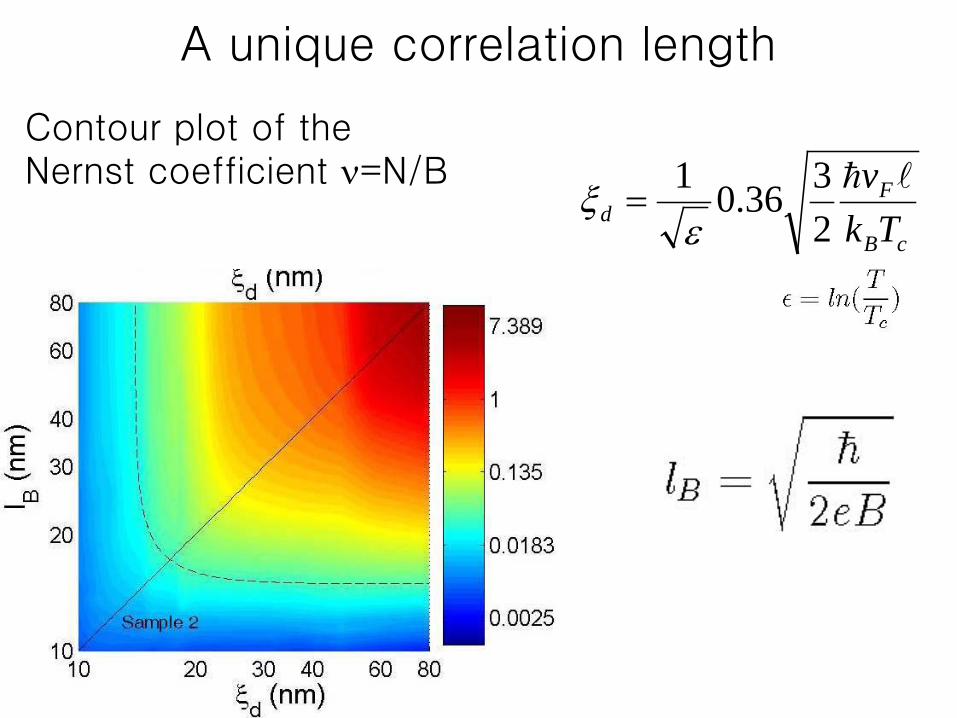
A unique correlation length
cB
Fd Tk
v
2336.01
εξ =
Contour plot of the Nernst coefficient ν=N/B
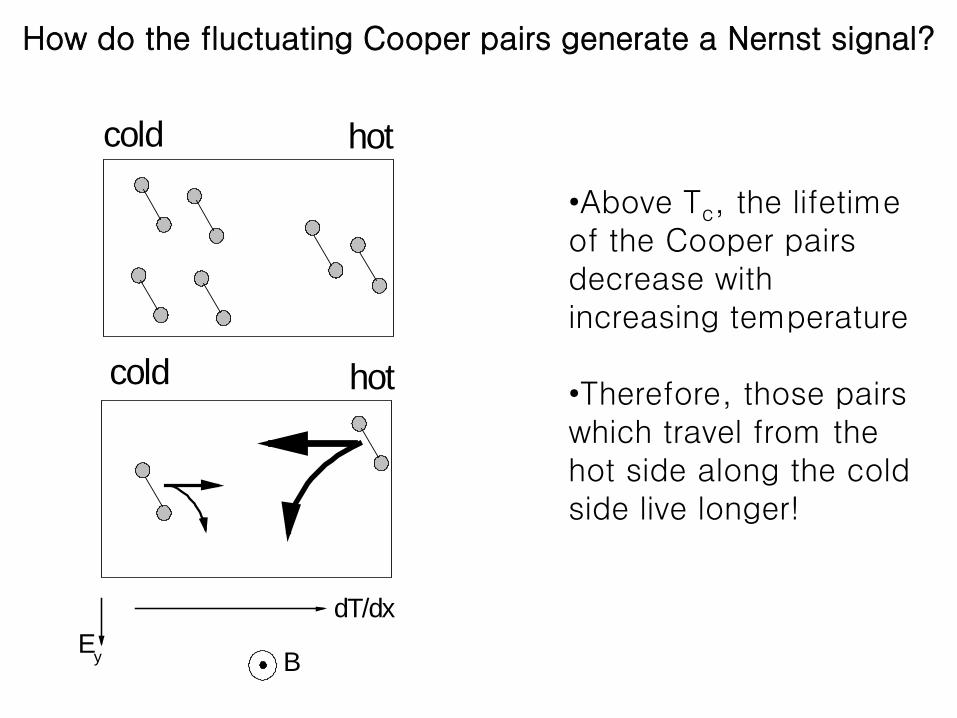
How do the fluctuating Cooper pairs generate a Nernst signal?
cold hot
cold hot
dT/dxEy B
•Above Tc, the lifetime of the Cooper pairs decrease with increasing temperature
•Therefore, those pairs which travel from the hot side along the cold side live longer!