air7
17
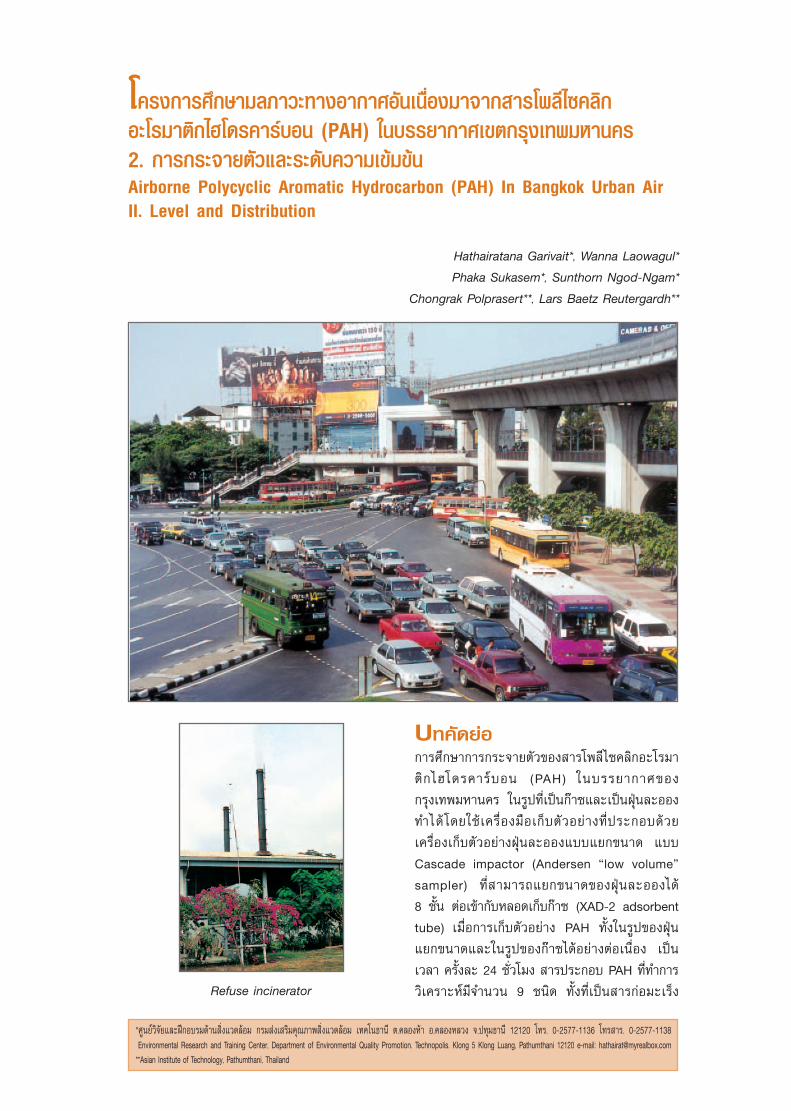
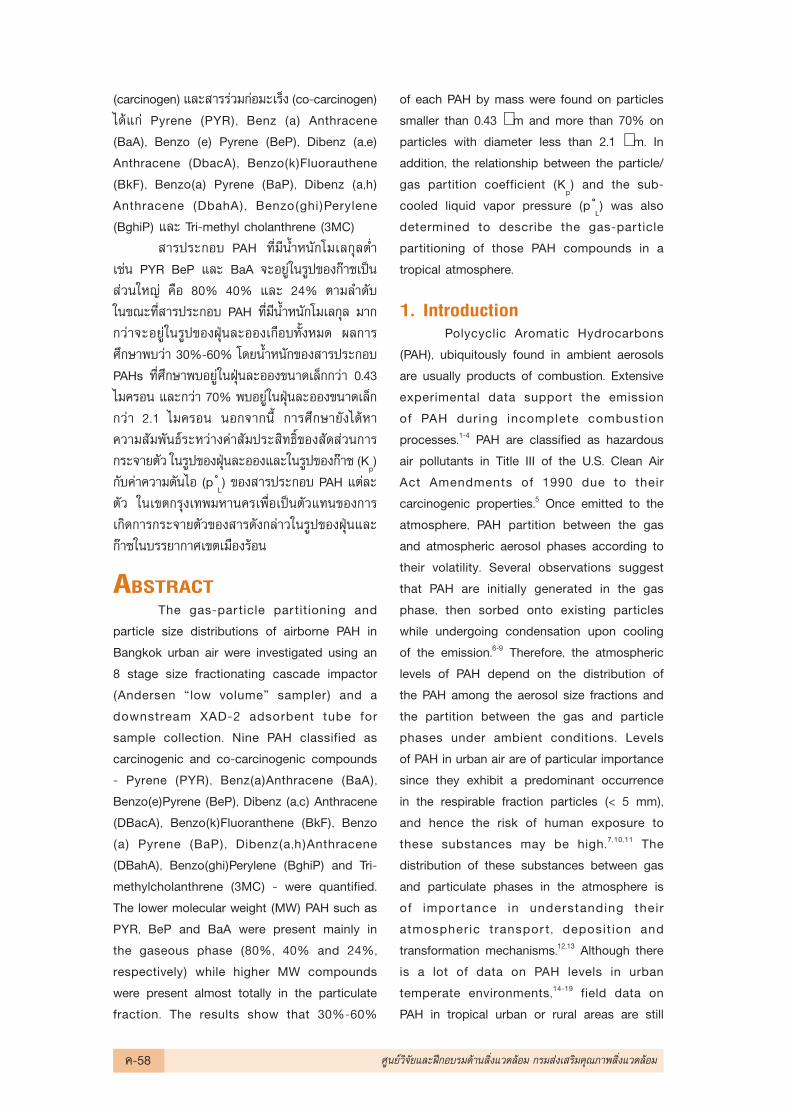
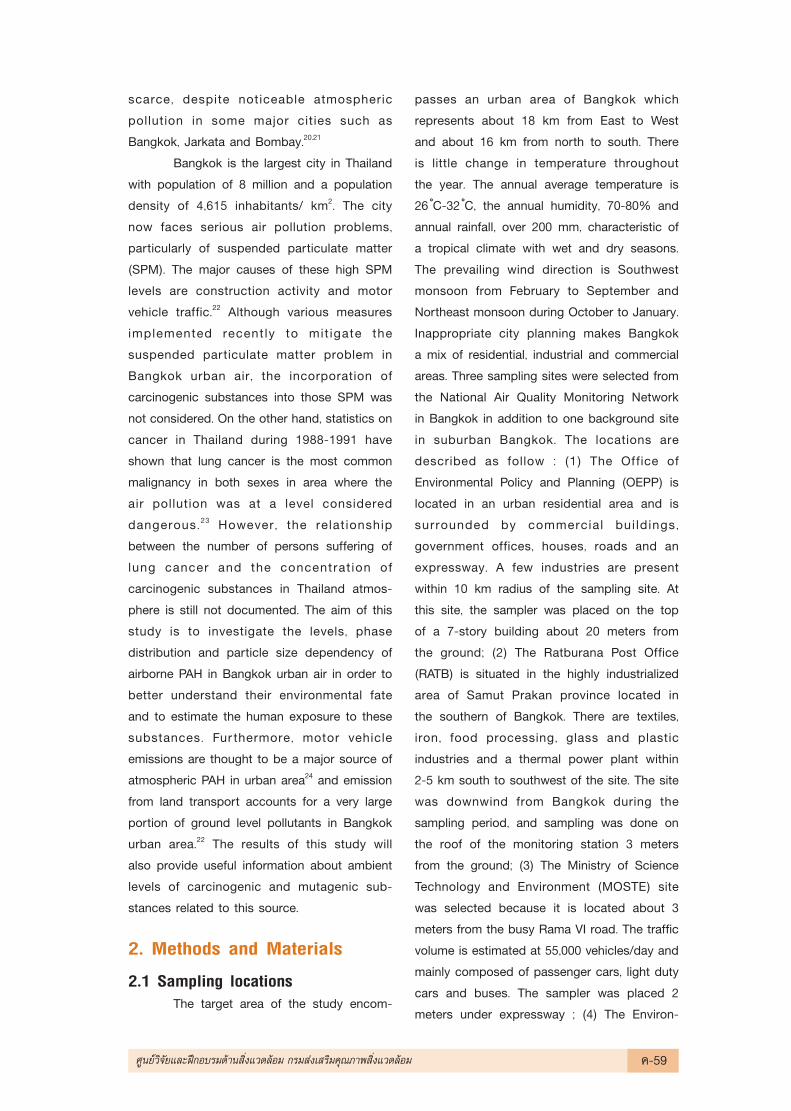
‚§√ß°“√»÷°…“¡≈¿“«–∑“ßÕ“°“»Õ—π‡π◊ËÕß¡“®“° “√‚æ≈’‰´§≈‘° Õ–‚√¡“µ‘°‰Œ‚¥√§“√å∫Õπ (PAH) „π∫√√¬“°“»‡¢µ°√ÿ߇∑æ¡À“π§√ 2. °“√°√–®“¬µ—«·≈–√–¥—∫§«“¡‡¢â¡¢âπ Airborne Polycyclic Aromatic Hydrocarbon (PAH) In Bangkok Urban Air II. Level and Distribution Hathairatana Garivait*, Wanna Laowagul* Phaka Sukasem*, Sunthorn Ngod-Ngam* Chongrak Polprasert**, Lars Baetz Reutergardh** ∫∑§—¥¬àÕ °“√»÷°…“°“√°√–®“¬µ—«¢Õß “√‚æ≈’‰´§≈‘°Õ–‚√¡“ µ‘°‰Œ‚¥√§“√å∫Õπ (PAH) „π∫√√¬“°“»¢Õß °√ÿ߇∑æ¡À“π§√ „π√Ÿª∑’ˇªìπ°ä“´·≈–‡ªìπΩÿÉπ≈–ÕÕß ∑”‰¥â‚¥¬„™â‡§√◊ËÕß¡◊Õ‡°Á∫µ—«Õ¬à“ß∑’˪√–°Õ∫¥â«¬ ‡§√◊ËÕ߇°Á∫µ—«Õ¬à“ßΩÿÉπ≈–ÕÕß·∫∫·¬°¢π“¥ ·∫∫ Cascade impactor (Andersen çlow volumeé sampler) ∑’Ë “¡“√∂·¬°¢π“¥¢ÕßΩÿÉπ≈–ÕÕ߉¥â 8 ™—Èπ µàÕ‡¢â“°—∫À≈Õ¥‡°Á∫°ä“´ (XAD-2 adsorbent tube) ‡¡◊ËÕ°“√‡°Á∫µ—«Õ¬à“ß PAH ∑—Èß„π√Ÿª¢ÕßΩÿÉπ ·¬°¢π“¥·≈–„π√Ÿª¢Õß°ä“´‰¥âÕ¬à“ßµàÕ‡π◊ËÕß ‡ªì𠇫≈“ §√—Èß≈– 24 ™—Ë«‚¡ß “√ª√–°Õ∫ PAH ∑’Ë∑”°“√ «‘‡§√“–Àå¡’®”π«π 9 ™π‘¥ ∑—Èß∑’ˇªìπ “√°àÕ¡–‡√Áß Refuse incinerator *»Ÿπ¬å«‘®—¬·≈–Ωñ°Õ∫√¡¥â“π ‘Ëß·«¥≈âÕ¡ °√¡ à߇ √‘¡§ÿ≥¿“æ ‘Ëß·«¥≈âÕ¡ ‡∑§‚π∏“π’ µ.§≈ÕßÀâ“ Õ.§≈ÕßÀ≈«ß ®.ª∑ÿ¡∏“π’ 12120 ‚∑√. 0-2577-1136 ‚∑√ “√. 0-2577-1138 Environmental Research and Training Center, Department of Environmental Quality Promotion. Technopolis. Klong 5 Klong Luang, Pathumthani 12120 e-mail: [email protected] **Asian Institute of Technology, Pathumthani, Thailand
-
Upload
department-of-environmental-quality-promotion-thailand -
Category
Documents
-
view
218 -
download
0
description
Õ–‚√¡“µ‘ ° ‰Œ‚¥√§“√å ∫ Õπ (PAH) „π∫√√¬“°“»‡¢µ°√ÿ ß ‡∑æ¡À“π§√ 2. °“√°√–®“¬µ— « ·≈–√–¥— ∫ §«“¡‡¢â ¡ ¢â π ‚ §√ß°“√»÷ ° …“¡≈¿“«–∑“ßÕ“°“»Õ— π ‡π◊ Ë Õ ß¡“®“° “√‚æ≈’ ‰ ´§≈‘ ° ∫ ∑§— ¥ ¬à Õ
Transcript of air7
‚§√ß°“√»÷°…“¡≈¿“«–∑“ßÕ“°“»Õ—π‡π◊ËÕß¡“®“° “√‚æ≈’‰´§≈‘°Õ–‚√¡“µ‘°‰Œ‚¥√§“√å∫Õπ (PAH) „π∫√√¬“°“»‡¢µ°√ÿ߇∑æ¡À“π§√2. °“√°√–®“¬µ—«·≈–√–¥—∫§«“¡‡¢â¡¢âπAirborne Polycyclic Aromatic Hydrocarbon (PAH) In Bangkok Urban AirII. Level and Distribution
Hathairatana Garivait*, Wanna Laowagul*
Phaka Sukasem*, Sunthorn Ngod-Ngam*
Chongrak Polprasert**, Lars Baetz Reutergardh**
∫∑§—¥¬àÕ°“√»÷°…“°“√°√–®“¬µ—«¢Õß “√‚æ≈’‰´§≈‘°Õ–‚√¡“
µ‘°‰Œ‚¥√§“√å∫Õπ (PAH) „π∫√√¬“°“»¢Õß
°√ÿ߇∑æ¡À“π§√ „π√Ÿª∑’ˇªìπ°ä“´·≈–‡ªìπΩÿÉπ≈–ÕÕß
∑”‰¥â ‚¥¬„™â‡§√◊ËÕß¡◊Õ‡°Á∫µ—«Õ¬à“ß∑’˪√–°Õ∫¥â«¬
‡§√◊ËÕ߇°Á∫µ—«Õ¬à“ßΩÿÉπ≈–ÕÕß·∫∫·¬°¢π“¥ ·∫∫
Cascade impactor (Andersen çlow volumeé
sampler) ∑’Ë “¡“√∂·¬°¢π“¥¢ÕßΩÿÉπ≈–ÕÕ߉¥â
8 ™—Èπ µàÕ‡¢â“°—∫À≈Õ¥‡°Á∫°ä“´ (XAD-2 adsorbent
tube) ‡¡◊ËÕ°“√‡°Á∫µ—«Õ¬à“ß PAH ∑—Èß„π√Ÿª¢ÕßΩÿÉπ
·¬°¢π“¥·≈–„π√Ÿª¢Õß°ä“´‰¥âÕ¬à“ßµàÕ‡π◊ËÕß ‡ªìπ
‡«≈“ §√—Èß≈– 24 ™—Ë«‚¡ß “√ª√–°Õ∫ PAH ∑’Ë∑”°“√
«‘‡§√“–Àå¡’®”π«π 9 ™π‘¥ ∑—Èß∑’ˇªìπ “√°àÕ¡–‡√ÁßRefuse incinerator
*»Ÿπ¬å«‘®—¬·≈–Ωñ°Õ∫√¡¥â“π ‘Ëß·«¥≈âÕ¡ °√¡ à߇ √‘¡§ÿ≥¿“æ ‘Ëß·«¥≈âÕ¡ ‡∑§‚π∏“π’ µ.§≈ÕßÀâ“ Õ.§≈ÕßÀ≈«ß ®.ª∑ÿ¡∏“π’ 12120 ‚∑√. 0-2577-1136 ‚∑√ “√. 0-2577-1138Environmental Research and Training Center, Department of Environmental Quality Promotion. Technopolis. Klong 5 Klong Luang, Pathumthani 12120 e-mail: [email protected]**Asian Institute of Technology, Pathumthani, Thailand
(carcinogen) ·≈– “√√à«¡°àÕ¡–‡√Áß (co-carcinogen)
䴉ᡈ Pyrene (PYR), Benz (a) Anthracene
(BaA), Benzo (e) Pyrene (BeP), Dibenz (a,e)
Anthracene (DbacA), Benzo(k)Fluorauthene
(BkF), Benzo(a) Pyrene (BaP), Dibenz (a,h)
Anthracene (DbahA), Benzo(ghi)Perylene
(BghiP) ·≈– Tri-methyl cholanthrene (3MC)
“√ª√–°Õ∫ PAH ∑’Ë¡’πÈ”Àπ—°‚¡‡≈°ÿ≈µË”
‡™àπ PYR BeP ·≈– BaA ®–Õ¬Ÿà„π√Ÿª¢Õß°ä“´‡ªìπ
à«π„À≠à §◊Õ 80% 40% ·≈– 24% µ“¡≈”¥—∫
„π¢≥–∑’Ë “√ª√–°Õ∫ PAH ∑’Ë¡’πÈ”Àπ—°‚¡‡≈°ÿ≈ ¡“°
°«à“®–Õ¬Ÿà„π√Ÿª¢ÕßΩÿÉπ≈–ÕÕ߇°◊Õ∫∑—ÈßÀ¡¥ º≈°“√
»÷°…“æ∫«à“ 30%-60% ‚¥¬πÈ”Àπ—°¢Õß “√ª√–°Õ∫
PAHs ∑’Ë»÷°…“æ∫Õ¬Ÿà„πΩÿÉπ≈–ÕÕß¢π“¥‡≈Á°°«à“ 0.43
‰¡§√Õπ ·≈–°«à“ 70% æ∫Õ¬Ÿà„πΩÿÉπ≈–ÕÕß¢π“¥‡≈Á°
°«à“ 2.1 ‰¡§√Õπ πÕ°®“°π’È °“√»÷°…“¬—߉¥âÀ“
§«“¡ —¡æ—π∏å√–À«à“ß§à“ —¡ª√– ‘∑∏‘Ï¢Õß —¥ à«π°“√
°√–®“¬µ—« „π√Ÿª¢ÕßΩÿÉπ≈–ÕÕß·≈–„π√Ÿª¢Õß°ä“´ (Kp)
°—∫§à“§«“¡¥—π‰Õ (p ÌL) ¢Õß “√ª√–°Õ∫ PAH ·µà≈–
µ—« „π‡¢µ°√ÿ߇∑æ¡À“π§√‡æ◊ËÕ‡ªìπµ—«·∑π¢Õß°“√
‡°‘¥°“√°√–®“¬µ—«¢Õß “√¥—ß°≈à“«„π√Ÿª¢ÕßΩÿÉπ·≈–
°ä“´„π∫√√¬“°“»‡¢µ‡¡◊Õß√âÕπ
ABSTRACTThe gas-par ticle par titioning and
particle size distributions of airborne PAH in
Bangkok urban air were investigated using an
8 stage size fractionating cascade impactor
(Andersen çlow volumeé sampler) and a
downstream XAD-2 adsorbent tube for
sample collection. Nine PAH classified as
carcinogenic and co-carcinogenic compounds
- Pyrene (PYR), Benz(a)Anthracene (BaA),
Benzo(e)Pyrene (BeP), Dibenz (a,c) Anthracene
(DBacA), Benzo(k)Fluoranthene (BkF), Benzo
(a) Pyrene (BaP), Dibenz(a,h)Anthracene
(DBahA), Benzo(ghi)Perylene (BghiP) and Tri-
methylcholanthrene (3MC) - were quantified.
The lower molecular weight (MW) PAH such as
PYR, BeP and BaA were present mainly in
the gaseous phase (80%, 40% and 24%,
respectively) while higher MW compounds
were present almost totally in the particulate
fraction. The results show that 30%-60%
of each PAH by mass were found on particles
smaller than 0.43 µm and more than 70% on
particles with diameter less than 2.1 µm. In
addition, the relationship between the particle/
gas partition coefficient (Kp) and the sub-
cooled liquid vapor pressure (p ÌL) was also
determined to describe the gas-particle
partitioning of those PAH compounds in a
tropical atmosphere.
1. IntroductionPolycyclic Aromatic Hydrocarbons
(PAH), ubiquitously found in ambient aerosols
are usually products of combustion. Extensive
experimental data support the emission
of PAH during incomplete combustion
processes.1-4 PAH are classified as hazardous
air pollutants in Title III of the U.S. Clean Air
Act Amendments of 1990 due to their
carcinogenic properties.5 Once emitted to the
atmosphere, PAH partition between the gas
and atmospheric aerosol phases according to
their volatility. Several observations suggest
that PAH are initially generated in the gas
phase, then sorbed onto existing particles
while undergoing condensation upon cooling
of the emission.6-9 Therefore, the atmospheric
levels of PAH depend on the distribution of
the PAH among the aerosol size fractions and
the partition between the gas and particle
phases under ambient conditions. Levels
of PAH in urban air are of particular importance
since they exhibit a predominant occurrence
in the respirable fraction particles (< 5 mm),
and hence the risk of human exposure to
these substances may be high.7,10,11 The
distribution of these substances between gas
and particulate phases in the atmosphere is
of impor tance in understanding their
atmospheric transpor t , deposit ion and
transformation mechanisms.12,13 Although there
is a lot of data on PAH levels in urban
temperate environments,14-19 field data on
PAH in tropical urban or rural areas are still
§-58 »Ÿπ¬å«‘®—¬·≈–Ωñ°Õ∫√¡¥â“π ‘Ëß·«¥≈âÕ¡ °√¡ à߇ √‘¡§ÿ≥¿“æ ‘Ëß·«¥≈âÕ¡
scarce, despite noticeable atmospheric
pollution in some major cities such as
Bangkok, Jarkata and Bombay.20,21
Bangkok is the largest city in Thailand
with population of 8 million and a population
density of 4,615 inhabitants/ km2. The city
now faces serious air pollution problems,
particularly of suspended particulate matter
(SPM). The major causes of these high SPM
levels are construction activity and motor
vehicle traffic.22 Although various measures
implemented recent ly to mit igate the
suspended particulate matter problem in
Bangkok urban air, the incorporation of
carcinogenic substances into those SPM was
not considered. On the other hand, statistics on
cancer in Thailand during 1988-1991 have
shown that lung cancer is the most common
malignancy in both sexes in area where the
air pollution was at a level considered
dangerous.23 However, the relat ionship
between the number of persons suffering of
lung cancer and the concentrat ion of
carcinogenic substances in Thailand atmos-
phere is still not documented. The aim of this
study is to investigate the levels, phase
distribution and particle size dependency of
airborne PAH in Bangkok urban air in order to
better understand their environmental fate
and to estimate the human exposure to these
substances. Fur thermore, motor vehicle
emissions are thought to be a major source of
atmospheric PAH in urban area24 and emission
from land transport accounts for a very large
portion of ground level pollutants in Bangkok
urban area.22 The results of this study will
also provide useful information about ambient
levels of carcinogenic and mutagenic sub-
stances related to this source.
2. Methods and Materials
2.1 Sampling locationsThe target area of the study encom-
passes an urban area of Bangkok which
represents about 18 km from East to West
and about 16 km from north to south. There
is little change in temperature throughout
the year. The annual average temperature is
26 ÌC-32 ÌC, the annual humidity, 70-80% and
annual rainfall, over 200 mm, characteristic of
a tropical climate with wet and dry seasons.
The prevailing wind direction is Southwest
monsoon from February to September and
Northeast monsoon during October to January.
Inappropriate city planning makes Bangkok
a mix of residential, industrial and commercial
areas. Three sampling sites were selected from
the National Air Quality Monitoring Network
in Bangkok in addition to one background site
in suburban Bangkok. The locations are
described as follow : (1) The Office of
Environmental Policy and Planning (OEPP) is
located in an urban residential area and is
surrounded by commercial bui ldings,
government offices, houses, roads and an
expressway. A few industries are present
within 10 km radius of the sampling site. At
this site, the sampler was placed on the top
of a 7-story building about 20 meters from
the ground; (2) The Ratburana Post Office
(RATB) is situated in the highly industrialized
area of Samut Prakan province located in
the southern of Bangkok. There are textiles,
iron, food processing, glass and plastic
industries and a thermal power plant within
2-5 km south to southwest of the site. The site
was downwind from Bangkok during the
sampling period, and sampling was done on
the roof of the monitoring station 3 meters
from the ground; (3) The Ministry of Science
Technology and Environment (MOSTE) site
was selected because it is located about 3
meters from the busy Rama VI road. The traffic
volume is estimated at 55,000 vehicles/day and
mainly composed of passenger cars, light duty
cars and buses. The sampler was placed 2
meters under expressway ; (4) The Environ-
»Ÿπ¬å«‘®—¬·≈–Ωñ°Õ∫√¡¥â“π ‘Ëß·«¥≈âÕ¡ °√¡ à߇ √‘¡§ÿ≥¿“æ ‘Ëß·«¥≈âÕ¡ §-59
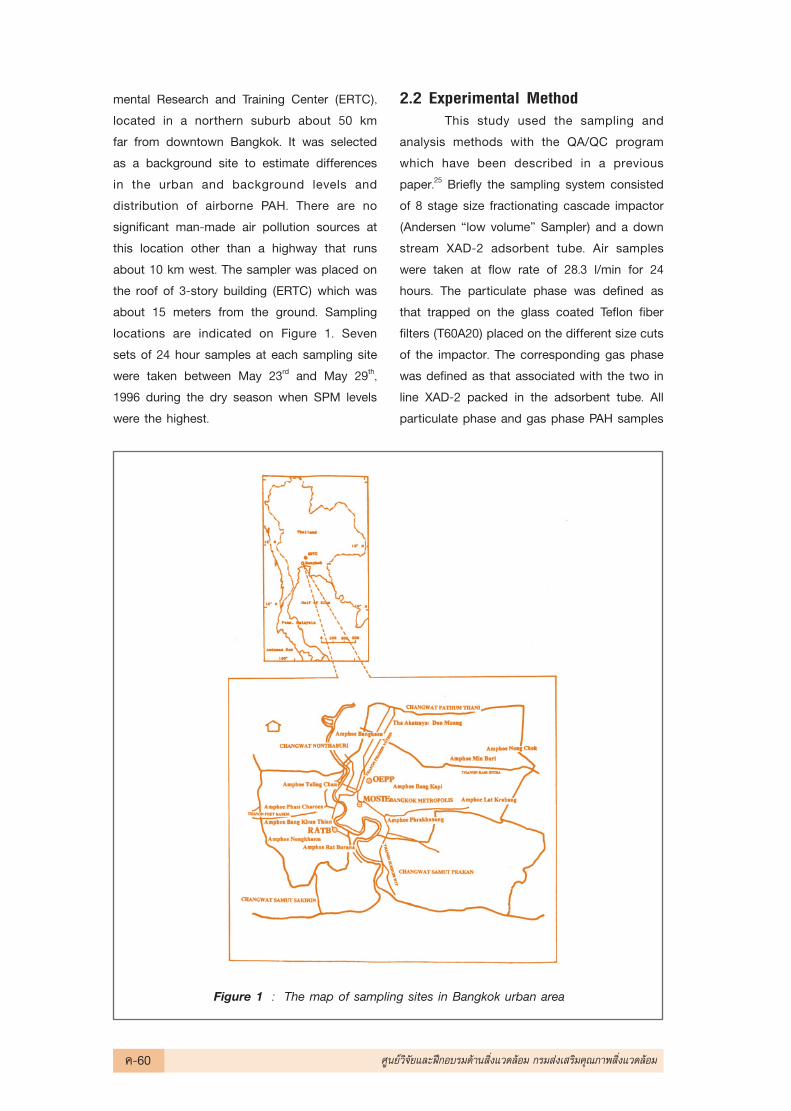
mental Research and Training Center (ERTC),
located in a northern suburb about 50 km
far from downtown Bangkok. It was selected
as a background site to estimate differences
in the urban and background levels and
distribution of airborne PAH. There are no
significant man-made air pollution sources at
this location other than a highway that runs
about 10 km west. The sampler was placed on
the roof of 3-story building (ERTC) which was
about 15 meters from the ground. Sampling
locations are indicated on Figure 1. Seven
sets of 24 hour samples at each sampling site
were taken between May 23rd and May 29th,
1996 during the dry season when SPM levels
were the highest.
2.2 Experimental MethodThis study used the sampling and
analysis methods with the QA/QC program
which have been described in a previous
paper.25 Briefly the sampling system consisted
of 8 stage size fractionating cascade impactor
(Andersen çlow volumeé Sampler) and a down
stream XAD-2 adsorbent tube. Air samples
were taken at flow rate of 28.3 l/min for 24
hours. The particulate phase was defined as
that trapped on the glass coated Teflon fiber
filters (T60A20) placed on the different size cuts
of the impactor. The corresponding gas phase
was defined as that associated with the two in
line XAD-2 packed in the adsorbent tube. All
particulate phase and gas phase PAH samples
Figure 1 : The map of sampling sites in Bangkok urban area
§-60 »Ÿπ¬å«‘®—¬·≈–Ωñ°Õ∫√¡¥â“π ‘Ëß·«¥≈âÕ¡ °√¡ à߇ √‘¡§ÿ≥¿“æ ‘Ëß·«¥≈âÕ¡
were extracted by ultrasonication with
dichloromethane, and dichloro- methane :
acetonitrile (1:1, v/v), respectively. The extracts
were transferred into acetonitrile solution and
analyzed by reverse phase high performance
liquid chromatography (HPLC) with fluores-
cence detection. The following nine PAH;
Pyrene (PYR), Benz(a)Anthracene (BaA), Benzo
(e)Pyrene(BeP), Dibenz(a,c)Anthracene
(DBacA), Benzo(k)Fluoranthene (BkF), Benzo
(a)Pyrene (BaP), Dibenz(a,h)Anthracene
(DBahA), Benzo(ghi)Perylene (BghiP) and
Trimethylcholanthrene (3MC) were quanti-tated
with the aid of a mixture of authentic standards
from Wako Pure Chemical Industries (Osaka,
Japan).
3. Results and DiscussionAir pollution by airborne PAH in Bangkok
urban area was evaluated during the dry
season. Typically this season is characterized
by low wind (less than 4 m/s at 10 m height)
and no precipitation. The average ambient
temperature was 32 ÌC, relative humidity,
65-85% and the predominant winds were
from south and southeast wind.
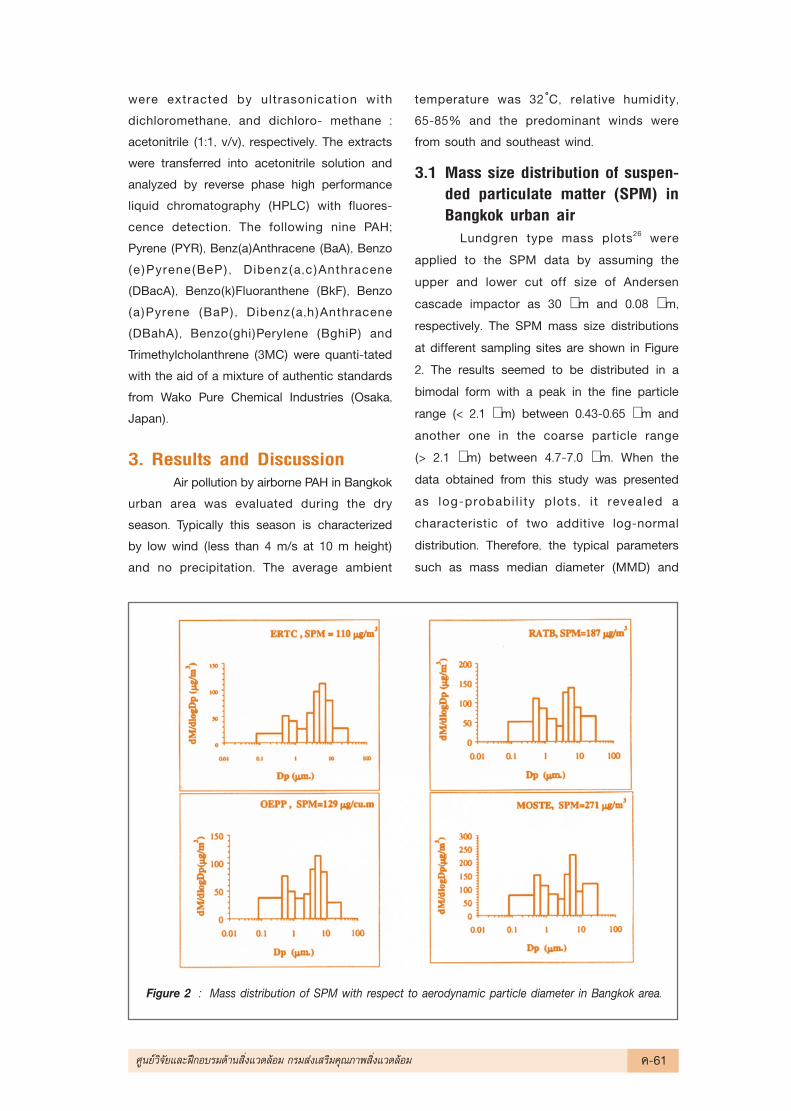
3.1 Mass size distribution of suspen-ded particulate matter (SPM) inBangkok urban air
Lundgren type mass plots26 were
applied to the SPM data by assuming the
upper and lower cut off size of Andersen
cascade impactor as 30 µm and 0.08 µm,
respectively. The SPM mass size distributions
at different sampling sites are shown in Figure
2. The results seemed to be distributed in a
bimodal form with a peak in the fine particle
range (< 2.1 µm) between 0.43-0.65 µm and
another one in the coarse particle range
(> 2.1 µm) between 4.7-7.0 µm. When the
data obtained from this study was presented
as log-probabi l i ty plots, i t revealed a
characteristic of two additive log-normal
distribution. Therefore, the typical parameters
such as mass median diameter (MMD) and
Figure 2 : Mass distribution of SPM with respect to aerodynamic particle diameter in Bangkok area.
»Ÿπ¬å«‘®—¬·≈–Ωñ°Õ∫√¡¥â“π ‘Ëß·«¥≈âÕ¡ °√¡ à߇ √‘¡§ÿ≥¿“æ ‘Ëß·«¥≈âÕ¡ §-61
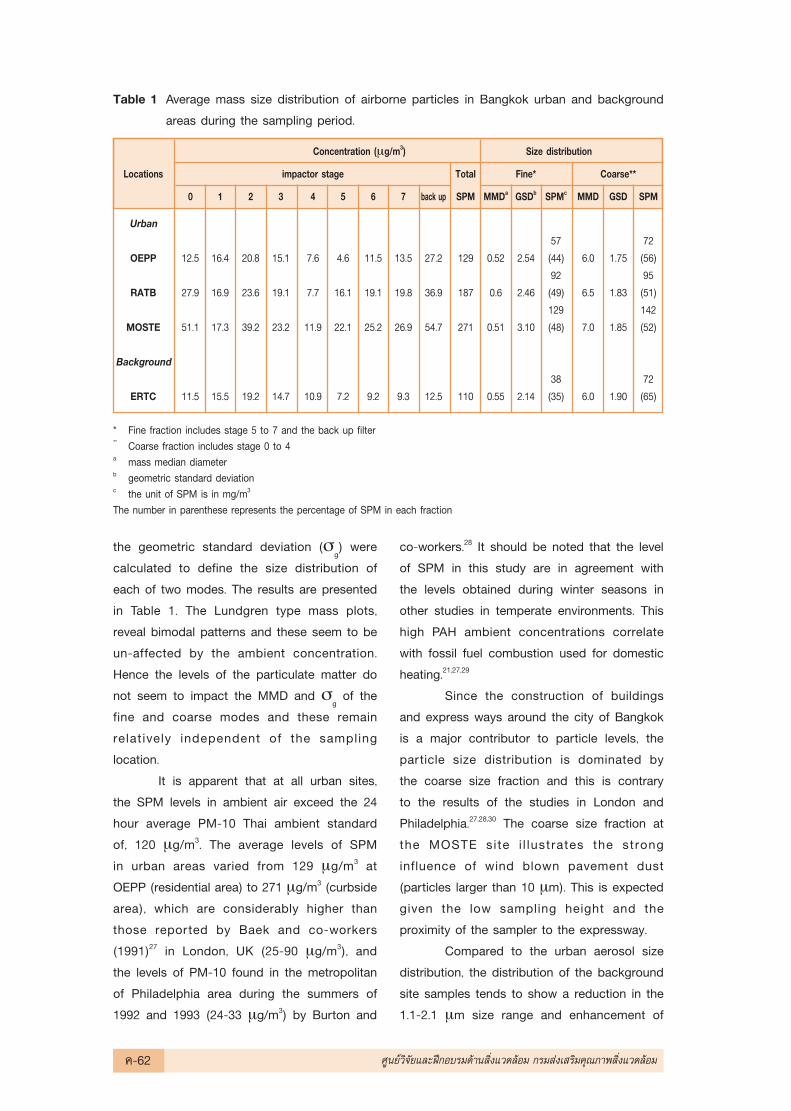
the geometric standard deviation (σg) were
calculated to define the size distribution of
each of two modes. The results are presented
in Table 1. The Lundgren type mass plots,
reveal bimodal patterns and these seem to be
un-affected by the ambient concentration.
Hence the levels of the particulate matter do
not seem to impact the MMD and σg of the
fine and coarse modes and these remain
relatively independent of the sampling
location.
It is apparent that at all urban sites,
the SPM levels in ambient air exceed the 24
hour average PM-10 Thai ambient standard
of, 120 µg/m3. The average levels of SPM
in urban areas varied from 129 µg/m3 at
OEPP (residential area) to 271 µg/m3 (curbside
area), which are considerably higher than
those reported by Baek and co-workers
(1991)27 in London, UK (25-90 µg/m3), and
the levels of PM-10 found in the metropolitan
of Philadelphia area during the summers of
1992 and 1993 (24-33 µg/m3) by Burton and
co-workers.28 It should be noted that the level
of SPM in this study are in agreement with
the levels obtained during winter seasons in
other studies in temperate environments. This
high PAH ambient concentrations correlate
with fossil fuel combustion used for domestic
heating.21,27,29
Since the construction of buildings
and express ways around the city of Bangkok
is a major contributor to particle levels, the
particle size distribution is dominated by
the coarse size fraction and this is contrary
to the results of the studies in London and
Philadelphia.27,28,30 The coarse size fraction at
the MOSTE site i l lustrates the strong
influence of wind blown pavement dust
(particles larger than 10 µm). This is expected
given the low sampling height and the
proximity of the sampler to the expressway.
Compared to the urban aerosol size
distribution, the distribution of the background
site samples tends to show a reduction in the
1.1-2.1 µm size range and enhancement of
Table 1 Average mass size distribution of airborne particles in Bangkok urban and background
areas during the sampling period.
Concentration (µg/m3) Size distribution
Locations impactor stage Total Fine* Coarse**
0 1 2 3 4 5 6 7 back up SPM MMDa GSDb SPMc MMD GSD SPM
Urban57 72
OEPP 12.5 16.4 20.8 15.1 7.6 4.6 11.5 13.5 27.2 129 0.52 2.54 (44) 6.0 1.75 (56)92 95
RATB 27.9 16.9 23.6 19.1 7.7 16.1 19.1 19.8 36.9 187 0.6 2.46 (49) 6.5 1.83 (51)129 142
MOSTE 51.1 17.3 39.2 23.2 11.9 22.1 25.2 26.9 54.7 271 0.51 3.10 (48) 7.0 1.85 (52)
Background38 72
ERTC 11.5 15.5 19.2 14.7 10.9 7.2 9.2 9.3 12.5 110 0.55 2.14 (35) 6.0 1.90 (65)
* Fine fraction includes stage 5 to 7 and the back up filter** Coarse fraction includes stage 0 to 4a mass median diameterb geometric standard deviationc the unit of SPM is in mg/m3
The number in parenthese represents the percentage of SPM in each fraction
§-62 »Ÿπ¬å«‘®—¬·≈–Ωñ°Õ∫√¡¥â“π ‘Ëß·«¥≈âÕ¡ °√¡ à߇ √‘¡§ÿ≥¿“æ ‘Ëß·«¥≈âÕ¡
larger particles, 2.1-3.3 µm. This may be due
to the entrainment of larger particles and
the lack of fine particle sources as well as
the aging process of particles (gas-particles
conversion) during transport of the aerosols.31,32
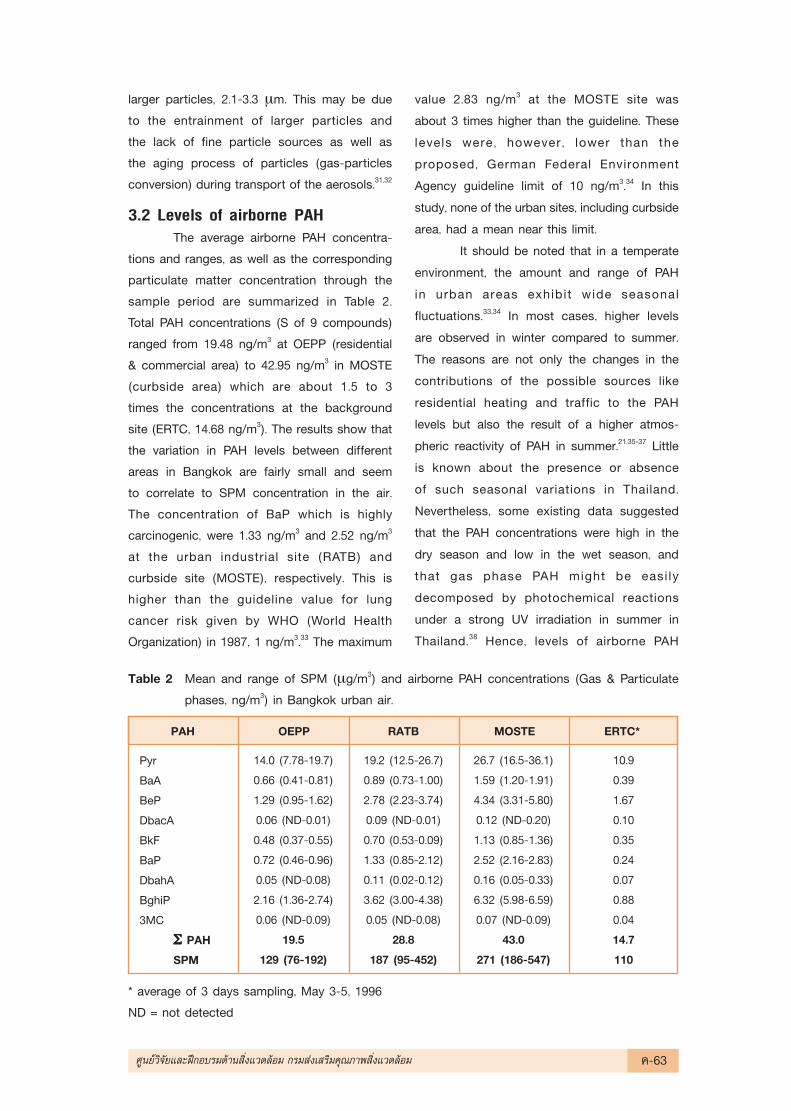
3.2 Levels of airborne PAHThe average airborne PAH concentra-
tions and ranges, as well as the corresponding
particulate matter concentration through the
sample period are summarized in Table 2.
Total PAH concentrations (S of 9 compounds)
ranged from 19.48 ng/m3 at OEPP (residential
& commercial area) to 42.95 ng/m3 in MOSTE
(curbside area) which are about 1.5 to 3
times the concentrations at the background
site (ERTC, 14.68 ng/m3). The results show that
the variation in PAH levels between different
areas in Bangkok are fairly small and seem
to correlate to SPM concentration in the air.
The concentration of BaP which is highly
carcinogenic, were 1.33 ng/m3 and 2.52 ng/m3
at the urban industrial site (RATB) and
curbside site (MOSTE), respectively. This is
higher than the guideline value for lung
cancer risk given by WHO (World Health
Organization) in 1987, 1 ng/m3.33 The maximum
value 2.83 ng/m3 at the MOSTE site was
about 3 times higher than the guideline. These
levels were, however , lower than the
proposed, German Federal Environment
Agency guideline limit of 10 ng/m3.34 In this
study, none of the urban sites, including curbside
area, had a mean near this limit.
It should be noted that in a temperate
environment, the amount and range of PAH
in urban areas exhibit wide seasonal
fluctuations.33,34 In most cases, higher levels
are observed in winter compared to summer.
The reasons are not only the changes in the
contributions of the possible sources like
residential heating and traffic to the PAH
levels but also the result of a higher atmos-
pheric reactivity of PAH in summer.21,35-37 Little
is known about the presence or absence
of such seasonal variations in Thailand.
Nevertheless, some existing data suggested
that the PAH concentrations were high in the
dry season and low in the wet season, and
that gas phase PAH might be easi ly
decomposed by photochemical reactions
under a strong UV irradiation in summer in
Thailand.38 Hence, levels of airborne PAH
Table 2 Mean and range of SPM (µg/m3) and airborne PAH concentrations (Gas & Particulate
phases, ng/m3) in Bangkok urban air.
PAH OEPP RATB MOSTE ERTC*
Pyr
BaA
BeP
DbacA
BkF
BaP
DbahA
BghiP
3MC
ΣΣΣΣΣ PAH
SPM
* average of 3 days sampling, May 3-5, 1996
ND = not detected
14.0 (7.78-19.7)
0.66 (0.41-0.81)
1.29 (0.95-1.62)
0.06 (ND-0.01)
0.48 (0.37-0.55)
0.72 (0.46-0.96)
0.05 (ND-0.08)
2.16 (1.36-2.74)
0.06 (ND-0.09)
19.5
129 (76-192)
19.2 (12.5-26.7)
0.89 (0.73-1.00)
2.78 (2.23-3.74)
0.09 (ND-0.01)
0.70 (0.53-0.09)
1.33 (0.85-2.12)
0.11 (0.02-0.12)
3.62 (3.00-4.38)
0.05 (ND-0.08)
28.8
187 (95-452)
26.7 (16.5-36.1)
1.59 (1.20-1.91)
4.34 (3.31-5.80)
0.12 (ND-0.20)
1.13 (0.85-1.36)
2.52 (2.16-2.83)
0.16 (0.05-0.33)
6.32 (5.98-6.59)
0.07 (ND-0.09)
43.0
271 (186-547)
10.9
0.39
1.67
0.10
0.35
0.24
0.07
0.88
0.04
14.7
110
»Ÿπ¬å«‘®—¬·≈–Ωñ°Õ∫√¡¥â“π ‘Ëß·«¥≈âÕ¡ °√¡ à߇ √‘¡§ÿ≥¿“æ ‘Ëß·«¥≈âÕ¡ §-63
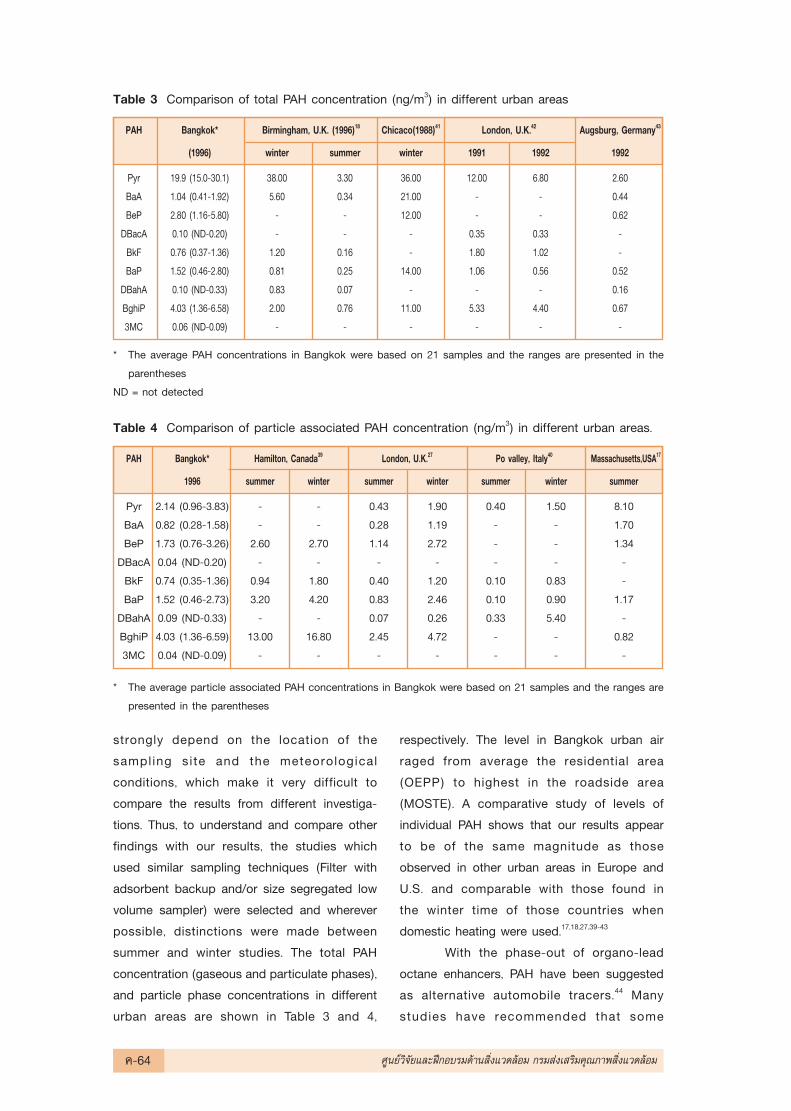
Table 3 Comparison of total PAH concentration (ng/m3) in different urban areas
PAH Bangkok* Birmingham, U.K. (1996)18 Chicaco(1988)41 London, U.K.42 Augsburg, Germany43
(1996) winter summer winter 1991 1992 1992
Pyr 19.9 (15.0-30.1) 38.00 3.30 36.00 12.00 6.80 2.60
BaA 1.04 (0.41-1.92) 5.60 0.34 21.00 - - 0.44
BeP 2.80 (1.16-5.80) - - 12.00 - - 0.62
DBacA 0.10 (ND-0.20) - - - 0.35 0.33 -
BkF 0.76 (0.37-1.36) 1.20 0.16 - 1.80 1.02 -
BaP 1.52 (0.46-2.80) 0.81 0.25 14.00 1.06 0.56 0.52
DBahA 0.10 (ND-0.33) 0.83 0.07 - - - 0.16
BghiP 4.03 (1.36-6.58) 2.00 0.76 11.00 5.33 4.40 0.67
3MC 0.06 (ND-0.09) - - - - - -
* The average PAH concentrations in Bangkok were based on 21 samples and the ranges are presented in the
parentheses
ND = not detected
Table 4 Comparison of particle associated PAH concentration (ng/m3) in different urban areas.
PAH Bangkok* Hamilton, Canada39 London, U.K.27 Po valley, Italy40 Massachusetts,USA17
1996 summer winter summer winter summer winter summer
Pyr 2.14 (0.96-3.83) - - 0.43 1.90 0.40 1.50 8.10
BaA 0.82 (0.28-1.58) - - 0.28 1.19 - - 1.70
BeP 1.73 (0.76-3.26) 2.60 2.70 1.14 2.72 - - 1.34
DBacA 0.04 (ND-0.20) - - - - - - -
BkF 0.74 (0.35-1.36) 0.94 1.80 0.40 1.20 0.10 0.83 -
BaP 1.52 (0.46-2.73) 3.20 4.20 0.83 2.46 0.10 0.90 1.17
DBahA 0.09 (ND-0.33) - - 0.07 0.26 0.33 5.40 -
BghiP 4.03 (1.36-6.59) 13.00 16.80 2.45 4.72 - - 0.82
3MC 0.04 (ND-0.09) - - - - - - -
* The average particle associated PAH concentrations in Bangkok were based on 21 samples and the ranges are
presented in the parentheses
strongly depend on the location of the
sampl ing site and the meteorological
conditions, which make it very difficult to
compare the results from different investiga-
tions. Thus, to understand and compare other
findings with our results, the studies which
used similar sampling techniques (Filter with
adsorbent backup and/or size segregated low
volume sampler) were selected and wherever
possible, distinctions were made between
summer and winter studies. The total PAH
concentration (gaseous and particulate phases),
and particle phase concentrations in different
urban areas are shown in Table 3 and 4,
respectively. The level in Bangkok urban air
raged from average the residential area
(OEPP) to highest in the roadside area
(MOSTE). A comparative study of levels of
individual PAH shows that our results appear
to be of the same magnitude as those
observed in other urban areas in Europe and
U.S. and comparable with those found in
the winter time of those countries when
domestic heating were used.17,18,27,39-43
With the phase-out of organo-lead
octane enhancers, PAH have been suggested
as alternative automobile tracers.44 Many
studies have recommended that some
§-64 »Ÿπ¬å«‘®—¬·≈–Ωñ°Õ∫√¡¥â“π ‘Ëß·«¥≈âÕ¡ °√¡ à߇ √‘¡§ÿ≥¿“æ ‘Ëß·«¥≈âÕ¡
specific PAH or ratios between PAHs may
be used for source identification. Miguel and
co-workers45 reported that diesel trucks were
the major source of light PAH such as
Fluoranthene, PYR and BaA, whereas light-duty
gasoline vehicles were the dominant source
of higher molecular weight such as BaP, BghiP
and DBahA. Nielsen1 reported that the ratio
of BghiP to BeP were 1.82 and 1.15 for street
and car park samples, respectively. Li and
Kamens46 proposed that the ratio of BaA to
BaP were 0.5 and 1.0 for gasoline and
diesel exhaust, respectively. Greenberg and
co-workers47 suggested that Coronene and
BghiP are good indicators of automobile traffic.
The high level of BghiP, BaP, BeP and PYR
found in this study, ratio of BaA to BaP (0.63
to 0.92) and the ratio of BghiP to BeP (1.30
to 1.68) let us expect automobile traffic to be
the major source of airborne PAH in this city.
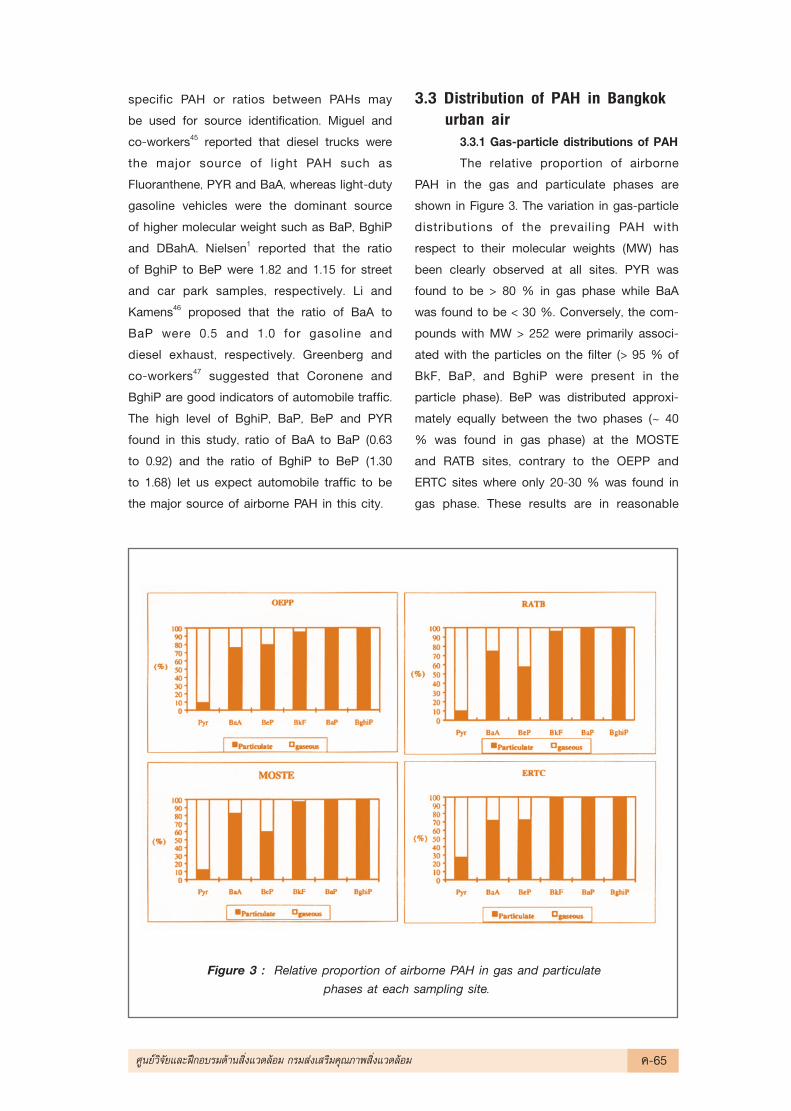
3.3 Distribution of PAH in Bangkokurban air
3.3.1 Gas-particle distributions of PAH
The relative proportion of airborne
PAH in the gas and particulate phases are
shown in Figure 3. The variation in gas-particle
distributions of the prevailing PAH with
respect to their molecular weights (MW) has
been clearly observed at all sites. PYR was
found to be > 80 % in gas phase while BaA
was found to be < 30 %. Conversely, the com-
pounds with MW > 252 were primarily associ-
ated with the particles on the filter (> 95 % of
BkF, BaP, and BghiP were present in the
particle phase). BeP was distributed approxi-
mately equally between the two phases (~ 40
% was found in gas phase) at the MOSTE
and RATB sites, contrary to the OEPP and
ERTC sites where only 20-30 % was found in
gas phase. These results are in reasonable
Figure 3 : Relative proportion of airborne PAH in gas and particulate phases at each sampling site.
»Ÿπ¬å«‘®—¬·≈–Ωñ°Õ∫√¡¥â“π ‘Ëß·«¥≈âÕ¡ °√¡ à߇ √‘¡§ÿ≥¿“æ ‘Ëß·«¥≈âÕ¡ §-65
agreement with other studies27,42 with the
exception of BaA and BeP. The low gas phase
BaA and BeP concentrations compared to
other studies may be due to the long time
scale required to re-establish equilibrium
after gas phase photolysis and reaction with
ozone, hydroxyl radicals and nitrate.48 In fact,
the distribution of PAH in the atmosphere
between the gas and particulate phases is
determined by several factors such as the
vapour pressure, the amount of particulate
matters in terms of the surface area available
for adsorption, the ambient temperature, the
affinity of the compound for the particlesû
organic matrix, and the reactivity and stability
of the compound.49-52 As a consequence, the
partitioning ratio has an important influence
on the fate, transport, transformation and the
physical removal (i.e., wet and dry deposition)
of the compounds in the urban atmosphere.
A number of studies on distribution factors,
defined as the ratios of particulate to gas
phase concentrations, for PAH have been
reported; Yamasaki and co-workers52 have
used Langmuirian adsorption/desorption
theory to describe the state of gas-particle
partitioning of urban PAH as a function of
temperature and aerosol concentration. By
assuming that the surface coverage of PAH
on the particles was low, they introduced a
temperature-dependent partition coefficient of
the form;
(1)
where A and F are the concentrations
of PAH in gas phase and associated
particulate phase in the atmosphere (ng/m3),
respectively, and TSP is the concentration
of particulate matter in the atmosphere
(mg/ m3). Pankow53 has proposed the inverse
definit ion of par t it ion coef f icient. It is
considered to be more convenient and intuitive
to define the partition coefficient Kp as
(2)
where increasing Kp implies increasing
partitioning to the particle phase. It has been
suggested that the sub-cooled liquid vapour
pressure of semivolatile organic compounds
is the dominating factor governing both
adsorption and absorption processes.54
(3)
Pankow and Bidleman49 have demon-
strated that equation (3) can be effectively
used for determining of gas-particle parti-
tioning of organic compounds in actual field
samples. Therefore, for comparative reasons,
equation (3) was used in this study to
illustrate the gas-particle partitioning of PAH
compounds in Bangkok urban air. For the
purpose, the temperature dependent sub-
cooled liquid vapor pressures (p ÌL) were
obtained as follows. Yamasaki and co-workers55
have reported p ÌL (mmHg) and the heat of
vaporization (DH, kcal/mol) for a number of
PAH compounds at 25 ÌC. Assuming that the
DH for a given PAH remains constant over
a small temperature range, the data were used
to calculate the p ÌL at 30 ÌC of each of the
individual PAH collected in this study by
referring to Clausius-Clapeyron approxi-
mations;
(4)
where R is the gas constant in kcal
K-1 mol-1, T is the average ambient tempe-
rature in K, and b is constant related to
the entropy of vaporization. Kp (m3/mg) was
plotted against p ÌL (mmHg) on a log-log
scale for each sampling site. The relationships
between partition coefficient, Kp and saturation
liquid phase vapor pressure, p ÌL at each
sampling site in this study is shown in Figure 4.
K =A
F / TSP
log Kp
= mr log po
L + b
r
Kp
=F / TSP
A= K-1
In poL
= + br
H
R
1
T
§-66 »Ÿπ¬å«‘®—¬·≈–Ωñ°Õ∫√¡¥â“π ‘Ëß·«¥≈âÕ¡ °√¡ à߇ √‘¡§ÿ≥¿“æ ‘Ëß·«¥≈âÕ¡
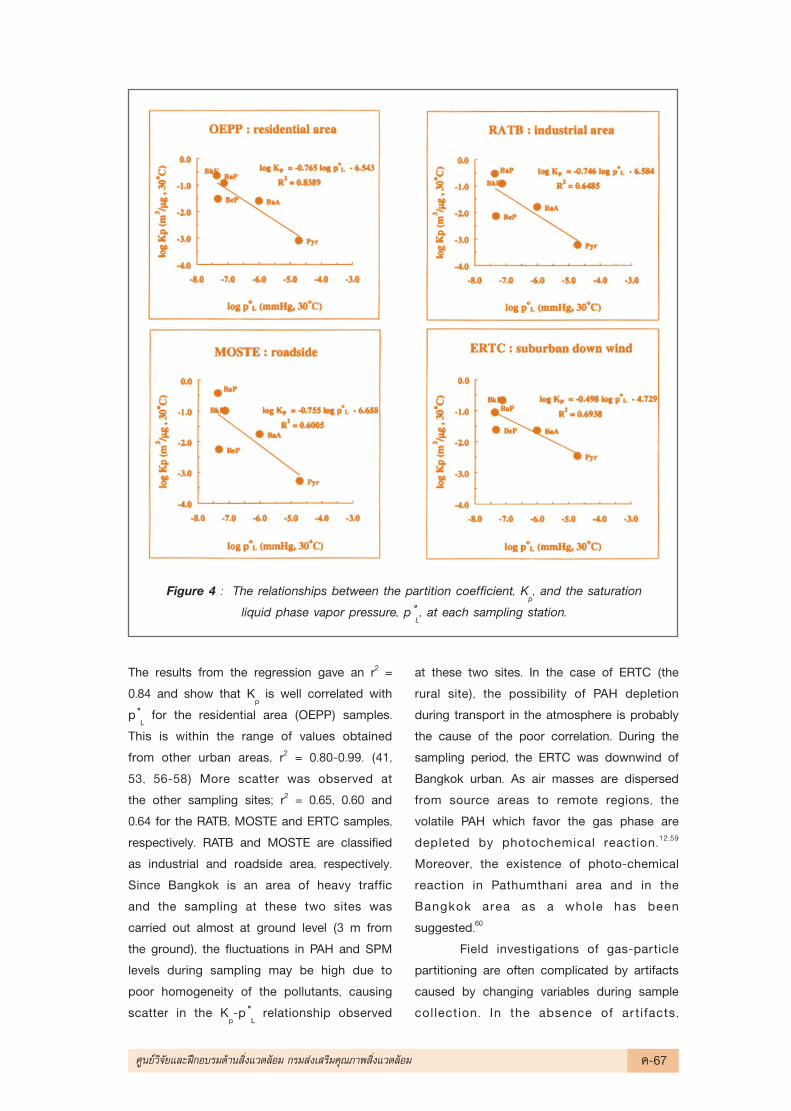
The results from the regression gave an r2 =
0.84 and show that Kp is well correlated with
p ÌL for the residential area (OEPP) samples.
This is within the range of values obtained
from other urban areas, r2 = 0.80-0.99. (41,
53, 56-58) More scatter was observed at
the other sampling sites; r2 = 0.65, 0.60 and
0.64 for the RATB, MOSTE and ERTC samples,
respectively. RATB and MOSTE are classified
as industrial and roadside area, respectively.
Since Bangkok is an area of heavy traffic
and the sampling at these two sites was
carried out almost at ground level (3 m from
the ground), the fluctuations in PAH and SPM
levels during sampling may be high due to
poor homogeneity of the pollutants, causing
scatter in the Kp-p Ì
L relationship observed
at these two sites. In the case of ERTC (the
rural site), the possibility of PAH depletion
during transport in the atmosphere is probably
the cause of the poor correlation. During the
sampling period, the ERTC was downwind of
Bangkok urban. As air masses are dispersed
from source areas to remote regions, the
volatile PAH which favor the gas phase are
depleted by photochemical reaction.12,59
Moreover, the existence of photo-chemical
reaction in Pathumthani area and in the
Bangkok area as a whole has been
suggested.60
Field investigations of gas-particle
partitioning are often complicated by artifacts
caused by changing variables during sample
collection. In the absence of ar tifacts,
Figure 4 : The relationships between the partition coefficient, Kp, and the saturation
liquid phase vapor pressure, p ÌL, at each sampling station.
»Ÿπ¬å«‘®—¬·≈–Ωñ°Õ∫√¡¥â“π ‘Ëß·«¥≈âÕ¡ °√¡ à߇ √‘¡§ÿ≥¿“æ ‘Ëß·«¥≈âÕ¡ §-67
equilibrium conditions for compounds of the
same class can be estimated by equation (3).
The expected value for the slope (mr) is -1
and the intercept (br) is related to the aerosol
properties. In this study, the slope of equation
(3) at all sampling sites was greater than -1.
The slopes and intercepts of the log Kp vs
log p ÌL lines were not significantly different
(two standard errors) within the urban sites
(mr = -0.77 to -0.74; b
r = -6.65 to -6.55),
whereas the shallowest slope and the most
positive intercept was observed at the rural
site (mr = -0.52 ; br = -4.83). The slopes
values in Bangkok urban were more or less
consistent with those found in other urban
air studies, mr = -0.38 to -1.04,41,61 even
though the intercepts values did not
compare very well. Several factors contribute
to the deviation in values of mr from -1 such
as effects of temperature and humidity,
atmospheric concentration of contaminants,
SPM and percent of non-exchangeable
material, and blow-off losses from or adsorp-
tion gains to particles on the filter.20,62,63 The
intercept term (br) depends on the assumed
mechanism of gas-particle interaction. If gas
to solid adsorption is assumed, br is related
to the specific surface area of the particulate
matter and the heat of desorption.49 If an
absorption model, in which organic compounds
are assumed to partition into a liquid-like film
on the aerosol is considered, br depends on
the fraction of organic matter in the particle
that is involved in the partitioning processes
and the activity coefficient of the compound
in the organic film.48,64 Moreover, factors that
change mr can also lead to changes in b
r.54
In our case, the ambient temperature
and relative humidity remained relatively
constant over the sampling period at all sites.
As clean air (probably at night time) passed
over previously collected particle PAH, a
çblow-off artifacté could become important.
This would lead to shallow slopes because the
most volatile PAH would be in the direction of
the gas phase and this is consistent with
our observations that slopes tend to be
greater than -1. On the other hand, it is likely
that urban air contains some non-exchangeable
PAH, bound to highly active sites or trapped
within the particles during their formation.49,51
These PAH will not equilibrate with its vapor
phase in the atmosphere but will be extracted
with solvent during analysis and operationally
counted along with the exchangeable PAH.
This phenomenon would also lead to shallow
slopes and we feel it is probably consistent
across most of our samples.
Another possibility is that of liquid
aerosols, the activity coefficient (g) of the
different PAHs, dissolved in different kinds of
ambient particles changes depending on the
chemical make of the particles. Jang et al. have
observed that if this is not taken into account,
log Kp vs -log p Ì
L tend to have shallow
slopes.65 This will promote the particulate
PAH in Kp and hence leading to shallower
slopes. Therefore, we speculate that shallow
slopes are most probably related to blow-off
artifact by clean air and activity coefficient
effects.
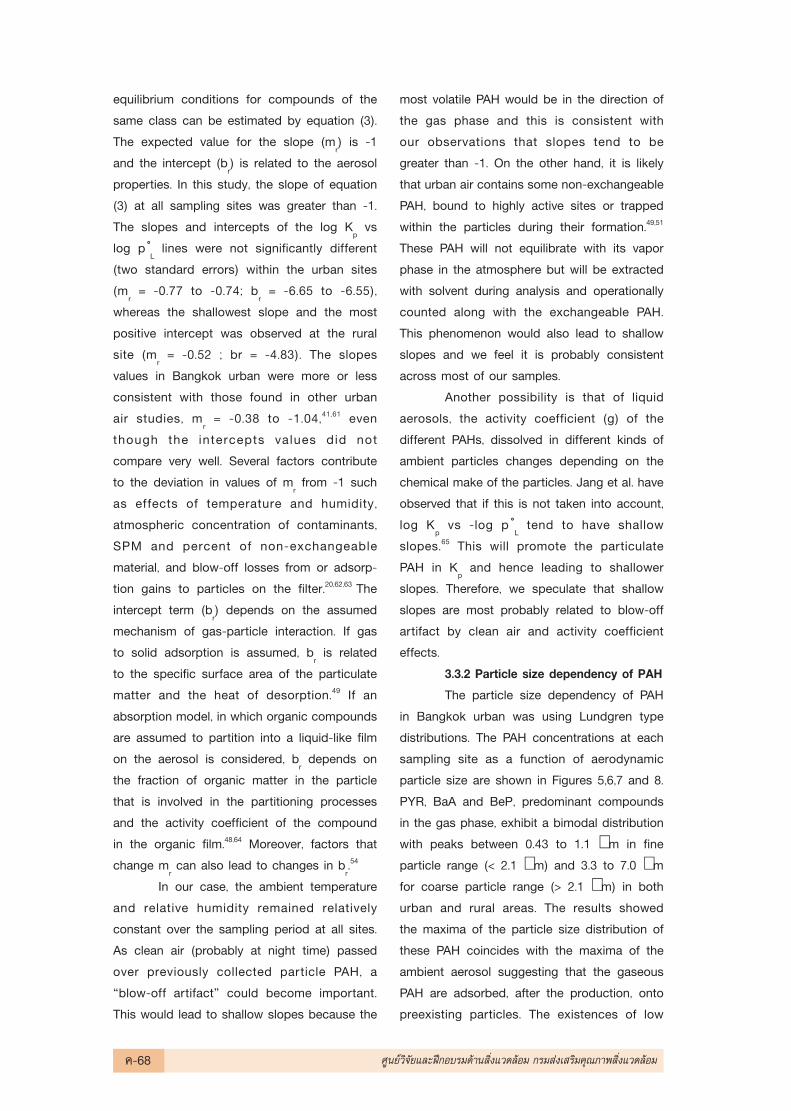
3.3.2 Particle size dependency of PAH
The particle size dependency of PAH
in Bangkok urban was using Lundgren type
distributions. The PAH concentrations at each
sampling site as a function of aerodynamic
particle size are shown in Figures 5,6,7 and 8.
PYR, BaA and BeP, predominant compounds
in the gas phase, exhibit a bimodal distribution
with peaks between 0.43 to 1.1 µm in fine
particle range (< 2.1 µm) and 3.3 to 7.0 µm
for coarse particle range (> 2.1 µm) in both
urban and rural areas. The results showed
the maxima of the particle size distribution of
these PAH coincides with the maxima of the
ambient aerosol suggesting that the gaseous
PAH are adsorbed, after the production, onto
preexisting particles. The existences of low
§-68 »Ÿπ¬å«‘®—¬·≈–Ωñ°Õ∫√¡¥â“π ‘Ëß·«¥≈âÕ¡ °√¡ à߇ √‘¡§ÿ≥¿“æ ‘Ëß·«¥≈âÕ¡
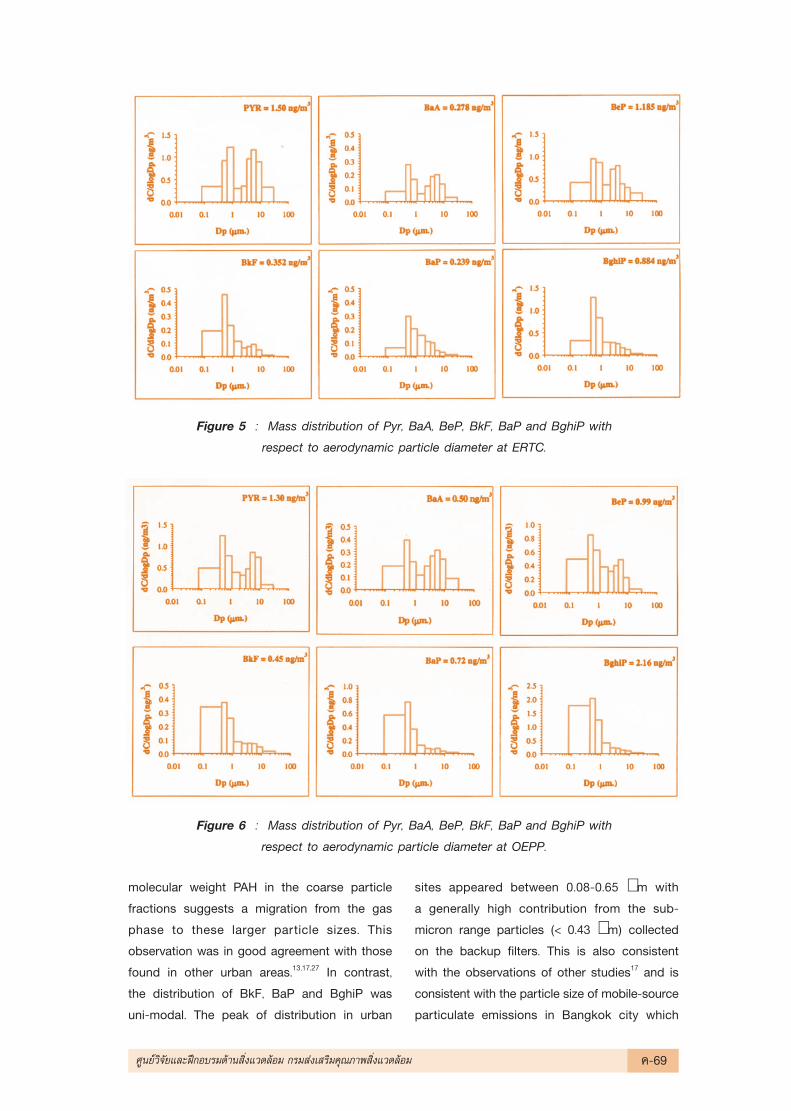
Figure 5 : Mass distribution of Pyr, BaA, BeP, BkF, BaP and BghiP with
respect to aerodynamic particle diameter at ERTC.
Figure 6 : Mass distribution of Pyr, BaA, BeP, BkF, BaP and BghiP with
respect to aerodynamic particle diameter at OEPP.
molecular weight PAH in the coarse particle
fractions suggests a migration from the gas
phase to these larger particle sizes. This
observation was in good agreement with those
found in other urban areas.13,17,27 In contrast,
the distribution of BkF, BaP and BghiP was
uni-modal. The peak of distribution in urban
sites appeared between 0.08-0.65 µm with
a generally high contribution from the sub-
micron range particles (< 0.43 µm) collected
on the backup filters. This is also consistent
with the observations of other studies17 and is
consistent with the particle size of mobile-source
particulate emissions in Bangkok city which
»Ÿπ¬å«‘®—¬·≈–Ωñ°Õ∫√¡¥â“π ‘Ëß·«¥≈âÕ¡ °√¡ à߇ √‘¡§ÿ≥¿“æ ‘Ëß·«¥≈âÕ¡ §-69
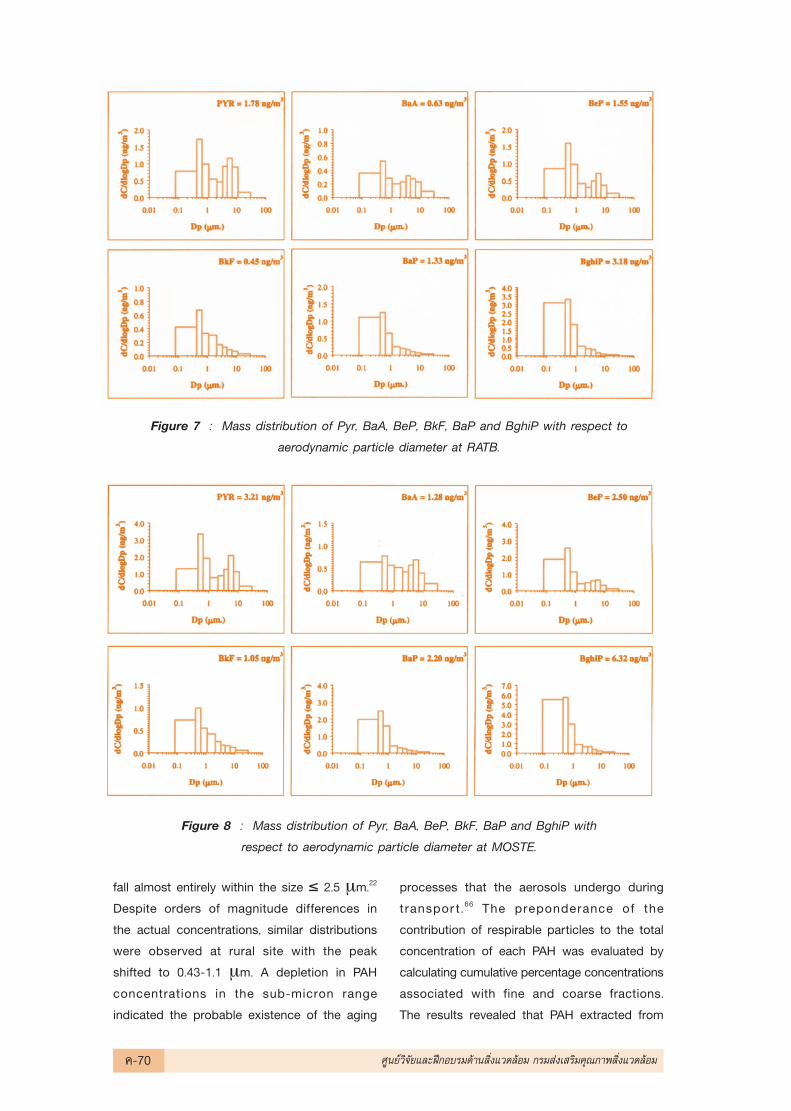
Figure 7 : Mass distribution of Pyr, BaA, BeP, BkF, BaP and BghiP with respect to
aerodynamic particle diameter at RATB.
Figure 8 : Mass distribution of Pyr, BaA, BeP, BkF, BaP and BghiP with
respect to aerodynamic particle diameter at MOSTE.
fall almost entirely within the size ≤ 2.5 µm.22
Despite orders of magnitude differences in
the actual concentrations, similar distributions
were observed at rural site with the peak
shifted to 0.43-1.1 µm. A depletion in PAH
concentrations in the sub-micron range
indicated the probable existence of the aging
processes that the aerosols undergo during
transpor t . 66 The preponderance of the
contribution of respirable particles to the total
concentration of each PAH was evaluated by
calculating cumulative percentage concentrations
associated with fine and coarse fractions.
The results revealed that PAH extracted from
§-70 »Ÿπ¬å«‘®—¬·≈–Ωñ°Õ∫√¡¥â“π ‘Ëß·«¥≈âÕ¡ °√¡ à߇ √‘¡§ÿ≥¿“æ ‘Ëß·«¥≈âÕ¡
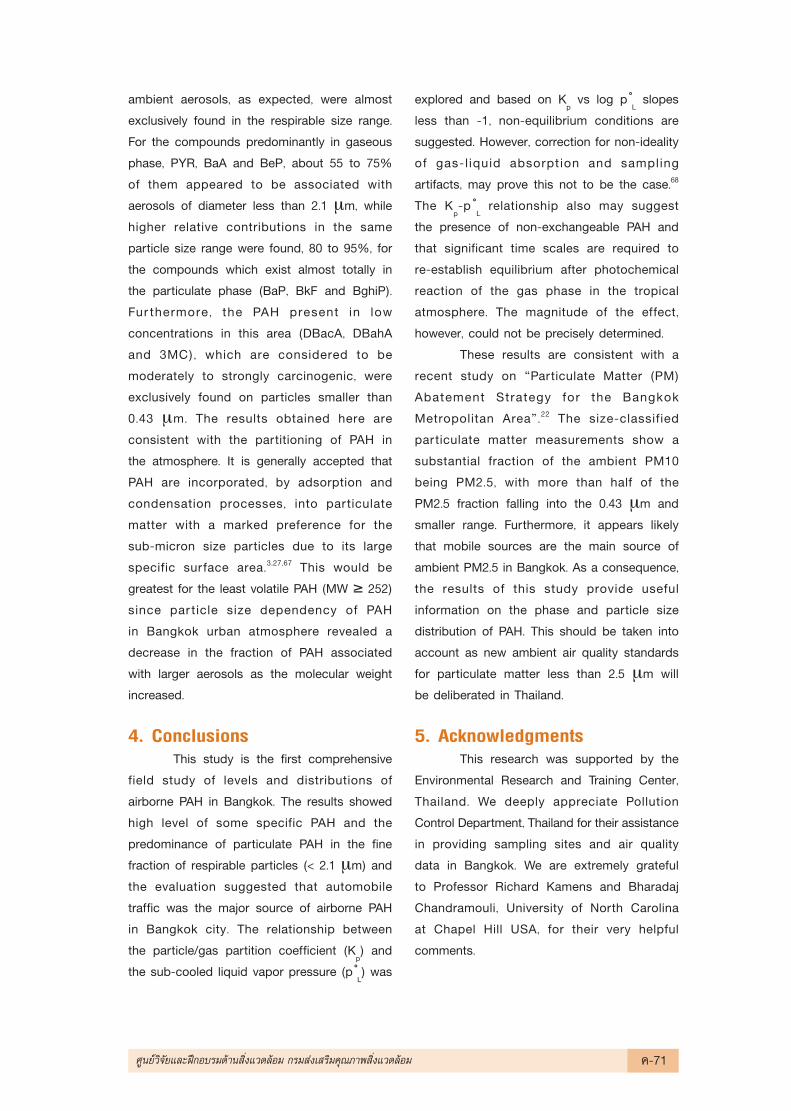
ambient aerosols, as expected, were almost
exclusively found in the respirable size range.
For the compounds predominantly in gaseous
phase, PYR, BaA and BeP, about 55 to 75%
of them appeared to be associated with
aerosols of diameter less than 2.1 µm, while
higher relative contributions in the same
particle size range were found, 80 to 95%, for
the compounds which exist almost totally in
the particulate phase (BaP, BkF and BghiP).
Fur thermore, the PAH present in low
concentrations in this area (DBacA, DBahA
and 3MC), which are considered to be
moderately to strongly carcinogenic, were
exclusively found on particles smaller than
0.43 µm. The results obtained here are
consistent with the partitioning of PAH in
the atmosphere. It is generally accepted that
PAH are incorporated, by adsorption and
condensation processes, into particulate
matter with a marked preference for the
sub-micron size particles due to its large
specific surface area.3,27,67 This would be
greatest for the least volatile PAH (MW ≥ 252)
since par ticle size dependency of PAH
in Bangkok urban atmosphere revealed a
decrease in the fraction of PAH associated
with larger aerosols as the molecular weight
increased.
4. ConclusionsThis study is the first comprehensive
field study of levels and distributions of
airborne PAH in Bangkok. The results showed
high level of some specific PAH and the
predominance of particulate PAH in the fine
fraction of respirable particles (< 2.1 µm) and
the evaluation suggested that automobile
traffic was the major source of airborne PAH
in Bangkok city. The relationship between
the particle/gas partition coefficient (Kp) and
the sub-cooled liquid vapor pressure (p ÌL) was
explored and based on Kp vs log p Ì
L slopes
less than -1, non-equilibrium conditions are
suggested. However, correction for non-ideality
of gas-l iquid absorption and sampling
artifacts, may prove this not to be the case.68
The Kp-p Ì
L relationship also may suggest
the presence of non-exchangeable PAH and
that significant time scales are required to
re-establish equilibrium after photochemical
reaction of the gas phase in the tropical
atmosphere. The magnitude of the effect,
however, could not be precisely determined.
These results are consistent with a
recent study on çParticulate Matter (PM)
Abatement Strategy for the Bangkok
Metropolitan Areaé.22 The size-classified
particulate matter measurements show a
substantial fraction of the ambient PM10
being PM2.5, with more than half of the
PM2.5 fraction falling into the 0.43 µm and
smaller range. Furthermore, it appears likely
that mobile sources are the main source of
ambient PM2.5 in Bangkok. As a consequence,
the results of this study provide useful
information on the phase and particle size
distribution of PAH. This should be taken into
account as new ambient air quality standards
for particulate matter less than 2.5 µm will
be deliberated in Thailand.
5. AcknowledgmentsThis research was supported by the
Environmental Research and Training Center,
Thailand. We deeply appreciate Pollution
Control Department, Thailand for their assistance
in providing sampling sites and air quality
data in Bangkok. We are extremely grateful
to Professor Richard Kamens and Bharadaj
Chandramouli, University of North Carolina
at Chapel Hill USA, for their very helpful
comments.
»Ÿπ¬å«‘®—¬·≈–Ωñ°Õ∫√¡¥â“π ‘Ëß·«¥≈âÕ¡ °√¡ à߇ √‘¡§ÿ≥¿“æ ‘Ëß·«¥≈âÕ¡ §-71
6. References1. T. Nielsen, (1996), Atmos. Environ., 30, pp.
3481.
2. Y. Mamane, (1990), Atmos. Environ., 24A,
pp. 127.
3. R. Westerholm, U. Stenberg and T. Alsberg,
(1988), Atmos. Environ., 22, pp. 1005.
4. P.S. Pedersen, J. Ingwersen, T. Nielsen and
E. Larsen, (1980), Environ. Sci. Technol., 14,
pp. 71.
5. International Agency for research in cancer
(IARC), (1983), In Part 1, IARC, 32, Lyon,
France.
6. L. Van Vaeck, K. Van Cauwenberghe and J.
Janssens, (1984), Atmos. Environ., 18, pp.
417.
7. K. Nikolaou, P. Masclet and G. Mouvier,
(1984), Sci. Total Environ., 32, pp. 103.
8. J. M. Daisey and P. J. Lioy, (1981), JAPCA,
31, pp. 567.
9. M. Kertesz-Saringer and Z. Morlin, (1975),
Atmos. Environ., 9, pp. 831.
10. R. H. Lin, C. R. Wang and C. S. Li, (1994),
Environ. Int., 20, pp. 161.
11. D. Grosjean, K. Fung and J. Harrison, (1983),
Environ Sci. Technol.,17, pp. 673.
12. R.M. Kamens, F. Zhi-Hua, Y. Yao, D. Chen,
S. Chen and M. Vartiainen, (1994) Chemo-
sphere, 28, pp. 1623.
13. P. Pistikopoulos, H. M. Wortham, L. Gomes,
S. Masclet-Beyne, E. Bon Nguyen, P. A.
Masclet and G. Mouvier, (1990), Atmos.
Environ., 24A, pp. 2573.
14. C. Venkataraman, J. M. Lyons and S. K.
Friedlander, (1994), Environ. Sci. Technol.,
28, pp. 555.
15. D. L. Poster, R. M. Hoff and J. E. Baker,
(1995), Environ. Sci. Technol., 29, pp. 1990.
16. H. L. Sheu, W. J. Lee, S.J. Lin, G. C. Fang,
H. C. Chang and W. C. You, (1997), Environ.
Poll., 96, pp. 369.
17. J. O. Allen, N. M. Dookeran, K. A. Smith, A.
F. Sarofim, K. Taghizadeh and A. L. Lafleur,
(1996), Environ. Sci. Technol., 30, pp.1023.
18. R. M. Harrison, D. J. T. Smith and L. Luhana,
(1996), Environ. Sci. Technol., 30, pp. 825.
19. J. Schnelle, T. Jansch, K. Wolf, I. Gebefugi
and A. Kettrup, (1995), Chemosphere, 31,
pp. 3119.
20. C. Venkataraman, S. Thomas and P. Kulkarni,
(1999), J. Aerosol Sci., 30, pp. 759.
21. B. C. Panther, M. A. Hooper and N. J.
Tapper, (1999), Atmos. Environ., 33, pp.
4087.
22. Pollution Control Department, (1998), PM
Abatement Strategy for the Bangkok
Metropolitan Area, Final Report Volume 1,
Ministry of Science, Technology and
Environment, Thailand.
23. International Agency for research in cancer
(IARC), (1993), IARC, 16, Lyon, France.
24. S. O. Baek, R. A. Field M. E. Goldstone, P.
W. Kirk J. N. Lester and R. Perry, (1991),
Water, Air and Soil Poll., 60, pp. 279.
25. H. Garivait, C. Polprasert, K. Yoshizumi and
L. Baetz Reutergardh, (1999), Polycyclic
Aromatic Compounds, 13, pp. 313.
26. D. A. Lungren and H. J. Paulus, (1975),
JAPCA, 25, pp. 1227.
27. S. O. Baek, M. E. Goldstone, P. W. W.
Kirk, J. N. Lester and R. Perry, (1991),
Chemosphere, 22, pp. 503.
28. R. M. Burton, H. H. Suh and P. koutrakis,
(1996), Environ. Sci. Technol., 30, pp. 400.
29. M. Aceves and J. O. Grimalt, (1993), Environ.
Sci. Technol., 27, pp. 2896.
30. T. G. Dzubay, R. K. Stevens, G. E. Gordon,
A. E. Sheffield and W. J. Courney, (1988),
Environ. Sci. Technol., 22, pp. 46.
31. L. Van Vaeck and K. Van Cauwenberghe,
(1985), Environ. Sci. Technol., 19, pp. 707.
32. L. Van Vaeck and K. Van Cauwenberghe,
(1978), Atmos. Environ., 12, pp. 2229.
33. K. G. Furton and G. Pentzke, (1992),
Polycyclic Aromatic Hydrocarbons, ISBN:
0-8247-0145-3.
34. E. Menichini, (1992), Sci. Total Environ., 116,
pp. 109.
§-72 »Ÿπ¬å«‘®—¬·≈–Ωñ°Õ∫√¡¥â“π ‘Ëß·«¥≈âÕ¡ °√¡ à߇ √‘¡§ÿ≥¿“æ ‘Ëß·«¥≈âÕ¡
35. R. M. Kamens, H. Karam, J. Guo, J. M. Perry
and L. Stockburger, (1989), Environ. Sci.
Technol., 23, pp. 801.
36. R. M. Kamens, Z. Guo, J. N. Fulcher and D.
A. Bell, (1988), Environ. Sci. Technol., 22, pp.
103.
37. P. Masclet, G. Mouvier and K. Nikolaou,
(1986), Atmos. Environ., 20, pp. 439.
38. H. Matsushita, K. Ching-Tang, M. Tabucanon
and S. Kootatep, (1986), Proceedings of
the third Joint Coference of Air Pollution
Studies in Asian Areas,Tokyo, Japan.
39. M. Katz and C. Chan, (1980), Environ. Sci.
Technol., 14, pp. 838.
40. C. Rossi, P. Poli, A. Buschini, F. Cassoni
and E. DeMunari, (1995), Chemosphere, 30,
pp. 1829.
41. W. E. Cotham and T. F. Bidleman, (1995),
Environ. Sci. Technol., 29, pp. 2782.
42. C. J. Halsall, P. J. Coleman, B. J. Davis, V.
Burnett, K. S. Waterhouse, P. Harding-Jones
and K. C. Jones, (1994), Environ. Sci. Technol.,
28, pp. 2380.
43. G. Dorr, M. Hippelein, H. Kaupp and O.
Hutzinger, (1996), Chemosphere, 33, pp.
1569.
44. J. M. Daisey, J. L. Cheney and P. J. Lioy,
(1986), JAPCA, 36, pp. 17.
45. A. H. Miguel, T. W. Kirchstetter and R. A.
Harley, (1998), Environ. Sci. Technol., 32, pp.
450.
46. C. K. Li and R. M. Kamens, (1993), Atmos.
Environ., 27A, pp. 523.
47. A. Greenberg, J. W. Bozzelli, F. Cannova, E.
Forstner, P. Giorgio and D. Stout, (1981),
Environ. Sci. Technol., 17, pp. 895.
48. M. R. Strommen and R. M. Kamens, (1997),
Environ. Sci. Technol., 31, pp. 2983.
49. J. F. Pankow and T. F. Bidleman, (1991),
Atmos. Environ., 25A, pp. 2241.
50. T. F. Bidleman, W. N. Billings and W. T.
Foreman, (1986), Environ. Sci. Technol., 20,
pp. 1038.
51. G. A. Eiceman and V. J. Vandiver, (1983),
Atmos. Environ., 17, pp. 461.
52. H. Yamasaki, K. Kuwata and H. Miyamoto,
(1982), Environ. Sci. Technol., 16, pp. 189.
53. J. F. Pankow, (1991), Atmos. Environ., 25A,
pp. 2239.
54. J. F. Pankow, (1987), Atmos. Environ., 21,
pp. 2275.
55. H. Yamasaki, K. Kuwata and Y. Kuce, (1984),
The Chemical Society of Japan, 8, pp. 1324.
56. M. F. Simcik, T. P. Franz, H. Zhang and S. J.
Eisenreich, (1998), Environ. Sci. Technol.,
32, pp. 251.
57. W. T. Foreman and T. F. Bidleman, (1990),
Atmos. Environ., 24A, pp. 2405.
58. M. P. Ligocki and J. F. Pankow, (1989),
Environ. Sci. Technol., 23, pp. 75.
59. S. R. McDow, Q. Sun, M. Vartiainen, Y. Hong,
Y. Yao, T. Fister, R. Yao and R. M. Kamens,
(1994), Environ. Sci. Technol., 28, pp. 2147.
60. K. Yoshizumi, Y. Ishibashi, H. Garivait, M.
Paranamara, K. Suksomsunk and M.
S. Tabucanon, (1996), Environ. Technol., 17,
pp. 777.
61. K. E. Gustafson and R. M. Dickhut, (1997),
Environ Sci. Technol., 31, pp. 140.
62. K. M. Hart and J. F. Pankow, (1994), Environ.
Sci. Technol., 28, pp. 655.
63. X. Zhang and P. H. McMurry, (1991), Environ.
Sci. Technol., 25, pp. 456.
64. S. R. McDow, M. Jang, Y. Hong and R. M.
Kamens, (1996), J. Geophys. Res.,101 (19),
pp.593.
65. M. Jang and R. M. Kamens, (1998), Environ.
Sci. Technol., 32, pp. 1237.
66. L. van Vaeck, G. Broddin and K. Van
cauwenberghe, (1979), Environ. Sci. Technol.,
13, pp. 1494.
67. C. Venkataraman and S. K. Friedlander,
(1994), Environ Sci Technol., 28, pp. 563.
68. L. H. Lim, G. M. Currado, R. M. Harrison and
S. Harrad, (1999), Final Program Abstracts
of 17th International Symposium on Polycy-
clic Aromatic Compounds, 25-29 October
1999, Bordeaux, France.
»Ÿπ¬å«‘®—¬·≈–Ωñ°Õ∫√¡¥â“π ‘Ëß·«¥≈âÕ¡ °√¡ à߇ √‘¡§ÿ≥¿“æ ‘Ëß·«¥≈âÕ¡ §-73