
Wording of Final Conclusion Slide 1math.fau.edu/qian/course/sta2023/Note/L19-HT-mean.pdf · 8.3:...
15
Slide 1 Wording of Final Conclusion
Transcript of Wording of Final Conclusion Slide 1math.fau.edu/qian/course/sta2023/Note/L19-HT-mean.pdf · 8.3:...
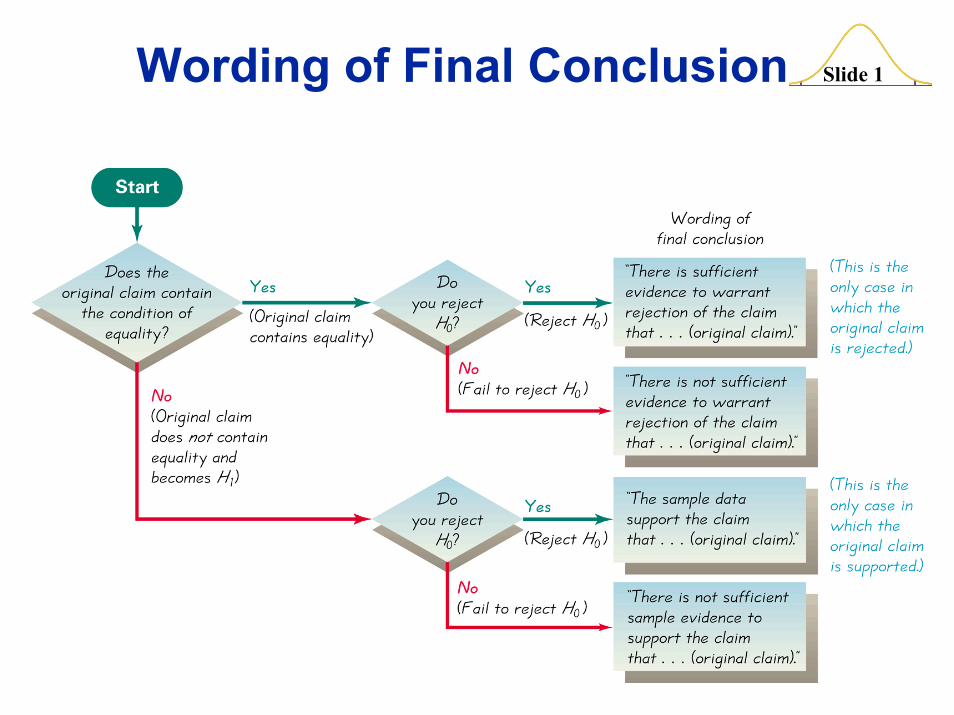
Slide 1Wording of Final Conclusion
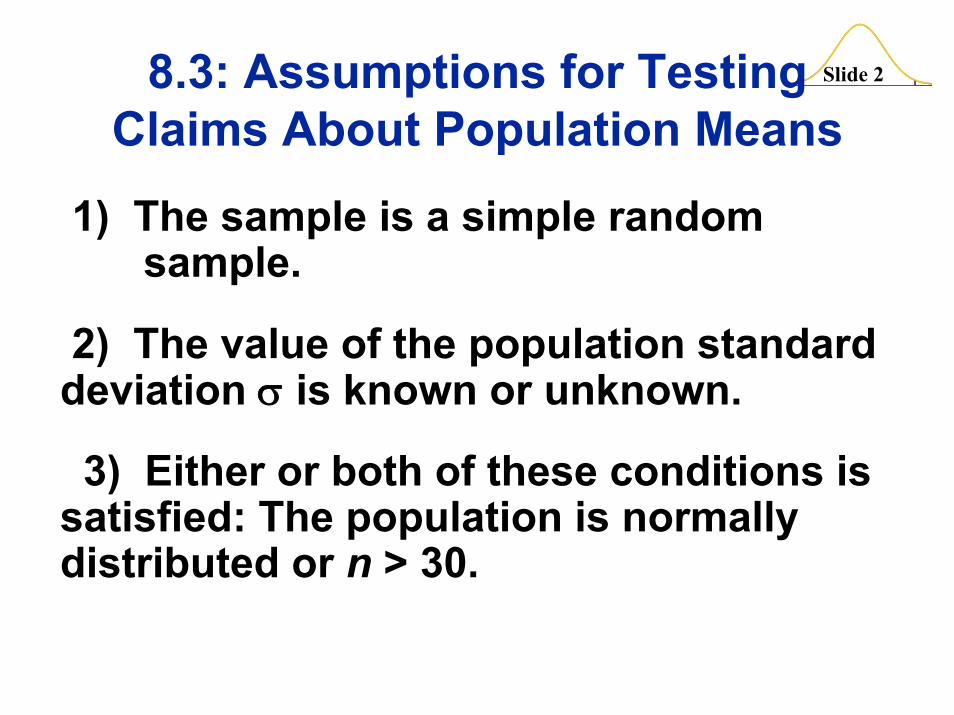
Slide 28.3: Assumptions for Testing Claims About Population Means
1) The sample is a simple random sample.
2) The value of the population standard deviation σ is known or unknown.
3) Either or both of these conditions is satisfied: The population is normally distributed or n > 30.
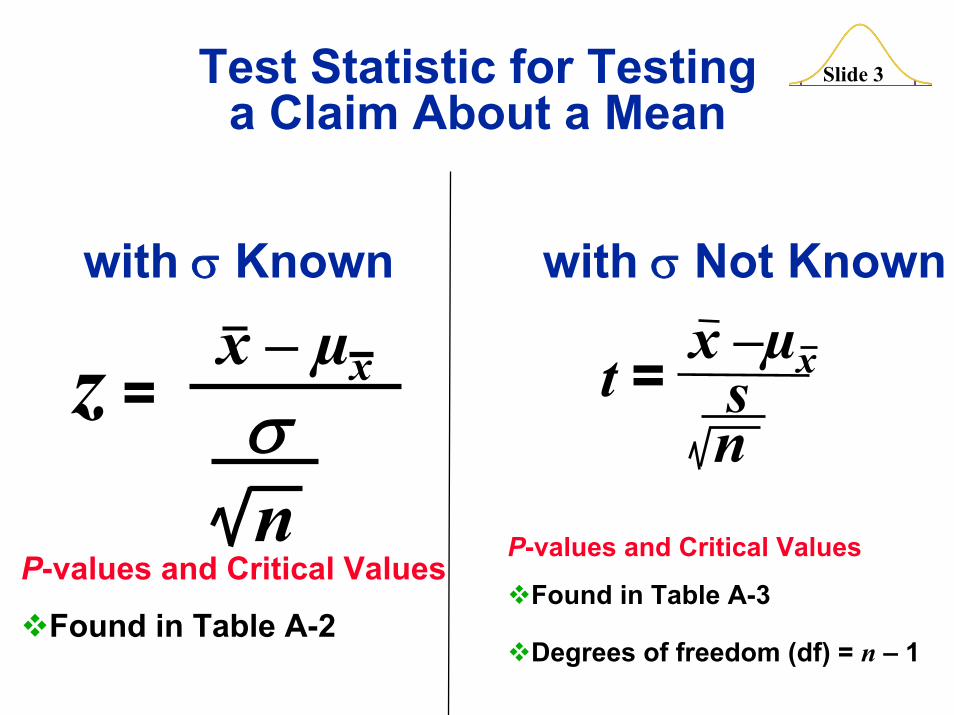
Slide 3Test Statistic for Testing a Claim About a Mean
n
x – µxz = σ
with σ Known with σ Not Known
t = x –µxsn
P-values and Critical Values
Found in Table A-3
Degrees of freedom (df) = n – 1
P-values and Critical Values
Found in Table A-2
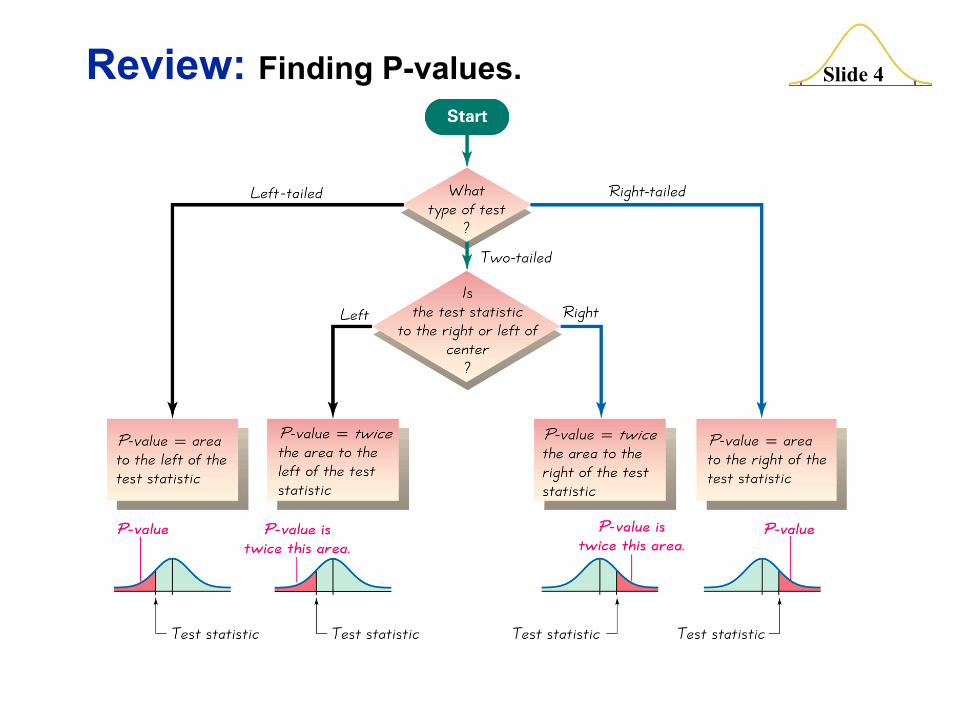
Slide 4Review: Finding P-values.
Slide 5
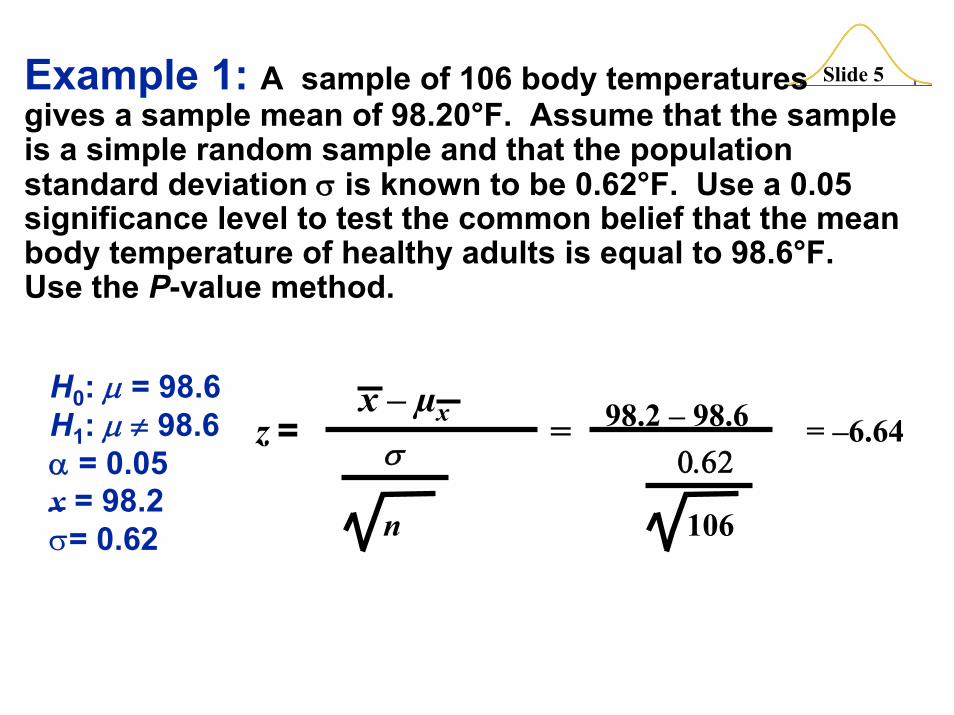
=z =x – µx
σ
n
98.2 – 98.6 = –6.640.62
106
Example 1: A sample of 106 body temperatures gives a sample mean of 98.20°F. Assume that the sample is a simple random sample and that the population standard deviation σ is known to be 0.62°F. Use a 0.05 significance level to test the common belief that the mean body temperature of healthy adults is equal to 98.6°F. Use the P-value method.
H0: μ = 98.6H1: μ ≠ 98.6α = 0.05x = 98.2σ= 0.62
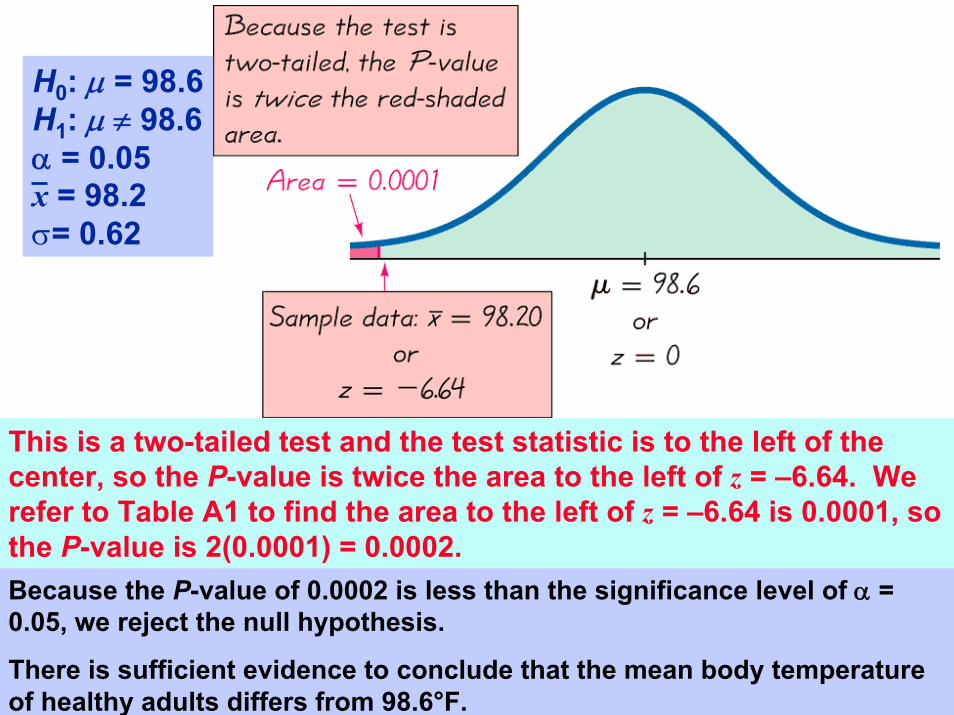
Slide 6H0: μ = 98.6H1: μ ≠ 98.6α = 0.05x = 98.2σ= 0.62
This is a two-tailed test and the test statistic is to the left of the center, so the P-value is twice the area to the left of z = –6.64. We refer to Table A1 to find the area to the left of z = –6.64 is 0.0001, so the P-value is 2(0.0001) = 0.0002.Because the P-value of 0.0002 is less than the significance level of α = 0.05, we reject the null hypothesis.
There is sufficient evidence to conclude that the mean body temperature of healthy adults differs from 98.6°F.
Slide 7
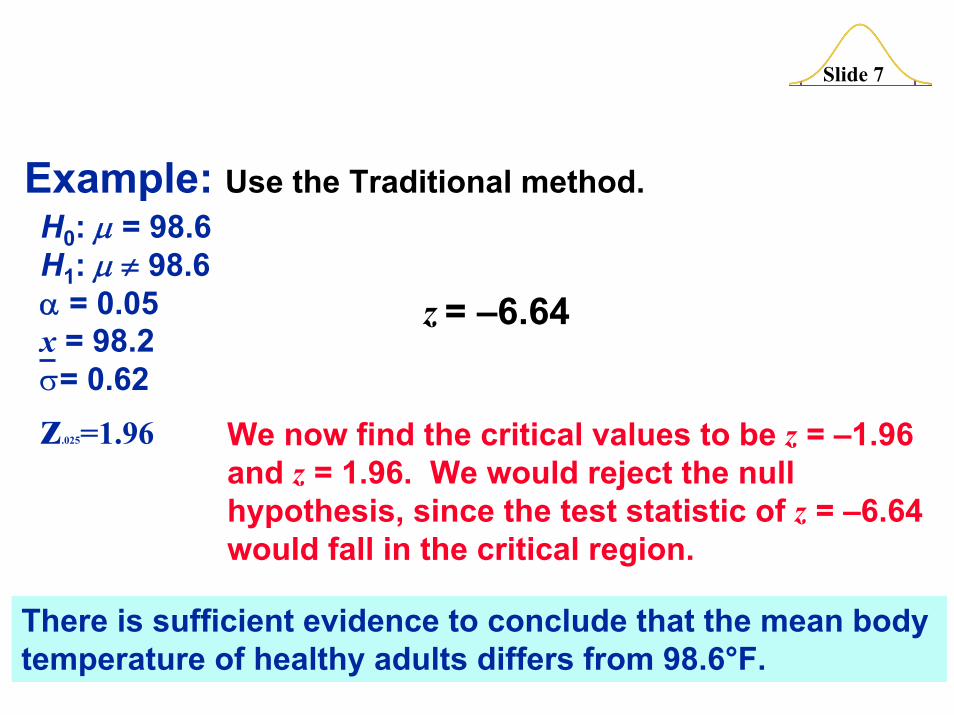
Example: Use the Traditional method.H0: μ = 98.6H1: μ ≠ 98.6α = 0.05x = 98.2σ= 0.62z.025=1.96
z = –6.64
We now find the critical values to be z = –1.96 and z = 1.96. We would reject the null hypothesis, since the test statistic of z = –6.64 would fall in the critical region.
There is sufficient evidence to conclude that the mean body temperature of healthy adults differs from 98.6°F.
Slide 8
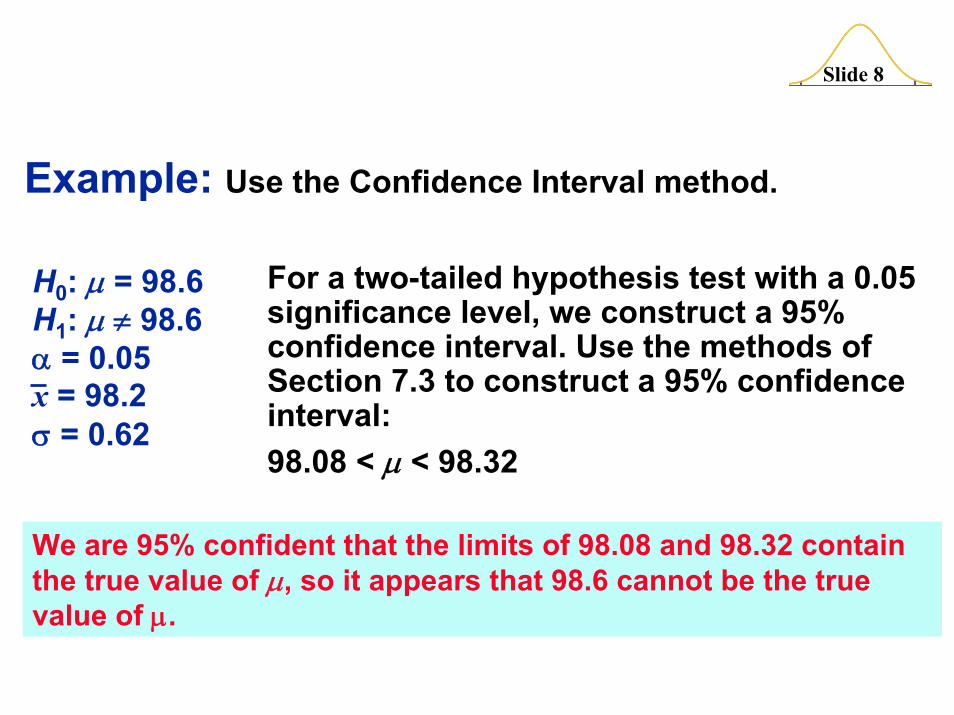
Example: Use the Confidence Interval method.
H0: μ = 98.6H1: μ ≠ 98.6α = 0.05x = 98.2σ = 0.62
For a two-tailed hypothesis test with a 0.05 significance level, we construct a 95% confidence interval. Use the methods of Section 7.3 to construct a 95% confidence interval:98.08 < μ < 98.32
We are 95% confident that the limits of 98.08 and 98.32 contain the true value of μ, so it appears that 98.6 cannot be the true value of μ.
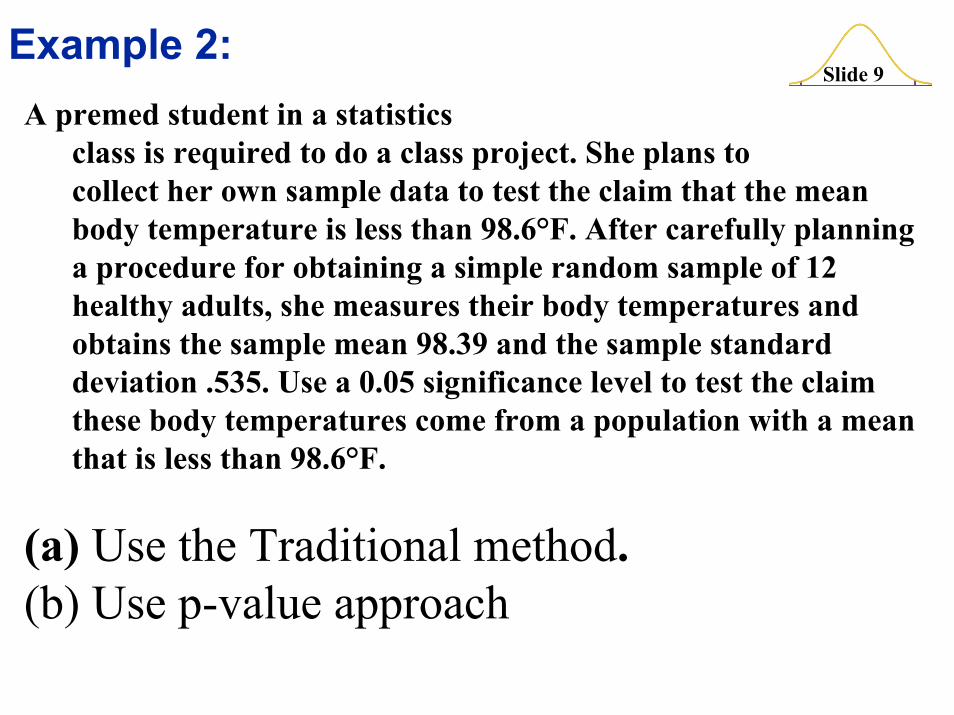
Slide 9Example 2: A premed student in a statistics
class is required to do a class project. She plans to collect her own sample data to test the claim that the mean body temperature is less than 98.6°F. After carefully planning a procedure for obtaining a simple random sample of 12 healthy adults, she measures their body temperatures and obtains the sample mean 98.39 and the sample standard deviation .535. Use a 0.05 significance level to test the claim these body temperatures come from a population with a mean that is less than 98.6°F.
(a) Use the Traditional method.(b) Use p-value approach
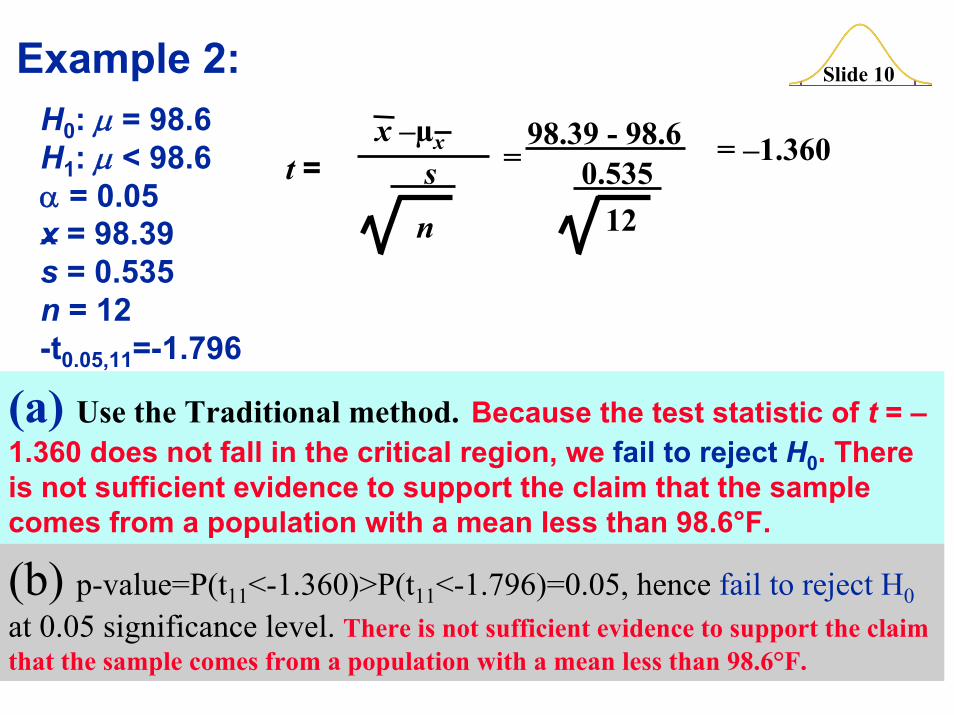
Slide 10Example 2:H0: μ = 98.6H1: μ < 98.6α = 0.05x = 98.39s = 0.535n = 12-t0.05,11=-1.796
= –1.360t =x –µx
s
n
=98.39 - 98.6
0.53512
(a) Use the Traditional method. Because the test statistic of t = –1.360 does not fall in the critical region, we fail to reject H0. There is not sufficient evidence to support the claim that the sample comes from a population with a mean less than 98.6°F.
(b) p-value=P(t11<-1.360)>P(t11<-1.796)=0.05, hence fail to reject H0at 0.05 significance level. There is not sufficient evidence to support the claim that the sample comes from a population with a mean less than 98.6°F.
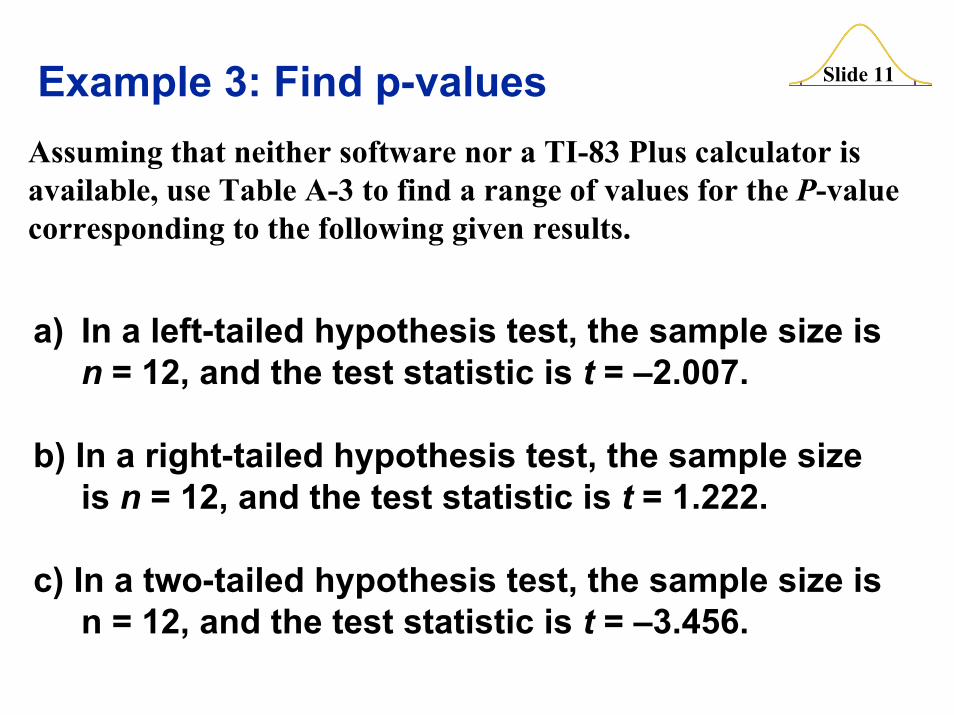
Slide 11Example 3: Find p-values
a) In a left-tailed hypothesis test, the sample size is n = 12, and the test statistic is t = –2.007.
b) In a right-tailed hypothesis test, the sample size is n = 12, and the test statistic is t = 1.222.
c) In a two-tailed hypothesis test, the sample size is n = 12, and the test statistic is t = –3.456.
Assuming that neither software nor a TI-83 Plus calculator is available, use Table A-3 to find a range of values for the P-value corresponding to the following given results.
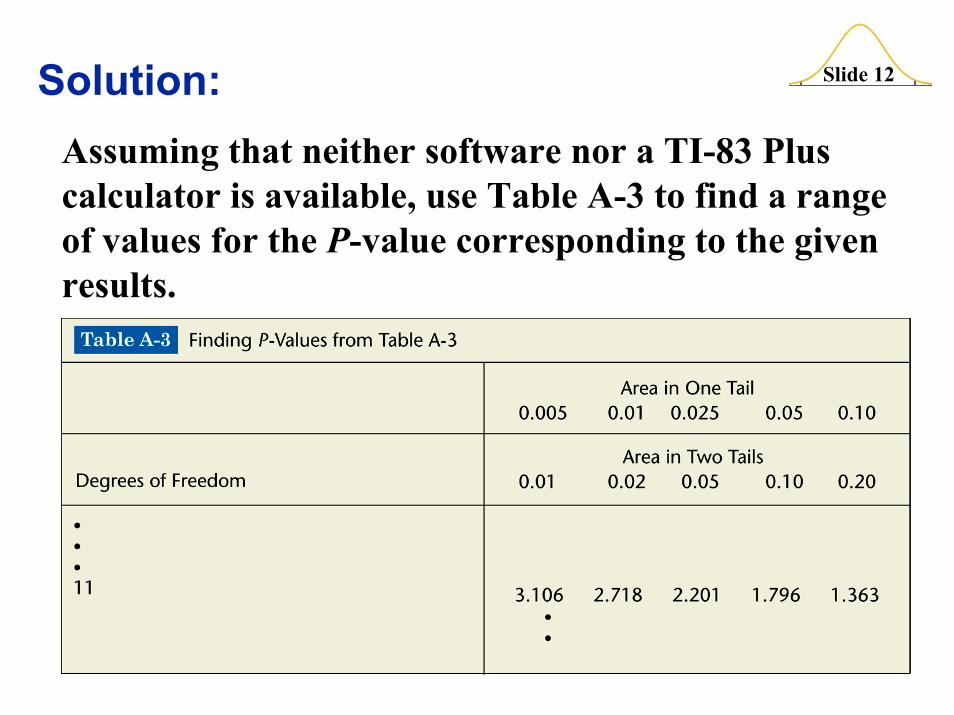
Slide 12Solution:Assuming that neither software nor a TI-83 Plus calculator is available, use Table A-3 to find a range of values for the P-value corresponding to the given results.
Slide 13
Solution (a):
a) The test is a left-tailed test with test statistic t = –2.007, so the P-value is the area to the left of –2.007. Because of the symmetry of the t distribution, that is the same as the area to the right of +2.007. Any test statistic between 2.201 and 1.796 has a right-tailed P-value that is between 0.025 and 0.05. We conclude that 0.025 < P-value < 0.05.
Slide 14
Solution (b):
b) The test is a right-tailed test with test statistic t = 1.222, so the P-value is the area to the right of 1.222. Any test statistic less than 1.363 has a right-tailed P-value that is greater than 0.10. We conclude that P-value > 0.10.
Slide 15
Solution (c):
c) The test is a two-tailed test with test statistic t = –3.456. The P-value is twice the area to the right of –3.456. Any test statistic greater than 3.106 has a two-tailed P-value that is less than 0.01. We conclude that P-value < 0.01.