water3
9
°“√„™â‡∑§π‘§‰Õ‚´‚∑ª‡æ◊ËÕµ‘¥µ“¡°“√‡ª≈’ˬπ·ª≈ߢÕß “√Õ‘π∑√’¬å√–‡À¬ „ππÈ”„µâ¥‘π„π∫√‘‡«≥π‘§¡Õÿµ “À°√√¡¿“§‡Àπ◊Õ ®—ßÀ«—¥≈”æŸπ Use of Isotope Techniques to Trace the Transformation of Volatile Organic Compounds in Polluted Ground Water in the Area of Northern Region Industrial Estate, Lampoon Province *»Ÿπ¬å«‘®—¬·≈–Ωñ°Õ∫√¡¥â“π ‘Ëß·«¥≈âÕ¡ °√¡ à߇ √‘¡§ÿ≥¿“æ ‘Ëß·«¥≈âÕ¡ ‡∑§‚π∏“π’ µ.§≈ÕßÀâ“ Õ.§≈ÕßÀ≈«ß ®.ª∑ÿ¡∏“π’ 12120 ‚∑√. 0-2577-1136 ‚∑√ “√. 0-2577-1138 Environmental Research and Training Center, Department of Environmental Quality Promotion. Technopolis. Klong 5 Klong Luang, Pathumthani 12120 e-mail: [email protected] Mr. Panja Yaithavorn*, Mr.Srihanart Charnnarong* ∫∑§—¥¬àÕ °“√»÷°…“«‘®—¬π’È°√–∑”‚¥¬°“√µ√«® Õ∫ °“√ªπ‡ªóôÕπ¢Õß “√Õ‘π∑√’¬å√–‡À¬ª√–‡¿∑‚∑≈ŸÕ’π ·≈– ‰µ√§≈Õ‚√‡Õ∏‘≈’π ´÷Ëßæ∫«à“ ¡’°“√ªπ‡ªóôÕπ¢Õß “√ ¥—ß°≈à“«„ππÈ”„µâ¥‘π ®”π«π 2 ‚√ßß“π ´÷Ë߉¥â∑”∫àÕ µ√«® Õ∫πÈ”„µâ¥‘π®”π«π 7 ∫àÕ ´÷ËßÕ¬Ÿà„π·≈–πÕ° ∫√‘‡«≥∑’Ë¡’°“√ªπ‡ªóôÕπ “√ ·≈–‡°Á∫µ—«Õ¬à“ßπÈ”„µâ¥‘π ®”π«π 3 µ—«Õ¬à“ß¡“∑”°“√µ√«®«‘‡§√“–Àå®”π«π ·∫§∑’‡√’¬ ®“°∫àÕ∑’Ë¡’°“√ªπ‡ªóôÕπ·≈–®“°πÈ”∑‘Èß æ∫«à“ µ—«Õ¬à“ß∑’Ë¡’°“√ªπ‡ªóôÕπ “√‰µ√§≈Õ‚√‡Õ∏‘≈’π ª√‘¡“≥ Ÿß®–¡’®”π«π·∫§∑’‡√’¬πâÕ¬ º≈°“√»÷°…“ ª√– ‘∑∏‘¿“æ¢Õß·∫§∑’‡√’¬„π°“√≈¥ª√‘¡“≥ ‰µ√§≈Õ‚√‡Õ∏‘≈’π ·≈–‚∑≈ŸÕ’π À≈—ß®“° 11 «—π æ∫«à“ πÈ”µ—«Õ¬à“ß 6 ∫àÕ “¡“√∂≈¥ª√‘¡“≥¢Õß‚∑≈ŸÕ’π‰¥â ·µà‰¡à “¡“√∂≈¥ª√‘¡“≥¢Õ߉µ√§≈Õ‚√‡Õ∏‘≈’π‰¥â √Ÿª· ¥ß·∫§∑’‡√’¬∑’˧—¥·¬°‰¥â®“°∏√√¡™“µ‘¡’√Ÿª√à“ß·∫∫·∑àß (rod shape) ‡ªìπæ«° gram positive √Ÿª· ¥ß·∫§∑’‡√’¬∑’˧—¥·¬°‰¥â ¡’√Ÿª√à“ß∑√ß°≈¡ (cocci shape) ‡ªìπæ«° gram negative
-
Upload
department-of-environmental-quality-promotion-thailand -
Category
Documents
-
view
212 -
download
0
description
∫ ∑§— ¥ ¬à Õ „ππÈ ” „µâ ¥ ‘ π „π∫√‘ ‡ «≥π‘ § ¡Õÿ µ “À°√√¡¿“§‡Àπ◊ Õ ®— ß À«— ¥ ≈”æŸ π √Ÿ ª · ¥ß·∫§∑’ ‡ √’ ¬ ∑’ Ë § — ¥ ·¬°‰¥â ¡’ √ Ÿ ª √à “ ß∑√ß°≈¡ (cocci shape) ‡ªì π æ«° gram negative
Transcript of water3
°“√„™â‡∑§π‘§‰Õ‚´‚∑ª‡æ◊ËÕµ‘¥µ“¡°“√‡ª≈’ˬπ·ª≈ߢÕß “√Õ‘π∑√’¬å√–‡À¬„ππÈ”„µâ¥‘π„π∫√‘‡«≥π‘§¡Õÿµ “À°√√¡¿“§‡Àπ◊Õ ®—ßÀ«—¥≈”æŸπUse of Isotope Techniques to Trace the Transformation of VolatileOrganic Compounds in Polluted Ground Water in the Area ofNorthern Region Industrial Estate, Lampoon Province
*»Ÿπ¬å«‘®—¬·≈–Ωñ°Õ∫√¡¥â“π ‘Ëß·«¥≈âÕ¡ °√¡ à߇ √‘¡§ÿ≥¿“æ ‘Ëß·«¥≈âÕ¡ ‡∑§‚π∏“π’ µ.§≈ÕßÀâ“ Õ.§≈ÕßÀ≈«ß ®.ª∑ÿ¡∏“π’ 12120 ‚∑√. 0-2577-1136 ‚∑√ “√. 0-2577-1138Environmental Research and Training Center, Department of Environmental Quality Promotion. Technopolis. Klong 5 Klong Luang, Pathumthani 12120 e-mail: [email protected]
Mr. Panja Yaithavorn*,Mr.Srihanart Charnnarong*
∫∑§—¥¬àÕ°“√»÷°…“«‘®—¬π’È°√–∑”‚¥¬°“√µ√«® Õ∫
°“√ªπ‡ªóôÕπ¢Õß “√Õ‘π∑√’¬å√–‡À¬ª√–‡¿∑‚∑≈ŸÕ’π ·≈–
‰µ√§≈Õ‚√‡Õ∏‘≈’π ´÷Ëßæ∫«à“ ¡’°“√ªπ‡ªóôÕπ¢Õß “√
¥—ß°≈à“«„ππÈ”„µâ¥‘π ®”π«π 2 ‚√ßß“π ´÷Ë߉¥â∑”∫àÕ
µ√«® Õ∫πÈ”„µâ¥‘π®”π«π 7 ∫àÕ ´÷ËßÕ¬Ÿà„π·≈–πÕ°
∫√‘‡«≥∑’Ë¡’°“√ªπ‡ªóôÕπ “√ ·≈–‡°Á∫µ—«Õ¬à“ßπÈ”„µâ¥‘π
®”π«π 3 µ—«Õ¬à“ß¡“∑”°“√µ√«®«‘‡§√“–Àå®”π«π
·∫§∑’‡√’¬ ®“°∫àÕ∑’Ë¡’°“√ªπ‡ªóôÕπ·≈–®“°πÈ”∑‘Èß
æ∫«à“ µ—«Õ¬à“ß∑’Ë¡’°“√ªπ‡ªóôÕπ “√‰µ√§≈Õ‚√‡Õ∏‘≈’π
ª√‘¡“≥ Ÿß®–¡’®”π«π·∫§∑’‡√’¬πâÕ¬ º≈°“√»÷°…“
ª√– ‘∑∏‘¿“æ¢Õß·∫§∑’ ‡√’ ¬ „π°“√≈¥ª√‘¡“≥
‰µ√§≈Õ‚√‡Õ∏‘≈’π ·≈–‚∑≈ŸÕ’π À≈—ß®“° 11 «—π æ∫«à“
πÈ”µ—«Õ¬à“ß 6 ∫àÕ “¡“√∂≈¥ª√‘¡“≥¢Õß‚∑≈ŸÕ’π‰¥â
·µà ‰¡à “¡“√∂≈¥ª√‘¡“≥¢Õ߉µ√§≈Õ‚√‡Õ∏‘≈’π‰¥â
√Ÿª· ¥ß·∫§∑’‡√’¬∑’˧—¥·¬°‰¥â®“°∏√√¡™“µ‘¡’√Ÿª√à“ß·∫∫·∑àß (rod shape) ‡ªìπæ«° gram positive
√Ÿª· ¥ß·∫§∑’‡√’¬∑’˧—¥·¬°‰¥â ¡’√Ÿª√à“ß∑√ß°≈¡(cocci shape) ‡ªìπæ«° gram negative
®“°°“√«‘‡§√“–Àå ‰Õ‚´‚∑ª¢Õߧ“√å∫Õπ-13 ·≈–
ÕÕ° ‘‡®π-18 ¢Õߧ“√å∫Õπ‰¥ÕÕ°‰´¥å„ππÈ” ™’È „Àâ
‡ÀÁπ«à“·∫§∑’‡√’¬„ππÈ”∑‘Èß·≈–πÈ”∫“¥“≈„™â·À≈àߢÕß
§“√å∫Õπ∑’Ë·µ°µà“ß°—π ·≈– √â“ß°ä“´§“√å∫Õπ‰¥-
ÕÕ°‰´¥åµà“ß™π‘¥°—π Õ¬à“߉√°Áµ“¡ ‰Õ‚´‚∑ª¢Õß
§“√å∫Õπ‰¥ÕÕ°‰´¥å∑’Ë≈–≈“¬πÈ”®“°∫àÕ∑’Ë¡’°“√ªπ‡ªóôÕπ
¢Õß “√‰µ√§≈Õ‚√‡Õ∏‘≈’π ·≈–‰¡à¡’°“√ªπ‡ªóôÕπ
“√‰µ√§≈Õ‚√‡Õ∏‘≈’π ‰¡à·µ°µà“ß°—π
ABSTRACTTwo factories were investigated to
be polluters of toluene and TCE in ground
water and 7 wells were installed inside and
outside TCE contaminated area. Two water
samples from TCE contaminated wells and
one from wastewater were measured bacterial
population. The result shows that samples
having higher TCE contamination have less
bacterial population. Bacteria in water samples
from 7 wells were tested for toluene and TCE
degradability. After 11 days of inoculation
samples from 6 wells shows ability in degrading
toluene but are not able in degrading TCE.
Measuring isotopic ratio of 13C and 18O of
the dissolved carbon dioxide indicated that
bacteria in waste water and ground water uses
dif ferent carbon sources and generates
isotopically different carbon dioxide. However
isotope ratio of dissolved carbon dioxide in
wells contaminated with and without TCE can
not be differentiated.
1. IntroductionBy the survey of Thailand Environ-
ment Inst i tute in 1998 on hazardous
chemicals used by industry, it was found
that volatile organic solvents has been
increasingly imported and intensively used by
industry in Thailand. The solvents, consisting
primarily of chlorinated aliphatic hydrocarbons
have been widely used as degreasing agents
of aircraft engines, automobile parts, electronic
components, and metal products. In many
cases the solvents are also used as raw
materials for producing electronic components.
After uses, the solvents are dirty and have
often been disposed into refuse sites, waste
pits and storage tanks and sometimes directly
on soil. Because of their relative low solubility
in water and their poor sorption to soil, they
tend to migrate downward through soil,
contaminating groundwater with which they
come into contact. By improper handling,
storage, disposal and lack of legislation
enforcement, it was estimated that the
chemicals have extensively contaminated soil
and groundwater of the country.
In 1998 Environmental Research
and Training Centre (ERTC) conducted a
survey to search in the area of Northern
Industrial Estate of Thailand for potential
contamination of the solvents in soil and
groundwater and found that organic solvents
used in the industrial complex such as
trichloroethylene (TCE), toluene, ethyl methyl
ketone etc. have already contaminated the
soil and shallow groundwater of the estate
at many locations. As shown by the cases of
developed countries, groundwater once
contaminated is not easy to clean up and
need long time and high cost for remediation.
Thailand like many developing countries
does not have technology to cope with the
problem. The research to search for appropriate
technology to remediate soil and ground water
has therefore been initiated.
In treating contaminated soil and
groundwater, many remediation techniques
have been employed. Among these are pump
and treat, soil venting, photooxidation etc.
These techniques need sophisticated and
expensive technology. However bioremediation
or using microorganisms to degrade or to
convert harmful contaminants to less harmful
species is one of attractive technology
because it is less expensive. In order for
these biodegradable processes to occur,
microorganisms require the presence of
¢-18 »Ÿπ¬å«‘®—¬·≈–Ωñ°Õ∫√¡¥â“π ‘Ëß·«¥≈âÕ¡ °√¡ à߇ √‘¡§ÿ≥¿“æ ‘Ëß·«¥≈âÕ¡
certain minerals, referred to as nutrients and
several other conditions i.e. oxidized-reduced
condit ion, temperature, pH etc. These
parameters can impact the effectiveness of
these processes.
This project is initiated to explore
microorganisms having capability in converting
toxic contaminants in the group of both
hydrocarbon and chlorinated hydrocarbon to
less toxic species and carbon dioxide which
is a final and nonharmful products in many
degradation pathways. Finally, the project is
intended to use isotope technique such as
measuring isotope ratio of 13C and 18O of
oxygen used and carbon dioxide generated
by bacteria to differentiate biodegradation
pathways and to measure degradation rate
of toluene (representative of aromatic hydro-
carbon) and TCE (representat ive of
chlorinated aliphatic hydrocarbon) at the
contaminated sites (Aggarwal et al, 1997).
In 1998 ERTC has conducted an
invest igat ion to search for potent ia l
contaminated sites by volat i le organic
compounds by selecting Northern Industrial
Estate in Lumphun province as a target. The
estate has been operated for 20 years to
run about 60 factories, most of them are
electronic appliance type production. The
survey was conducted by applying soil gas
method to find the possibility of contami-
nation of VOCs in soil in the estate area.
The method was done by drilling small holes
1 m. depth, 20x20 m grid spacing and
inserting absorbent tubes or detector tubes
into the holes, then soil vapor was withdrawn
through the tubes. By this method trace of
the organic compounds such as TCE, toluene
etc. contaminated in soil or groundwater was
trapped by the tubes. In case of detector
tube, the type of organic compounds and
content of soil vapor can be detected by
observing color development in the tubes.
In the other hand adsorbent tubes can be
read by a GC equipped with a thermal
desorption unit. By this method 2 factories
could be identified as TCE soil polluter while
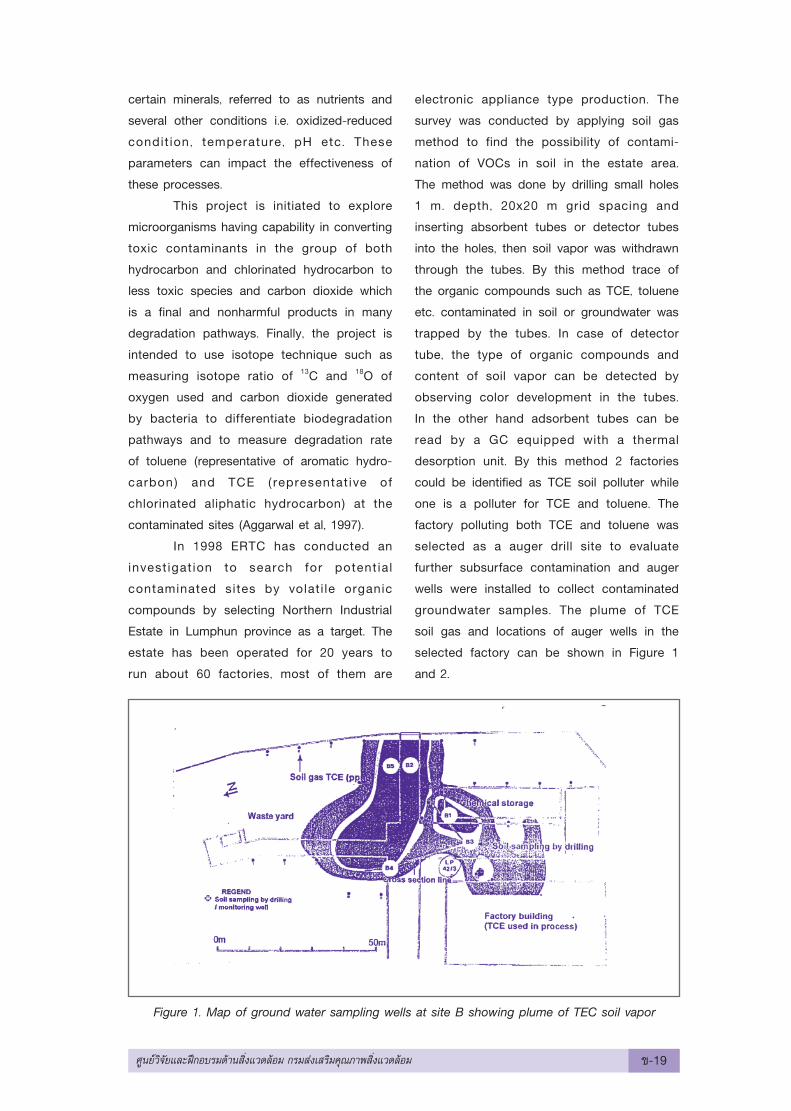
one is a polluter for TCE and toluene. The
factory polluting both TCE and toluene was
selected as a auger drill site to evaluate
further subsurface contamination and auger
wells were installed to collect contaminated
groundwater samples. The plume of TCE
soil gas and locations of auger wells in the
selected factory can be shown in Figure 1
and 2.
Figure 1. Map of ground water sampling wells at site B showing plume of TEC soil vapor
»Ÿπ¬å«‘®—¬·≈–Ωñ°Õ∫√¡¥â“π ‘Ëß·«¥≈âÕ¡ °√¡ à߇ √‘¡§ÿ≥¿“æ ‘Ëß·«¥≈âÕ¡ ¢-19
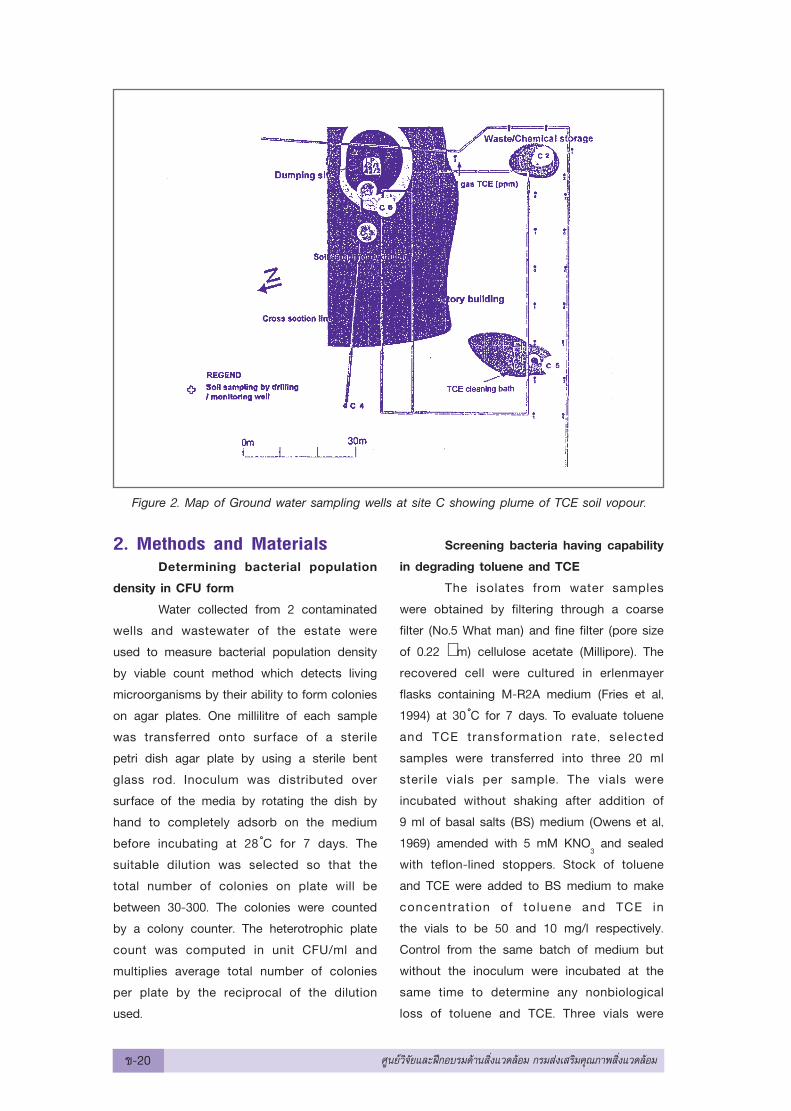
Figure 2. Map of Ground water sampling wells at site C showing plume of TCE soil vopour.
2. Methods and MaterialsDetermining bacterial population
density in CFU form
Water collected from 2 contaminated
wells and wastewater of the estate were
used to measure bacterial population density
by viable count method which detects living
microorganisms by their ability to form colonies
on agar plates. One millilitre of each sample
was transferred onto surface of a sterile
petri dish agar plate by using a sterile bent
glass rod. Inoculum was distributed over
surface of the media by rotating the dish by
hand to completely adsorb on the medium
before incubating at 28 ÌC for 7 days. The
suitable dilution was selected so that the
total number of colonies on plate will be
between 30-300. The colonies were counted
by a colony counter. The heterotrophic plate
count was computed in unit CFU/ml and
multiplies average total number of colonies
per plate by the reciprocal of the dilution
used.
Screening bacteria having capability
in degrading toluene and TCE
The isolates from water samples
were obtained by filtering through a coarse
filter (No.5 What man) and fine filter (pore size
of 0.22 µm) cellulose acetate (Millipore). The
recovered cell were cultured in erlenmayer
flasks containing M-R2A medium (Fries et al,
1994) at 30 ÌC for 7 days. To evaluate toluene
and TCE transformation rate, selected
samples were transferred into three 20 ml
sterile vials per sample. The vials were
incubated without shaking after addition of
9 ml of basal salts (BS) medium (Owens et al,
1969) amended with 5 mM KNO3 and sealed
with teflon-lined stoppers. Stock of toluene
and TCE were added to BS medium to make
concentrat ion of toluene and TCE in
the vials to be 50 and 10 mg/l respectively.
Control from the same batch of medium but
without the inoculum were incubated at the
same time to determine any nonbiological
loss of toluene and TCE. Three vials were
¢-20 »Ÿπ¬å«‘®—¬·≈–Ωñ°Õ∫√¡¥â“π ‘Ëß·«¥≈âÕ¡ °√¡ à߇ √‘¡§ÿ≥¿“æ ‘Ëß·«¥≈âÕ¡
sacrificed at each sampling time of 0, 1, 2, 3,
6, 11, 17 and 20 days by adding 10 M HCl.
The vials were frozen at 4 ÌC for analysis of
toluene and TCE concentrations. Toluene
and TCE were equilibrated at 30 ÌC and
measured by headspace analysis with a gas
chromatograph equipped with photoionization
detector and an ultra alloy stainless steel
capillary column (UAC-504-30V-3.0F). The
GC column was set at 80 ÌC and injector
and detector at 110 ÌC. Nitrogen was used as
the carrier gas. All reported data on toluene
and TCE degradation rate were averaged by
three replications.
Study toluene and TCE degradation
pathways of bacteria by applying isotope
technique
Eight samples were collected from
wells, 4 from contaminated and other 4
from uncontaminated wells. They were fixed
and sent to the laboratory of International
Atomic Energy Agency for performing 13C and18O analysis in carbon dioxide gas dissolved
in the water sample. The ratio of these 2 stable
isotopes will be used to differentiate the
pathways of organic compound transfor-
mation.
3. Results and DiscussionsCultivation of microbes and counting
population density in CFU form
The population of bacteria from B-1,
B-5 and waste water were counted on plate
is show in table 1. From the table population
density of bacteria in wastewater is higher
than B-1 and B-5 because wastewater
contains many types of organic compounds
which can be used by many types of bacteria
as carbon sources while samples from B-1 and
B-5 wells might have less amount of carbon
sources. Comparing between B-1 and B-5
samples, B-1 has less abundance of bacteria
because B-1 well is located closer to the hot
spot of toluene and TCE contamination.
The higher concentration of the compounds
will get rid of general bacteria that cannot
use the compounds as carbon source or both
compounds might be toxic to them. Therefore
indigenous bacteria that will be able to
transformed both toluene and TCE is limited.
The tolerated species will be used in the
toluene and TCE degradation study.
Table 1. Population density of bacteria by
heterotrophic plate count
Sample CFU/ml
B-1 29 X 104
B-5 139 X 105
WA 151 X 107
Testing degrading capability of
microbes on toluene and TCE
Degradation of toluene and TCE
by bacteria collected from well B-1, well
BH 1, well BH 2, well BH 3, well AIWA, and well
LP 3 are shown in Fig 3, 4, 5 and 6
respectively. With 50 and 10 mg/l of toluene
and TCE at starting concentration, degradation
rate of the 2 compounds by bacteria seems
to be not to much different from control.
However the degradation of toluene by
bacteria from well B-1, well LP 3, well AIWA,
well BH 1, well BH 2, well BH 3 and the
waste water are significantly different from
control after 11 days from inoculation. This
might be because of in the first period,
bacterial population are not enough to
degrade toluene. After 11 days bacteria from
isolates well LP3, well Bl, well BHl, well BH2
can decrease toluene 23-29% comparing to
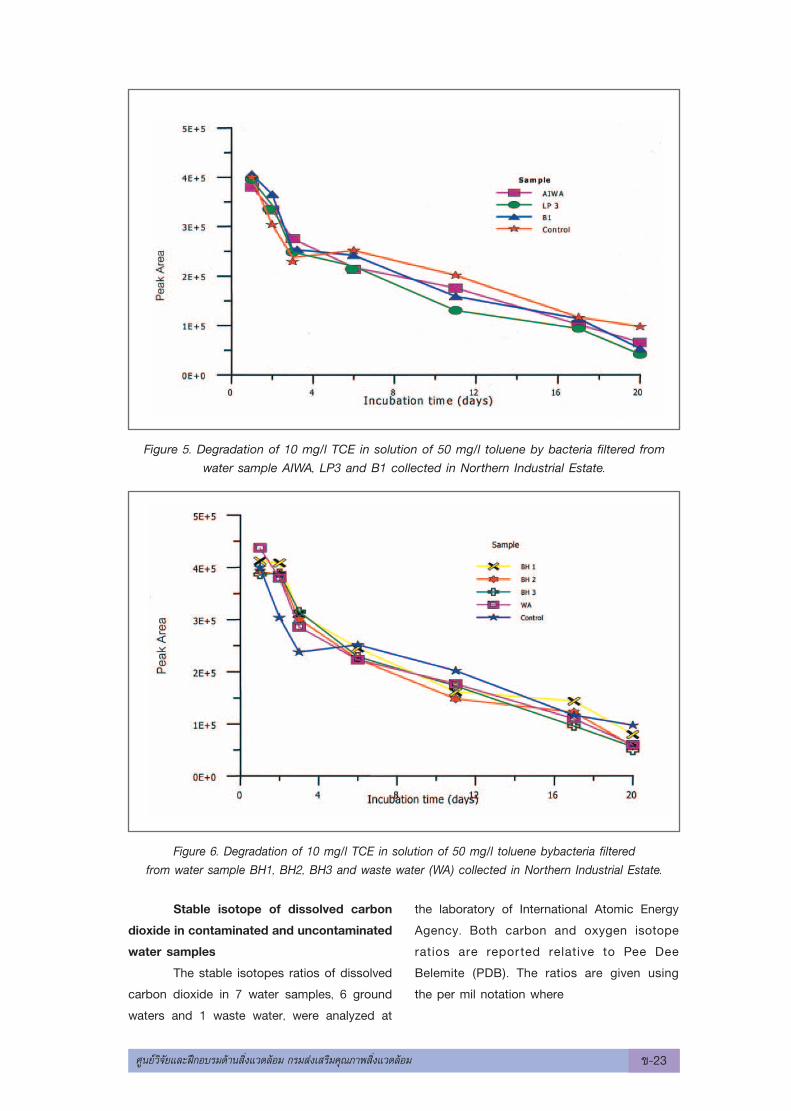
control, while bacteria from well BH3, well
AIWA and the waste water can decrease
TCE 12-14% and bacteria from well LP3,
well Bl, BHl and BH2 can decrease TCE 20-
35% if these bacteria are cultured in media
containing toluene.
The transformation of toluene and
TCE is supposed to be either anaerobic or
»Ÿπ¬å«‘®—¬·≈–Ωñ°Õ∫√¡¥â“π ‘Ëß·«¥≈âÕ¡ °√¡ à߇ √‘¡§ÿ≥¿“æ ‘Ëß·«¥≈âÕ¡ ¢-21
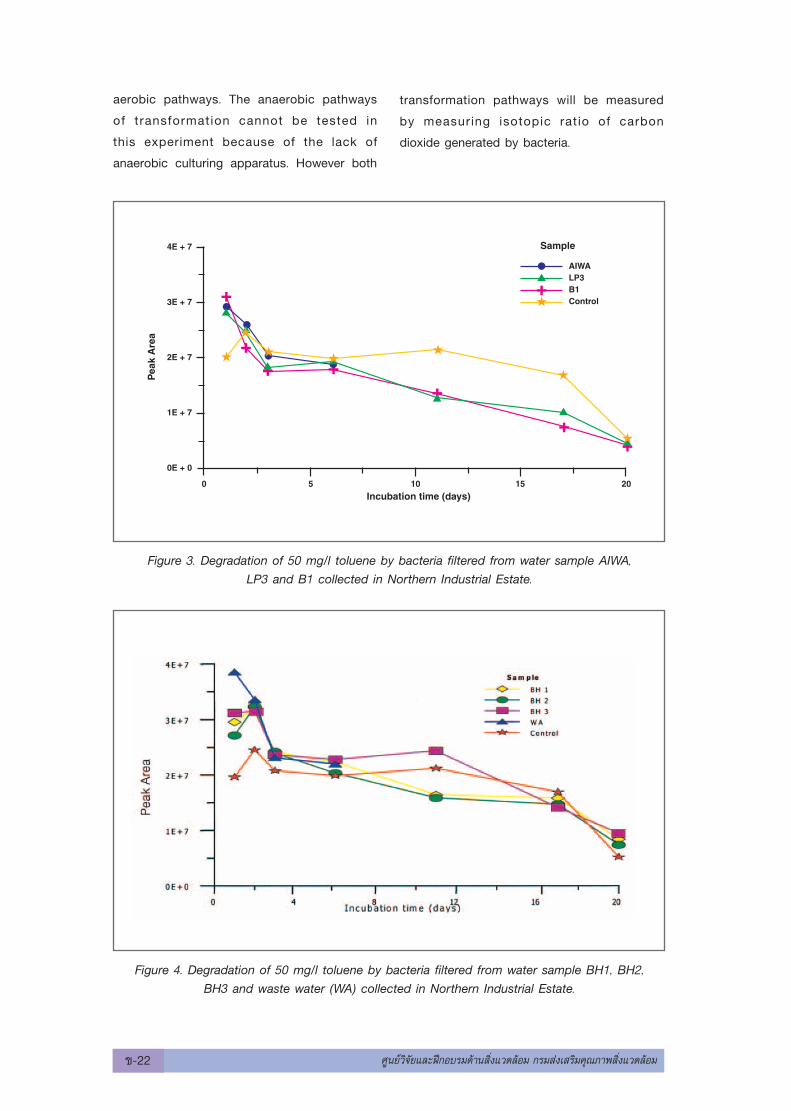
aerobic pathways. The anaerobic pathways
of transformation cannot be tested in
this experiment because of the lack of
anaerobic culturing apparatus. However both
Figure 3. Degradation of 50 mg/l toluene by bacteria filtered from water sample AIWA,LP3 and B1 collected in Northern Industrial Estate.
transformation pathways will be measured
by measuring isotopic ratio of carbon
dioxide generated by bacteria.
Figure 4. Degradation of 50 mg/l toluene by bacteria filtered from water sample BH1, BH2,BH3 and waste water (WA) collected in Northern Industrial Estate.
¢-22 »Ÿπ¬å«‘®—¬·≈–Ωñ°Õ∫√¡¥â“π ‘Ëß·«¥≈âÕ¡ °√¡ à߇ √‘¡§ÿ≥¿“æ ‘Ëß·«¥≈âÕ¡
Stable isotope of dissolved carbon
dioxide in contaminated and uncontaminated
water samples
The stable isotopes ratios of dissolved
carbon dioxide in 7 water samples, 6 ground
waters and 1 waste water, were analyzed at
the laboratory of International Atomic Energy
Agency. Both carbon and oxygen isotope
ratios are reported relative to Pee Dee
Belemite (PDB). The ratios are given using
the per mil notation where
Figure 5. Degradation of 10 mg/l TCE in solution of 50 mg/l toluene by bacteria filtered fromwater sample AIWA, LP3 and B1 collected in Northern Industrial Estate.
Figure 6. Degradation of 10 mg/l TCE in solution of 50 mg/l toluene bybacteria filteredfrom water sample BH1, BH2, BH3 and waste water (WA) collected in Northern Industrial Estate.
»Ÿπ¬å«‘®—¬·≈–Ωñ°Õ∫√¡¥â“π ‘Ëß·«¥≈âÕ¡ °√¡ à߇ √‘¡§ÿ≥¿“æ ‘Ëß·«¥≈âÕ¡ ¢-23
δ13C = [(13C/12C) sample
- (13C/12C)PDB
] X 1000
(13C/12C)PDB
δ18O = [(18O/16O) sample
- (18O/16O)PDB
] X 1000
(18O/16O)PDB
The carbon isotope ratio of δ13C of
3 uncontaminated and 4 contaminated
ground waters is in the range of -13.31
to -16.24 and -12.76 to -20.32 .
respectively. It looks like contaminated
ground water are slightly more depleted
in δ13C than the uncontaminated ones.
However the dif ferences are not clear.
If the sample from well AIWA is not included
in the comparison, the range of δ13C ratio
of the two groups are same. Landmeyer
et.al. (1996) found that the carbon isotope
signature of uncontaminated aquifer is
-24.6 . This indicates active respiration of
bacteria, fungi and plants in temperate
climates. And the atmospheric carbon dioxide
is - 8.5 . Our data of isotope ratio of δ13C
in groundwater are in the range which
indicated that dissolved carbon dioxide
in ground water collected from our wells is
from the mixing of carbon dioxide generated
from activity of bacteria decomposing plant
material and carbon dioxide from atmosphere.
Because of no difference between isotopic
signature of dissolved carbon dioxide in
contaminated and uncontaminated wells,
the special signature of carbon dioxide from
TCE degradation is not significantly different
from other sources of bacterial respiration.
The intrinsic degradation of TCE in the
sites occurs by anaerobic pathway which
is confirmed by anaerobic degraded products
such as 1,2-cis-dichloroethylene and vinyl
chloride found in well AIWA, Bl (a), Bl (b), and
LP3.
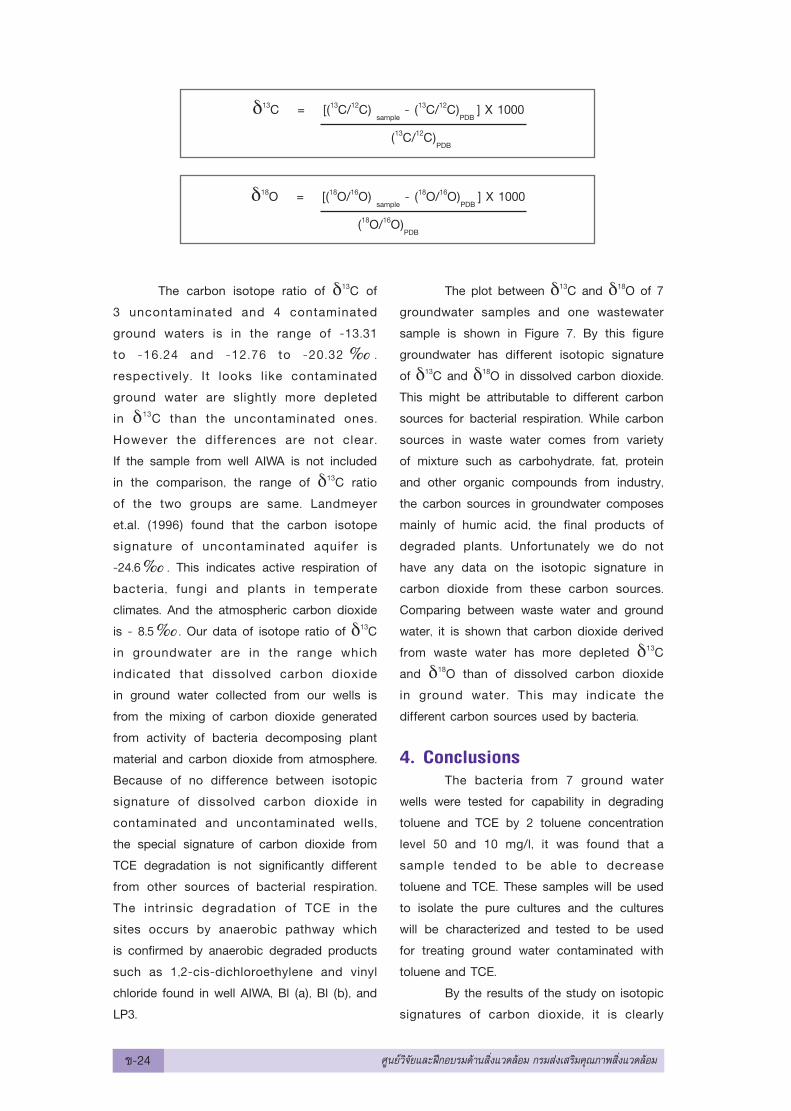
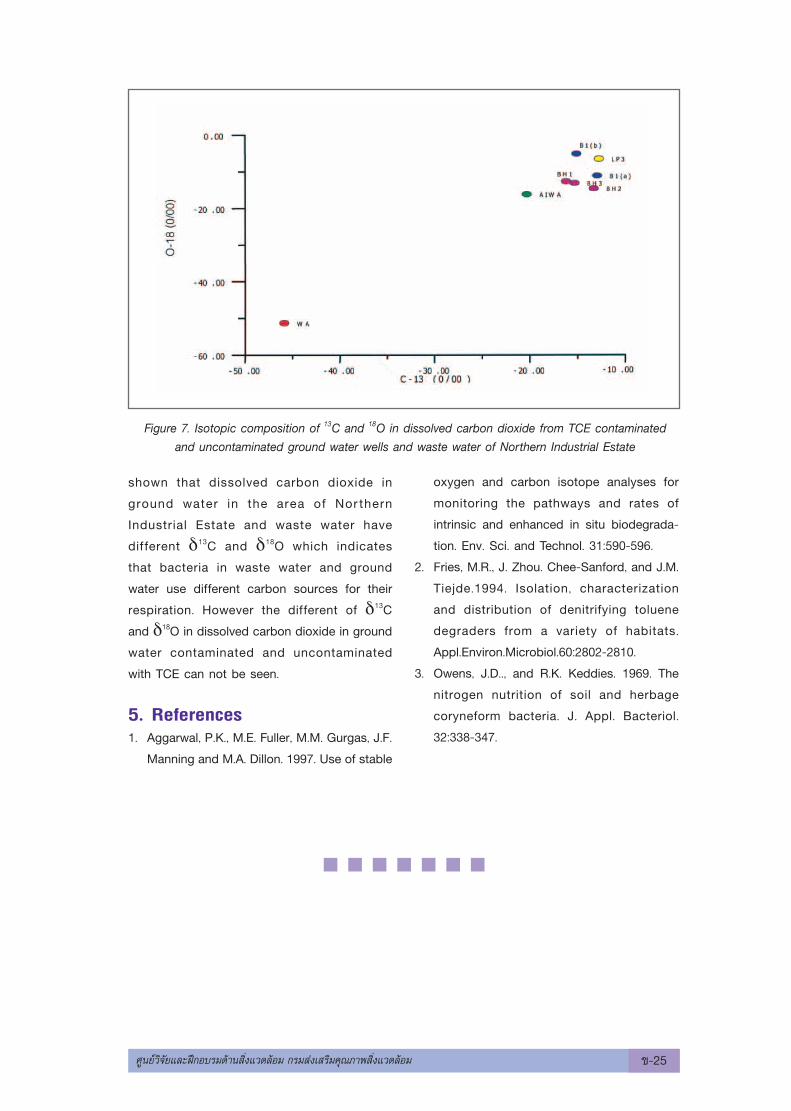
The plot between δ13C and δ18O of 7
groundwater samples and one wastewater
sample is shown in Figure 7. By this figure
groundwater has different isotopic signature
of δ13C and δ18O in dissolved carbon dioxide.
This might be attributable to different carbon
sources for bacterial respiration. While carbon
sources in waste water comes from variety
of mixture such as carbohydrate, fat, protein
and other organic compounds from industry,
the carbon sources in groundwater composes
mainly of humic acid, the final products of
degraded plants. Unfortunately we do not
have any data on the isotopic signature in
carbon dioxide from these carbon sources.
Comparing between waste water and ground
water, it is shown that carbon dioxide derived
from waste water has more depleted δ13C
and δ18O than of dissolved carbon dioxide
in ground water. This may indicate the
different carbon sources used by bacteria.
4. ConclusionsThe bacteria from 7 ground water
wells were tested for capability in degrading
toluene and TCE by 2 toluene concentration
level 50 and 10 mg/l, it was found that a
sample tended to be able to decrease
toluene and TCE. These samples will be used
to isolate the pure cultures and the cultures
will be characterized and tested to be used
for treating ground water contaminated with
toluene and TCE.
By the results of the study on isotopic
signatures of carbon dioxide, it is clearly
¢-24 »Ÿπ¬å«‘®—¬·≈–Ωñ°Õ∫√¡¥â“π ‘Ëß·«¥≈âÕ¡ °√¡ à߇ √‘¡§ÿ≥¿“æ ‘Ëß·«¥≈âÕ¡
shown that dissolved carbon dioxide in
ground water in the area of Nor thern
Industrial Estate and waste water have
different δ13C and δ18O which indicates
that bacteria in waste water and ground
water use different carbon sources for their
respiration. However the different of δ13C
and δ18O in dissolved carbon dioxide in ground
water contaminated and uncontaminated
with TCE can not be seen.
5. References1. Aggarwal, P.K., M.E. Fuller, M.M. Gurgas, J.F.
Manning and M.A. Dillon. 1997. Use of stable
oxygen and carbon isotope analyses for
monitoring the pathways and rates of
intrinsic and enhanced in situ biodegrada-
tion. Env. Sci. and Technol. 31:590-596.
2. Fries, M.R., J. Zhou. Chee-Sanford, and J.M.
Tiejde.1994. Isolation, characterization
and distribution of denitrifying toluene
degraders from a variety of habitats.
Appl.Environ.Microbiol.60:2802-2810.
3. Owens, J.D.., and R.K. Keddies. 1969. The
nitrogen nutrition of soil and herbage
coryneform bacteria. J. Appl. Bacteriol.
32:338-347.
Figure 7. Isotopic composition of 13C and 18O in dissolved carbon dioxide from TCE contaminatedand uncontaminated ground water wells and waste water of Northern Industrial Estate
»Ÿπ¬å«‘®—¬·≈–Ωñ°Õ∫√¡¥â“π ‘Ëß·«¥≈âÕ¡ °√¡ à߇ √‘¡§ÿ≥¿“æ ‘Ëß·«¥≈âÕ¡ ¢-25