Statistical Analysis of Complete Social Networkssnijders/siena/NetworksBehaviourInfluence.pdf ·...
38
university of groningen behavioural and social sciences sociology Statistical Analysis of Complete Social Networks Co-evolution of Networks & Behaviour ( ) β = → = - → ∑ 1 Pr( ) ln( ) ( ) ( ) Pr( ) c b K b a i k ik ik c a k i x x s x s x x x 0.0 0.5 1.0 1.5 2.0 0.0 0.6 1.2 1.8 3.0 3.3 3.6 3.9 4.2 4.5 4.8 5.1 5.4 5.7 6.0 homophily transitivity median geodesic distance between groups Christian Steglich [email protected]
Transcript of Statistical Analysis of Complete Social Networkssnijders/siena/NetworksBehaviourInfluence.pdf ·...

universityof
groningen
behavioural and
social sciences
sociology
Statistical Analysis of Complete Social Networks
Co-evolution of Networks & Behaviour
( )β=
→= −
→∑1
Pr( )ln( ) ( ) ( )
Pr( )
c b Kb ai
k ik ikc aki
x xs x s x
x x0.0
0.5
1.0
1.5
2.0
0.0
0.6
1.2
1.8
3.03.33.63.94.24.54.85.15.45.76.0
homophily
transitivity
median geodesic distance between groups
Christian Steglich [email protected]

universityof
groningen
behavioural and
social sciences
sociology
Co-evolution models for networks and behaviour
A. Interdependence of networks and behaviour
B. Extension of the stochastic actor-based modelling framework to “behaviour” dimensions
Statistical Analysis of Complete Social Networks 2
C. The case of homogeneity bias / network autocorrelation
D. An example: Co-evolution of music taste, alcohol & friendship
E. Notes on the modelling of peer influence

universityof
groningen
behavioural and
social sciences
sociology
A: Interdependence of networks and behavior
As could be seen already, social network dynamics can depend on actors’ individual characteristics.
Some examples:
– homophily: interaction with similar others can be more
Statistical Analysis of Complete Social Networks 3
– homophily: interaction with similar others can be more rewarding than interaction with dissimilar others
– heterophily / exchange: selection of partners such that they complement own abilities and resources
– popularity: some properties make actors more attractive as network partners than other actors
– activity: some properties make actors send more network ties than other actors do

universityof
groningen
behavioural and
social sciences
sociology
Vice versa, also actors’ characteristics can depend on the social network
Changeable individual characteristics can be affected by others in the network: behaviour proper, but also opinions, attitudes, intentions, etc. – we use the word behaviour for all of these!
Statistical Analysis of Complete Social Networks 4
intentions, etc. – we use the word behaviour for all of these!
Some examples:
– contagion / assimilation: innovations spreading in a professional community; adolescents adopting friends’ attitudes; investment bankers copying behaviour of successful competitors
– differentiation: division of tasks in a work team
– effects of isolation: lack of connections in a network may lead to behaviour that well-connected actors do not exhibit

universityof
groningen
behavioural and
social sciences
sociology
Example: Suppose “money attracts friends”. This will lead to a
positive association between money and indegree in any cross-sectional data collection. The same cross-sectinoal association, however, could also be explained as “friends make you rich”.
There often is a “natural pairing” of effects in both directions
Statistical Analysis of Complete Social Networks 5
however, could also be explained as “friends make you rich”.
More generally, any cross-sectional association between network features and individual characteristics could come about by at least two competing mechanisms:
1. The network leads to behavioural alignment.
2. Actors’ behaviour leads to network alignment.
Aim: construction of a model that allows a teasing apart.

universityof
groningen
behavioural and
social sciences
sociology
B. Extension of the network modelling framework
- Stochastic process in the (extended!) space of all possible network-behaviour configurations
beh rn states, where r is the range of the ordinal behaviour variable z
Statistical Analysis of Complete Social Networks 6
- Again, the first observation is not modelled but conditioned upon as the process’ starting value.
- Discrete change is modelled as occurring in continuous time, but now there are two types of change.
net 2n(n-1) states in the case of a (binary) directed network variable x
r states, where r is the range of the ordinal behaviour variable z

universityof
groningen
behavioural and
social sciences
sociology
Actor based approach now in two domains
- Network actors drive the process: individual decisions.
› two domains of decisions:
• decisions about network neighbours,
Statistical Analysis of Complete Social Networks 7
• decisions about network neighbours,
• decisions about own behaviour.
› per decision domain two model parts:
• When can actor imake a decision? (rate functions λnet, λbeh)
• Which decision does actor imake? (objective functions fnet, fbeh)
By again sampling waiting times and identifying the shortest
one, it becomes clear who makes which type of change.

universityof
groningen
behavioural and
social sciences
sociology
Schematic overview of model components
Timing of decisions Decision rules
Network evolution
Network rate function λλλλnetNetwork objective function fnet
Behavioural Behaviour rate function λλλλbeh
Behaviour objective
Statistical Analysis of Complete Social Networks 8
› By simultaneously operating both processes on the same state space (conditionally independent, given the current state), feedback processes are instantiated.
› Network evolution model and behavioural evolution model therefore are controlling for each other!
Behavioural evolution
Behaviour rate function λλλλbehBehaviour objective
function fbeh

universityof
groningen
behavioural and
social sciences
sociology
Micro steps that are modelled explicitly
Let (x,z)(t) be the state of the co-evolution process at time point t (where x stands for the network part and z for the behaviour vector).
Micro steps are defined as “smallest possible changes”:
Statistical Analysis of Complete Social Networks 9
Micro steps are defined as “smallest possible changes”:
network micro steps
(x,z)(t1) and (x,z)(t2) differ in one tie variable xij only.
behaviour micro steps
(x,z)(t1) and (x,z)(t2) differ by one in one behavioural score variable zi only.

universityof
groningen
behavioural and
social sciences
sociology
Model for behavioural change
Choice options:
(1) increase, (2) decrease, or (3) keep current score
on the ordinal behavioural variable, provided the range is not left
Statistical Analysis of Complete Social Networks 10
Choice probabilities:
Analogous to network part: multinomial logit model based on
evaluations of options according to behavioural objective function.
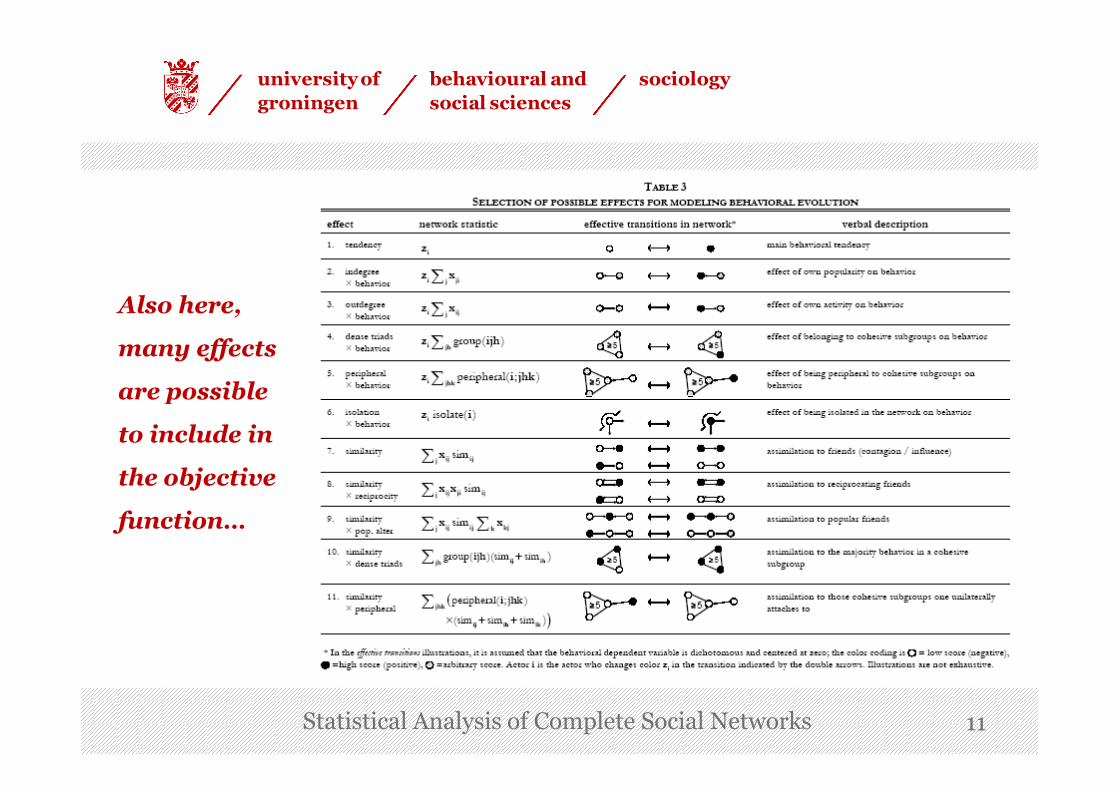
Explanatory model for behaviour change:
By inclusion of effect statistics in the objective function.
zmin zmax
universityof
groningen
behavioural and
social sciences
sociology
Also here,
many effects
are possible
Statistical Analysis of Complete Social Networks 11
are possible
to include in
the objective
function…

universityof
groningen
behavioural and
social sciences
sociology
Estimation of co-evolution models
› The estimating equations algorithm needs to be modified slightly because the default equations for ‘competing process explanations’ are identical and would imply an unsolvable collinear system of
Statistical Analysis of Complete Social Networks 12
would imply an unsolvable collinear system of equations.
› Solution: work with cross-lagged statistics in the estimating equations!
• Network change in response to prior behaviour,
• behaviour change in response to prior network.

universityof
groningen
behavioural and
social sciences
sociology
Estimating equations
When X, Z are model-based simulated data and x, z the empirical data, the following statistics are used:
› For parameters in the network objective function:
Statistical Analysis of Complete Social Networks 13
› For parameters in the behaviour objective function:
The estimating equations are ; everything else remains as in the case of the simple network evolution model.
( ) ( )+=∑ ∑i 1, ( ), ( )net
ih k kk iS X Z s X t z t
( ) ( )+=∑ ∑i 1, ( ), ( )beh
ih k kk iS X Z s x t Z t
=i i
( ( , )) ( , )E S X Z S x z
universityof
groningen
behavioural and
social sciences
sociology
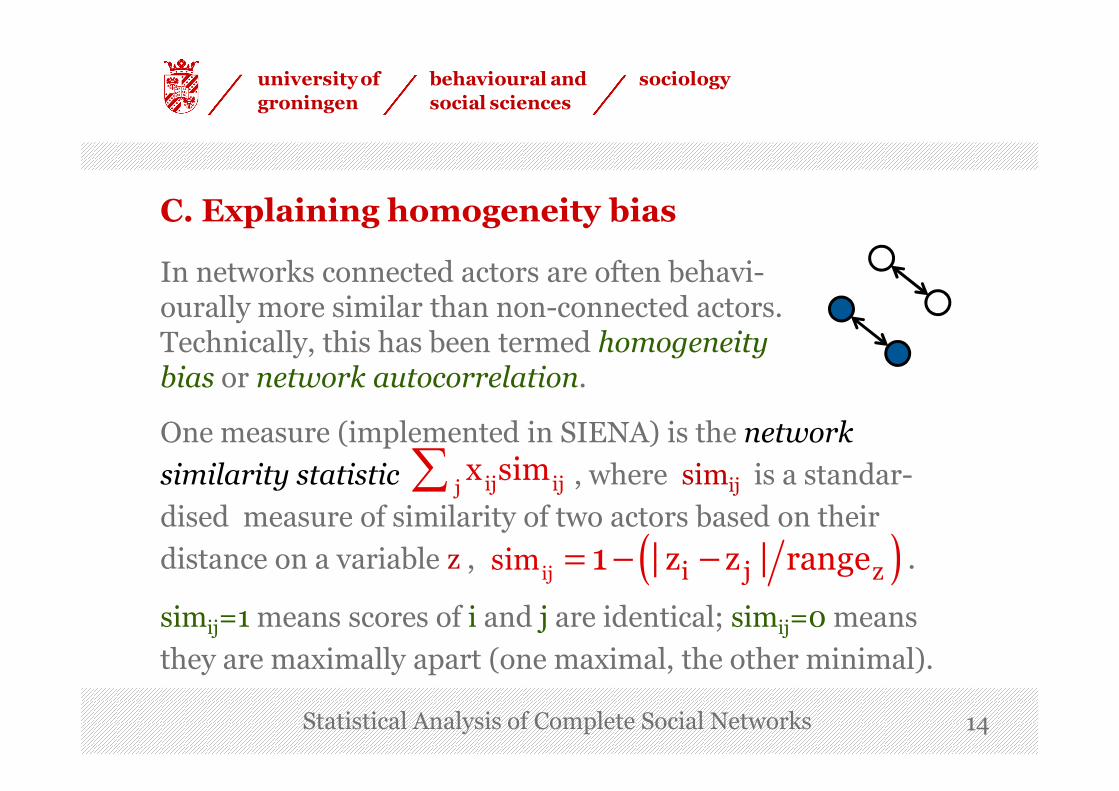
C. Explaining homogeneity bias
In networks connected actors are often behavi-ourally more similar than non-connected actors. Technically, this has been termed homogeneity bias or network autocorrelation.
Statistical Analysis of Complete Social Networks 14
ij ijjx sim∑
( )= − −ij i j zsim z z range1 | |
One measure (implemented in SIENA) is the network
similarity statistic , where simij is a standar-
dised measure of similarity of two actors based on their
distance on a variable z , .
simij=1 means scores of i and j are identical; simij=0 means
they are maximally apart (one maximal, the other minimal).
universityof
groningen
behavioural and
social sciences
sociology
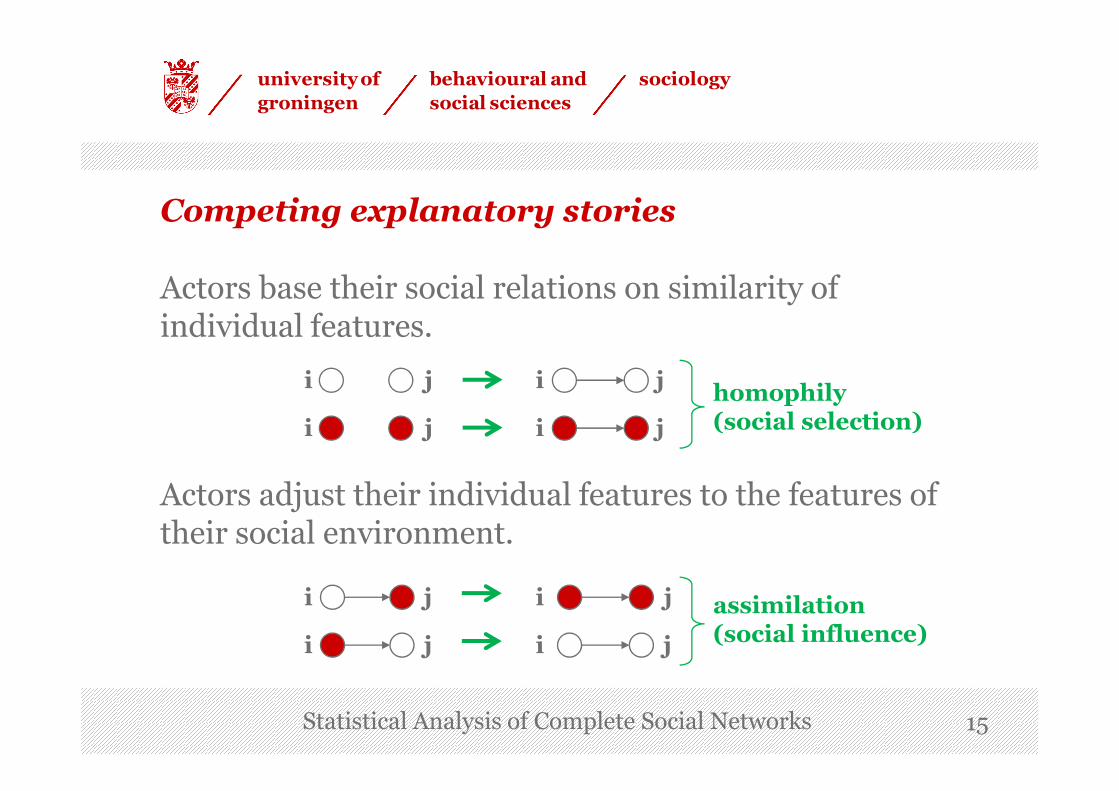
Actors base their social relations on similarity of individual features.
Competing explanatory stories
homophily i j i j
Statistical Analysis of Complete Social Networks 15
Actors adjust their individual features to the features of their social environment.
assimilation (social influence)
homophily (social selection)i
i
i
i
i
i
j j
j
jj
j

universityof
groningen
behavioural and
social sciences
sociology
Modelling selection and influence
By including the network similarity statistic
…in the network objective function, homophilousselection is modelled,
ij ijjx sim∑
Statistical Analysis of Complete Social Networks 16
selection is modelled,
…in the behaviour objective function, assimilation / social influence is modelled.
It can be of crucial importance to be able to control one effect for the occurrence of the other – e.g., in the design of social interventions to reduce smoking at school.

universityof
groningen
behavioural and
social sciences
sociology
i j
Behavior change other
than assimilation
Network change other
than homophily(c)(b)
Intermezzo: continuous time modelling revisited
Suppose in a given data set, transition (a) on the right has been observed from
Statistical Analysis of Complete Social Networks 17
i j i j
i j
Homophily
possible
Assimilation
possible
(a) (d)
one observation moment to the next.
May one diagnosethis observation asoccurrence of assimilation?
The continuous time approach allows to control for other expla-nations such as (b)-(c)-(d); discrete time models cannot do this!

universityof
groningen
behavioural and
social sciences
sociology
D: Example co-evolution analysis*
A set of illustrative research questions:
1. To what degree is music taste acquired via friendship ties?
2. Does music taste (co-)determine the selection of friends?
3. What is the role played by alcohol consumption in both
Statistical Analysis of Complete Social Networks 18
3. What is the role played by alcohol consumption in both friendship evolution and the dynamics of music taste?
Data: Medical Research Council’s Teenage Friends & Lifestyle
Study (Bush, Michell & West, 1997)
three waves, 129 pupils (13-15 year old) at one Glasgow-based school; pupils named up to 6 friends
* see Steglich, Snijders & West, Methodology 2: 48-56 (2006)
universityof
groningen
behavioural and
social sciences
sociology
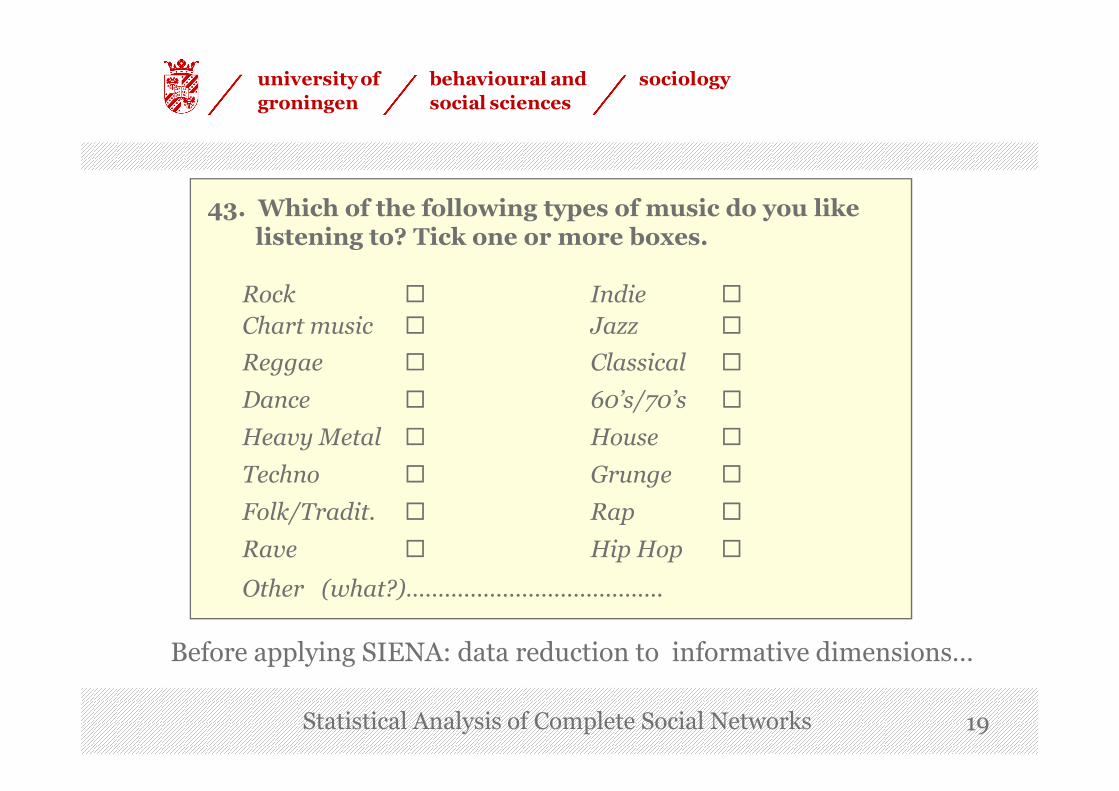
43. Which of the following types of music do you like listening to? Tick one or more boxes.
Rock � Indie �
Chart music � Jazz �
Reggae � Classical �
Dance � 60’s/70’s �
Statistical Analysis of Complete Social Networks 19
Dance � 60’s/70’s �
Heavy Metal � House �
Techno � Grunge �
Folk/Tradit. � Rap �
Rave � Hip Hop �
Other (what?)………………………………….
Before applying SIENA: data reduction to informative dimensions…

rap
grunge
heavymtl
rock
classica
indie
sixty70s
scale CLASSICAL
scale ROCK
Principal components analysis (confirmed by Mokkenscaling) yields three music listening dimensions…
rap
dance
reggae
techno
househiphop
chart
rave
classica
jazz
folk_trd
scale TECHNO

universityof
groningen
behavioural and
social sciences
sociology
Alcohol question: five point scale
32. How often do you drinkalcohol? Tick one box only.
More than once a week � 5
Statistical Analysis of Complete Social Networks 21
More than once a week �
About once a week �
About once a month �
Once or twice a year �
I don’t drink (alcohol) �
5
4
3
2
1

universityof
groningen
behavioural and
social sciences
sociology
Average dynamics of the four behavioural variables...
2
2.5
3
3.5
Statistical Analysis of Complete Social Networks 22
0
0.5
1
1.5
2
wave 1 wave 2 wave 3
techno rock classical alcohol

universityof
groningen
behavioural and
social sciences
sociology
…and global dynamics of friendship (dyad counts)
150
200
250
Statistical Analysis of Complete Social Networks 23
0
50
100
150
wave 1 wave 2 wave 3
asymmetric mutual

universityof
groningen
behavioural and
social sciences
sociology
Analysis of the music taste data
Network objective function:
– intercept:
outdegree
– covariate-determined:
– network-endogenous:
reciprocitydistance-2
Statistical Analysis of Complete Social Networks 24
– covariate-determined:
gender homophilygender egogender alter
Rate functions were kept as
simple as possible (periodwise
constant).
– behaviour-determined:
beh. homophilybeh. egobeh. alter
“behaviour” stands shorthand for the three music taste dimensions and alcohol consumption.

universityof
groningen
behavioural and
social sciences
sociology
Behaviour objective function(s):
– intercept:
tendency
– network-determined:
assimilation to neighbours
Statistical Analysis of Complete Social Networks 25
assimilation to neighbours
– covariate-determined:
gender main effect
– behaviour-determined:
behaviour main effect
The following slides show the original estimation results (2006, Steglich, Snijders & West).
universityof
groningen
behavioural and
social sciences
sociology
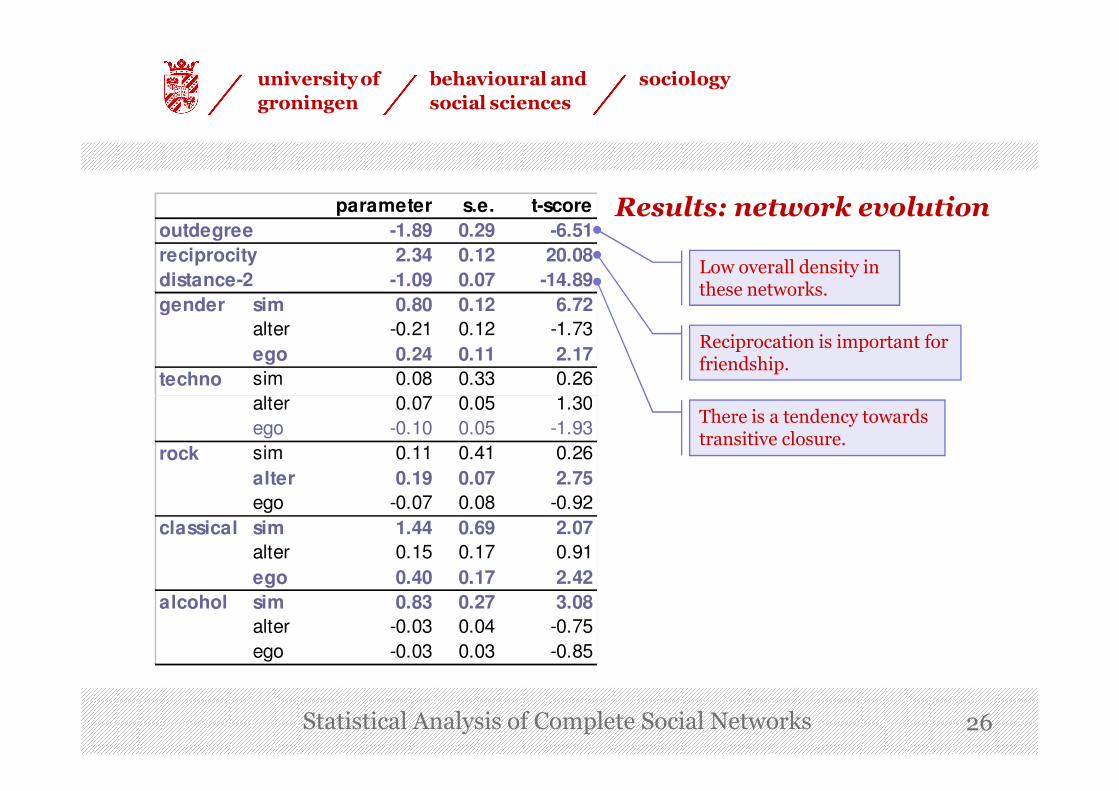
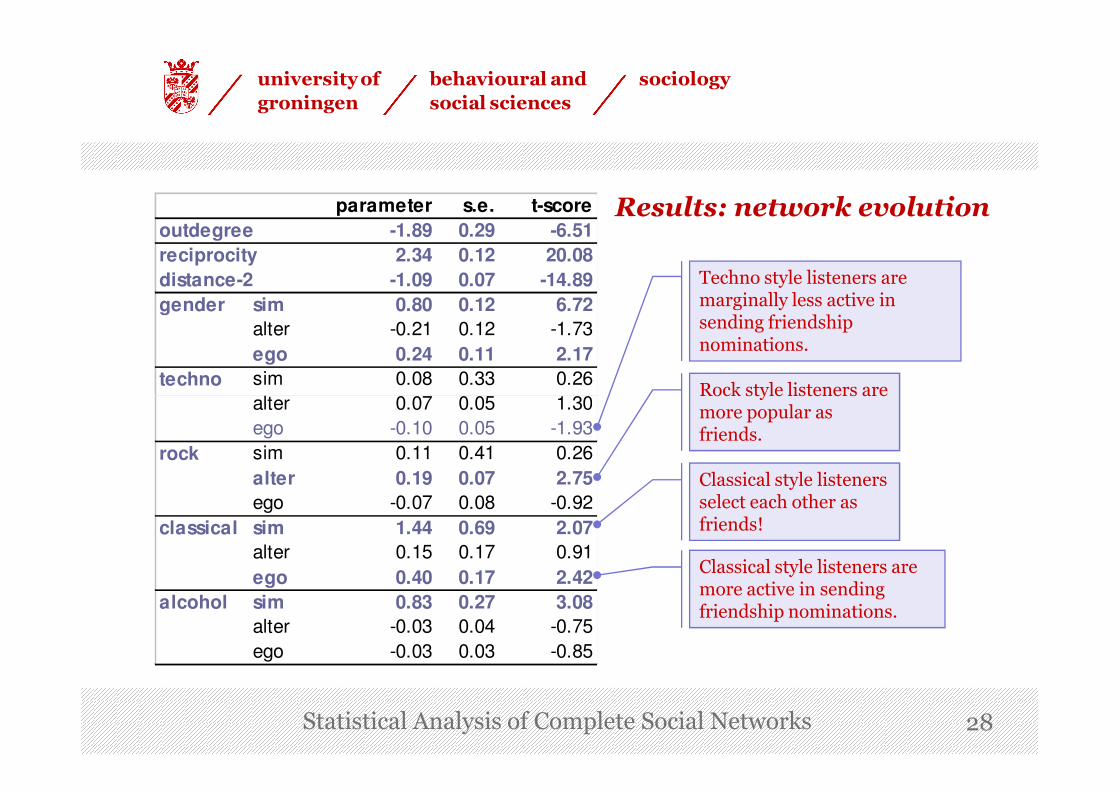
Results: network evolutionparameter s.e. t-score
outdegree -1.89 0.29 -6.51
reciprocity 2.34 0.12 20.08
distance-2 -1.09 0.07 -14.89
gender sim 0.80 0.12 6.72
alter -0.21 0.12 -1.73
ego 0.24 0.11 2.17
techno sim 0.08 0.33 0.26
alter 0.07 0.05 1.30
Low overall density in these networks.
Reciprocation is important for friendship.
Statistical Analysis of Complete Social Networks 26
alter 0.07 0.05 1.30
ego -0.10 0.05 -1.93
rock sim 0.11 0.41 0.26
alter 0.19 0.07 2.75
ego -0.07 0.08 -0.92
classical sim 1.44 0.69 2.07
alter 0.15 0.17 0.91
ego 0.40 0.17 2.42
alcohol sim 0.83 0.27 3.08
alter -0.03 0.04 -0.75
ego -0.03 0.03 -0.85
There is a tendency towards transitive closure.

universityof
groningen
behavioural and
social sciences
sociology
Results: network evolutionparameter s.e. t-score
outdegree -1.89 0.29 -6.51
reciprocity 2.34 0.12 20.08
distance-2 -1.09 0.07 -14.89
gender sim 0.80 0.12 6.72
alter -0.21 0.12 -1.73
ego 0.24 0.11 2.17
techno sim 0.08 0.33 0.26
alter 0.07 0.05 1.30
There is gender homophily:alter
boy girl
boy 0.38 -0.62ego
girl -0.18 0.41
table gives gender-related
Statistical Analysis of Complete Social Networks 27
alter 0.07 0.05 1.30
ego -0.10 0.05 -1.93
rock sim 0.11 0.41 0.26
alter 0.19 0.07 2.75
ego -0.07 0.08 -0.92
classical sim 1.44 0.69 2.07
alter 0.15 0.17 0.91
ego 0.40 0.17 2.42
alcohol sim 0.83 0.27 3.08
alter -0.03 0.04 -0.75
ego -0.03 0.03 -0.85
table gives gender-related contributions to the objective function
There is alcohol homophily:alter
low high
low 0.36 -0.59ego
high -0.59 0.13
table shows contributions to the objective function for highest / lowest possible scores
universityof
groningen
behavioural and
social sciences
sociology
Results: network evolutionparameter s.e. t-score
outdegree -1.89 0.29 -6.51
reciprocity 2.34 0.12 20.08
distance-2 -1.09 0.07 -14.89
gender sim 0.80 0.12 6.72
alter -0.21 0.12 -1.73
ego 0.24 0.11 2.17
techno sim 0.08 0.33 0.26
alter 0.07 0.05 1.30Rock style listeners are
Techno style listeners are marginally less active in sending friendship nominations.
Statistical Analysis of Complete Social Networks 28
alter 0.07 0.05 1.30
ego -0.10 0.05 -1.93
rock sim 0.11 0.41 0.26
alter 0.19 0.07 2.75
ego -0.07 0.08 -0.92
classical sim 1.44 0.69 2.07
alter 0.15 0.17 0.91
ego 0.40 0.17 2.42
alcohol sim 0.83 0.27 3.08
alter -0.03 0.04 -0.75
ego -0.03 0.03 -0.85
Rock style listeners are more popular as friends.
Classical style listeners are more active in sending friendship nominations.
Classical style listeners select each other as friends!
universityof
groningen
behavioural and
social sciences
sociology
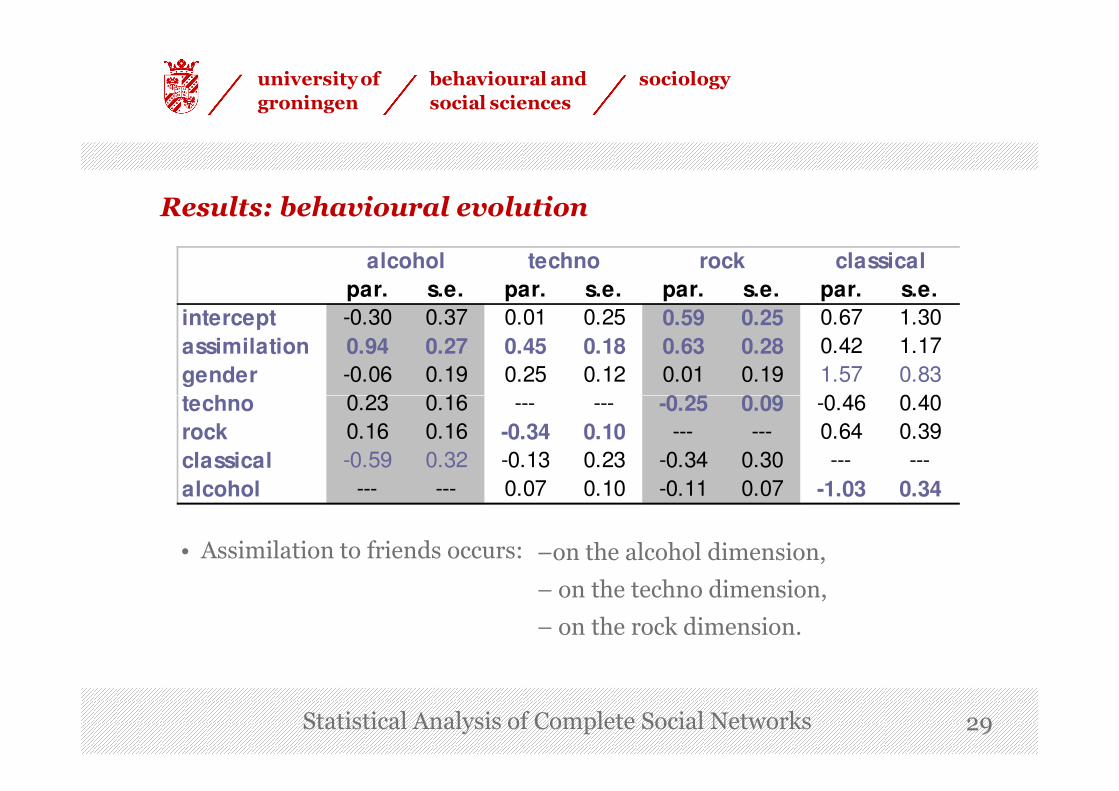
Results: behavioural evolution
par. s.e. par. s.e. par. s.e. par. s.e.
intercept -0.30 0.37 0.01 0.25 0.59 0.25 0.67 1.30
assimilation 0.94 0.27 0.45 0.18 0.63 0.28 0.42 1.17
gender -0.06 0.19 0.25 0.12 0.01 0.19 1.57 0.83
techno 0.23 0.16 --- --- -0.25 0.09 -0.46 0.40
alcohol techno rock classical
Statistical Analysis of Complete Social Networks 29
techno 0.23 0.16 --- --- -0.25 0.09 -0.46 0.40
rock 0.16 0.16 -0.34 0.10 --- --- 0.64 0.39
classical -0.59 0.32 -0.13 0.23 -0.34 0.30 --- ---
alcohol --- --- 0.07 0.10 -0.11 0.07 -1.03 0.34
–on the alcohol dimension,
– on the techno dimension,
– on the rock dimension.
• Assimilation to friends occurs:
universityof
groningen
behavioural and
social sciences
sociology
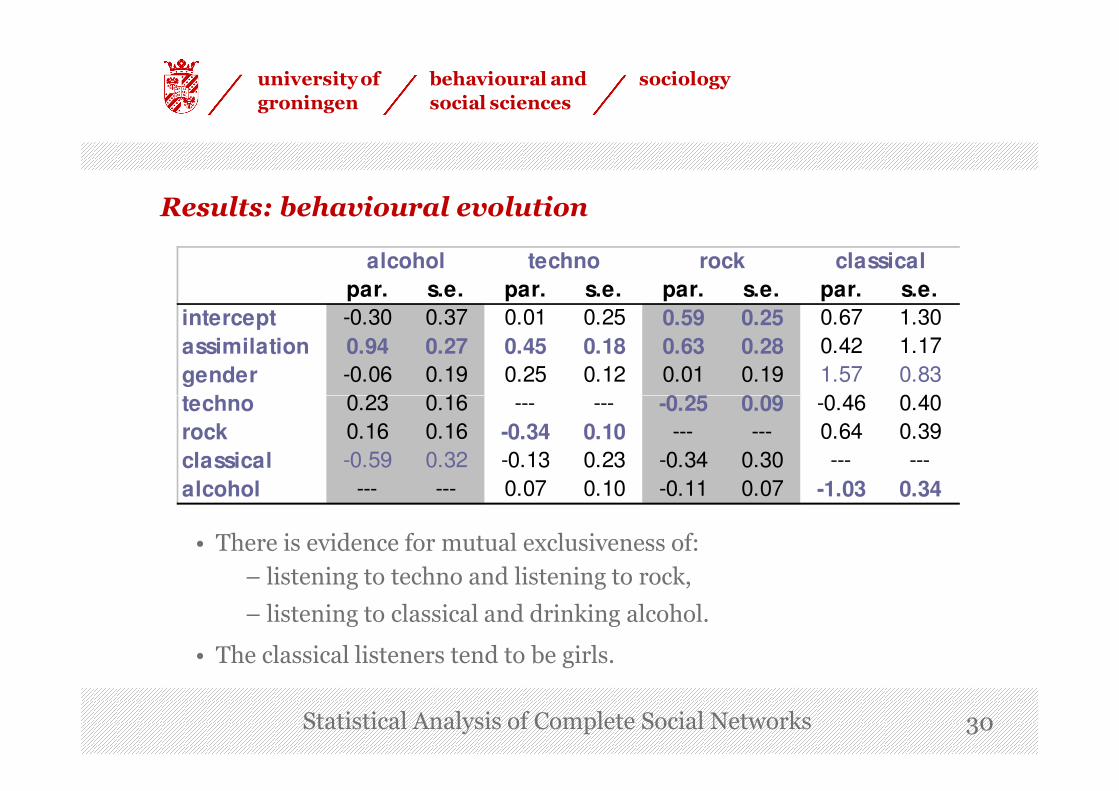
Results: behavioural evolution
par. s.e. par. s.e. par. s.e. par. s.e.
intercept -0.30 0.37 0.01 0.25 0.59 0.25 0.67 1.30
assimilation 0.94 0.27 0.45 0.18 0.63 0.28 0.42 1.17
gender -0.06 0.19 0.25 0.12 0.01 0.19 1.57 0.83
techno 0.23 0.16 --- --- -0.25 0.09 -0.46 0.40
alcohol techno rock classical
Statistical Analysis of Complete Social Networks 30
techno 0.23 0.16 --- --- -0.25 0.09 -0.46 0.40
rock 0.16 0.16 -0.34 0.10 --- --- 0.64 0.39
classical -0.59 0.32 -0.13 0.23 -0.34 0.30 --- ---
alcohol --- --- 0.07 0.10 -0.11 0.07 -1.03 0.34
• There is evidence for mutual exclusiveness of:
– listening to techno and listening to rock,
– listening to classical and drinking alcohol.
• The classical listeners tend to be girls.
universityof
groningen
behavioural and
social sciences
sociology
› Peer influence doesn’t necessarily mean “connected people becoming / staying more similar over time”
• For strongly skewed variables, peer influence may even coincide with connected people becoming less similar.
E: More on peer influence modelling
Statistical Analysis of Complete Social Networks 31
coincide with connected people becoming less similar.
Example: When entering secondary school, students initially
are all non-delinquent, i.e., perfectly similar. Any subsequent movement implies a reduction of similarity.
• In such cases, the similarity based measures can be wrong specifications of peer influence!
Correlational measures may be the better choice here; see Knecht et al. (Social Development, 2010).
universityof
groningen
behavioural and
social sciences
sociology
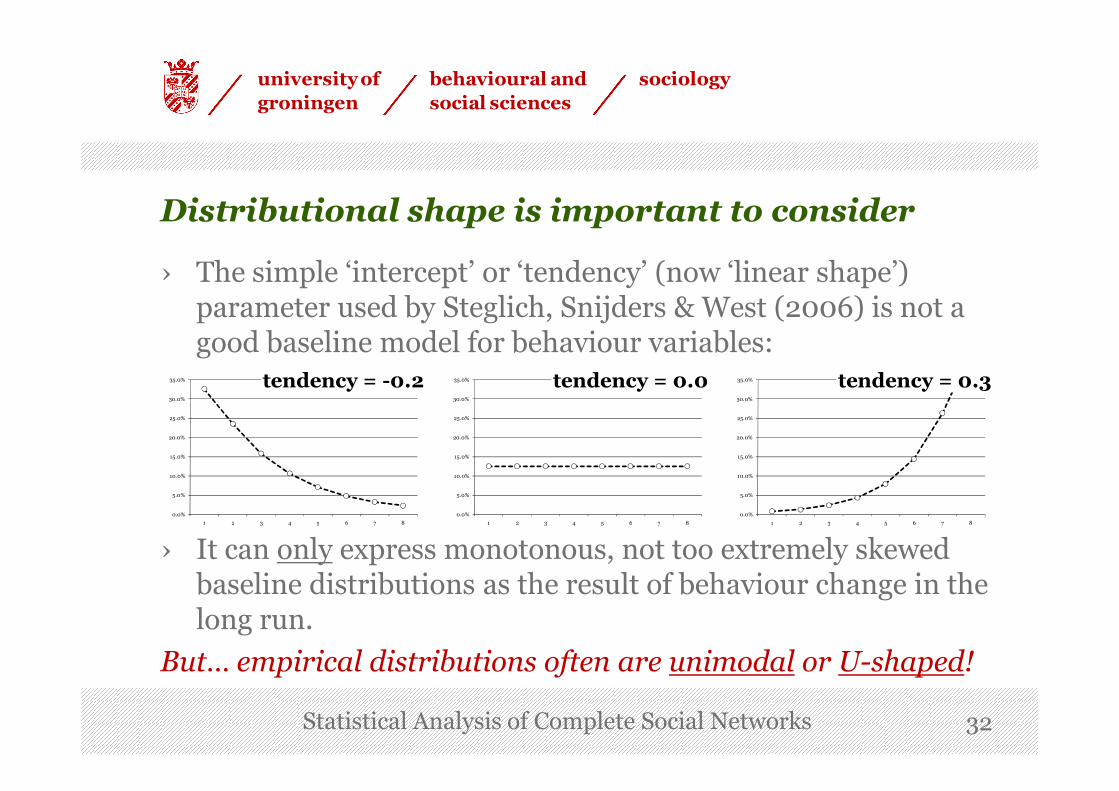
› The simple ‘intercept’ or ‘tendency’ (now ‘linear shape’) parameter used by Steglich, Snijders & West (2006) is not a good baseline model for behaviour variables:
Distributional shape is important to consider
35.0% tendency = 0.0 35.0% tendency = 0.335.0% tendency = -0.2
Statistical Analysis of Complete Social Networks 32
› It can only express monotonous, not too extremely skewed baseline distributions as the result of behaviour change in the long run.
But… empirical distributions often are unimodal or U-shaped!
0.0%
5.0%
10.0%
15.0%
20.0%
25.0%
30.0%
1 2 3 4 5 6 7 8
0.0%
5.0%
10.0%
15.0%
20.0%
25.0%
30.0%
1 2 3 4 5 6 7 8
0.0%
5.0%
10.0%
15.0%
20.0%
25.0%
30.0%
1 2 3 4 5 6 7 8
universityof
groningen
behavioural and
social sciences
sociology
› If a distributional shape persists over time, this stability will be captured by parameter estimates.
Example: If a behaviour variable is empirically over- or under-
dispersed with respect to its best-fitting ‘linear shape’ model, the
Why is this a problem?
Statistical Analysis of Complete Social Networks 33
dispersed with respect to its best-fitting ‘linear shape’ model, the residual dispersion can bias peer influence estimates.
An illustration is the paper by Baerveldt et al., 2008.
› Best is to work with empirically meaningful baseline distributions – including U-shapes and unimodality.
U-shape or strong skewness are cases of overdispersion; unimo-dality is a case of underdispersion w.r.t. the linear shape model.
› So… enhance ‘baseline capabilities’ of the behaviour model!

universityof
groningen
behavioural and
social sciences
sociology
› The addition of a ‘quadratic shape’ parameter allows the modelling of also unimodal, U-shaped, and strongly skewed baseline distributions as long-run result of behaviour change:
The ‘quadratic shape’ parameter
18.0%
20.0%
16.0%
18.0%
Statistical Analysis of Complete Social Networks 34
› Note, however, that there still can be other, weird empirical distributional shapes! Always check, recode if too weird!
0.0%
2.0%
4.0%
6.0%
8.0%
10.0%
12.0%
14.0%
16.0%
18.0%
1 2 3 4 5 6 7 8
0.0%
2.0%
4.0%
6.0%
8.0%
10.0%
12.0%
14.0%
16.0%
1 2 3 4 5 6 7 8
quadratic shape > 0 quadratic shape < 0

universityof
groningen
behavioural and
social sciences
sociology
› Besides the rather technical dispersion interpretation, the ‘quadratic shape’ parameter can be interpreted as follows:
positive sign: “The higher the behaviour already is, the higher the tendency to increase it even more.” Change dynamics self-accelerating towards extremes. Behaviour is potentially
Interpretation of ‘quadratic shape’ estimates
Statistical Analysis of Complete Social Networks 35
accelerating towards extremes. Behaviour is potentially ‘addictive’. Polarisation of the group on this behaviourdimension is likely.
negative sign: “The higher the behaviour already is, the lower the tendency to still increase it further.” Change dynamics self-correcting towards the mean. Behaviour is potentially governed by norms of moderation that hold in the whole group. Consensus formation on this behaviour is likely.

universityof
groningen
behavioural and
social sciences
sociology
36
48
60
72
Rock
21
28
35
42
Chart / Techno
What about the distributional shapes of the four behaviourvariables in Steglich, Snijders & West (2006)?
Statistical Analysis of Complete Social Networks 36
0
20
40
60
80
100
120
0 1 2 3
Elite / Classical
0
12
24
0 1 2 3 4
0
7
14
0 1 2 3 4
0
10
20
30
40
50
60
1 2 3 4 5
Alcohol
T1 T2 T3
alcohol&technounimodal, more or less
rock&
classicalskewed, the latter strongly

universityof
groningen
behavioural and
social sciences
sociology
Robustness check of results reported by Steglich, Snijders & West upon addition of ‘quadratic shape’ effect to the model
quadratic shape parameters:
› weakly negative (p=0.08) for alcohol consumption (unimodal)
› positive (p=0.01) for classical / elite (strongly skewed)
› n.s. (p>0.6) for rock and techno / chart
Statistical Analysis of Complete Social Networks 37
› n.s. (p>0.6) for rock and techno / chart
change in peer influence results:
› result for rock drops to n.s. (p=0.16)
› result for techno / chart drops to weak effect (p=0.08)
change in homophily-based selection:
› result for classical / elite drops to weak effect (p=0.08)
Overall “slightly less spectacular results”, it seems.

universityof
groningen
behavioural and
social sciences
sociology
Interpretation of robustness check results
› The overall drop in significance of almost all effects can be a result of adding four more parameters to an already large model, which implies a reduction of statistical power.
› The strongest drop in significance occurs for the ‘assimilation
Statistical Analysis of Complete Social Networks 38
› The strongest drop in significance occurs for the ‘assimilation rock’ effect: Controlling for the whole cohort’s behaviouraltendencies, it is not possible to tell anymore whether friends adjusted their rock listening habits to those of their friends.
› Besides these comments, the new results seem in line with the earlier reported ones.