Project Title: Design and Evaluation of High-Volume Fly ... · γsh,ψ Fine aggregate correction...
84
FINAL Report D TRyy1110 Project Title: Design and Evaluation of High-Volume Fly Ash (HVFA) Concrete Mixes Report D: Creep, Shrinkage, and Abrasion Resistance of HVFA Concrete Prepared for Missouri Department of Transportation Construction and Materials Missouri University of Science and Technology, Rolla, Missouri October 2012 The opinions, findings, and conclusions expressed in this publication are those of the principal investigators and the Missouri Department of Transportation. They are not necessarily those of the U.S. Department of Transportation, Federal Highway Administration. This report does not constitute a standard or regulation.
Transcript of Project Title: Design and Evaluation of High-Volume Fly ... · γsh,ψ Fine aggregate correction...
FINAL Report D
TRyy1110
Project Title: Design and Evaluation of High-Volume Fly Ash (HVFA) Concrete Mixes
Report D: Creep, Shrinkage, and Abrasion Resistance of HVFA Concrete
Prepared for
Missouri Department of Transportation
Construction and Materials
Missouri University of Science and Technology, Rolla, Missouri
October 2012
The opinions, findings, and conclusions expressed in this publication are those of the
principal investigators and the Missouri Department of Transportation. They are not
necessarily those of the U.S. Department of Transportation, Federal Highway
Administration. This report does not constitute a standard or regulation.
ii
ABSTRACT
The main objective of this study was to determine the effect on shrinkage, creep,
and abrasion resistance of high-volume fly ash (HVFA) concrete. The HVFA concrete
test program consisted of comparing the shrinkage, creep, and abrasion performance of
two concrete mix designs with 70% cement replacement with Class C fly ash relative to a
Missouri Department of Transportation (MoDOT) standard mix design.
Modified versions of standard test methods were used for the shrinkage and creep
portions of the study. Shrinkage was measured through a modified version of ASTM
C157 “Standard Test Method for Length Change of Hardened Hydraulic-Cement Mortar
and Concrete,” while creep was measured through a modified version of ASTM C512
“Standard Test Method for Creep of Concrete in Compression.” Abrasion resistance was
measured in accordance with ASTM C944 “Standard Test Method for Abrasion
Resistance of Concrete or Mortar Surfaces by Rotating-Cutter Method.”
In addition to comparisons between the three mix designs, the results were also
compared to existing prediction models and previous research results on HVFA concrete.
Both HVFA concrete mixes showed a significant decrease in shrinkage strain relative to
the control concrete, which was very consistent with previous research. With regard to
creep, both HVFA concrete mixes also showed improved performance over the control
mix, again confirming previous research results. However, the control concrete exhibited
improved abrasion resistance relative to the two HVFA concrete mixes, which coincided
with the higher strength of the control mix. At later ages, the abrasion resistance of the
HVFA concrete improved due to late age strength gain characteristic of this material.
iii
TABLE OF CONTENTS
Page
ABSTRACT ....................................................................................................................... ii
LIST OF ILLUSTRATIONS ............................................................................................. vi
LIST OF TABLES ........................................................................................................... viii
NOMENCLATURE .......................................................................................................... ix
1. LITERATURE REVIEW ........................................................................................... 1
1.1. HIGH VOLUME FLY ASH CONCRETE (HVFA) .......................................... 1
1.1.1. Fly Ash. .................................................................................................... 1
1.1.2. Definition of HFVA. ................................................................................ 1
1.1.3. Advantages of HVFA. .............................................................................. 2
1.2. SHRINKAGE OF CONCRETE ......................................................................... 2
1.2.1. Definition of Shrinkage. ........................................................................... 2
1.2.2. Factors Affecting Shrinkage (ACI 209.1R-05). ....................................... 3
1.3. SHRINKAGE MODELS. ................................................................................... 5
1.3.1. ACI 209R-92. .......................................................................................... 5
1.3.2. NCHRP Report 496 (2003). ..................................................................... 9
1.3.3. Model B3. ............................................................................................... 11
1.3.4. CEB-FIP 90. ........................................................................................... 12
1.3.5. GL 2000. ................................................................................................. 13
1.4. HVFA SHRINKAGE RESEARCH .................................................................. 14
1.4.1. Atis. ...................................................................................................... 15
1.4.2. Termkhajornkit, et. al. ............................................................................ 16
1.4.3. Gao, et. al. ............................................................................................... 16
1.4.4. Nath and Sarker. ..................................................................................... 17
1.5. CREEP OF CONCRETE .................................................................................. 18
1.5.1. Definition of Creep. ................................................................................ 18
1.5.2. Factors Affecting Creep. ........................................................................ 19
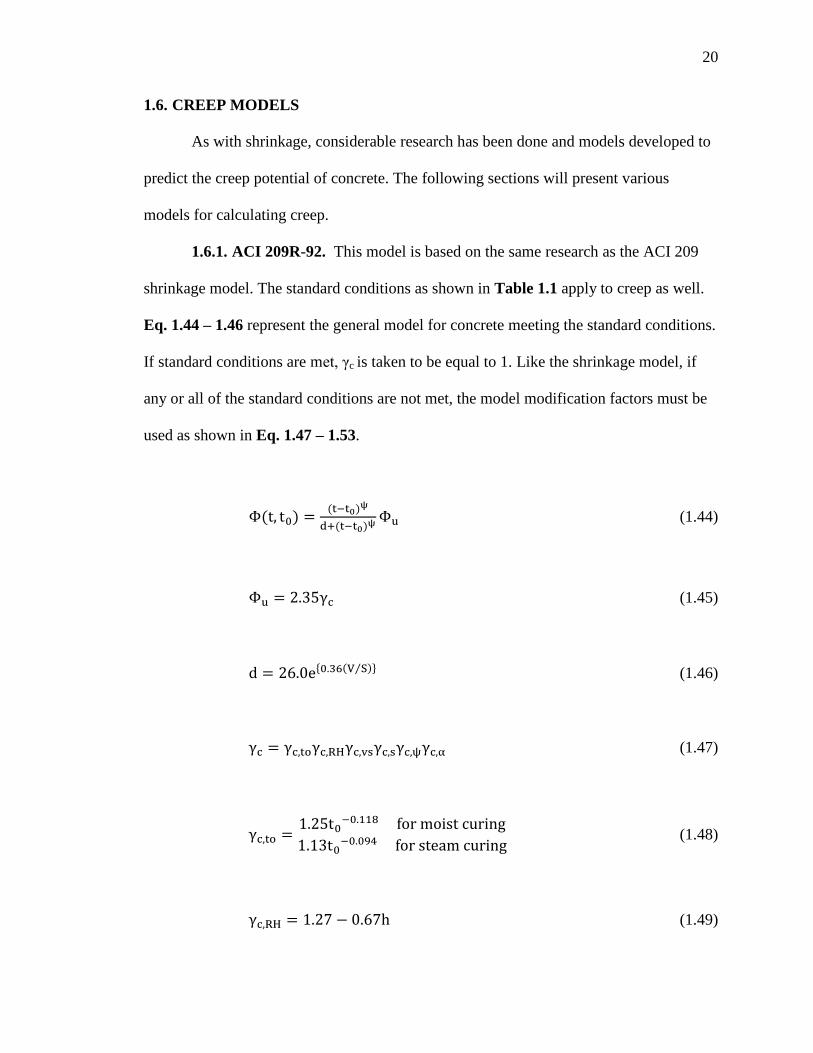
1.6. CREEP MODELS ............................................................................................. 20

iv
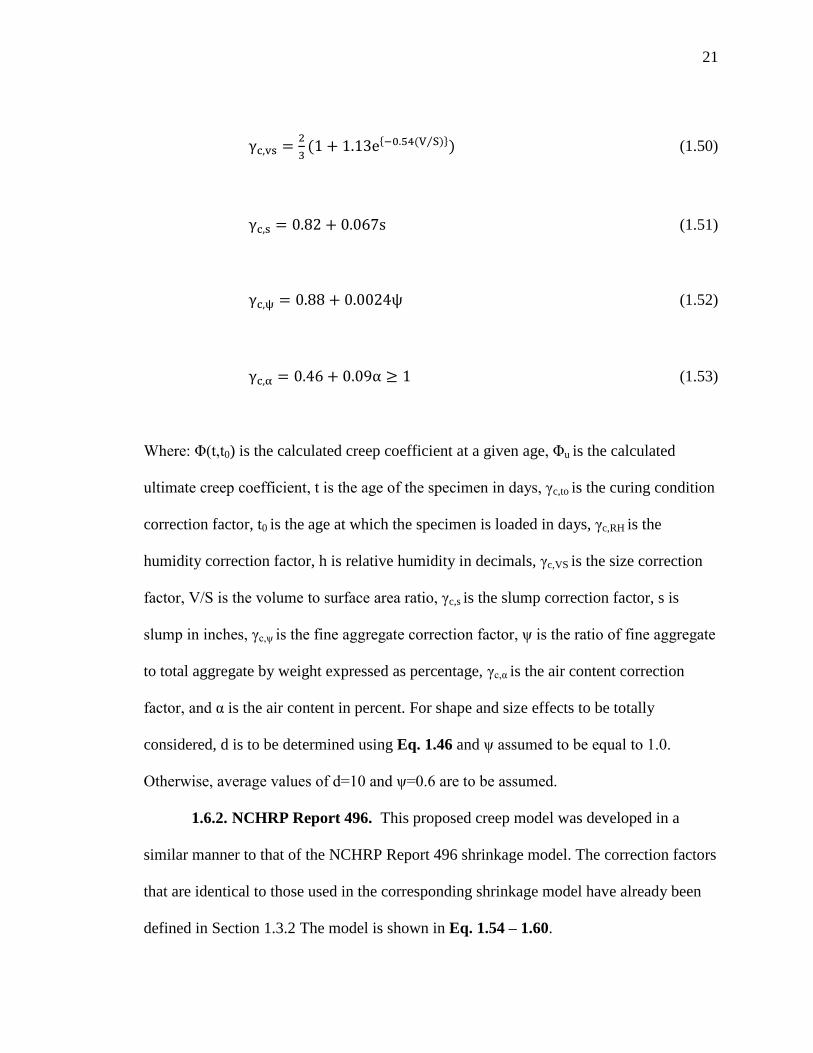
1.6.1. ACI 209R-92. ......................................................................................... 20
1.6.2. NCHRP Report 496. ............................................................................... 21
1.6.3. CEB-FIP 90. ........................................................................................... 23
1.6.4. GL 2000. ................................................................................................. 24
1.7. HVFA CREEP RESEARCH ............................................................................ 24
1.7.1. ACI 232.2R-03. ...................................................................................... 24
1.7.2. Alexander, et. al. ..................................................................................... 25
1.8. APPLICATION OF SHRINKAGE AND CREEP ........................................... 25
1.8.1. Prestress Loss. ........................................................................................ 25
1.8.2. Load Effects. .......................................................................................... 26
1.8.3. Beam Deflection. .................................................................................... 27
1.9. CONCRETE ABRASION ................................................................................ 27
1.9.1. Definition of Concrete Abrasion. ........................................................... 27
1.9.2. Factors Affecting Concrete Abrasion. .................................................... 28
1.10. HVFA ABRASION RESEARCH .................................................................. 28
1.10.1. Naik, et. al. ........................................................................................... 28
1.10.2. Atis. ...................................................................................................... 29
2. RESEARCH PROGRAM ........................................................................................ 30
2.1. MIX DESIGNS ................................................................................................. 30
2.1.1. HVFA. .................................................................................................... 30
2.2. SHRINKAGE AND CREEP SPECIMEN CONSTRUCTION ........................ 31
2.2.1. Shrinkage and Creep Specimens. ........................................................... 31
2.2.2. Shrinkage and Creep Molds. .................................................................. 31
2.2.3. Shrinkage and Creep Specimen Casting. ............................................... 32
2.2.4. Shrinkage and Creep De-Molding and Preparation. .............................. 33
2.2.5. Shrinkage and Creep Data Acquisition. ................................................. 33
2.3. ABRASION SPECIMEN CONSTRUCTION ................................................. 34
2.4. TESTING PROCEDURES ............................................................................... 35
2.4.1. Shrinkage Testing Procedures. ............................................................... 35
2.4.2. Creep Testing Procedures. ...................................................................... 38
2.4.3. Abrasion Resistance Testing Procedures. .............................................. 41
v
3. HVFA RESULTS AND DISCUSSION ................................................................... 45
3.1. SHRINKAGE ................................................................................................... 45
3.1.1. Results. ................................................................................................... 45
3.1.2. Conclusions and Discussion. .................................................................. 45
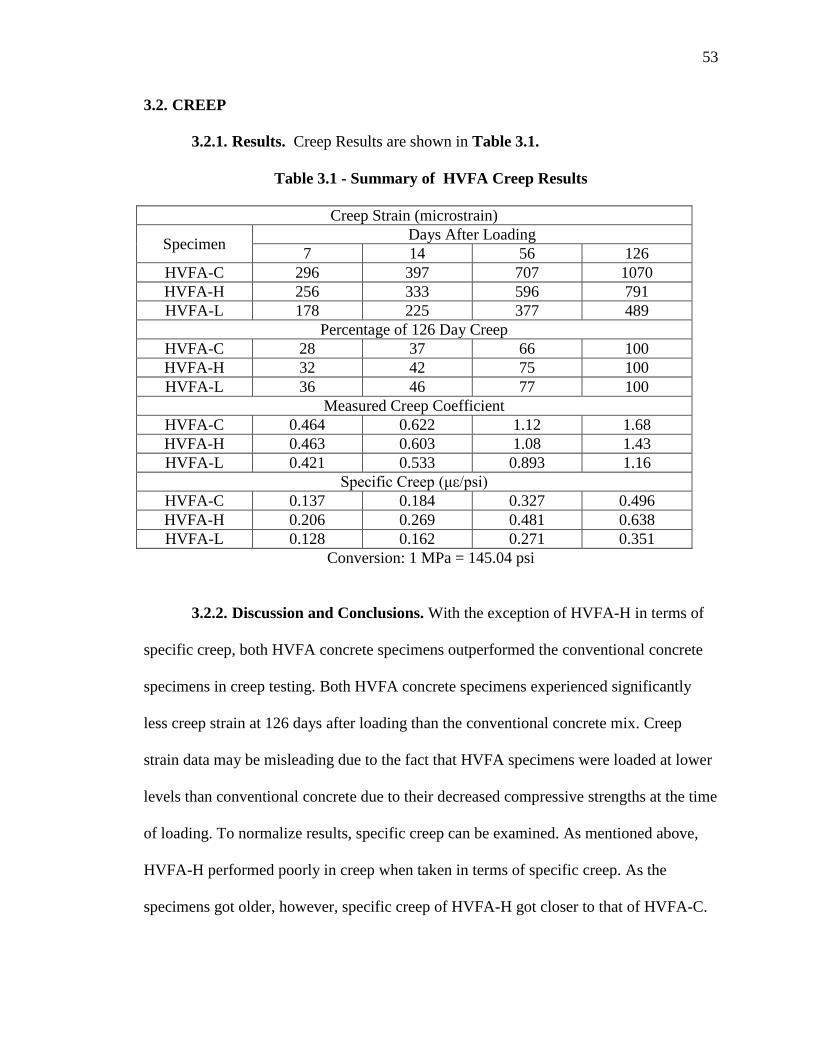
3.2. CREEP .............................................................................................................. 53
3.2.1. Results. ................................................................................................... 53
3.2.2. Discussion and Conclusions. .................................................................. 53
3.3. ABRASION RESISTANCE ............................................................................. 54
3.3.1. Results. ................................................................................................... 54
3.3.2. Discussion and Conclusions. .................................................................. 58
APPENDIX A ....................................................................................................................60
APPENDIX B ....................................................................................................................64
APPENDIX C ....................................................................................................................67
BIBLIOGRAPHY ..............................................................................................................70
vi
LIST OF ILLUSTRATIONS
Figure Page
Figure 1.1 - Relationship Between Moist Cure Time and Shrinkage Strain ...................... 4
Figure 1.2 - Series A Shrinkage Results (adapted from Nath and Sarker) ....................... 17
Figure 1.3 - Series B Shrinkage Results (adapted from Nath and Sarker) ....................... 18
Figure 1.4 - Stress vs. Time for Prestressed Bridge Girder (Tadros et. al. 2003) ............. 26
Figure 2.1 - Shrinkage and Creep Form............................................................................ 32
Figure 2.2 – Shrinkage and Creep Specimens and DEMEC Point Arrangement (Myers
and Yang, 2005) ......................................................................................................... 34
Figure 2.3 – DEMEC Reading Taken on Specimen ......................................................... 36
Figure 2.4 - Reference Bar ................................................................................................ 36
Figure 2.5 - Reading Taken on Reference Bar ................................................................. 37
Figure 2.6 - Gauge Factor Used for Shrinkage and Creep Calculations ........................... 37
Figure 2.7 - Example DEMEC Gauge Reading ................................................................ 37
Figure 2.8 - Schematic of Creep Loading Frame (Myers and Yang, 2005) ..................... 38
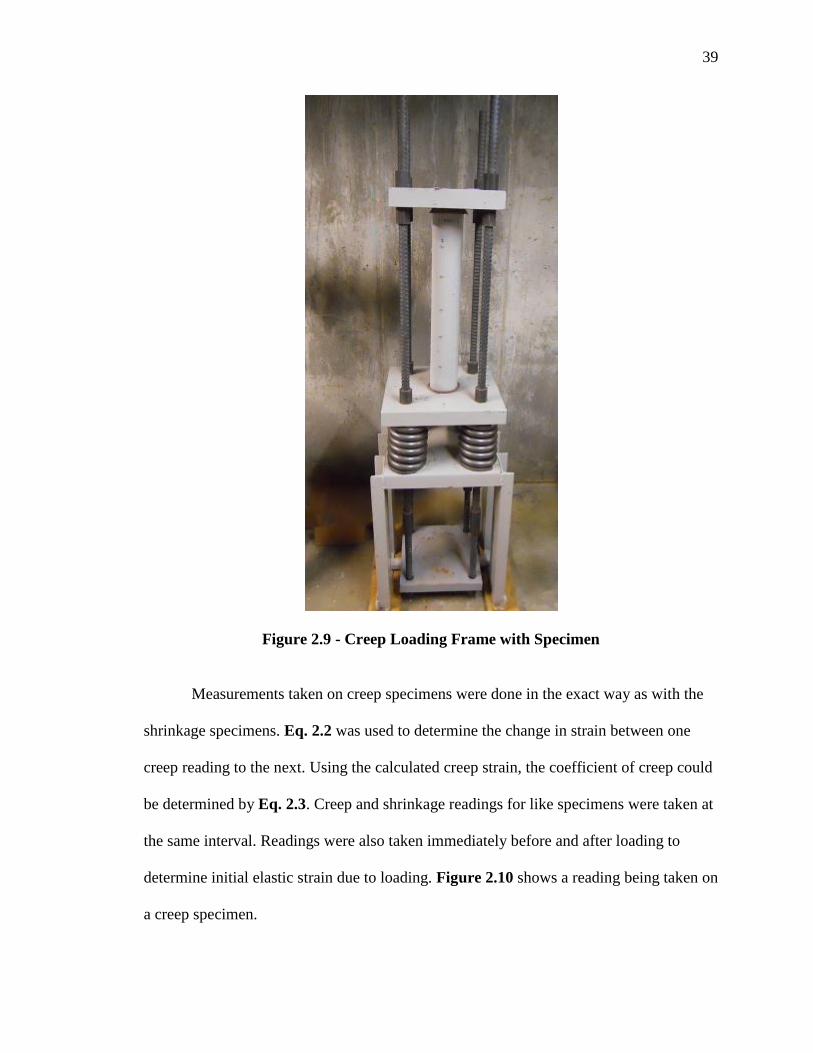
Figure 2.9 - Creep Loading Frame with Specimen ........................................................... 39
Figure 2.10 - Reading Taken on Creep Specimen ............................................................ 40
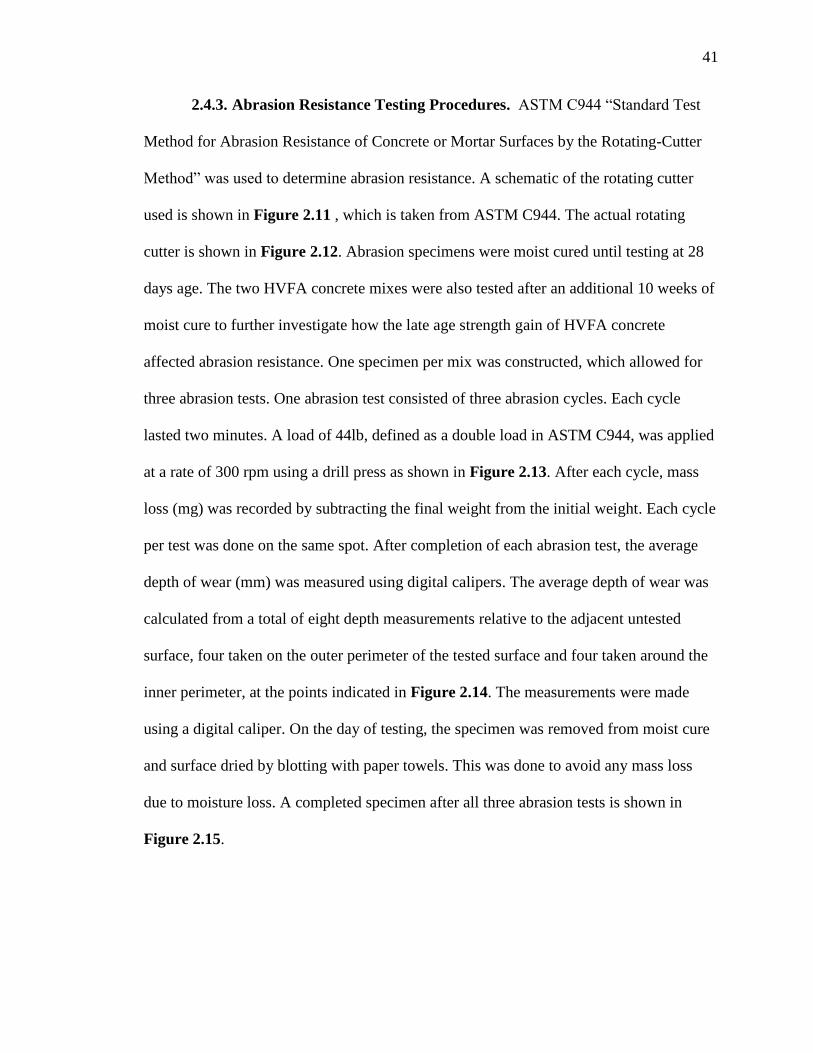
Figure 2.11 - Schematic of Abrasion Rotating Cutter (ASTM C944) .............................. 42
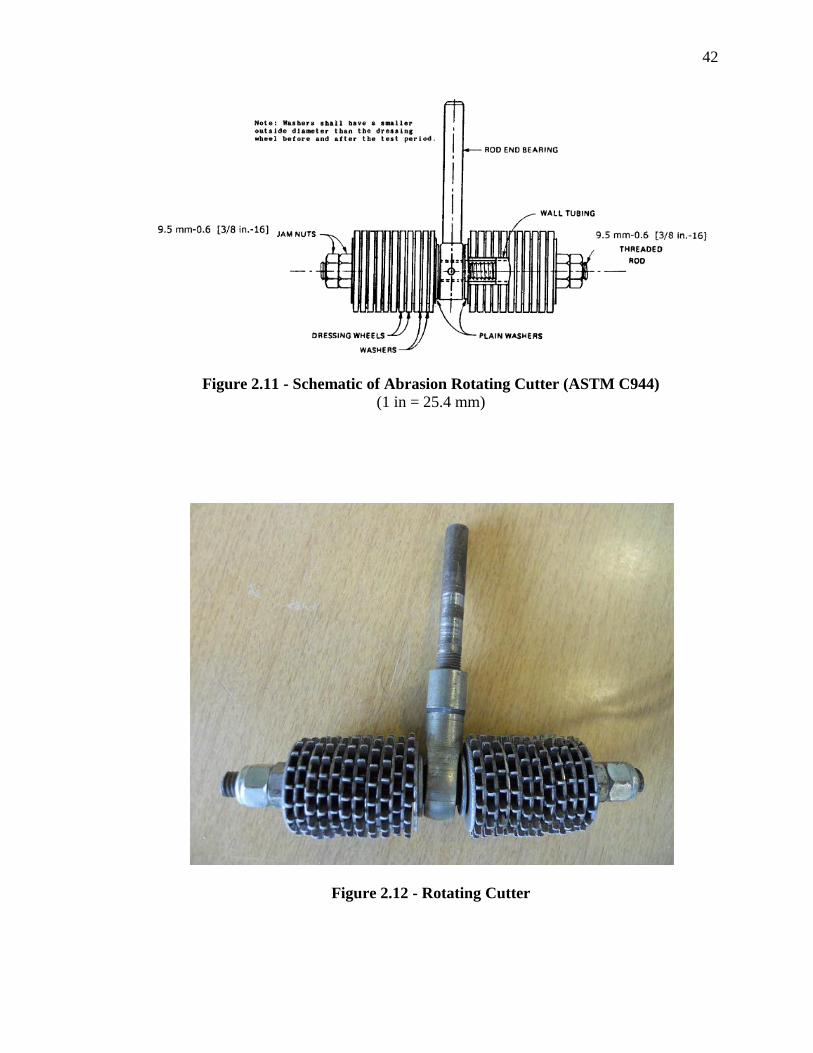
Figure 2.12 - Rotating Cutter ............................................................................................ 42
Figure 2.13 - Abrasion Resistance Test In Progress ......................................................... 43
Figure 2.14 - Depth of Wear Measurement Points ........................................................... 43
Figure 2.15 - Abrasion Resistance Specimen After Testing ............................................. 44
Figure 3.1 - HVFA-C Shrinkage Results and Prediction Models ..................................... 46
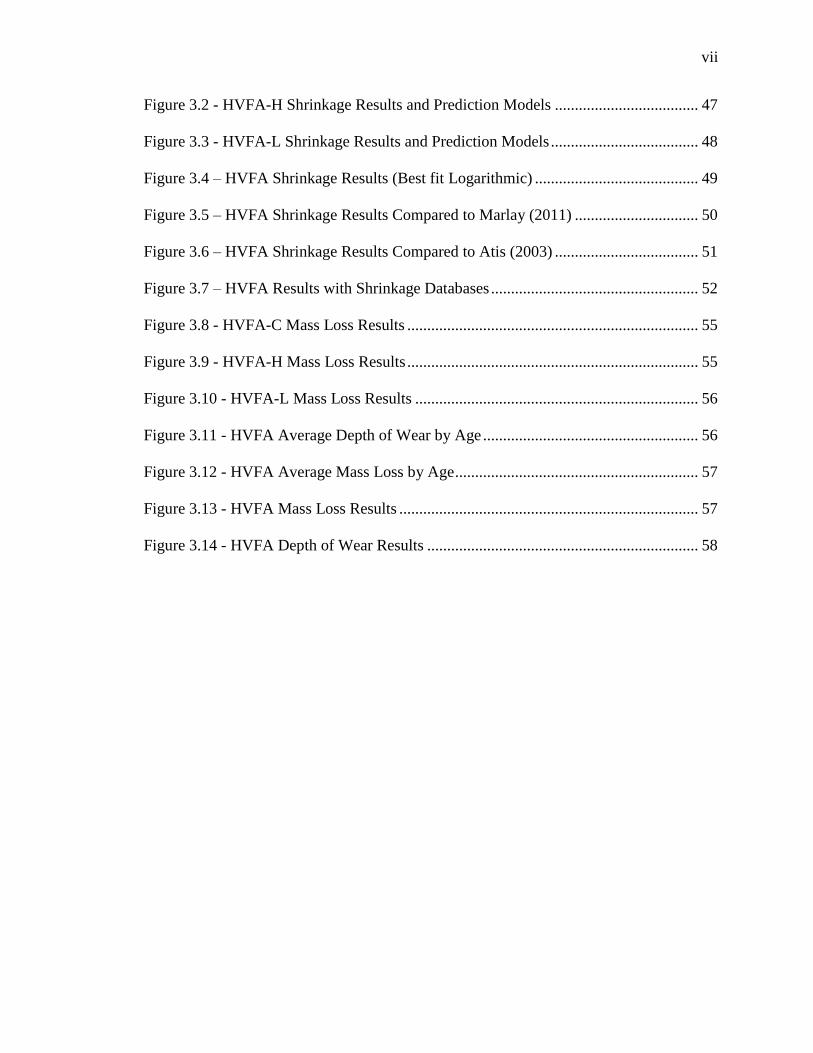
vii
Figure 3.2 - HVFA-H Shrinkage Results and Prediction Models .................................... 47
Figure 3.3 - HVFA-L Shrinkage Results and Prediction Models ..................................... 48
Figure 3.4 – HVFA Shrinkage Results (Best fit Logarithmic) ......................................... 49
Figure 3.5 – HVFA Shrinkage Results Compared to Marlay (2011) ............................... 50
Figure 3.6 – HVFA Shrinkage Results Compared to Atis (2003) .................................... 51
Figure 3.7 – HVFA Results with Shrinkage Databases .................................................... 52
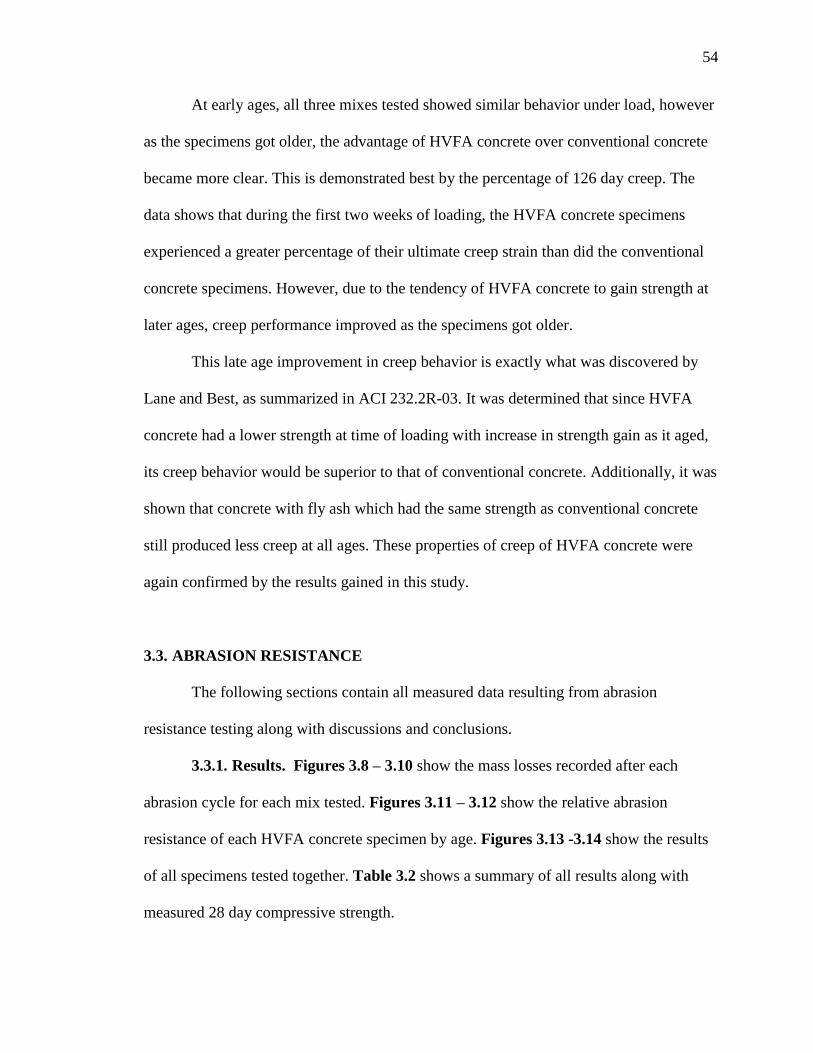
Figure 3.8 - HVFA-C Mass Loss Results ......................................................................... 55
Figure 3.9 - HVFA-H Mass Loss Results ......................................................................... 55
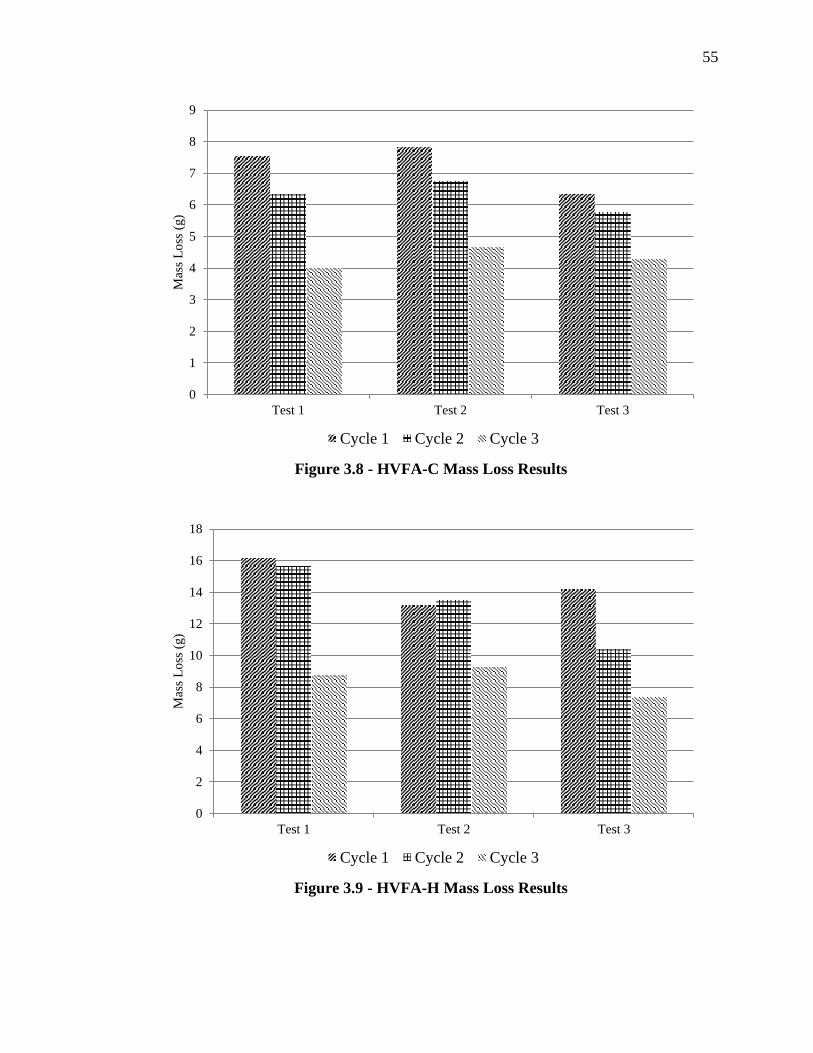
Figure 3.10 - HVFA-L Mass Loss Results ....................................................................... 56
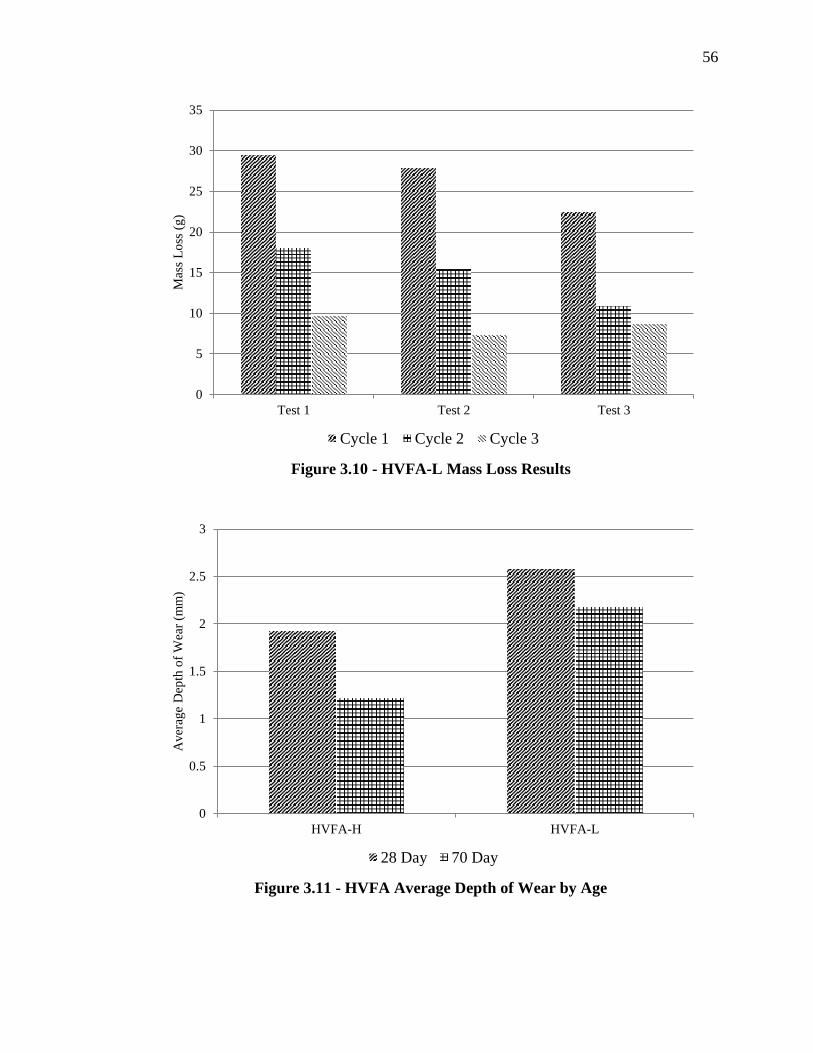
Figure 3.11 - HVFA Average Depth of Wear by Age ...................................................... 56
Figure 3.12 - HVFA Average Mass Loss by Age ............................................................. 57
Figure 3.13 - HVFA Mass Loss Results ........................................................................... 57
Figure 3.14 - HVFA Depth of Wear Results .................................................................... 58
viii
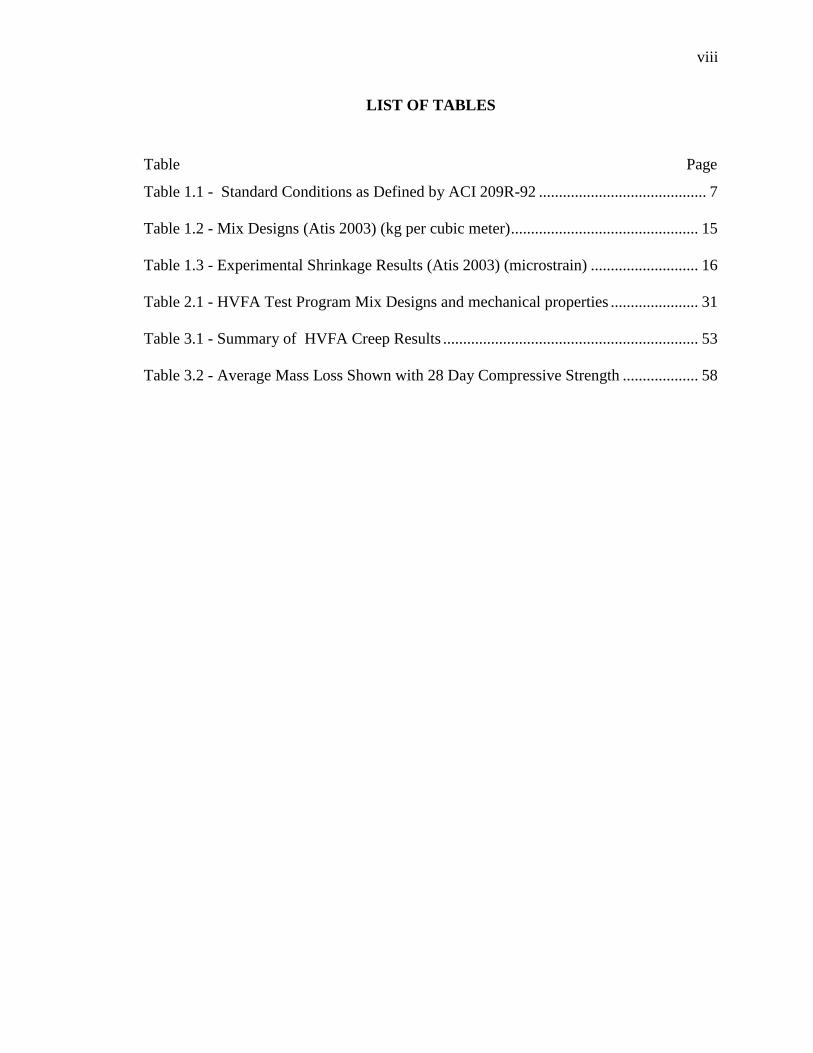
LIST OF TABLES
Table Page
Table 1.1 - Standard Conditions as Defined by ACI 209R-92 .......................................... 7
Table 1.2 - Mix Designs (Atis 2003) (kg per cubic meter) ............................................... 15
Table 1.3 - Experimental Shrinkage Results (Atis 2003) (microstrain) ........................... 16
Table 2.1 - HVFA Test Program Mix Designs and mechanical properties ...................... 31
Table 3.1 - Summary of HVFA Creep Results ................................................................ 53
Table 3.2 - Average Mass Loss Shown with 28 Day Compressive Strength ................... 58
ix
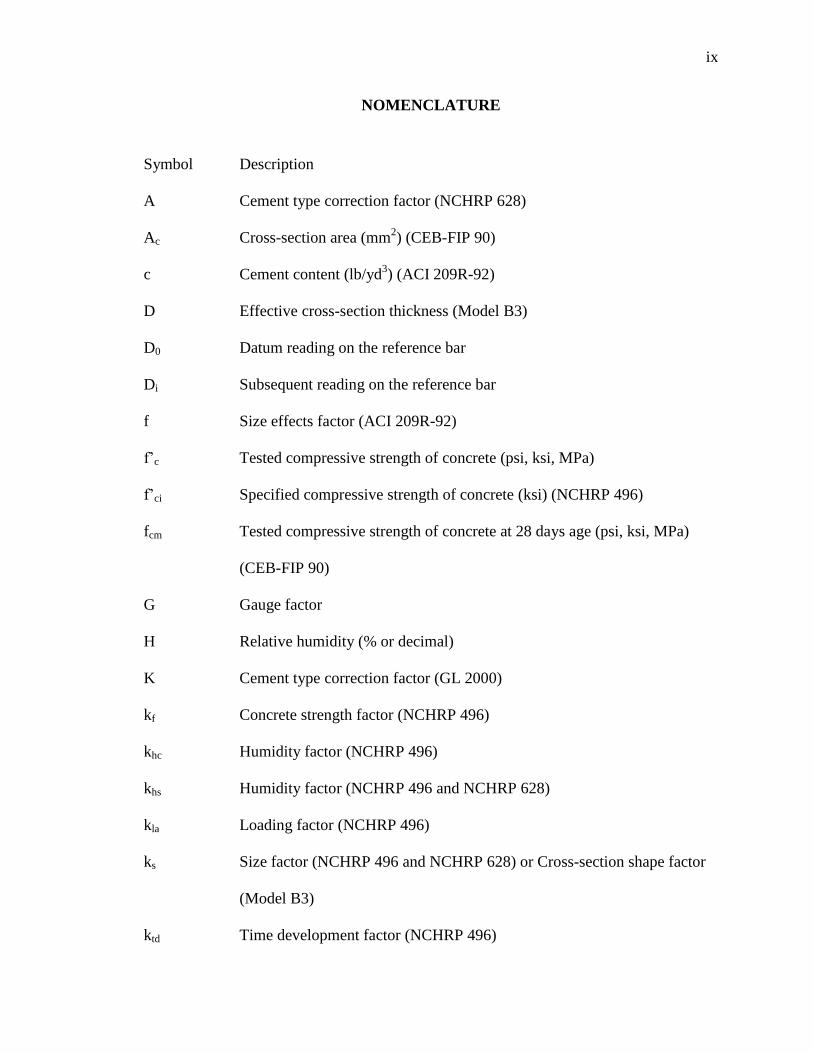
NOMENCLATURE
Symbol Description
A Cement type correction factor (NCHRP 628)
Ac Cross-section area (mm2) (CEB-FIP 90)
c Cement content (lb/yd3) (ACI 209R-92)
D Effective cross-section thickness (Model B3)
D0 Datum reading on the reference bar
Di Subsequent reading on the reference bar
f Size effects factor (ACI 209R-92)
f’c Tested compressive strength of concrete (psi, ksi, MPa)
f’ci Specified compressive strength of concrete (ksi) (NCHRP 496)
fcm Tested compressive strength of concrete at 28 days age (psi, ksi, MPa)
(CEB-FIP 90)
G Gauge factor
H Relative humidity (% or decimal)
K Cement type correction factor (GL 2000)
kf Concrete strength factor (NCHRP 496)
khc Humidity factor (NCHRP 496)
khs Humidity factor (NCHRP 496 and NCHRP 628)
kla Loading factor (NCHRP 496)
ks Size factor (NCHRP 496 and NCHRP 628) or Cross-section shape factor
(Model B3)
ktd Time development factor (NCHRP 496)
x
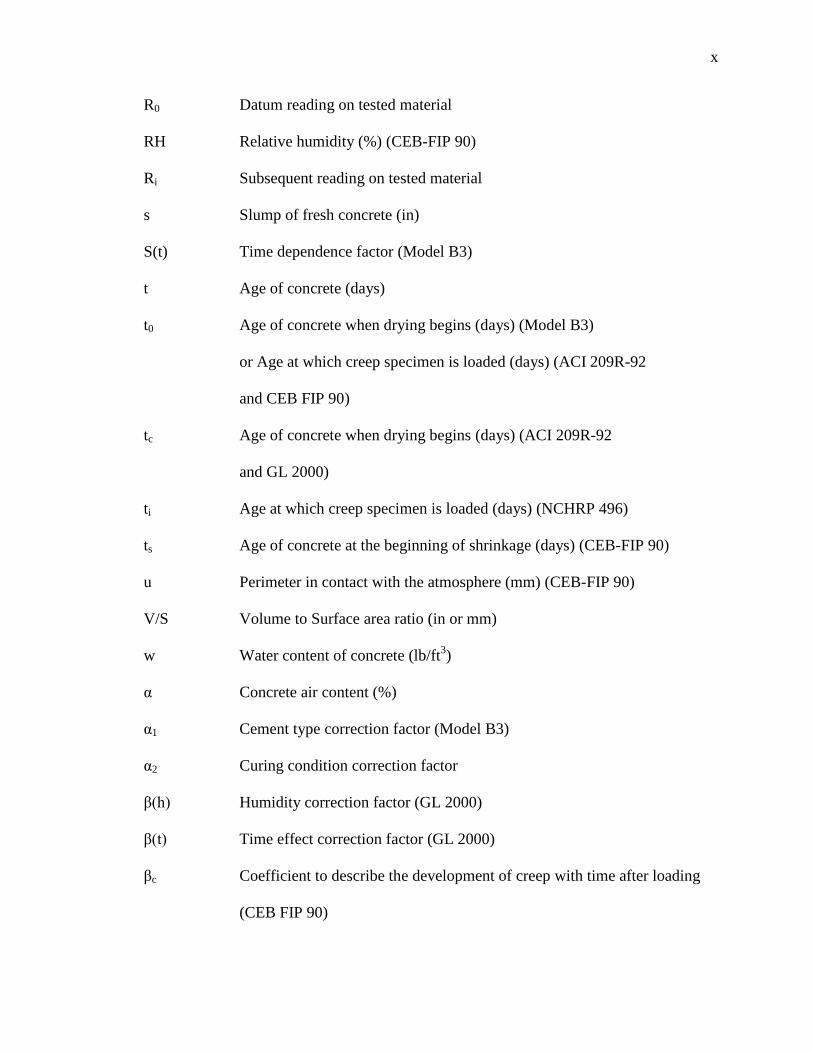
R0 Datum reading on tested material
RH Relative humidity (%) (CEB-FIP 90)
Ri Subsequent reading on tested material
s Slump of fresh concrete (in)
S(t) Time dependence factor (Model B3)
t Age of concrete (days)
t0 Age of concrete when drying begins (days) (Model B3)
or Age at which creep specimen is loaded (days) (ACI 209R-92
and CEB FIP 90)
tc Age of concrete when drying begins (days) (ACI 209R-92
and GL 2000)
ti Age at which creep specimen is loaded (days) (NCHRP 496)
ts Age of concrete at the beginning of shrinkage (days) (CEB-FIP 90)
u Perimeter in contact with the atmosphere (mm) (CEB-FIP 90)
V/S Volume to Surface area ratio (in or mm)
w Water content of concrete (lb/ft3)
α Concrete air content (%)
α1 Cement type correction factor (Model B3)
α2 Curing condition correction factor
β(h) Humidity correction factor (GL 2000)
β(t) Time effect correction factor (GL 2000)
βc Coefficient to describe the development of creep with time after loading
(CEB FIP 90)
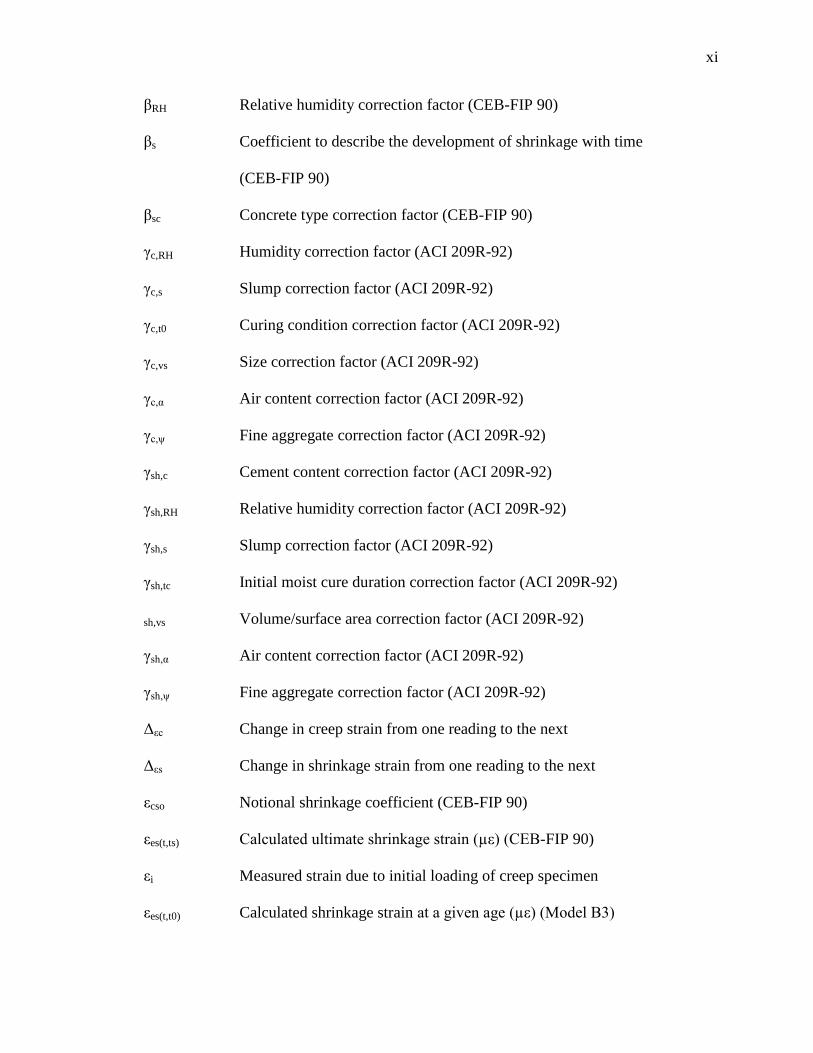
xi
βRH Relative humidity correction factor (CEB-FIP 90)
βs Coefficient to describe the development of shrinkage with time
(CEB-FIP 90)
βsc Concrete type correction factor (CEB-FIP 90)
γc,RH Humidity correction factor (ACI 209R-92)
γc,s Slump correction factor (ACI 209R-92)
γc,t0 Curing condition correction factor (ACI 209R-92)
γc,vs Size correction factor (ACI 209R-92)
γc,α Air content correction factor (ACI 209R-92)
γc,ψ Fine aggregate correction factor (ACI 209R-92)
γsh,c Cement content correction factor (ACI 209R-92)
γsh,RH Relative humidity correction factor (ACI 209R-92)
γsh,s Slump correction factor (ACI 209R-92)
γsh,tc Initial moist cure duration correction factor (ACI 209R-92)
sh,vs Volume/surface area correction factor (ACI 209R-92)
γsh,α Air content correction factor (ACI 209R-92)
γsh,ψ Fine aggregate correction factor (ACI 209R-92)
Δεc Change in creep strain from one reading to the next
Δεs Change in shrinkage strain from one reading to the next
εcso Notional shrinkage coefficient (CEB-FIP 90)
εes(t,ts) Calculated ultimate shrinkage strain (µε) (CEB-FIP 90)
εi Measured strain due to initial loading of creep specimen
εes(t,t0) Calculated shrinkage strain at a given age (µε) (Model B3)
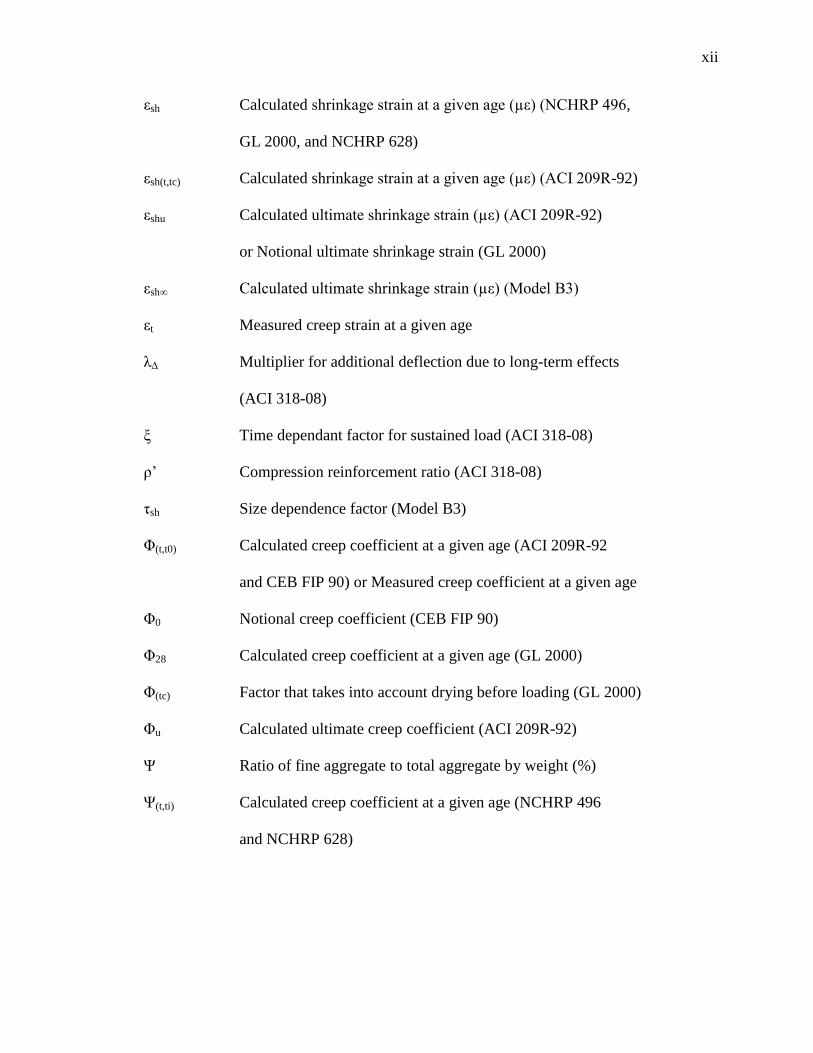
xii
εsh Calculated shrinkage strain at a given age (µε) (NCHRP 496,
GL 2000, and NCHRP 628)
εsh(t,tc) Calculated shrinkage strain at a given age (µε) (ACI 209R-92)
εshu Calculated ultimate shrinkage strain (µε) (ACI 209R-92)
or Notional ultimate shrinkage strain (GL 2000)
εsh∞ Calculated ultimate shrinkage strain (µε) (Model B3)
εt Measured creep strain at a given age
λΔ Multiplier for additional deflection due to long-term effects
(ACI 318-08)
ξ Time dependant factor for sustained load (ACI 318-08)
ρ’ Compression reinforcement ratio (ACI 318-08)
τsh Size dependence factor (Model B3)
Φ(t,t0) Calculated creep coefficient at a given age (ACI 209R-92
and CEB FIP 90) or Measured creep coefficient at a given age
Φ0 Notional creep coefficient (CEB FIP 90)
Φ28 Calculated creep coefficient at a given age (GL 2000)
Φ(tc) Factor that takes into account drying before loading (GL 2000)
Φu Calculated ultimate creep coefficient (ACI 209R-92)
Ψ Ratio of fine aggregate to total aggregate by weight (%)
Ψ(t,ti) Calculated creep coefficient at a given age (NCHRP 496
and NCHRP 628)
1. LITERATURE REVIEW
1.1. HIGH VOLUME FLY ASH CONCRETE (HVFA)
1.1.1. Fly Ash. Fly ash is defined by ACI 116R-00 as “the finely divided residue
that results from the combustion of ground or powdered coal and that is transported by
flue gases from the combustion zone to the particle removal system.” Fly ash is often
collected in this manner from coal burning electric power plants and is considered a
waste product of the power plant. As reported by the American Coal Ash Association’s
2010 Coal Combustion Product Production & Use Survey Report, there were 67,700,000
tons (61,400,000,000 kg) of fly ash produced, of which 11,000,000 tons (9,990,000,000
kg) (16.3%) were used in concrete, concrete products, or grout.
1.1.2. Definition of HFVA. Concretes containing 15% - 35% fly ash
replacement by mass of total cementitious material are typically used. High volume
concrete is concrete that contains a much higher percentage of fly ash replacement than
the typical fly ash concrete mix. The exact definition of high volume fly ash concrete
varies depending on the source. ACI 232.2R-03 states “HVFA concrete may be defined
as having a fly ash content of 50% or greater by mass of cementitious materials.” ACI
also cites research from Haque, Langan, and Ward (1984) and Ramme and Tharaniyil
(2000) which define high volume fly ash concrete as concrete with fly ash replacement of
40% and 37% respectively. The report concludes that “HVFA concrete can be considered
to represent concrete containing higher percentages of fly ash than normal for the
intended application of the concrete.” (ACI 232.2R-11)
2
1.1.3. Advantages of HVFA. The advantages of using fly ash as a replacement
for Portland cement in concrete production include economic benefits, environmental
benefits, as well as some advantageous material properties. Fly ash is generally cheaper
to purchase than Portland cement, however this is dependent on local availability and
transportation costs. Since fly ash is otherwise considered a waste product, which is
either disposed of in landfills or released into the atmosphere, its use as a recycled
material is considered very environmentally advantageous. The use of HVFA concrete
can contribute to LEED certification by the U.S. Green Building Council, applicable to
MR credit 4-recycled content (USGBC). Use of fly ash also has beneficial effects on the
properties of the concrete in which it is used. Because fly ash has a lower specific gravity
than cement, its replacement by mass will increase the paste volume of the concrete,
allowing for an increase in workability. Fly ash also contributes to less bleeding in fresh
concrete. HVFA concrete also retards setting time and strength gain, which can be
beneficial in mass concrete projects. Research has also shown that fly ash concrete
reaches a higher ultimate strength than conventional concrete.
1.2. SHRINKAGE OF CONCRETE
1.2.1. Definition of Shrinkage. Shrinkage of concrete is the decrease in
volume of hardened concrete with time. Shrinkage is expressed as the strain measured on
a load-free specimen, most often as the dimensionless unit microstrain (strain x10-6
).
Concrete experiences shrinkage in three ways, drying shrinkage, autogenous (chemical)
shrinkage, and carbonation shrinkage. Autogenous shrinkage is due strictly to the
hydration reactions of the cement. Drying shrinkage is the strain imposed on a specimen
3
exposed to the atmosphere and allowed to dry. Carbonation shrinkage is caused by the
reaction of calcium hydroxide with cement with carbon dioxide in the atmosphere. The
magnitude and rate of shrinkage is dependent on a number of factors. These factors are
accounted for and described in the various industry models and research projects in the
following sections.
1.2.2. Factors Affecting Shrinkage (ACI 209.1R-05). Shrinkage of concrete is
closely related to shrinkage of paste. Therefore the amount of paste in the mix
significantly affects the level of concrete shrinkage. Paste volume is determined by the
quantity, size, and gradation of aggregate. Because paste volume is largely dependent on
aggregate properties, the most important factor in determining a concrete’s shrinkage
level is the aggregate used in the mix. Similarly, the water content, cement content, and
slump will affect the shrinkage of concrete. These three factors are indications of the
paste volume and therefore can be used to determine the shrinkage potential of a mix.
Aggregate acts as a restraining force to shrinkage, therefore an aggregate with a higher
modulus of elasticity (MOE) will better restrain against shrinkage than an aggregate with
a lower MOE. The characteristics of the cement itself are other significant indicators of
shrinkage potential. Research has shown cements with low sulfate content, high alumina
content, and cements that are finely ground exhibit increased shrinkage.
The environment which the concrete is exposed to can also influence shrinkage.
The biggest environmental factor is the relative humidity of the surrounding air. As
shown by Eq. 2.1, as relative humidity increases, shrinkage decreases due to the decrease
in potential moisture loss. It has also been shown that an increase in temperature
increases the ultimate shrinkage of concrete.

4
(1.1)
Where: h is relative humidity in percent, and b is a constant that ranges from 1 to 4.
Finally, the design and construction of concrete specimens can influence
shrinkage. The curing conditions experienced by the concrete have a significant effect on
shrinkage. Generally, the longer the specimen is allowed to moist cure, the less it will
shrink. However, research conducted by Perenchio (1997), Figure 1.1, shows that there
may not be a simple relationship between moist cure time and shrinkage.
Figure 1.1 - Relationship Between Moist Cure Time and Shrinkage Strain
(adapted from Perenchio 1997)
0
100
200
300
400
500
600
700
1 10 100 1000 10000
Dry
ing s
hri
nkag
e af
ter
1 y
ear,
mic
rost
rain
Initial moist curing period, hours
0.4
0.5
0.6
w/c ratio
5
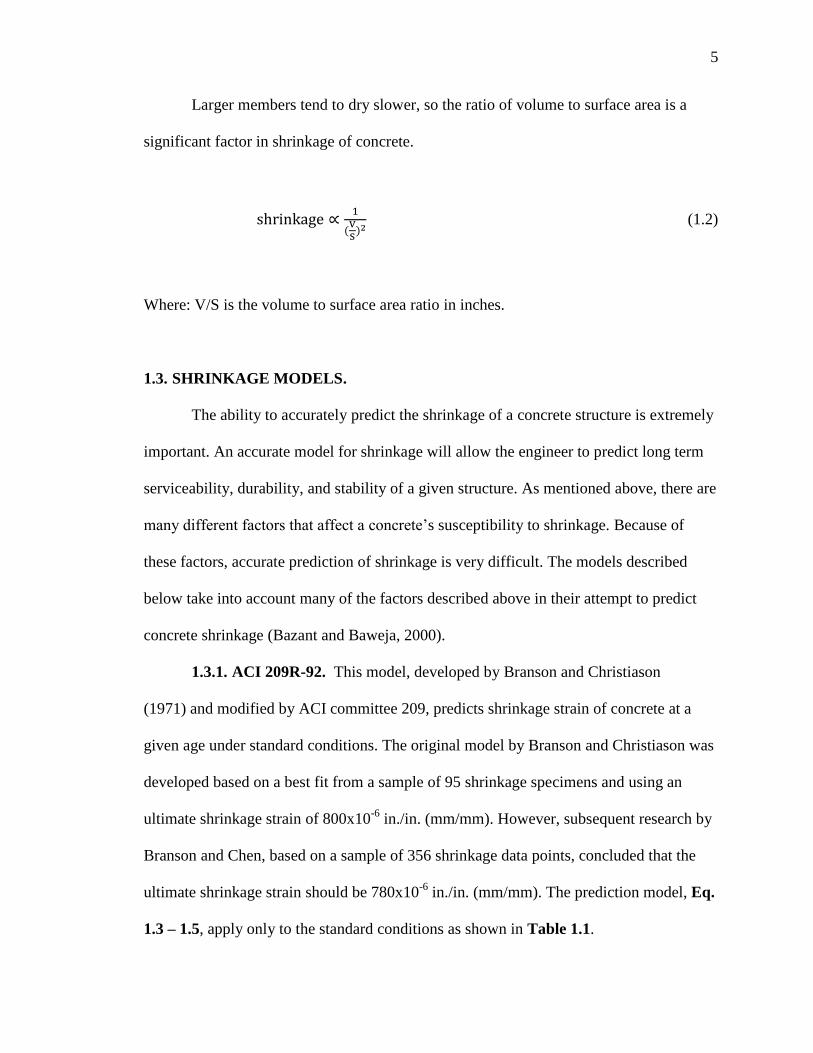
Larger members tend to dry slower, so the ratio of volume to surface area is a
significant factor in shrinkage of concrete.
(1.2)
Where: V/S is the volume to surface area ratio in inches.
1.3. SHRINKAGE MODELS.
The ability to accurately predict the shrinkage of a concrete structure is extremely
important. An accurate model for shrinkage will allow the engineer to predict long term
serviceability, durability, and stability of a given structure. As mentioned above, there are
many different factors that affect a concrete’s susceptibility to shrinkage. Because of
these factors, accurate prediction of shrinkage is very difficult. The models described
below take into account many of the factors described above in their attempt to predict
concrete shrinkage (Bazant and Baweja, 2000).
1.3.1. ACI 209R-92. This model, developed by Branson and Christiason
(1971) and modified by ACI committee 209, predicts shrinkage strain of concrete at a
given age under standard conditions. The original model by Branson and Christiason was
developed based on a best fit from a sample of 95 shrinkage specimens and using an
ultimate shrinkage strain of 800x10-6
in./in. (mm/mm). However, subsequent research by
Branson and Chen, based on a sample of 356 shrinkage data points, concluded that the
ultimate shrinkage strain should be 780x10-6
in./in. (mm/mm). The prediction model, Eq.
1.3 – 1.5, apply only to the standard conditions as shown in Table 1.1.
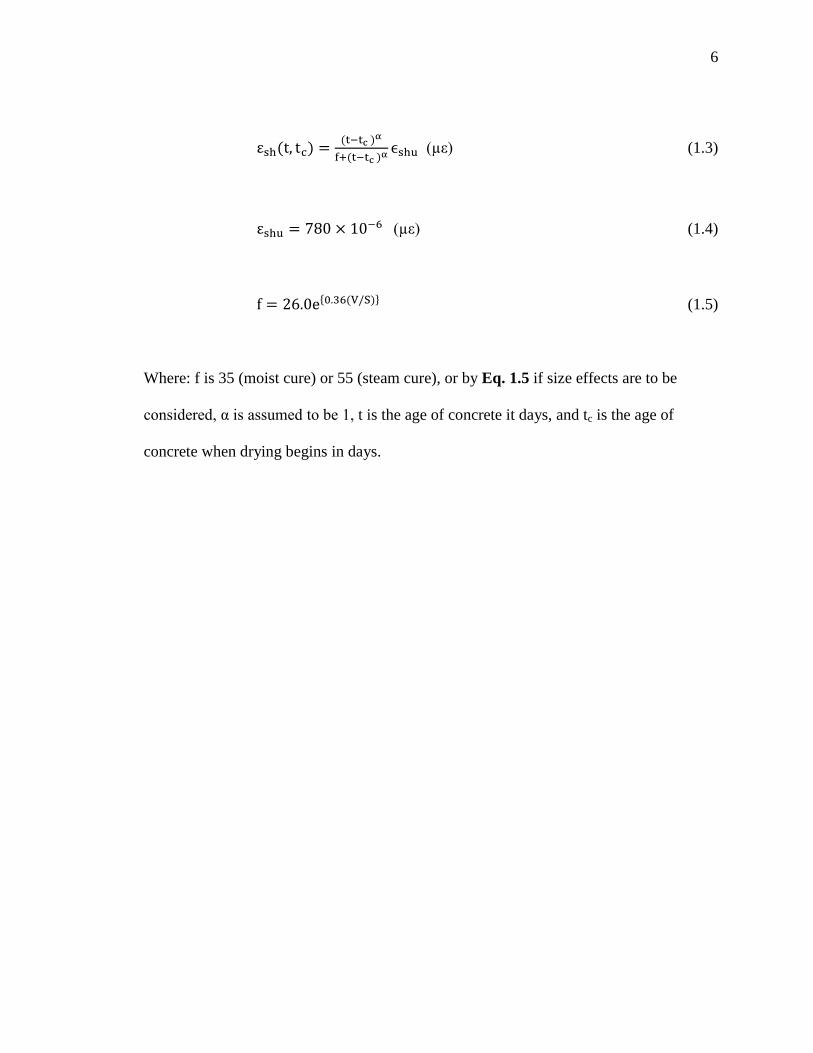
6
(µε) (1.3)
(µε) (1.4)
{ } (1.5)
Where: f is 35 (moist cure) or 55 (steam cure), or by Eq. 1.5 if size effects are to be
considered, α is assumed to be 1, t is the age of concrete it days, and tc is the age of
concrete when drying begins in days.
7
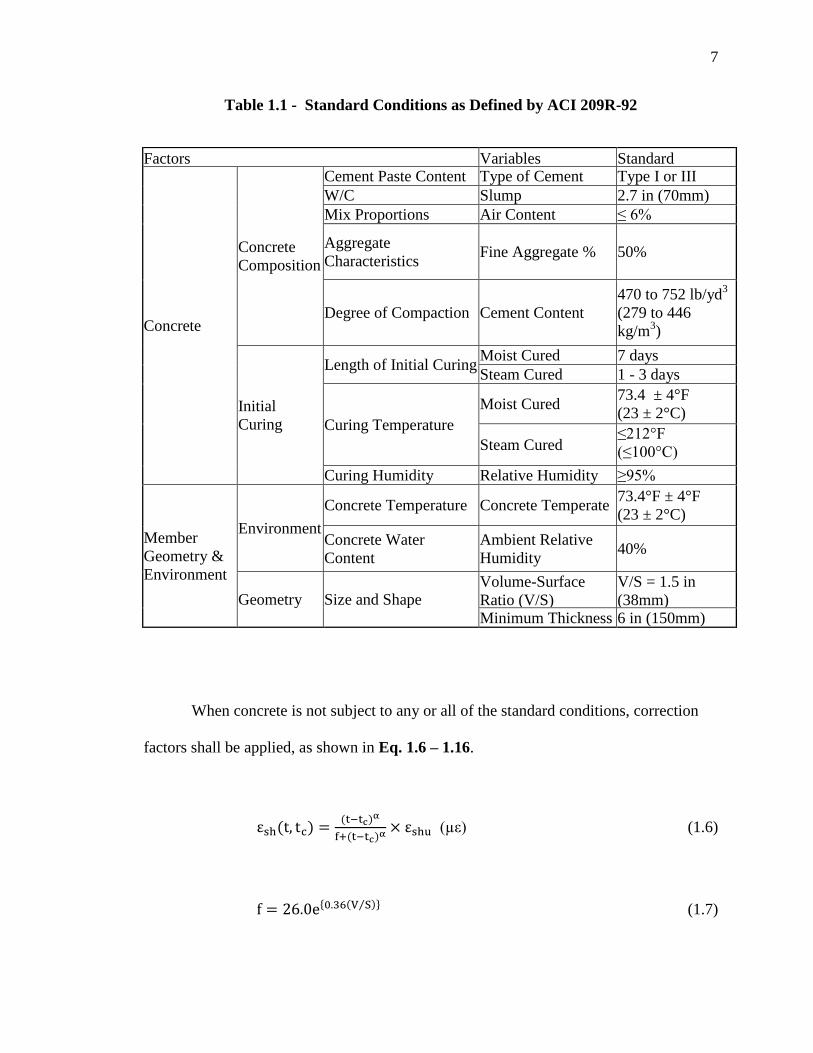
Table 1.1 - Standard Conditions as Defined by ACI 209R-92
When concrete is not subject to any or all of the standard conditions, correction
factors shall be applied, as shown in Eq. 1.6 – 1.16.
(µε) (1.6)
{ ⁄ } (1.7)
Factors Variables
Considered
Standard
Conditions
Concrete
Concrete
Composition
Cement Paste Content Type of Cement Type I or III
W/C Slump 2.7 in (70mm)
Mix Proportions Air Content ≤ 6%
Aggregate
Characteristics Fine Aggregate % 50%
Degree of Compaction Cement Content
470 to 752 lb/yd3
(279 to 446
kg/m3)
Initial
Curing
Length of Initial Curing Moist Cured 7 days
Steam Cured 1 - 3 days
Curing Temperature
Moist Cured 73.4 ± 4°F
(23 ± 2°C)
Steam Cured ≤212°F
(≤100°C)
Curing Humidity Relative Humidity ≥95%
Member
Geometry &
Environment
Environment
Concrete Temperature Concrete Temperate 73.4°F ± 4°F
(23 ± 2°C)
Concrete Water
Content
Ambient Relative
Humidity 40%
Geometry Size and Shape Volume-Surface
Ratio (V/S)
V/S = 1.5 in
(38mm) Minimum Thickness 6 in (150mm)
8
(µε) (1.8)
(1.9)
(1.10)
(1.11)
{ ⁄ } (1.12)
(1.13)
(1.14)
(1.15)
(1.16)
Where: εsh(t,tc) is the calculated shrinkage strain at a given age, εshu is the calculated
ultimate shrinkage strain, γsh,tc is the initial moist cure duration correction factor, t is the
age of concrete in days, tc is the age of concrete when drying starts in days, γsh,RH is the
relative humidity correction factor, h is humidity in decimals, γsh,vs is the volume/surface
9
area correction factor, where V/S is the volume to surface area ratio in inches, γsh,s is the
slump correction factor, s is slump in inches, γsh,ψ is the fine aggregate correction factor,
ψ is the ratio of fine aggregate to total aggregate by weight expressed as percentage, γsh,c
is the cement content correction factor, c is the cement content in lb/yd3, γsh,α is the air
content correction factor, and α is the air content in percent. In Eq 1.6, the value of α can
be assumed to be equal to 1, with f assumed to be equal to 35 for concrete that is moist
cured for seven days or 55 for concrete subject to 1-3 days of steam curing. In order to
totally consider shape and size effects, α is still assumed to be equal to 1, with f given by
Eq. 1.7.
1.3.2. NCHRP Report 496 (2003). The National Cooperative Highway Research
Program (NCHRP) conducted research on shrinkage of high strength concrete in the
states of Nebraska, New Hampshire, Texas, and Washington. This research project was
sponsored by the American Association of State Highway and Transportation Officials
(AASHTO) and the results adopted into the 2007 AASHTO LRFD Bridge Design
Specifications. Laboratory shrinkage data was obtained from three 4 in. (101.6 mm) by 4
in. (101.6 mm) by 24 in. (609.6 mm) specimens per mix, with a total of 48 specimens
tested including both normal and high strength concrete. Field specimens were also made
and cured in the same condition as corresponding bridge girders in each of the four
participating states. The field program consisted of a set of three 4 in. (101.6 mm) by 4
in. (101.6 mm) by 24 in. (609.6 mm) shrinkage specimens at each location with
measurements taken for 3 months. The data showed that an ultimate shrinkage strain of
480x10-6
in./in. (mm/mm) should be assumed. The modification factors in the model
10
account for the effects of high strength concrete. Eq. 1.17 – 1.22 present the proposed
shrinkage formula as proposed in this study.
(µε) (1.17)
(1.18)
(1.19)
(1.20)
⁄
(1.21)
(1.22)
Where: εsh is the calculated shrinkage strain at a given age, ktd is the time development
factor, t is the age of the concrete in days, khs is the humidity factor, H is the average
ambient relative humidity in percent, ks is the size factor, V/S is the volume to surface
area ratio in inches, kf is the concrete strength factor, and f’ci is the specified compressive
strength of concrete in ksi.
11
1.3.3. Model B3. Model B3 (Bazant and Baweja) is the third update of
shrinkage predictions developed at Northwestern University, based on BP model β3 and
BP-KX model β4. This model is simpler than previous versions and is validated by a
larger set of test data. Eq. 1.23 – 1.32 present the B3 shrinkage prediction model.
(µε) (1.23)
√
(1.24)
(1.25)
(1.26)
⁄ (1.27)
⁄ (in.) (1.28)
(1.29)
12
[
] (µε) (1.30)
(1.31)
(1.32)
Where: εshu(t,t0) is the calculated shrinkage strain at a given age, S(t) is the time
dependence factor, t is the age of concrete in days, t0 is the age of concrete at which
drying begins, τsh is the size dependence factor, f’c is the cylinder compressive strength in
psi, D is the effective cross-section thickness, V/S is the volume to surface area ratio in
inches, ks is the cross-section shape factor, εsh∞ is the calculated ultimate shrinkage strain,
α1 is the cement type correction factor, α2 is the curing condition correction factor, and w
is the water content of the concrete in lb/ft3.
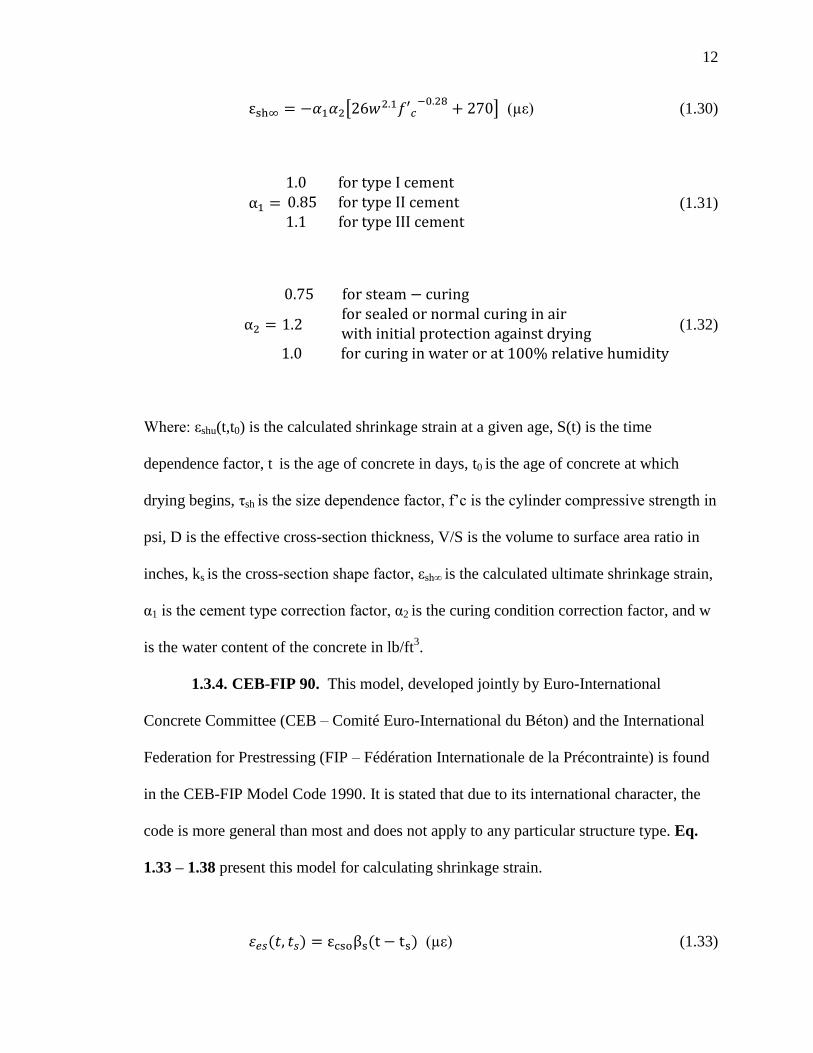
1.3.4. CEB-FIP 90. This model, developed jointly by Euro-International
Concrete Committee (CEB – Comité Euro-International du Béton) and the International
Federation for Prestressing (FIP – Fédération Internationale de la Précontrainte) is found
in the CEB-FIP Model Code 1990. It is stated that due to its international character, the
code is more general than most and does not apply to any particular structure type. Eq.
1.33 – 1.38 present this model for calculating shrinkage strain.
(µε) (1.33)
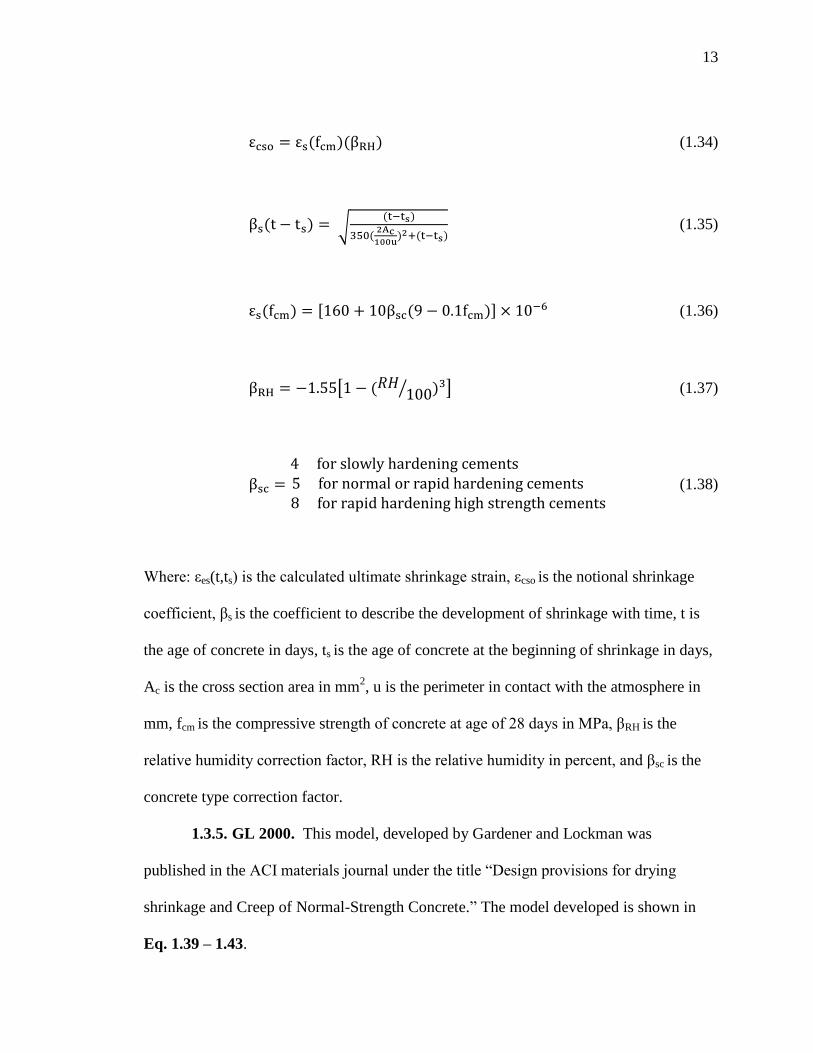
13
(1.34)
√
(1.35)
[ ] (1.36)
[ ⁄ ] (1.37)
(1.38)
Where: εes(t,ts) is the calculated ultimate shrinkage strain, εcso is the notional shrinkage
coefficient, βs is the coefficient to describe the development of shrinkage with time, t is
the age of concrete in days, ts is the age of concrete at the beginning of shrinkage in days,
Ac is the cross section area in mm2, u is the perimeter in contact with the atmosphere in
mm, fcm is the compressive strength of concrete at age of 28 days in MPa, βRH is the
relative humidity correction factor, RH is the relative humidity in percent, and βsc is the
concrete type correction factor.
1.3.5. GL 2000. This model, developed by Gardener and Lockman was
published in the ACI materials journal under the title “Design provisions for drying
shrinkage and Creep of Normal-Strength Concrete.” The model developed is shown in
Eq. 1.39 – 1.43.
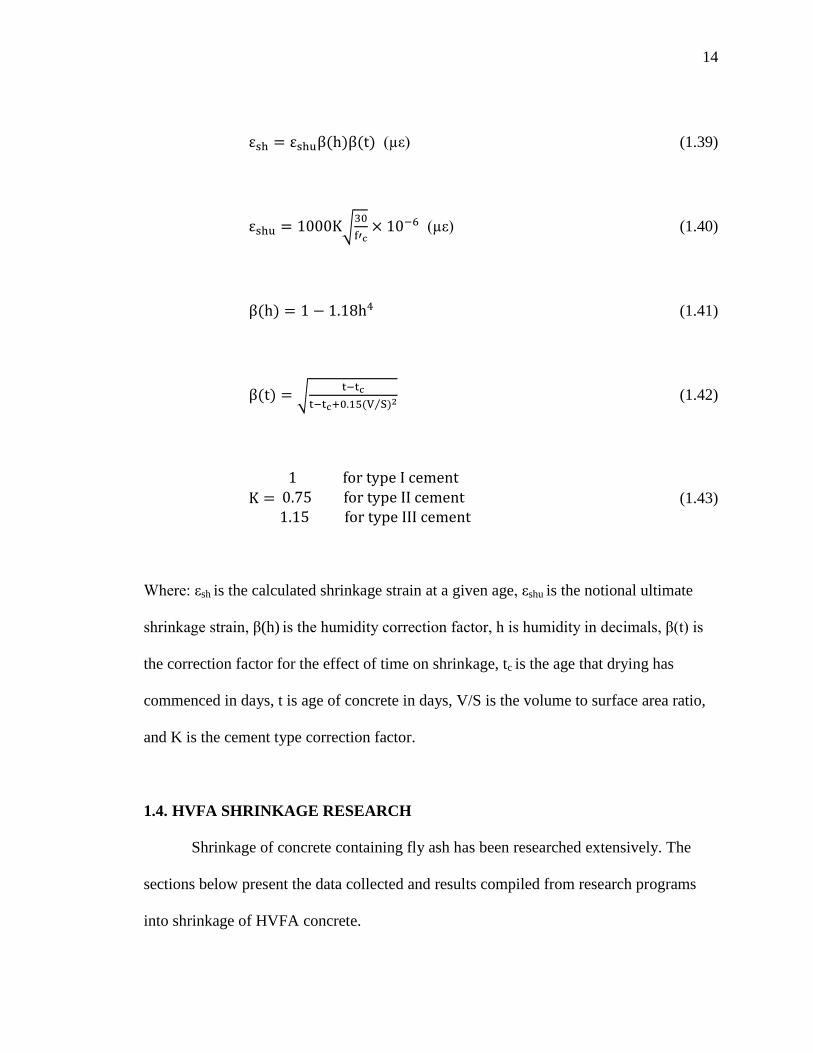
14
(µε) (1.39)
√
(µε) (1.40)
(1.41)
√
⁄ (1.42)
(1.43)
Where: εsh is the calculated shrinkage strain at a given age, εshu is the notional ultimate
shrinkage strain, β(h) is the humidity correction factor, h is humidity in decimals, β(t) is
the correction factor for the effect of time on shrinkage, tc is the age that drying has
commenced in days, t is age of concrete in days, V/S is the volume to surface area ratio,
and K is the cement type correction factor.
1.4. HVFA SHRINKAGE RESEARCH
Shrinkage of concrete containing fly ash has been researched extensively. The
sections below present the data collected and results compiled from research programs
into shrinkage of HVFA concrete.
15
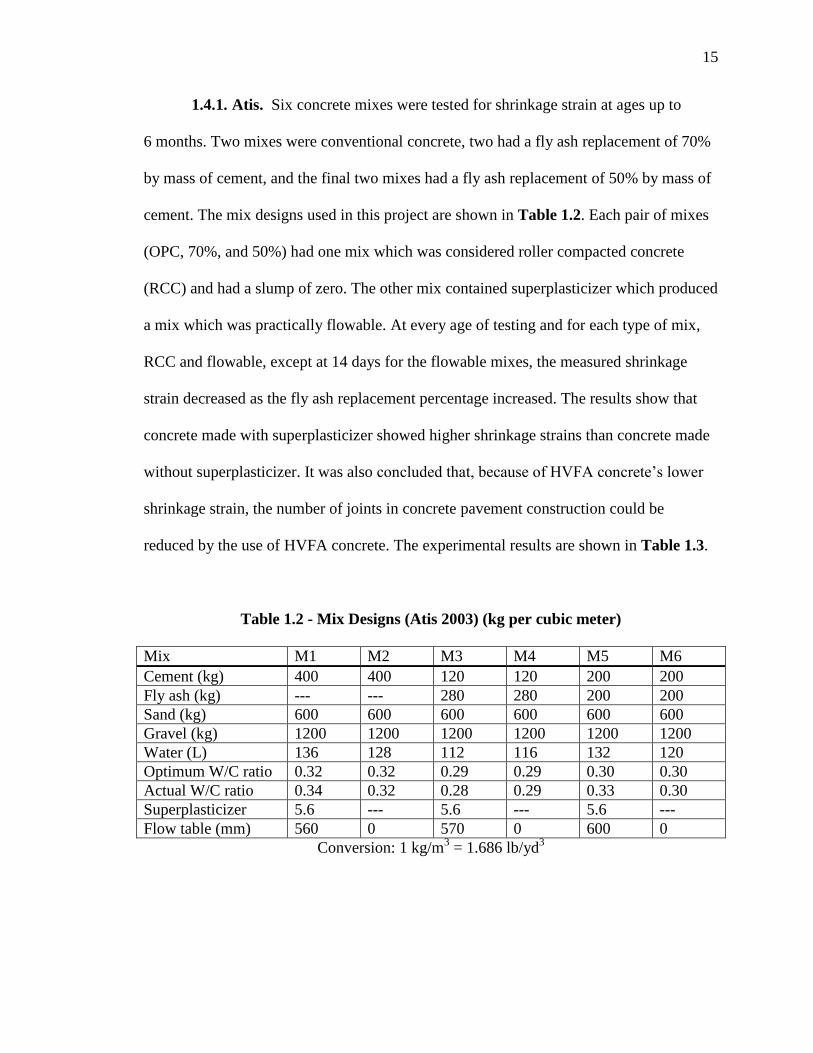
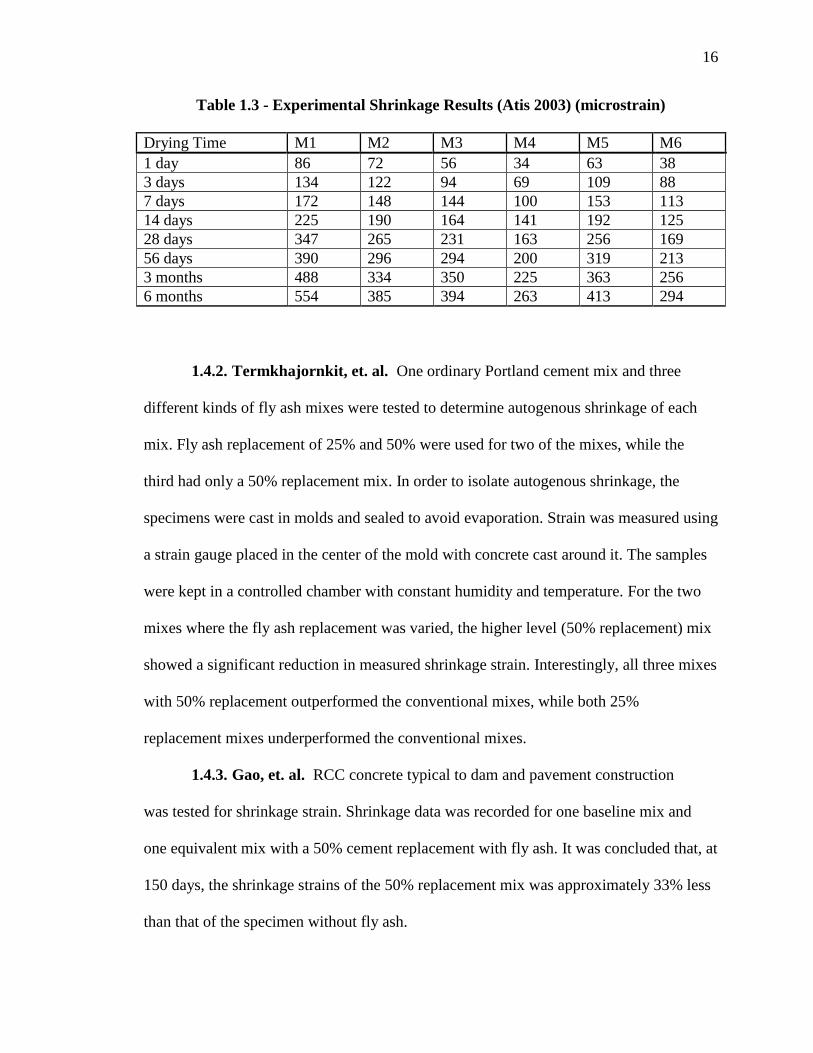
1.4.1. Atis. Six concrete mixes were tested for shrinkage strain at ages up to
6 months. Two mixes were conventional concrete, two had a fly ash replacement of 70%
by mass of cement, and the final two mixes had a fly ash replacement of 50% by mass of
cement. The mix designs used in this project are shown in Table 1.2. Each pair of mixes
(OPC, 70%, and 50%) had one mix which was considered roller compacted concrete
(RCC) and had a slump of zero. The other mix contained superplasticizer which produced
a mix which was practically flowable. At every age of testing and for each type of mix,
RCC and flowable, except at 14 days for the flowable mixes, the measured shrinkage
strain decreased as the fly ash replacement percentage increased. The results show that
concrete made with superplasticizer showed higher shrinkage strains than concrete made
without superplasticizer. It was also concluded that, because of HVFA concrete’s lower
shrinkage strain, the number of joints in concrete pavement construction could be
reduced by the use of HVFA concrete. The experimental results are shown in Table 1.3.
Table 1.2 - Mix Designs (Atis 2003) (kg per cubic meter)
Mix M1 M2 M3 M4 M5 M6
Cement (kg) 400 400 120 120 200 200
Fly ash (kg) --- --- 280 280 200 200
Sand (kg) 600 600 600 600 600 600
Gravel (kg) 1200 1200 1200 1200 1200 1200
Water (L) 136 128 112 116 132 120
Optimum W/C ratio 0.32 0.32 0.29 0.29 0.30 0.30
Actual W/C ratio 0.34 0.32 0.28 0.29 0.33 0.30
Superplasticizer 5.6 --- 5.6 --- 5.6 ---
Flow table (mm) 560 0 570 0 600 0
Conversion: 1 kg/m3 = 1.686 lb/yd
3
16
Table 1.3 - Experimental Shrinkage Results (Atis 2003) (microstrain)
Drying Time M1 M2 M3 M4 M5 M6
1 day 86 72 56 34 63 38
3 days 134 122 94 69 109 88
7 days 172 148 144 100 153 113
14 days 225 190 164 141 192 125
28 days 347 265 231 163 256 169
56 days 390 296 294 200 319 213
3 months 488 334 350 225 363 256
6 months 554 385 394 263 413 294
1.4.2. Termkhajornkit, et. al. One ordinary Portland cement mix and three
different kinds of fly ash mixes were tested to determine autogenous shrinkage of each
mix. Fly ash replacement of 25% and 50% were used for two of the mixes, while the
third had only a 50% replacement mix. In order to isolate autogenous shrinkage, the
specimens were cast in molds and sealed to avoid evaporation. Strain was measured using
a strain gauge placed in the center of the mold with concrete cast around it. The samples
were kept in a controlled chamber with constant humidity and temperature. For the two
mixes where the fly ash replacement was varied, the higher level (50% replacement) mix
showed a significant reduction in measured shrinkage strain. Interestingly, all three mixes
with 50% replacement outperformed the conventional mixes, while both 25%
replacement mixes underperformed the conventional mixes.
1.4.3. Gao, et. al. RCC concrete typical to dam and pavement construction
was tested for shrinkage strain. Shrinkage data was recorded for one baseline mix and
one equivalent mix with a 50% cement replacement with fly ash. It was concluded that, at
150 days, the shrinkage strains of the 50% replacement mix was approximately 33% less
than that of the specimen without fly ash.
17
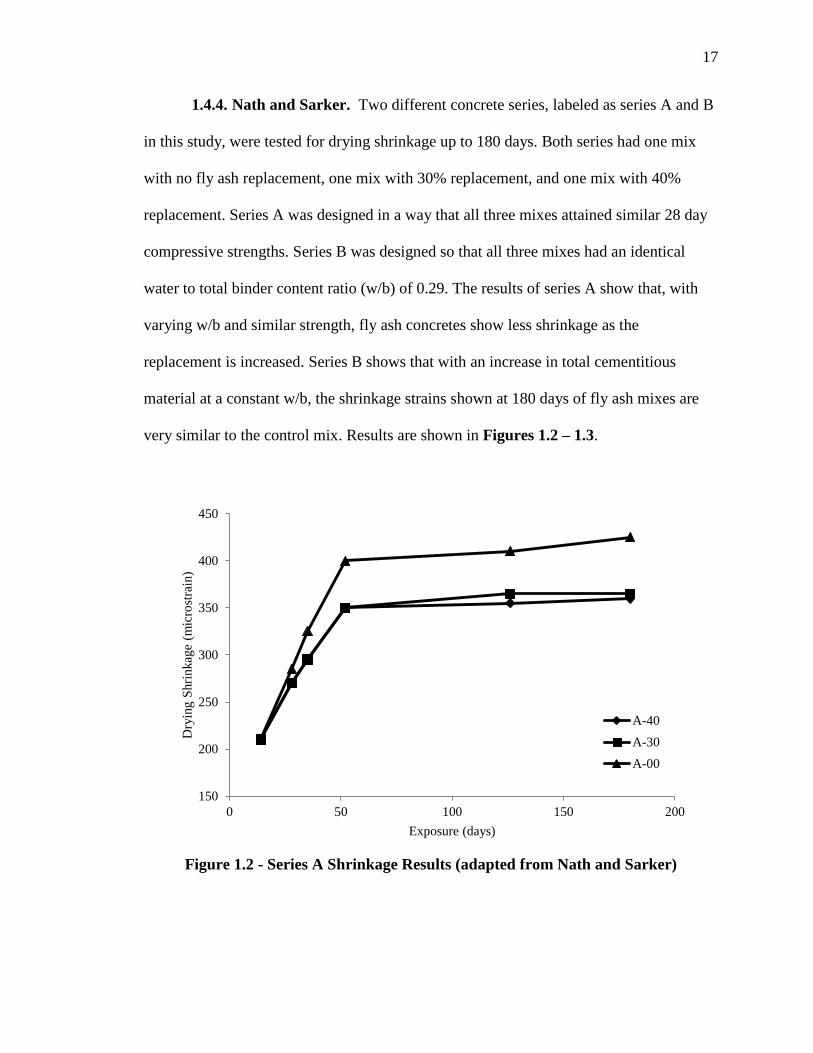
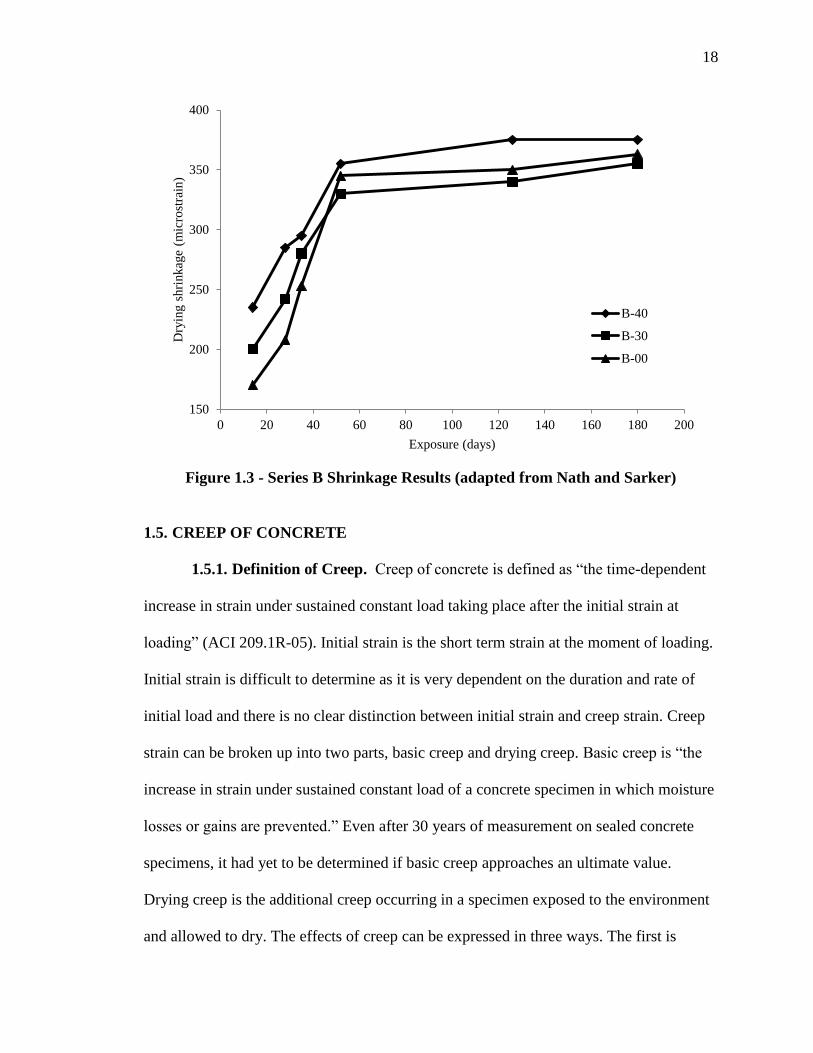
1.4.4. Nath and Sarker. Two different concrete series, labeled as series A and B
in this study, were tested for drying shrinkage up to 180 days. Both series had one mix
with no fly ash replacement, one mix with 30% replacement, and one mix with 40%
replacement. Series A was designed in a way that all three mixes attained similar 28 day
compressive strengths. Series B was designed so that all three mixes had an identical
water to total binder content ratio (w/b) of 0.29. The results of series A show that, with
varying w/b and similar strength, fly ash concretes show less shrinkage as the
replacement is increased. Series B shows that with an increase in total cementitious
material at a constant w/b, the shrinkage strains shown at 180 days of fly ash mixes are
very similar to the control mix. Results are shown in Figures 1.2 – 1.3.
Figure 1.2 - Series A Shrinkage Results (adapted from Nath and Sarker)
150
200
250
300
350
400
450
0 50 100 150 200
Dry
ing S
hri
nkag
e (m
icro
stra
in)
Exposure (days)
A-40
A-30
A-00
18
Figure 1.3 - Series B Shrinkage Results (adapted from Nath and Sarker)
1.5. CREEP OF CONCRETE
1.5.1. Definition of Creep. Creep of concrete is defined as “the time-dependent
increase in strain under sustained constant load taking place after the initial strain at
loading” (ACI 209.1R-05). Initial strain is the short term strain at the moment of loading.
Initial strain is difficult to determine as it is very dependent on the duration and rate of
initial load and there is no clear distinction between initial strain and creep strain. Creep
strain can be broken up into two parts, basic creep and drying creep. Basic creep is “the
increase in strain under sustained constant load of a concrete specimen in which moisture
losses or gains are prevented.” Even after 30 years of measurement on sealed concrete
specimens, it had yet to be determined if basic creep approaches an ultimate value.
Drying creep is the additional creep occurring in a specimen exposed to the environment
and allowed to dry. The effects of creep can be expressed in three ways. The first is
150
200
250
300
350
400
0 20 40 60 80 100 120 140 160 180 200
Dry
ing s
hri
nkag
e (m
icro
stra
in)
Exposure (days)
B-40
B-30
B-00
19
similar to that of shrinkage, where creep strain is simply expressed in terms of
microstrain (strain x10-6
). The second way is called the creep coefficient. The creep
coefficient is the ratio of creep strain to the initial strain at loading. The third is specific
creep. Specific creep is the ratio of microstrain to applied load (psi).
1.5.2. Factors Affecting Creep. Like shrinkage, creep is affected by numerous
material, mix design, environmental, and construction related factors. Similar to
shrinkage, the amount, size, gradation, and properties of the aggregate are very influential
on creep of concrete. An increase in aggregate volume will decrease creep. Aggregate
gradation is believed to influence creep of concrete because of its relation to changes in
overall aggregate volume. The size of aggregate affects bond between paste and
aggregate, which controls stress concentration and microcracking. Unlike shrinkage,
which is primarily affected by properties of the paste, creep is very dependent on the
elastic properties of the aggregate. Concretes with aggregate that have a lower modulus
of elasticity generally have higher creep. The primary environmental factor in creep is
relative humidity. As relative humidity increases, drying creep significantly decreases.
Specimens in environments where drying cannot occur may have only one quarter of the
creep of concrete which is allowed to dry. The effects of construction and design on creep
are slightly different than shrinkage. One similarity is that increased curing time will
decrease creep strain. Unlike shrinkage, basic creep is not affected by the size and shape
of the member. The factor that most affects creep is the load applied to the specimen.
The magnitude of the load, and the age at which the load is first applied are very
important. Loads up to 0.40f’c are considered to be linearly related to creep. Finally,
concrete loaded at later ages has lower creep.
20
1.6. CREEP MODELS
As with shrinkage, considerable research has been done and models developed to
predict the creep potential of concrete. The following sections will present various
models for calculating creep.
1.6.1. ACI 209R-92. This model is based on the same research as the ACI 209
shrinkage model. The standard conditions as shown in Table 1.1 apply to creep as well.
Eq. 1.44 – 1.46 represent the general model for concrete meeting the standard conditions.
If standard conditions are met, γc is taken to be equal to 1. Like the shrinkage model, if
any or all of the standard conditions are not met, the model modification factors must be
used as shown in Eq. 1.47 – 1.53.
(1.44)
(1.45)
{ ⁄ } (1.46)
(1.47)
(1.48)
(1.49)
21
{ ⁄ } (1.50)
(1.51)
(1.52)
(1.53)
Where: Φ(t,t0) is the calculated creep coefficient at a given age, Φu is the calculated
ultimate creep coefficient, t is the age of the specimen in days, γc,to is the curing condition
correction factor, t0 is the age at which the specimen is loaded in days, γc,RH is the
humidity correction factor, h is relative humidity in decimals, γc,VS is the size correction
factor, V/S is the volume to surface area ratio, γc,s is the slump correction factor, s is
slump in inches, γc,ψ is the fine aggregate correction factor, ψ is the ratio of fine aggregate
to total aggregate by weight expressed as percentage, γc,α is the air content correction
factor, and α is the air content in percent. For shape and size effects to be totally
considered, d is to be determined using Eq. 1.46 and ψ assumed to be equal to 1.0.
Otherwise, average values of d=10 and ψ=0.6 are to be assumed.
1.6.2. NCHRP Report 496. This proposed creep model was developed in a
similar manner to that of the NCHRP Report 496 shrinkage model. The correction factors
that are identical to those used in the corresponding shrinkage model have already been
defined in Section 1.3.2 The model is shown in Eq. 1.54 – 1.60.

22
(1.54)
(1.55)
(1.56)
(1.57)
⁄
(1.58)
(1.59)
(1.60)
Where: ψ(t,ti) is the calculated creep coefficient at a given age, ktd is the time
development factor, t is the age of the concrete in days, kla is the loading factor, ti is the
age at which creep specimen is loaded in days, ks is the size factor, V/S is the volume to
surface area ratio, khc is the humidity factor, H is the average ambient relative humidity in
percent, kf is the concrete strength factor, and f’ci is the specified compressive strength of
concete in ksi.
23
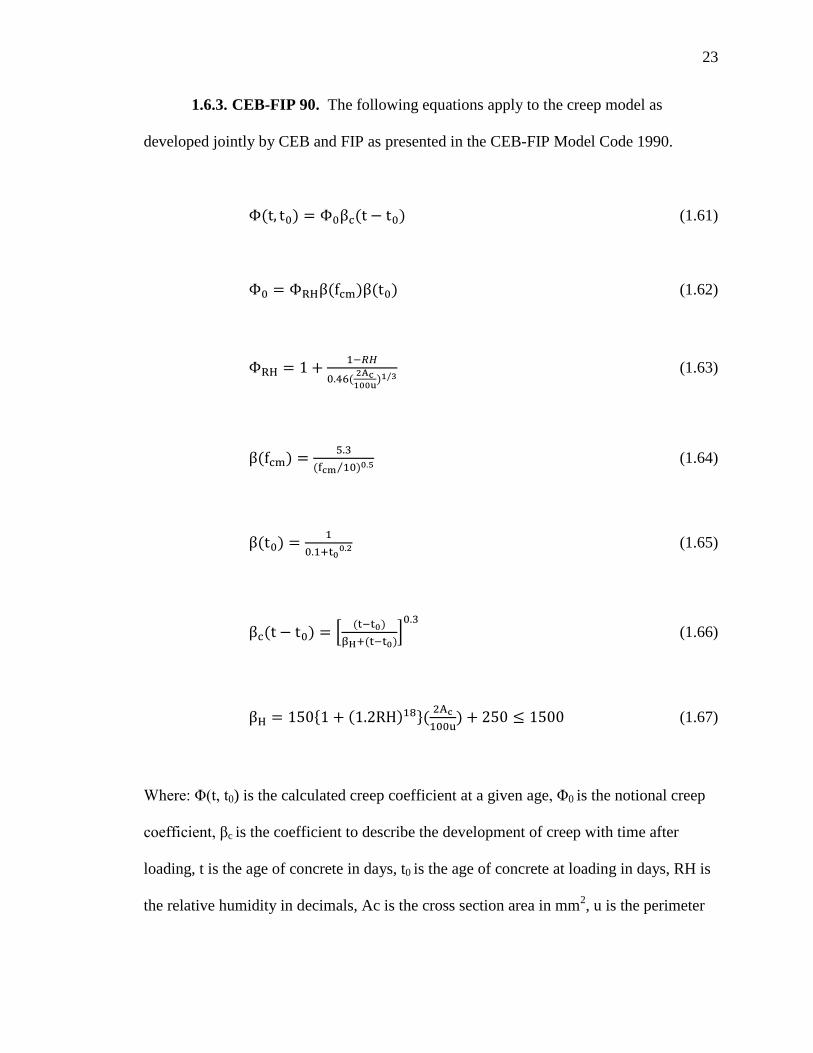
1.6.3. CEB-FIP 90. The following equations apply to the creep model as
developed jointly by CEB and FIP as presented in the CEB-FIP Model Code 1990.
(1.61)
(1.62)
(1.63)
⁄ (1.64)
(1.65)
[
]
(1.66)
{ }
(1.67)
Where: Φ(t, t0) is the calculated creep coefficient at a given age, Φ0 is the notional creep
coefficient, βc is the coefficient to describe the development of creep with time after
loading, t is the age of concrete in days, t0 is the age of concrete at loading in days, RH is
the relative humidity in decimals, Ac is the cross section area in mm2, u is the perimeter
24
in contact with the atmosphere in mm, and fcm is the mean compressive strength of
concrete at the age of 28 days in MPa.
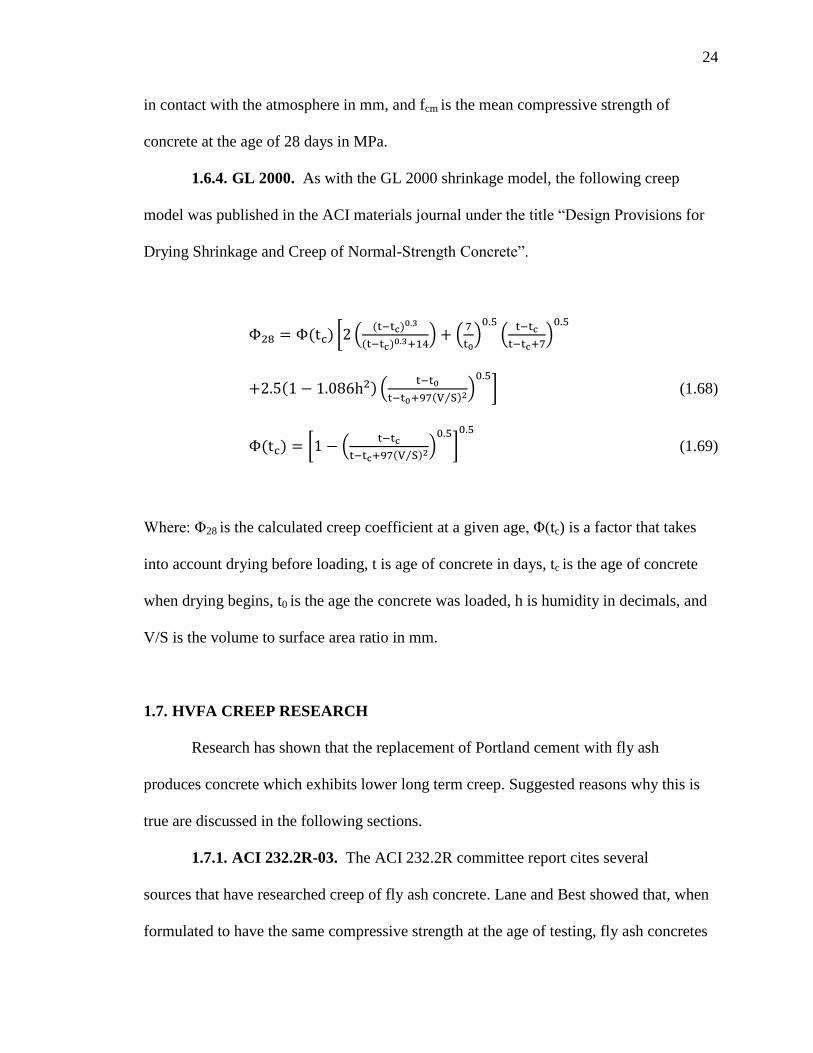
1.6.4. GL 2000. As with the GL 2000 shrinkage model, the following creep
model was published in the ACI materials journal under the title “Design Provisions for
Drying Shrinkage and Creep of Normal-Strength Concrete”.
[ (
) (
)
(
)
(1.72)
(
⁄ )
] (1.68)
[ (
⁄ )
]
(1.69)
Where: Φ28 is the calculated creep coefficient at a given age, Φ(tc) is a factor that takes
into account drying before loading, t is age of concrete in days, tc is the age of concrete
when drying begins, t0 is the age the concrete was loaded, h is humidity in decimals, and
V/S is the volume to surface area ratio in mm.
1.7. HVFA CREEP RESEARCH
Research has shown that the replacement of Portland cement with fly ash
produces concrete which exhibits lower long term creep. Suggested reasons why this is
true are discussed in the following sections.
1.7.1. ACI 232.2R-03. The ACI 232.2R committee report cites several
sources that have researched creep of fly ash concrete. Lane and Best showed that, when
formulated to have the same compressive strength at the age of testing, fly ash concretes
25
display lower shrinkage. It is suggested that this is due to the higher late age strength of
fly ash concrete.
1.7.2. Alexander, et. al. Concrete with 25% fly ash replacement was tested
for creep up to the age of 6 years. The specimens were tested at loads of 25% and 40% of
28 day compressive strength. A control conventional concrete mix was also tested
simultaneously. All specimens tested had a strength of 4000 psi (27.58 MPa) at 28 days.
The results show that concrete without fly ash showed 50% higher creep than concrete
which had 25% fly ash replacement. These results were recorded at two years of age, and
remained unchanged up to six years.
1.8. APPLICATION OF SHRINKAGE AND CREEP
1.8.1. Prestress Loss. Prestress loss is “the loss of compressive force acting
on the concrete component of a prestressed concrete section” (NCHRP 426). The ability
to accurately predict the prestress loss in beams is very dependent on the ability to predict
the beam’s shortening due to shrinkage and creep. Shortening of the beam reduces the
tensile force in the prestressed reinforcement and must be accounted for in design.
NCHRP 426 names three components which significantly affect the prestress loss in
pretensioned concrete members which directly relate to shrinkage and creep. These
components are:
1. Instantaneous prestress loss due to elastic shortening at transfer of force from
prestressed reinforcement to concrete.
2. Long-term prestress loss due to shrinkage and creep of concrete and relaxation of
prestressing strands between the time of transfer and deck placement.
26
3. Long-term prestress loss between the time of deck placement to the final service
life of the structure due to shrinkage and creep of the girder.
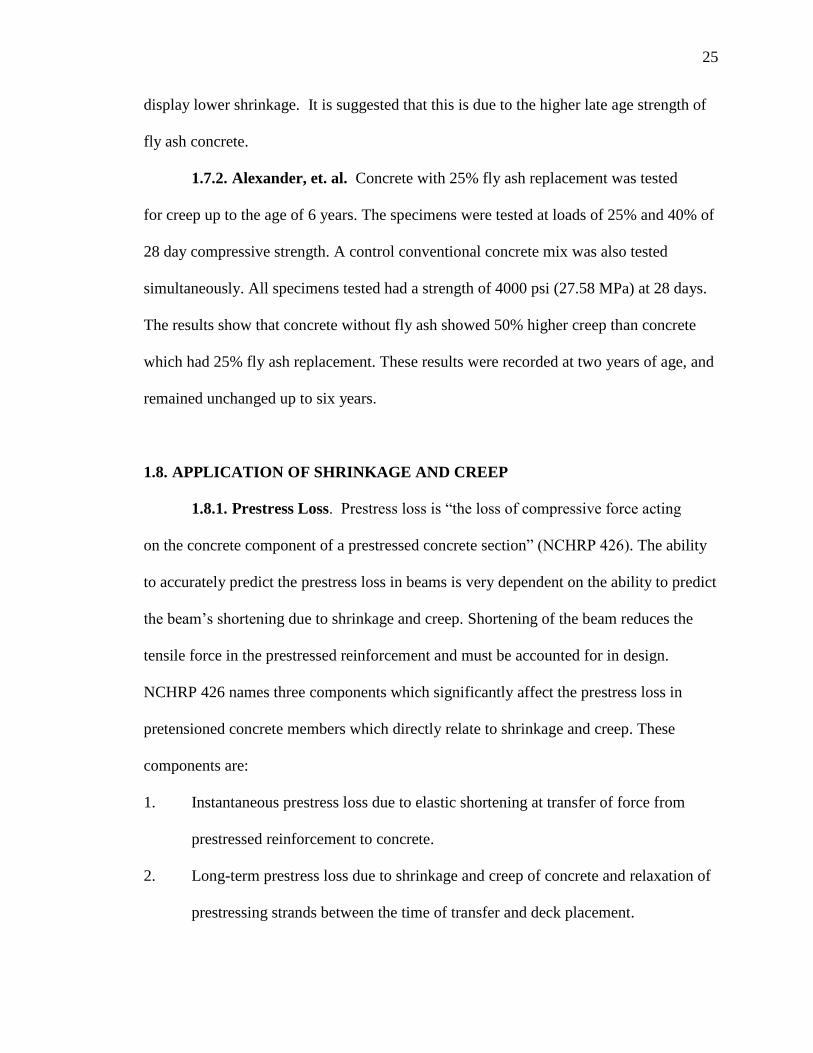
Figure 1.4 shows the prestress loss over the life cycle of a pretensioned concrete
girder. The loss between points D and E represent the loss due to creep, shrinkage, and
relaxation of prestressing strands.
Figure 1.4 - Stress vs. Time for Prestressed Bridge Girder (Tadros et. al. 2003)
1.8.2. Load Effects. The procedures in “Design of Continuous Highway
Bridges with Precast, Prestressed Concrete Girders” published by the Portland Cement
Association (PCA) take into account additional moments due to shrinkage and creep
when determining loads for design. In this method, fixed end moments due to creep and
end driving moments due to shrinkage are calculated. These applied moments result from
a continuity connection being made at supports by the placement of the bridge deck. The
placement restricts free rotation of the beams and therefore produces moment in the
27
connection. The moments calculated by this method are then added to all other load
effects at all sections for determination of the ultimate design load. The shrinkage driving
moment calculation is done by first calculating theoretical ultimate shrinkage values for
the beam and the slab. The differential shrinkage between the beam and slab are then
used to determine an applied moment due to shrinkage. The applied moment due to creep
results from prestressed creep and dead load creep. Theoretical creep coefficients are
calculated for the time before and after deck placement. The creep that occurs after deck
placement is what contributes to the applied moment.
1.8.3. Beam Deflection. Shrinkage and creep must also be accounted for
when calculating long term deflection of flexural members. Eq. 9-11 of ACI 318-08,
shown here as Eq. 1.70, accounts for long term sustained loads. This factor is multiplied
by the immediate deflection caused by the load considered.
(1.70)
Where: λΔ is the multiplier for additional deflection due to long-term effects, ξ is the time
dependent factor for sustained load, and ρ’ is compression reinforcement ratio.
1.9. CONCRETE ABRASION
1.9.1. Definition of Concrete Abrasion. Abrasion is the physical wearing
down of a material. The most common sources of abrasion of concrete structures are by
the friction between vehicle tires and concrete pavement road surfaces, and by water

28
flows over exposed dam or bridge footings. Concrete abrasion leads to a decrease in
member thickness which can lead to cracking or failure of the structure (Atis).
1.9.2. Factors Affecting Concrete Abrasion. Several material properties
and construction factors can affect the abrasion resistance of concrete. The concrete
strength is the most influential property in regards to abrasion resistance. The properties
of the aggregate are also very important in a concrete’s resistance to abrasion. The
surface finish and whether or not a hardener or topping is used effects abrasion resistance
as well (Naik et. al.).
1.10. HVFA ABRASION RESEARCH
There is considerable data available on the abrasion resistance of HVFA concrete.
The motivation for research of HVFA concrete abrasion resistance is that HVFA concrete
has been proposed as a possible material for paving.
1.10.1. Naik, et. al. The objective of this testing program was to determine
the abrasion resistance of HVFA concrete mixes. Three sources of fly ash were used.
Mixes containing 40%, 50%, and 60% fly ash were tested according to a modified
version of ASTM C944 for each source along with one convention concrete mix. In this
study, depth of wear was used as the measure of value. Results show that above 50%,
abrasion resistance of fly ash mixes is slightly lower than that of the reference mix.
Results also show that, above all, the concrete’s strength was the most influential factor
in abrasion resistance.
29
1.10.2. Atis. The objective of this program was to determine the abrasion
resistance of HVFA concrete for use as a pavement material. Five different mixes were
tested. One baseline mix, two 50% HVFA mixes, and two 70% HVFA mixes were tested
in accordance to BSI 1993 – British Standards Institute “Method for determination of
aggregate abrasion value (AAV).” This test method is similar to ASTM C944, which was
followed during testing of specimens in this report. Mass loss was the measure of value in
this test. Again, results show that abrasion resistance is primarily dependent on the
concrete’s strength rather than fly ash content. However results also suggest that at higher
strengths, the 70% fly ash mix showed higher resistance than the 50% mix and
conventional mix, but at lower strengths the opposite is true.
30
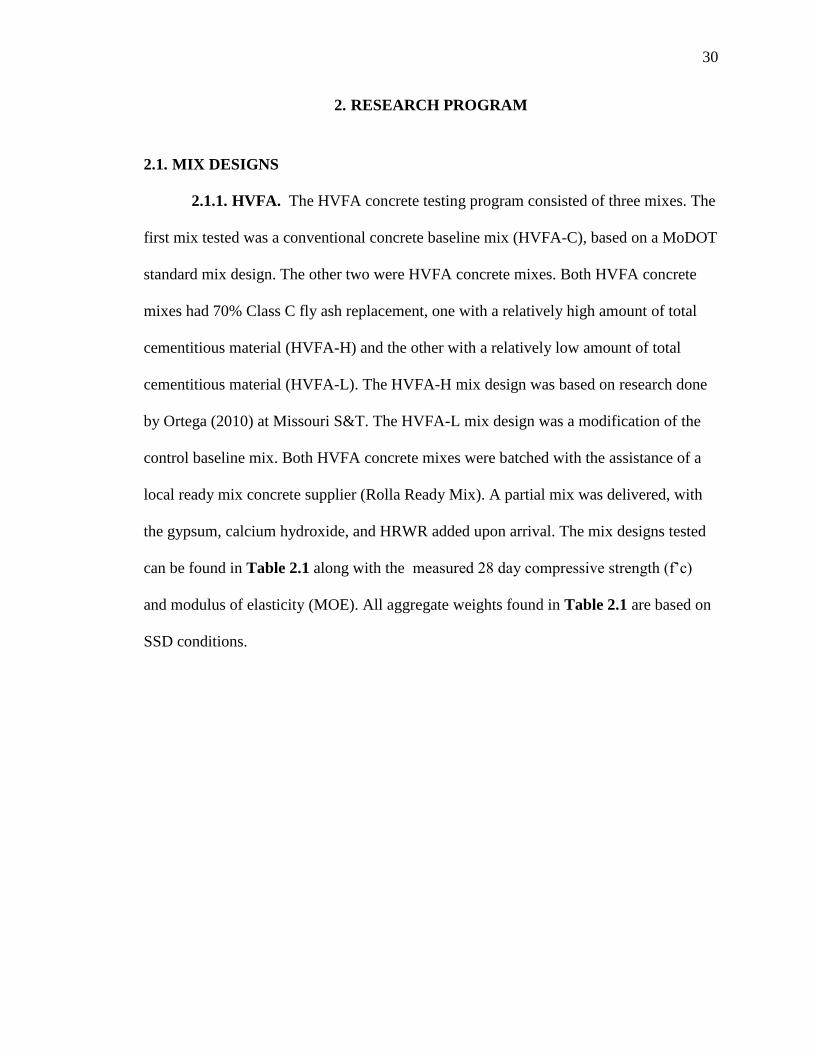
2. RESEARCH PROGRAM
2.1. MIX DESIGNS
2.1.1. HVFA. The HVFA concrete testing program consisted of three mixes. The
first mix tested was a conventional concrete baseline mix (HVFA-C), based on a MoDOT
standard mix design. The other two were HVFA concrete mixes. Both HVFA concrete
mixes had 70% Class C fly ash replacement, one with a relatively high amount of total
cementitious material (HVFA-H) and the other with a relatively low amount of total
cementitious material (HVFA-L). The HVFA-H mix design was based on research done
by Ortega (2010) at Missouri S&T. The HVFA-L mix design was a modification of the
control baseline mix. Both HVFA concrete mixes were batched with the assistance of a
local ready mix concrete supplier (Rolla Ready Mix). A partial mix was delivered, with
the gypsum, calcium hydroxide, and HRWR added upon arrival. The mix designs tested
can be found in Table 2.1 along with the measured 28 day compressive strength (f’c)
and modulus of elasticity (MOE). All aggregate weights found in Table 2.1 are based on
SSD conditions.
31
Table 2.1 - HVFA Test Program Mix Designs and mechanical properties
Amount (per cubic yard)
Material HVFA-C HVFA-H HVFA-L
Water 226 lb. 321 lb. 226 lb.
Cement (Type I) 564 lb. 219 lb. 155 lb.
Coarse Aggregate
(3/4” JC Dolomite)
1860 lb. 1754 lb. 1754 lb.
Fine Aggregate
(Missouri River Sand)
1240 lb. 1080 lb. 1080 lb.
Fly Ash N/A 511 lb. 360 lb.
Gypsum N/A 20.4 lb 14.4 lb.
Calcium Hydroxide N/A 51.1 lb. 36 lb.
BASF Glenium 7500
(HRWR)
3.0 fl oz/cwt N/A 3.0 fl oz/cwt
f’c (psi) 5,400 3,100 3,500
MOE (psi) 3,386,000 3,475,000 3,163,000
Conversion: 1 kg/m3 = 1.686 lb/yd
3
1 fl oz = 26.57 mL
1 psi = 6.89 kPa
2.2. SHRINKAGE AND CREEP SPECIMEN CONSTRUCTION
2.2.1. Shrinkage and Creep Specimens. Both shrinkage and creep testing
were done using identical specimens. Although only four specimens per mix were
necessary for testing (two each for shrinkage and creep), six specimens per mix were cast
in case any specimens were damaged during de-molding. These specimens were
fabricated and prepared as described below.
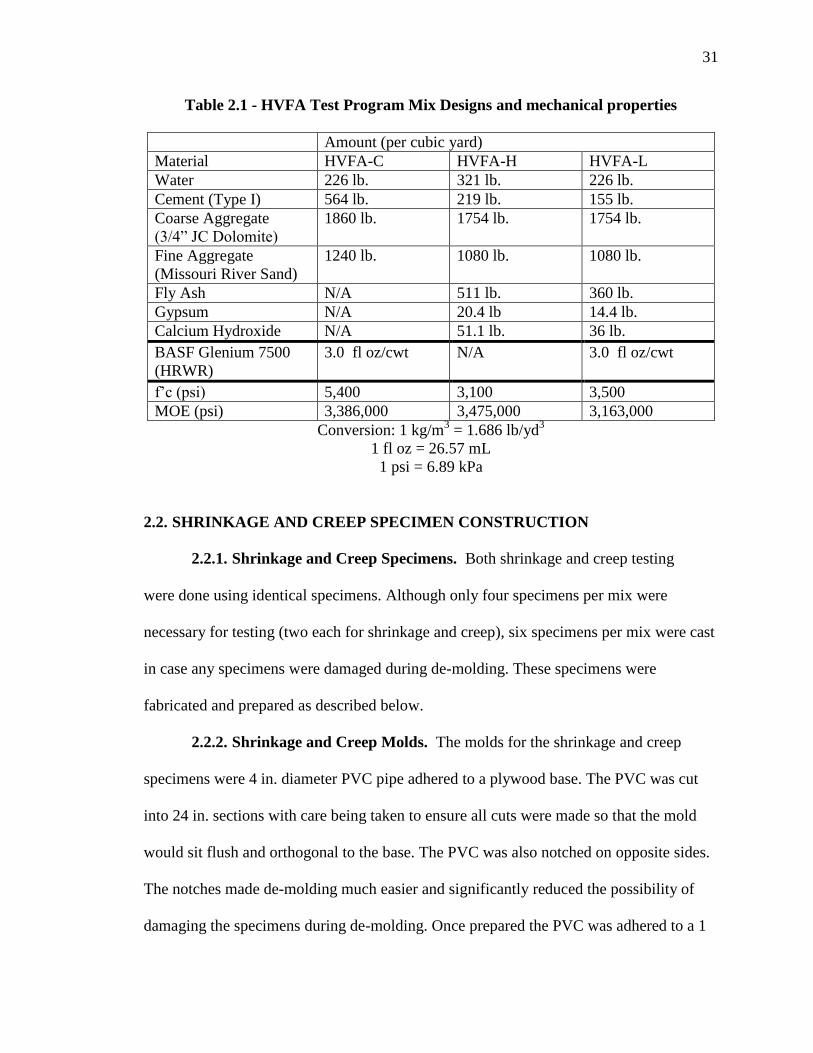
2.2.2. Shrinkage and Creep Molds. The molds for the shrinkage and creep
specimens were 4 in. diameter PVC pipe adhered to a plywood base. The PVC was cut
into 24 in. sections with care being taken to ensure all cuts were made so that the mold
would sit flush and orthogonal to the base. The PVC was also notched on opposite sides.
The notches made de-molding much easier and significantly reduced the possibility of
damaging the specimens during de-molding. Once prepared the PVC was adhered to a 1
32
ft. (304.8 mm) by 1 ft. (304.8 mm) plywood base using a waterproof silicon sealant. The
completed molds were allowed to sit for at least 24 hours before use to allow for the
sealant to fully set up. Figure 2.1 shows a completed shrinkage and creep mold.
Figure 2.1 - Shrinkage and Creep Form
2.2.3. Shrinkage and Creep Specimen Casting. Specimens were consolidated
in a manner similar to that prescribed in ASTM C31 “Standard Practice for Making and
Curing Concrete Test Specimens in the Field” for a 6 in. diameter cylinder. Consolidation
and vibration were performed when necessary. The specimens were cast in three layers of
approximately equal depth and were rodded 25 times per layer. External vibration was
33
also performed after each layer was rodded using an electric handheld concrete vibrator
as needed. Specimens were moist cured until de-molded and prepared.
2.2.4. Shrinkage and Creep De-Molding and Preparation. All specimens
were de-molded within 24 hours of their initial set time. De-molding was done by first
cutting through the notched section with a utility knife. A hammer and chisel were then
used to split the mold and remove it from the concrete. Creep specimens were sulfur
capped on both ends in preparation for loading at 28 days. Shrinkage specimens were
sulfur capped on only the bottom end, allowing for stability and more accurate readings.
2.2.5. Shrinkage and Creep Data Acquisition. A demountable mechanical
strain gauge (DEMEC) was used to measure strain in the concrete. DEMEC points, small
pre-drilled stainless steel discs, were adhered to the surface of the specimen. They were
arranged in three vertical lines of five points, 120º apart, as shown in Fig. 2.2. This
arrangement allowed for 9 readings to be taken per specimen. The average of all readings
taken per specimen was taken as the value to be used for strain calculation. The points in
one line per specimen were adhered using gel control super glue. The instant hardening
allowed for initial readings to be made on each specimen as soon as possible. The
remaining points were adhered using concrete/metal epoxy, which took up to 24 hours to
fully harden for accurate reading to be taken. The points adhered with super glue were
later protected using the epoxy.
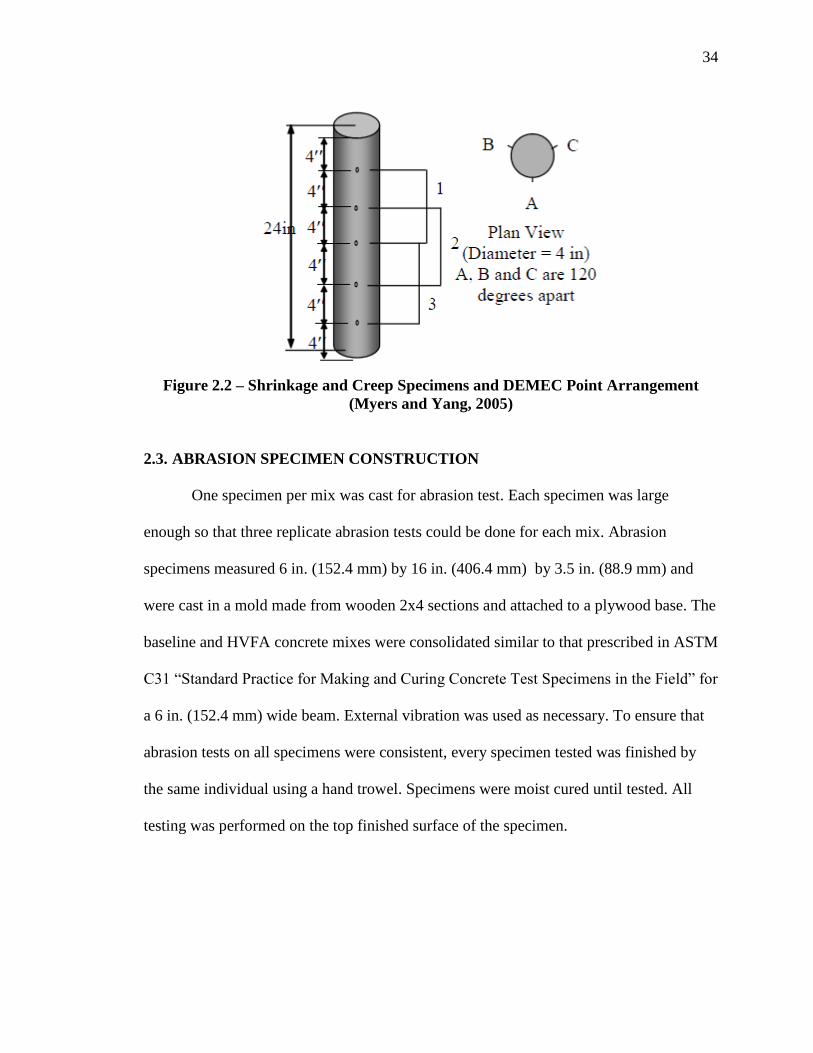
34
Figure 2.2 – Shrinkage and Creep Specimens and DEMEC Point Arrangement
(Myers and Yang, 2005)
2.3. ABRASION SPECIMEN CONSTRUCTION
One specimen per mix was cast for abrasion test. Each specimen was large
enough so that three replicate abrasion tests could be done for each mix. Abrasion
specimens measured 6 in. (152.4 mm) by 16 in. (406.4 mm) by 3.5 in. (88.9 mm) and
were cast in a mold made from wooden 2x4 sections and attached to a plywood base. The
baseline and HVFA concrete mixes were consolidated similar to that prescribed in ASTM
C31 “Standard Practice for Making and Curing Concrete Test Specimens in the Field” for
a 6 in. (152.4 mm) wide beam. External vibration was used as necessary. To ensure that
abrasion tests on all specimens were consistent, every specimen tested was finished by
the same individual using a hand trowel. Specimens were moist cured until tested. All
testing was performed on the top finished surface of the specimen.

35
2.4. TESTING PROCEDURES
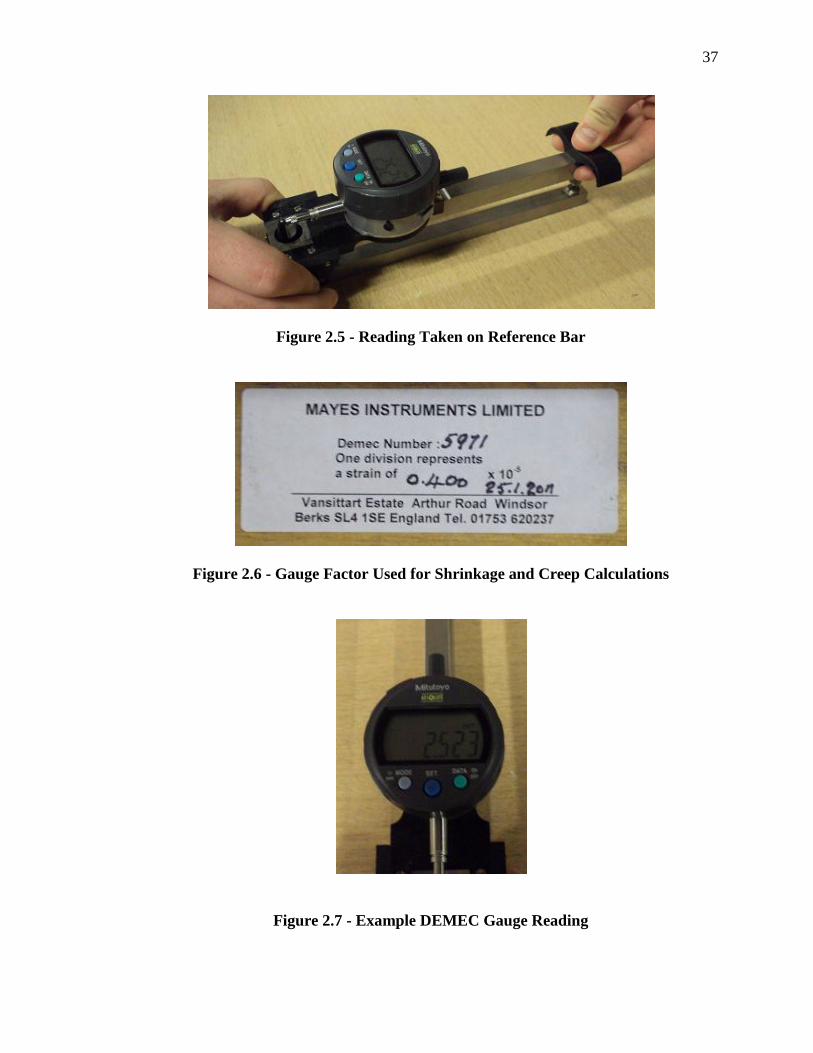
2.4.1. Shrinkage Testing Procedures. A modified version of ASTM C157
“Standard Test Method for Length Change of Hardened Hydraulic-Cement Mortar and
Concrete” was used to determine the shrinkage of the concrete specimens. Until the age
of loading for creep, four specimens were used for shrinkage determination. At 28 days,
two of these specimens were transferred to creep frames, leaving two remaining
specimens to be tested for long term shrinkage. Nine strain readings could be taken per
specimen, with the average of all readings taken as the value to be used for shrinkage
calculation. Strain was determined using the DEMEC readings and calculated by Eq. 2.1
as found in “Simplified Instructions for Using a Digital DEMEC Gauge”. An example of
a DEMEC reading being taken on a specimen is in Figure 2.1. Readings were normalized
by taking a reading on the reference bar, shown in Figure 2.2 with a reading taken on the
reference bar shown in Figure 2.3. Shrinkage strain experienced during the first day after
demolding was estimated based on linear interpolation of subsequent strain values, as
calculated by Eq. 2.1
(µε) (2.1)
Where: Δεs is the change in strain from one reading to the next, G is the gauge factor
shown in Figure 2.3, 0.400 x 10⁻⁵
strain per division (4 microstrain), D0 is the datum
reading on the reference bar, Di is the subsequent reading on the reference bar, R0 is the
datum reading on the tested material, and Ri is the subsequent reading on the tested
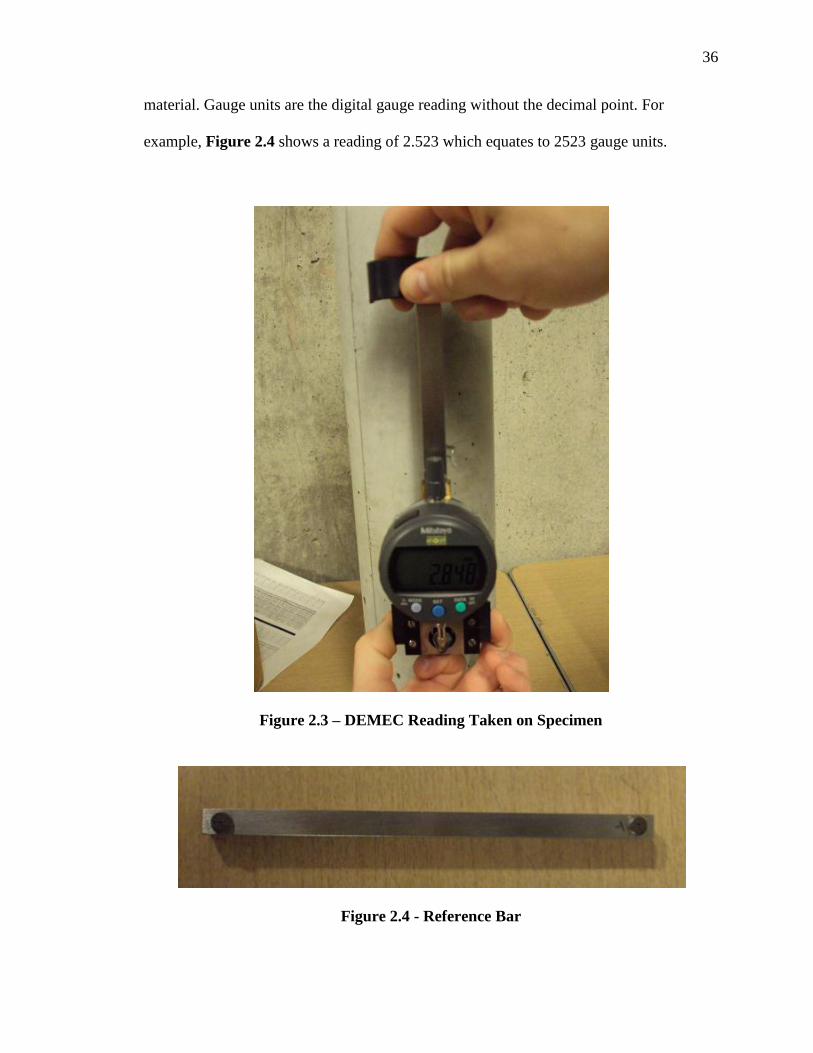
36
material. Gauge units are the digital gauge reading without the decimal point. For
example, Figure 2.4 shows a reading of 2.523 which equates to 2523 gauge units.
Figure 2.3 – DEMEC Reading Taken on Specimen
Figure 2.4 - Reference Bar
37
Figure 2.5 - Reading Taken on Reference Bar
Figure 2.6 - Gauge Factor Used for Shrinkage and Creep Calculations
Figure 2.7 - Example DEMEC Gauge Reading
38
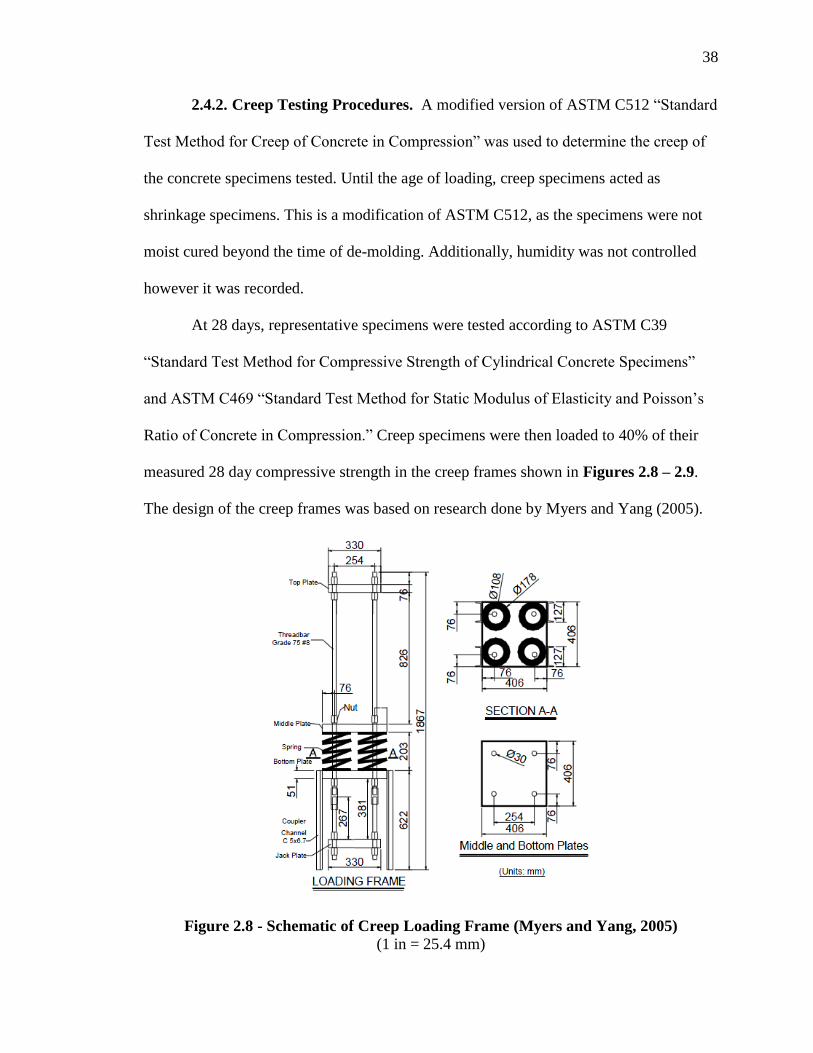
2.4.2. Creep Testing Procedures. A modified version of ASTM C512 “Standard
Test Method for Creep of Concrete in Compression” was used to determine the creep of
the concrete specimens tested. Until the age of loading, creep specimens acted as
shrinkage specimens. This is a modification of ASTM C512, as the specimens were not
moist cured beyond the time of de-molding. Additionally, humidity was not controlled
however it was recorded.
At 28 days, representative specimens were tested according to ASTM C39
“Standard Test Method for Compressive Strength of Cylindrical Concrete Specimens”
and ASTM C469 “Standard Test Method for Static Modulus of Elasticity and Poisson’s
Ratio of Concrete in Compression.” Creep specimens were then loaded to 40% of their
measured 28 day compressive strength in the creep frames shown in Figures 2.8 – 2.9.
The design of the creep frames was based on research done by Myers and Yang (2005).
Figure 2.8 - Schematic of Creep Loading Frame (Myers and Yang, 2005)
(1 in = 25.4 mm)
39
Figure 2.9 - Creep Loading Frame with Specimen
Measurements taken on creep specimens were done in the exact way as with the
shrinkage specimens. Eq. 2.2 was used to determine the change in strain between one
creep reading to the next. Using the calculated creep strain, the coefficient of creep could
be determined by Eq. 2.3. Creep and shrinkage readings for like specimens were taken at
the same interval. Readings were also taken immediately before and after loading to
determine initial elastic strain due to loading. Figure 2.10 shows a reading being taken on
a creep specimen.
40
(µε) (2.2)
Where: Δεc is the change in creep strain between readings.
⁄ (2.3)
Where: Φ(t,t0) is the measured creep coefficient at a given age, εi is the measured strain
due to initial loading of the specimen, εt is the measured creep strain at a given age.
Figure 2.10 - Reading Taken on Creep Specimen
41
2.4.3. Abrasion Resistance Testing Procedures. ASTM C944 “Standard Test
Method for Abrasion Resistance of Concrete or Mortar Surfaces by the Rotating-Cutter
Method” was used to determine abrasion resistance. A schematic of the rotating cutter
used is shown in Figure 2.11 , which is taken from ASTM C944. The actual rotating
cutter is shown in Figure 2.12. Abrasion specimens were moist cured until testing at 28
days age. The two HVFA concrete mixes were also tested after an additional 10 weeks of
moist cure to further investigate how the late age strength gain of HVFA concrete
affected abrasion resistance. One specimen per mix was constructed, which allowed for
three abrasion tests. One abrasion test consisted of three abrasion cycles. Each cycle
lasted two minutes. A load of 44lb, defined as a double load in ASTM C944, was applied
at a rate of 300 rpm using a drill press as shown in Figure 2.13. After each cycle, mass
loss (mg) was recorded by subtracting the final weight from the initial weight. Each cycle
per test was done on the same spot. After completion of each abrasion test, the average
depth of wear (mm) was measured using digital calipers. The average depth of wear was
calculated from a total of eight depth measurements relative to the adjacent untested
surface, four taken on the outer perimeter of the tested surface and four taken around the
inner perimeter, at the points indicated in Figure 2.14. The measurements were made
using a digital caliper. On the day of testing, the specimen was removed from moist cure
and surface dried by blotting with paper towels. This was done to avoid any mass loss
due to moisture loss. A completed specimen after all three abrasion tests is shown in
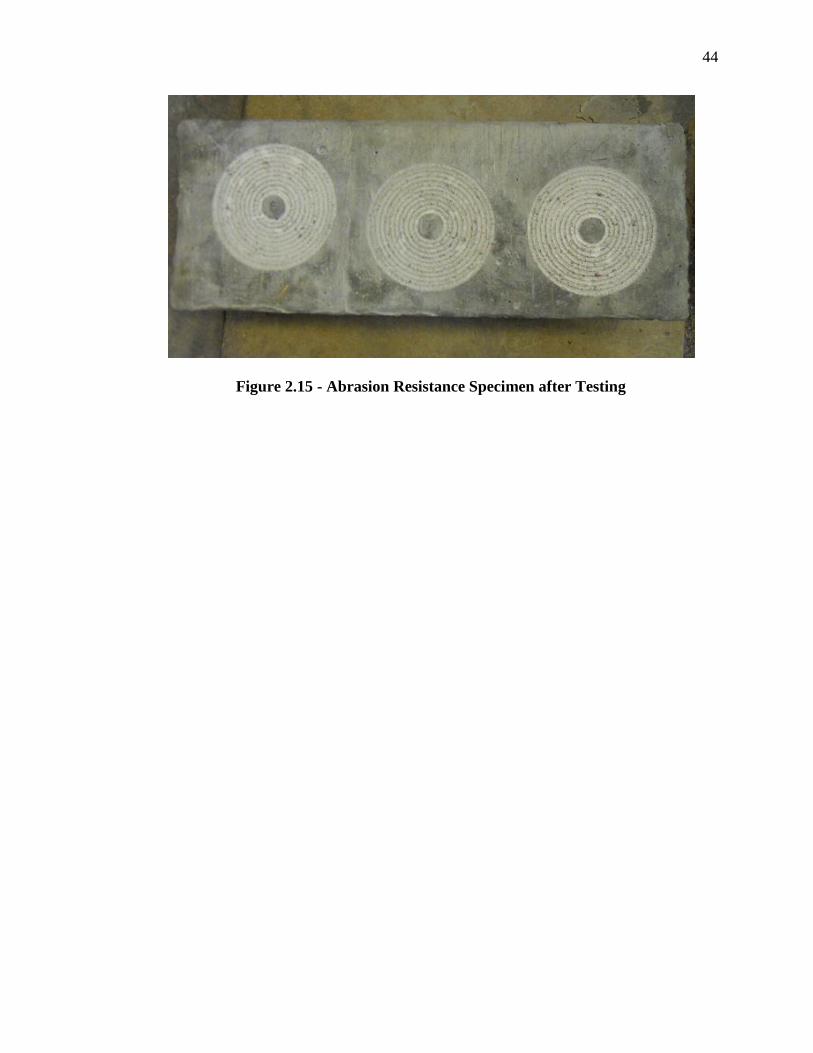
Figure 2.15.
42
Figure 2.11 - Schematic of Abrasion Rotating Cutter (ASTM C944)
(1 in = 25.4 mm)
Figure 2.12 - Rotating Cutter

43
Figure 2.13 - Abrasion Resistance Test in Progress
Figure 2.14 - Depth of Wear Measurement Points
44
Figure 2.15 - Abrasion Resistance Specimen after Testing
45
3. HVFA RESULTS AND DISCUSSION
3.1. SHRINKAGE
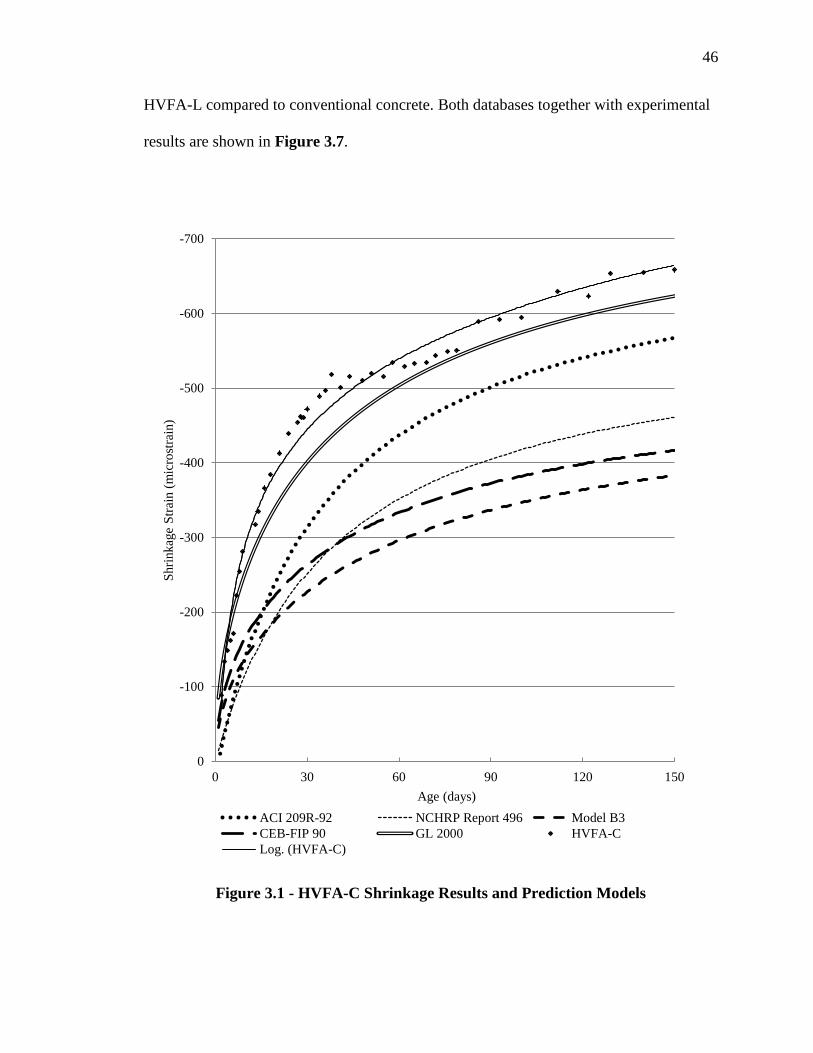
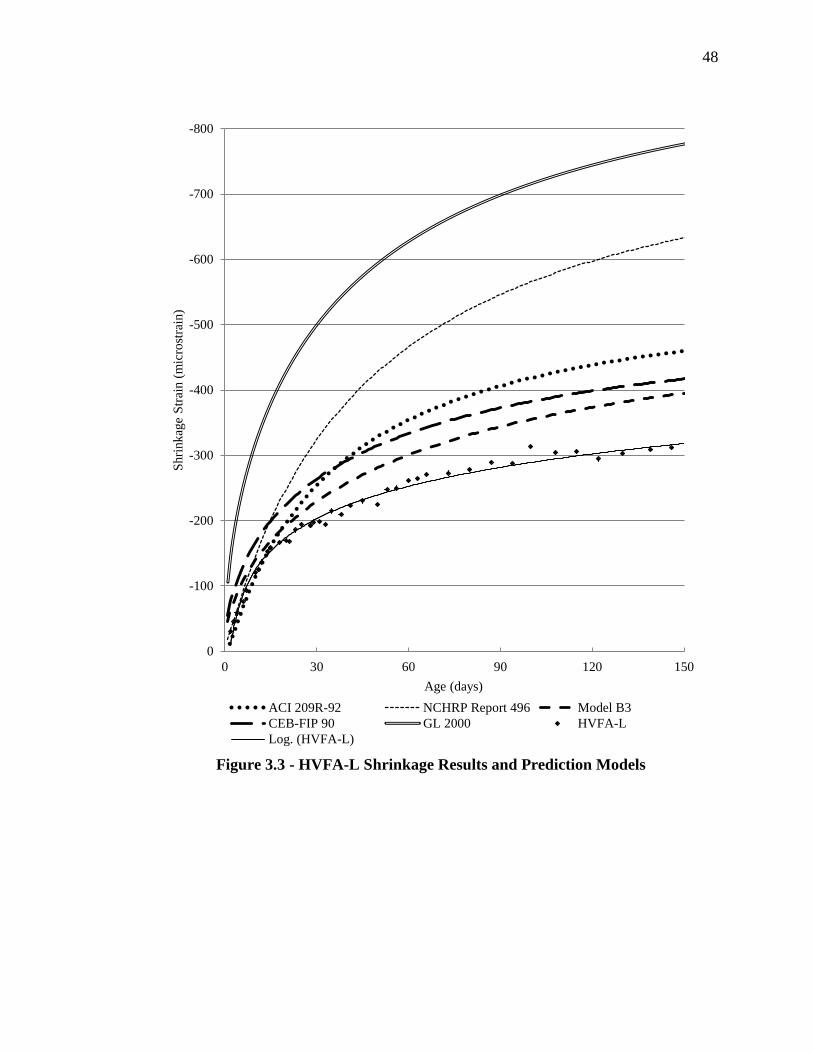
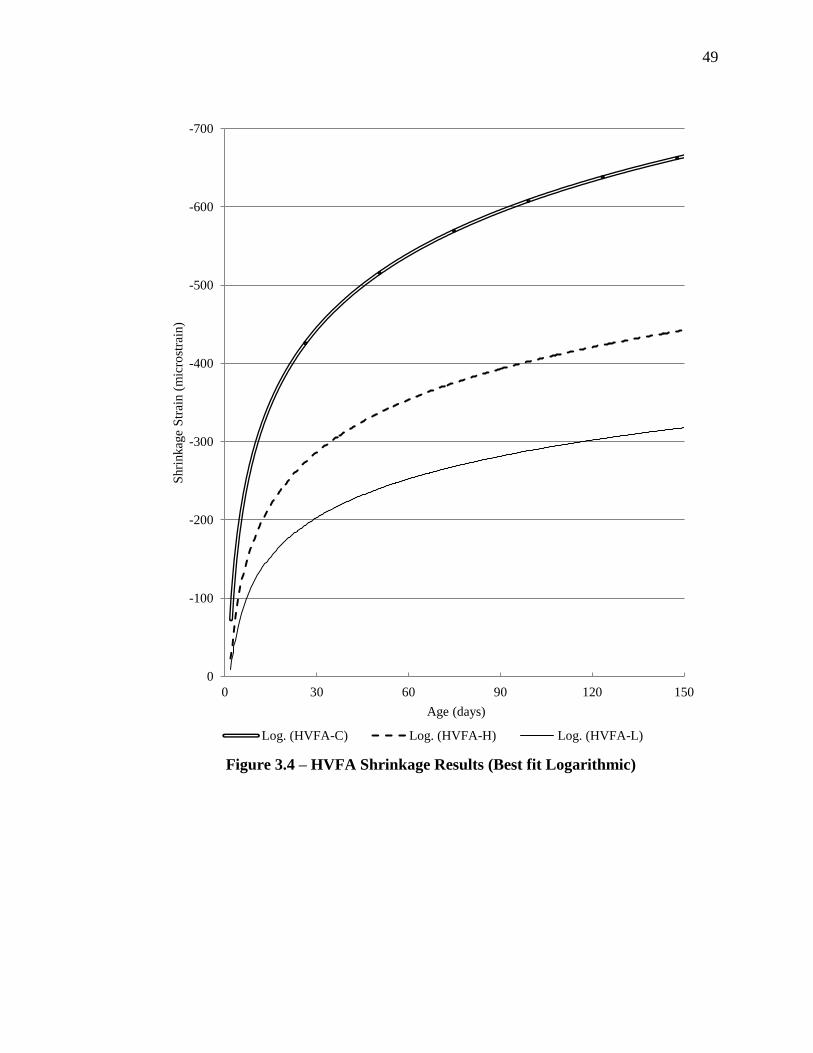
3.1.1. Results. Figures 3.1 – 3.3 show the experimental data obtained from
shrinkage tests of the HVFA concrete plotted with the various prediction models
discussed in Section 1. Figure 3.4 shows the experimental results of all four mixes
plotted with one another. In figures where different data sources are together, the source
of the data can be found in parentheses after the data label in the legend of its respective
figure. For all specimens tested for this study, the notation (S&T) will be used.
3.1.2. Conclusions and Discussion. For both HVFA concrete mixes, results
were very consistent with data from numerous previous research projects described in
sections 1.4.1-1.4.4. It was expected that the two HVFA concrete mixes would
experience a decrease in shrinkage strain relative to the conventional mix. It was also
expected that HVFA-L, due to the lower level of cementitious material, would experience
a further decrease in shrinkage strains.
Both HVFA-H and HVFA-L showed a significant decrease in shrinkage strain
relative to HVFA-C. Therefore, for use in practice when shrinkage is a design concern,
both HVFA mixes are superior to their equivalent conventional concrete mix.
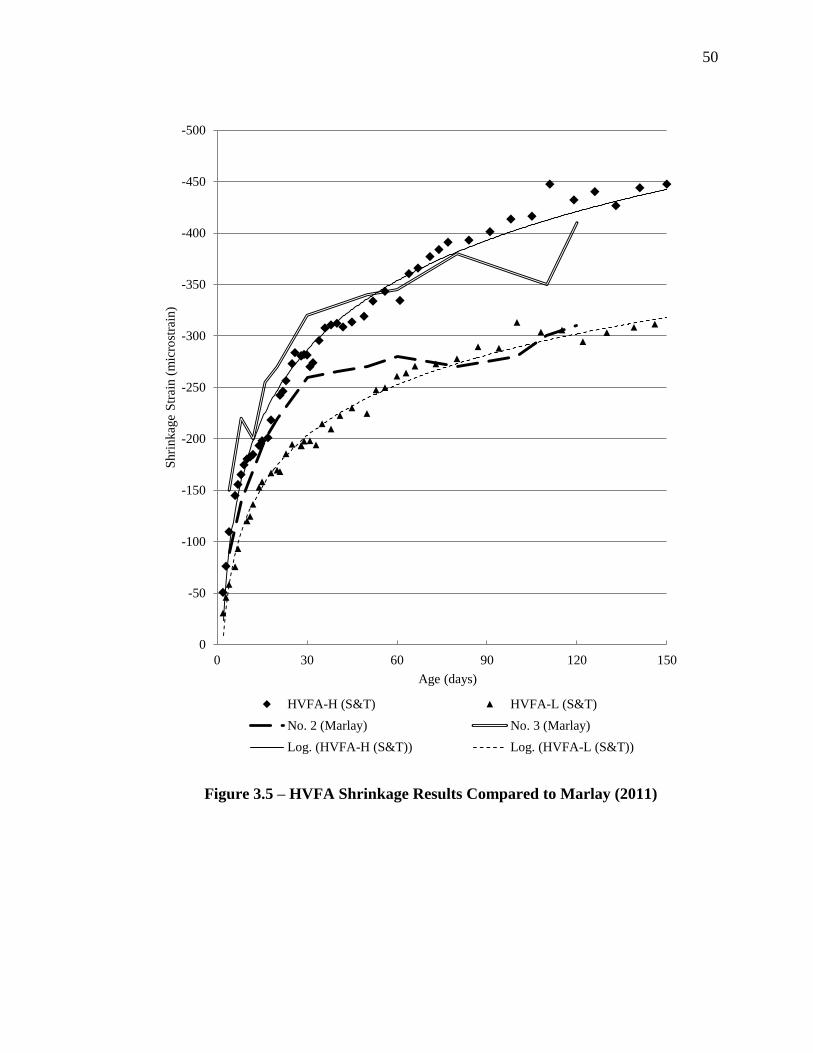
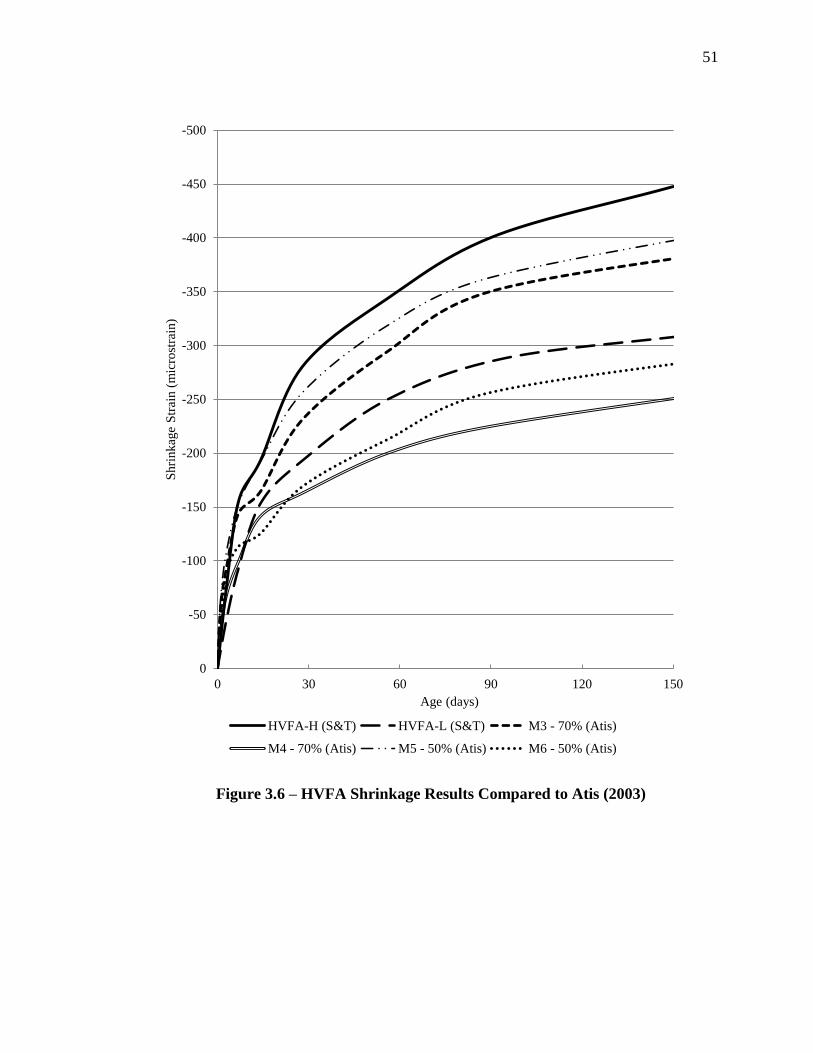
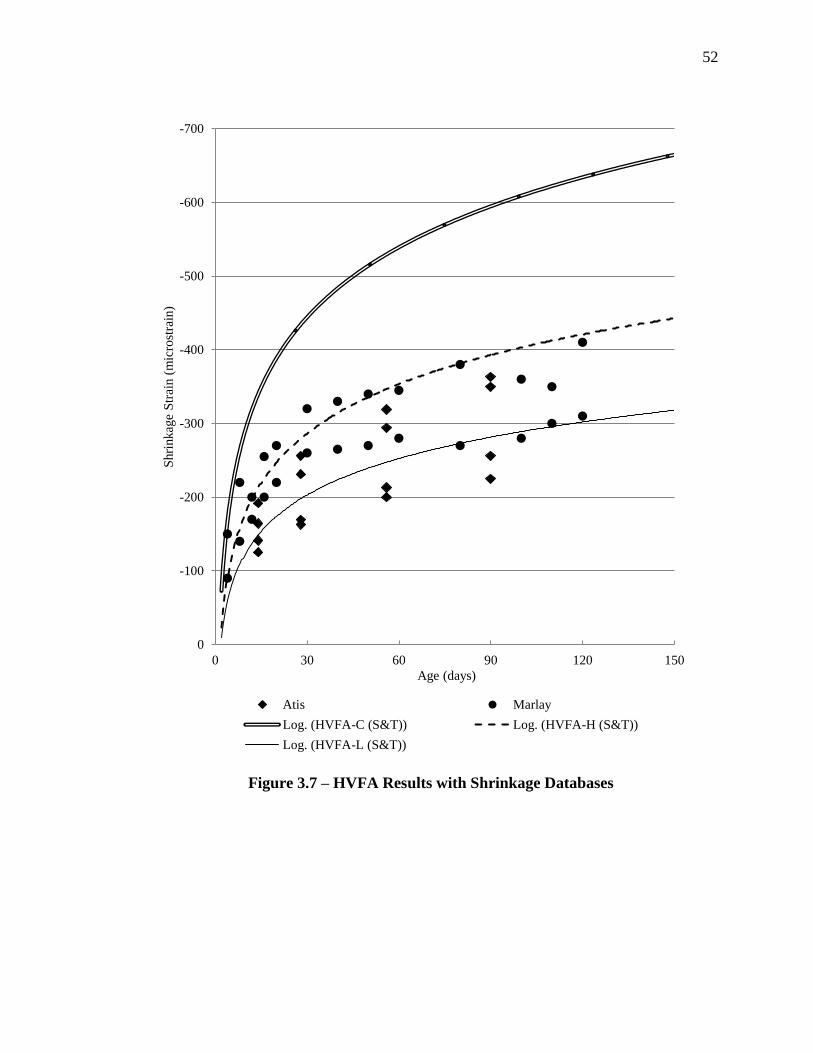
When comparing results to previous studies, both HVFA-H and HVFA-L
performed as expected. Figures 3.5 – 3.6 show the results of HVFA-H and HVFA-L
plotted against shrinkage results from Marlay (2011) and Atis (2003) both of which
tested HVFA concrete specimens with 70% replacement of Portland cement with fly ash,
in addition to two mixes with 50% replacement for comparison. The results from Marlay
and Atis validate the relatively low shrinkage strains experienced by HVFA-H and
46
HVFA-L compared to conventional concrete. Both databases together with experimental
results are shown in Figure 3.7.
Figure 3.1 - HVFA-C Shrinkage Results and Prediction Models
-700
-600
-500
-400
-300
-200
-100
0
0 30 60 90 120 150
Shri
nkag
e S
trai
n (
mic
rost
rain
)
Age (days)
ACI 209R-92 NCHRP Report 496 Model B3
CEB-FIP 90 GL 2000 HVFA-C
Log. (HVFA-C)

47
Figure 3.2 - HVFA-H Shrinkage Results and Prediction Models
-850
-750
-650
-550
-450
-350
-250
-150
-50
0 30 60 90 120 150
Shri
nkag
e S
trai
n (
mic
rost
rain
)
Age (days)
ACI 209R-92 NCHRP Report 496 Model B3CEB-FIP 90 GL 2000 HVFA-HLog. (HVFA-H)
48
Figure 3.3 - HVFA-L Shrinkage Results and Prediction Models
-800
-700
-600
-500
-400
-300
-200
-100
0
0 30 60 90 120 150
Shri
nkag
e S
trai
n (
mic
rost
rain
)
Age (days)
ACI 209R-92 NCHRP Report 496 Model B3
CEB-FIP 90 GL 2000 HVFA-L
Log. (HVFA-L)
49
Figure 3.4 – HVFA Shrinkage Results (Best fit Logarithmic)
-700
-600
-500
-400
-300
-200
-100
0
0 30 60 90 120 150
Shri
nkag
e S
trai
n (
mic
rost
rain
)
Age (days)
Log. (HVFA-C) Log. (HVFA-H) Log. (HVFA-L)
50
Figure 3.5 – HVFA Shrinkage Results Compared to Marlay (2011)
-500
-450
-400
-350
-300
-250
-200
-150
-100
-50
0
0 30 60 90 120 150
Shri
nkag
e S
trai
n (
mic
rost
rain
)
Age (days)
HVFA-H (S&T) HVFA-L (S&T)
No. 2 (Marlay) No. 3 (Marlay)
Log. (HVFA-H (S&T)) Log. (HVFA-L (S&T))
51
Figure 3.6 – HVFA Shrinkage Results Compared to Atis (2003)
-500
-450
-400
-350
-300
-250
-200
-150
-100
-50
0
0 30 60 90 120 150
Shri
nkag
e S
trai
n (
mic
rost
rain
)
Age (days)
HVFA-H (S&T) HVFA-L (S&T) M3 - 70% (Atis)
M4 - 70% (Atis) M5 - 50% (Atis) M6 - 50% (Atis)
52
Figure 3.7 – HVFA Results with Shrinkage Databases
-700
-600
-500
-400
-300
-200
-100
0
0 30 60 90 120 150
Shri
nkag
e S
trai
n (
mic
rost
rain
)
Age (days)
Atis Marlay
Log. (HVFA-C (S&T)) Log. (HVFA-H (S&T))
Log. (HVFA-L (S&T))
53
3.2. CREEP
3.2.1. Results. Creep Results are shown in Table 3.1.
Table 3.1 - Summary of HVFA Creep Results
Creep Strain (microstrain)
Specimen Days After Loading
7 14 56 126
HVFA-C 296 397 707 1070
HVFA-H 256 333 596 791
HVFA-L 178 225 377 489
Percentage of 126 Day Creep
HVFA-C 28 37 66 100
HVFA-H 32 42 75 100
HVFA-L 36 46 77 100
Measured Creep Coefficient
HVFA-C 0.464 0.622 1.12 1.68
HVFA-H 0.463 0.603 1.08 1.43
HVFA-L 0.421 0.533 0.893 1.16
Specific Creep (με/psi)
HVFA-C 0.137 0.184 0.327 0.496
HVFA-H 0.206 0.269 0.481 0.638
HVFA-L 0.128 0.162 0.271 0.351
Conversion: 1 MPa = 145.04 psi
3.2.2. Discussion and Conclusions. With the exception of HVFA-H in terms of
specific creep, both HVFA concrete specimens outperformed the conventional concrete
specimens in creep testing. Both HVFA concrete specimens experienced significantly
less creep strain at 126 days after loading than the conventional concrete mix. Creep
strain data may be misleading due to the fact that HVFA specimens were loaded at lower
levels than conventional concrete due to their decreased compressive strengths at the time
of loading. To normalize results, specific creep can be examined. As mentioned above,
HVFA-H performed poorly in creep when taken in terms of specific creep. As the
specimens got older, however, specific creep of HVFA-H got closer to that of HVFA-C.
54
At early ages, all three mixes tested showed similar behavior under load, however
as the specimens got older, the advantage of HVFA concrete over conventional concrete
became more clear. This is demonstrated best by the percentage of 126 day creep. The
data shows that during the first two weeks of loading, the HVFA concrete specimens
experienced a greater percentage of their ultimate creep strain than did the conventional
concrete specimens. However, due to the tendency of HVFA concrete to gain strength at
later ages, creep performance improved as the specimens got older.
This late age improvement in creep behavior is exactly what was discovered by
Lane and Best, as summarized in ACI 232.2R-03. It was determined that since HVFA
concrete had a lower strength at time of loading with increase in strength gain as it aged,
its creep behavior would be superior to that of conventional concrete. Additionally, it was
shown that concrete with fly ash which had the same strength as conventional concrete
still produced less creep at all ages. These properties of creep of HVFA concrete were
again confirmed by the results gained in this study.
3.3. ABRASION RESISTANCE
The following sections contain all measured data resulting from abrasion
resistance testing along with discussions and conclusions.
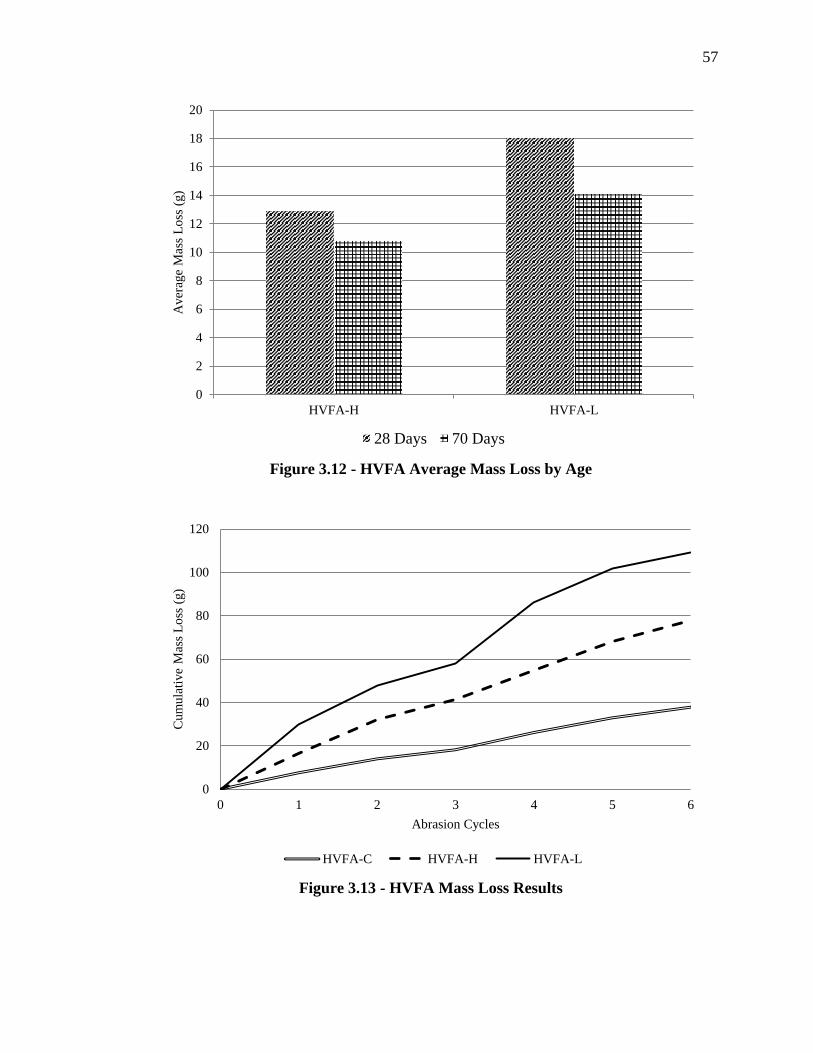
3.3.1. Results. Figures 3.8 – 3.10 show the mass losses recorded after each
abrasion cycle for each mix tested. Figures 3.11 – 3.12 show the relative abrasion
resistance of each HVFA concrete specimen by age. Figures 3.13 -3.14 show the results
of all specimens tested together. Table 3.2 shows a summary of all results along with
measured 28 day compressive strength.
55
Figure 3.8 - HVFA-C Mass Loss Results
Figure 3.9 - HVFA-H Mass Loss Results
0
1
2
3
4
5
6
7
8
9
Test 1 Test 2 Test 3
Mas
s L
oss
(g)
Cycle 1 Cycle 2 Cycle 3
0
2
4
6
8
10
12
14
16
18
Test 1 Test 2 Test 3
Mas
s L
oss
(g)
Cycle 1 Cycle 2 Cycle 3
56
Figure 3.10 - HVFA-L Mass Loss Results
Figure 3.11 - HVFA Average Depth of Wear by Age
0
5
10
15
20
25
30
35
Test 1 Test 2 Test 3
Mas
s L
oss
(g)
Cycle 1 Cycle 2 Cycle 3
0
0.5
1
1.5
2
2.5
3
HVFA-H HVFA-L
Aver
age
Dep
th o
f W
ear
(mm
)
28 Day 70 Day
57
Figure 3.12 - HVFA Average Mass Loss by Age
Figure 3.13 - HVFA Mass Loss Results
0
2
4
6
8
10
12
14
16
18
20
HVFA-H HVFA-L
Aver
age
Mas
s L
oss
(g)
28 Days 70 Days
0
20
40
60
80
100
120
0 1 2 3 4 5 6
Cum
ula
tive
Mas
s L
oss
(g)
Abrasion Cycles
HVFA-C HVFA-H HVFA-L
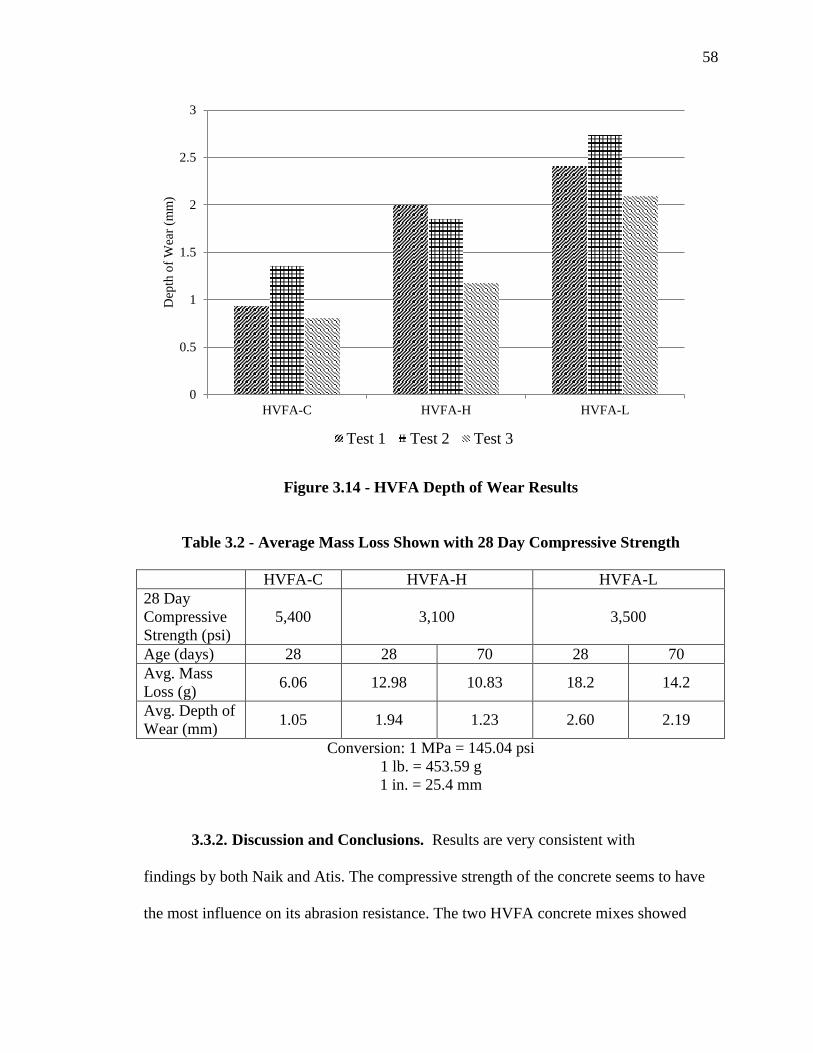
58
Figure 3.14 - HVFA Depth of Wear Results
Table 3.2 - Average Mass Loss Shown with 28 Day Compressive Strength
HVFA-C HVFA-H HVFA-L
28 Day
Compressive
Strength (psi)
5,400 3,100 3,500
Age (days) 28 28 70 28 70
Avg. Mass
Loss (g) 6.06 12.98 10.83 18.2 14.2
Avg. Depth of
Wear (mm) 1.05 1.94 1.23 2.60 2.19
Conversion: 1 MPa = 145.04 psi
1 lb. = 453.59 g
1 in. = 25.4 mm
3.3.2. Discussion and Conclusions. Results are very consistent with
findings by both Naik and Atis. The compressive strength of the concrete seems to have
the most influence on its abrasion resistance. The two HVFA concrete mixes showed
0
0.5
1
1.5
2
2.5
3
HVFA-C HVFA-H HVFA-L
Dep
th o
f W
ear
(mm
)
Test 1 Test 2 Test 3
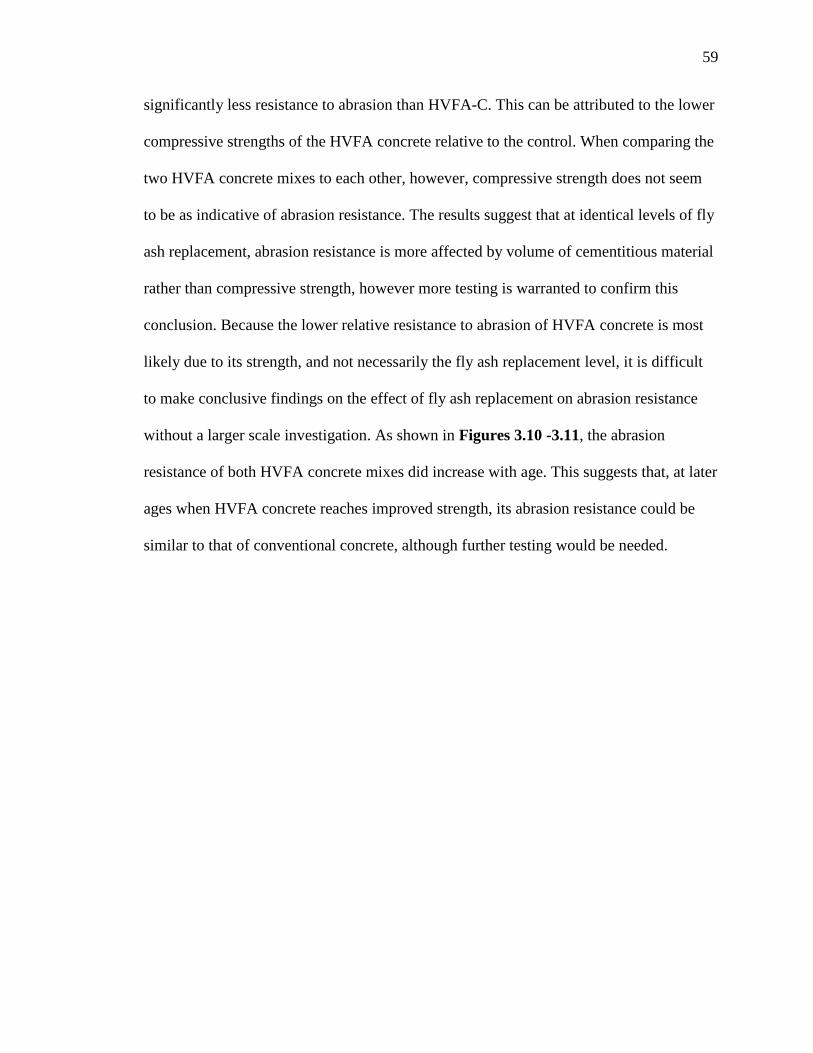
59
significantly less resistance to abrasion than HVFA-C. This can be attributed to the lower
compressive strengths of the HVFA concrete relative to the control. When comparing the
two HVFA concrete mixes to each other, however, compressive strength does not seem
to be as indicative of abrasion resistance. The results suggest that at identical levels of fly
ash replacement, abrasion resistance is more affected by volume of cementitious material
rather than compressive strength, however more testing is warranted to confirm this
conclusion. Because the lower relative resistance to abrasion of HVFA concrete is most
likely due to its strength, and not necessarily the fly ash replacement level, it is difficult
to make conclusive findings on the effect of fly ash replacement on abrasion resistance
without a larger scale investigation. As shown in Figures 3.10 -3.11, the abrasion
resistance of both HVFA concrete mixes did increase with age. This suggests that, at later
ages when HVFA concrete reaches improved strength, its abrasion resistance could be
similar to that of conventional concrete, although further testing would be needed.
60
APPENDIX A
SHRINKAGE DATA WITH RELATIVE HUMIDITY DATA
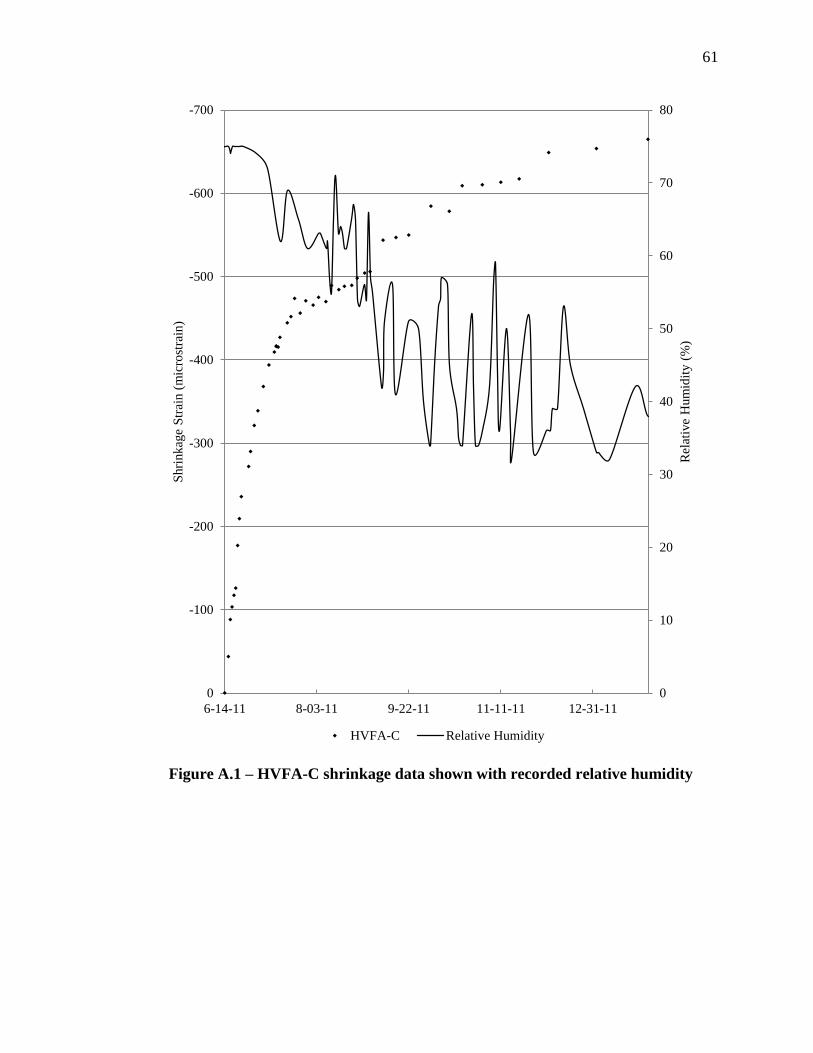
61
Figure A.1 – HVFA-C shrinkage data shown with recorded relative humidity
0
10
20
30
40
50
60
70
80-700
-600
-500
-400
-300
-200
-100
0
6-14-11 8-03-11 9-22-11 11-11-11 12-31-11
Rel
ativ
e H
um
idit
y (
%)
Shri
nkag
e S
trai
n (
mic
rost
rain
)
HVFA-C Relative Humidity
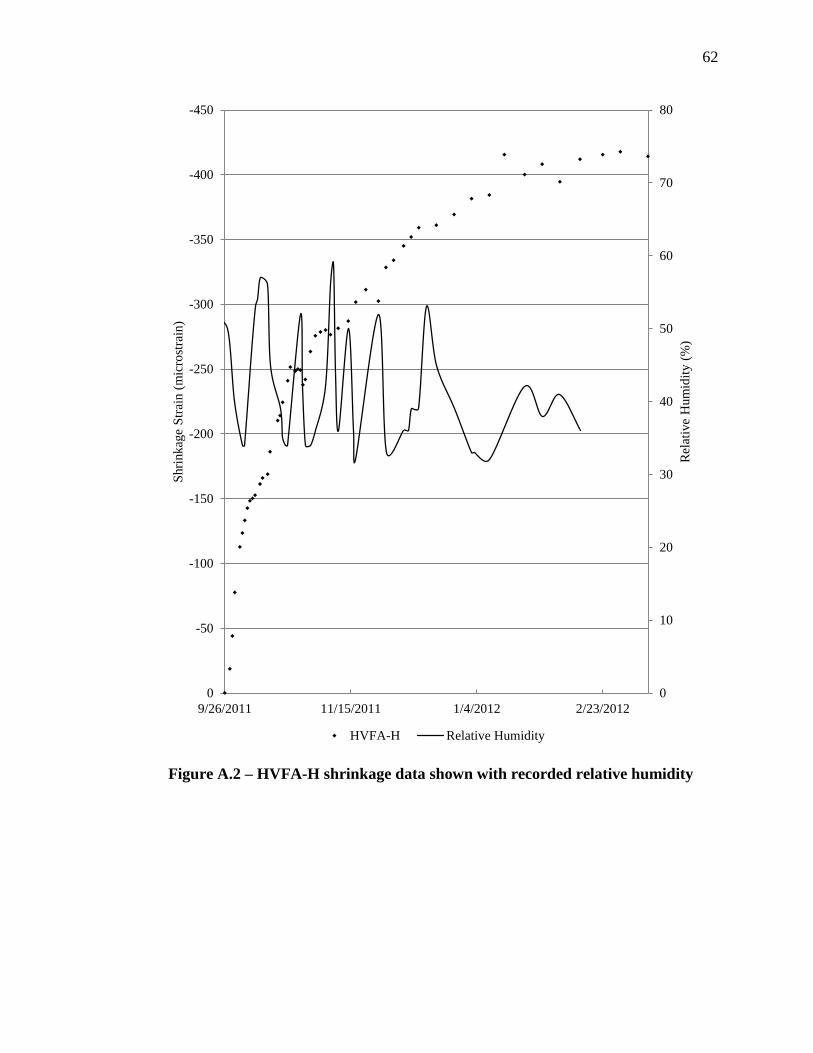
62
Figure A.2 – HVFA-H shrinkage data shown with recorded relative humidity
0
10
20
30
40
50
60
70
80-450
-400
-350
-300
-250
-200
-150
-100
-50
0
9/26/2011 11/15/2011 1/4/2012 2/23/2012
Rel
ativ
e H
um
idit
y (
%)
Shri
nkag
e S
trai
n (
mic
rost
rain
)
HVFA-H Relative Humidity
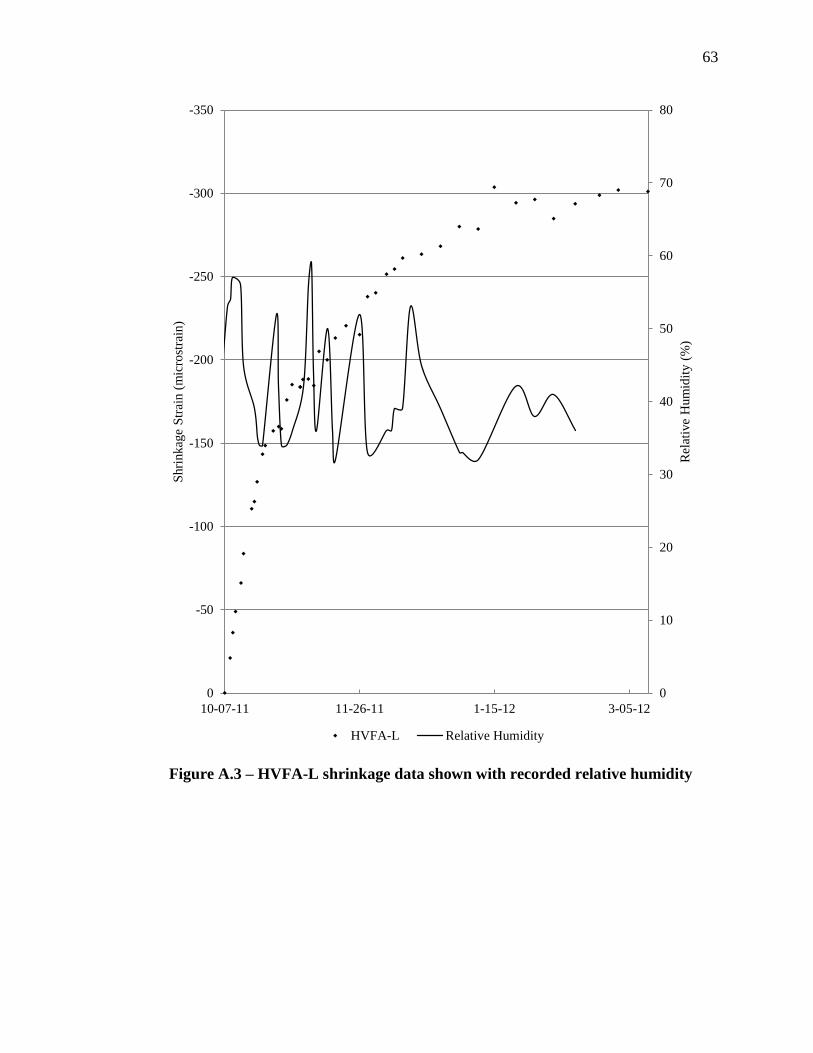
63
Figure A.3 – HVFA-L shrinkage data shown with recorded relative humidity
0
10
20
30
40
50
60
70
80-350
-300
-250
-200
-150
-100
-50
0
10-07-11 11-26-11 1-15-12 3-05-12
Rel
ativ
e H
um
idit
y (
%)
Shri
nkag
e S
trai
n (
mic
rost
rain
)
HVFA-L Relative Humidity

64
APPENDIX B
EXAMPLE STRAIN CALCULATIONS
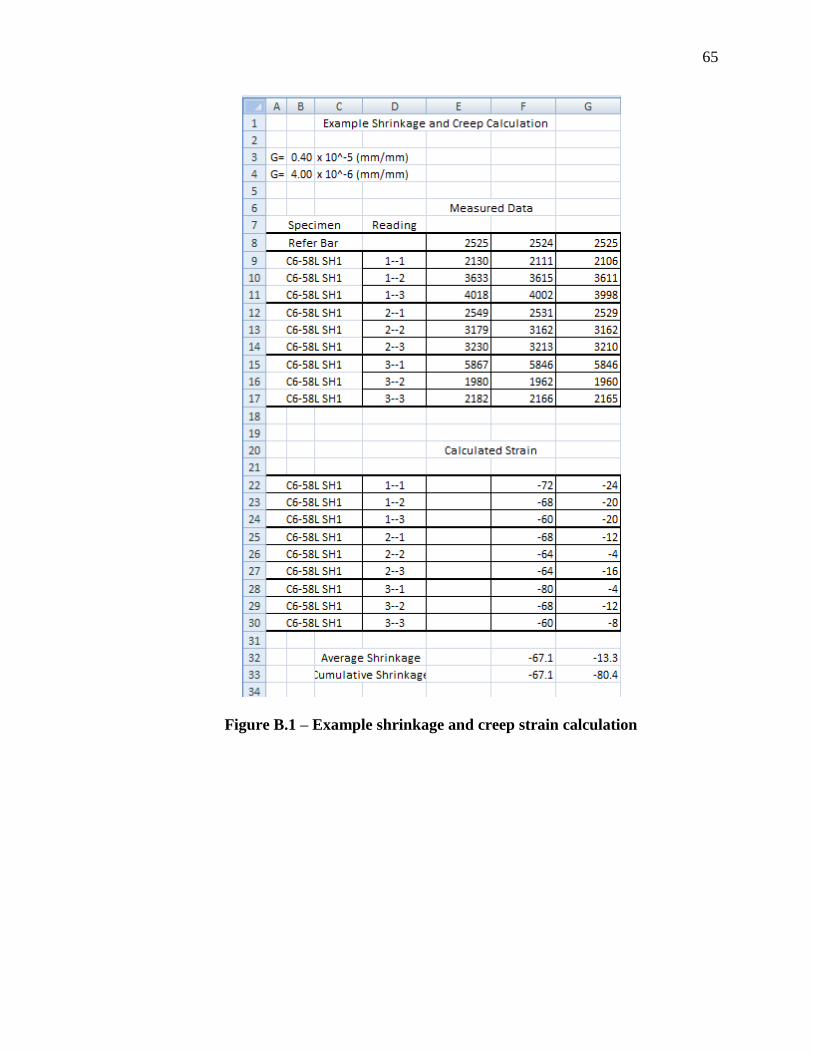
65
Figure B.1 – Example shrinkage and creep strain calculation
66
Figure B.2 – Example shrinkage and creep strain calculations with equations shown
67
APPENDIX C
COEFFICIENT OF VARIATION DATA
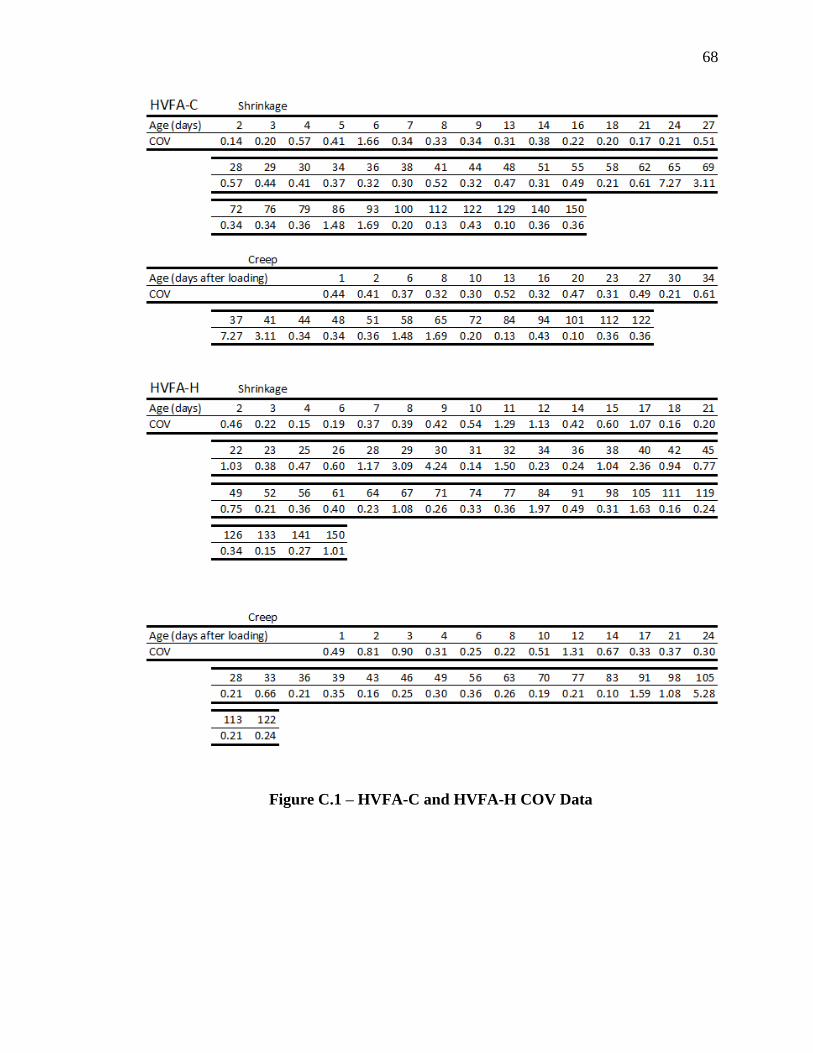
68
Figure C.1 – HVFA-C and HVFA-H COV Data
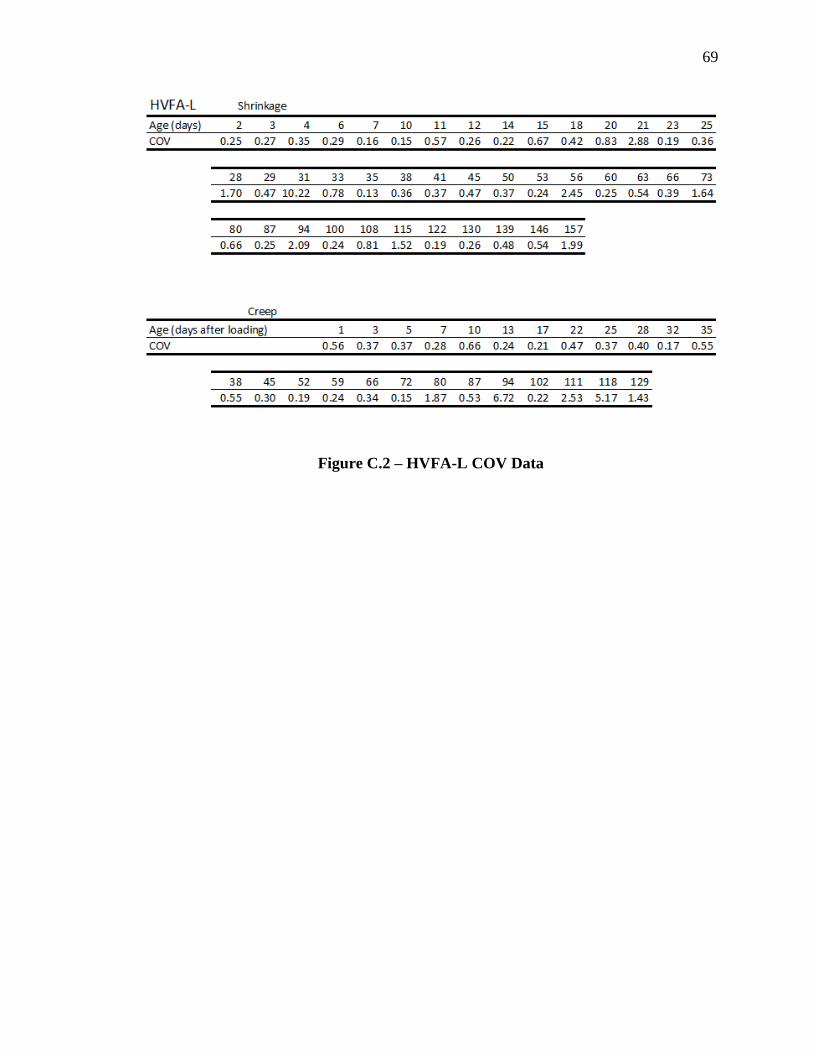
69
Figure C.2 – HVFA-L COV Data
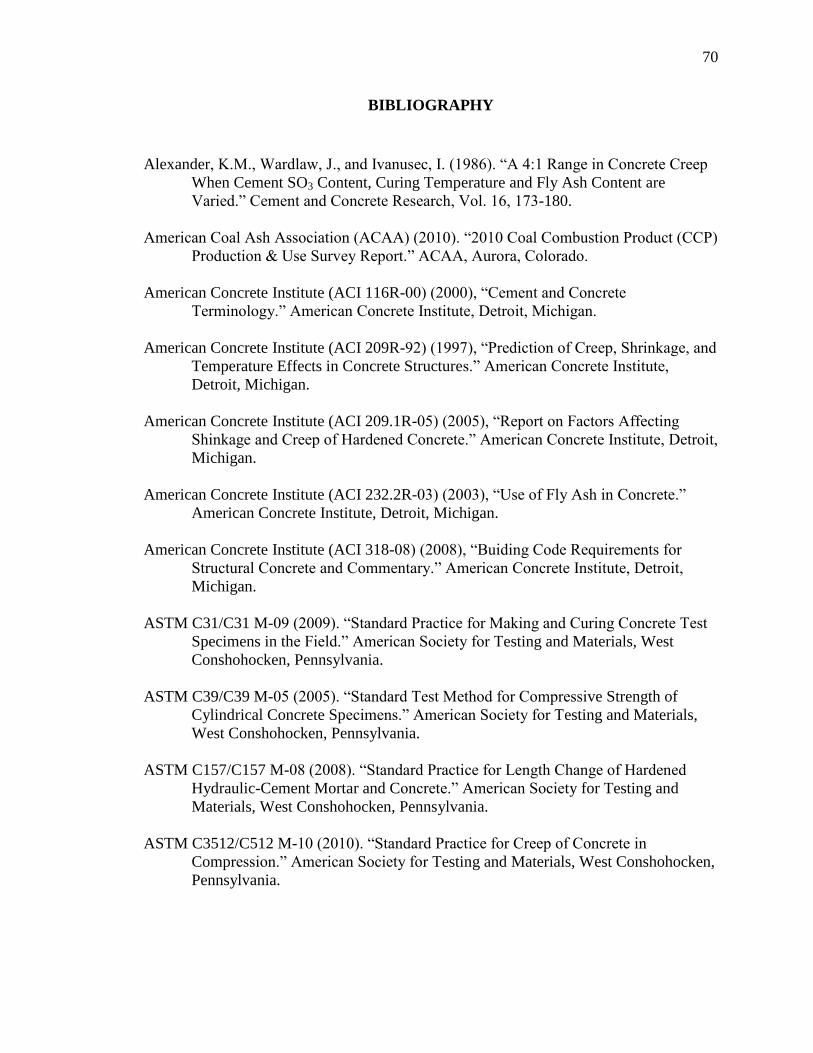
70
BIBLIOGRAPHY
Alexander, K.M., Wardlaw, J., and Ivanusec, I. (1986). “A 4:1 Range in Concrete Creep
When Cement SO3 Content, Curing Temperature and Fly Ash Content are
Varied.” Cement and Concrete Research, Vol. 16, 173-180.
American Coal Ash Association (ACAA) (2010). “2010 Coal Combustion Product (CCP)
Production & Use Survey Report.” ACAA, Aurora, Colorado.
American Concrete Institute (ACI 116R-00) (2000), “Cement and Concrete
Terminology.” American Concrete Institute, Detroit, Michigan.
American Concrete Institute (ACI 209R-92) (1997), “Prediction of Creep, Shrinkage, and
Temperature Effects in Concrete Structures.” American Concrete Institute,
Detroit, Michigan.
American Concrete Institute (ACI 209.1R-05) (2005), “Report on Factors Affecting
Shinkage and Creep of Hardened Concrete.” American Concrete Institute, Detroit,
Michigan.
American Concrete Institute (ACI 232.2R-03) (2003), “Use of Fly Ash in Concrete.”
American Concrete Institute, Detroit, Michigan.
American Concrete Institute (ACI 318-08) (2008), “Buiding Code Requirements for
Structural Concrete and Commentary.” American Concrete Institute, Detroit,
Michigan.
ASTM C31/C31 M-09 (2009). “Standard Practice for Making and Curing Concrete Test
Specimens in the Field.” American Society for Testing and Materials, West
Conshohocken, Pennsylvania.
ASTM C39/C39 M-05 (2005). “Standard Test Method for Compressive Strength of
Cylindrical Concrete Specimens.” American Society for Testing and Materials,
West Conshohocken, Pennsylvania.
ASTM C157/C157 M-08 (2008). “Standard Practice for Length Change of Hardened
Hydraulic-Cement Mortar and Concrete.” American Society for Testing and
Materials, West Conshohocken, Pennsylvania.
ASTM C3512/C512 M-10 (2010). “Standard Practice for Creep of Concrete in
Compression.” American Society for Testing and Materials, West Conshohocken,
Pennsylvania.
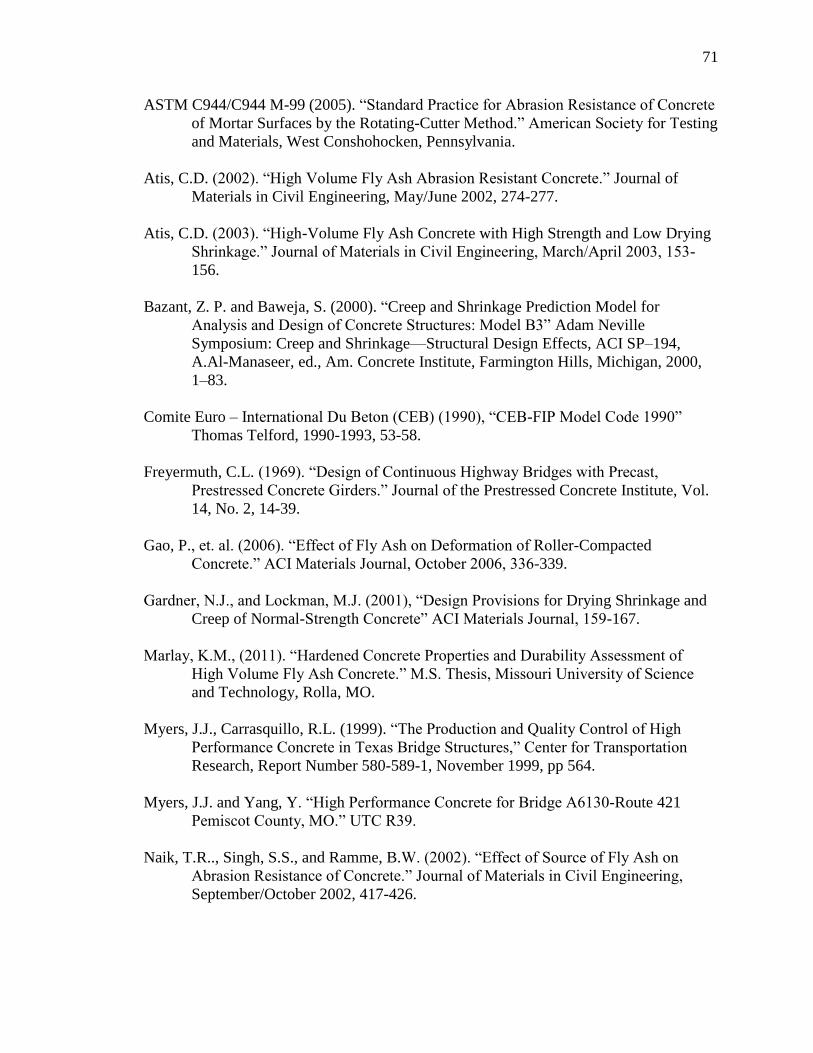
71
ASTM C944/C944 M-99 (2005). “Standard Practice for Abrasion Resistance of Concrete
of Mortar Surfaces by the Rotating-Cutter Method.” American Society for Testing
and Materials, West Conshohocken, Pennsylvania.
Atis, C.D. (2002). “High Volume Fly Ash Abrasion Resistant Concrete.” Journal of
Materials in Civil Engineering, May/June 2002, 274-277.
Atis, C.D. (2003). “High-Volume Fly Ash Concrete with High Strength and Low Drying
Shrinkage.” Journal of Materials in Civil Engineering, March/April 2003, 153-
156.
Bazant, Z. P. and Baweja, S. (2000). “Creep and Shrinkage Prediction Model for
Analysis and Design of Concrete Structures: Model B3” Adam Neville
Symposium: Creep and Shrinkage—Structural Design Effects, ACI SP–194,
A.Al-Manaseer, ed., Am. Concrete Institute, Farmington Hills, Michigan, 2000,
1–83.
Comite Euro – International Du Beton (CEB) (1990), “CEB-FIP Model Code 1990”
Thomas Telford, 1990-1993, 53-58.
Freyermuth, C.L. (1969). “Design of Continuous Highway Bridges with Precast,
Prestressed Concrete Girders.” Journal of the Prestressed Concrete Institute, Vol.
14, No. 2, 14-39.
Gao, P., et. al. (2006). “Effect of Fly Ash on Deformation of Roller-Compacted
Concrete.” ACI Materials Journal, October 2006, 336-339.
Gardner, N.J., and Lockman, M.J. (2001), “Design Provisions for Drying Shrinkage and
Creep of Normal-Strength Concrete” ACI Materials Journal, 159-167.
Marlay, K.M., (2011). “Hardened Concrete Properties and Durability Assessment of
High Volume Fly Ash Concrete.” M.S. Thesis, Missouri University of Science
and Technology, Rolla, MO.
Myers, J.J., Carrasquillo, R.L. (1999). “The Production and Quality Control of High
Performance Concrete in Texas Bridge Structures,” Center for Transportation
Research, Report Number 580-589-1, November 1999, pp 564.
Myers, J.J. and Yang, Y. “High Performance Concrete for Bridge A6130-Route 421
Pemiscot County, MO.” UTC R39.
Naik, T.R.., Singh, S.S., and Ramme, B.W. (2002). “Effect of Source of Fly Ash on
Abrasion Resistance of Concrete.” Journal of Materials in Civil Engineering,
September/October 2002, 417-426.
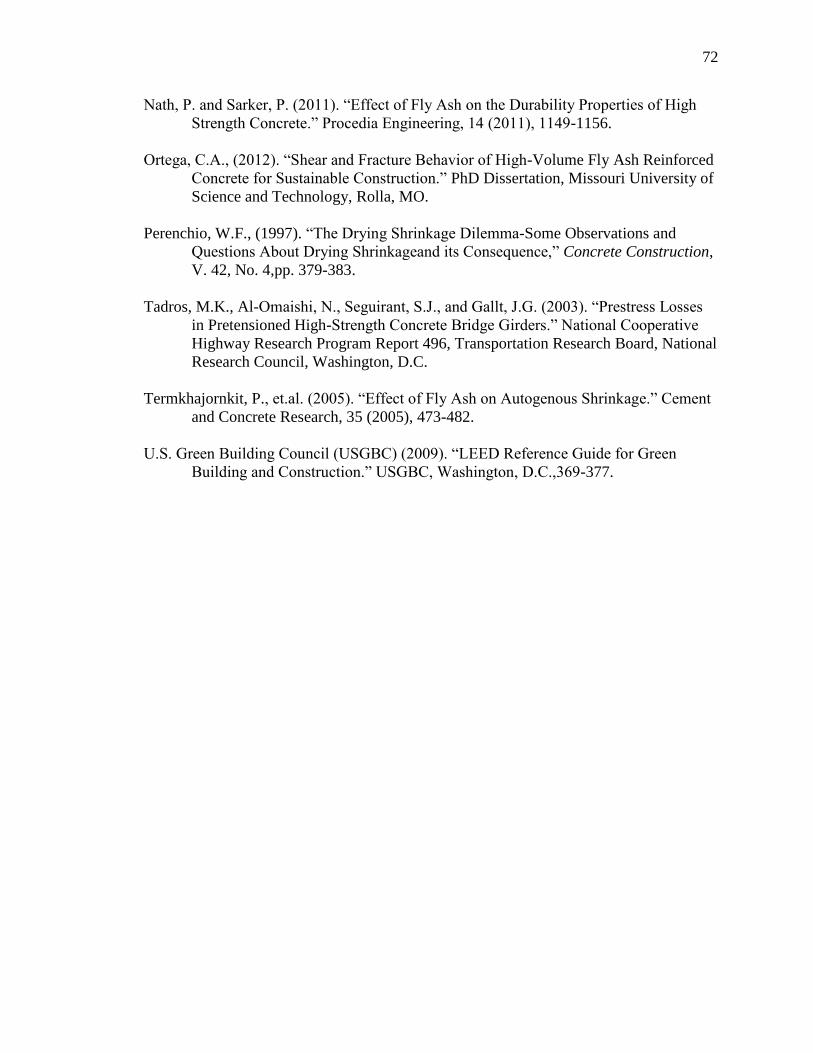
72
Nath, P. and Sarker, P. (2011). “Effect of Fly Ash on the Durability Properties of High
Strength Concrete.” Procedia Engineering, 14 (2011), 1149-1156.
Ortega, C.A., (2012). “Shear and Fracture Behavior of High-Volume Fly Ash Reinforced
Concrete for Sustainable Construction.” PhD Dissertation, Missouri University of
Science and Technology, Rolla, MO.
Perenchio, W.F., (1997). “The Drying Shrinkage Dilemma-Some Observations and
Questions About Drying Shrinkageand its Consequence,” Concrete Construction,
V. 42, No. 4,pp. 379-383.
Tadros, M.K., Al-Omaishi, N., Seguirant, S.J., and Gallt, J.G. (2003). “Prestress Losses
in Pretensioned High-Strength Concrete Bridge Girders.” National Cooperative
Highway Research Program Report 496, Transportation Research Board, National
Research Council, Washington, D.C.
Termkhajornkit, P., et.al. (2005). “Effect of Fly Ash on Autogenous Shrinkage.” Cement
and Concrete Research, 35 (2005), 473-482.
U.S. Green Building Council (USGBC) (2009). “LEED Reference Guide for Green
Building and Construction.” USGBC, Washington, D.C.,369-377.