Overview and status of the IAGOS added-value products (L4 ...
15
Overview and status of the IAGOS added-value products (L4 ancillary data) Source-receptor links applications Bastien Sauvage Université Paul Sabatier, CNRS, Toulouse and IAGOS team IAGOS Annual Meeting – June 19th, Toulouse
Transcript of Overview and status of the IAGOS added-value products (L4 ...
Overview and status of the IAGOS
added-value products (L4 ancillary
data)
Source-receptor links applications
Bastien Sauvage Université Paul Sabatier, CNRS,
Toulouse
and IAGOS team
IAGOS Annual Meeting – June 19th, Toulouse
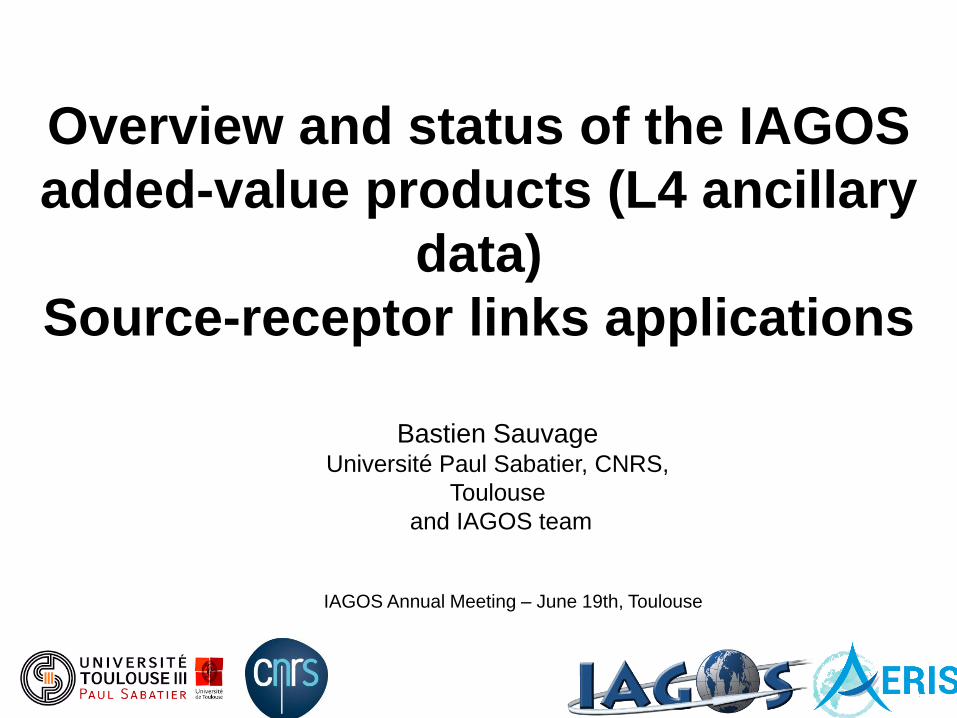
Added-value products: methodology
0.5° lat/lon
Operational analyses
& forecasts
(0.5° res. / 50-137
vertical levels)
5-20 days of backward
simulations
Added-value products
A-Meteorological data (since 1994)
C-Trajectories (since 1994)
Over 5days, every 6h OR 3h
PV, P(PV=1pvu, 2pvu, …),lat, lon,
fraction of each cluster
z = 10 hPa
Coupling tool
(SOFT-IO)
CO Emission inventories
anthropogenic and biomass burning
injection
resid
z
EmissionTonContributi
D-SOFT-IO (since 2002)
• CO anthropogenic contributions
(EDGAR & MACCITY)
• CO fire contributions (GFASv1.2 &
GFED4)
Over 20days & 14 regions
B-Residence time (since 1994)
Over 20 days
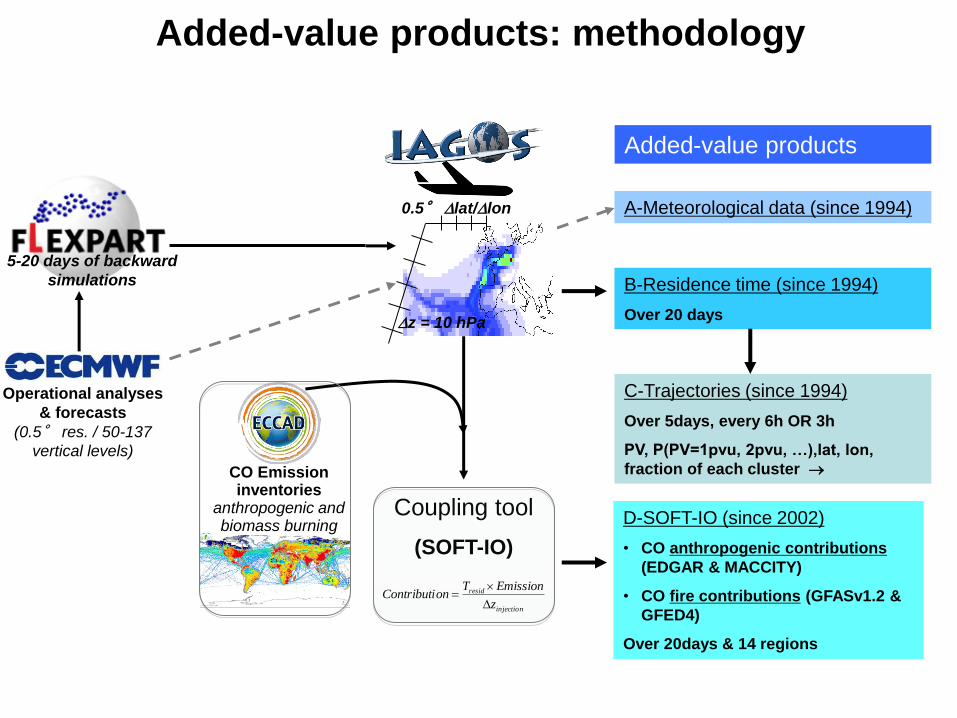
A-Meteorological data (Ancillary Parameters)
ECMWF meteorological analyses interpolation over flight tracks since 1994 :
• Air potential temperature
• Geopotential height (@ 500hPa)
• Orography
• Pressure of PV=1.5; PV=2; PV=3; PV=4
• PV (ECMWF and calculated with FLEXPART)
• Surface pressure
• Vertical wind speed
• PBL height (ECMWF and calculated with FLEXPART)
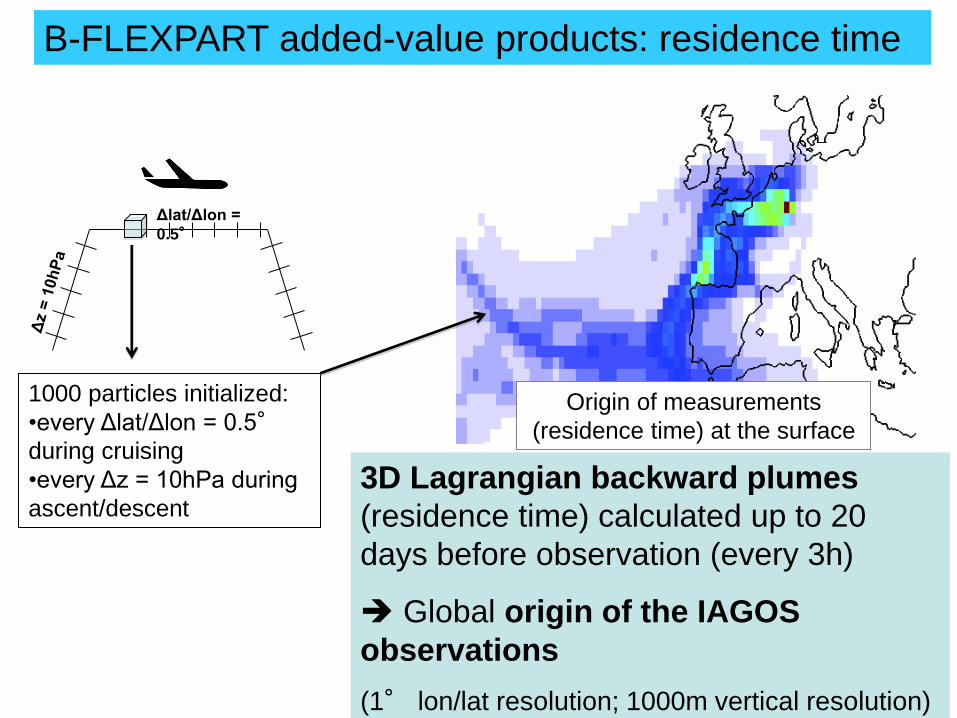
1000 particles initialized:
•every Δlat/Δlon = 0.5°
during cruising
•every Δz = 10hPa during
ascent/descent
Δlat/Δlon =
0.5°
3D Lagrangian backward plumes
(residence time) calculated up to 20
days before observation (every 3h)
Global origin of the IAGOS
observations
(1° lon/lat resolution; 1000m vertical resolution)
B-FLEXPART added-value products: residence time
Origin of measurements
(residence time) at the surface
1
3 4
5
2
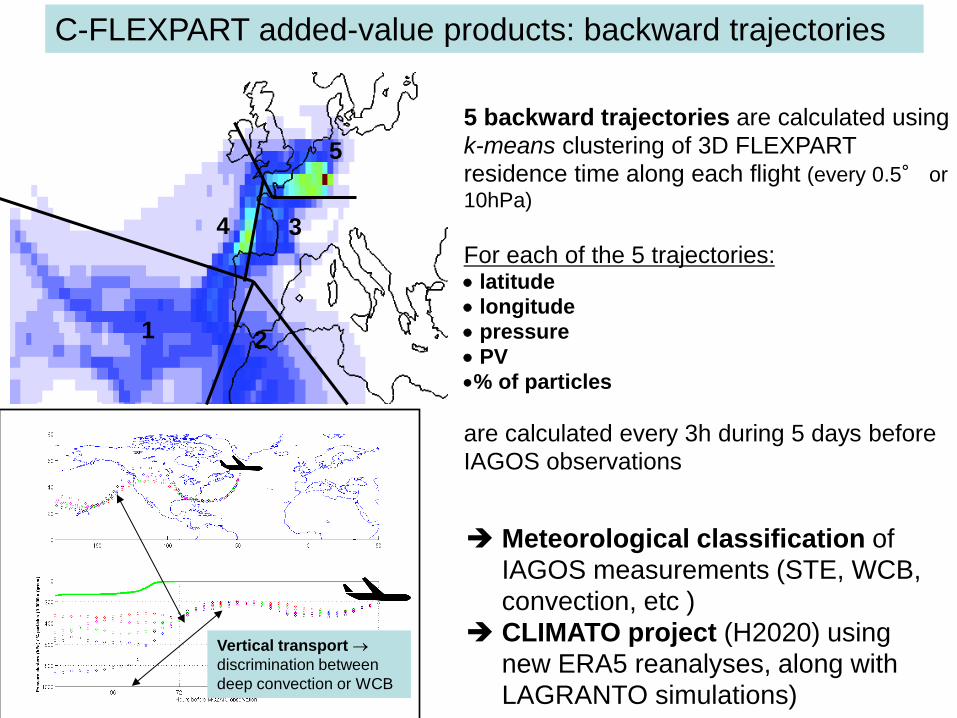
C-FLEXPART added-value products: backward trajectories
Meteorological classification of
IAGOS measurements (STE, WCB,
convection, etc )
CLIMATO project (H2020) using new ERA5 reanalyses, along with
LAGRANTO simulations)
Vertical transport
discrimination between
deep convection or WCB
5 backward trajectories are calculated using
k-means clustering of 3D FLEXPART
residence time along each flight (every 0.5° or
10hPa)
For each of the 5 trajectories: latitude
longitude
pressure
PV
% of particles
are calculated every 3h during 5 days before
IAGOS observations
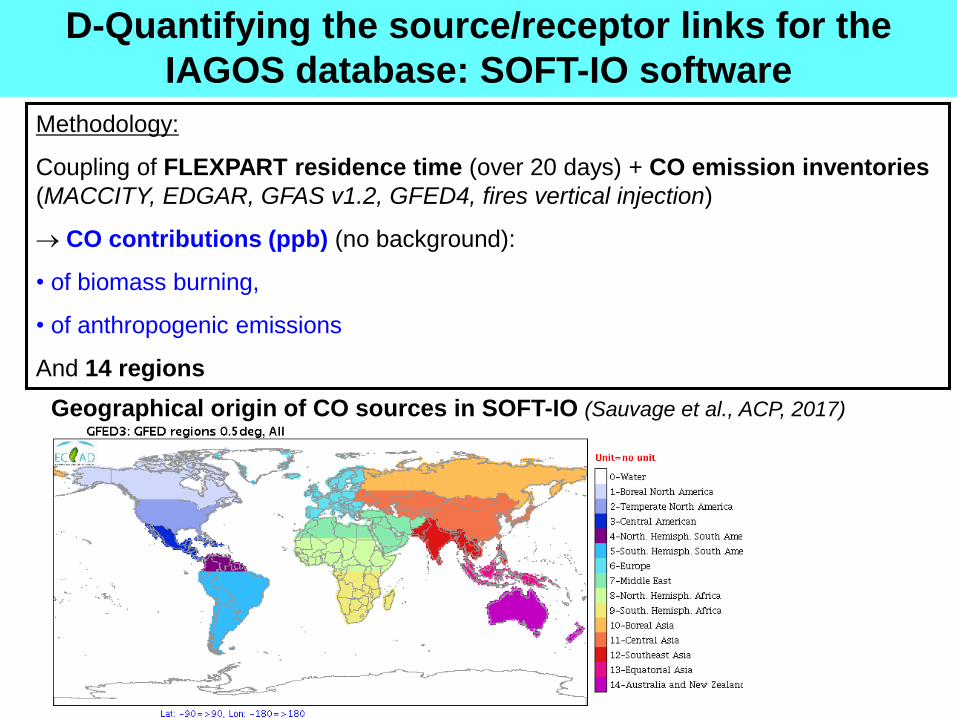
Methodology:
Coupling of FLEXPART residence time (over 20 days) + CO emission inventories
(MACCITY, EDGAR, GFAS v1.2, GFED4, fires vertical injection)
CO contributions (ppb) (no background):
• of biomass burning,
• of anthropogenic emissions
And 14 regions
Geographical origin of CO sources in SOFT-IO (Sauvage et al., ACP, 2017)
D-Quantifying the source/receptor links for the
IAGOS database: SOFT-IO software
D-Quantifying the source/receptor links for the
IAGOS database: SOFT-IO software
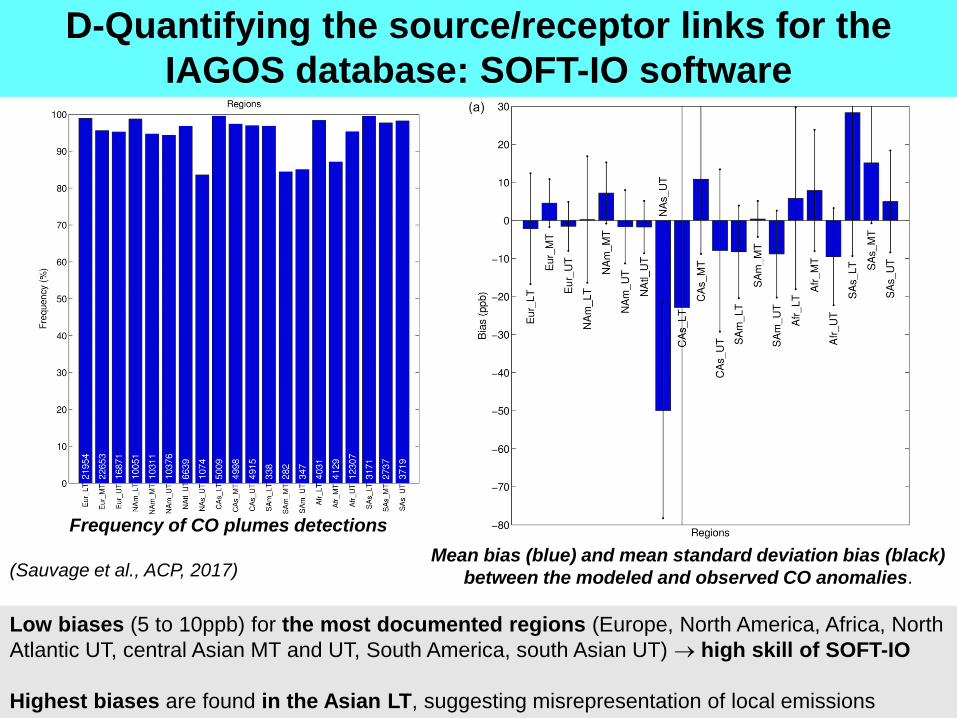
Frequency of CO plumes detections
Mean bias (blue) and mean standard deviation bias (black)
between the modeled and observed CO anomalies.
Low biases (5 to 10ppb) for the most documented regions (Europe, North America, Africa, North
Atlantic UT, central Asian MT and UT, South America, south Asian UT) high skill of SOFT-IO
Highest biases are found in the Asian LT, suggesting misrepresentation of local emissions
(Sauvage et al., ACP, 2017)
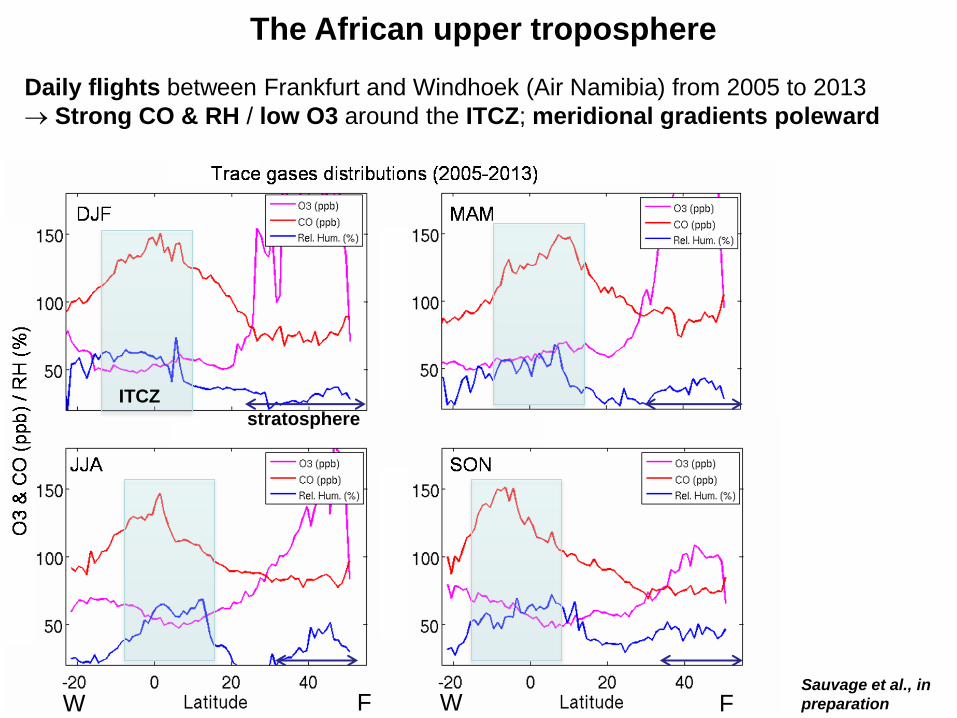
The African upper troposphere
Daily flights between Frankfurt and Windhoek (Air Namibia) from 2005 to 2013
Strong CO & RH / low O3 around the ITCZ; meridional gradients poleward
Sauvage et al., in
preparation W W F F
ITCZ
stratosphere
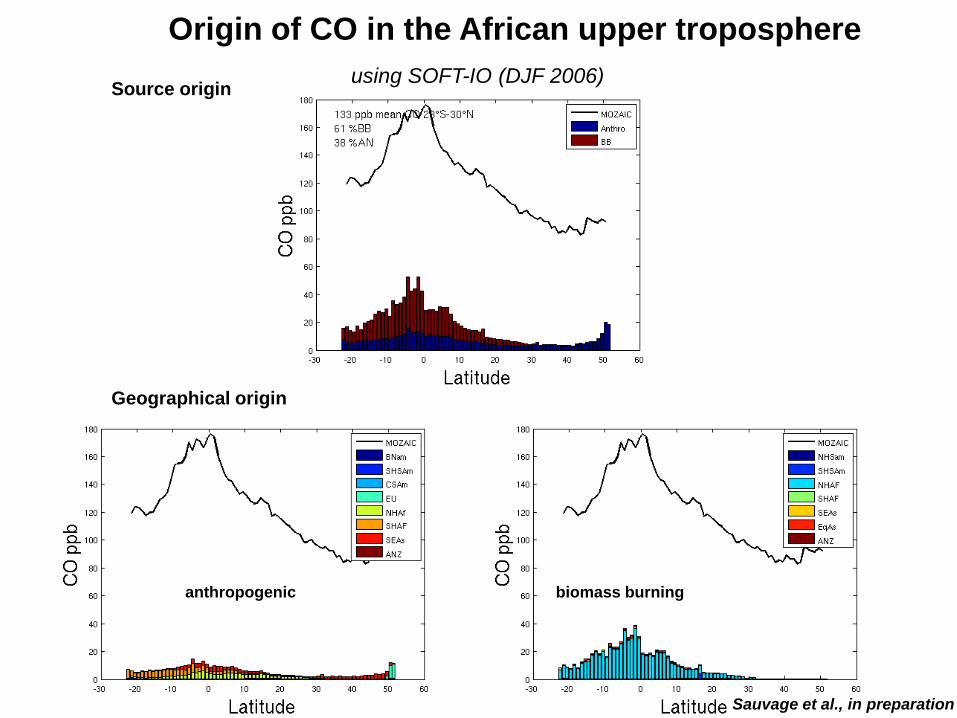
Origin of CO in the African upper troposphere
using SOFT-IO (DJF 2006) Source origin
anthropogenic biomass burning
Geographical origin
Sauvage et al., in preparation
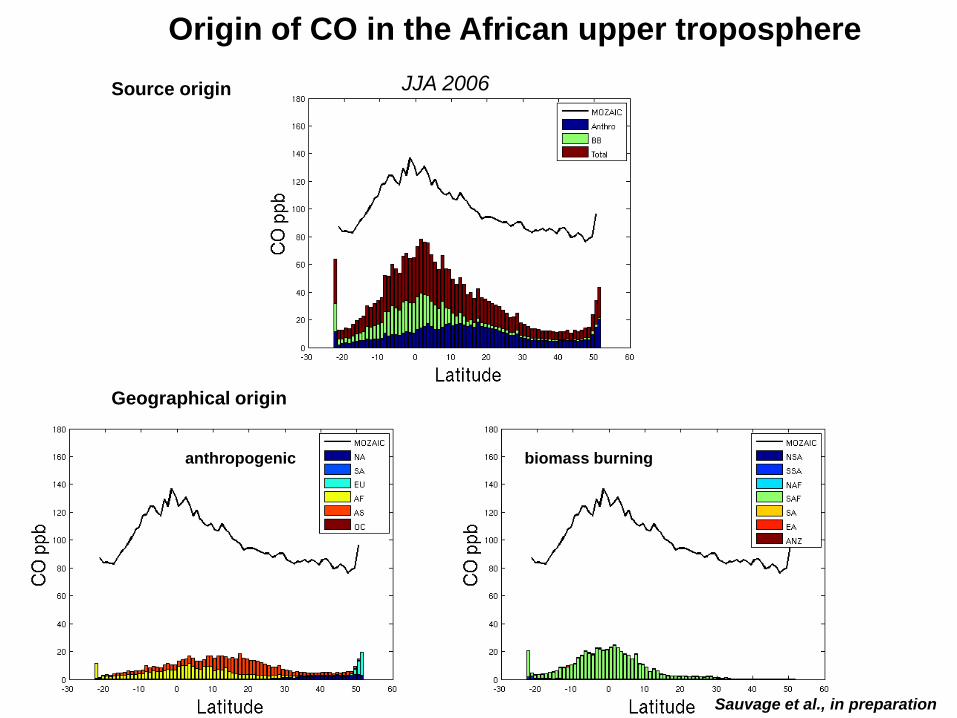
JJA 2006
anthropogenic biomass burning
Origin of CO in the African upper troposphere
Sauvage et al., in preparation
Source origin
Geographical origin
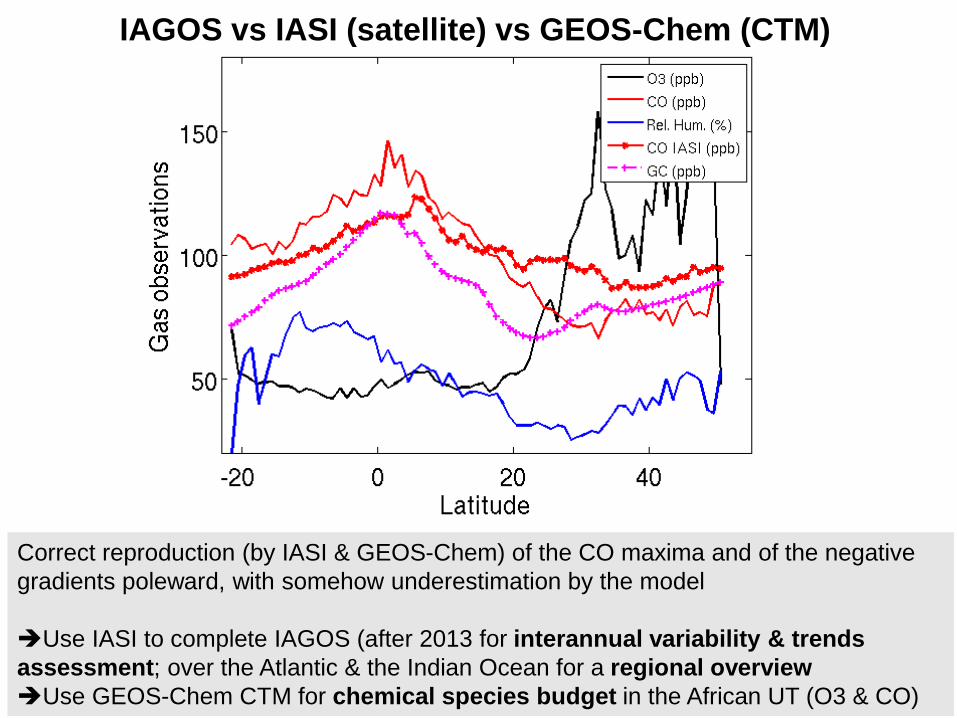
IAGOS vs IASI (satellite) vs GEOS-Chem (CTM)
Correct reproduction (by IASI & GEOS-Chem) of the CO maxima and of the negative
gradients poleward, with somehow underestimation by the model
Use IASI to complete IAGOS (after 2013 for interannual variability & trends
assessment; over the Atlantic & the Indian Ocean for a regional overview
Use GEOS-Chem CTM for chemical species budget in the African UT (O3 & CO)
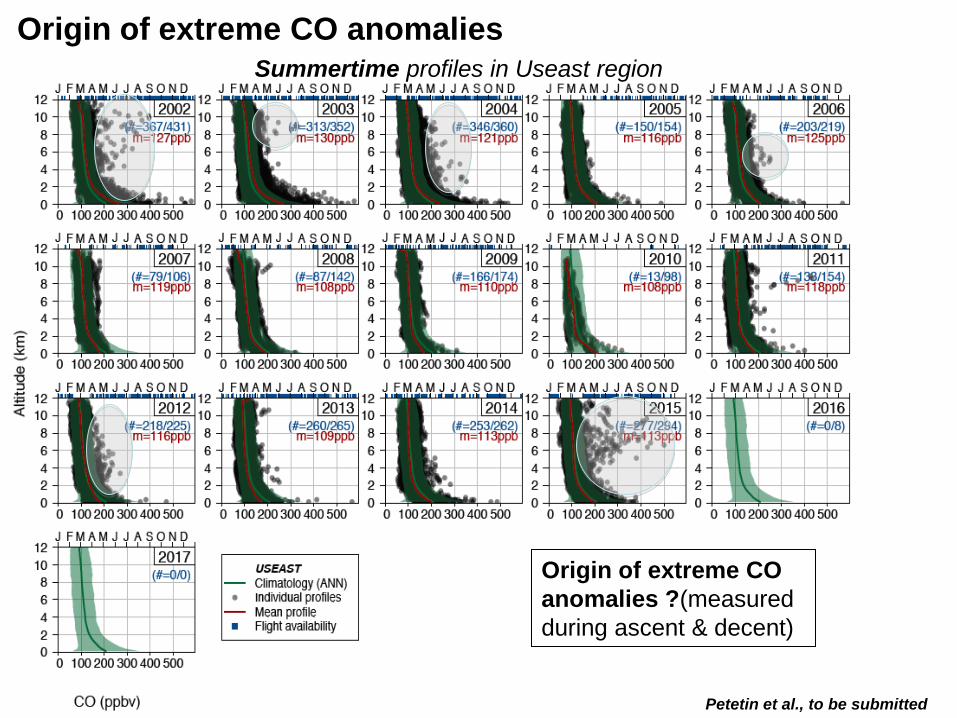
Origin of extreme CO anomalies
Petetin et al., to be submitted
Origin of extreme CO
anomalies ?(measured
during ascent & decent)
Summertime profiles in Useast region
Petetin et al., to be submitted
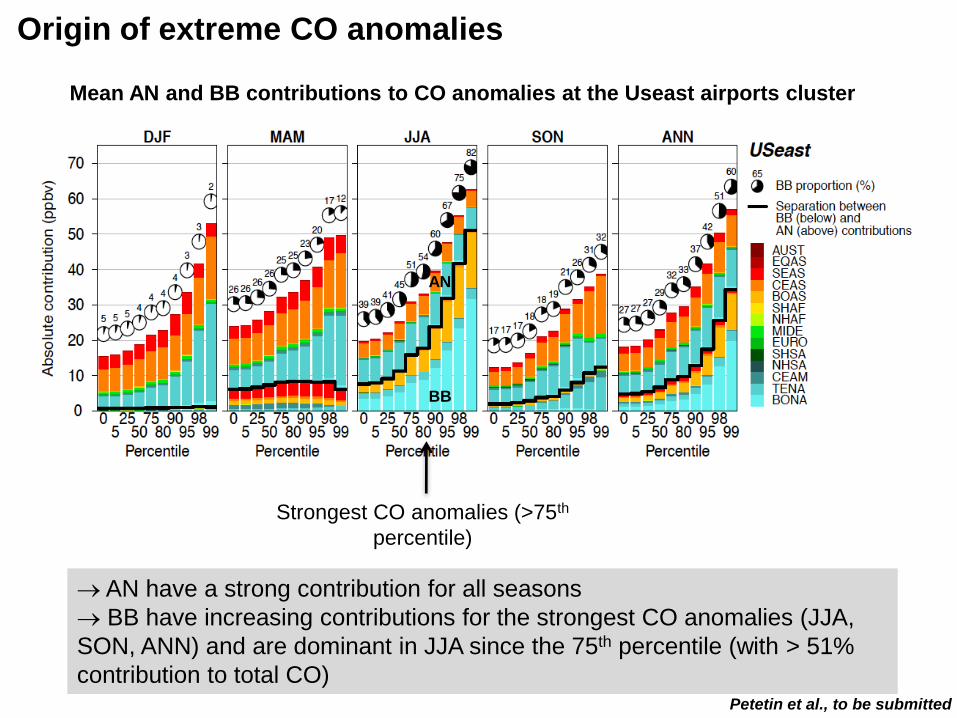
Mean AN and BB contributions to CO anomalies at the Useast airports cluster
Origin of extreme CO anomalies
BB
AN
Strongest CO anomalies (>75th
percentile)
AN have a strong contribution for all seasons
BB have increasing contributions for the strongest CO anomalies (JJA,
SON, ANN) and are dominant in JJA since the 75th percentile (with > 51%
contribution to total CO)
Perspectives
Backward trajectories:
New calculations with ERA5 reanalyzes (rather than operational analyses and
forecasts)
meteorological classification of IAGOS observations (CLIMATO H2020):
STE, WCB, convection
SOFT-IO:
New simulations using meteorological analyses with higher horizontal
resolution (0.1°/0.3°)
New simulations using ERA5 reanalysis (consistency for inter annual variability
and climate studies)
Perspectives
New software for coupling IAGOS NOx and lightning observations (SOFT-
IO-Li)
Systematic FLEXPART simulations from IAGOS NOx measurements,
coupled with lightning observations (geostationary satellites GLM, MTG-Li) : proposal
submitted to the French space agency (CNES) (Sauvage, Berkes, Defer et al., LA +
Jülich )
Derive LiNOx plumes metrics:
• plumes age,
• NOx, O3, RH
• lightning numbers,
• IC/CG ratio,
• possibly space-based NO2 & HNO3 over sea,
• NOx concentrations at the just after emission using NOx e-folding