Journal of Applied Geophysics - liag-hannover.de · dielectric permittivity and magnetic...
10
Soil properties and performance of landmine detection by metal detector and ground-penetrating radar — Soil characterisation and its verification by a field test Kazunori Takahashi ⁎, Holger Preetz, Jan Igel Leibniz Institute for Applied Geophysics, Stilleweg 2, 30655 Hannover, Germany abstract article info Article history: Received 11 November 2010 Accepted 16 February 2011 Available online 23 February 2011 Keywords: Dielectric permittivity Electric conductivity Electromagnetic induction (EMI) Ground-penetrating radar (GPR) Magnetic susceptibility Soil heterogeneity Metal detectors have commonly been used for landmine detection, and ground-penetrating radar (GPR) is about to be deployed for this purpose. These devices are influenced by the magnetic and electric properties of soil, since both employ electromagnetic techniques. Various soil properties and their spatial distributions were measured and determined with geophysical methods in four soil types where a test of metal detectors and GPR systems took place. By analysing the soil properties, these four soils were classified based on the expected influence of each detection technique and predicted soil difficulty. This classification was compared to the detection performance of the detectors and a clear correlation between the predicted soil difficulty and performance was observed. The detection performance of the metal detector and target identification performance of the GPR systems degraded in soils that were expected to be problematic. Therefore, this study demonstrated that the metal detector and GPR performance for landmine detection can be assessed qualitatively by geophysical analyses. © 2011 Elsevier B.V. All rights reserved. 1. Introduction There are still more than 70 countries worldwide affected by landmines and unexploded ordnance (UXO). The International Campaign to Ban Landmines (ICBL) identified at least 73,576 casualties in these countries during the past 10 years (ICBL, 2009). Although the dissemination of landmines is considerably reduced today, a large number buried during past conflicts still threaten the population of affected countries. The most common tool for detecting buried landmines is the metal detector, which has been used for more than 50 years because of the simple operation, relatively low costs, and high reliability of this technique. Metal detectors operate via the principle of electromag- netic induction (EMI) in the frequency range from 100 Hz to 100 kHz. Commercial demining detectors typically produce an audible beep when an object containing metal is present in a sensitive area, although the object may not be a landmine. Consequently, an extremely large number of false alarms may occur during clearance operations. The sources of these false alarms include screws, nails, and shrapnel from former bomb explosions. In addition, soil with considerable magnetic properties can create false alarms, especially if the frequency dependence of magnetic susceptibility is high (Das, 2006). Clearance operations are hindered tremendously because all metal detector alarm sources must be investigated in most human- itarian demining operations. For example, approximately 200 million items were excavated during the clearance operation in Cambodia between 1992 and 1998, and only approximately 500,000 items (i.e., less than 0.3%) were landmines or other explosive devices. With such a slow clearance speed, an estimated 450–500 years are required to clear all mines in the world, which assumes that no new mines are laid (MacDonald et al., 2003). This estimate indicates the necessity of accelerating clearance operations. One proposed method for this acceleration is the use of subsurface sensing techniques in non-destructive manner that enables the identification of false alarm sources. For example, this identification allows for application of a rapid excavation process for non-explosive devices as tested in Bushoff and Cresci (2008) which is expected to speed up the total clearance operation. A significant number of studies have been performed on the discrimination of targets. One approach is to analyse metal detector responses (e.g., Pasion et al., 2007; Shubitidze et al., 2007; Throckmorton et al., 2007). Another approach is to exploit other subsurface sensing techniques in addition to a metal detector or as a standalone detector. Such techniques include nuclear quadrupole resonance (NQR) (e.g., Garroway et al., 2001; Jakobsson et al., 2005; Somasundaram et al., 2007), chemical vapour analysis/ spectrometry (e.g., Cumming et al., 2001), seismic (e.g., Sabatier and Xiang, 2001; Scott et al., 2001; Zeng and Liu, 2001), and infrared detection (e.g., Khanafer et al., 2003; Muscio and Corticelli, 2004). None of the above listed technologies has been available for humanitarian demining until now because of the complexity, high costs, and large size of these systems. Journal of Applied Geophysics 73 (2011) 368–377 ⁎ Corresponding author. Tel.: + 49 511 643 3572; fax: + 49 511 643 3665. E-mail addresses: [email protected] (K. Takahashi), [email protected] (H. Preetz), [email protected] (J. Igel). 0926-9851/$ – see front matter © 2011 Elsevier B.V. All rights reserved. doi:10.1016/j.jappgeo.2011.02.008 Contents lists available at ScienceDirect Journal of Applied Geophysics journal homepage: www.elsevier.com/locate/jappgeo
Transcript of Journal of Applied Geophysics - liag-hannover.de · dielectric permittivity and magnetic...
Journal of Applied Geophysics 73 (2011) 368–377
Contents lists available at ScienceDirect
Journal of Applied Geophysics
j ourna l homepage: www.e lsev ie r.com/ locate / jappgeo
Soil properties and performance of landmine detection by metal detector andground-penetrating radar — Soil characterisation and its verification by a field test
Kazunori Takahashi ⁎, Holger Preetz, Jan IgelLeibniz Institute for Applied Geophysics, Stilleweg 2, 30655 Hannover, Germany
⁎ Corresponding author. Tel.: +49 511 643 3572; faxE-mail addresses: kazunori.takahashi@liag-hannover
[email protected] (H. Preetz), jan.igel@lia
0926-9851/$ – see front matter © 2011 Elsevier B.V. Adoi:10.1016/j.jappgeo.2011.02.008
a b s t r a c t
a r t i c l e i n f oArticle history:Received 11 November 2010Accepted 16 February 2011Available online 23 February 2011
Keywords:Dielectric permittivityElectric conductivityElectromagnetic induction (EMI)Ground-penetrating radar (GPR)Magnetic susceptibilitySoil heterogeneity
Metal detectors have commonly been used for landmine detection, and ground-penetrating radar (GPR) isabout to be deployed for this purpose. These devices are influenced by the magnetic and electric properties ofsoil, since both employ electromagnetic techniques. Various soil properties and their spatial distributionswere measured and determined with geophysical methods in four soil types where a test of metal detectorsand GPR systems took place. By analysing the soil properties, these four soils were classified based on theexpected influence of each detection technique and predicted soil difficulty. This classification was comparedto the detection performance of the detectors and a clear correlation between the predicted soil difficulty andperformance was observed. The detection performance of the metal detector and target identificationperformance of the GPR systems degraded in soils that were expected to be problematic. Therefore, this studydemonstrated that the metal detector and GPR performance for landmine detection can be assessedqualitatively by geophysical analyses.
: +49 511 643 3665..de (K. Takahashi),g-hannover.de (J. Igel).
ll rights reserved.
© 2011 Elsevier B.V. All rights reserved.
1. Introduction
There are still more than 70 countries worldwide affected bylandmines and unexploded ordnance (UXO). The InternationalCampaign to Ban Landmines (ICBL) identified at least 73,576casualties in these countries during the past 10 years (ICBL, 2009).Although the dissemination of landmines is considerably reducedtoday, a large number buried during past conflicts still threaten thepopulation of affected countries.
The most common tool for detecting buried landmines is themetaldetector, which has been used for more than 50 years because of thesimple operation, relatively low costs, and high reliability of thistechnique. Metal detectors operate via the principle of electromag-netic induction (EMI) in the frequency range from 100 Hz to 100 kHz.Commercial demining detectors typically produce an audible beepwhen an object containing metal is present in a sensitive area,although the object may not be a landmine. Consequently, anextremely large number of false alarms may occur during clearanceoperations. The sources of these false alarms include screws, nails, andshrapnel from former bomb explosions. In addition, soil withconsiderable magnetic properties can create false alarms, especiallyif the frequency dependence of magnetic susceptibility is high (Das,2006). Clearance operations are hindered tremendously because all
metal detector alarm sources must be investigated in most human-itarian demining operations. For example, approximately 200 millionitems were excavated during the clearance operation in Cambodiabetween 1992 and 1998, and only approximately 500,000 items (i.e.,less than 0.3%) were landmines or other explosive devices. With sucha slow clearance speed, an estimated 450–500 years are required toclear all mines in theworld, which assumes that no newmines are laid(MacDonald et al., 2003). This estimate indicates the necessity ofaccelerating clearance operations.
One proposed method for this acceleration is the use of subsurfacesensing techniques in non-destructive manner that enables theidentification of false alarm sources. For example, this identificationallows for application of a rapid excavation process for non-explosivedevices as tested in Bushoff and Cresci (2008) which is expected tospeed up the total clearance operation. A significant number of studieshave been performed on the discrimination of targets. One approachis to analyse metal detector responses (e.g., Pasion et al., 2007;Shubitidze et al., 2007; Throckmorton et al., 2007). Another approachis to exploit other subsurface sensing techniques in addition to ametaldetector or as a standalone detector. Such techniques include nuclearquadrupole resonance (NQR) (e.g., Garroway et al., 2001; Jakobssonet al., 2005; Somasundaram et al., 2007), chemical vapour analysis/spectrometry (e.g., Cumming et al., 2001), seismic (e.g., Sabatier andXiang, 2001; Scott et al., 2001; Zeng and Liu, 2001), and infrareddetection (e.g., Khanafer et al., 2003; Muscio and Corticelli, 2004).None of the above listed technologies has been available forhumanitarian demining until now because of the complexity, highcosts, and large size of these systems.
369K. Takahashi et al. / Journal of Applied Geophysics 73 (2011) 368–377
Ground-penetrating radar (GPR) has been considered the mostpromising subsurface sensing technique for demining in combinationwith a metal detector. GPR will be deployed relatively soon due to theability of this method to detect both metallic and non-metalliclandmines, imaging capability, simplicity, and relatively low produc-tion cost (e.g., Bruschini et al., 1998; Brunzell, 1999; Chen et al., 2001;Lopera and Milisavljevic, 2007). Furthermore, the capability forimaging and post-processing data enables the identification ofdetected objects (e.g., Savelyev et al., 2007; Ho et al., 2008; Takahashiand Sato, 2008). A system combining GPR and a metal detector iscommonly called a dual sensor. In the operation of such a system, themetal detector is used as the primary sensor for detection andlocalisation of metal-containing object, and the system then switchesto GPR as the secondary sensor for target identification. Basically, bothsensors transmit electromagnetic fields into the ground and measurethe returned fields, which contain information on the target buried inthe soil. The returned field is disturbed if the soil has distinct magneticand/or dielectric properties (Das, 2006; CEN, 2008; Cross, 2008; Igel,2008), and information on the target is not retrievable in worst cases,whichmay result in missed landmine detections. Therefore, studies ofsoil influence on both metal detector and GPR are very important forassessing the productivity and safety of clearance operations.
In this paper, the relationships between soil properties andperformance of landmine detection sensors will be discussed. Soilproperties that principally affect the detection techniques and theirinfluence on these methods will be briefly reviewed in the followingsection. These soil properties were measured in the field during a testcampaign of metal detectors and dual sensors to observe anddemonstrate the associated correlations. According to these measure-ments, the comprehensive evaluation of test soils for the detectionperformance was accomplished. The estimation was compared to theperformance of detectors from the test campaign, and the influence ofsoil was clearly observed.
2. Influence of soil on demining sensors
Antipersonnel (AP) landmines (i.e., blast mines) are usually buriedshallowly or just beneath the ground surface and always surroundedby soil. Therefore, detection techniques are usually influenced by soil.There are some soil properties that have a relatively large influence onmetal detectors and GPR, of which the practical roles are brieflyreviewed in this section.
2.1. Magnetic susceptibility
The magnetic susceptibility of soils is caused by the presence offerrimagnetic minerals, mainly magnetite, titanomagnetite, andmaghemite. Magnetite and titanomagnetite are prevalent in basicmagnetic rocks, and concentrations of these minerals may be higherin soils than in the associated parent rock material due to residualenrichment during soil formation processes (Singer and Fine, 1989).This enrichment occurs because these minerals have a higherresistance to weathering compared to a variety of other soil minerals(Friedrich et al., 1992). Maghemite is formed during weathering andsoil genesis and is the product of magnetite oxidation (Schwertmann,1988) or can be formed as a new mineral by dissolved ironcrystallisation (Mullins, 1977). Magnetite and maghemite can alsobe formed as a result of bacterial activity (e.g., Fassbinder et al., 1990),thermal transformation of Fe-oxides during fires (Kletetschka andBanerjee, 1995), or may arise from anthropogenic atmospheric inputs(Dearing et al., 1996).
Magnetic susceptibility κ is considered the most influential soilproperty on the electromagnetic induction (EMI) technique employedby metal detectors (Das, 2006). In general, the absolute level affectsthe frequency-domain (continuous wave; CW) metal detectors, andthe frequency dependence of susceptibility has more influence on
time-domain (pulse induction; PI) detectors (Cross, 2008). Thenormalised voltage vsoil induced in the receiving coil with a radius bdue to a non-conductive soil in half-space configuration can bewritten as (Das, 2006):
vsoil = jμ0ωπabκ
2 + κ
� �m hð Þ ð1Þ
where μ0, ω, and a are the magnetic permeability of the air, angularfrequency, and radius of the transmitting coil, respectively, andm(h)=∫
0
∞J1(λa)J1(λb)exp(−2λh)dλ with J1, h, and λ as the Bessel
function of the first kind and order 1, distance to the soil, and anintegration variable, respectively. As the equation exhibits, soil witha high magnetic susceptibility creates additional responses to metaldetectors and can be misinterpreted as a metal detection and/ordisturb response from landmines. This can result in false alarms andmissing mine detections. The majority of modern metal detectorshave a ground compensation function that aims to reduce the soilinfluence; however, overcompensation or the wrong settingsreduce the sensitivity of metal detection, which also results inmissed mine detection.
Although magnetic susceptibility theoretically influences GPR, theeffect must be extremely high to influence the signal. For example, Jol(2009) suggests that itmust be greater than 30,000 SI×10−5 to have aninfluence comparable to dielectric permittivity. Soils exhibiting suchhigh magnetic susceptibility are extremely rare. Even tropical soils,which often display high susceptibility, with values in this range areexceptional (Preetz et al., 2008; Igel et al., 2009). Therefore, magneticsusceptibility has practically no influence on GPR in most soil.
Investigation of soil magnetic susceptibility can easily beperformed by electromagnetic induction based measuring deviceseither in the field or laboratory. However, the frequency dependencemay only be measured in the laboratory.
2.2. Electric conductivity
Soil can be described as a three-phase composite: the solid matrix,pore fluid, and gaseous pore filling. These three phases cause threemechanisms of conduction that determine the electric conductivity ofgeologic materials. The first is electronic conductivity caused by thefree electrons in the crystal lattice of the minerals, and the second iselectrolytic conductivity caused by the aqueous liquid in the porespace featuring dissolved ions. These two types of conductivity areindependent of frequency over a wide range. However, the thirdconduction called surface conductivity often exhibits frequencydependence. Surface conductivity is determined from the innersurface of the soil and is associated with the cation exchange capacityof the material, which is typically high for clay minerals and soilorganic matters (Igel, 2007; Knödel et al., 2007).
Electric conductivity σ is considered an influential soil property onmetal detectors, but less than magnetic susceptibility and only ifextremely high (Das, 2006). However, electric conductivity influencesGPR in the normal range. The property is related primarily to theattenuation of electromagnetic waves, such that a radar signal cannotpropagate a long distance in a highly conductive medium. The depthof electromagnetic field decay 1/e (~−8.7 dB) is called skin depth andis often used to assess the penetration depth. For a slightly conductingmaterial, such as soil, this approximate depth is (Shen and Kong,1995):
δ≈ 2σ
ffiffiffiεμ
rð2Þ
where ε and μ are the absolute dielectric permittivity and magneticpermeability of the material, respectively. The equation indicates thatelectric conductivity is more influential on penetration depth than
Table 1Texture and humus content of test soils.
Laterite Magnetic sand Humus A Humus B
Clay [% of mineral soil] 31.5 1.3 16.6 17.1Silt [% of mineral soil] 39.4 7.0 48.4 40.7Sand [% of mineral soil] 29.1 91.7 35.0 42.2Humus [% of total soil] 0.8 b0.5 2.7 12.4
370 K. Takahashi et al. / Journal of Applied Geophysics 73 (2011) 368–377
dielectric permittivity and magnetic permeability. The inverse of skindepth is the attenuation constant in nepers per metre:
α =1δN=m½ � ð3Þ
Static electric conductivity at a location and distribution can easilybe obtained in the field by resistivity measurements with electrodesand inverse calculations. The frequency dependence at low frequen-cies can be measured by the spectral induced polarisation (SIP)method in the field or laboratory.
2.3. Dielectric permittivity and water content
The liquid water phase, one of the three soil phases, can besubdivided further into free water and bound water that is restrictedin mobility by absorption to the soil matrix surface. The relativepermittivity (dielectric constant) of air is 1 and for common mineralsin soils and rocks is in the range 4.5 to 10, while water has apermittivity of 78.5 at 25 °C. Thus, the permittivity of water-bearingsoil is strongly influenced by its water content (Robinson et al., 2003).
Dielectric permittivity ε more greatly influences GPR rather thanelectric conductivity (Lampe and Holliger, 2003; Igel, 2008) and isdirectly related to the soil water content, as described by the empiricalrelationship, e.g., Topp's equation (Topp et al., 1980). Dielectricpermittivity defines the propagation velocity of the electromagneticwave as v = 1 =
ffiffiffiffiffiffiffiε μ
p, where μ is the magnetic permeability. The
permeability of soil is often assumed to be equal to that of air, i.e.μ=μ0. The reflection coefficient of radar signals Γ at the interfacebetween two non-conducting and non-magnetic materials can beapproximated as (Daniels, 2004):
Γ =ffiffiffiffiffiε1
p − ffiffiffiffiffiε2
pffiffiffiffiffiε1
p+
ffiffiffiffiffiε2
p ð4Þ
where ε1 and ε2 are the permittivity of the first and second materials,respectively. This expression indicates that the permittivity contrastcontributes to the reflectivity rather than the absolute values ofpermittivity.
Themeasurement of permittivity at a specific location can easily beperformed in the field, e.g., with a time-domain reflectometry (TDR)probe. The spatial distribution can be obtained by repeating TDRmeasurements at various positions.
2.4. Heterogeneity
Soil properties always exhibit spatial variability as demonstratedby, e.g., Butler (2003) and Igel and Preetz (2009) for magneticsusceptibility. The spatial changes can be quantified by statisticalparameters, e.g., correlation length and variability. The formerquantity indicates the spatial length of the change and the latterrepresents the magnitude of changes. These parameters can bedetermined by calculating the semivariogram, which is a geostatisticalanalysis tool. The experimental semivariogram is described by(Deutsch and Journel, 1992):
γ hð Þ = 12N
∑N
i=1z xi + hð Þ−z xið Þ½ �2 ð5Þ
where h is the lag distance, or separation distance between two datapoints, z(xi+h) and z(xi), and N is the number of data pairs with aconstant lag distance h from all data points xi. Typically, thesemivariance γ(h) increases with lag distance h to a certain valueand then becomes constant. The lag distance and semivariance whereγ(h) becomes constant is called the range a and sill C, respectively.These parameters can be determined by fitting a model and are
considered to be indications of the correlation length and variability ofthe data. In this study, an exponential model given as (Deutsch andJournel, 1992)
γ̂ hð Þ = C 1− exp −3h= að Þ½ � ð6Þ
was employed.The soil can be considered to be homogeneous if one or more
following conditions are met:
1) The correlation length is significantly smaller or larger than thetarget dimension
2) The correlation length is significantly smaller or larger than thespatial resolution of the detection technique
3) The variability is relatively small
If none of the above conditions is met, the soil is considered to beheterogeneous and can have additional influence on detectors. Forexample, a metal detector is compensated at one location and has nosoil response at this position. However, the compensation can beinvalid at adjacent locations where the soil has different properties,and consequently the soil causes false alarms. For GPR, the spatialchanges in permittivity generate reflections that can disturb minesignatures and/or create additional responses to the radar. Further-more, the radiation pattern of antennas is deformed (Lampe andHolliger, 2003; Holliger and Maurer, 2004).
The spatial variation for a specific property can be determined byrepeating single point measurements at various locations coupled toanalyses. These measurements can only be performed in the field,because soil samples cannot be brought to the laboratory and retainthe natural spatial pattern of variation.
3. Testing demining sensors
A field test for metal detectors and dual sensors (i.e., GPRcombined with metal detectors) was performed in Germany in 2009(Takahashi and Gülle, 2010a,b). Four types of soil were prepared forthis test called “Laterite”, “Magnetic sand”, “Humus A”, and “HumusB”. These test soils are described as follows:
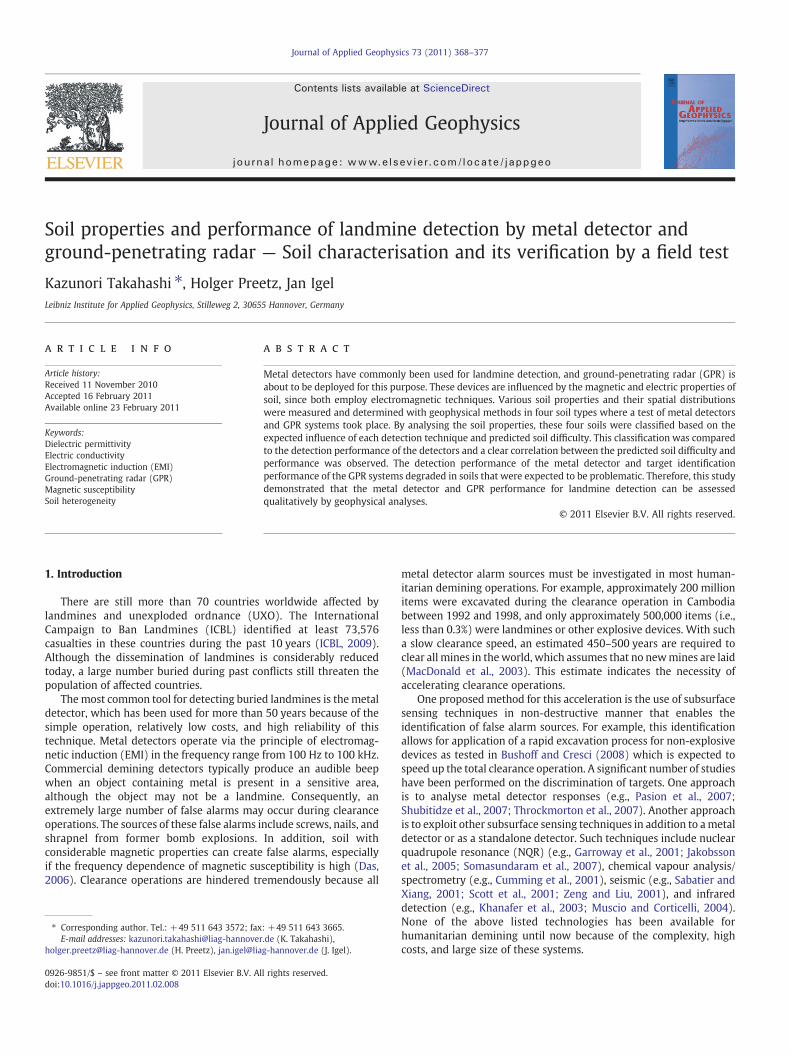
• “Laterite” was an Fe-rich tropical weathering product, a red-coloured clay loam whose parent rock was basalt and with lowstone content (basalt) of approximately 2–5%. Laterites are themostcommon tropical soil formation and this test soil provided the samephysical and chemical features of those in the recent tropics.
• “Magnetic sand” was an artificial mixture of calcareous sand andengineered magnetite to replicate high magnetic susceptibility. Thetexture was coarse sand with a low content of fine gravel (2–5%).
• “Humus A” was a loess-originated topsoil material and the texturewas loam with low fine gravel and humus content.
• “Humus B”was a forest soil from the Bavarian Alps. The texture wasloam with a high stone content (about 30–40%) and high humuscontent.
The texture and humus content of the test soils are summarised inTable 1, and the texture triangle is shown in Fig. 1.
Landmine models were planted randomly in all soil types severalmonths prior to the test. For evaluating the identification capability of
0
0
010
10
10
20
20
20
30
30
30
40
40
40
50
50 50
60
60
60
70
70
70
80
80
80
90
90
90
100100
100
% Silt
% S
and %
Clay
Laterite
Magnetic sand
Humus AHumus B
Fig. 1. Texture triangle of the test soils.
10 100 1000 100000
1000
2000
3000
4000
5000
6000
Laterite
Magnetic sand
Humus A × 10
Humus B × 10
Frequency [Hz]
Mag
netic
sus
cept
ibili
ty [S
I×10
−5 ]
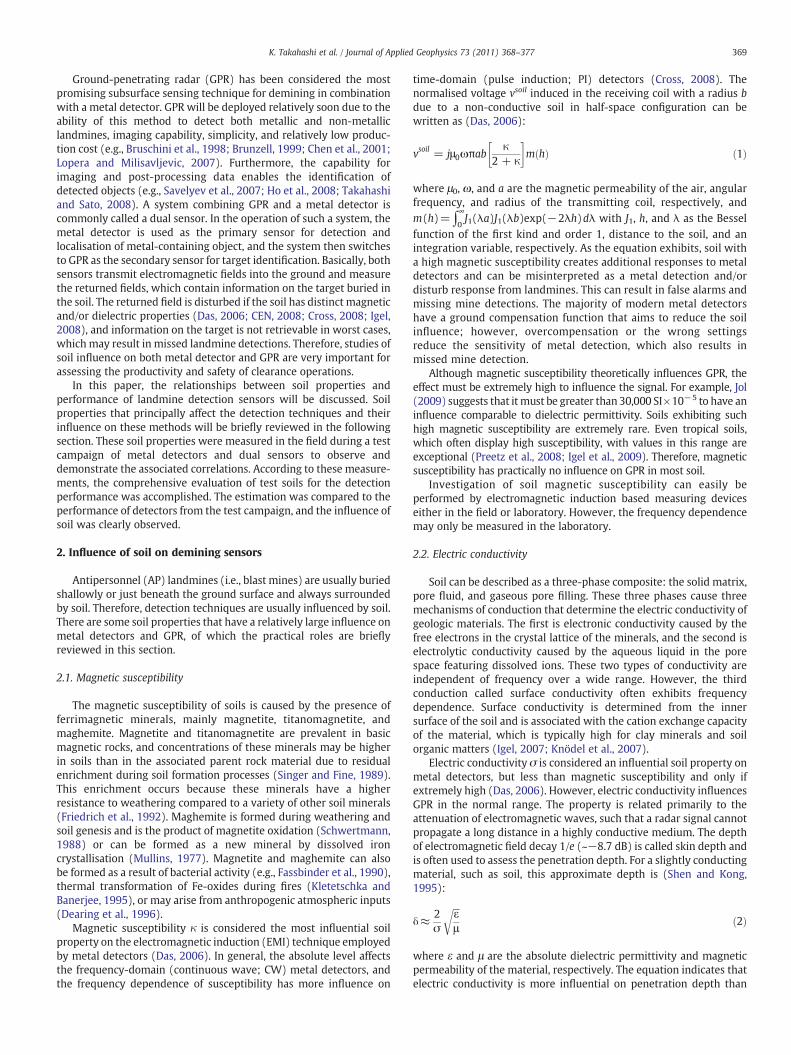
Fig. 2. Frequency dependence of test soil magnetic susceptibility. Note that themagnetic susceptibility of Humus A and B was multiplied by a factor of 10 for visibility.
371K. Takahashi et al. / Journal of Applied Geophysics 73 (2011) 368–377
dual sensors, metal pieces that included bullets and cartridges werealso buried with the landmines. The positions of these objects wereunknown to the operators to create a blind test.
There were five models of commercial metal detectors and onedual sensor in the test. Four out of these five metal detectors weretime-domain (pulse induction; PI) and one was frequency-domain(continuous wave; CW) detector. Operators who were unfamiliarwith the detectors were trained by the manufacturers. The trainingwas conducted on an area comprising the same soil type as the testsoils and with the same test targets. At the end of the training, themanufacturers approved that the operators were trained enough toparticipate in the field test. During the test, the operators of the metaldetectors placed markers at the metal detection locations. The dualsensor operators proceeded similarly, but also tried to identify thedetected objects with GPR. If the operator thought a detected objectwas a landmine, amarker of another colourwas placed in the detectedposition, and the type of the object was compared to the plan forperformance evaluation after test execution.
3.1. Performances of metal detector and dual sensor
The detection performance of metal detectors has been evaluatedcommonly by calculating the probability of detection (POD) and falsealarm rate (FAR) (e.g., Simonson, 1998a,b; Daniels, 2010). The firstmeasure indicates howmany targets (mines and other metal objects)were found for all buried targets, and the other measure indicateshow many false alarms (alarms created by objects that were nottargets, e.g., soil and stone) are reported in a unit area. Thesemeasuresare given as follows:
POD =Number of detected targetsNumber of buried targets
ð7Þ
FAR =Number of false alarms
Area searchedð8Þ
POD and FAR are considered absolute measures and highly subjectto the design of experiment. Two measures were additionallyintroduced to assess the identification performance of GPR as a partof a dual sensor (Takahashi et al., 2009). One is FAR reduction, whichindicates howmany false alarms (caused by objects other than mines,e.g., metal decoys and soil) obtained by the metal detector part of thedevice are identified and rejected correctly by GPR. The other is PODloss, which is a measure for the number of landmines detected by a
metal detector but identified and rejected incorrectly by GPR. Thesemeasures are defined as follows:
FAR reduction = 1− FAR by metal detector and GPRFAR by metal detector
ð9Þ
POD loss = 1− POD by metal detector and GPRPOD by metal detector
ð10Þ
FAR reduction and POD loss are measures relative to the searchresult of the primary sensor (metal detector) and are not directlyinfluenced by the design of experiment, although the associatedestimation accuracies (uncertainty) are affected. FAR reduction isexpected to be high for the sake of efficiency improvements ofclearance operations, and POD loss must be as low as possible forsafety in humanitarian demining. Notably, the definition of falsealarms for metal detectors and GPR are different. The sources of falsealarms for metal detector are soil and stones, but those for GPR areeverything other than mines.
4. Soil investigations
Measurements of various soil properties were performed at thesame site and time as the detector test. All laboratory measurementswere conducted for all four types of soil; however, field measure-ments for Humus A could not always be obtained. The results of thesemeasurements and interpretations are summarised as follows.
Notably, the textures of the test soils were apparently verydifferent. Humus B had higher stone and humus content than HumusA, but these soils had higher stone content than Laterite and Magneticsand. Thus, these soils seemed very heterogeneous, particularlyHumus B. In contrast, Magnetic sand appeared to have a uniformgrain size distribution and be highly homogeneous.
4.1. Magnetic susceptibility
The frequency dependence of magnetic susceptibility was mea-sured using a susceptibility bridge (Magnon VFSM) in a frequencyrange from 35 Hz to 10 kHz on representative samples at thelaboratory, as shown in Fig. 2. Laterite and Magnetic sand had veryhigh absolute levels of magnetic susceptibility; however, only Lateriteexhibited significant frequency dependence of 6% per decade.Absolute levels of magnetic susceptibility for both Humus A and Bweremuch lower, but only Humus A demonstrated a remarkably highfrequency dependence of 7%. There are classification systems for soilin metal detector demining based on the absolute level of magneticsusceptibility (CEN, 2003, 2008) and the frequency dependence of
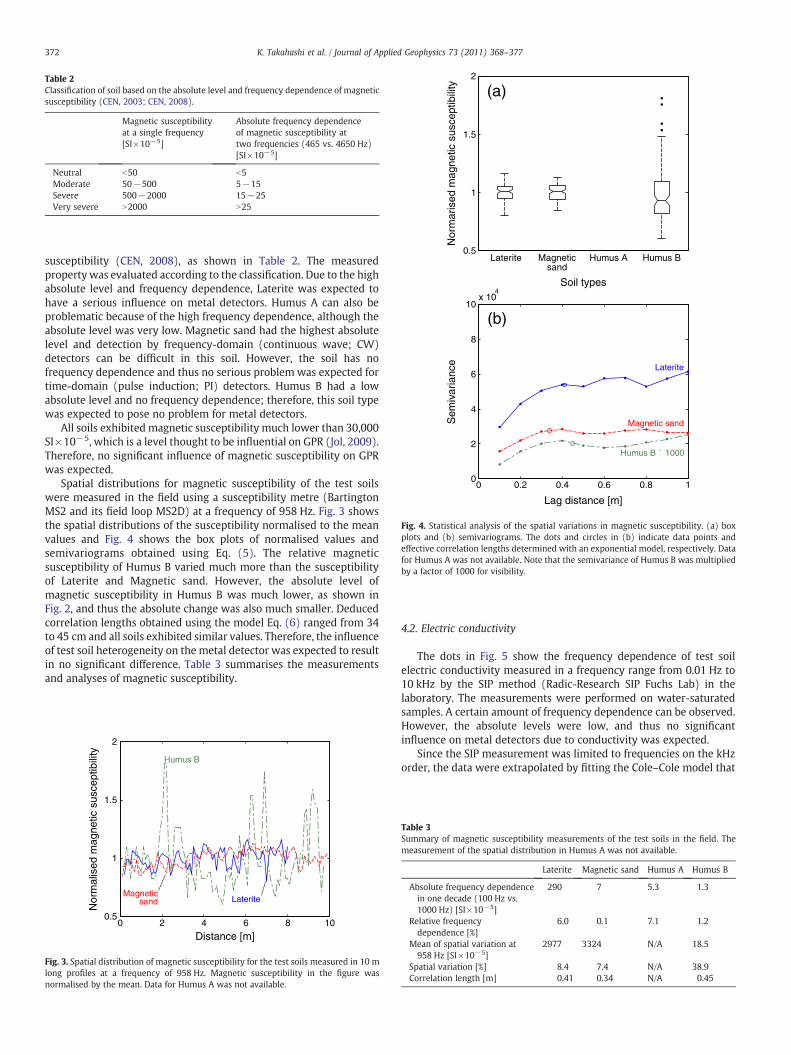
Table 2Classification of soil based on the absolute level and frequency dependence of magneticsusceptibility (CEN, 2003; CEN, 2008).
Magnetic susceptibilityat a single frequency[SI×10−5]
Absolute frequency dependenceof magnetic susceptibility attwo frequencies (465 vs. 4650 Hz)[SI×10−5]
Neutral b50 b5Moderate 50−500 5−15Severe 500−2000 15−25Very severe N2000 N25
0.5
1
1.5
2
Laterite Magneticsand
Humus A Humus B
Soil types
Nor
mar
ised
mag
netic
sus
cept
ibili
ty (a)
0 0.2 0.4 0.6 0.8 10
2
4
6
8
10x 10
4
Laterite
Magnetic sand
Humus B ´ 1000
Lag distance [m]
Sem
ivar
ianc
e
(b)
Fig. 4. Statistical analysis of the spatial variations in magnetic susceptibility. (a) boxplots and (b) semivariograms. The dots and circles in (b) indicate data points andeffective correlation lengths determined with an exponential model, respectively. Datafor Humus A was not available. Note that the semivariance of Humus B was multipliedby a factor of 1000 for visibility.
372 K. Takahashi et al. / Journal of Applied Geophysics 73 (2011) 368–377
susceptibility (CEN, 2008), as shown in Table 2. The measuredproperty was evaluated according to the classification. Due to the highabsolute level and frequency dependence, Laterite was expected tohave a serious influence on metal detectors. Humus A can also beproblematic because of the high frequency dependence, although theabsolute level was very low. Magnetic sand had the highest absolutelevel and detection by frequency-domain (continuous wave; CW)detectors can be difficult in this soil. However, the soil has nofrequency dependence and thus no serious problem was expected fortime-domain (pulse induction; PI) detectors. Humus B had a lowabsolute level and no frequency dependence; therefore, this soil typewas expected to pose no problem for metal detectors.
All soils exhibited magnetic susceptibility much lower than 30,000SI×10−5, which is a level thought to be influential on GPR (Jol, 2009).Therefore, no significant influence of magnetic susceptibility on GPRwas expected.
Spatial distributions for magnetic susceptibility of the test soilswere measured in the field using a susceptibility metre (BartingtonMS2 and its field loop MS2D) at a frequency of 958 Hz. Fig. 3 showsthe spatial distributions of the susceptibility normalised to the meanvalues and Fig. 4 shows the box plots of normalised values andsemivariograms obtained using Eq. (5). The relative magneticsusceptibility of Humus B varied much more than the susceptibilityof Laterite and Magnetic sand. However, the absolute level ofmagnetic susceptibility in Humus B was much lower, as shown inFig. 2, and thus the absolute change was also much smaller. Deducedcorrelation lengths obtained using the model Eq. (6) ranged from 34to 45 cm and all soils exhibited similar values. Therefore, the influenceof test soil heterogeneity on the metal detector was expected to resultin no significant difference. Table 3 summarises the measurementsand analyses of magnetic susceptibility.
0 2 4 6 8 100.5
1
1.5
2
LateriteMagnetic
sand
Humus B
Distance [m]
Nor
mal
ised
mag
netic
sus
cept
ibili
ty
Fig. 3. Spatial distribution of magnetic susceptibility for the test soils measured in 10 mlong profiles at a frequency of 958 Hz. Magnetic susceptibility in the figure wasnormalised by the mean. Data for Humus A was not available.
4.2. Electric conductivity
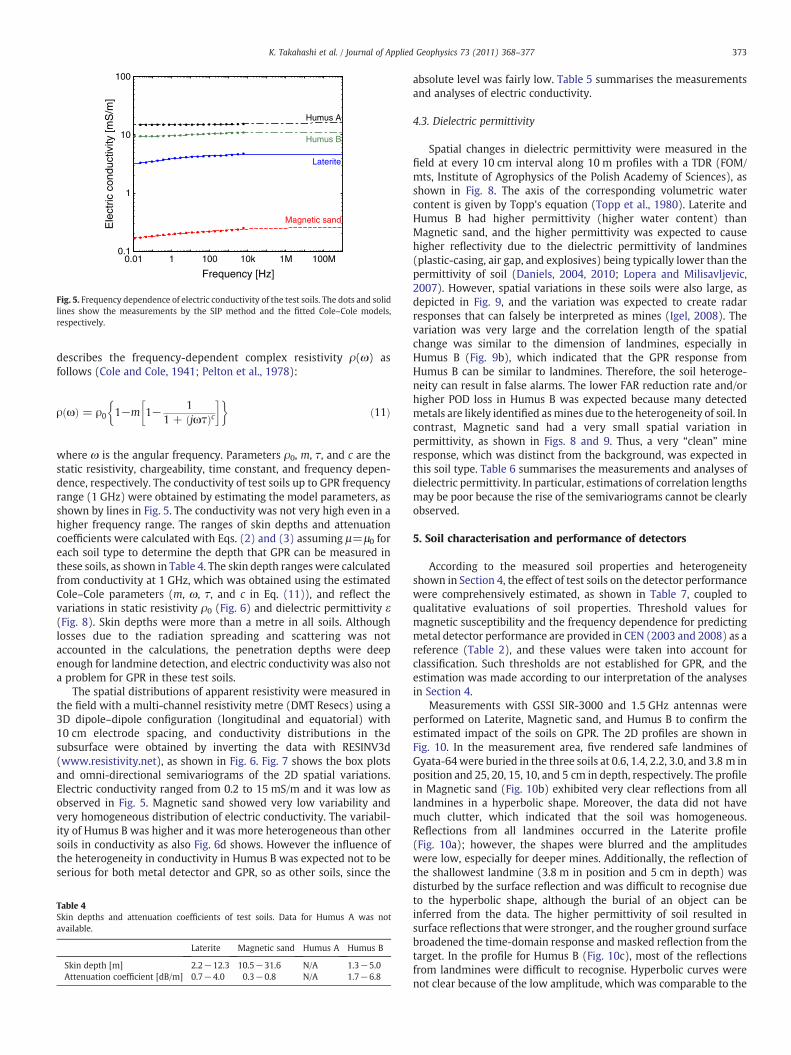
The dots in Fig. 5 show the frequency dependence of test soilelectric conductivity measured in a frequency range from 0.01 Hz to10 kHz by the SIP method (Radic-Research SIP Fuchs Lab) in thelaboratory. The measurements were performed on water-saturatedsamples. A certain amount of frequency dependence can be observed.However, the absolute levels were low, and thus no significantinfluence on metal detectors due to conductivity was expected.
Since the SIP measurement was limited to frequencies on the kHzorder, the data were extrapolated by fitting the Cole–Cole model that
Table 3Summary of magnetic susceptibility measurements of the test soils in the field. Themeasurement of the spatial distribution in Humus A was not available.
Laterite Magnetic sand Humus A Humus B
Absolute frequency dependencein one decade (100 Hz vs.1000 Hz) [SI×10−5]
290 7 5.3 1.3
Relative frequencydependence [%]
6.0 0.1 7.1 1.2
Mean of spatial variation at958 Hz [SI×10−5]
2977 3324 N/A 18.5
Spatial variation [%] 8.4 7.4 N/A 38.9Correlation length [m] 0.41 0.34 N/A 0.45
0.01 1 100 10k 1M 100M0.1
1
10
100
Frequency [Hz]
Ele
ctric
con
duct
ivity
[mS
/m]
Laterite
Magnetic sand
Humus A
Humus B
Fig. 5. Frequency dependence of electric conductivity of the test soils. The dots and solidlines show the measurements by the SIP method and the fitted Cole–Cole models,respectively.
373K. Takahashi et al. / Journal of Applied Geophysics 73 (2011) 368–377
describes the frequency-dependent complex resistivity ρ(ω) asfollows (Cole and Cole, 1941; Pelton et al., 1978):
ρ ωð Þ = ρ0 1−m 1− 11 + jωτð Þc
� �� �ð11Þ
where ω is the angular frequency. Parameters ρ0, m, τ, and c are thestatic resistivity, chargeability, time constant, and frequency depen-dence, respectively. The conductivity of test soils up to GPR frequencyrange (1 GHz) were obtained by estimating the model parameters, asshown by lines in Fig. 5. The conductivity was not very high even in ahigher frequency range. The ranges of skin depths and attenuationcoefficients were calculated with Eqs. (2) and (3) assuming μ=μ0 foreach soil type to determine the depth that GPR can be measured inthese soils, as shown in Table 4. The skin depth ranges were calculatedfrom conductivity at 1 GHz, which was obtained using the estimatedCole–Cole parameters (m, ω, τ, and c in Eq. (11)), and reflect thevariations in static resistivity ρ0 (Fig. 6) and dielectric permittivity ε(Fig. 8). Skin depths were more than a metre in all soils. Althoughlosses due to the radiation spreading and scattering was notaccounted in the calculations, the penetration depths were deepenough for landmine detection, and electric conductivity was also nota problem for GPR in these test soils.
The spatial distributions of apparent resistivity were measured inthe field with a multi-channel resistivity metre (DMT Resecs) using a3D dipole–dipole configuration (longitudinal and equatorial) with10 cm electrode spacing, and conductivity distributions in thesubsurface were obtained by inverting the data with RESINV3d(www.resistivity.net), as shown in Fig. 6. Fig. 7 shows the box plotsand omni-directional semivariograms of the 2D spatial variations.Electric conductivity ranged from 0.2 to 15 mS/m and it was low asobserved in Fig. 5. Magnetic sand showed very low variability andvery homogeneous distribution of electric conductivity. The variabil-ity of Humus B was higher and it was more heterogeneous than othersoils in conductivity as also Fig. 6d shows. However the influence ofthe heterogeneity in conductivity in Humus B was expected not to beserious for both metal detector and GPR, so as other soils, since the
Table 4Skin depths and attenuation coefficients of test soils. Data for Humus A was notavailable.
Laterite Magnetic sand Humus A Humus B
Skin depth [m] 2.2−12.3 10.5−31.6 N/A 1.3−5.0Attenuation coefficient [dB/m] 0.7−4.0 0.3−0.8 N/A 1.7−6.8
absolute level was fairly low. Table 5 summarises the measurementsand analyses of electric conductivity.
4.3. Dielectric permittivity
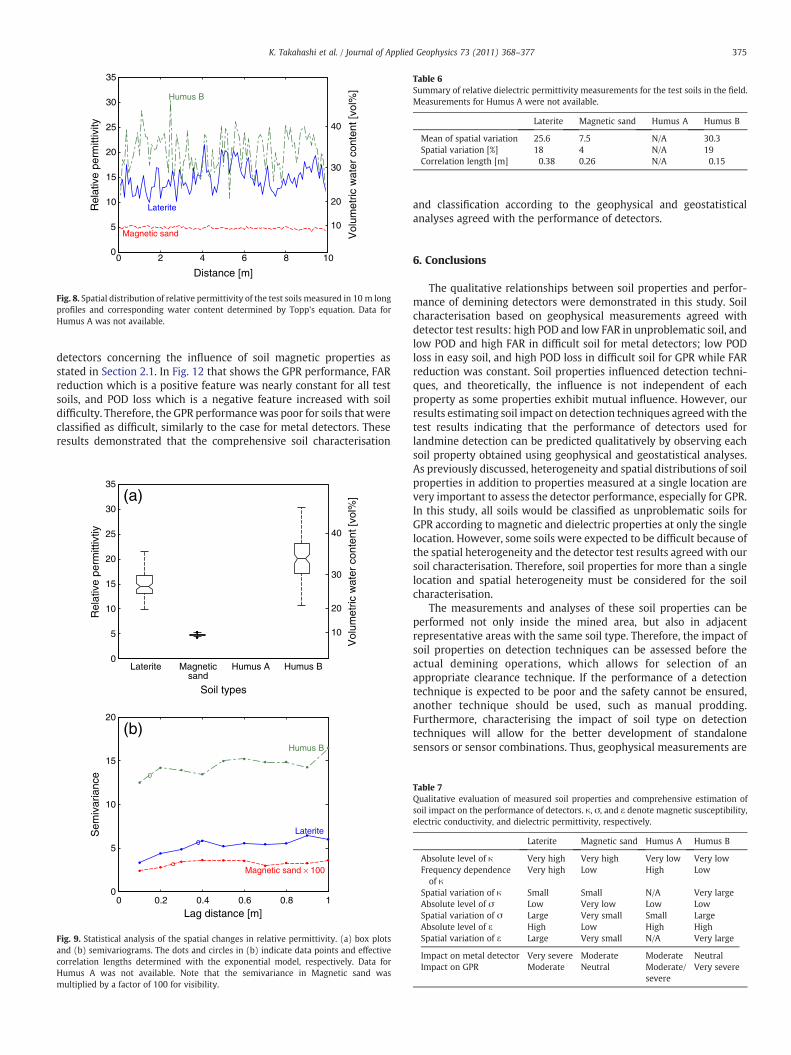
Spatial changes in dielectric permittivity were measured in thefield at every 10 cm interval along 10 m profiles with a TDR (FOM/mts, Institute of Agrophysics of the Polish Academy of Sciences), asshown in Fig. 8. The axis of the corresponding volumetric watercontent is given by Topp's equation (Topp et al., 1980). Laterite andHumus B had higher permittivity (higher water content) thanMagnetic sand, and the higher permittivity was expected to causehigher reflectivity due to the dielectric permittivity of landmines(plastic-casing, air gap, and explosives) being typically lower than thepermittivity of soil (Daniels, 2004, 2010; Lopera and Milisavljevic,2007). However, spatial variations in these soils were also large, asdepicted in Fig. 9, and the variation was expected to create radarresponses that can falsely be interpreted as mines (Igel, 2008). Thevariation was very large and the correlation length of the spatialchange was similar to the dimension of landmines, especially inHumus B (Fig. 9b), which indicated that the GPR response fromHumus B can be similar to landmines. Therefore, the soil heteroge-neity can result in false alarms. The lower FAR reduction rate and/orhigher POD loss in Humus B was expected because many detectedmetals are likely identified asmines due to the heterogeneity of soil. Incontrast, Magnetic sand had a very small spatial variation inpermittivity, as shown in Figs. 8 and 9. Thus, a very “clean” mineresponse, which was distinct from the background, was expected inthis soil type. Table 6 summarises the measurements and analyses ofdielectric permittivity. In particular, estimations of correlation lengthsmay be poor because the rise of the semivariograms cannot be clearlyobserved.
5. Soil characterisation and performance of detectors
According to the measured soil properties and heterogeneityshown in Section 4, the effect of test soils on the detector performancewere comprehensively estimated, as shown in Table 7, coupled toqualitative evaluations of soil properties. Threshold values formagnetic susceptibility and the frequency dependence for predictingmetal detector performance are provided in CEN (2003 and 2008) as areference (Table 2), and these values were taken into account forclassification. Such thresholds are not established for GPR, and theestimation was made according to our interpretation of the analysesin Section 4.
Measurements with GSSI SIR-3000 and 1.5 GHz antennas wereperformed on Laterite, Magnetic sand, and Humus B to confirm theestimated impact of the soils on GPR. The 2D profiles are shown inFig. 10. In the measurement area, five rendered safe landmines ofGyata-64were buried in the three soils at 0.6, 1.4, 2.2, 3.0, and 3.8 m inposition and 25, 20, 15, 10, and 5 cm in depth, respectively. The profilein Magnetic sand (Fig. 10b) exhibited very clear reflections from alllandmines in a hyperbolic shape. Moreover, the data did not havemuch clutter, which indicated that the soil was homogeneous.Reflections from all landmines occurred in the Laterite profile(Fig. 10a); however, the shapes were blurred and the amplitudeswere low, especially for deeper mines. Additionally, the reflection ofthe shallowest landmine (3.8 m in position and 5 cm in depth) wasdisturbed by the surface reflection and was difficult to recognise dueto the hyperbolic shape, although the burial of an object can beinferred from the data. The higher permittivity of soil resulted insurface reflections that were stronger, and the rougher ground surfacebroadened the time-domain response and masked reflection from thetarget. In the profile for Humus B (Fig. 10c), most of the reflectionsfrom landmines were difficult to recognise. Hyperbolic curves werenot clear because of the low amplitude, which was comparable to the
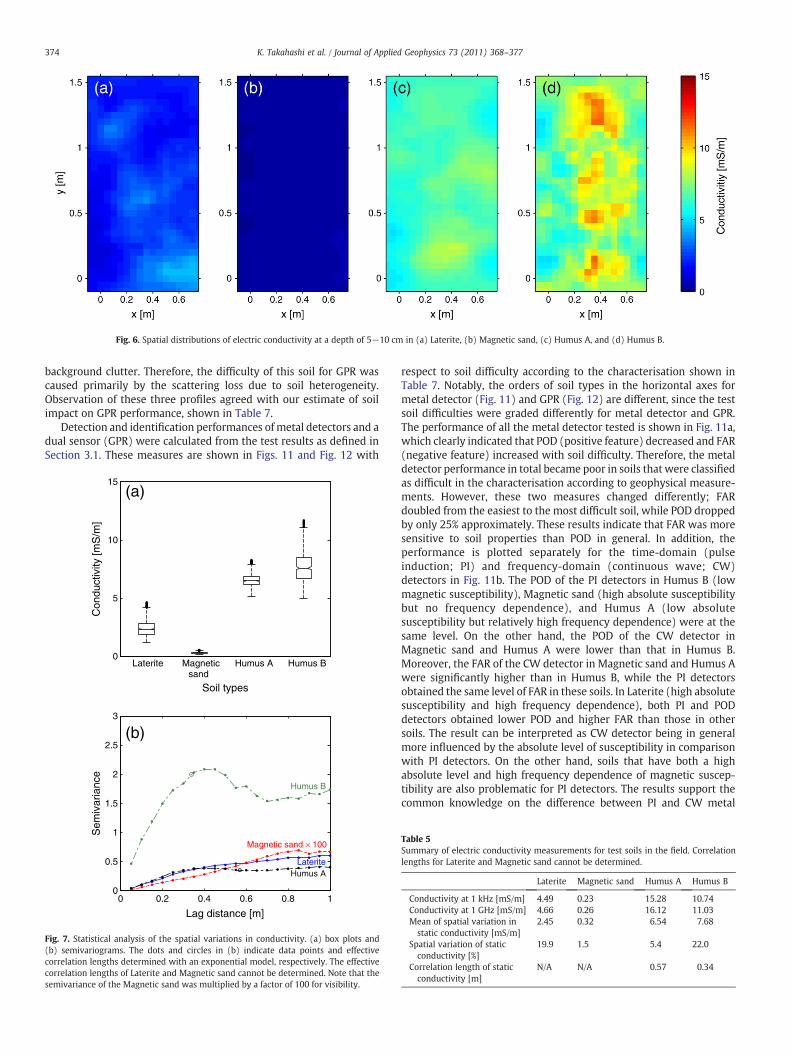
Fig. 6. Spatial distributions of electric conductivity at a depth of 5−10 cm in (a) Laterite, (b) Magnetic sand, (c) Humus A, and (d) Humus B.
374 K. Takahashi et al. / Journal of Applied Geophysics 73 (2011) 368–377
background clutter. Therefore, the difficulty of this soil for GPR wascaused primarily by the scattering loss due to soil heterogeneity.Observation of these three profiles agreed with our estimate of soilimpact on GPR performance, shown in Table 7.
Detection and identification performances of metal detectors and adual sensor (GPR) were calculated from the test results as defined inSection 3.1. These measures are shown in Figs. 11 and Fig. 12 with
0
5
10
15
Laterite Magneticsand
Humus A Humus B
Soil types
Con
duct
ivity
[mS
/m]
(a)
(b)
0 0.2 0.4 0.6 0.8 10
0.5
1
1.5
2
2.5
3
Laterite
Magnetic sand × 100
Humus A
Humus B
Lag distance [m]
Sem
ivar
ianc
e
Fig. 7. Statistical analysis of the spatial variations in conductivity. (a) box plots and(b) semivariograms. The dots and circles in (b) indicate data points and effectivecorrelation lengths determined with an exponential model, respectively. The effectivecorrelation lengths of Laterite and Magnetic sand cannot be determined. Note that thesemivariance of the Magnetic sand was multiplied by a factor of 100 for visibility.
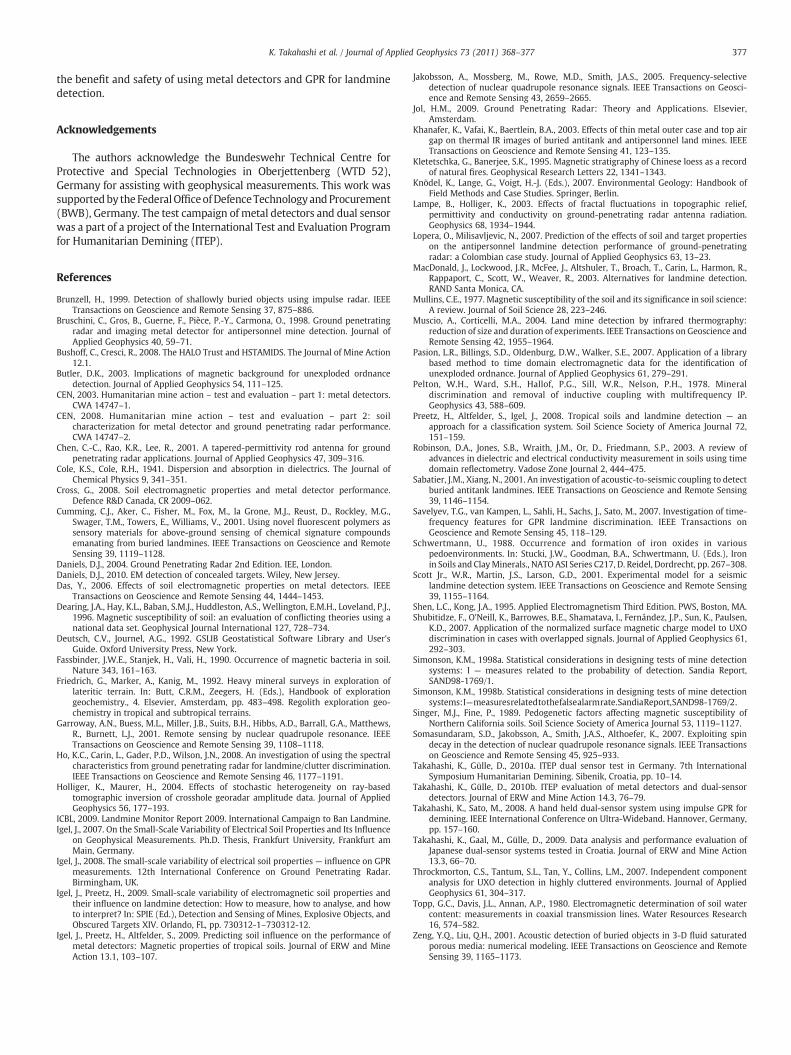
respect to soil difficulty according to the characterisation shown inTable 7. Notably, the orders of soil types in the horizontal axes formetal detector (Fig. 11) and GPR (Fig. 12) are different, since the testsoil difficulties were graded differently for metal detector and GPR.The performance of all the metal detector tested is shown in Fig. 11a,which clearly indicated that POD (positive feature) decreased and FAR(negative feature) increased with soil difficulty. Therefore, the metaldetector performance in total became poor in soils that were classifiedas difficult in the characterisation according to geophysical measure-ments. However, these two measures changed differently; FARdoubled from the easiest to the most difficult soil, while POD droppedby only 25% approximately. These results indicate that FAR was moresensitive to soil properties than POD in general. In addition, theperformance is plotted separately for the time-domain (pulseinduction; PI) and frequency-domain (continuous wave; CW)detectors in Fig. 11b. The POD of the PI detectors in Humus B (lowmagnetic susceptibility), Magnetic sand (high absolute susceptibilitybut no frequency dependence), and Humus A (low absolutesusceptibility but relatively high frequency dependence) were at thesame level. On the other hand, the POD of the CW detector inMagnetic sand and Humus A were lower than that in Humus B.Moreover, the FAR of the CW detector in Magnetic sand and Humus Awere significantly higher than in Humus B, while the PI detectorsobtained the same level of FAR in these soils. In Laterite (high absolutesusceptibility and high frequency dependence), both PI and PODdetectors obtained lower POD and higher FAR than those in othersoils. The result can be interpreted as CW detector being in generalmore influenced by the absolute level of susceptibility in comparisonwith PI detectors. On the other hand, soils that have both a highabsolute level and high frequency dependence of magnetic suscep-tibility are also problematic for PI detectors. The results support thecommon knowledge on the difference between PI and CW metal
Table 5Summary of electric conductivity measurements for test soils in the field. Correlationlengths for Laterite and Magnetic sand cannot be determined.
Laterite Magnetic sand Humus A Humus B
Conductivity at 1 kHz [mS/m] 4.49 0.23 15.28 10.74Conductivity at 1 GHz [mS/m] 4.66 0.26 16.12 11.03Mean of spatial variation instatic conductivity [mS/m]
2.45 0.32 6.54 7.68
Spatial variation of staticconductivity [%]
19.9 1.5 5.4 22.0
Correlation length of staticconductivity [m]
N/A N/A 0.57 0.34
0 2 4 6 8 100
5
10
15
20
25
30
35
Distance [m]
Rel
ativ
e pe
rmitt
ivity
Laterite
Magnetic sand
Humus B
10
20
30
40
Vol
umet
ric w
ater
con
tent
[vol
%]
Fig. 8. Spatial distribution of relative permittivity of the test soils measured in 10 m longprofiles and corresponding water content determined by Topp's equation. Data forHumus A was not available.
Table 6Summary of relative dielectric permittivity measurements for the test soils in the field.Measurements for Humus A were not available.
Laterite Magnetic sand Humus A Humus B
Mean of spatial variation 25.6 7.5 N/A 30.3Spatial variation [%] 18 4 N/A 19Correlation length [m] 0.38 0.26 N/A 0.15
375K. Takahashi et al. / Journal of Applied Geophysics 73 (2011) 368–377
detectors concerning the influence of soil magnetic properties asstated in Section 2.1. In Fig. 12 that shows the GPR performance, FARreduction which is a positive feature was nearly constant for all testsoils, and POD loss which is a negative feature increased with soildifficulty. Therefore, the GPR performancewas poor for soils that wereclassified as difficult, similarly to the case for metal detectors. Theseresults demonstrated that the comprehensive soil characterisation
0
5
10
15
20
25
30
35
Laterite Magneticsand
Humus A Humus B
Soil types
Rel
ativ
e pe
rmitt
ivtiy
10
20
30
40
Vol
umet
ric w
ater
con
tent
[vol
%](a)
0 0.2 0.4 0.6 0.8 10
5
10
15
20
Laterite
Magnetic sand × 100
Humus B
Lag distance [m]
Sem
ivar
ianc
e
(b)
Fig. 9. Statistical analysis of the spatial changes in relative permittivity. (a) box plotsand (b) semivariograms. The dots and circles in (b) indicate data points and effectivecorrelation lengths determined with the exponential model, respectively. Data forHumus A was not available. Note that the semivariance in Magnetic sand wasmultiplied by a factor of 100 for visibility.
and classification according to the geophysical and geostatisticalanalyses agreed with the performance of detectors.
6. Conclusions
The qualitative relationships between soil properties and perfor-mance of demining detectors were demonstrated in this study. Soilcharacterisation based on geophysical measurements agreed withdetector test results: high POD and low FAR in unproblematic soil, andlow POD and high FAR in difficult soil for metal detectors; low PODloss in easy soil, and high POD loss in difficult soil for GPR while FARreduction was constant. Soil properties influenced detection techni-ques, and theoretically, the influence is not independent of eachproperty as some properties exhibit mutual influence. However, ourresults estimating soil impact on detection techniques agreedwith thetest results indicating that the performance of detectors used forlandmine detection can be predicted qualitatively by observing eachsoil property obtained using geophysical and geostatistical analyses.As previously discussed, heterogeneity and spatial distributions of soilproperties in addition to properties measured at a single location arevery important to assess the detector performance, especially for GPR.In this study, all soils would be classified as unproblematic soils forGPR according to magnetic and dielectric properties at only the singlelocation. However, some soils were expected to be difficult because ofthe spatial heterogeneity and the detector test results agreed with oursoil characterisation. Therefore, soil properties for more than a singlelocation and spatial heterogeneity must be considered for the soilcharacterisation.
The measurements and analyses of these soil properties can beperformed not only inside the mined area, but also in adjacentrepresentative areas with the same soil type. Therefore, the impact ofsoil properties on detection techniques can be assessed before theactual demining operations, which allows for selection of anappropriate clearance technique. If the performance of a detectiontechnique is expected to be poor and the safety cannot be ensured,another technique should be used, such as manual prodding.Furthermore, characterising the impact of soil type on detectiontechniques will allow for the better development of standalonesensors or sensor combinations. Thus, geophysical measurements are
Table 7Qualitative evaluation of measured soil properties and comprehensive estimation ofsoil impact on the performance of detectors. κ, σ, and ε denote magnetic susceptibility,electric conductivity, and dielectric permittivity, respectively.
Laterite Magnetic sand Humus A Humus B
Absolute level of κ Very high Very high Very low Very lowFrequency dependenceof κ
Very high Low High Low
Spatial variation of κ Small Small N/A Very largeAbsolute level of σ Low Very low Low LowSpatial variation of σ Large Very small Small LargeAbsolute level of ε High Low High HighSpatial variation of ε Large Very small N/A Very large
Impact on metal detector Very severe Moderate Moderate NeutralImpact on GPR Moderate Neutral Moderate/
severeVery severe
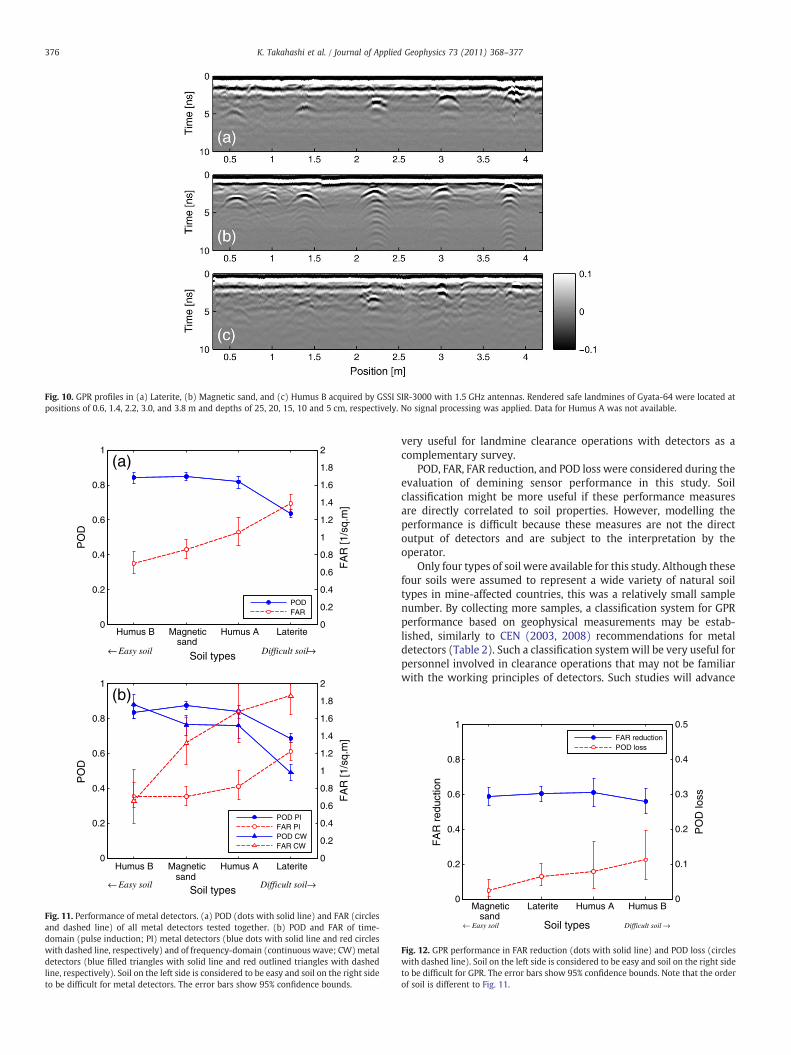
Fig. 10. GPR profiles in (a) Laterite, (b) Magnetic sand, and (c) Humus B acquired by GSSI SIR-3000 with 1.5 GHz antennas. Rendered safe landmines of Gyata-64 were located atpositions of 0.6, 1.4, 2.2, 3.0, and 3.8 m and depths of 25, 20, 15, 10 and 5 cm, respectively. No signal processing was applied. Data for Humus A was not available.
Humus B Magnetic Humus A Laterite
Humus B Magnetic Humus A Laterite
0
0.2
0.4
0.6
0.8
1
sand
Soil types
PO
D
0
0.2
0.4
0.6
0.8
1
1.2
1.4
1.6
1.8
2
FA
R [1
/sq.
m]
(a)
← Easy soil Difficult soil→
PODFAR
0
0.2
0.4
0.6
0.8
1
sand
Soil types
PO
D
0
0.2
0.4
0.6
0.8
1
1.2
1.4
1.6
1.8
2
FA
R [1
/sq.
m]
(b)
← Easy soil Difficult soil→
POD PIFAR PIPOD CWFAR CW
Fig. 11. Performance of metal detectors. (a) POD (dots with solid line) and FAR (circlesand dashed line) of all metal detectors tested together. (b) POD and FAR of time-domain (pulse induction; PI) metal detectors (blue dots with solid line and red circleswith dashed line, respectively) and of frequency-domain (continuous wave; CW)metaldetectors (blue filled triangles with solid line and red outlined triangles with dashedline, respectively). Soil on the left side is considered to be easy and soil on the right sideto be difficult for metal detectors. The error bars show 95% confidence bounds.
376 K. Takahashi et al. / Journal of Applied Geophysics 73 (2011) 368–377
very useful for landmine clearance operations with detectors as acomplementary survey.
POD, FAR, FAR reduction, and POD loss were considered during theevaluation of demining sensor performance in this study. Soilclassification might be more useful if these performance measuresare directly correlated to soil properties. However, modelling theperformance is difficult because these measures are not the directoutput of detectors and are subject to the interpretation by theoperator.
Only four types of soil were available for this study. Although thesefour soils were assumed to represent a wide variety of natural soiltypes in mine-affected countries, this was a relatively small samplenumber. By collecting more samples, a classification system for GPRperformance based on geophysical measurements may be estab-lished, similarly to CEN (2003, 2008) recommendations for metaldetectors (Table 2). Such a classification systemwill be very useful forpersonnel involved in clearance operations that may not be familiarwith the working principles of detectors. Such studies will advance
Magnetic Laterite Humus A Humus B0
0.2
0.4
0.6
0.8
1
sandSoil types
FA
R r
educ
tion
0
0.1
0.2
0.3
0.4
0.5
PO
D lo
ss
← Easy soil Difficult soil →
FAR reductionPOD loss
Fig. 12. GPR performance in FAR reduction (dots with solid line) and POD loss (circleswith dashed line). Soil on the left side is considered to be easy and soil on the right sideto be difficult for GPR. The error bars show 95% confidence bounds. Note that the orderof soil is different to Fig. 11.
377K. Takahashi et al. / Journal of Applied Geophysics 73 (2011) 368–377
the benefit and safety of using metal detectors and GPR for landminedetection.
Acknowledgements
The authors acknowledge the Bundeswehr Technical Centre forProtective and Special Technologies in Oberjettenberg (WTD 52),Germany for assisting with geophysical measurements. This work wassupportedby the FederalOfficeofDefenceTechnologyandProcurement(BWB), Germany. The test campaign of metal detectors and dual sensorwas a part of a project of the International Test and Evaluation Programfor Humanitarian Demining (ITEP).
References
Brunzell, H., 1999. Detection of shallowly buried objects using impulse radar. IEEETransactions on Geoscience and Remote Sensing 37, 875–886.
Bruschini, C., Gros, B., Guerne, F., Pièce, P.-Y., Carmona, O., 1998. Ground penetratingradar and imaging metal detector for antipersonnel mine detection. Journal ofApplied Geophysics 40, 59–71.
Bushoff, C., Cresci, R., 2008. The HALO Trust and HSTAMIDS. The Journal of Mine Action12.1.
Butler, D.K., 2003. Implications of magnetic background for unexploded ordnancedetection. Journal of Applied Geophysics 54, 111–125.
CEN, 2003. Humanitarian mine action – test and evaluation – part 1: metal detectors.CWA 14747–1.
CEN, 2008. Humanitarian mine action – test and evaluation – part 2: soilcharacterization for metal detector and ground penetrating radar performance.CWA 14747–2.
Chen, C.-C., Rao, K.R., Lee, R., 2001. A tapered-permittivity rod antenna for groundpenetrating radar applications. Journal of Applied Geophysics 47, 309–316.
Cole, K.S., Cole, R.H., 1941. Dispersion and absorption in dielectrics. The Journal ofChemical Physics 9, 341–351.
Cross, G., 2008. Soil electromagnetic properties and metal detector performance.Defence R&D Canada, CR 2009–062.
Cumming, C.J., Aker, C., Fisher, M., Fox, M., la Grone, M.J., Reust, D., Rockley, M.G.,Swager, T.M., Towers, E., Williams, V., 2001. Using novel fluorescent polymers assensory materials for above-ground sensing of chemical signature compoundsemanating from buried landmines. IEEE Transactions on Geoscience and RemoteSensing 39, 1119–1128.
Daniels, D.J., 2004. Ground Penetrating Radar 2nd Edition. IEE, London.Daniels, D.J., 2010. EM detection of concealed targets. Wiley, New Jersey.Das, Y., 2006. Effects of soil electromagnetic properties on metal detectors. IEEE
Transactions on Geoscience and Remote Sensing 44, 1444–1453.Dearing, J.A., Hay, K.L., Baban, S.M.J., Huddleston, A.S., Wellington, E.M.H., Loveland, P.J.,
1996. Magnetic susceptibility of soil: an evaluation of conflicting theories using anational data set. Geophysical Journal International 127, 728–734.
Deutsch, C.V., Journel, A.G., 1992. GSLIB Geostatistical Software Library and User'sGuide. Oxford University Press, New York.
Fassbinder, J.W.E., Stanjek, H., Vali, H., 1990. Occurrence of magnetic bacteria in soil.Nature 343, 161–163.
Friedrich, G., Marker, A., Kanig, M., 1992. Heavy mineral surveys in exploration oflateritic terrain. In: Butt, C.R.M., Zeegers, H. (Eds.), Handbook of explorationgeochemistry., 4. Elsevier, Amsterdam, pp. 483–498. Regolith exploration geo-chemistry in tropical and subtropical terrains.
Garroway, A.N., Buess, M.L., Miller, J.B., Suits, B.H., Hibbs, A.D., Barrall, G.A., Matthews,R., Burnett, L.J., 2001. Remote sensing by nuclear quadrupole resonance. IEEETransactions on Geoscience and Remote Sensing 39, 1108–1118.
Ho, K.C., Carin, L., Gader, P.D., Wilson, J.N., 2008. An investigation of using the spectralcharacteristics from ground penetrating radar for landmine/clutter discrimination.IEEE Transactions on Geoscience and Remote Sensing 46, 1177–1191.
Holliger, K., Maurer, H., 2004. Effects of stochastic heterogeneity on ray-basedtomographic inversion of crosshole georadar amplitude data. Journal of AppliedGeophysics 56, 177–193.
ICBL, 2009. Landmine Monitor Report 2009. International Campaign to Ban Landmine.Igel, J., 2007. On the Small-Scale Variability of Electrical Soil Properties and Its Influence
on Geophysical Measurements. Ph.D. Thesis, Frankfurt University, Frankfurt amMain, Germany.
Igel, J., 2008. The small-scale variability of electrical soil properties — influence on GPRmeasurements. 12th International Conference on Ground Penetrating Radar.Birmingham, UK.
Igel, J., Preetz, H., 2009. Small-scale variability of electromagnetic soil properties andtheir influence on landmine detection: How to measure, how to analyse, and howto interpret? In: SPIE (Ed.), Detection and Sensing of Mines, Explosive Objects, andObscured Targets XIV. Orlando, FL, pp. 730312-1–730312-12.
Igel, J., Preetz, H., Altfelder, S., 2009. Predicting soil influence on the performance ofmetal detectors: Magnetic properties of tropical soils. Journal of ERW and MineAction 13.1, 103–107.
Jakobsson, A., Mossberg, M., Rowe, M.D., Smith, J.A.S., 2005. Frequency-selectivedetection of nuclear quadrupole resonance signals. IEEE Transactions on Geosci-ence and Remote Sensing 43, 2659–2665.
Jol, H.M., 2009. Ground Penetrating Radar: Theory and Applications. Elsevier,Amsterdam.
Khanafer, K., Vafai, K., Baertlein, B.A., 2003. Effects of thin metal outer case and top airgap on thermal IR images of buried antitank and antipersonnel land mines. IEEETransactions on Geoscience and Remote Sensing 41, 123–135.
Kletetschka, G., Banerjee, S.K., 1995. Magnetic stratigraphy of Chinese loess as a recordof natural fires. Geophysical Research Letters 22, 1341–1343.
Knödel, K., Lange, G., Voigt, H.-J. (Eds.), 2007. Environmental Geology: Handbook ofField Methods and Case Studies. Springer, Berlin.
Lampe, B., Holliger, K., 2003. Effects of fractal fluctuations in topographic relief,permittivity and conductivity on ground-penetrating radar antenna radiation.Geophysics 68, 1934–1944.
Lopera, O., Milisavljevic, N., 2007. Prediction of the effects of soil and target propertieson the antipersonnel landmine detection performance of ground-penetratingradar: a Colombian case study. Journal of Applied Geophysics 63, 13–23.
MacDonald, J., Lockwood, J.R., McFee, J., Altshuler, T., Broach, T., Carin, L., Harmon, R.,Rappaport, C., Scott, W., Weaver, R., 2003. Alternatives for landmine detection.RAND Santa Monica, CA.
Mullins, C.E., 1977. Magnetic susceptibility of the soil and its significance in soil science:A review. Journal of Soil Science 28, 223–246.
Muscio, A., Corticelli, M.A., 2004. Land mine detection by infrared thermography:reduction of size and duration of experiments. IEEE Transactions on Geoscience andRemote Sensing 42, 1955–1964.
Pasion, L.R., Billings, S.D., Oldenburg, D.W., Walker, S.E., 2007. Application of a librarybased method to time domain electromagnetic data for the identification ofunexploded ordnance. Journal of Applied Geophysics 61, 279–291.
Pelton, W.H., Ward, S.H., Hallof, P.G., Sill, W.R., Nelson, P.H., 1978. Mineraldiscrimination and removal of inductive coupling with multifrequency IP.Geophysics 43, 588–609.
Preetz, H., Altfelder, S., Igel, J., 2008. Tropical soils and landmine detection — anapproach for a classification system. Soil Science Society of America Journal 72,151–159.
Robinson, D.A., Jones, S.B., Wraith, J.M., Or, D., Friedmann, S.P., 2003. A review ofadvances in dielectric and electrical conductivity measurement in soils using timedomain reflectometry. Vadose Zone Journal 2, 444–475.
Sabatier, J.M., Xiang, N., 2001. An investigation of acoustic-to-seismic coupling to detectburied antitank landmines. IEEE Transactions on Geoscience and Remote Sensing39, 1146–1154.
Savelyev, T.G., van Kampen, L., Sahli, H., Sachs, J., Sato, M., 2007. Investigation of time-frequency features for GPR landmine discrimination. IEEE Transactions onGeoscience and Remote Sensing 45, 118–129.
Schwertmann, U., 1988. Occurrence and formation of iron oxides in variouspedoenvironments. In: Stucki, J.W., Goodman, B.A., Schwertmann, U. (Eds.), Ironin Soils and ClayMinerals., NATO ASI Series C217, D. Reidel, Dordrecht, pp. 267–308.
Scott Jr., W.R., Martin, J.S., Larson, G.D., 2001. Experimental model for a seismiclandmine detection system. IEEE Transactions on Geoscience and Remote Sensing39, 1155–1164.
Shen, L.C., Kong, J.A., 1995. Applied Electromagnetism Third Edition. PWS, Boston, MA.Shubitidze, F., O'Neill, K., Barrowes, B.E., Shamatava, I., Fernández, J.P., Sun, K., Paulsen,
K.D., 2007. Application of the normalized surface magnetic charge model to UXOdiscrimination in cases with overlapped signals. Journal of Applied Geophysics 61,292–303.
Simonson, K.M., 1998a. Statistical considerations in designing tests of mine detectionsystems: I — measures related to the probability of detection. Sandia Report,SAND98-1769/1.
Simonson, K.M., 1998b. Statistical considerations in designing tests of mine detectionsystems:I—measuresrelatedtothefalsealarmrate.SandiaReport,SAND98-1769/2.
Singer, M.J., Fine, P., 1989. Pedogenetic factors affecting magnetic susceptibility ofNorthern California soils. Soil Science Society of America Journal 53, 1119–1127.
Somasundaram, S.D., Jakobsson, A., Smith, J.A.S., Althoefer, K., 2007. Exploiting spindecay in the detection of nuclear quadrupole resonance signals. IEEE Transactionson Geoscience and Remote Sensing 45, 925–933.
Takahashi, K., Gülle, D., 2010a. ITEP dual sensor test in Germany. 7th InternationalSymposium Humanitarian Demining. Sibenik, Croatia, pp. 10–14.
Takahashi, K., Gülle, D., 2010b. ITEP evaluation of metal detectors and dual-sensordetectors. Journal of ERW and Mine Action 14.3, 76–79.
Takahashi, K., Sato, M., 2008. A hand held dual-sensor system using impulse GPR fordemining. IEEE International Conference on Ultra-Wideband. Hannover, Germany,pp. 157–160.
Takahashi, K., Gaal, M., Gülle, D., 2009. Data analysis and performance evaluation ofJapanese dual-sensor systems tested in Croatia. Journal of ERW and Mine Action13.3, 66–70.
Throckmorton, C.S., Tantum, S.L., Tan, Y., Collins, L.M., 2007. Independent componentanalysis for UXO detection in highly cluttered environments. Journal of AppliedGeophysics 61, 304–317.
Topp, G.C., Davis, J.L., Annan, A.P., 1980. Electromagnetic determination of soil watercontent: measurements in coaxial transmission lines. Water Resources Research16, 574–582.
Zeng, Y.Q., Liu, Q.H., 2001. Acoustic detection of buried objects in 3-D fluid saturatedporous media: numerical modeling. IEEE Transactions on Geoscience and RemoteSensing 39, 1165–1173.


![T Madas. The metric unit of length is the metre [ m ] Smaller units are the: ( centimetre) cm ( millimetre ) mm ( micrometre ) mm ( nanometre ) nm.](https://static.fdocument.org/doc/165x107/5a4d1b8a7f8b9ab0599be5b3/t-madas-the-metric-unit-of-length-is-the-metre-m-smaller-units-are-the-centimetre.jpg)


![Sensitivity analyses of turbulence ... - ife.uni-hannover.de fileFigure 3: Example correlation matrix (Cn = 1.0e-7 [m-1/3], wind velocity = 4.0 [m/s]) Figure 4: Partial derivative](https://static.fdocument.org/doc/165x107/5d542d9d88c99355178b9656/sensitivity-analyses-of-turbulence-ifeuni-3-example-correlation-matrix.jpg)