BLAH BLAH BLAH nvvbnvbnvbncvncn. Abstract A complete sample of point source emissions in the spiral...
33
BLAH BLAH BLAH nvvbnvbnvbncvncn
-
date post
20-Dec-2015 -
Category
Documents
-
view
226 -
download
0
Transcript of BLAH BLAH BLAH nvvbnvbnvbncvncn. Abstract A complete sample of point source emissions in the spiral...
BLAH BLAH BLAH
nvvbnvbnvbncvncn
Abstract
• A complete sample of point source emissions in the spiral type galaxies NGC300 and M31 have been catalogued and analysed. This study has identified a total of 72 and 864 point source emissions in both NGC300 and M#!.
• New high-sensitivity and resolution radio-continuum images of NGC300 and M31 at λ=20~cm have been created as part of this study. These new images were produced by merging archived 20~cm radio-continuum data sourced from ATCA and the VLA. Images presented in this thesis are extremely sensitive and feature high angular resolution (<10”).
Outline
• Overview of Instruments• Data reduction process• Results– NGC 300– M31
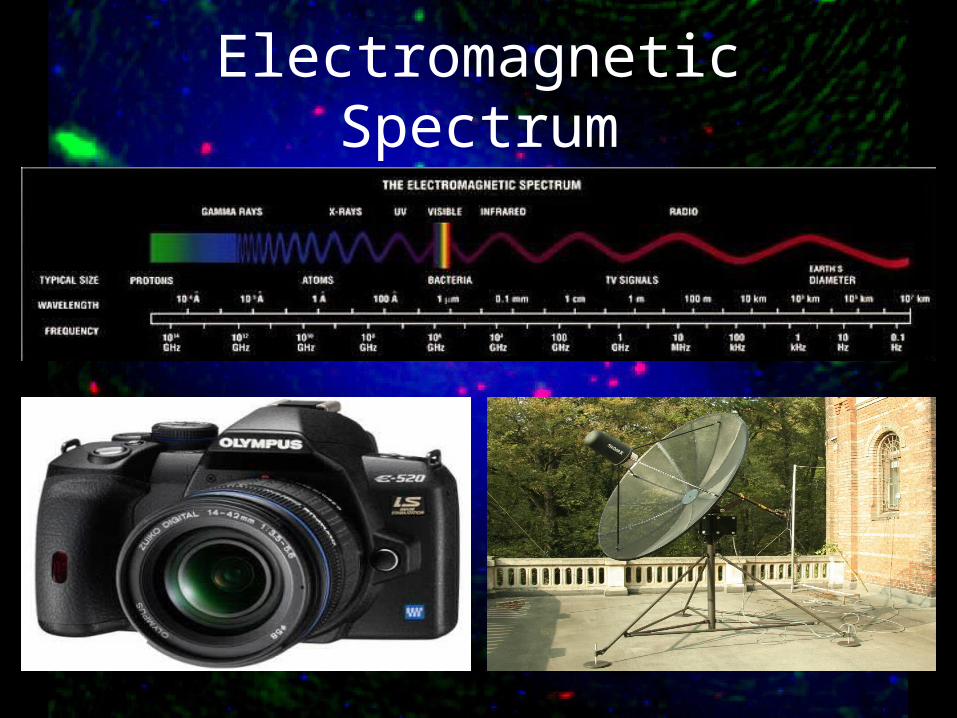
Electromagnetic Spectrum
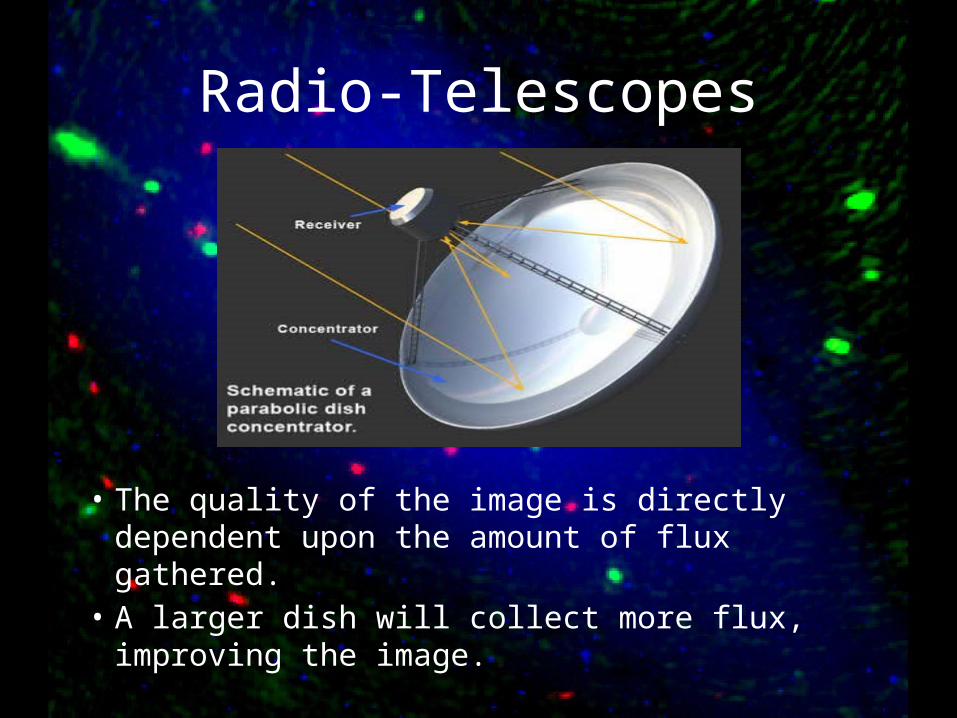
Radio-Telescopes
• The quality of the image is directly dependent upon the amount of flux gathered.
• A larger dish will collect more flux, improving the image.
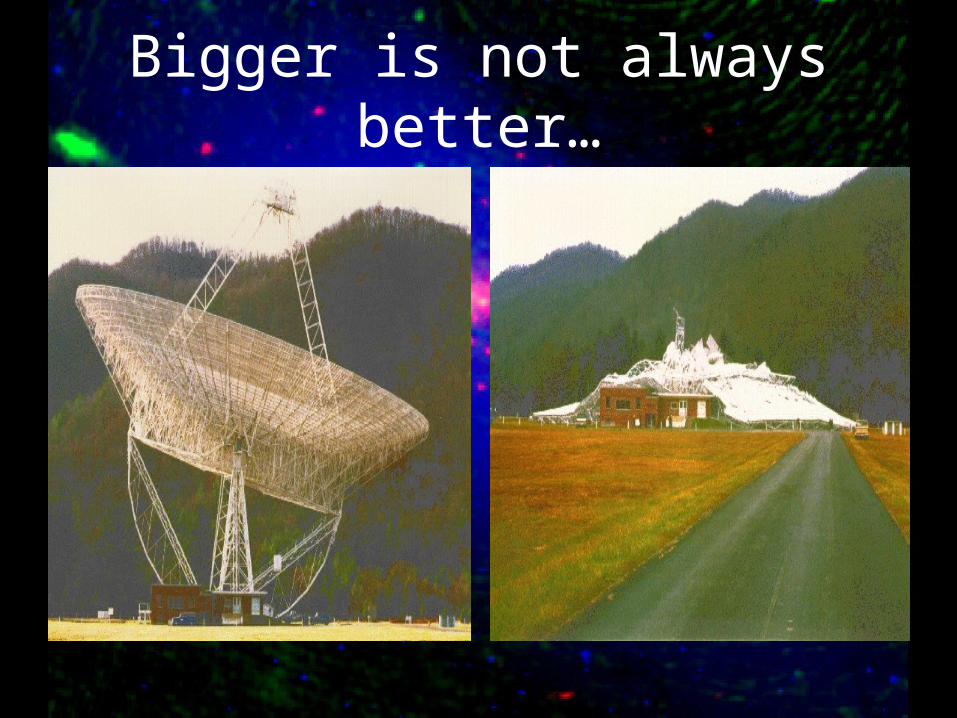
Bigger is not always better…
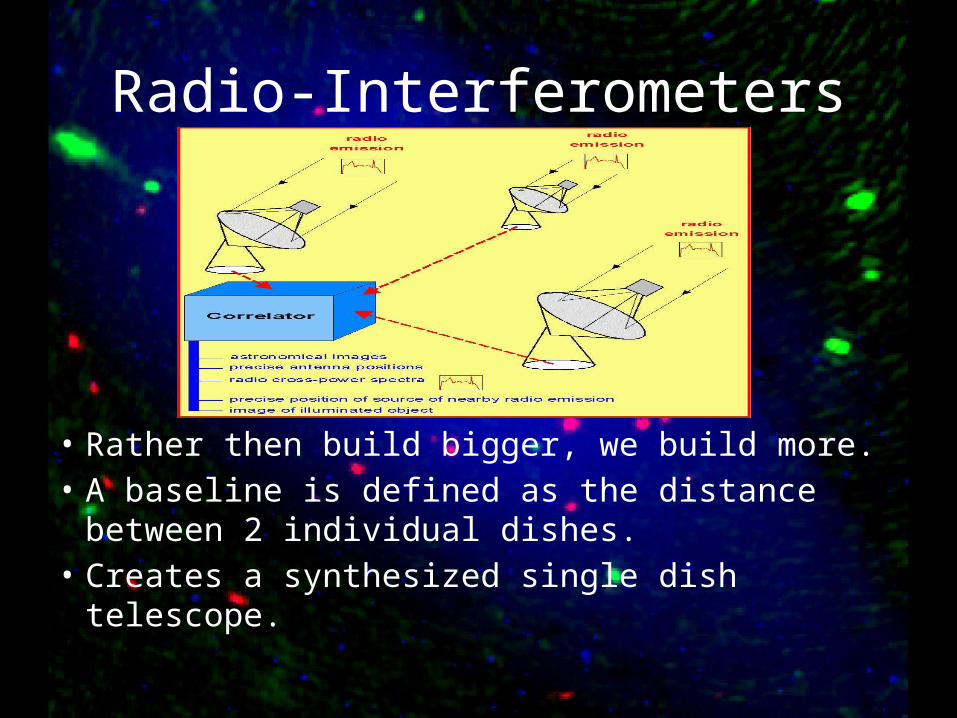
Radio-Interferometers
• Rather then build bigger, we build more.• A baseline is defined as the distance between
2 individual dishes. • Creates a synthesized single dish telescope.
Effects of Baselines
• Array configurations with longer baselines produce higher resolution images– Intrinsic structure of sources can be studied– Image artifacts may be introduced
• Array configurations with shorter baselines produce lower resolution images– Extended sources are more apparent ie. Extended
Emission
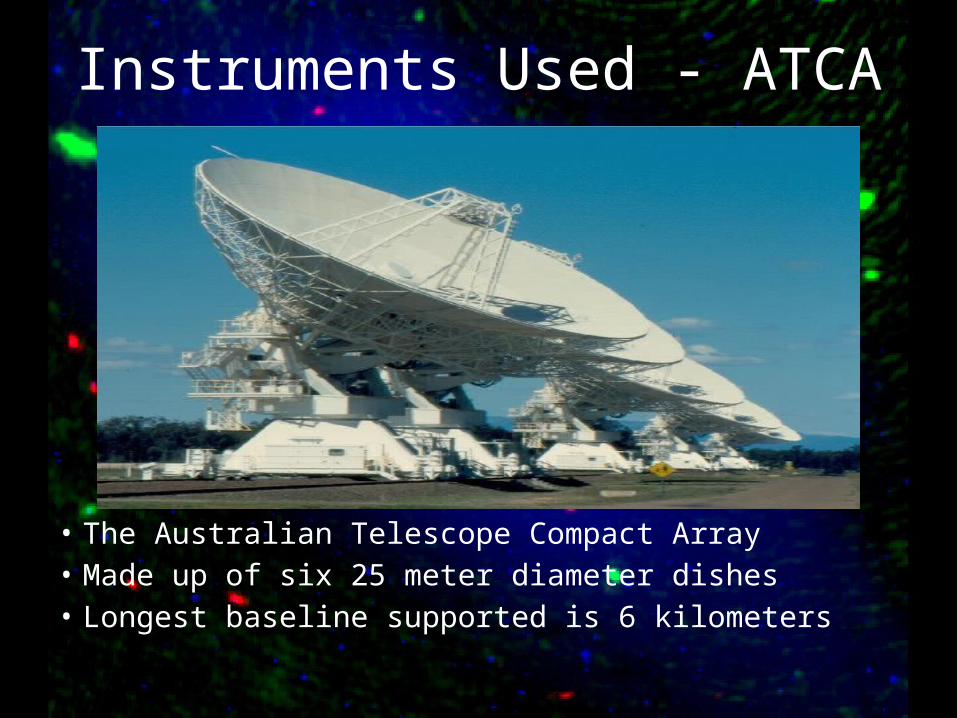
Instruments Used - ATCA
• The Australian Telescope Compact Array • Made up of six 25 meter diameter dishes• Longest baseline supported is 6 kilometers
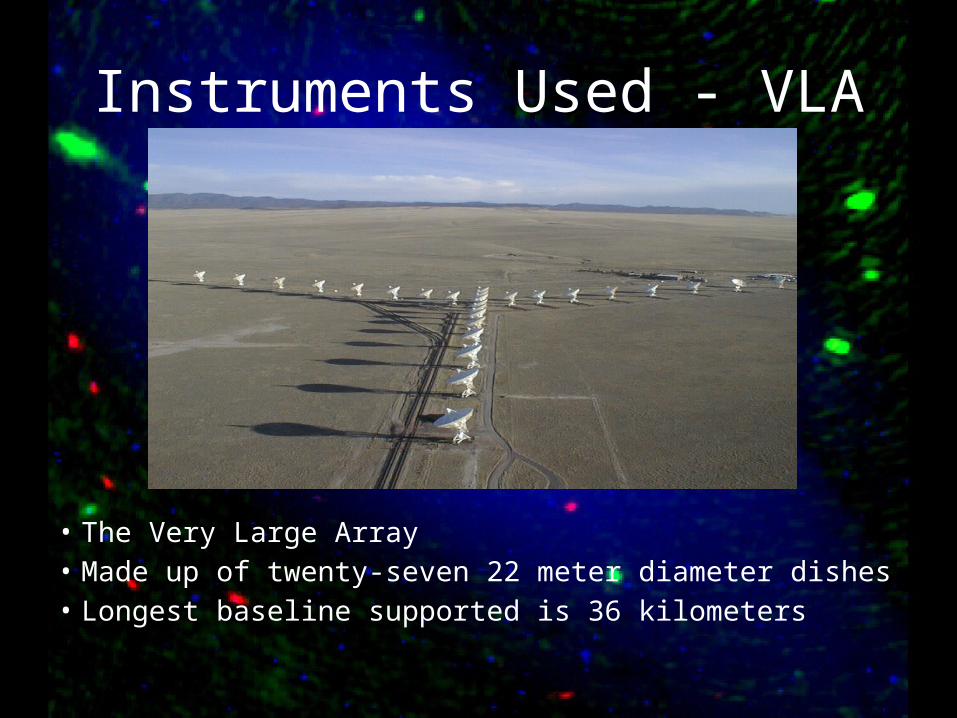
Instruments Used - VLA
• The Very Large Array• Made up of twenty-seven 22 meter diameter dishes• Longest baseline supported is 36 kilometers
Merging Observations
• Merging multiple observations together is possible
• Observations with different array configurations can produce images with both intrinsic and extended structure to sources
Data Reduction Process
• Two main data reduction software packages were used– Astronomical Image Processing System (AIPS)• Use was limited to preprocessing of VLA only
– Multichannel Image Reconstruction, Image Analysis and Display (miriad)
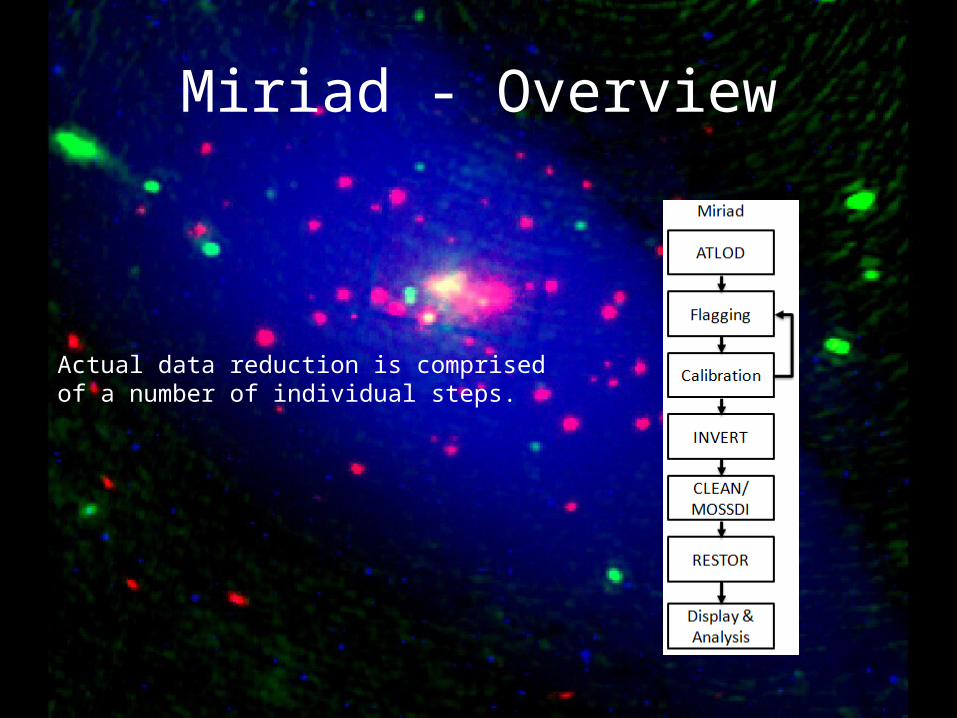
Miriad - Overview
Actual data reduction is comprised of a number of individual steps.
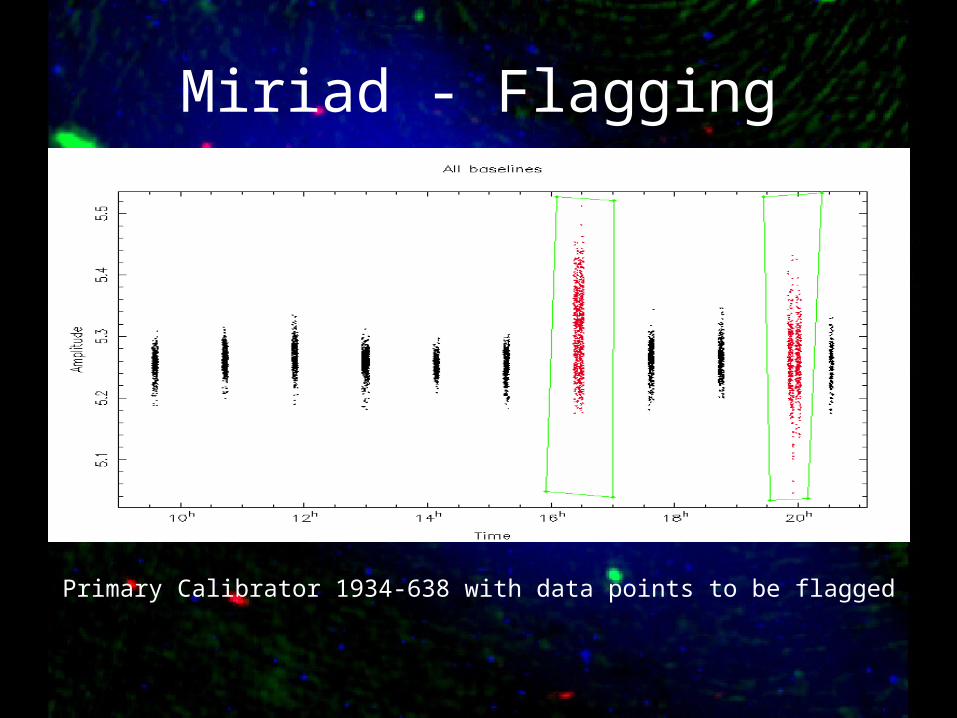
Miriad - Flagging
Primary Calibrator 1934-638 with data points to be flagged
Miriad - Calibration
• Calibration is necessary to establish a flux density scale and correct for instrument gains over time
• Achieve this by observing significantly strong and are well understood sources
• By comparing results measured to what we expect the results to be, we can deduce certain corrections which need to be made, and apply these corrections to our data
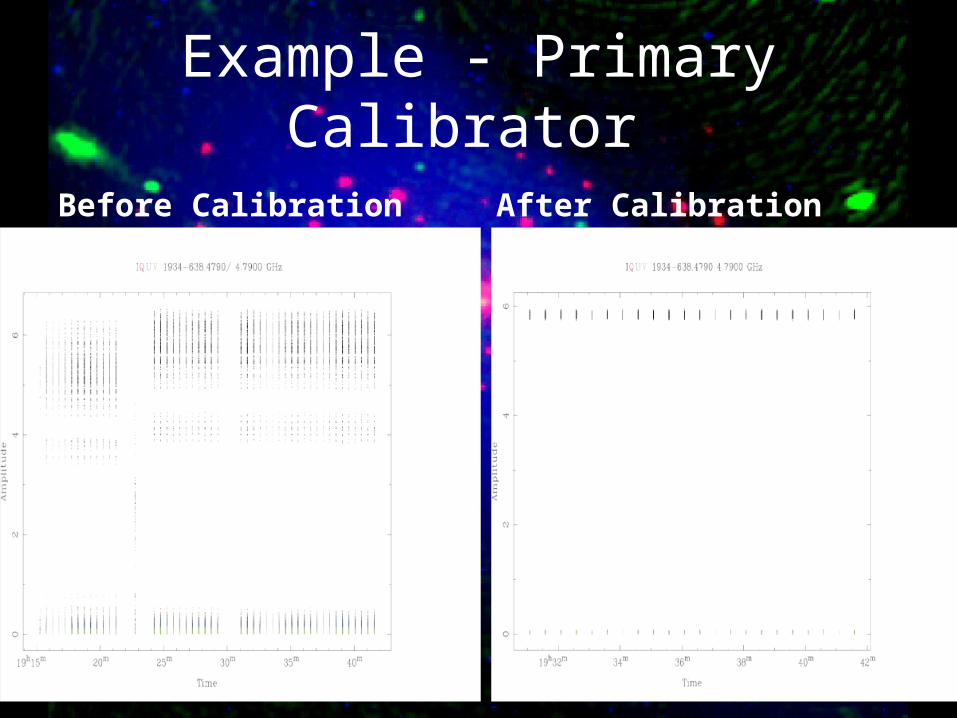
Example - Primary Calibrator
Before Calibration After Calibration
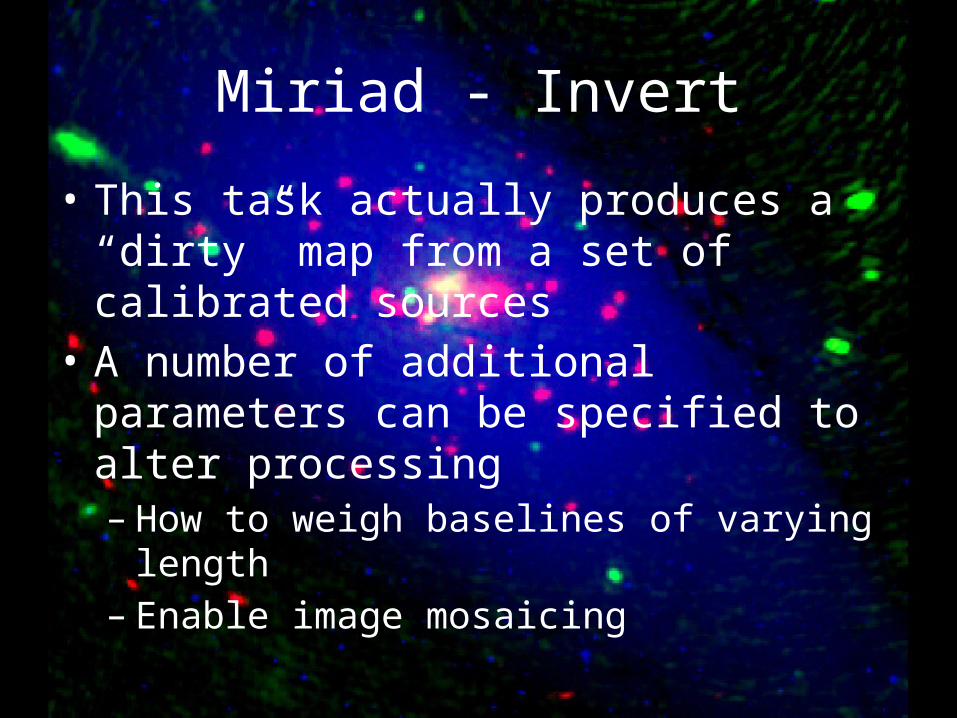
Miriad - Invert
• This task actually produces a “dirty” map from a set of calibrated sources
• A number of additional parameters can be specified to alter processing– How to weigh baselines of varying length– Enable image mosaicing
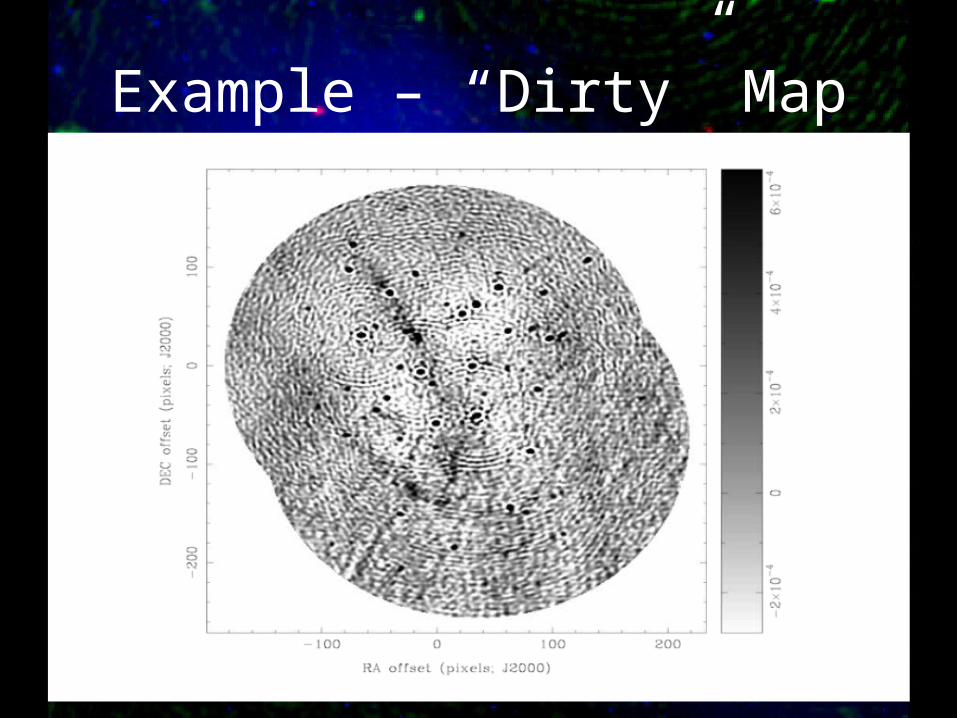
Example – “Dirty” Map
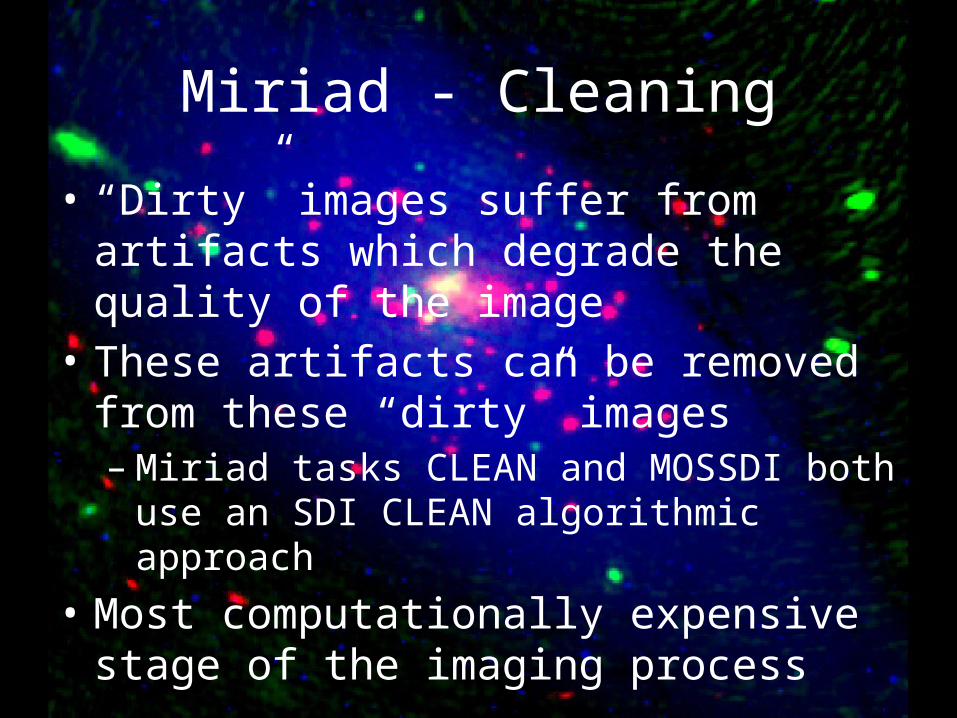
Miriad - Cleaning
• “Dirty” images suffer from artifacts which degrade the quality of the image
• These artifacts can be removed from these “dirty” images– Miriad tasks CLEAN and MOSSDI both use an SDI
CLEAN algorithmic approach• Most computationally expensive stage of the
imaging process
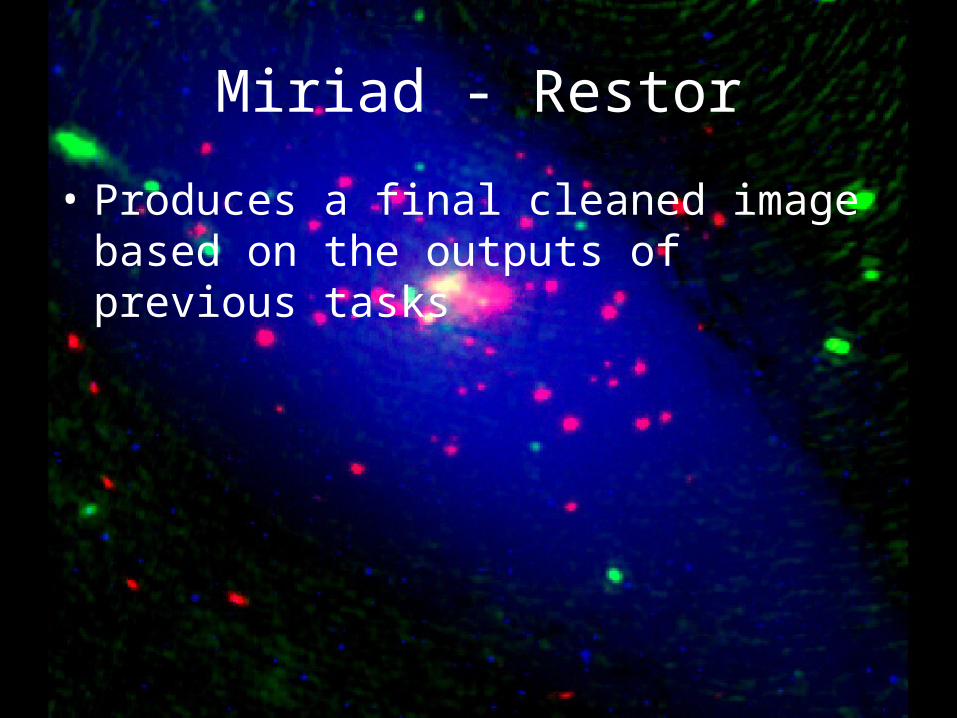
Miriad - Restor
• Produces a final cleaned image based on the outputs of previous tasks
Results – NGC 300
NGC 300 - Observations Used
• PUT A TABLE HERE SUMMARISING:– PROJECT CODE– VLA/ATCA– RA AND DEC– DATE
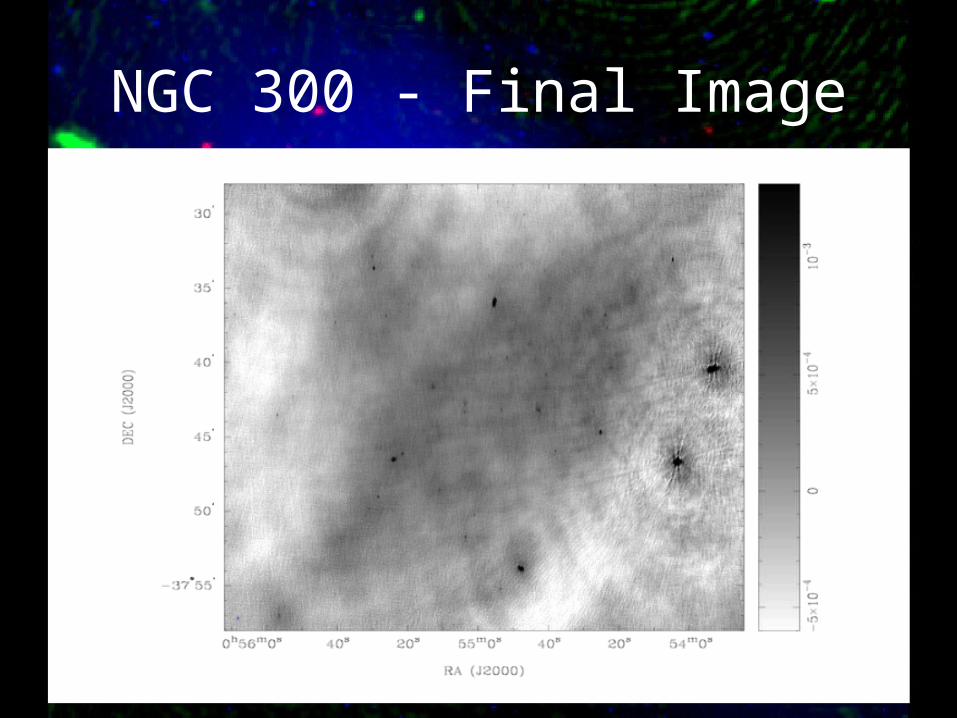
NGC 300 - Final Image
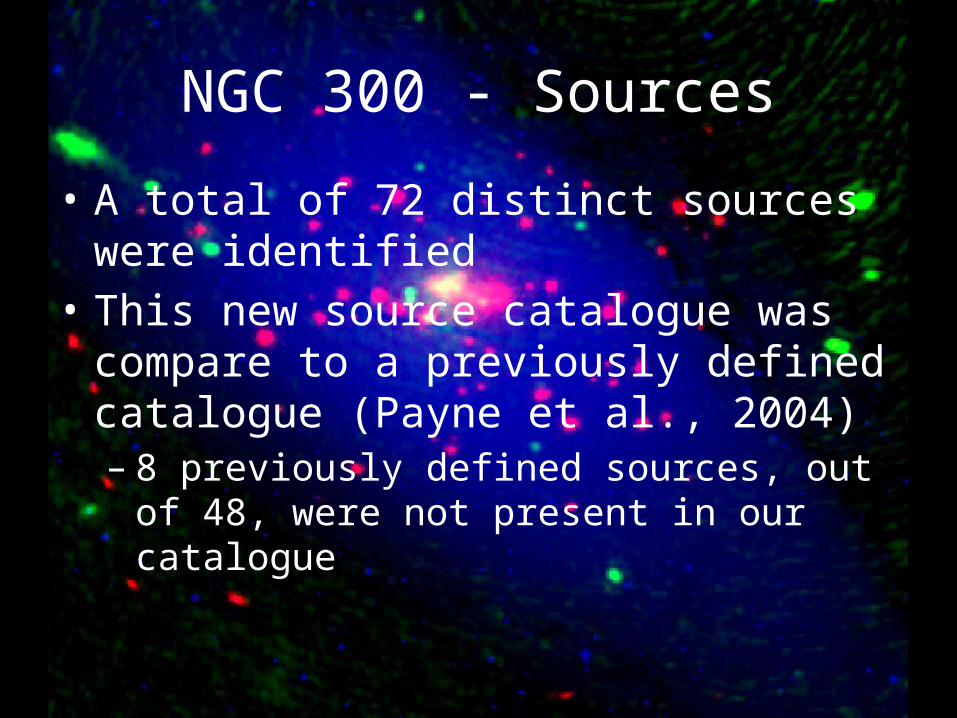
NGC 300 - Sources
• A total of 72 distinct sources were identified• This new source catalogue was compare to a
previously defined catalogue (Payne et al., 2004)– 8 previously defined sources, out of 48, were not
present in our catalogue
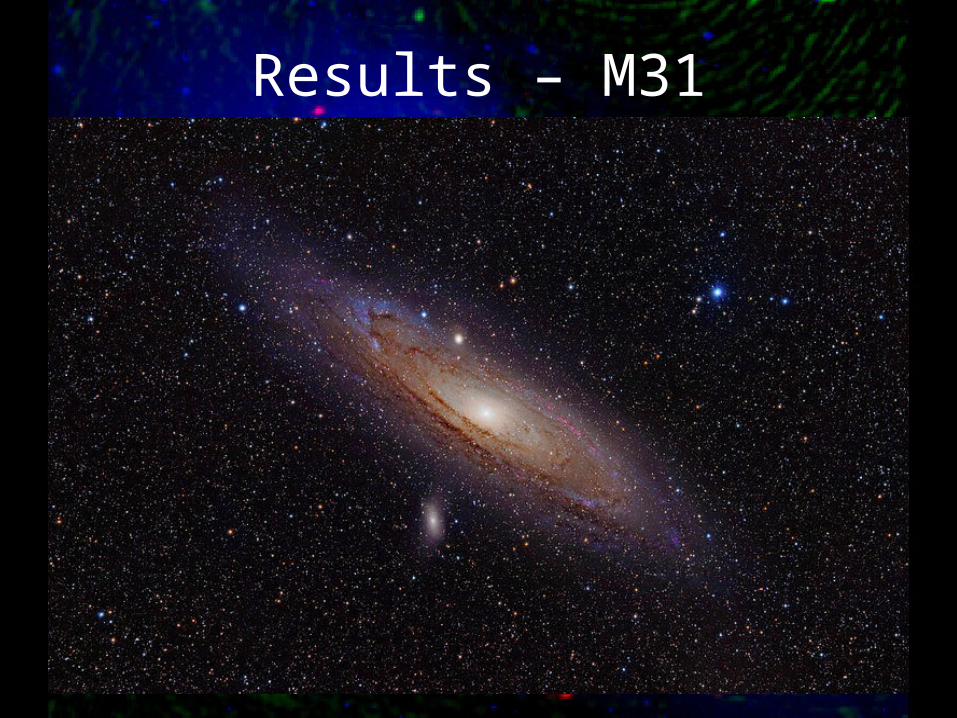
Results – M31
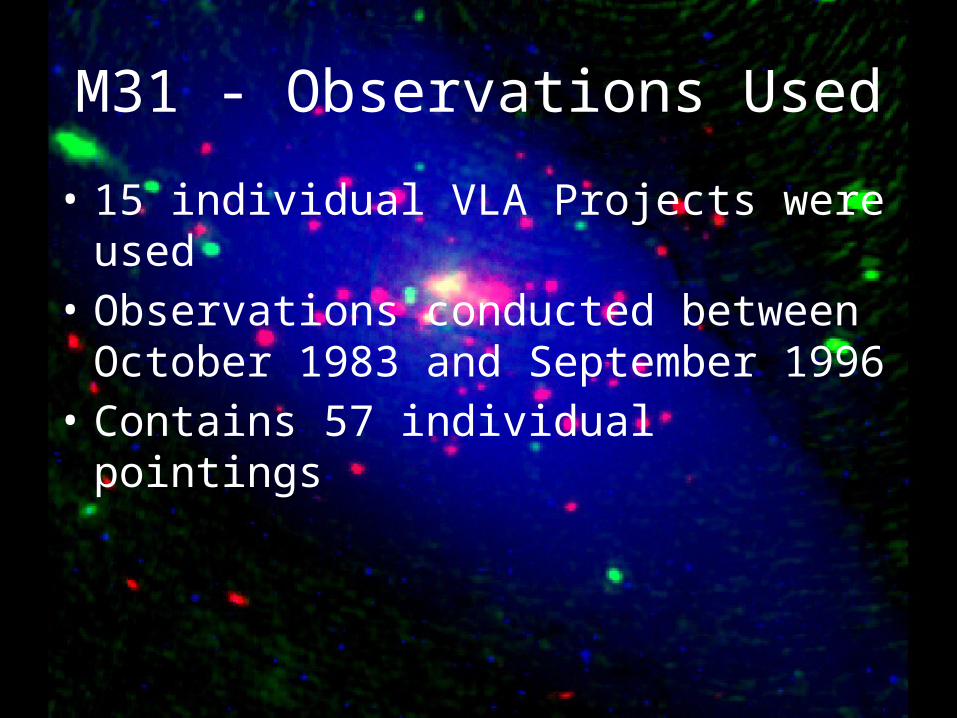
M31 - Observations Used
• 15 individual VLA Projects were used• Observations conducted between October
1983 and September 1996• Contains 57 individual pointings
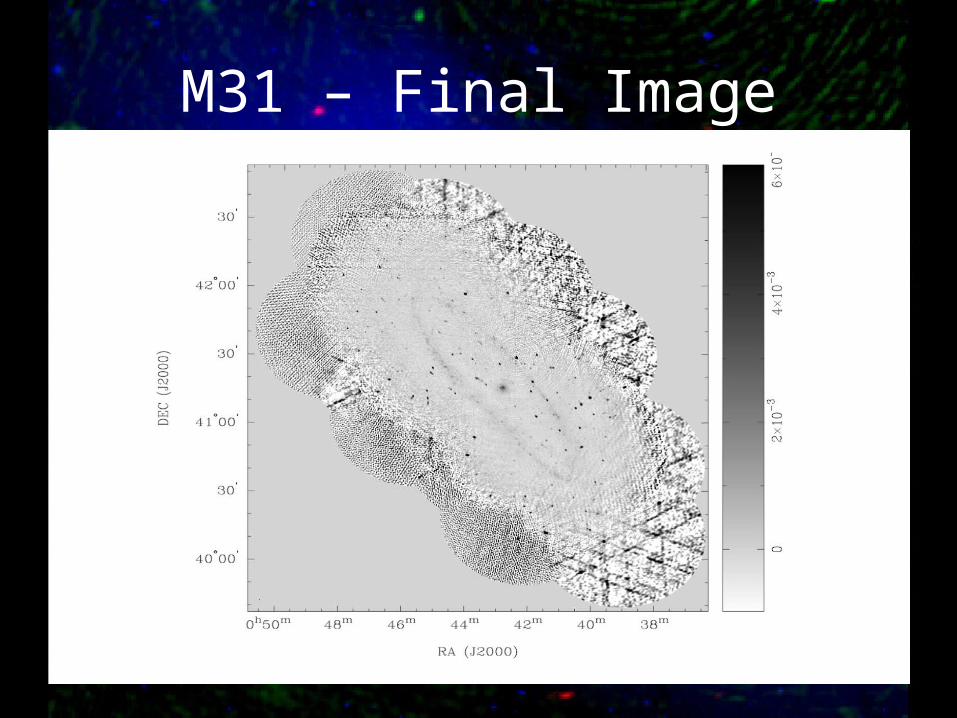
M31 – Final Image
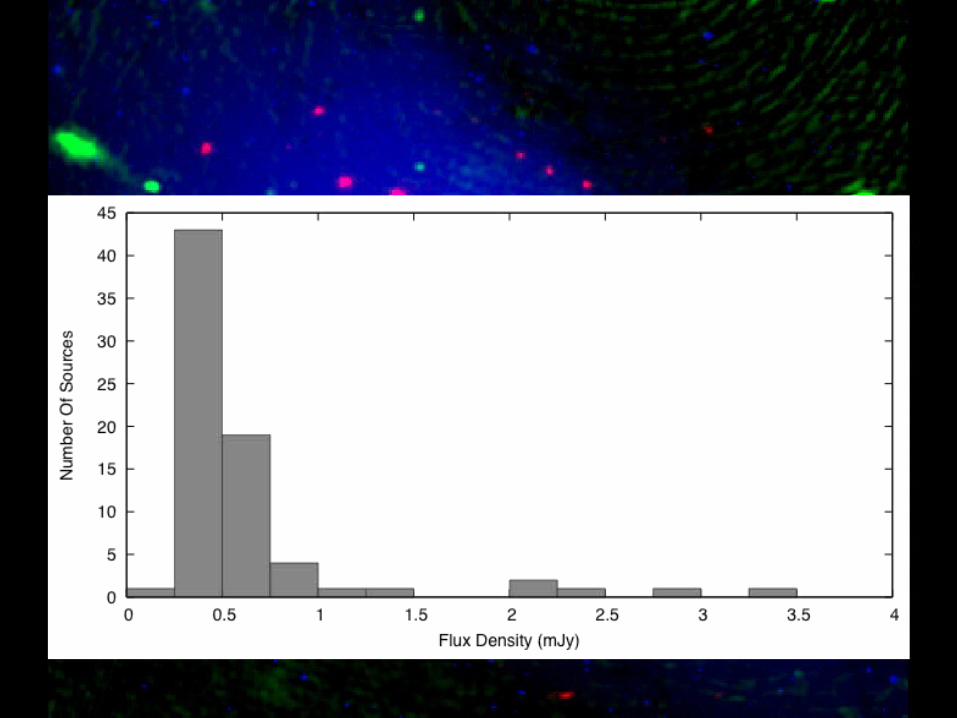
M31 - Sources
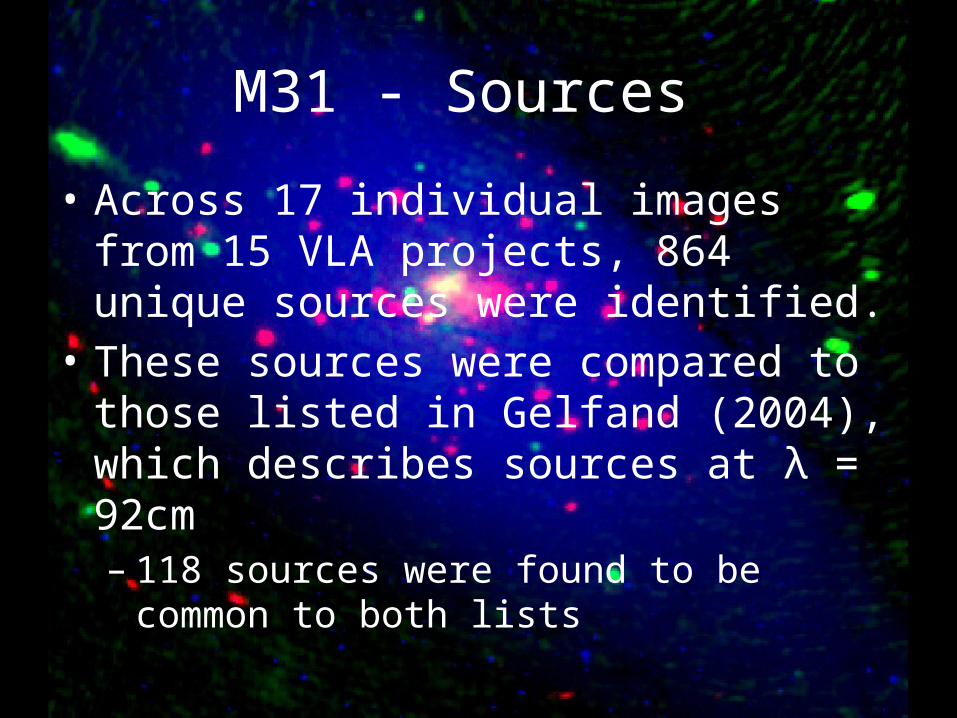
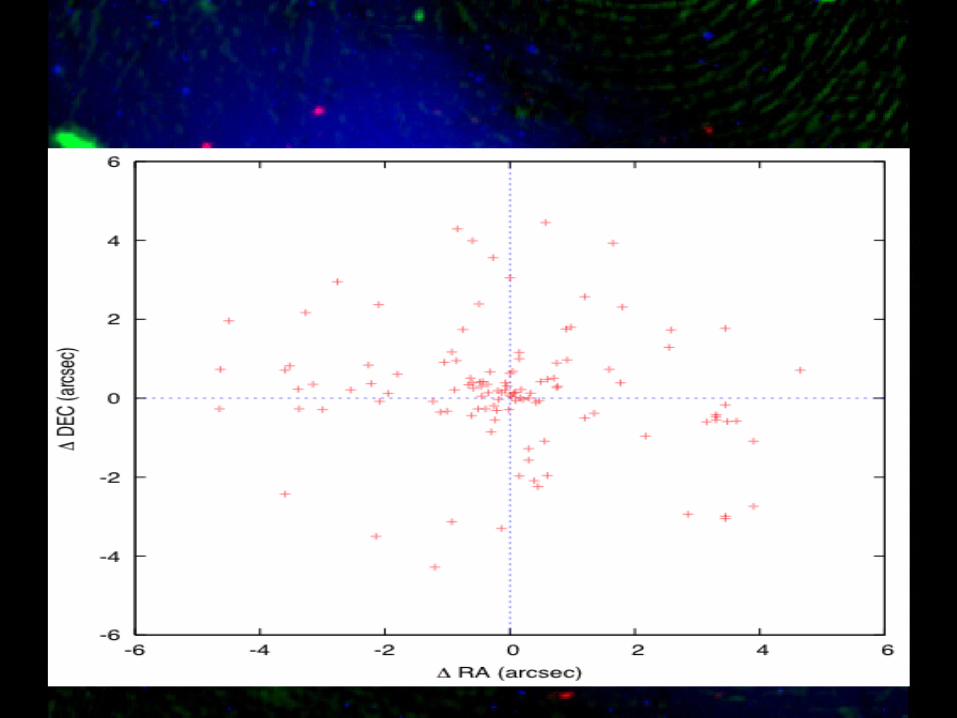
• Across 17 individual images from 15 VLA projects, 864 unique sources were identified.
• These sources were compared to those listed in Gelfand (2004), which describes sources at λ = 92cm– 118 sources were found to be common to both
lists
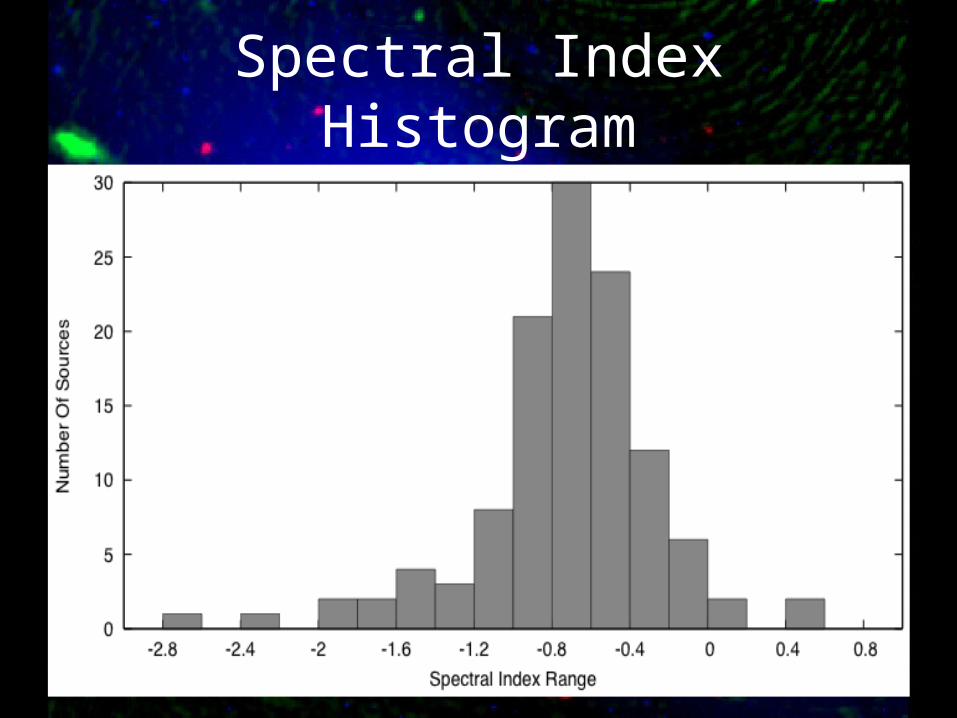
Spectral Index Histogram
THANKS!
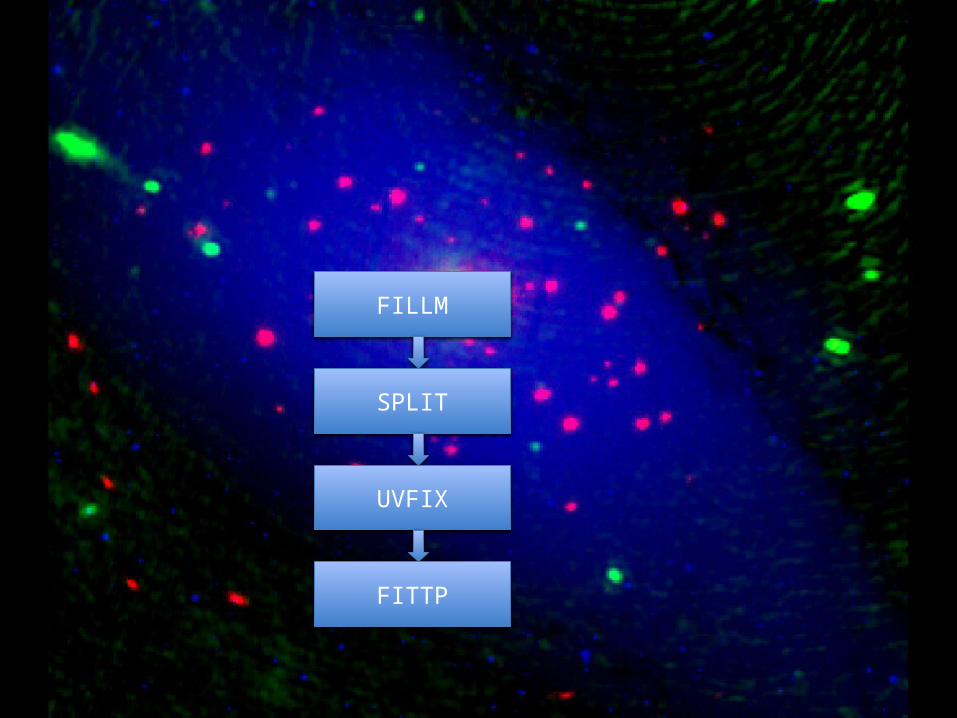
FILLM
SPLIT
UVFIX
FITTP