BANK OF GREECE · ability to access bank financing and exports of goods both in the long and in ......
24
Transcript of BANK OF GREECE · ability to access bank financing and exports of goods both in the long and in ......
BANK OF GREECE
Economic Research Department – Special Studies Division
21, Ε. Venizelos Avenue
GR-102 50 Athens
Τel: +30210-320 3610
Fax: +30210-320 2432
www.bankofgreece.gr
Printed in Athens, Greece
at the Bank of Greece Printing Works.
All rights reserved. Reproduction for educational and non-commercial
purposes is permitted provided that the source is acknowledged.
ISSN 1109-6691
FINANCING EXPORTS OF GOODS: A CONSTRAINT ON GREEK
ECONOMIC GROWTH
Ioanna C. Bardakas
Bank of Greece
Abstract
This paper assesses the effect of financing conditions on exports of goods in Greece
during the last decade. Controlling for reverse causality which is feasible with the
Johansen multivariate cointegration technique (1988) we have adopted, we estimate a
reduced form of exports showing the existence of a relationship between companies’
ability to access bank financing and exports of goods both in the long and in the short-
run. Robustness is established by estimating alternative specifications producing
comparable results using absolute or relative prices and allowing for cyclical effects.
More specifically, we show that during an economic crisis (given that for large part of the
sample period credit has been declining) a 10 percent drop in firm financing leads to a
decline in export growth by 6 to 9 percent in the short-run and by 2 to 4 percent in the
long-run. Additionally, a similar increase in bank financing during an economic recovery
is expected to produce a 6 to 9 percent increase in exports a result which will lead to an
approximate increase of 1 to 2 percent to current GDP and economic growth.
Keywords: Exports, bank financing, economic growth.
JEL classification codes: F10, F14, C32
Acknowledgements: I am grateful to George Zombanakis for providing the motivation for
this paper and to Heather Gibson for her constructive comments and helpful suggestions.
I am also grateful to Nikolaos Kamberoglou and Nikoleta Koliou for their help on the use
of statistics of bank financing of firms. Finally, I would like to thank Christos Catiforis
and Evaggelia Georgiou for helpful discussions. The opinions expressed in this paper are
those of the author and do not necessarily represent the views of the Bank of Greece.
Correspondence:
Ioanna Bardaka
Economic Research Department
Bank of Greece
21, El. Venizelos Avenue
102 50 Athens, Greece
tel. + 30 210 3202397
e-mail. [email protected]

5
1. Introduction
There has been an extensive discussion recently regarding the degree to which the
limited access to financing facing Greek exporters imposes a constraint on their
performance in international markets and, consequently, on the return of the economy to
positive rates of growth. In the World Economic Forum’s report on competitiveness in
the section entitled “the most problematic factors for doing business in Greece”, the
limited access to financing of firms emerges as the second most problematic factor that
has worsened due to the ongoing recession.1 This paper assesses the effect of bank
financing on exports of goods in Greece during the last decade using various
specifications to ensure robustness. Given that the period under review incorporates the
Greek crisis we are able to examine the impact of the increasingly limited access of
Greek exporters to bank financing. Finally, given that bank lending is unlikely to pick up
quickly in Greece, we offer a measure of the contribution of bank financing to export
performance and, consequently, growth.
2. The necessity for export finance
Most firms need external capital along with their own internal cash flows to
finance investment in new capital equipment, research and development expenses,
payments to workers and intermediate input purchases. It is only natural, therefore, that, a
number of empirical studies examine the impact of credit tightening for exporters2 and
some papers introduce “financial accelerators” in export demand equations. Thus,
according to Chor and Manova (2012) and Muûls (2008), exporting firms depend more
on external financing compared to domestically producing firms for a number of reasons.
1 See World Economic Forum (2012), and The Global Competitiveness Report 2012-13 in the website
http://www.weforum.org/issues/golbal-competitiveness. The construction of the index measuring firms’
access to financing is based on a questionnaire where firms are asked to identify five (from a list of sixteen)
most problematic factors for doing business in the country, ranking them from one to five. 2 There is a consensus among economists that during a financial crisis credit to firms is tightened.
Information on trade credit per se, however, is limited. A survey conducted by the International Monetary
Fund and the BAFT-IFSA presented in an IMF study shows that trade finance tightening during the 2008-9
crisis occurred mostly in large banks that suffered most from the financial crisis and which, in order to
overcome the burden, increased the cost of borrowing in trade-related credit and letters of credit. (See
Asmundson et al. 2011).
6
They suggest that export activity involves “sunk costs 3 that must be paid before any
profits are made abroad”. Foreign activities are often considered more risky than
domestic ones because it is more difficult for the exporter to deal with foreign payment
systems that may be unknown and, in the case of default, to collect the payment
sometimes through intricate or obscure procedures. In addition, since there is a time lag
between shipment and payment, the exporting firm has a greater need for working capital
and turns to the banking system for financing, for guaranteeing payment and for
providing export insurance. Accordingly, banks have developed various instruments to
provide so-called trade finance.
A usual bank-intermediated way to ensure that exporters have access to sufficient
working capital is for the bank to extend loans to them before shipments using as
collateral the letter of credit by which the bank guarantees payment for the imports. Of
secondary importance is the documentary bill. The importer’s bank issues a letter of
credit to ensure that the exporter is paid upon submission of certain documents like
invoices and bills of landing. In the case of Greece the Bank of Greece collects data on
credit extended to non-financial corporations that include credit extended to exporting
firms. In the present study we use credit to manufacturing firms since the bulk of exports
of goods is recorded in this sector.
A financial crisis can create problems in banks’ ability to raise funding, as
interbank lending dries up and banks are forced to limit loans granted, including those to
exporters. This characterizes the situation faced by exporters in Greece at the present
time.4 In more technical terms, such an environment offers considerable potential for the
introduction of a financial accelerator as a significant determinant in an export equation.
3. Related literature
Kletzer and Bardhan (1987) provide a starting point with their finding that the
development of the financial sector can determine a country’s comparative advantage
3A term introduced by Krugman (1989) referring to irrecoverable costs to the exporter incurred to enter
foreign markets that involve investing in equipment or knowledge regarding the characteristics of the
markets. 4Greek exporting firms in trying to avoid financing constraints, are transferring their headquarters to
countries with more healthy economies and higher ratings (recent examples include Viohalco, Coca-cola
and Fage, all during 2013).
7
especially in those industries that rely on it more. Beck (2002) and Svaleryd and Vlachos
(2005) empirically verify Kletzer and Bradhan’s hypothesis. They show the importance
of the development of the financial sector for trade and exports for a number of countries
and that exporting firms in countries with better financing conditions tend to rely more on
external finance.
Theoretical contributions that develop models introducing financial constraints
into the firm’s decision to participate in an export market include Melitz (2003), Chaney
(2005), Manova (2013, 2008) and Muûls (2008). Melitz using elements of “new trade
theory” highlights the importance of sunk costs in the firm decision to start exporting and
the dependence of these costs on financial variables. Chaney adds liquidity constraints to
Melitz’s model and shows how they may affect the probability of a firm becoming an
exporter.5 Manova explicitly models financial constraints of firms in the framework set
by Chaney and shows that the role of financing varies i) across different industries
depending on whether they rely more or less on external financing and ii) across different
countries. Financially developed countries tend to be export-oriented and presence in
export markets is more pronounced in the case of industries that are able to access less
expensive credit. Muûls finds that credit constraints are important in determining the
number of exporters and that lack of firm financing prevents firms from entering foreign
markets without, however, affecting the size of sales of existing exporters. An empirical
assessment of Chaney’s model is provided by Berman and Hericourt (2010) who use
survey data for nine developing and emerging economies. They show that firms’ access
to finance affects the decision to enter export markets, but better financial health does not
guarantee that the firm will necessarily survive in an export-market environment.
A number of recent empirical studies analyze the effects of a financial crisis on
exports. For example Amity and Weinstein (2009) relate the declining bank health during
the crisis in the 1990s and 2000s in Japan, with the consequent drying up of finance, to
firms’ export performance. They match Japanese exporters and the Japanese banks from
which they borrowed and they construct market-to-book values for all large Japanese
banks. Αmity and Weinstein find large differences across banks in these measures that
represent bank health. They establish a causal link from distressed banks to exporters that
5 He examines the effect of financial variables on sunk costs associated with entering a market.
8
borrowed from them and show that exporters connected to distressed banks reduced their
exports faster than those who borrowed from healthier banks.
While the above studies show that financial development matters for export
growth it can be argued that an increase in the number of exporters of a country can
improve the health of the financial sector in this country (see Greenaway et al., 2007 and
Do and Levchenko, 2007). The presence of endogeneity in the export-finance relationship
suggests that in the estimation we need to control for any possible reverse causality
effects.
4. The empirical specification
Since Greece is a small country it is acceptable to estimate a reduced form which
is derived combining the demand and supply of exports (see Goldstein and Khan 1986,
Athukorala and Suphachalasai 2004, Jongwanich 2009, Esteves and Rua 2013, and
Belke, Oeking and Setzer 2013). The determinants of export demand are traditionally
export prices, prices in competitors’ countries and a scale variable that represents foreign
income usually approximated by the demand from the rest of the world for the given
product.6 A variant often employed uses relative prices assuming perfect substitution or
homogeneity of degree zero with respect to prices. The supply side of exports includes
income and price variables and capacity utilization a variable which is frequently adopted
and concerns cyclical effects (see Goldstein and Khan 1985 and Faini 1994). The reduced
form which is estimated in the absolute and relative price versions in log-linear form
augmenting with bank credit is as follows:
creditacuapcompapxawdaxd
54321 (1)
creditbcubprelbwdbxd
5321 (2)
where xd
refers to the volume of exports demanded, wd is world demand, px and pcomp
are prices of exports and competitors’ prices respectively, prel the ratio of these prices, cu
capacity utilization and credit a variable representing private credit by banks to
nonfinancial manufacturing. This variable is assumed to approximate financial conditions
in exporting firms. Better financing conditions are expected to cause export growth and
6Goldstein and Khan (1985) and Stern Francis and Schumacher (1976) provide a starting point reviewing
specification and estimation issues of trade equations.
9
the relevant coefficient should be positive. The coefficient on world demand is expected
to be positive since an increase in world demand leads to an increase in a given country’s
exports. The coefficients α2 and b2,, which correspond to own absolute and to relative
prices respectively, should be negative given that an increase in these prices decreases the
demand of exports. By contrast, a price increase in competing markets is expected to
cause an increase in export demand and the corresponding coefficient should be positive.
Finally, the sign of capacity utilization should be positive in the long run since increased
capital utilization leads to higher investment activity that would create increased demand
for capital goods. In the literature it has often been argued that the coefficient on capacity
utilization in an export demand equation could be negative especially in the short-run
since the high domestic demand resulting from an increase in capacity utilization creates
an impediment in foreign export demand.
5. Estimation results
5.1 Data
The sample consists of quarterly data covering the period 2000-2012. As a proxy
for firms’ financing, we use an aggregate measure of bank credit to nonfinancial
enterprises in manufacturing, provided by the Bank of Greece. Related studies have used
various measures to proxy the availability of finance such as the credit of all financial
institutions (banks and other financial intermediaries, Beck 2002), credit of deposit-
taking banks or measures that refer to the size of activity on the stock market such as the
stock market capitalization to GDP ratio (see Hur etal., 2006). We have chosen to use
bank credit since in Greece credit provided by deposit-taking banks is the major source of
financing.7 In addition, given that Greek exports of goods consist largely of exports of
manufactures, bank credit to manufacturing approximates credit directed to exporting
firms.8 Further, regarding the separate treatment of short-term and long-term credit, we
use data on bank credit to nonfinancial enterprises up to one year to approximate the
former and credit to nonfinancial enterprises over one year to approximate the latter.
7 During the last 5 years non-bank financing to enterprises was on average about 8% of total firm financing
(own calculations using data provided by the Bank of Greece Statistics Division). 8 This measure includes securitized loans and securitized bonds. In addition, a correction for write-offs,
foreign exchange valuation and reclassifications is implemented.
10
Exports are expressed in real terms, deflating the Bank of Greece series for exports of
goods (excluding oil and ships) by the producer price index for exports (basis
year=2000). The producer price index for exports excluding oil and ships (Bank of
Greece) is used. We have constructed an index measuring competition from third
countries and then we have removed seasonality with the method applied to the rest of the
series since data on competitors’ prices are provided by the Bank of Greece as seasonally
adjusted (with a different method than the one we have adopted). The index is computed
as a weighted average of quarterly unit labor cost indices and, if not available, consumer
price indices for Greece’s 28 major trading partners, extracted from OECD’s main
economic indicators database. The weights are based on imports and exports in
manufacturing (5-8 digits of SITC classification). An index of euro area import volumes
(basis year =2000) obtained from the CPB Netherlands Bureau for Economic Policy
analysis database approximates world demand.9 All data, except world demand (which is
available seasonally adjusted), are seasonally adjusted with the ratio to moving average
method.
5.2 Long-run export demand equations
We have adopted the two-step approach estimating cointegrating long-run
relationships first and then the dynamic short-run equations. A requirement of the long-
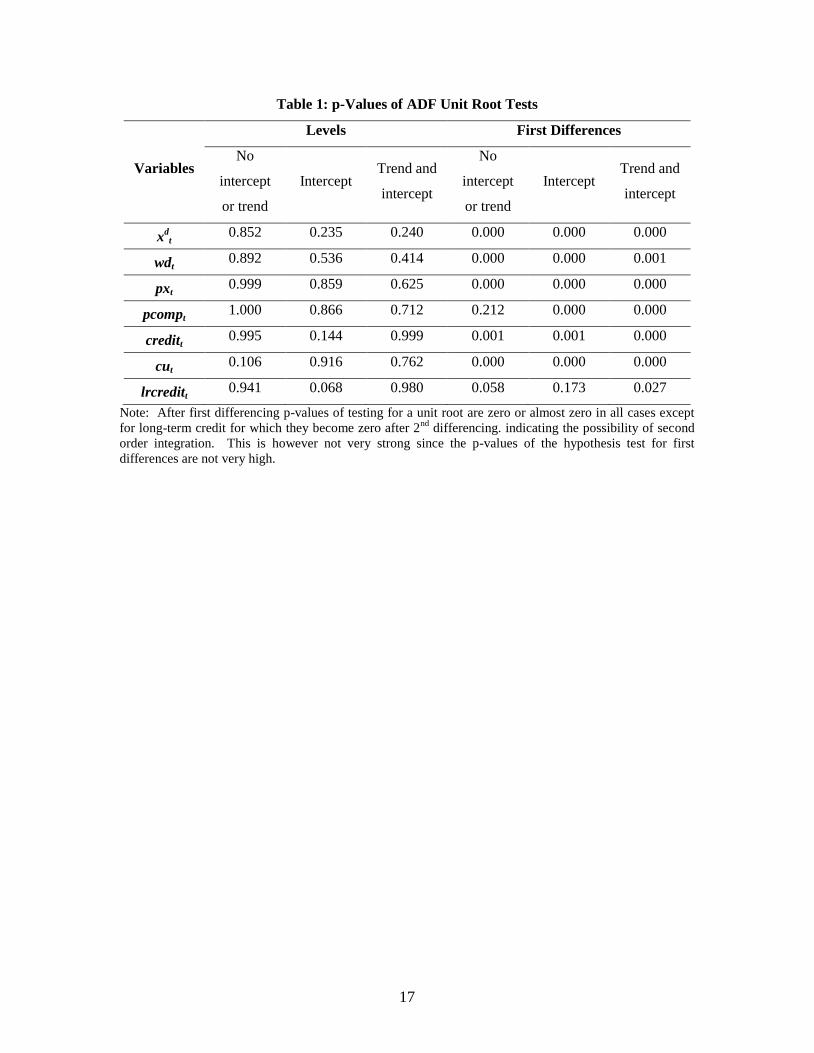
run estimation method is that all variables are integrated of order one. Table 1 shows the
results of the Augmented Dickey Fuller tests for integration of order one. The levels of all
the variables included in equations (1) and (2) have a unit root and their first differences
are stationary.10
The Johansen procedure is applied for the long-run estimation. The advantage of
this method is that it allows us to take into account endogeneity present in the exports-
finance relationship11
mentioned earlier. Given the strong positive association between
these two variables in our sample (ie, their correlation coefficient is 0.67) by making
bank finance endogenous we remove any reverse causality effects. In addition, world
9 In the estimation we tried a variety of different world demand measures such as weighted GDP referring
to OECD countries or Greece’s 28 more important trading partners. Since these did not generate
satisfactory results the above mentioned measure was finally adopted. 10
The same estimations were performed for the time period 2002:1-2011:4 and the results were not much
different from the ones presented. Adding the year 2012 to the sample led to estimates showing stronger
response of exports to the finance variable. This provides an additional robustness check. 11
See also Beck (2002) , Svaleryd & Vlachos (2005).
11
demand, capacity utilization and export prices are also considered endogenous since the
joint test for their weak exogeneity takes the value 6.828 (p-value: 0.077) leading to the
rejection of this hypothesis at the 5% level of significance. Similarly, the joint weak
exogeneity of finance, world demand and capacity utilization in the relative price
equations is rejected at 5% level of significance with a test statistic of 6.906 (p-
value:0.075). Competitors’ prices and relative prices were considered as weakly
exogenous given that the corresponding chi-square test statistics failed to reject the null
hypothesis of weak exogeneity taking values of 1.136 and 0.094, respectively.
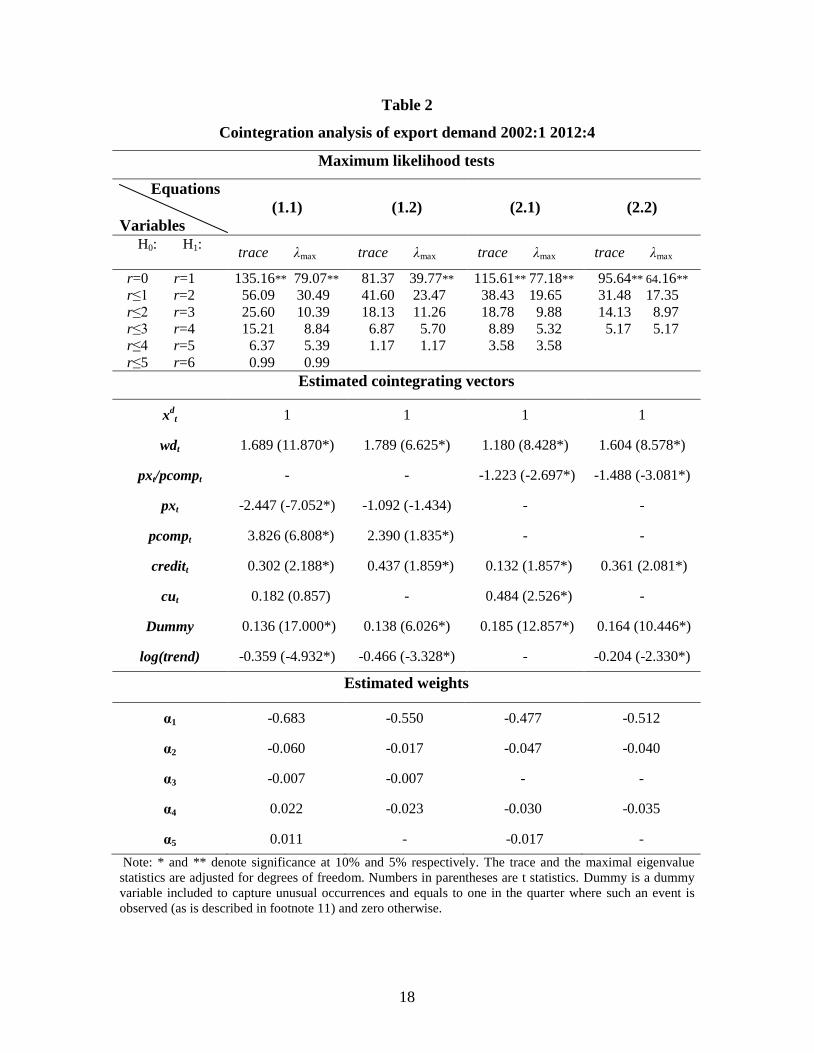
The upper part of Table 2 reports the trace and maximum eigenvalue statistics to
determine the cointegrating rank of the four specifications that result from (1) and (2)
which differ in respect to the addition or otherwise of capacity utilization. A lag length of
2 is adopted. These statistics support the existence of one cointegrating relationship in all
four cases at 5% level of statistical significance. The lower part of the table shows the
estimated coefficients that have the correct sign and their size conforms to theory and to
previous findings.12
All coefficients with the exception of that of competitors’ prices are
significant at the 10% level. The hypothesis that bank credit has an effect on export
performance is verified in all four specifications. It is shown that in the long run a 10%
increase in bank credit induces a 4% growth in exports in three out of four specifications
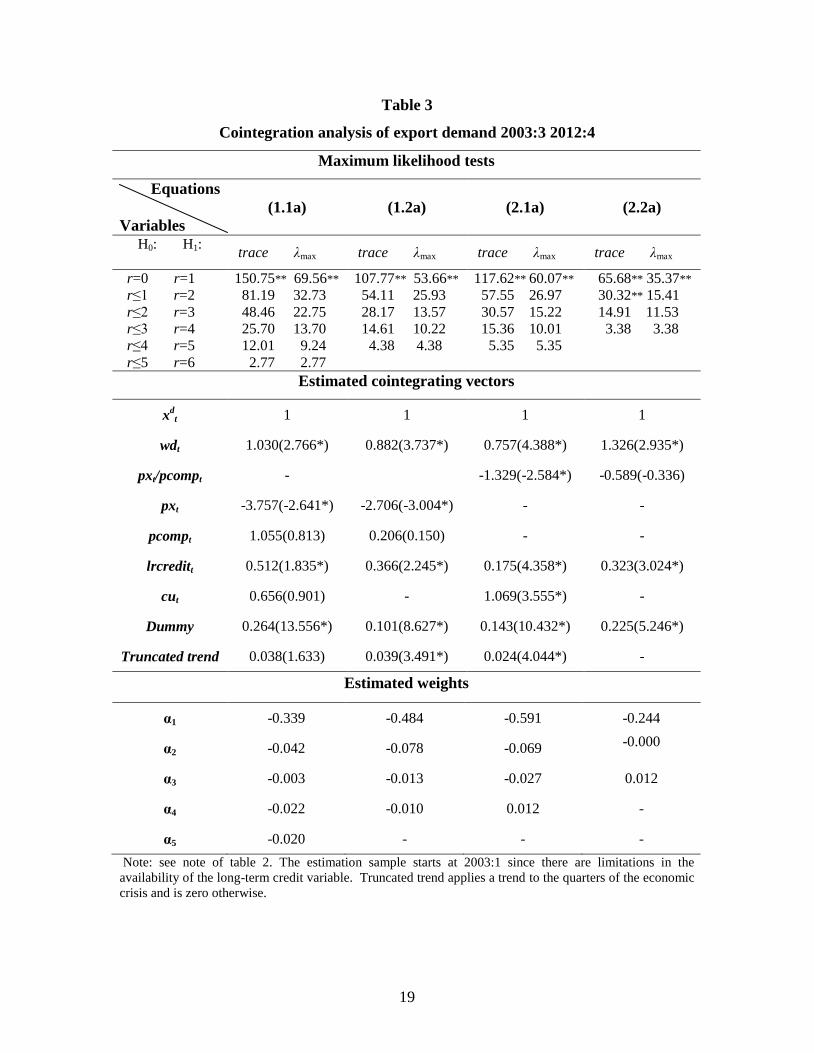
and 1% growth in the fourth. Table 3 presents the results of similar estimations including
long-term bank credit. Out of the twenty three estimated coefficients some turn out to be
insignificant, mainly those assigned to prices. The estimated elasticity of long-term credit
is of a similar magnitude compared with the total credit elasticity and it ranges between
0.2 and 0.5 and is significant in all four equations.
5.3 Short-run dynamic equations
We can use the results of the previously estimated cointegrating vectors to
determine the short-run relationships. We consider the same set of variables in the
dynamic equations as in the long-run estimation deriving four specifications and we use a
maximum of two lags. The results after dropping insignificant variables are presented in
12
Dummy variables are included to take into account the effect of the 2009-12 financial crisis, the mark-up
in raw material prices during 2006 and the 2004 Olympic games effect which prove to be significant in all
specifications.
12
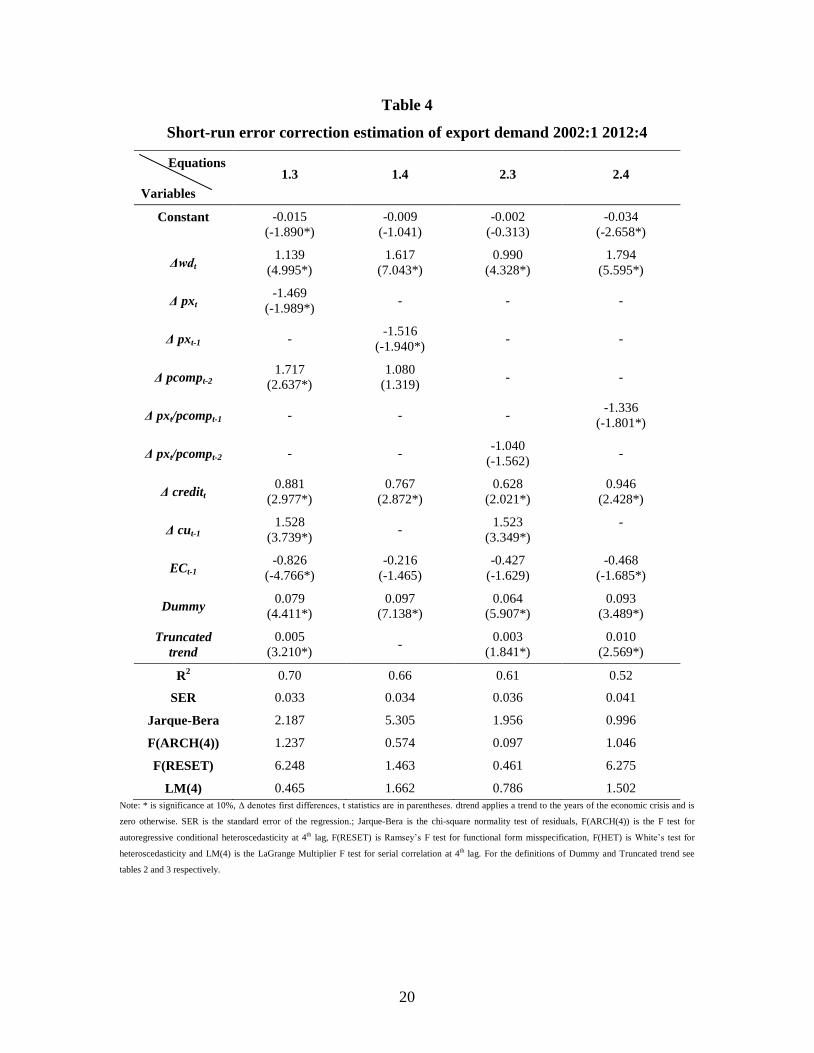
tables 4 and 5. The empirical validity of the estimations is confirmed using a variety of
diagnostic tests presented in these tables and it is shown that there is no significant
evidence of departure from standard assumptions. The adjusted coefficient of multiple
determination ranges between 60-90 percent showing strong explanatory power.
According to this criterion the best performing models are 1.3 1.3a and 2.3a the two of
which are with absolute prices and capacity utilization.
The effect of bank credit on exports is stronger and more stable in the short run.
The overall impact on export growth ranges between 0.6 and 0.9 and it should be noted
that it is immediate (the level is significant in all equations). That is, it takes a quarter or
three months for this effect to reach the above values. Accordingly, a 10% increase in
bank credit will lead to a 6-9 % increase in export growth within three months.
The error-correction coefficient is the same in the two relative price specifications
in table 4 (0.4). It is higher (0.8) in equations 1.3 and 1.3a and in the rest it averages 0.4.
That is 40 percent Greece’s export growth is attributed to disequilibrium existing during a
quarter or it takes about two quarters or six months for export growth to return to its long-
run equilibrium position which is a fast adjustment. Part of the disequilibrium is
explained by the credit effect.
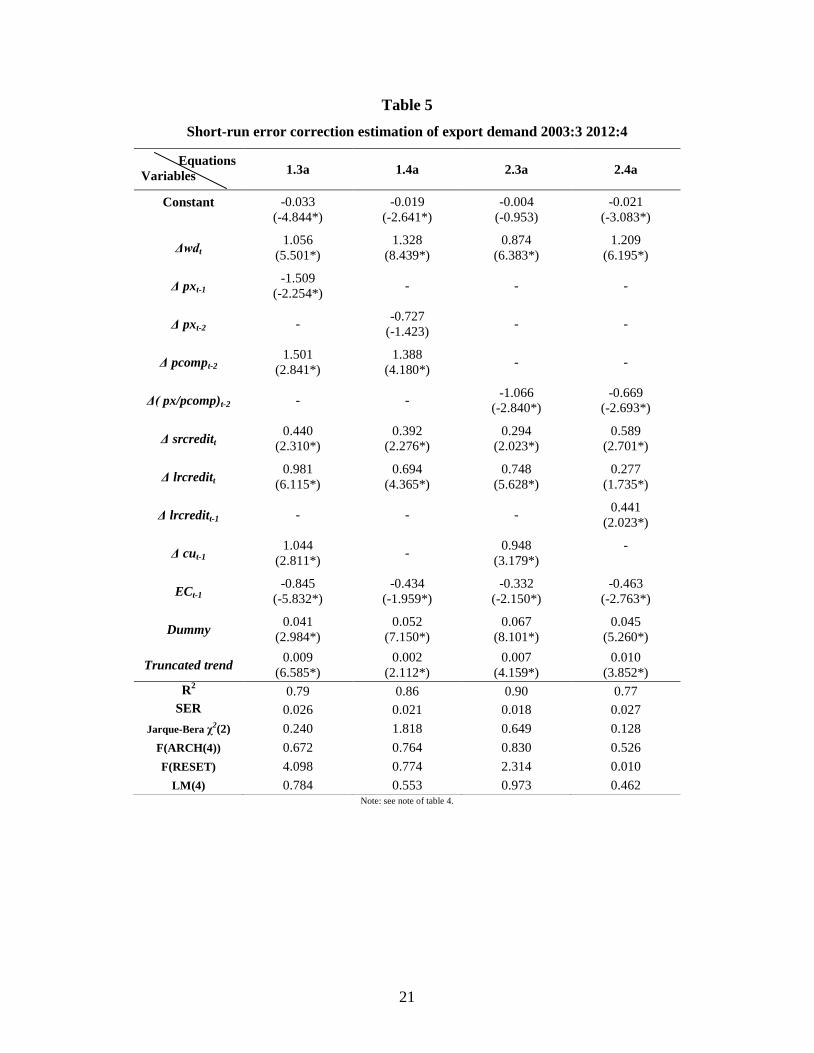
These short-run dynamic equations deserve additional attention since they allow
the separate inclusion of short-term and long-term bank credit as shown in Table 5. It is
notable that both these variables are significant (as with total credit) in all four
specifications.13
They all exhibit high significance at 1% and their effect on exports is
positive, robust to the alternative specifications and it ranges between 0.3 and 0.9 not
very different from the previously estimated total bank credit effect on export demand.
Regarding these estimations a result which appears consistently in the four specifications
is worth highlighting. The positive and significant effect of long-term credit on exports is
higher in the range of 0.9-0.7 than the effect of short-term credit, which ranges between
0.3 and 0.6. According to a recent study by Prete and Federico (2013) there is not much
said in the literature about the reason why this may be the case and in addition there is
little or no empirical work distinguishing the two effects The plausible explanation they
13
In addition, significance is achieved in all the coefficients of the variables included in the four
specifications, except for the export price coefficient in equation 1.4a which is marginally significant.
13
provide is that the effect of long-term loans is stronger because they usually finance
investment and by this way lead to the expansion of the firms’ capacity and higher
exports. On the other hand, short-term loans are mainly used for liquidity management
purposes to finance firms’ working capital and raw material imports which affect to a
smaller extend trade credit and exports.
6. Conclusions
This paper provides support for the hypothesis that firm financing has an impact
on export performance, in line with the existing literature. Using data referring to the last
decade for Greece we consider various specifications to ensure robustness. The relative
and absolute price versions of a reduced form of exports of goods are used and short-term
and long-term credit is treated separately. The main finding is that firm financing has a
positive impact on export performance both in the long and short run taking into account
reverse causality effects. This finding is also confirmed when short-term and long-term
credit effects are treated separately in the short run. The estimated elasticity in the short
run ranges between 0.6 and 0.9; that is, assuming a 10% drop in firm financing (given
that during a large part of the sample period credit flows have been declining), export
growth declines by 6-9%. By contrast, a 10% rise in firm financing would lead to a 6-9%
increase in nominal exports; such a rise in exports would be expected to add
approximately 1-2% to current GDP and consequently to economic growth.
14
References
Amity, M. and Weinstein D. E., 2009. “Exports and Financial Shocks”, Centre For
Economic Policy Research, Discussion Paper No. 7590.
Asmodson, I., Dorsey T., Khachatryan A., Niculcea I. and Sailo M., 2011. “Trade and
Trade Finance in the 2008-09 Financial Crisis”, International Monetary Fund Working
Paper 11/16.
Athukorala, P.C., and Suphachalasai S., 2004, “Post-crisis Export Performance in
Thailand” Asean Economic Bulletin, Vol.21 no.1.
Baldwin, R., 1989. “Sunk-Cost Hysteresis”, National Bureau of Economic Research
Working Paper 2911.
---------- and Krugman, P., 1989. “Persistent Trade Effects of Large Exchange Rate
Shocks”, The Quarterly Journal of Economics, Vol. 104, No. 4, pp.635-54.
Beck, T., 2002. “Financial Development and International Trade. Is There a Link?”,
Journal of International Economics, 57, 107-131.
Belke, A., Oeking A. and Setzer, R., 2013. “Exports and Capacity Constraints. A Smooth
Transition Regression Model for Six Euro Area Countries”, European Central Bank
Preliminary Draft.
Berman, N. and Héricourt, J., 2010. “Financial Factors and the Margins of Trade:
Evidence from Cross-Country Firm-Level Data”, Journal of Development Economics,
93, 206-217.
Chaney, T., 2013. “Liquidity Constrained Exporters”, National Bureau of Economic
Research Working Paper 19170.
Chor, D. and Manova, K., 2012. ”Off the Cliff and Back? Credit Conditions and
International Trade during the Global Financial Crisis”, Journal of International
Economics, 87, p.117-133.
Do, Q.-T., and Levchenko, A., 2007. “Comparative Advantage, Demand for External
Finance and Financial Development”, Journal of Financial Economics, 86(3), 796-834.
Esteves, P., S., and Rua A., 2013. “Is there a Role for Domestic Demand Pressure on
Export Performance?”, European Central Bank Working Paper Series, No. 1594.
Faini, R., 1994. “Export Supply, Capacity and Relative Prices”,Journal of Development
Economics, 45, 81-100.
15
Greenaway, D., Guariglia, A., and Kneller R., 2007. “Financial Factors and Exporting
Decisions”, Journal of International Economics, 73(2), 377-395.
Goldstein, M. and Khan M.S., 1985. “Income and Price Effects in Foreign Trade”, in
Jones R. and P. Kenen (eds.), Handbook of International Economics, Vol. 2, Amsterdam:
North-Holland.
--------------------------,1985. “Trade Demand and Supply”, in Jones R. and Kenen P.
(eds.), Handbook of International Economics, Vol2., Amsterdam:North-Holland.
Hur, J., Raj, M. and Riyanto Y., 2006. “Finance and Trade: A Cross-Country Empirical
Analysis on the Impact of Financial Development and Asset Tangibility on International
Trade”, World Development, 34(10), p. 1728.
Jongwanich, J., 2009. “Determinants of Export Performance in East and Southeast Asia”,
World Economy, 33(1), 20-41.
Johansen, S., 1991. “Estimation and Hypothesis Testing of Cointegration Vectors in
Gaussian Vector Autoregressive Models”, Econometrica, 59, 6, 1551-1580.
-------------- 1992a. “Testing Weak Exogeneity and the Order of Cointegration in
UK Money Demand Data,” Journal of Policy Modeling, vol. 14:3, 313-334.
--------------- 1992b. “Determination of Cointegration Rank in the Presence of a
Linear Trend”, Oxford Bulletin of Economics and Statistics, Vol. 54:2, 383-397.
-------------- and K. Juselius, 1990a. “Maximum Likelihood Estimation and
Inference on Cointegration – with Application on the Demand for Money”, Oxford
Bulletin of Economics and Statistics, 52, 169-210.
------------ 1990b. “Some Structural Hypotheses in a Multivariate Cointegration
Analysis of the Purchasing Power Parity and the Uncovered Interest Parity for UK”,
Institute of Mathematical Statistics, University of Copenhagen, February, Preprint
No.1.
Kletzer, K. and Bardhan P, 1987. “Credit Markets and Patterns of International Trade”,
Journal of Development Economics, 27, p.57-70.
Krugman, P. , 1989. Exchange Rate Instability, Cambridge: MIT Press.
Manova, K., 2013. “Credit Constraints, Heterogeneous Firms, and International Trade”,
Review of Economic Studies, 80, 711-744.
16
Manova, K., 2008. “Credit Constraints, Equity Market Liberalizations, and International
Trade”, Journal of International Economics, Vol.76, No.1, pp.33-47.
Melitz, M., 2003. “The Impact of Trade on Intra-Industry Reallocations and Aggregate
Industry Productivity”, Econometrica, 71(6):1695-1725.
Muûls, M., 2012. “Exporters, Importers and Credit Constraints”, Center for Economic
Performance Discussion Paper, No 1169.
Prete S. D., and Federico S., 2013. “Trade and finance: is there more than just “trade
finance”? Evidence from matched bank-firm data”, presented in the Ljubljana Empirical
Trade Conference, June 6-8.
Stern, R. M. , Francis J. and Schumacher B., 1976. Price elasticities in International
Trade, Macmillan of Canada, Toronto.
Svaleryd, H. and Vlachos, J., 2005. “Financial Markets, the Pattern of Industrial
Specialization and Comparative advantage: Evidence from OECD Countries”, European
Economic Review, 49 113-144.
17
Table 1: p-Values of ADF Unit Root Tests
Note: After first differencing p-values of testing for a unit root are zero or almost zero in all cases except
for long-term credit for which they become zero after 2nd
differencing. indicating the possibility of second
order integration. This is however not very strong since the p-values of the hypothesis test for first
differences are not very high.
Variables
Levels First Differences
No
intercept
or trend
Intercept Trend and
intercept
No
intercept
or trend
Intercept Trend and
intercept
xd
t 0.852 0.235 0.240 0.000 0.000 0.000
wdt 0.892 0.536 0.414 0.000 0.000 0.001
pxt 0.999 0.859 0.625 0.000 0.000 0.000
pcompt 1.000 0.866 0.712 0.212 0.000 0.000
creditt 0.995 0.144 0.999 0.001 0.001 0.000
cut 0.106 0.916 0.762 0.000 0.000 0.000
lrcreditt 0.941 0.068 0.980 0.058 0.173 0.027
18
Table 2
Cointegration analysis of export demand 2002:1 2012:4
Maximum likelihood tests
Equations
Variables
(1.1) (1.2) (2.1) (2.2)
H0: H1:
trace λmax trace λmax trace λmax trace λmax
r=0 r=1
r≤1 r=2
r≤2 r=3
r≤3 r=4
r≤4 r=5
r≤5 r=6
135.16** 79.07**
56.09 30.49
25.60 10.39
15.21 8.84
6.37 5.39
0.99 0.99
81.37 39.77**
41.60 23.47
18.13 11.26
6.87 5.70
1.17 1.17
115.61** 77.18**
38.43 19.65
18.78 9.88
8.89 5.32
3.58 3.58
95.64** 64.16**
31.48 17.35
14.13 8.97
5.17 5.17
Estimated cointegrating vectors
xdt 1 1 1 1
wdt 1.689 (11.870*) 1.789 (6.625*) 1.180 (8.428*) 1.604 (8.578*)
pxt/pcompt - - -1.223 (-2.697*) -1.488 (-3.081*)
pxt -2.447 (-7.052*) -1.092 (-1.434) - -
pcompt 3.826 (6.808*) 2.390 (1.835*) - -
creditt 0.302 (2.188*) 0.437 (1.859*) 0.132 (1.857*) 0.361 (2.081*)
cut 0.182 (0.857) - 0.484 (2.526*) -
Dummy 0.136 (17.000*) 0.138 (6.026*) 0.185 (12.857*) 0.164 (10.446*)
log(trend) -0.359 (-4.932*) -0.466 (-3.328*) - -0.204 (-2.330*)
Estimated weights
α1 -0.683 -0.550 -0.477 -0.512
α2 -0.060 -0.017 -0.047 -0.040
α3 -0.007 -0.007 - -
α4 0.022 -0.023 -0.030 -0.035
α5 0.011 - -0.017 -
Note: * and ** denote significance at 10% and 5% respectively. The trace and the maximal eigenvalue
statistics are adjusted for degrees of freedom. Numbers in parentheses are t statistics. Dummy is a dummy
variable included to capture unusual occurrences and equals to one in the quarter where such an event is
observed (as is described in footnote 11) and zero otherwise.
19
Table 3
Cointegration analysis of export demand 2003:3 2012:4
Maximum likelihood tests
Equations
Variables
(1.1a) (1.2a) (2.1a) (2.2a)
H0: H1:
trace λmax trace λmax trace λmax trace λmax
r=0 r=1
r≤1 r=2
r≤2 r=3
r≤3 r=4
r≤4 r=5
r≤5 r=6
150.75** 69.56**
81.19 32.73
48.46 22.75
25.70 13.70
12.01 9.24
2.77 2.77
107.77** 53.66**
54.11 25.93
28.17 13.57
14.61 10.22
4.38 4.38
117.62** 60.07**
57.55 26.97
30.57 15.22
15.36 10.01
5.35 5.35
65.68** 35.37**
30.32** 15.41
14.91 11.53
3.38 3.38
Estimated cointegrating vectors
xdt 1 1 1 1
wdt 1.030(2.766*) 0.882(3.737*) 0.757(4.388*) 1.326(2.935*)
pxt/pcompt - -1.329(-2.584*) -0.589(-0.336)
pxt -3.757(-2.641*) -2.706(-3.004*) - -
pcompt 1.055(0.813) 0.206(0.150) - -
lrcreditt 0.512(1.835*) 0.366(2.245*) 0.175(4.358*) 0.323(3.024*)
cut 0.656(0.901) - 1.069(3.555*) -
Dummy 0.264(13.556*) 0.101(8.627*) 0.143(10.432*) 0.225(5.246*)
Truncated trend 0.038(1.633) 0.039(3.491*) 0.024(4.044*) -
Estimated weights
α1 -0.339 -0.484 -0.591 -0.244
α2 -0.042 -0.078 -0.069 -0.000
α3 -0.003 -0.013 -0.027 0.012
α4 -0.022 -0.010 0.012 -
α5 -0.020 - - -
Note: see note of table 2. The estimation sample starts at 2003:1 since there are limitations in the
availability of the long-term credit variable. Truncated trend applies a trend to the quarters of the economic
crisis and is zero otherwise.
20
Table 4
Short-run error correction estimation of export demand 2002:1 2012:4
Equations
Variables
1.3 1.4 2.3 2.4
Constant -0.015
(-1.890*)
-0.009
(-1.041)
-0.002
(-0.313)
-0.034
(-2.658*)
Δwdt
1.139
(4.995*)
1.617
(7.043*)
0.990
(4.328*)
1.794
(5.595*)
Δ pxt -1.469
(-1.989*) - - -
Δ pxt-1 - -1.516
(-1.940*) - -
Δ pcompt-2
1.717
(2.637*)
1.080
(1.319) - -
Δ pxt/pcompt-1 - - - -1.336
(-1.801*)
Δ pxt/pcompt-2 - - -1.040
(-1.562) -
Δ creditt 0.881
(2.977*)
0.767
(2.872*)
0.628
(2.021*)
0.946
(2.428*)
Δ cut-1
1.528
(3.739*) -
1.523
(3.349*)
-
ECt-1
-0.826
(-4.766*)
-0.216
(-1.465)
-0.427
(-1.629)
-0.468
(-1.685*)
Dummy 0.079
(4.411*)
0.097
(7.138*)
0.064
(5.907*)
0.093
(3.489*)
Truncated
trend
0.005
(3.210*) -
0.003
(1.841*)
0.010
(2.569*)
R2 0.70 0.66 0.61 0.52
SER 0.033 0.034 0.036 0.041
Jarque-Bera
χ2(2)
2.187 5.305 1.956 0.996
F(ARCH(4)) 1.237 0.574 0.097 1.046
F(RESET) 6.248 1.463 0.461 6.275
LM(4) 0.465 1.662 0.786 1.502
Note: * is significance at 10%, Δ denotes first differences, t statistics are in parentheses. dtrend applies a trend to the years of the economic crisis and is
zero otherwise. SER is the standard error of the regression.; Jarque-Bera is the chi-square normality test of residuals, F(ARCH(4)) is the F test for
autoregressive conditional heteroscedasticity at 4th lag, F(RESET) is Ramsey’s F test for functional form misspecification, F(HET) is White’s test for
heteroscedasticity and LM(4) is the LaGrange Multiplier F test for serial correlation at 4th lag. For the definitions of Dummy and Truncated trend see
tables 2 and 3 respectively.
21
Table 5
Short-run error correction estimation of export demand 2003:3 2012:4
Note: see note of table 4.
Equations
Variables
Variables
1.3a 1.4a 2.3a 2.4a
Constant -0.033
(-4.844*)
-0.019
(-2.641*)
-0.004
(-0.953)
-0.021
(-3.083*)
Δwdt
1.056
(5.501*)
1.328
(8.439*)
0.874
(6.383*)
1.209
(6.195*)
Δ pxt-1 -1.509
(-2.254*) - - -
Δ pxt-2 - -0.727
(-1.423) - -
Δ pcompt-2
1.501
(2.841*)
1.388
(4.180*) - -
Δ( px/pcomp)t-2 - - -1.066
(-2.840*)
-0.669
(-2.693*)
Δ srcreditt 0.440
(2.310*)
0.392
(2.276*)
0.294
(2.023*)
0.589
(2.701*)
Δ lrcreditt 0.981
(6.115*)
0.694
(4.365*)
0.748
(5.628*)
0.277
(1.735*)
Δ lrcreditt-1 - - - 0.441
(2.023*)
Δ cut-1
1.044
(2.811*) -
0.948
(3.179*)
-
ECt-1
-0.845
(-5.832*)
-0.434
(-1.959*)
-0.332
(-2.150*)
-0.463
(-2.763*)
Dummy 0.041
(2.984*)
0.052
(7.150*)
0.067
(8.101*)
0.045
(5.260*)
Truncated trend 0.009
(6.585*)
0.002
(2.112*)
0.007
(4.159*)
0.010
(3.852*)
R2
0.79 0.86 0.90 0.77
SER
0.026 0.021 0.018 0.027
Jarque-Bera χ2(2) 0.240 1.818 0.649 0.128
F(ARCH(4)) 0.672 0.764 0.830 0.526
F(RESET) 4.098 0.774 2.314 0.010
LM(4) 0.784 0.553 0.973 0.462

22
23
BANK OF GREECE WORKING PAPERS
151. Brissimis, N. S. and P. M. Migiakis, “Inflation Persistence and the Rationality of
Inflation Expectations”, January 2013.
152. Tagkalakis, O. A., “Audits and Tax Offenders: Recent Evidence from Greece”,
February 2013.
153. Bageri, V., Y. Katsoulacos, and G.Spagnolo, “The Distortive Effects of Antitrust
Fines Based on Revenue”, February 2013.
154. Louzis, P. D., “Measuring Return and Volatility Spillovers in Euro Area Financial
Markets”, March 2013
155. Louzis, P. D., and A.T. Vouldis,“A Financial Systemic Stress Index for Greece”,
March 2013.
156. Nicolitsas, D., “Price Setting Practices in Greece: Evidence From a Small-Scale
Firm-Level Survey”, April 2013
157. Bragoudakis, G. Z., S.T. Panagiotou and H. A. Thanopoulou, “Investment
Strategy and Greek Shipping Earnings: Exploring The Pre & Post "Ordering-
Frenzy" Period”, April 2013.
158. Kasselaki, Th. M. and O, Tagkalakis, “Financial Soundness Indicators and
Financial Crisis Episodes”, April 2013.
159. Bardakas, C.I., “The Asymmetric Effect of Income on Import Demand in
Greece”, May 2013.
160. Chassamboulli, A., and T. Palivos, “The Impact of Immigration on the
Employment and Wages of Native Workers”, June 2013.
161. Degiannakis, S., G. Filis, and R. Kizys, “Oil Price Shocks and Stock Market
Volatility: Evidence from European Data”, September 2013.
162. Koutsomanoli-Filippaki, A., and E. Mamatzakis, “How Labour Market
Regulation Shapes Bank Performance in EU-15 Countries?”, September 2013.
163. Koukouritakis,M., A.P. Papadopoulos., and A. Yannopoulos, “Linkages Between
The Eurozone and the South-Eastern European Countries: A Global VAR
Analysis”, October 2013.
164. Charalambakis, C. E., “On the Prediction of Corporate Financial Distress in the
Light of the Financial Crisis: Empirical Evidence from Greek Listed Firms”,
October 2013.
165. Dimelis, S., I. Giotopoulos and H. Louri, “The Credit Crunch and Firm Growth in
the Euro Area: 2005-2011. A Quantile Panel Analysis”, November 2013.
24
166. Degiannakis, S, A. Andrikopoulos, T. Angelidis, and, C. Floros “Return
Dispersion, Stock Market Liquidity and Aggregate Economic Activity”,
November 2013.
167. Tagkalakis O. A. “The Output Effects of Systematic and Non-Systematic Fiscal
Policy Changes in Greece”, November 2013.
168. Palaiodimos T. G., “Putting the EMU Integration Into a New Perspective: the
Case of Capital Market Holdings”, December 2013.
169. Tagkalakis, O.A., “Discretionary Fiscal Policy and Economic Activity in Greece”,
December 2013.
170. Degiannakis, S. T. Angelidis, and G. Filis, “Oil Price Shocks and Volatility Do
Predict Stock Market Regimes, December 2013.
171. Tagkalakis, O. A., “Assessing the Variability of Indirect Tax Elasticity in
Greece”, January 2014.
172. Koukouritakis, M., A.P. Papadopoulos and A.Yannopoulos, “Transmission Effects In
The Presence of Structural Breaks: Evidence from South-Eastern European
Countries”, January 2014.
173. Du Caju, P., T. Kosma, M. Lawless, J. Messina, T. Rõõm, Why Firms Avoid
Cutting Wages: Survey Evidence From European Firms”, January 2014.
174. Mitrakos, T., “Inequality, Poverty and Social Welfare in Greece: Distributional
Effects of Austerity”, February 2014.
175. Lazaretou, S., “Η Έξυπνη Οικονομία: «Πολιτιστικές» και «Δημιουργικές»
Βιομηχανίες Στην Ελλάδα Μπορούν Να Αποτελέσουν Προοπτική Εξόδου Από
Την Κρίση”, February 2014.
176. Chouliarakis, G., and S. Lazaretou, “Déjà Vu? The Greek Crisis Experience, the
2010s Versus the 1930s. Lessons From History”, February 2014.
177. Tavlas, G.S., “In Old Chicago: Simons, Friedman and The Development of
Monetary-Policy Rules”, March 2014.