Vibration measurement of rotating blades using a...
26
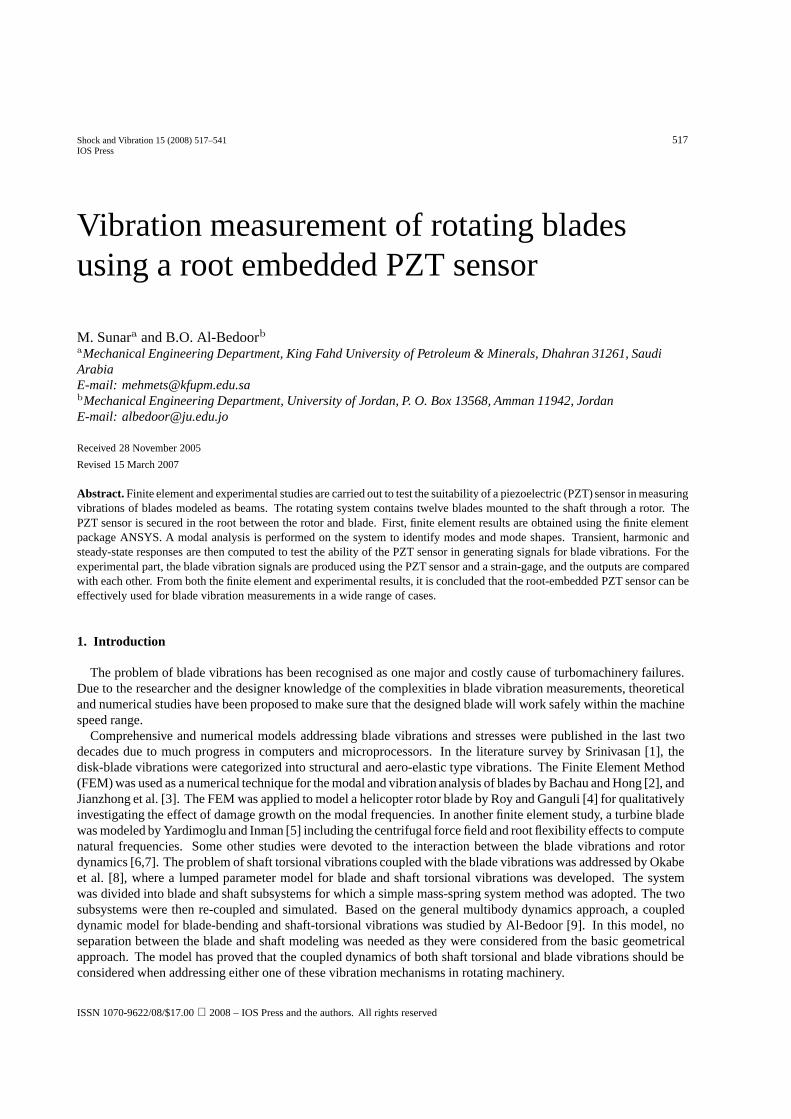
Shock and Vibration 15 (2008) 517–541 517 IOS Press Vibration measurement of rotating blades using a root embedded PZT sensor M. Sunar a and B.O. Al-Bedoor b a Mechanical Engineering Department, King Fahd University of Petroleum & Minerals, Dhahran 31261, Saudi Arabia E-mail: [email protected] b Mechanical Engineering Department, University of Jordan, P. O. Box 13568, Amman 11942, Jordan E-mail: [email protected] Received 28 November 2005 Revised 15 March 2007 Abstract. Finite element and experimental studies are carried out to test the suitability of a piezoelectric (PZT) sensor in measuring vibrations of blades modeled as beams. The rotating system contains twelve blades mounted to the shaft through a rotor. The PZT sensor is secured in the root between the rotor and blade. First, finite element results are obtained using the finite element package ANSYS. A modal analysis is performed on the system to identify modes and mode shapes. Transient, harmonic and steady-state responses are then computed to test the ability of the PZT sensor in generating signals for blade vibrations. For the experimental part, the blade vibration signals are produced using the PZT sensor and a strain-gage, and the outputs are compared with each other. From both the finite element and experimental results, it is concluded that the root-embedded PZT sensor can be effectively used for blade vibration measurements in a wide range of cases. 1. Introduction The problem of blade vibrations has been recognised as one major and costly cause of turbomachinery failures. Due to the researcher and the designer knowledge of the complexities in blade vibration measurements, theoretical and numerical studies have been proposed to make sure that the designed blade will work safely within the machine speed range. Comprehensive and numerical models addressing blade vibrations and stresses were published in the last two decades due to much progress in computers and microprocessors. In the literature survey by Srinivasan [1], the disk-blade vibrations were categorized into structural and aero-elastic type vibrations. The Finite Element Method (FEM) was used as a numerical technique for the modal and vibration analysis of blades by Bachau and Hong [2], and Jianzhong et al. [3]. The FEM was applied to model a helicopter rotor blade by Roy and Ganguli [4] for qualitatively investigating the effect of damage growth on the modal frequencies. In another finite element study, a turbine blade was modeled by Yardimoglu and Inman [5] including the centrifugal force field and root flexibility effects to compute natural frequencies. Some other studies were devoted to the interaction between the blade vibrations and rotor dynamics [6,7]. The problem of shaft torsional vibrations coupled with the blade vibrations was addressed by Okabe et al. [8], where a lumped parameter model for blade and shaft torsional vibrations was developed. The system was divided into blade and shaft subsystems for which a simple mass-spring system method was adopted. The two subsystems were then re-coupled and simulated. Based on the general multibody dynamics approach, a coupled dynamic model for blade-bending and shaft-torsional vibrations was studied by Al-Bedoor [9]. In this model, no separation between the blade and shaft modeling was needed as they were considered from the basic geometrical approach. The model has proved that the coupled dynamics of both shaft torsional and blade vibrations should be considered when addressing either one of these vibration mechanisms in rotating machinery. ISSN 1070-9622/08/$17.00 2008 – IOS Press and the authors. All rights reserved
Transcript of Vibration measurement of rotating blades using a...
Shock and Vibration 15 (2008) 517–541 517IOS Press
Vibration measurement of rotating bladesusing a root embedded PZT sensor
M. Sunara and B.O. Al-BedoorbaMechanical Engineering Department, King Fahd University of Petroleum & Minerals, Dhahran 31261, SaudiArabiaE-mail: [email protected] Engineering Department, University of Jordan, P. O. Box 13568, Amman 11942, JordanE-mail: [email protected]
Received 28 November 2005
Revised 15 March 2007
Abstract. Finite element and experimental studies are carried out to test the suitability of a piezoelectric (PZT) sensor in measuringvibrations of blades modeled as beams. The rotating system contains twelve blades mounted to the shaft through a rotor. ThePZT sensor is secured in the root between the rotor and blade. First, finite element results are obtained using the finite elementpackage ANSYS. A modal analysis is performed on the system to identify modes and mode shapes. Transient, harmonic andsteady-state responses are then computed to test the ability of the PZT sensor in generating signals for blade vibrations. For theexperimental part, the blade vibration signals are produced using the PZT sensor and a strain-gage, and the outputs are comparedwith each other. From both the finite element and experimental results, it is concluded that the root-embedded PZT sensor can beeffectively used for blade vibration measurements in a wide range of cases.
1. Introduction
The problem of blade vibrations has been recognised as one major and costly cause of turbomachinery failures.Due to the researcher and the designer knowledge of the complexities in blade vibration measurements, theoreticaland numerical studies have been proposed to make sure that the designed blade will work safely within the machinespeed range.
Comprehensive and numerical models addressing blade vibrations and stresses were published in the last twodecades due to much progress in computers and microprocessors. In the literature survey by Srinivasan [1], thedisk-blade vibrations were categorized into structural and aero-elastic type vibrations. The Finite Element Method(FEM) was used as a numerical technique for the modal and vibration analysis of blades by Bachau and Hong [2], andJianzhong et al. [3]. The FEM was applied to model a helicopter rotor blade by Roy and Ganguli [4] for qualitativelyinvestigating the effect of damage growth on the modal frequencies. In another finite element study, a turbine bladewas modeled by Yardimoglu and Inman [5] including the centrifugal force field and root flexibility effects to computenatural frequencies. Some other studies were devoted to the interaction between the blade vibrations and rotordynamics [6,7]. The problem of shaft torsional vibrations coupled with the blade vibrations was addressed by Okabeet al. [8], where a lumped parameter model for blade and shaft torsional vibrations was developed. The systemwas divided into blade and shaft subsystems for which a simple mass-spring system method was adopted. The twosubsystems were then re-coupled and simulated. Based on the general multibody dynamics approach, a coupleddynamic model for blade-bending and shaft-torsional vibrations was studied by Al-Bedoor [9]. In this model, noseparation between the blade and shaft modeling was needed as they were considered from the basic geometricalapproach. The model has proved that the coupled dynamics of both shaft torsional and blade vibrations should beconsidered when addressing either one of these vibration mechanisms in rotating machinery.
ISSN 1070-9622/08/$17.00 2008 – IOS Press and the authors. All rights reserved
518 M. Sunar and B.O. Al-Bedoor / Vibration measurement of rotating blades using a root embedded PZT sensor
Despite difficulties in measuring vibrations of rotating blades, many researchers and manufacturers have investedtheir efforts in developing techniques for blade vibration measurements due to the importance of the problem. Astudy for the analysis and solution of a non-synchronous vibration problem in the last row turbine blade of a largeindustrial combustion turbine was reported by Scalzo et al. [10]. Blade vibrations signals were transmitted fromstrain gages using a telemetry system. Slip rings were not used, because they are known to produce much noiseinto the signal. Strain gages were also used by Tang and Dowell [11] for blade vibration measurements in theirexperimental set-up. Experimental results on the vibration measurements of rotating blades via a telemetry systemwere reported by Fan et al. [9]. A theoretical and experimental study on blade stresses under constant speed andtransient conditions with non-linear damping was carried out by Rao and Vyas [12]. Tri-axial set strain gagesnear the blade root were used and the signal was processed through a slip-ring mechanism. Optimal placement ofstrain gages for rotating blade vibrations was studied by Szwedowicz et al. [13]. The optimum gage positions werebased on sensitivity, orthogonality gradient and distance criteria. To this end one recognizes the wide use of straingages in measuring blade vibrations. Some problems associated with the use of strain gages for the blade vibrationmeasurements can be identified as: (1) where to locate the strain gages rosettes when dealing with an actual bladeof complex shape, (2) how to transmit the signal to be further processed and analyzed, and (4) how long strain gagesrosettes are going to survive.
Laser-doppler and optical measuring methods are also utilized in vibration measurement systems. A fibre-opticlaser-doppler probe was proposed by Cookson and Bandyopadhyay [14] for the vibration analysis of rotatingmachines. The main limitation of this study is that the technique depends on frequency shifting that limits therotating speed. Vibration measurement of a naval propeller rotating in water using a tracking laser vibrometer wasperformed by Castellini and Santolini [15], where the following troubles were encountered: Firstly, the experimentswere confined to a low speed of about 600 revolutions per minute. Then, the laser “speckle” was producing noisethat was greater than the vibration signal itself. Moreover, the problems of changing of the refraction-index, formingof water bubbles and absorption of light were observed. Finally, the problem of misalignment between the rotationalaxis and the laser vibrometer was also noticed. Despite these problems it was reported that the bending is thedominant vibration mode in rotating blades.
The approach of indirect measurements has been known for a long time [16]. Accelerometers at the casing ofa compressor near the blade tips were attached by Mathioudakis et al. [17] to measure the blade vibrations. Thecollected vibration signals are rich in frequency contents. This method has shown a great deal of uncertainties whenblade vibrations are to be monitored, as a result of the contribution of almost all working fluid and machine types ofinstabilities in addition to the acoustical and housing/foundation problems.
These investigations with the theoretical work of Al-Bedoor [18] indicate that the blade vibration monitoring viatorsional vibration measurements is a promising technique. However, torsional vibration measurement techniquesare many and are still in the development stage from both the aspects of pick-ups and data processing tools. Hence,the need of finding a more direct technique for blade vibration measurements is much in demand and the utilization ofnew materials for sensors like piezoelectric materials for this purpose is very attractive. The piezoelectric materialshave been used as sensors for a long time in vastly different areas and the corresponding technologies have beenwell-developed. The survey paper by Sunar and Rao [19] reports on the phenomenon of piezoelectricity andvarious applications of piezoelectric materials. Some of the advantages of these materials can be listed as durability,sensitivity, precision and high frequency bandwidth, which are important for the blade vibration measurements.Therefore, motivated by the favourable characteristics of piezoelectric materials, this study aims at investigating thesuitability of a piezoeceramic (PZT) material in sensing and measuring the blade vibrations of a rotating system.The material (sensor) is placed at the root of one of twelve blades of the system. The numerical part reports on thefinite element modeling and analysis aspects using the ANSYS software [20]. The measurements are made usingthe PZT material, a strain-gage system, a casing accelerometer and a vertical proximity probe, but the results arereported only for the PZT material and the strain gage system due to space limitations.
2. Finite element part
2.1. Modal analysis
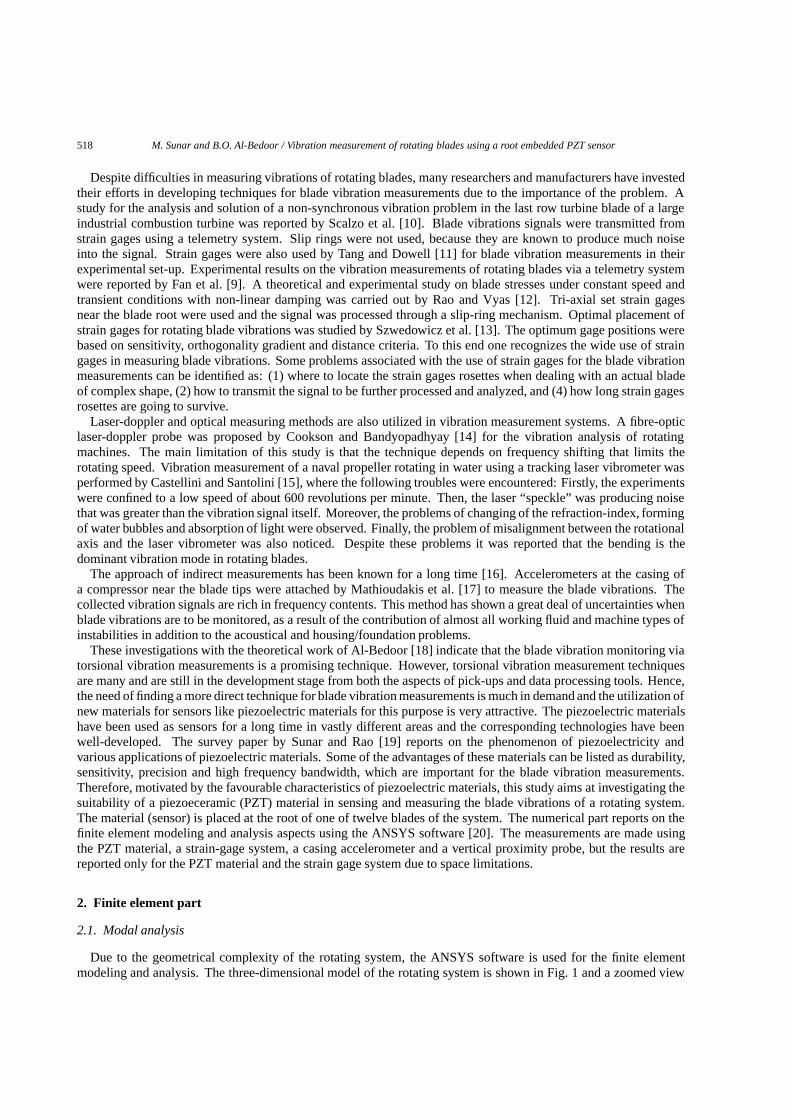
Due to the geometrical complexity of the rotating system, the ANSYS software is used for the finite elementmodeling and analysis. The three-dimensional model of the rotating system is shown in Fig. 1 and a zoomed view
M. Sunar and B.O. Al-Bedoor / Vibration measurement of rotating blades using a root embedded PZT sensor 519
Table 1Material properties
PZT Sensor (BM500 or PZT-5A):Mass density= ρ = 7500 (kg/m3)
Elasticity matrix= c =
12.6 8.41 7.95 0 0 011.7 8.41 0 0 0
12.6 0 0 02.3 0 0
sym. 2.3 02.35
× 1010(Pa)
Dielectric matrix= ε =
[1.151 0 0
0 1.043 00 0 1.151
]× 10−3 (F/m)
Piezoelectric matrix= e=
0 −5.4 00 15.8 00 −5.4 0
12.3 0 00 0 12.30 0 0
(C/m2)
Shaft, disk and blades (steel):Mass density= ρ = 7800 (kg/m3)Young’s modulus= Y = 2.07× 10¹¹ (Pa)
Table 2Dimensions
PZT Sensor:Length= 0.025 m, square cross-section of 0.005× 0.005 m.
Shaft:Length= 0.17 m, diameter= 0.016 m.
Disk:Width = 0.045 m, diameter= 0.126 m.
Blade:Length= 0.127 m, thickness= 0.001 m.
Fig. 1. Rotating system.
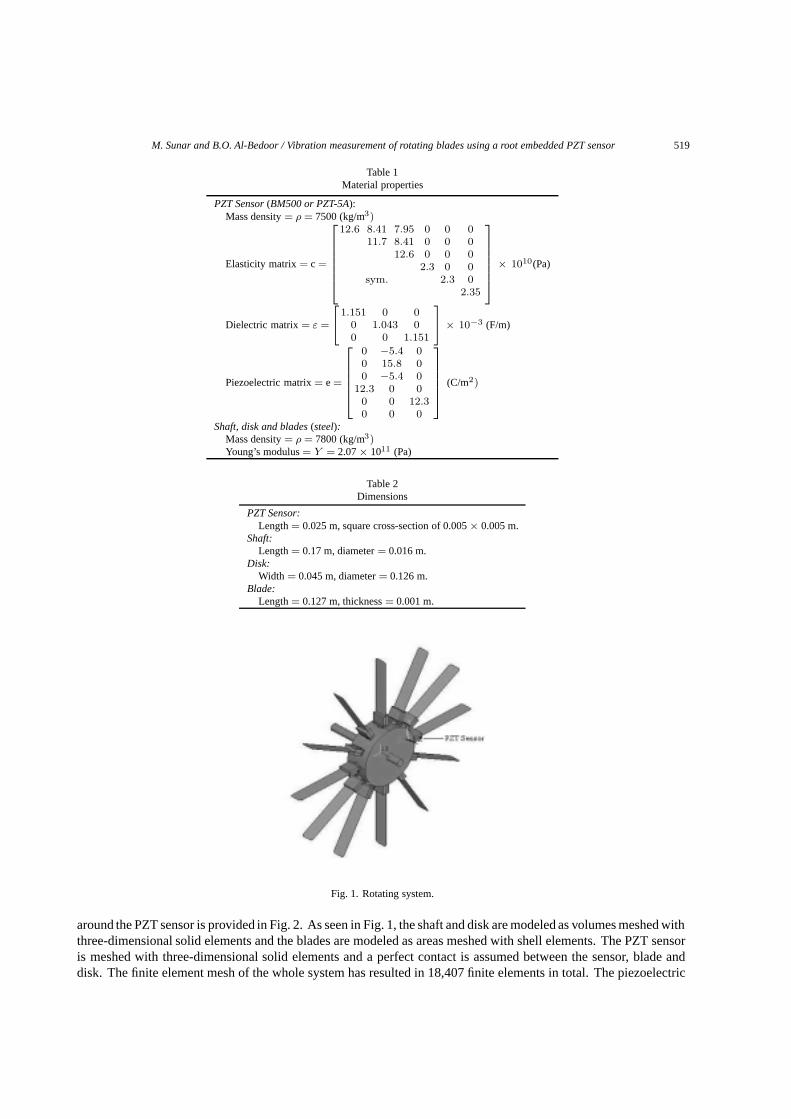
around the PZT sensor is provided in Fig. 2. As seen in Fig. 1, the shaft and disk are modeled as volumes meshed withthree-dimensional solid elements and the blades are modeled as areas meshed with shell elements. The PZT sensoris meshed with three-dimensional solid elements and a perfect contact is assumed between the sensor, blade anddisk. The finite element mesh of the whole system has resulted in 18,407 finite elements in total. The piezoelectric
520 M. Sunar and B.O. Al-Bedoor / Vibration measurement of rotating blades using a root embedded PZT sensor
Fig. 2. PZT sensor zoomed.
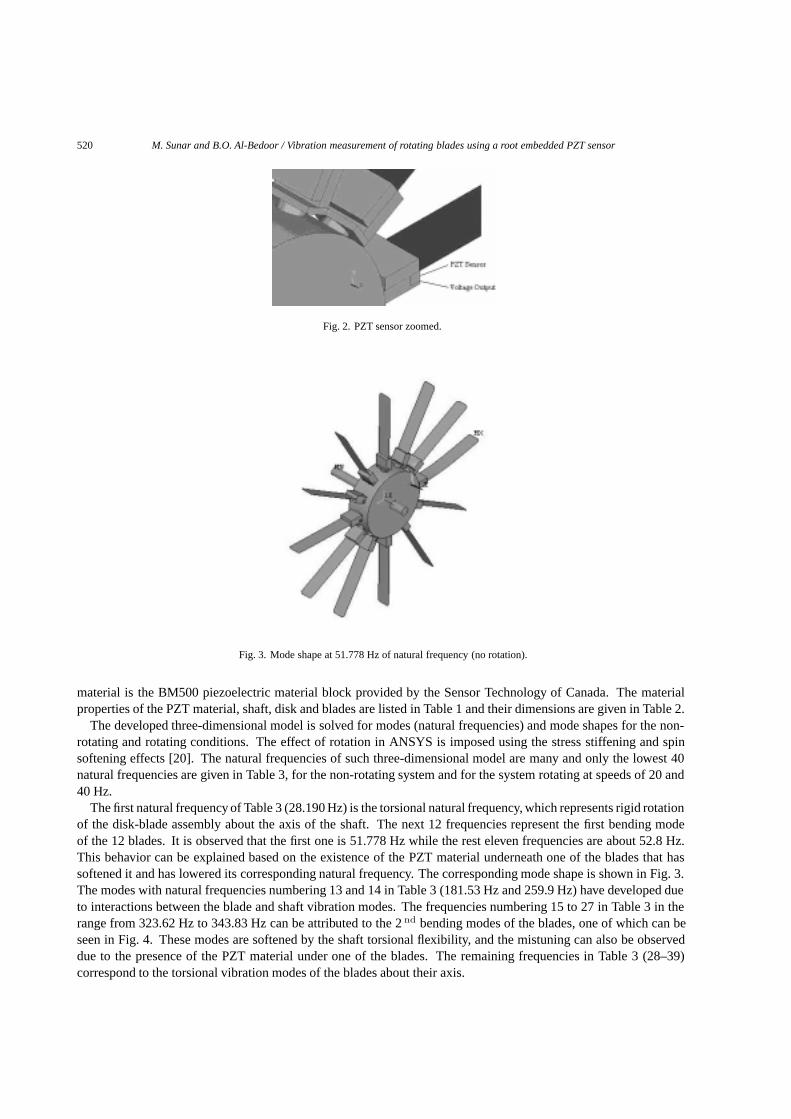
Fig. 3. Mode shape at 51.778 Hz of natural frequency (no rotation).
material is the BM500 piezoelectric material block provided by the Sensor Technology of Canada. The materialproperties of the PZT material, shaft, disk and blades are listed in Table 1 and their dimensions are given in Table 2.
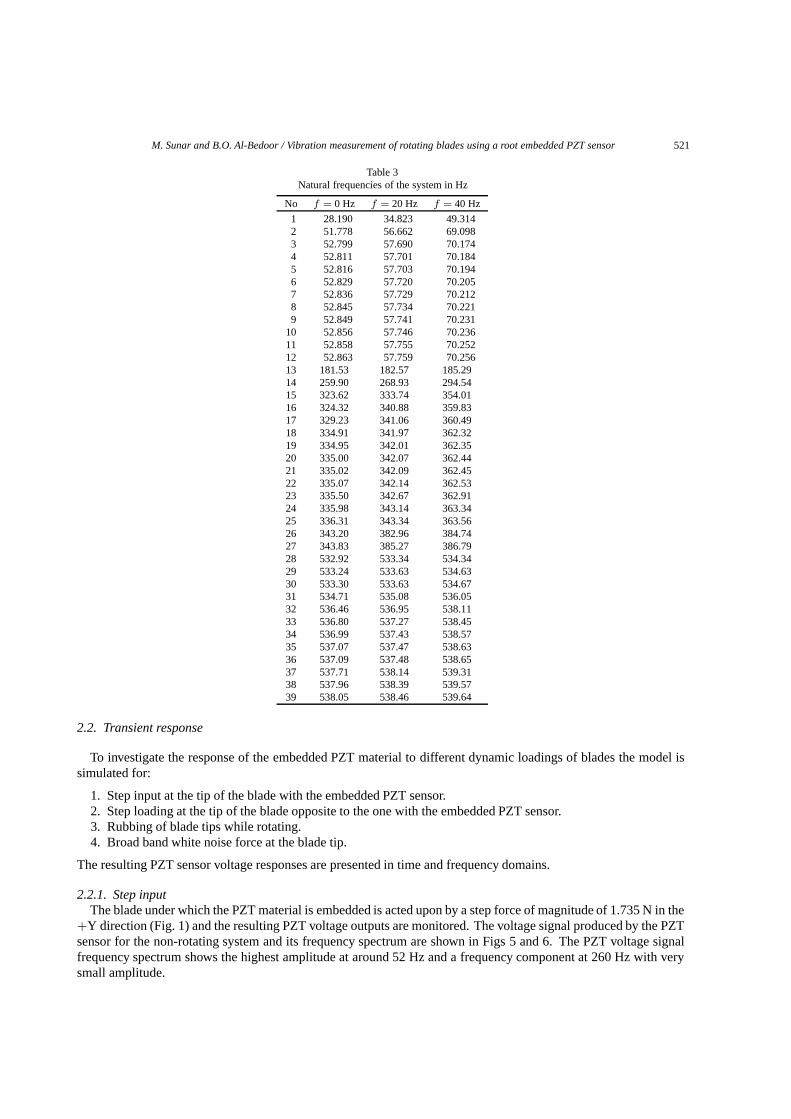
The developed three-dimensional model is solved for modes (natural frequencies) and mode shapes for the non-rotating and rotating conditions. The effect of rotation in ANSYS is imposed using the stress stiffening and spinsoftening effects [20]. The natural frequencies of such three-dimensional model are many and only the lowest 40natural frequencies are given in Table 3, for the non-rotating system and for the system rotating at speeds of 20 and40 Hz.
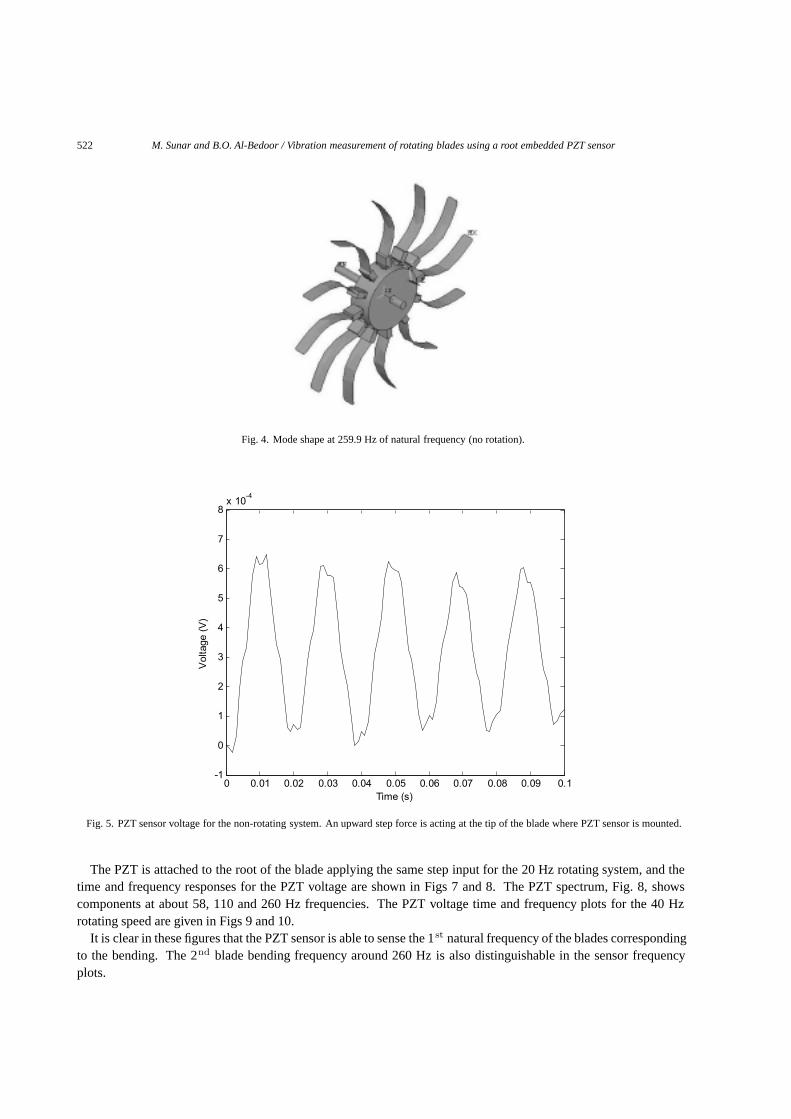
The first natural frequency of Table 3 (28.190 Hz) is the torsional natural frequency, which represents rigid rotationof the disk-blade assembly about the axis of the shaft. The next 12 frequencies represent the first bending modeof the 12 blades. It is observed that the first one is 51.778 Hz while the rest eleven frequencies are about 52.8 Hz.This behavior can be explained based on the existence of the PZT material underneath one of the blades that hassoftened it and has lowered its corresponding natural frequency. The corresponding mode shape is shown in Fig. 3.The modes with natural frequencies numbering 13 and 14 in Table 3 (181.53 Hz and 259.9 Hz) have developed dueto interactions between the blade and shaft vibration modes. The frequencies numbering 15 to 27 in Table 3 in therange from 323.62 Hz to 343.83 Hz can be attributed to the 2nd bending modes of the blades, one of which can beseen in Fig. 4. These modes are softened by the shaft torsional flexibility, and the mistuning can also be observeddue to the presence of the PZT material under one of the blades. The remaining frequencies in Table 3 (28–39)correspond to the torsional vibration modes of the blades about their axis.
M. Sunar and B.O. Al-Bedoor / Vibration measurement of rotating blades using a root embedded PZT sensor 521
Table 3Natural frequencies of the system in Hz
No f = 0 Hz f = 20 Hz f = 40 Hz
1 28.190 34.823 49.3142 51.778 56.662 69.0983 52.799 57.690 70.1744 52.811 57.701 70.1845 52.816 57.703 70.1946 52.829 57.720 70.2057 52.836 57.729 70.2128 52.845 57.734 70.2219 52.849 57.741 70.231
10 52.856 57.746 70.23611 52.858 57.755 70.25212 52.863 57.759 70.25613 181.53 182.57 185.2914 259.90 268.93 294.5415 323.62 333.74 354.0116 324.32 340.88 359.8317 329.23 341.06 360.4918 334.91 341.97 362.3219 334.95 342.01 362.3520 335.00 342.07 362.4421 335.02 342.09 362.4522 335.07 342.14 362.5323 335.50 342.67 362.9124 335.98 343.14 363.3425 336.31 343.34 363.5626 343.20 382.96 384.7427 343.83 385.27 386.7928 532.92 533.34 534.3429 533.24 533.63 534.6330 533.30 533.63 534.6731 534.71 535.08 536.0532 536.46 536.95 538.1133 536.80 537.27 538.4534 536.99 537.43 538.5735 537.07 537.47 538.6336 537.09 537.48 538.6537 537.71 538.14 539.3138 537.96 538.39 539.5739 538.05 538.46 539.64
2.2. Transient response
To investigate the response of the embedded PZT material to different dynamic loadings of blades the model issimulated for:
1. Step input at the tip of the blade with the embedded PZT sensor.2. Step loading at the tip of the blade opposite to the one with the embedded PZT sensor.3. Rubbing of blade tips while rotating.4. Broad band white noise force at the blade tip.
The resulting PZT sensor voltage responses are presented in time and frequency domains.
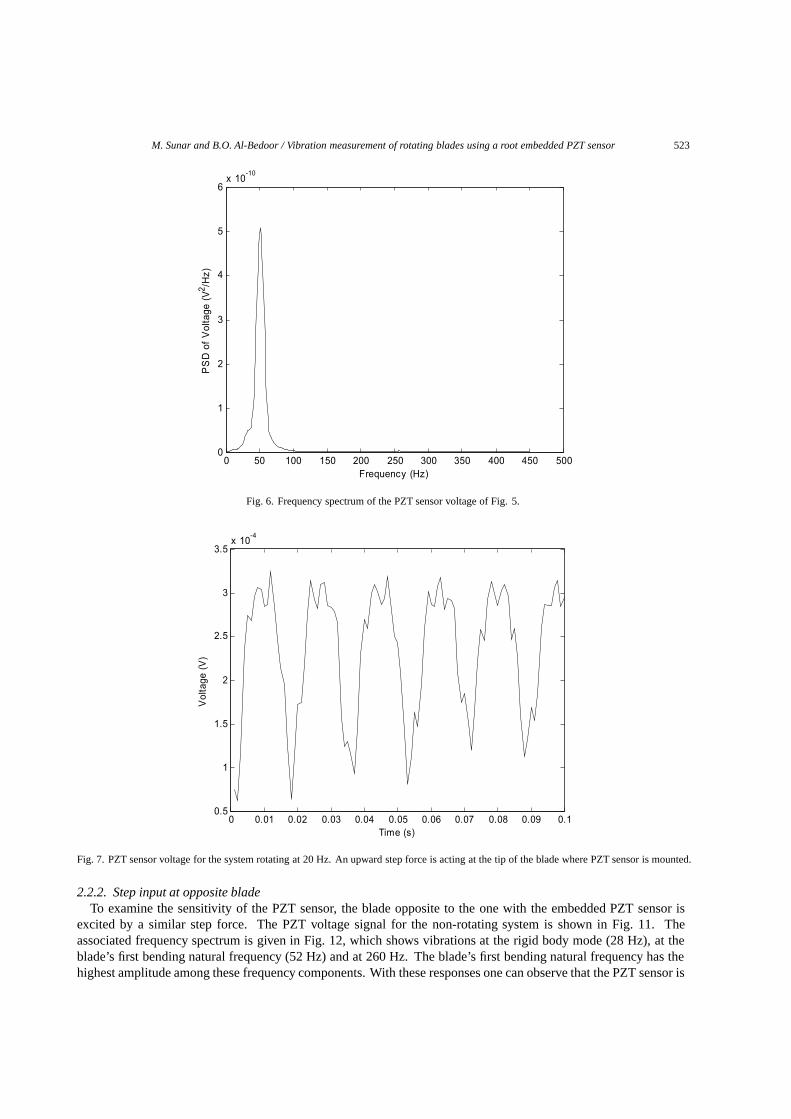
2.2.1. Step inputThe blade under which the PZT material is embedded is acted upon by a step force of magnitude of 1.735 N in the
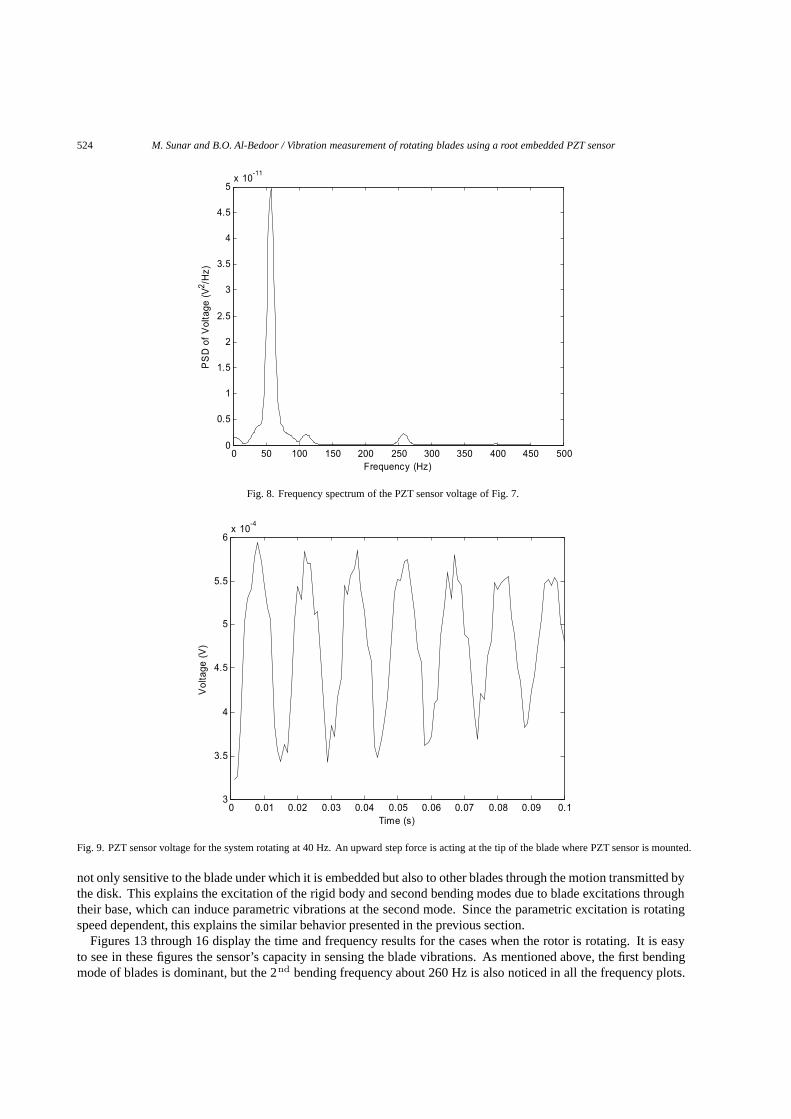
+Y direction (Fig. 1) and the resulting PZT voltage outputs are monitored. The voltage signal produced by the PZTsensor for the non-rotating system and its frequency spectrum are shown in Figs 5 and 6. The PZT voltage signalfrequency spectrum shows the highest amplitude at around 52 Hz and a frequency component at 260 Hz with verysmall amplitude.
522 M. Sunar and B.O. Al-Bedoor / Vibration measurement of rotating blades using a root embedded PZT sensor
Fig. 4. Mode shape at 259.9 Hz of natural frequency (no rotation).
0 0.01 0.02 0.03 0.04 0.05 0.06 0.07 0.08 0.09 0.1-1
0
1
2
3
4
5
6
7
8x 10
-4
Time (s)
Vol
tage
(V
)
Fig. 5. PZT sensor voltage for the non-rotating system. An upward step force is acting at the tip of the blade where PZT sensor is mounted.
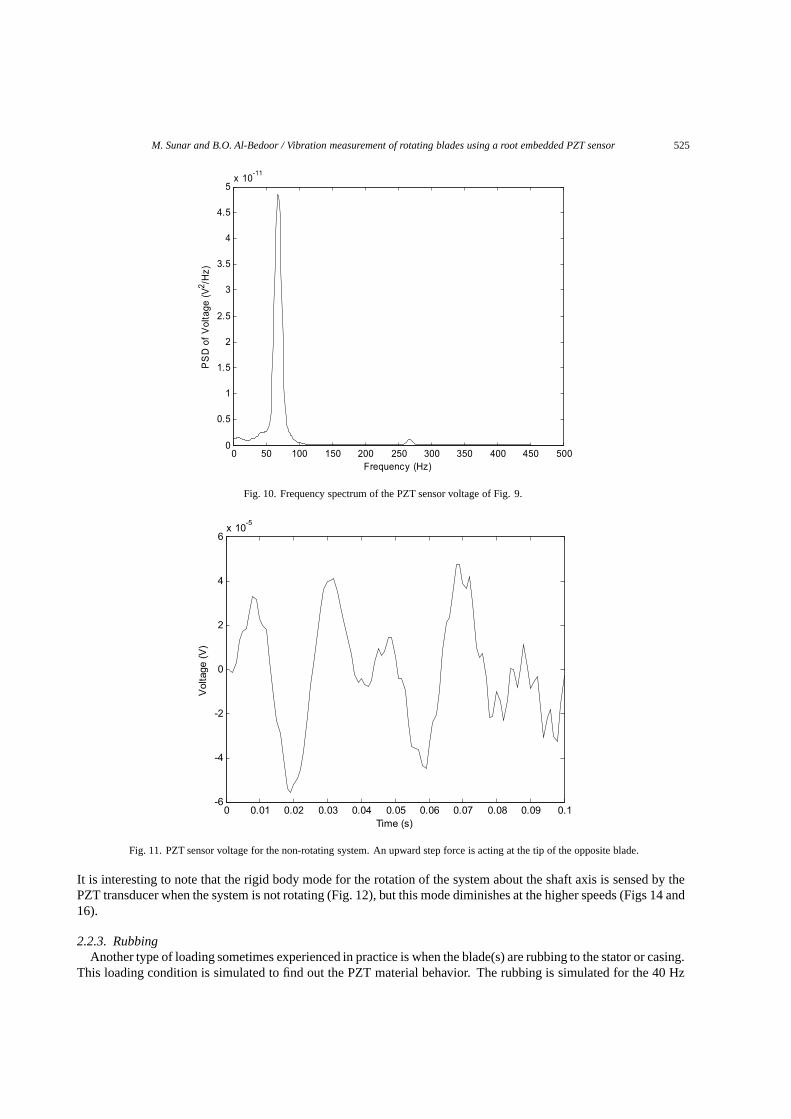
The PZT is attached to the root of the blade applying the same step input for the 20 Hz rotating system, and thetime and frequency responses for the PZT voltage are shown in Figs 7 and 8. The PZT spectrum, Fig. 8, showscomponents at about 58, 110 and 260 Hz frequencies. The PZT voltage time and frequency plots for the 40 Hzrotating speed are given in Figs 9 and 10.
It is clear in these figures that the PZT sensor is able to sense the 1st natural frequency of the blades correspondingto the bending. The 2nd blade bending frequency around 260 Hz is also distinguishable in the sensor frequencyplots.
M. Sunar and B.O. Al-Bedoor / Vibration measurement of rotating blades using a root embedded PZT sensor 523
0 50 100 150 200 250 300 350 400 450 5000
1
2
3
4
5
6x 10
-10
Frequency (Hz)
PS
D o
f V
olta
ge (
V2 /H
z)
Fig. 6. Frequency spectrum of the PZT sensor voltage of Fig. 5.
0 0.01 0.02 0.03 0.04 0.05 0.06 0.07 0.08 0.09 0.10.5
1
1.5
2
2.5
3
3.5x 10
-4
Time (s)
Vol
tage
(V
)
Fig. 7. PZT sensor voltage for the system rotating at 20 Hz. An upward step force is acting at the tip of the blade where PZT sensor is mounted.
2.2.2. Step input at opposite bladeTo examine the sensitivity of the PZT sensor, the blade opposite to the one with the embedded PZT sensor is
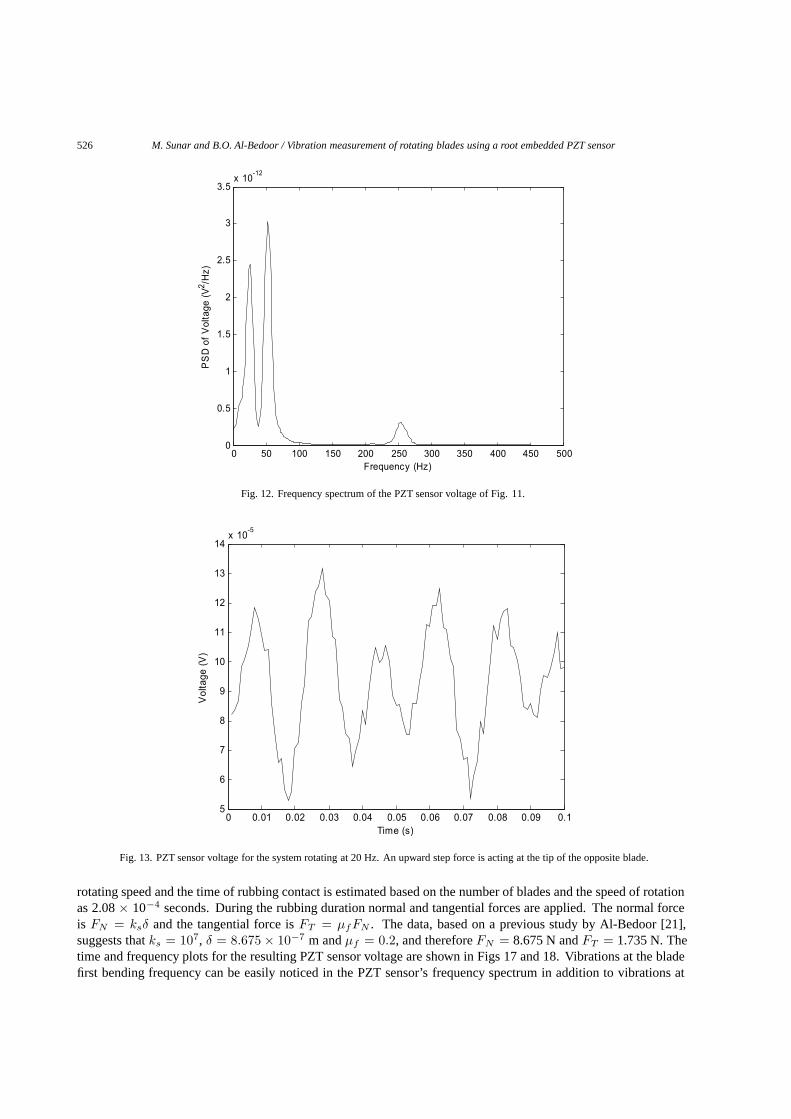
excited by a similar step force. The PZT voltage signal for the non-rotating system is shown in Fig. 11. Theassociated frequency spectrum is given in Fig. 12, which shows vibrations at the rigid body mode (28 Hz), at theblade’s first bending natural frequency (52 Hz) and at 260 Hz. The blade’s first bending natural frequency has thehighest amplitude among these frequency components. With these responses one can observe that the PZT sensor is
524 M. Sunar and B.O. Al-Bedoor / Vibration measurement of rotating blades using a root embedded PZT sensor
0 50 100 150 200 250 300 350 400 450 5000
0.5
1
1.5
2
2.5
3
3.5
4
4.5
5x 10
-11
Frequency (Hz)
PS
D o
f V
olta
ge (
V2 /H
z)
Fig. 8. Frequency spectrum of the PZT sensor voltage of Fig. 7.
0 0.01 0.02 0.03 0.04 0.05 0.06 0.07 0.08 0.09 0.13
3.5
4
4.5
5
5.5
6x 10
-4
Time (s)
Vol
tage
(V
)
Fig. 9. PZT sensor voltage for the system rotating at 40 Hz. An upward step force is acting at the tip of the blade where PZT sensor is mounted.
not only sensitive to the blade under which it is embedded but also to other blades through the motion transmitted bythe disk. This explains the excitation of the rigid body and second bending modes due to blade excitations throughtheir base, which can induce parametric vibrations at the second mode. Since the parametric excitation is rotatingspeed dependent, this explains the similar behavior presented in the previous section.
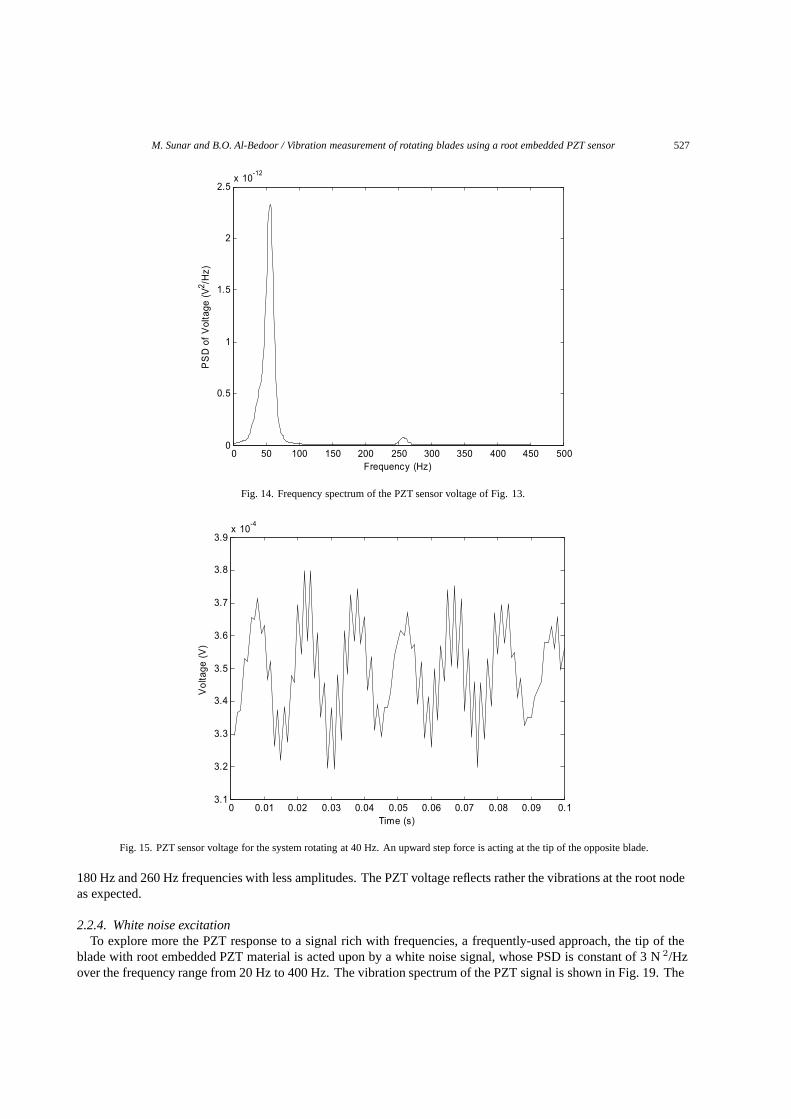
Figures 13 through 16 display the time and frequency results for the cases when the rotor is rotating. It is easyto see in these figures the sensor’s capacity in sensing the blade vibrations. As mentioned above, the first bendingmode of blades is dominant, but the 2nd bending frequency about 260 Hz is also noticed in all the frequency plots.
M. Sunar and B.O. Al-Bedoor / Vibration measurement of rotating blades using a root embedded PZT sensor 525
0 50 100 150 200 250 300 350 400 450 5000
0.5
1
1.5
2
2.5
3
3.5
4
4.5
5x 10
-11
Frequency (Hz)
PS
D o
f V
olta
ge (
V2 /H
z)
Fig. 10. Frequency spectrum of the PZT sensor voltage of Fig. 9.
0 0.01 0.02 0.03 0.04 0.05 0.06 0.07 0.08 0.09 0.1-6
-4
-2
0
2
4
6x 10
-5
Time (s)
Vol
tage
(V
)
Fig. 11. PZT sensor voltage for the non-rotating system. An upward step force is acting at the tip of the opposite blade.
It is interesting to note that the rigid body mode for the rotation of the system about the shaft axis is sensed by thePZT transducer when the system is not rotating (Fig. 12), but this mode diminishes at the higher speeds (Figs 14 and16).
2.2.3. RubbingAnother type of loading sometimes experienced in practice is when the blade(s) are rubbing to the stator or casing.
This loading condition is simulated to find out the PZT material behavior. The rubbing is simulated for the 40 Hz
526 M. Sunar and B.O. Al-Bedoor / Vibration measurement of rotating blades using a root embedded PZT sensor
0 50 100 150 200 250 300 350 400 450 5000
0.5
1
1.5
2
2.5
3
3.5x 10
-12
Frequency (Hz)
PS
D o
f V
olta
ge (
V2 /H
z)
Fig. 12. Frequency spectrum of the PZT sensor voltage of Fig. 11.
0 0.01 0.02 0.03 0.04 0.05 0.06 0.07 0.08 0.09 0.15
6
7
8
9
10
11
12
13
14x 10
-5
Time (s)
Vol
tage
(V
)
Fig. 13. PZT sensor voltage for the system rotating at 20 Hz. An upward step force is acting at the tip of the opposite blade.
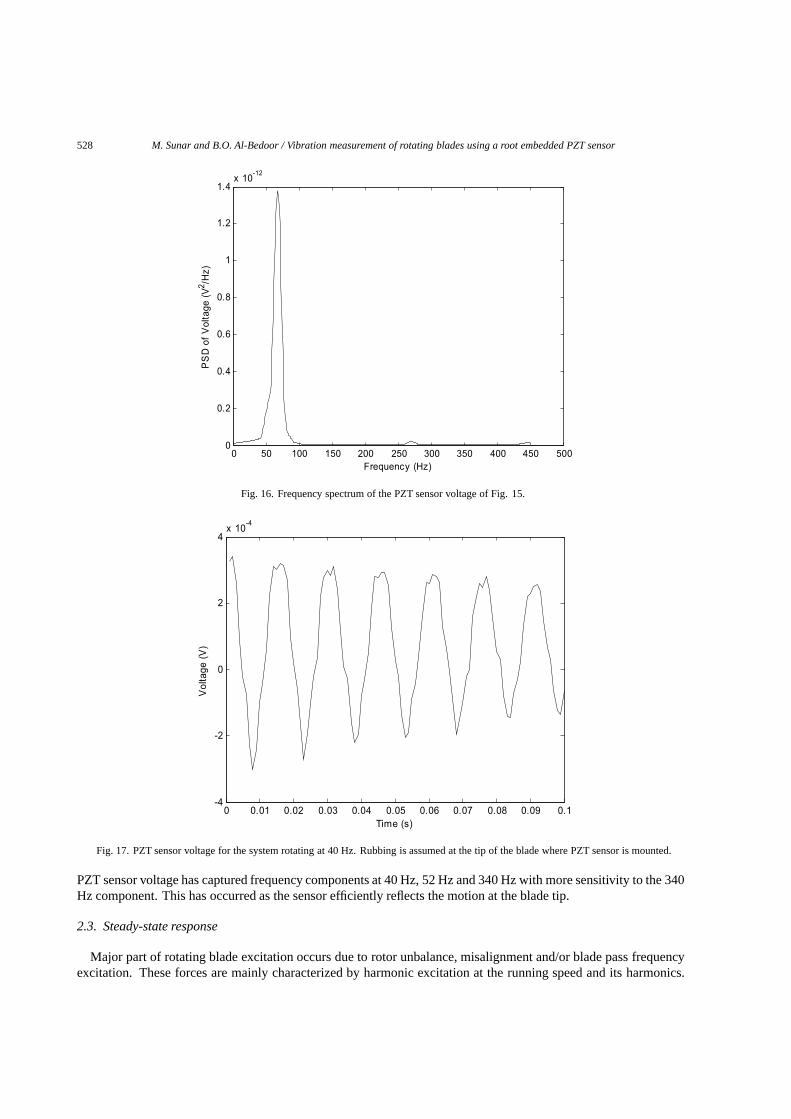
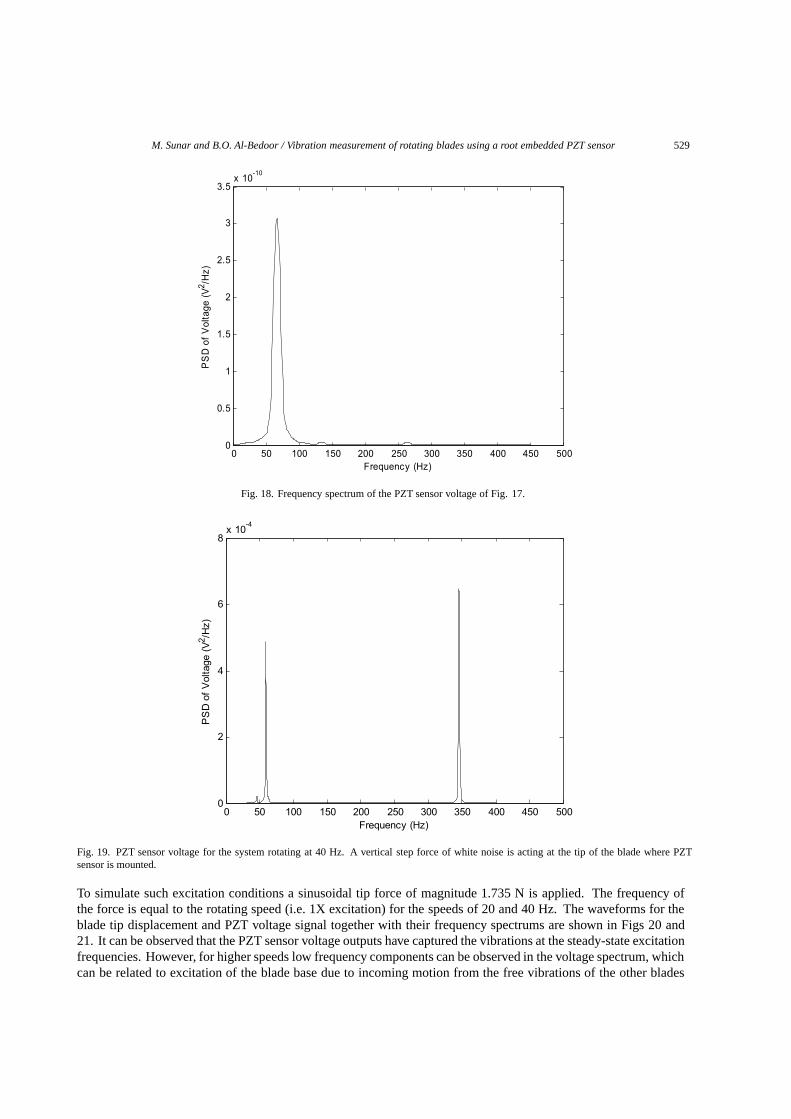
rotating speed and the time of rubbing contact is estimated based on the number of blades and the speed of rotationas 2.08× 10⁻⁴ seconds. During the rubbing duration normal and tangential forces are applied. The normal forceis FN = ksδ and the tangential force isFT = µfFN . The data, based on a previous study by Al-Bedoor [21],suggests thatks = 107, δ = 8.675 × 10⁻⁷ m andµf = 0.2, and thereforeFN = 8.675 N andFT = 1.735 N. Thetime and frequency plots for the resulting PZT sensor voltage are shown in Figs 17 and 18. Vibrations at the bladefirst bending frequency can be easily noticed in the PZT sensor’s frequency spectrum in addition to vibrations at
M. Sunar and B.O. Al-Bedoor / Vibration measurement of rotating blades using a root embedded PZT sensor 527
0 50 100 150 200 250 300 350 400 450 5000
0.5
1
1.5
2
2.5x 10
-12
Frequency (Hz)
PS
D o
f V
olta
ge (
V2 /H
z)
Fig. 14. Frequency spectrum of the PZT sensor voltage of Fig. 13.
0 0.01 0.02 0.03 0.04 0.05 0.06 0.07 0.08 0.09 0.13.1
3.2
3.3
3.4
3.5
3.6
3.7
3.8
3.9x 10
-4
Time (s)
Vol
tage
(V
)
Fig. 15. PZT sensor voltage for the system rotating at 40 Hz. An upward step force is acting at the tip of the opposite blade.
180 Hz and 260 Hz frequencies with less amplitudes. The PZT voltage reflects rather the vibrations at the root nodeas expected.
2.2.4. White noise excitationTo explore more the PZT response to a signal rich with frequencies, a frequently-used approach, the tip of the
blade with root embedded PZT material is acted upon by a white noise signal, whose PSD is constant of 3 N2/Hzover the frequency range from 20 Hz to 400 Hz. The vibration spectrum of the PZT signal is shown in Fig. 19. The
528 M. Sunar and B.O. Al-Bedoor / Vibration measurement of rotating blades using a root embedded PZT sensor
0 50 100 150 200 250 300 350 400 450 5000
0.2
0.4
0.6
0.8
1
1.2
1.4x 10
-12
Frequency (Hz)
PS
D o
f V
olta
ge (
V2 /H
z)
Fig. 16. Frequency spectrum of the PZT sensor voltage of Fig. 15.
0 0.01 0.02 0.03 0.04 0.05 0.06 0.07 0.08 0.09 0.1-4
-2
0
2
4x 10
-4
Time (s)
Vol
tage
(V
)
Fig. 17. PZT sensor voltage for the system rotating at 40 Hz. Rubbing is assumed at the tip of the blade where PZT sensor is mounted.
PZT sensor voltage has captured frequency components at 40 Hz, 52 Hz and 340 Hz with more sensitivity to the 340Hz component. This has occurred as the sensor efficiently reflects the motion at the blade tip.
2.3. Steady-state response
Major part of rotating blade excitation occurs due to rotor unbalance, misalignment and/or blade pass frequencyexcitation. These forces are mainly characterized by harmonic excitation at the running speed and its harmonics.
M. Sunar and B.O. Al-Bedoor / Vibration measurement of rotating blades using a root embedded PZT sensor 529
0 50 100 150 200 250 300 350 400 450 5000
0.5
1
1.5
2
2.5
3
3.5x 10
-10
Frequency (Hz)
PS
D o
f V
olta
ge (
V2 /H
z)
Fig. 18. Frequency spectrum of the PZT sensor voltage of Fig. 17.
0 50 100 150 200 250 300 350 400 450 5000
2
4
6
8x 10
-4
Frequency (Hz)
PS
D o
f V
olta
ge (
V2 /H
z)
Fig. 19. PZT sensor voltage for the system rotating at 40 Hz. A vertical step force of white noise is acting at the tip of the blade where PZTsensor is mounted.
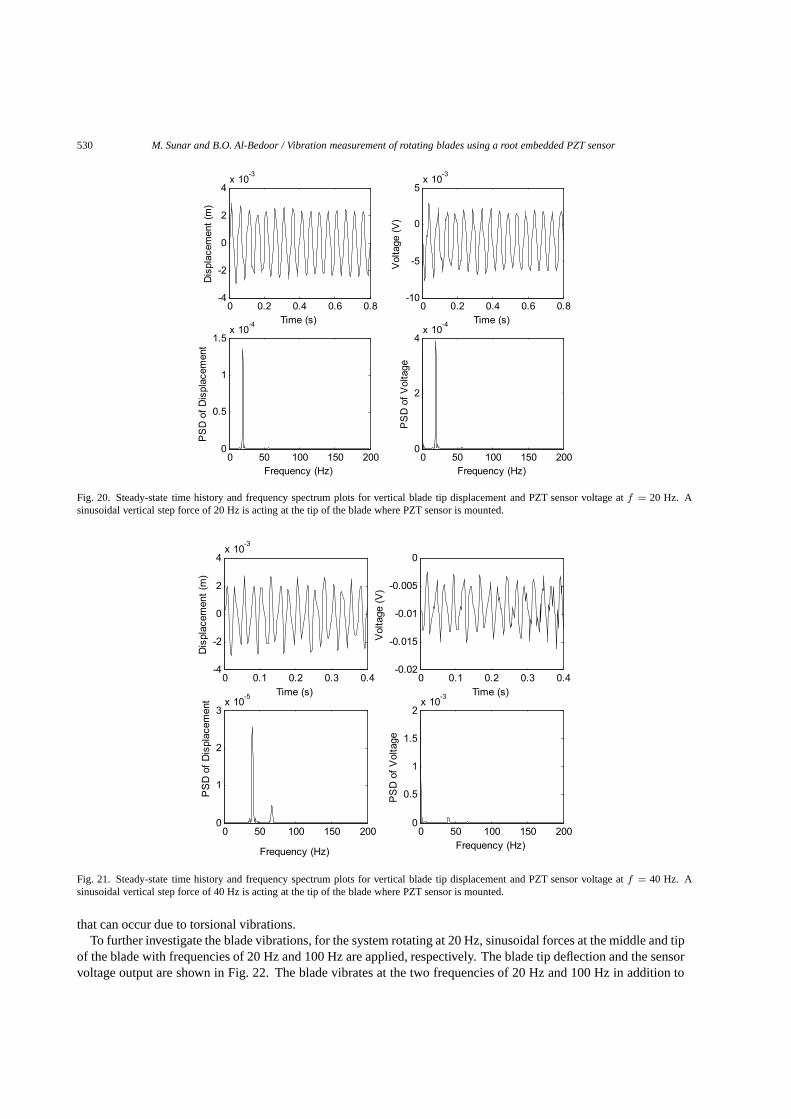
To simulate such excitation conditions a sinusoidal tip force of magnitude 1.735 N is applied. The frequency ofthe force is equal to the rotating speed (i.e. 1X excitation) for the speeds of 20 and 40 Hz. The waveforms for theblade tip displacement and PZT voltage signal together with their frequency spectrums are shown in Figs 20 and21. It can be observed that the PZT sensor voltage outputs have captured the vibrations at the steady-state excitationfrequencies. However, for higher speeds low frequency components can be observed in the voltage spectrum, whichcan be related to excitation of the blade base due to incoming motion from the free vibrations of the other blades
530 M. Sunar and B.O. Al-Bedoor / Vibration measurement of rotating blades using a root embedded PZT sensor
0 0.2 0.4 0.6 0.8-4
-2
0
2
4x 10
-3
Time (s)
Dis
plac
emen
t (m
)
0 50 100 150 2000
0.5
1
1.5x 10
-4
Frequency (Hz)
PS
D o
f D
ispl
acem
ent
0 0.2 0.4 0.6 0.8-10
-5
0
5x 10
-3
Time (s)
Vol
tage
(V
)
0 50 100 150 2000
2
4x 10
-4
Frequency (Hz)
PS
D o
f V
olta
ge
Fig. 20. Steady-state time history and frequency spectrum plots for vertical blade tip displacement and PZT sensor voltage atf = 20 Hz. Asinusoidal vertical step force of 20 Hz is acting at the tip of the blade where PZT sensor is mounted.
0 0.1 0.2 0.3 0.4-4
-2
0
2
4x 10
-3
Time (s)
Dis
plac
emen
t (m
)
0 50 100 150 2000
1
2
3x 10
-5
Frequency (Hz)
PS
D o
f D
ispl
acem
ent
0 0.1 0.2 0.3 0.4-0.02
-0.015
-0.01
-0.005
0
Time (s)
Vol
tage
(V
)
0 50 100 150 2000
0.5
1
1.5
2x 10
-3
Frequency (Hz)
PS
D o
f V
olta
ge
Fig. 21. Steady-state time history and frequency spectrum plots for vertical blade tip displacement and PZT sensor voltage atf = 40 Hz. Asinusoidal vertical step force of 40 Hz is acting at the tip of the blade where PZT sensor is mounted.
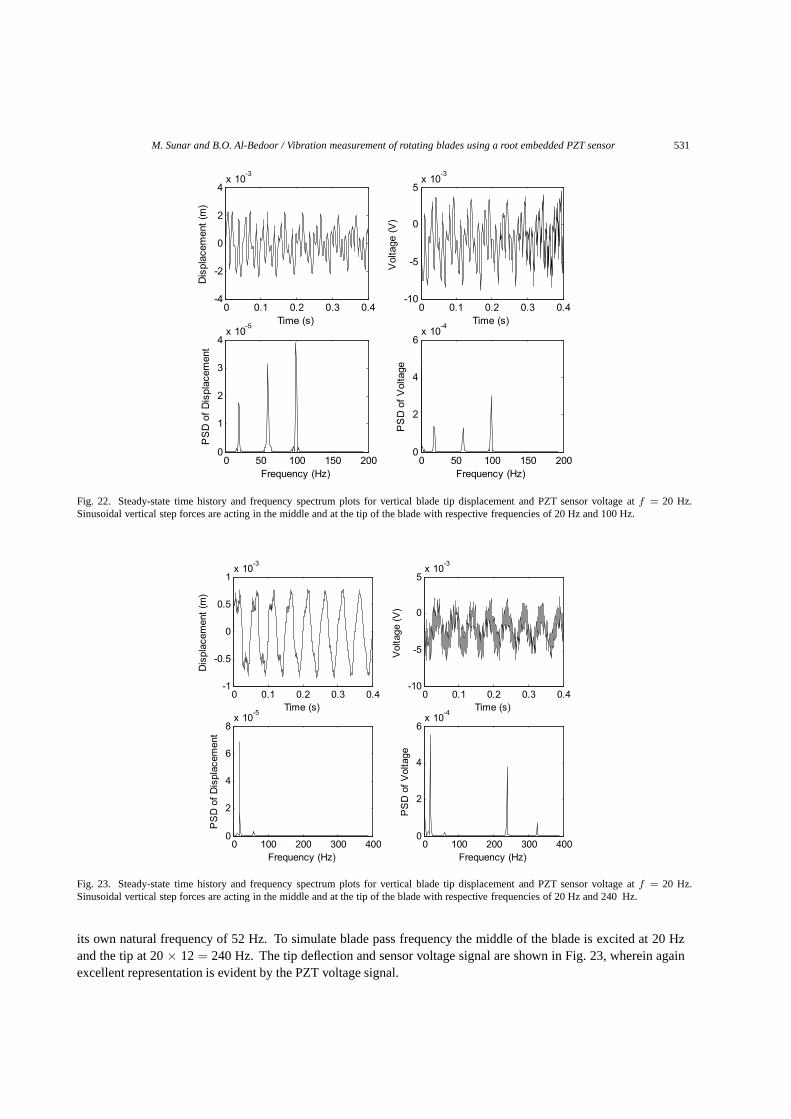
that can occur due to torsional vibrations.To further investigate the blade vibrations, for the system rotating at 20 Hz, sinusoidal forces at the middle and tip
of the blade with frequencies of 20 Hz and 100 Hz are applied, respectively. The blade tip deflection and the sensorvoltage output are shown in Fig. 22. The blade vibrates at the two frequencies of 20 Hz and 100 Hz in addition to
M. Sunar and B.O. Al-Bedoor / Vibration measurement of rotating blades using a root embedded PZT sensor 531
0 0.1 0.2 0.3 0.4-4
-2
0
2
4x 10
-3
Time (s)
Dis
plac
emen
t (m
)
0 50 100 150 2000
1
2
3
4x 10
-5
Frequency (Hz)
PS
D o
f D
ispl
acem
ent
0 0.1 0.2 0.3 0.4-10
-5
0
5x 10
-3
Time (s)
Vol
tage
(V
)
0 50 100 150 2000
2
4
6x 10
-4
Frequency (Hz)
PS
D o
f V
olta
ge
Fig. 22. Steady-state time history and frequency spectrum plots for vertical blade tip displacement and PZT sensor voltage atf = 20 Hz.Sinusoidal vertical step forces are acting in the middle and at the tip of the blade with respective frequencies of 20 Hz and 100 Hz.
0 0.1 0.2 0.3 0.4-1
-0.5
0
0.5
1x 10
-3
Time (s)
Dis
plac
emen
t (m
)
0 100 200 300 4000
2
4
6
8x 10
-5
Frequency (Hz)
PS
D o
f D
ispl
acem
ent
0 0.1 0.2 0.3 0.4-10
-5
0
5x 10
-3
Time (s)
Vol
tage
(V
)
0 100 200 300 4000
2
4
6x 10
-4
Frequency (Hz)
PS
D o
f V
olta
ge
Fig. 23. Steady-state time history and frequency spectrum plots for vertical blade tip displacement and PZT sensor voltage atf = 20 Hz.Sinusoidal vertical step forces are acting in the middle and at the tip of the blade with respective frequencies of 20 Hz and 240 Hz.
its own natural frequency of 52 Hz. To simulate blade pass frequency the middle of the blade is excited at 20 Hzand the tip at 20× 12= 240 Hz. The tip deflection and sensor voltage signal are shown in Fig. 23, wherein againexcellent representation is evident by the PZT voltage signal.
532 M. Sunar and B.O. Al-Bedoor / Vibration measurement of rotating blades using a root embedded PZT sensor
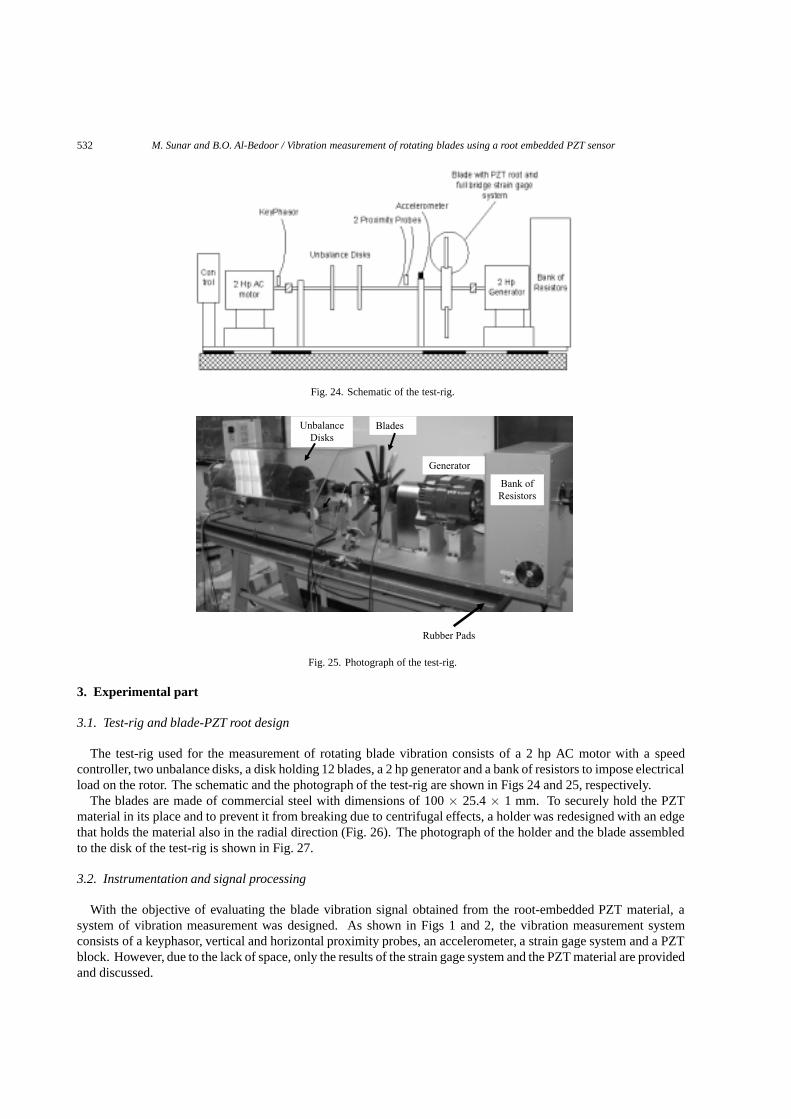
Fig. 24. Schematic of the test-rig.
Blades Unbalance
Disks
Generator
Bank of
Resistors
Rubber Pads
Fig. 25. Photograph of the test-rig.
3. Experimental part
3.1. Test-rig and blade-PZT root design
The test-rig used for the measurement of rotating blade vibration consists of a 2 hp AC motor with a speedcontroller, two unbalance disks, a disk holding 12 blades, a 2 hp generator and a bank of resistors to impose electricalload on the rotor. The schematic and the photograph of the test-rig are shown in Figs 24 and 25, respectively.
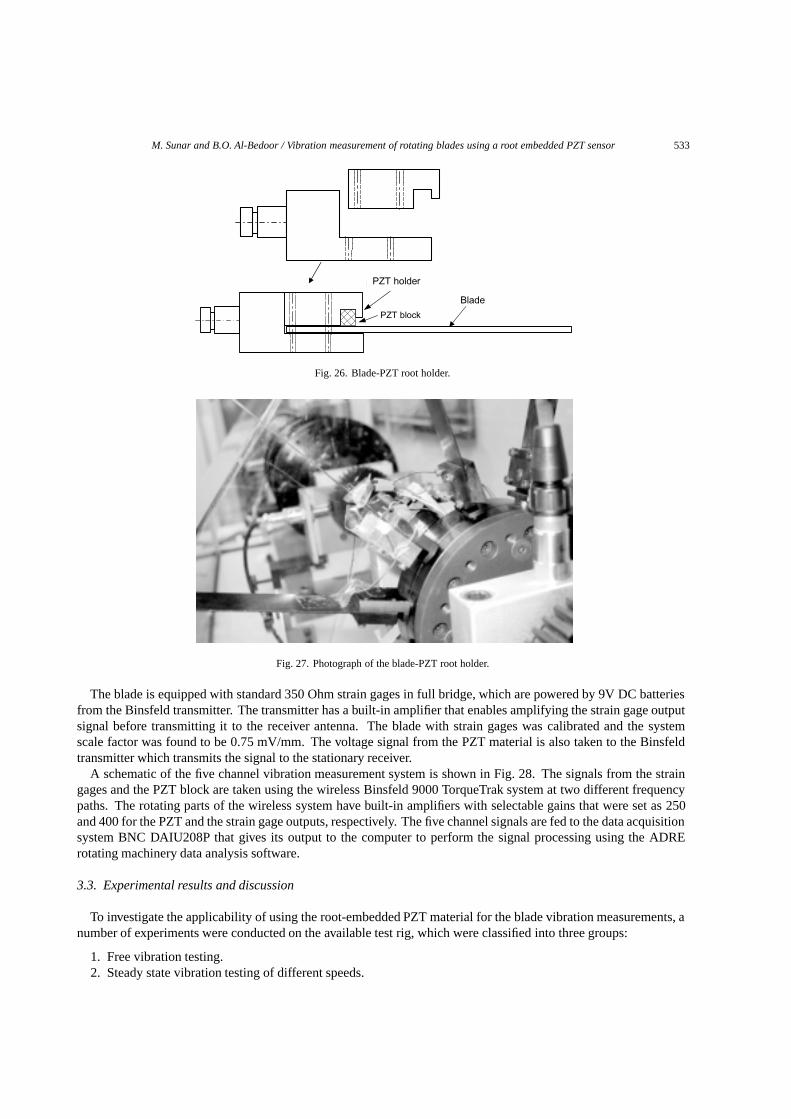
The blades are made of commercial steel with dimensions of 100× 25.4× 1 mm. To securely hold the PZTmaterial in its place and to prevent it from breaking due to centrifugal effects, a holder was redesigned with an edgethat holds the material also in the radial direction (Fig. 26). The photograph of the holder and the blade assembledto the disk of the test-rig is shown in Fig. 27.
3.2. Instrumentation and signal processing
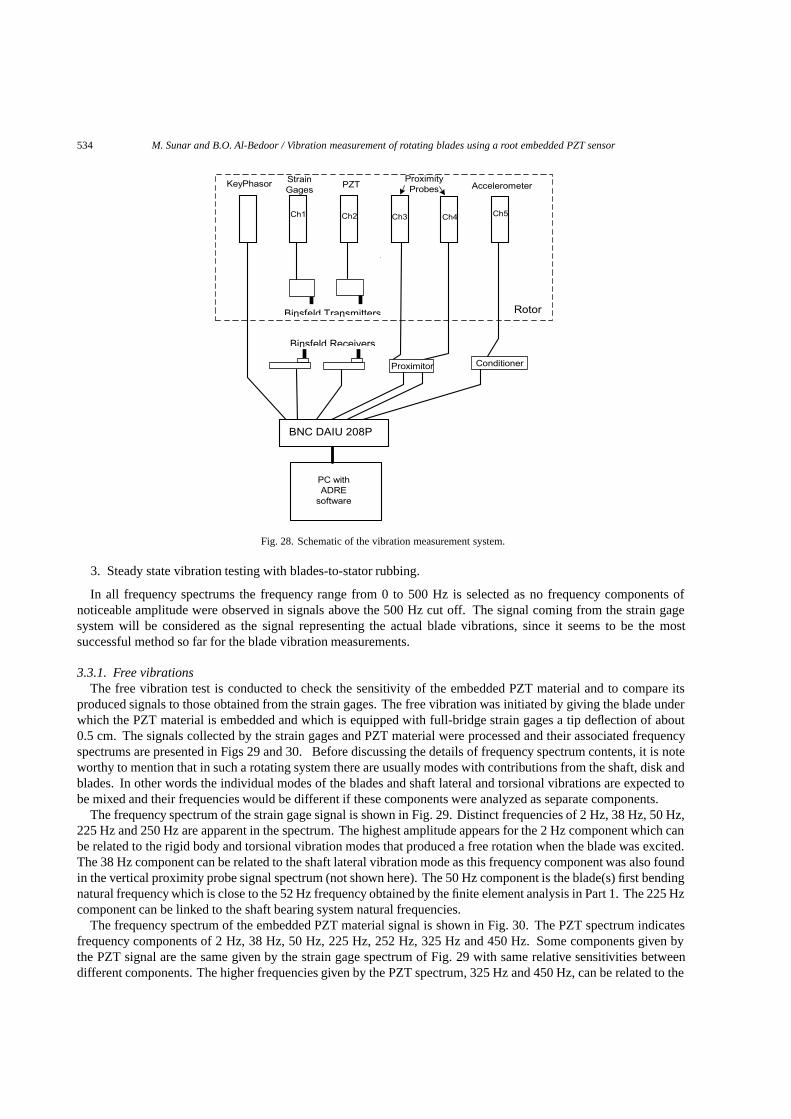
With the objective of evaluating the blade vibration signal obtained from the root-embedded PZT material, asystem of vibration measurement was designed. As shown in Figs 1 and 2, the vibration measurement systemconsists of a keyphasor, vertical and horizontal proximity probes, an accelerometer, a strain gage system and a PZTblock. However, due to the lack of space, only the results of the strain gage system and the PZT material are providedand discussed.
M. Sunar and B.O. Al-Bedoor / Vibration measurement of rotating blades using a root embedded PZT sensor 533
Blade
PZT block
Modified PZT holderPZT holder
Fig. 26. Blade-PZT root holder.
Fig. 27. Photograph of the blade-PZT root holder.
The blade is equipped with standard 350 Ohm strain gages in full bridge, which are powered by 9V DC batteriesfrom the Binsfeld transmitter. The transmitter has a built-in amplifier that enables amplifying the strain gage outputsignal before transmitting it to the receiver antenna. The blade with strain gages was calibrated and the systemscale factor was found to be 0.75 mV/mm. The voltage signal from the PZT material is also taken to the Binsfeldtransmitter which transmits the signal to the stationary receiver.
A schematic of the five channel vibration measurement system is shown in Fig. 28. The signals from the straingages and the PZT block are taken using the wireless Binsfeld 9000 TorqueTrak system at two different frequencypaths. The rotating parts of the wireless system have built-in amplifiers with selectable gains that were set as 250and 400 for the PZT and the strain gage outputs, respectively. The five channel signals are fed to the data acquisitionsystem BNC DAIU208P that gives its output to the computer to perform the signal processing using the ADRErotating machinery data analysis software.
3.3. Experimental results and discussion
To investigate the applicability of using the root-embedded PZT material for the blade vibration measurements, anumber of experiments were conducted on the available test rig, which were classified into three groups:
1. Free vibration testing.2. Steady state vibration testing of different speeds.
534 M. Sunar and B.O. Al-Bedoor / Vibration measurement of rotating blades using a root embedded PZT sensor
StrainGages
KeyPhasor PZTProximityProbes Accelerometer
Ch1 Ch2 Ch3 Ch4 Ch5
RotorBensfiled Transmitters
Bensfiled Recievers
Proximitor Conditioner
BNC DAIU 208P
PC withADRE
software
Binsfeld Transmitters
Binsfeld Receivers
Fig. 28. Schematic of the vibration measurement system.
3. Steady state vibration testing with blades-to-stator rubbing.
In all frequency spectrums the frequency range from 0 to 500 Hz is selected as no frequency components ofnoticeable amplitude were observed in signals above the 500 Hz cut off. The signal coming from the strain gagesystem will be considered as the signal representing the actual blade vibrations, since it seems to be the mostsuccessful method so far for the blade vibration measurements.
3.3.1. Free vibrationsThe free vibration test is conducted to check the sensitivity of the embedded PZT material and to compare its
produced signals to those obtained from the strain gages. The free vibration was initiated by giving the blade underwhich the PZT material is embedded and which is equipped with full-bridge strain gages a tip deflection of about0.5 cm. The signals collected by the strain gages and PZT material were processed and their associated frequencyspectrums are presented in Figs 29 and 30. Before discussing the details of frequency spectrum contents, it is noteworthy to mention that in such a rotating system there are usually modes with contributions from the shaft, disk andblades. In other words the individual modes of the blades and shaft lateral and torsional vibrations are expected tobe mixed and their frequencies would be different if these components were analyzed as separate components.
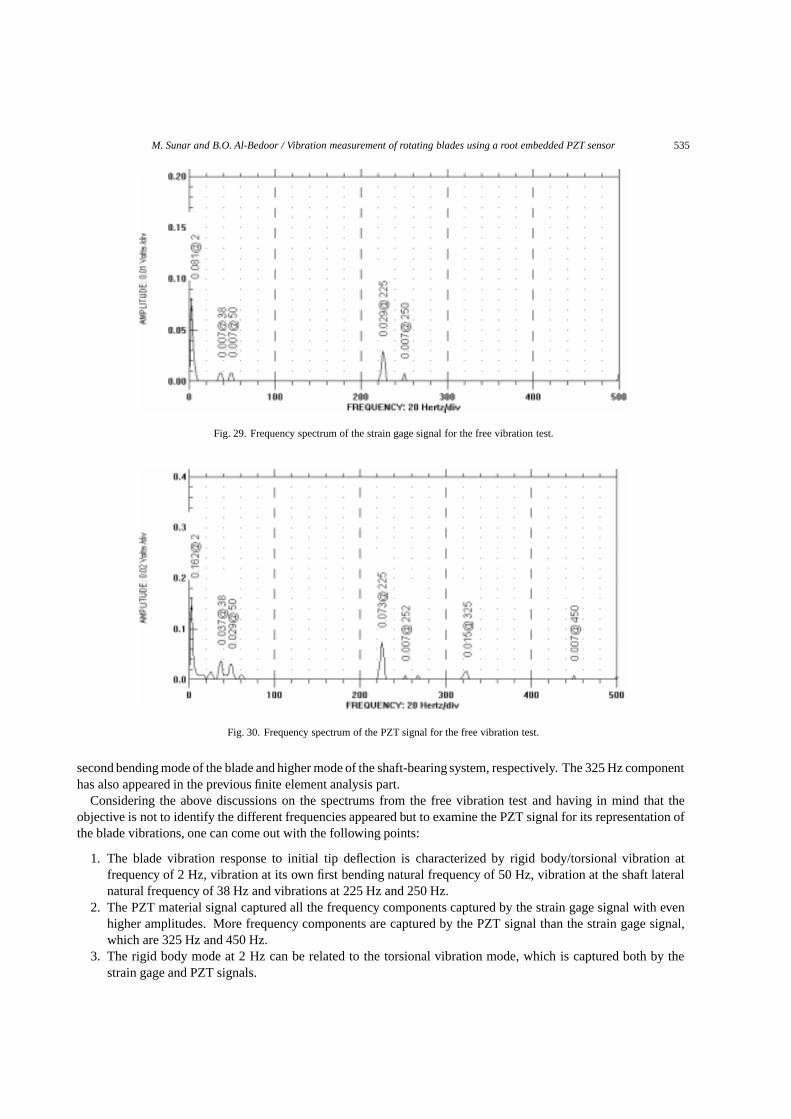
The frequency spectrum of the strain gage signal is shown in Fig. 29. Distinct frequencies of 2 Hz, 38 Hz, 50 Hz,225 Hz and 250 Hz are apparent in the spectrum. The highest amplitude appears for the 2 Hz component which canbe related to the rigid body and torsional vibration modes that produced a free rotation when the blade was excited.The 38 Hz component can be related to the shaft lateral vibration mode as this frequency component was also foundin the vertical proximity probe signal spectrum (not shown here). The 50 Hz component is the blade(s) first bendingnatural frequency which is close to the 52 Hz frequency obtained by the finite element analysis in Part 1. The 225 Hzcomponent can be linked to the shaft bearing system natural frequencies.
The frequency spectrum of the embedded PZT material signal is shown in Fig. 30. The PZT spectrum indicatesfrequency components of 2 Hz, 38 Hz, 50 Hz, 225 Hz, 252 Hz, 325 Hz and 450 Hz. Some components given bythe PZT signal are the same given by the strain gage spectrum of Fig. 29 with same relative sensitivities betweendifferent components. The higher frequencies given by the PZT spectrum, 325 Hz and 450 Hz, can be related to the
M. Sunar and B.O. Al-Bedoor / Vibration measurement of rotating blades using a root embedded PZT sensor 535
Fig. 29. Frequency spectrum of the strain gage signal for the free vibration test.
Fig. 30. Frequency spectrum of the PZT signal for the free vibration test.
second bending mode of the blade and higher mode of the shaft-bearing system, respectively. The 325 Hz componenthas also appeared in the previous finite element analysis part.
Considering the above discussions on the spectrums from the free vibration test and having in mind that theobjective is not to identify the different frequencies appeared but to examine the PZT signal for its representation ofthe blade vibrations, one can come out with the following points:
1. The blade vibration response to initial tip deflection is characterized by rigid body/torsional vibration atfrequency of 2 Hz, vibration at its own first bending natural frequency of 50 Hz, vibration at the shaft lateralnatural frequency of 38 Hz and vibrations at 225 Hz and 250 Hz.
2. The PZT material signal captured all the frequency components captured by the strain gage signal with evenhigher amplitudes. More frequency components are captured by the PZT signal than the strain gage signal,which are 325 Hz and 450 Hz.
3. The rigid body mode at 2 Hz can be related to the torsional vibration mode, which is captured both by thestrain gage and PZT signals.
536 M. Sunar and B.O. Al-Bedoor / Vibration measurement of rotating blades using a root embedded PZT sensor
(a)
(b)
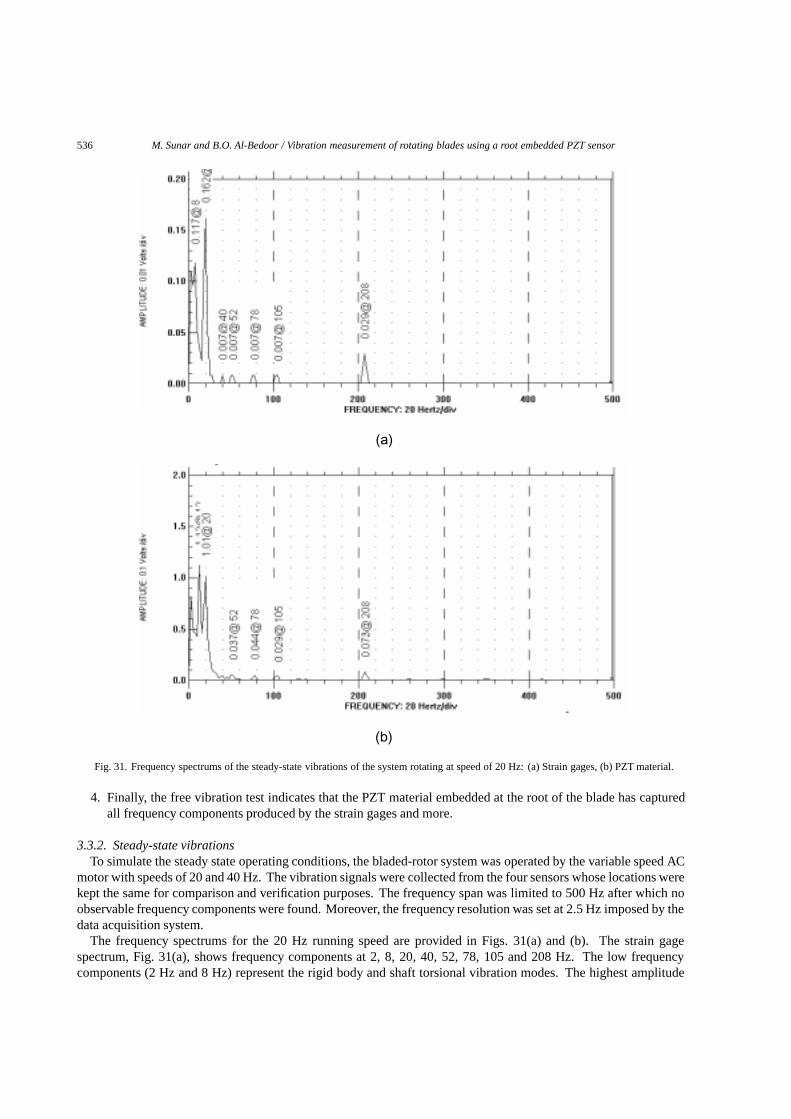
Fig. 31. Frequency spectrums of the steady-state vibrations of the system rotating at speed of 20 Hz: (a) Strain gages, (b) PZT material.
4. Finally, the free vibration test indicates that the PZT material embedded at the root of the blade has capturedall frequency components produced by the strain gages and more.
3.3.2. Steady-state vibrationsTo simulate the steady state operating conditions, the bladed-rotor system was operated by the variable speed AC
motor with speeds of 20 and 40 Hz. The vibration signals were collected from the four sensors whose locations werekept the same for comparison and verification purposes. The frequency span was limited to 500 Hz after which noobservable frequency components were found. Moreover, the frequency resolution was set at 2.5 Hz imposed by thedata acquisition system.
The frequency spectrums for the 20 Hz running speed are provided in Figs. 31(a) and (b). The strain gagespectrum, Fig. 31(a), shows frequency components at 2, 8, 20, 40, 52, 78, 105 and 208 Hz. The low frequencycomponents (2 Hz and 8 Hz) represent the rigid body and shaft torsional vibration modes. The highest amplitude
M. Sunar and B.O. Al-Bedoor / Vibration measurement of rotating blades using a root embedded PZT sensor 537
(a)
(b)
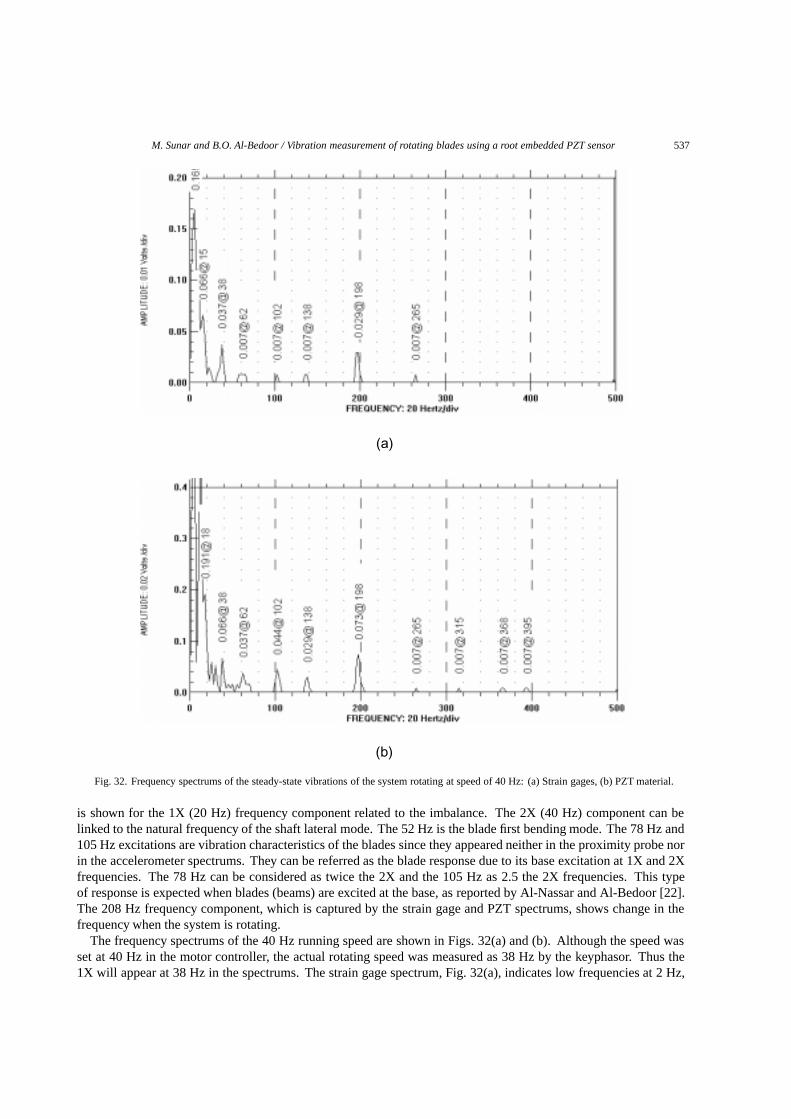
Fig. 32. Frequency spectrums of the steady-state vibrations of the system rotating at speed of 40 Hz: (a) Strain gages, (b) PZT material.
is shown for the 1X (20 Hz) frequency component related to the imbalance. The 2X (40 Hz) component can belinked to the natural frequency of the shaft lateral mode. The 52 Hz is the blade first bending mode. The 78 Hz and105 Hz excitations are vibration characteristics of the blades since they appeared neither in the proximity probe norin the accelerometer spectrums. They can be referred as the blade response due to its base excitation at 1X and 2Xfrequencies. The 78 Hz can be considered as twice the 2X and the 105 Hz as 2.5 the 2X frequencies. This typeof response is expected when blades (beams) are excited at the base, as reported by Al-Nassar and Al-Bedoor [22].The 208 Hz frequency component, which is captured by the strain gage and PZT spectrums, shows change in thefrequency when the system is rotating.
The frequency spectrums of the 40 Hz running speed are shown in Figs. 32(a) and (b). Although the speed wasset at 40 Hz in the motor controller, the actual rotating speed was measured as 38 Hz by the keyphasor. Thus the1X will appear at 38 Hz in the spectrums. The strain gage spectrum, Fig. 32(a), indicates low frequencies at 2 Hz,
538 M. Sunar and B.O. Al-Bedoor / Vibration measurement of rotating blades using a root embedded PZT sensor
(a)
(b)
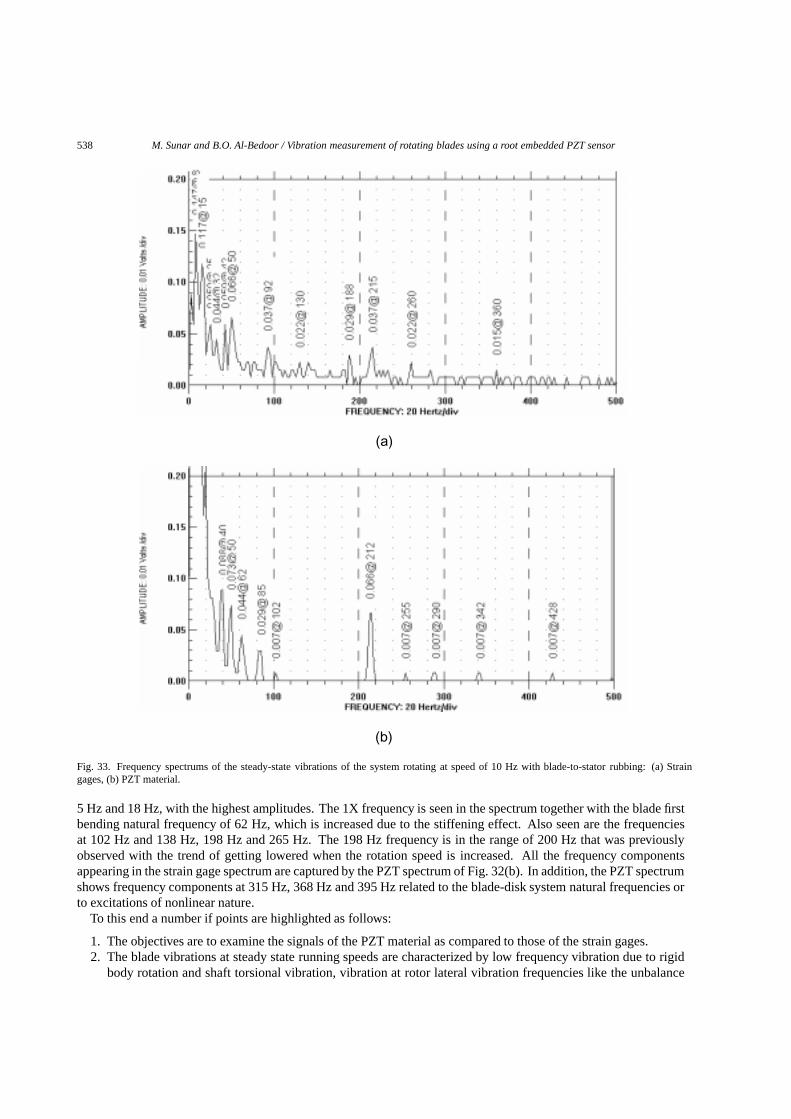
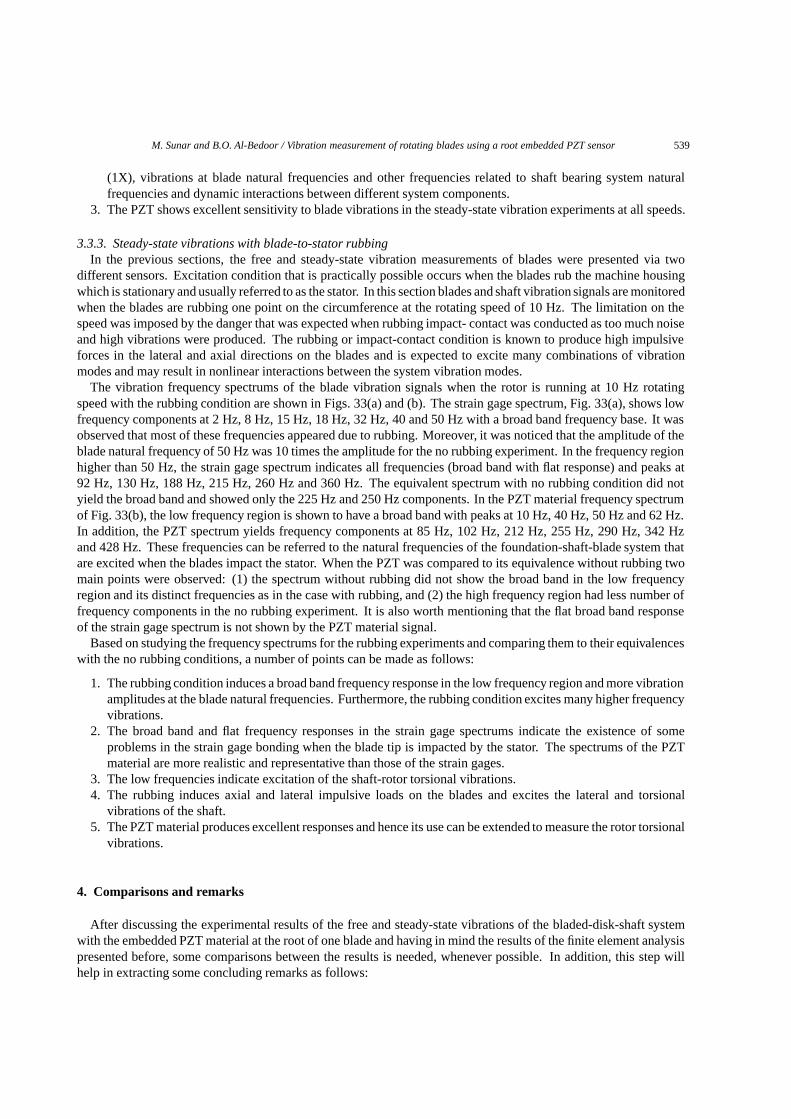
Fig. 33. Frequency spectrums of the steady-state vibrations of the system rotating at speed of 10 Hz with blade-to-stator rubbing: (a) Straingages, (b) PZT material.
5 Hz and 18 Hz, with the highest amplitudes. The 1X frequency is seen in the spectrum together with the blade firstbending natural frequency of 62 Hz, which is increased due to the stiffening effect. Also seen are the frequenciesat 102 Hz and 138 Hz, 198 Hz and 265 Hz. The 198 Hz frequency is in the range of 200 Hz that was previouslyobserved with the trend of getting lowered when the rotation speed is increased. All the frequency componentsappearing in the strain gage spectrum are captured by the PZT spectrum of Fig. 32(b). In addition, the PZT spectrumshows frequency components at 315 Hz, 368 Hz and 395 Hz related to the blade-disk system natural frequencies orto excitations of nonlinear nature.
To this end a number if points are highlighted as follows:
1. The objectives are to examine the signals of the PZT material as compared to those of the strain gages.2. The blade vibrations at steady state running speeds are characterized by low frequency vibration due to rigid
body rotation and shaft torsional vibration, vibration at rotor lateral vibration frequencies like the unbalance
M. Sunar and B.O. Al-Bedoor / Vibration measurement of rotating blades using a root embedded PZT sensor 539
(1X), vibrations at blade natural frequencies and other frequencies related to shaft bearing system naturalfrequencies and dynamic interactions between different system components.
3. The PZT shows excellent sensitivity to blade vibrations in the steady-state vibration experiments at all speeds.
3.3.3. Steady-state vibrations with blade-to-stator rubbingIn the previous sections, the free and steady-state vibration measurements of blades were presented via two
different sensors. Excitation condition that is practically possible occurs when the blades rub the machine housingwhich is stationary and usually referred to as the stator. In this section blades and shaft vibration signals are monitoredwhen the blades are rubbing one point on the circumference at the rotating speed of 10 Hz. The limitation on thespeed was imposed by the danger that was expected when rubbing impact- contact was conducted as too much noiseand high vibrations were produced. The rubbing or impact-contact condition is known to produce high impulsiveforces in the lateral and axial directions on the blades and is expected to excite many combinations of vibrationmodes and may result in nonlinear interactions between the system vibration modes.
The vibration frequency spectrums of the blade vibration signals when the rotor is running at 10 Hz rotatingspeed with the rubbing condition are shown in Figs. 33(a) and (b). The strain gage spectrum, Fig. 33(a), shows lowfrequency components at 2 Hz, 8 Hz, 15 Hz, 18 Hz, 32 Hz, 40 and 50 Hz with a broad band frequency base. It wasobserved that most of these frequencies appeared due to rubbing. Moreover, it was noticed that the amplitude of theblade natural frequency of 50 Hz was 10 times the amplitude for the no rubbing experiment. In the frequency regionhigher than 50 Hz, the strain gage spectrum indicates all frequencies (broad band with flat response) and peaks at92 Hz, 130 Hz, 188 Hz, 215 Hz, 260 Hz and 360 Hz. The equivalent spectrum with no rubbing condition did notyield the broad band and showed only the 225 Hz and 250 Hz components. In the PZT material frequency spectrumof Fig. 33(b), the low frequency region is shown to have a broad band with peaks at 10 Hz, 40 Hz, 50 Hz and 62 Hz.In addition, the PZT spectrum yields frequency components at 85 Hz, 102 Hz, 212 Hz, 255 Hz, 290 Hz, 342 Hzand 428 Hz. These frequencies can be referred to the natural frequencies of the foundation-shaft-blade system thatare excited when the blades impact the stator. When the PZT was compared to its equivalence without rubbing twomain points were observed: (1) the spectrum without rubbing did not show the broad band in the low frequencyregion and its distinct frequencies as in the case with rubbing, and (2) the high frequency region had less number offrequency components in the no rubbing experiment. It is also worth mentioning that the flat broad band responseof the strain gage spectrum is not shown by the PZT material signal.
Based on studying the frequency spectrums for the rubbing experiments and comparing them to their equivalenceswith the no rubbing conditions, a number of points can be made as follows:
1. The rubbing condition induces a broad band frequency response in the low frequency region and more vibrationamplitudes at the blade natural frequencies. Furthermore, the rubbing condition excites many higher frequencyvibrations.
2. The broad band and flat frequency responses in the strain gage spectrums indicate the existence of someproblems in the strain gage bonding when the blade tip is impacted by the stator. The spectrums of the PZTmaterial are more realistic and representative than those of the strain gages.
3. The low frequencies indicate excitation of the shaft-rotor torsional vibrations.4. The rubbing induces axial and lateral impulsive loads on the blades and excites the lateral and torsional
vibrations of the shaft.5. The PZT material produces excellent responses and hence its use can be extended to measure the rotor torsional
vibrations.
4. Comparisons and remarks
After discussing the experimental results of the free and steady-state vibrations of the bladed-disk-shaft systemwith the embedded PZT material at the root of one blade and having in mind the results of the finite element analysispresented before, some comparisons between the results is needed, whenever possible. In addition, this step willhelp in extracting some concluding remarks as follows:
540 M. Sunar and B.O. Al-Bedoor / Vibration measurement of rotating blades using a root embedded PZT sensor
4.1. Free and transient vibration results
Based on the results of the finite element modal and transient analyses presented in Part 1 and those of theexperimental free vibrations in Part 2, the following points can be extracted:
1. The 2 Hz free vibration component appeared in the experiment and did not appear in the finite element modaland transient analysis. Instead the 28 Hz vibration frequency appeared as the rotational mode in the finiteelement analysis. The big difference in the frequency can be referred to the short length of the shaft in thefinite element model and no consideration of the motor mass moment of inertia.
2. The 38 Hz frequency appearing in the free vibration experiment and representing the shaft lateral vibrationmode did not appear in the finite element modal analysis. Again this is due to the shorter shaft segment takenin the finite element model.
3. The 50 Hz frequency appearing in the free vibration experiment corresponds to the 52 Hz frequency in thefinite element modal and transient analyses. This is the most important frequency and is shown to be capturedby the finite element model as reflected by its corresponding mode and mode shape. The excellent agreementin the blade first bending natural frequency between the finite element model and the experiment indicatesexcellent capabilities of the PZT material in capturing the blade free vibration mode. This phenomenon is alsosupported by the strain gage results.
4. The 225 Hz frequency appeared in the free vibration experiments, but did not appear in the finite elementmodal and transient analysis as the model did not account for the shaft-bearing system.
5. The 250 Hz component appeared in the free vibration experiments can be taken equivalent to the 259 Hz in thefinite element modal analysis. This frequency can be thought as a coupled mode between the disk and blades.
6. The 325 Hz frequency component in the free vibration experiment is shown in the frequency range of 323–343 Hz in the finite element modal analysis. This is a very important frequency component which is thesecond blade bending mode. This agreement indicates that the PZT material is excellent in capturing the higherbending modes of the blade vibrations.
7. The PZT in the free vibration experiment showed a frequency component at 450 Hz that may be related to thetorsional vibration mode of blades. In the finite element model this mode appeared in the neighbourhood of533 Hz.
4.2. Steady-state vibration analysis
Based on the steady-state vibration experimental and finite element results at the speeds of 20 Hz and 40 Hz, thefollowing remarks are emerged:
1. The low frequency vibration at 2 Hz produced by the experiment was not shown by the finite element simulationsdue to the shorter segment of the shaft used in the model and due to not accounting for the motor mass momentof inertia. This frequency was not shown by either the blade tip or root vibration or by the PZT materialvoltage signal in the finite element model. Its appearance in the experiment, in the strain gage and PZT outputs,supports the notion that the PZT reflects the blade vibrations.
2. The 1X response was captured at all speeds by the finite element model simulations and by the experiments.3. The blade first free bending vibration frequency appeared in the steady-state experiments and in the finite
element simulations.4. The condition of Blade Pass Frequency (BPF) vibration was not possible to be produced in the experiments.
The finite element model simulations showed that the BPF excitation is sensed by the PZT material.5. The results of rubbing simulation in the finite element model gave little indication of rubbing vibration signature.
5. Conclusion
This research work was motivated by the need of measuring the rotating blade vibrations using a reliable, lastingand yet accurate method. This need was developed after the recognition that a good percentage of turbomachinery
M. Sunar and B.O. Al-Bedoor / Vibration measurement of rotating blades using a root embedded PZT sensor 541
failures occur due to the blade vibrations and fatigue. As a result, the objectives of this research study were identifiedas developing a method of blade vibration measurements using the root embedded PZT material. The approach toachieve the objectives of the study involved the finite element analysis and experimental studies for the non-rotating(stationary) and rotating blades. Finally, based on the finite element and experimental results presented, one canreach a conclusion that the root embedded PZT material is excellent for rotating blade vibration measurements. Thisstudy is to prove the concept and many other developments will refine the final sensor.
Acknowledgments
The authors gratefully acknowledge the support provided by King Abdulaziz City for Science and Technology(KACST) through Project # AR-19-14.
References
[1] A.V. Srinivasan, Vibrations of Bladed-Disk Assemblies – A Selected Survey,Journal of Vibration, Acoustics, Stress, and Reliability inDesign – Transactions of the ASME 106 (April 1984), 165–168.
[2] O.A. Bachau and C.H. Hong,Finite Element Approach to Rotor Blade Modelling, The Dynamics and Aeroelastic Stability Modelling ofRotor Systems Technical Workshop, Georgia Institute of Technology, December 1985, 60–67.
[3] L. Jianzhong, T. Seng and C. Zhangzhi, Numerical Analysis of the Dynamic Behaviour of Steam-Turbine Blade Group,Finite Element inAnalysis and Design 35 (2000), 337–348.
[4] N. Roy and R. Ganguli, Helicopter Rotor Blade Frequency Evolution with Damage Growth and Signal Processing,Journal of Sound andVibration 283 (20 May 2005), 821–851.
[5] B. Yardimoglu and D.J. Inman, Coupled Bending-Bending-Torsion Vibration of a Rotating Pre-twisted Beam with Aerofoil Cross-sectionand Flexible Root by Finite Element Method,Shock and Vibration 11 (2004), 637–646.
[6] R.G. Loewy and N. Khader, Structural Dynamics of Rotating Bladed-disk Assemblies Coupled with Flexible Shaft Motions,AIAA Journal22(9) (September 1984), 1319–1327.
[7] E.F. Crawley, E.H. Ducharme and D.R. Mokadam, Analytical and Experimental Investigation of Coupled Bladed Disk/Shaft Whirl of aCantilever Turbofan,Journal of Engineering for Gas Turbines and Power – Transactions of the ASME 108 (October 1986), 567–576.
[8] A. Okabe, Y. Otawara and R. Kaneko, An Equivalent Reduced Modeling Method and Its Application to Shaft-blade Coupled TorsionalVibration Analysis of a Turbine Generator Set,Proceedings of the Institute of Mechanical Engineers, Part A, Journal of Power and Energy205 (1991), 173–181.
[9] B.O. Al-Bedoor, Dynamic Model of Coupled Shaft Torsional and Blade Bending Deformations in Rotors,Computer Methods in AppliedMechanics and Engineering 169 (1999), 177–190.
[10] A.J. Scalzo, J.M. Allen and R.J. Antos, Analysis and Solution of a Non-Synchronous Vibration Problem in the Last Row Turbine Blade ofa Large Industrial Turbine,Journal of Engineering for Gas Turbines and Power – Transactions of the ASME 108 (October 1986), 591–598.
[11] D.M. Tang and E.H. Dowell, Experimental and Theoretical Study for Non-Linear Aeroelastic Behaviour of a Flexible Rotor Blade,AIAAJournal 31(6) (June 1993), 1133–1142.
[12] J.S. Rao and N.S. Vyas, Determination of Blade Stresses under Constant Speed and Transient Conditions with Nonlinear Damping,Journalof Engineering for Gas Turbines and Power – Transactions of the ASME 118 (April 1996), 424–433.
[13] J. Szwedowicz, S.M. Senn and R.S. Abhari, Optimum Strain Gage Application to Bladed Assemblies,Journal of Turbomachinery –Transactions of the ASME 124(4) (October 2002), 606–613.
[14] R.A. Cookson and P. Bandyopadhyay, A Fibre-Optic Laser-Doppler Probe for Vibration Analysis of Rotating Machines,Journal of Power –Transactions of the ASME 102 (July 1980), 607–612.
[15] P. Castellini and C. Santolini, Vibration Measurement on Blades of a Naval Propeller Rotating in Water with Tracking Laser Vibrometer,Measurement 24 (1998), 43–54.
[16] W.C. Laws and A. Muszynska, Periodic and Continuous Vibration Monitoring for Preventive/Predictive Maintenance of Rotating Machin-ery,Journal of Engineering for Gas Turbines and Power – Transactions of the ASME 109 (April 1987), 159–167.
[17] K. Mathioudakis, E. Loukis and K.D. Papailiou, Casing Vibration and Gas-Turbine Operating-Conditions,Journal of Engineering for GasTurbines and Power – Transactions of the ASME 112(4) (October 1990), 478–485.
[18] B.O. Al-Bedoor, Reduced-Order Non-Linear Dynamic Model of Coupled Shaft-Torsional and Blade-Bending Vibrations in Rotors,Journalof Engineering for Gas Turbines and Power – Transactions of the ASME 123 (2001), 82–88.
[19] M. Sunar and S.S. Rao, Recent Advances in Sensing and Control of Flexible Structures via Piezoelectric Materials Technology,ASMEApplied Mechanics Reviews 52 (1999), 1–16.
[20] ANSYS, Release 7.0, ANSYS, Inc., Canonsburg, Pennsylvania, USA, 2000.[21] B.O. Al-Bedoor, Transient Torsional and Lateral Vibrations of Unbalanced Rotors with Rotor-to-Stator Rubbing,Journal of Sound and
Vibration 229(3) (2000), 627–645.[22] Y. Al-Nassar and B.O. Al-Bedoor, On the Vibration of Rotating Blade on Torsionally Flexible Shaft,Journal of Sound and Vibration
259(5) (2003), 1237–1242.

International Journal of
AerospaceEngineeringHindawi Publishing Corporationhttp://www.hindawi.com Volume 2010
RoboticsJournal of
Hindawi Publishing Corporationhttp://www.hindawi.com Volume 2014
Hindawi Publishing Corporationhttp://www.hindawi.com Volume 2014
Active and Passive Electronic Components
Control Scienceand Engineering
Journal of
Hindawi Publishing Corporationhttp://www.hindawi.com Volume 2014
International Journal of
RotatingMachinery
Hindawi Publishing Corporationhttp://www.hindawi.com Volume 2014
Hindawi Publishing Corporation http://www.hindawi.com
Journal ofEngineeringVolume 2014
Submit your manuscripts athttp://www.hindawi.com
VLSI Design
Hindawi Publishing Corporationhttp://www.hindawi.com Volume 2014
Hindawi Publishing Corporationhttp://www.hindawi.com Volume 2014
Shock and Vibration
Hindawi Publishing Corporationhttp://www.hindawi.com Volume 2014
Civil EngineeringAdvances in
Acoustics and VibrationAdvances in
Hindawi Publishing Corporationhttp://www.hindawi.com Volume 2014
Hindawi Publishing Corporationhttp://www.hindawi.com Volume 2014
Electrical and Computer Engineering
Journal of
Advances inOptoElectronics
Hindawi Publishing Corporation http://www.hindawi.com
Volume 2014
The Scientific World JournalHindawi Publishing Corporation http://www.hindawi.com Volume 2014
SensorsJournal of
Hindawi Publishing Corporationhttp://www.hindawi.com Volume 2014
Modelling & Simulation in EngineeringHindawi Publishing Corporation http://www.hindawi.com Volume 2014
Hindawi Publishing Corporationhttp://www.hindawi.com Volume 2014
Chemical EngineeringInternational Journal of Antennas and
Propagation
International Journal of
Hindawi Publishing Corporationhttp://www.hindawi.com Volume 2014
Hindawi Publishing Corporationhttp://www.hindawi.com Volume 2014
Navigation and Observation
International Journal of
Hindawi Publishing Corporationhttp://www.hindawi.com Volume 2014
DistributedSensor Networks
International Journal of