
Thesis Main Document V7 - TDL
52
ABSTRACT Characterization of the Metallo-β-Lactamase from Pseudomonas aeruginosa, IMP-1 Nicole R. Solida, M.S. Mentor: Sung-Kun Kim, Ph.D. The rate at which pathogenic bacteria are gaining antibiotic resistance has become increasingly alarming. Major contributors of this antibiotic resistance in microbes are a class of enzymes known as β-lactamases. These enzymes are effective in breaking down the most commonly prescribed antibiotics at present. This work investigates two separate metallo-β-lactamase enzymes, first IMP-1, which provides antibiotic resistance to Pseudomonas aeruginosa, and second Bla2, which grants antibiotic resistance to Bacillus anthracis. The main focus of this work was to investigate and characterize IMP-1 according to its activity and stability in temperature and pH. This was done in an effort to increase the general knowledge for potential inhibitors to be designed. The secondary focus of this work was to examine the ability of novel hydroxamate compounds to inhibit the growth of bacterial cells expressing Bla2. In addition to this work, aptamers were investigated as a potential means of future inhibitor design.
Transcript of Thesis Main Document V7 - TDL
ABSTRACT
Characterization of the Metallo-β-Lactamase from Pseudomonas aeruginosa, IMP-1
Nicole R. Solida, M.S.
Mentor: Sung-Kun Kim, Ph.D.
The rate at which pathogenic bacteria are gaining antibiotic resistance has become
increasingly alarming. Major contributors of this antibiotic resistance in microbes are a
class of enzymes known as β-lactamases. These enzymes are effective in breaking down
the most commonly prescribed antibiotics at present. This work investigates two separate
metallo-β-lactamase enzymes, first IMP-1, which provides antibiotic resistance to
Pseudomonas aeruginosa, and second Bla2, which grants antibiotic resistance to Bacillus
anthracis. The main focus of this work was to investigate and characterize IMP-1
according to its activity and stability in temperature and pH. This was done in an effort
to increase the general knowledge for potential inhibitors to be designed. The secondary
focus of this work was to examine the ability of novel hydroxamate compounds to inhibit
the growth of bacterial cells expressing Bla2. In addition to this work, aptamers were
investigated as a potential means of future inhibitor design.
Characterization of the Metallo-β-Lactamase from Pseudomonas aeruginosa, IMP-1 by
Nicole R. Solida, B.S.
A Thesis Approved by the Department of Chemistry and Biochemistry
___________________________________
Patrick J. Farmer, Ph.D., Chairperson
Submitted to the Graduate Faculty of Baylor University in Partial Fulfillment of the
Requirements for the Degree of
Master of Science
Approved by the Thesis Committee
_________________________________ Sung-Kun Kim, Ph.D., Chairperson
_________________________________
Sung Joon Kim, Ph.D.
_________________________________ Cheolho Sim, Ph.D.
Accepted by the Graduate School May 2014
________________________________
J. Larry Lyon, Ph.D., Dean
Page bearing signatures is kept on file in the Graduate School.

Copyright © 2014 by Nicole R. Solida
All rights reserved
iv
TABLE OF CONTENTS
LIST OF FIGURES ........................................................................................................... vi LIST OF TABLES ............................................................................................................ vii LIST OF ABBREVIATIONS .......................................................................................... viii ACKNOWLEDGMENTS ................................................................................................. ix CHAPTER ONE ..................................................................................................................1 Introduction ......................................................................................................................1 CHAPTER TWO .................................................................................................................6 Materials and Methods .....................................................................................................6 Expression and Purification of IMP-1 .........................................................................6 Enzyme Assay with Penicillin G ..................................................................................8 Temperature Stability ...................................................................................................8 pH Dependence ............................................................................................................9 Inhibition Tests with EDTA and βME ..........................................................................9 MIC Testing of B. subtilis ..........................................................................................10 Preparation of DNA Affinity Column ........................................................................11 Determination of Amine-modified Linker Coupling ..................................................12 CHAPTER THREE ...........................................................................................................15 Results ............................................................................................................................15 Purification of IMP-1 and Kinetic Parameters .........................................................15 Effects of Temperature and pH ..................................................................................17 IC50 of EDTA and βME ..............................................................................................20 MIC Testing of B. subtilis ..........................................................................................21 Confirmation of Linker Coupling to DNA Affinity Column .......................................24 CHAPTER FOUR ..............................................................................................................26 Discussion ......................................................................................................................26 Purification of IMP-1 and Kinetic Parameters .........................................................26 Effects of Temperature and pH ..................................................................................27 IC50 of EDTA and βME ..............................................................................................29 MIC Testing of B. subtilis ..........................................................................................30 DNA Affinity Column .................................................................................................31 CHAPTER FIVE ...............................................................................................................33 Conclusions ....................................................................................................................33

v
APPENDIX ........................................................................................................................35 REFERENCES ..................................................................................................................42

vi
LIST OF FIGURES
Figure 1 Amino acid sequence alignment of IMP-1 with other class B1 MBLs ................3 Figure 2 The 3D structure of IMP-1 ...................................................................................4 Figure 3 SDS-PAGE analysis of purified IMP-1 ..............................................................16 Figure 4 Kinetic activity of IMP-1 against penicillin G at
room temperature and pH 8.0 ..........................................................................17 Figure 5 Graphic analysis of IMP-1 temperature stability data ........................................19 Figure 6 pH dependence of kinetic parameters for IMP-1 ...............................................20 Figure 7 Determination of IC50 of EDTA and βME for IMP-1 ........................................22 Figure 8 PCR results of washes removing template DNA from affinity column .............25
vii
LIST OF TABLES
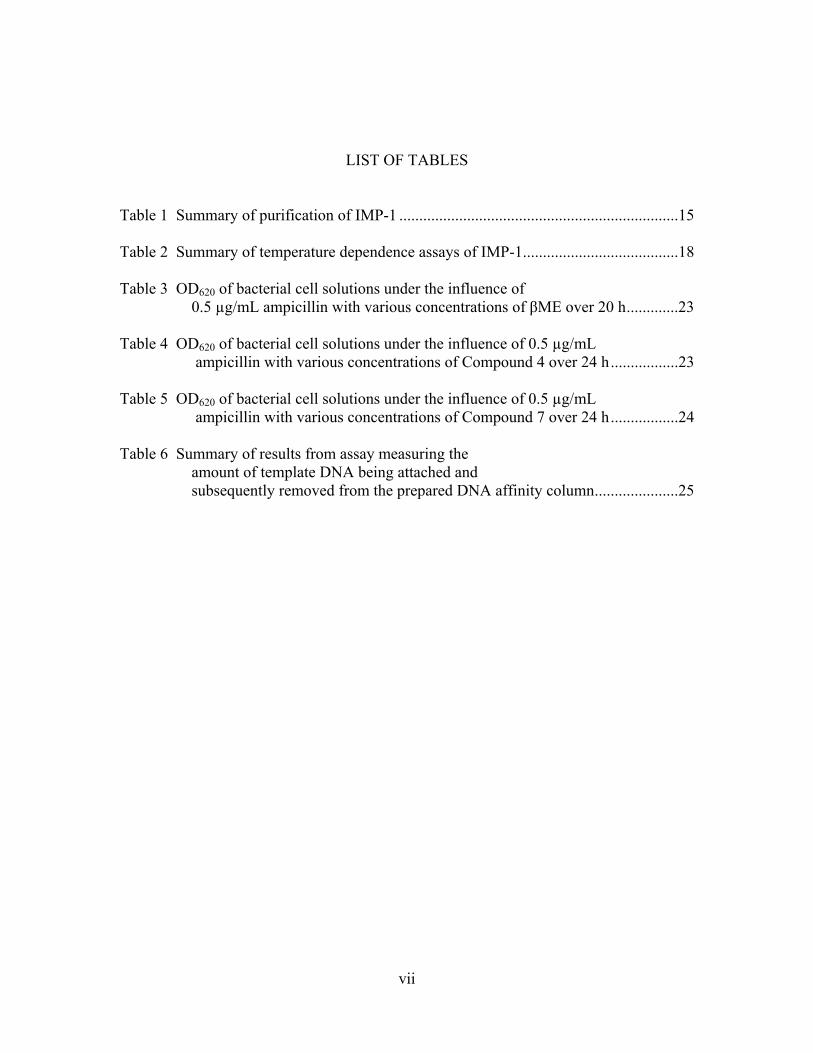
Table 1 Summary of purification of IMP-1 ......................................................................15 Table 2 Summary of temperature dependence assays of IMP-1 .......................................18 Table 3 OD620 of bacterial cell solutions under the influence of
0.5 µg/mL ampicillin with various concentrations of βME over 20 h .............23 Table 4 OD620 of bacterial cell solutions under the influence of 0.5 µg/mL
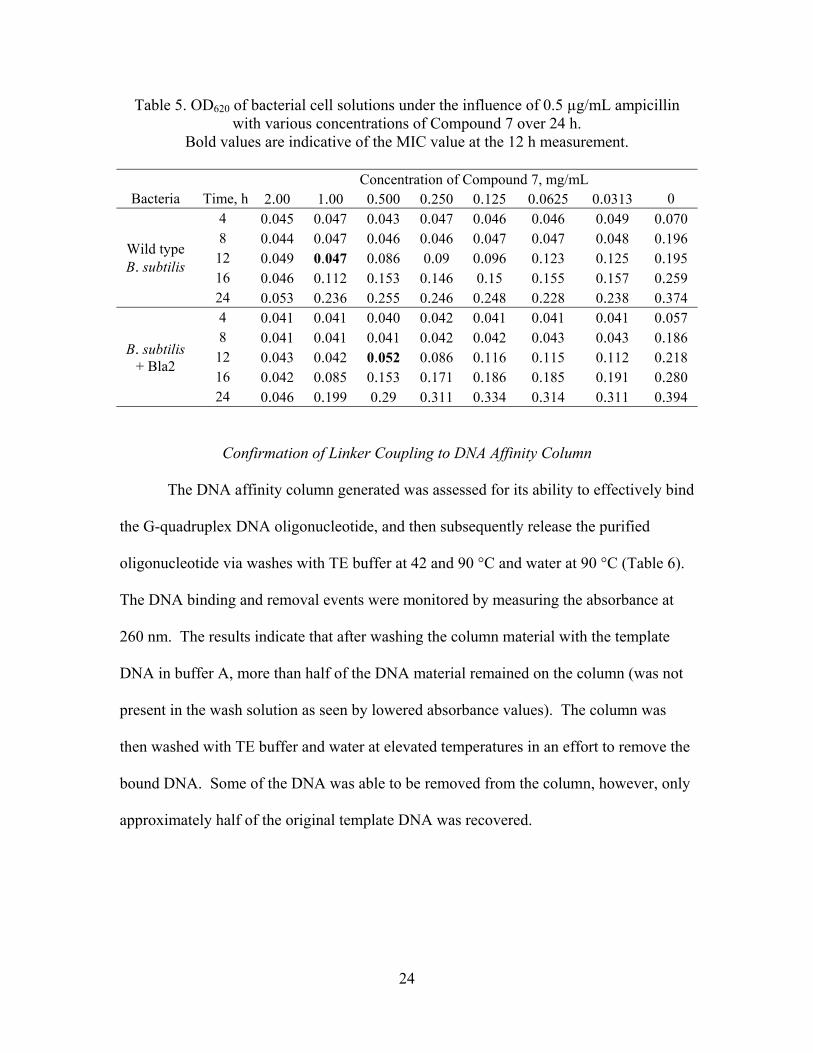
ampicillin with various concentrations of Compound 4 over 24 h .................23 Table 5 OD620 of bacterial cell solutions under the influence of 0.5 µg/mL
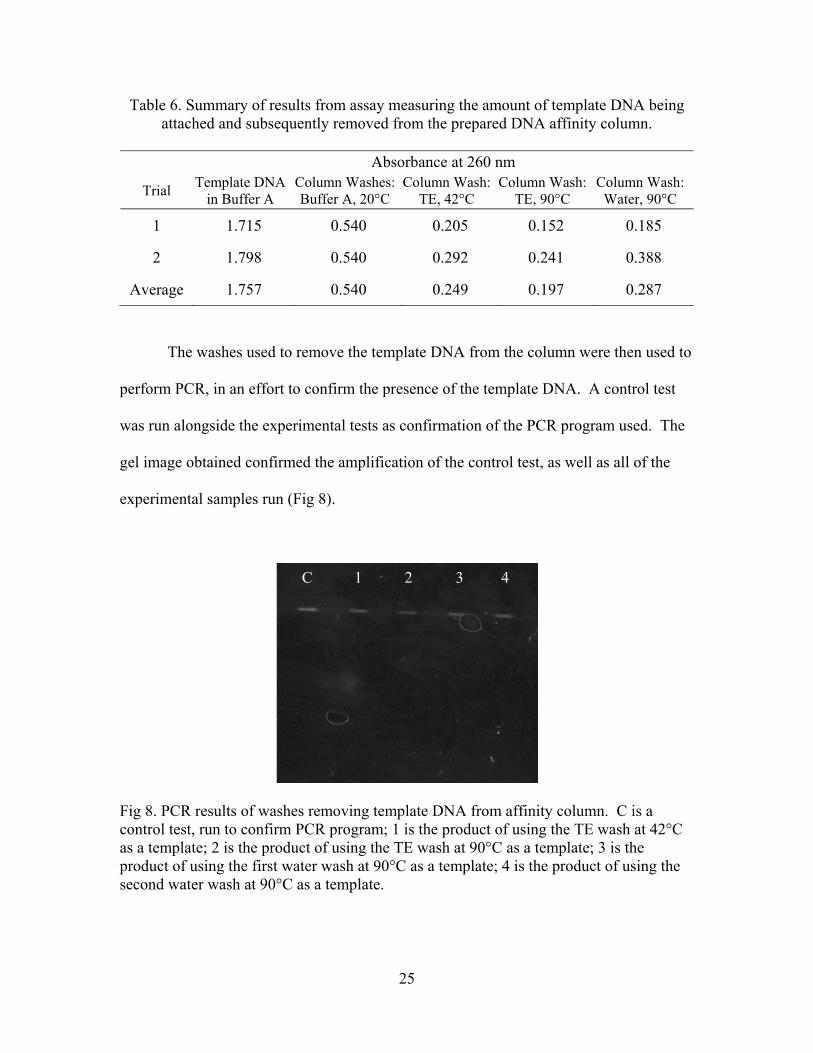
ampicillin with various concentrations of Compound 7 over 24 h .................24 Table 6 Summary of results from assay measuring the
amount of template DNA being attached and subsequently removed from the prepared DNA affinity column .....................25
viii
LIST OF ABBREVIATIONS
Bla2 – metallo-β-lactamase from Bacillus anthracis βME – β-mercaptoethanol CFU – colony forming units DMSO – dimethyl sulfoxide EDAC – 1-(3-dimethylaminopropyl)-3-ethyl-carbodiimide hydrochloride EDTA – ethylenediaminetetraacetic acid HEPES – 4-(2-hydroxyethyl)-1-piperazineethanesulfonic acid IC50 value – concentration of inhibitor necessary to inhibit 50% of enzyme activity IMP-1 – metallo-β-lactamase from Pseudomonas aeruginosa IPTG – isopropylthio-β-D-galactopyranoside LB – Luria-Bertani media MBL – metallo-β-lactamase MES – 2-(N-Morpholino)ethanesulfonic acid MH – Mueller-Hinton broth MIC – minimum inhibitory concentration MOPS – 3-(N-Morpholino)propanesulfonic acid NHS – N-hydroxysuccinimide OD – Optical density ss – single stranded TAPS – N-[Tris(hydroxymethyl)methyl]-3-aminopropanesulfonic acid TE – Tris-EDTA
ix
ACKNOWLEDGMENTS
This work was in part funded by the Undergraduate Research and Scholarly
Achievement grant at Baylor University. Acknowledgment goes to Christopher Taylor
and Drs. Jugeshwar Kshetrimayum, Nelson van der Velde, Sung Joon Kim, and
Sung-Kun Kim for their collaboration and contribution to this work.
I would like to further acknowledge my mentor, Dr. Sung-Kun Kim, for his
guidance and support, and without whom this work would not have been possible. I have
a great appreciation for the commitment he made to my graduate education and
experience. I also would like to recognize the other members of my research group, past
and present, for their continued support throughout this journey. Thank you Dr. Mieke
Lahousse, Myung Cho, M.S., and Sara Schlesinger (soon to be Ph.D.) for welcoming me
into your lab space with open arms. I am forever grateful to you for your kindness and
willingness to teach a ‘newbie’ the lab skills necessary for survival in a biochemistry
research lab.
Finally I would like to express my greatest appreciation for my Mom and Dad,
my brother, Allen, and my boyfriend, Brandon. Without the encouragement of these
people, I may never have even entered graduate school, and I am grateful for their
commitment to me throughout this process. They have been the greatest support
structure I could have asked for, and I hope that my work in this thesis will make them
proud.
1
CHAPTER ONE
Introduction
Due to the overuse and misuse of antibiotics, drug resistance among infectious
pathogens, including Pseudomonas aeruginosa, has been increasing1–3. This resistance is
a serious problem, especially in nosocomial and immunosuppressed patients, who have
an increased risk of infection, and in which infection is more harmful4. One of the most
commonly prescribed classes of antibiotics are β-lactam antbiotics, which are among the
most effective antibiotics for Gram-negative bacterial infections5. The problem,
however, lies in the ability of these bacteria to gain resistance to antibiotics through a
variety of methods, one of which is to produce enzymes that break down a drug and
inactivate it 6. β-lactamases are among those enzymes that have developed for this
purpose, specifically neutralizing β-lactam antibiotics, such as penicillins,
cephalosporins, and carbapenems, by hydrolyzing the amide bond of the lactam ring,
leaving behind an inactive β-amino acid. In response to this increasing bacterial
resistance, there has been development of β-lactamase inhibitors. Common β-lactamase
inhibitors include penicillanic acid sulfone and clavulanic acid 7. These inhibitors work
for serine-β-lactamases by binding to the serine residue in the active site, but the
compounds fail to inhibit another type of β-lactamase known as metallo-β-lactamases
(MBLs) 7. In fact, MBLs belong to group B out of the four types of β-lactamases in their
classification system (A through D), where group A, C, and D belong to serine-β-
lactamases. The group B MBL has three subclasses, B1-B3 8. The subclass B1 enzymes

2
have two zinc ions, where a tightly bound zinc with a tetrahedral geometry coordinated
by three His residues and one solvent molecule is called Zn1, and a relatively loose
bound zinc with a distorted trigonal bipyramidal geometry coordinated by three different
amino acid residues (His, Cys, Asp), a water molecule and a solvent such as glycerol is
called Zn2. The subclass B2 enzymes have only one zinc ion, and the subclass B3
enzymes have two tightly bound zinc ions in the active site.
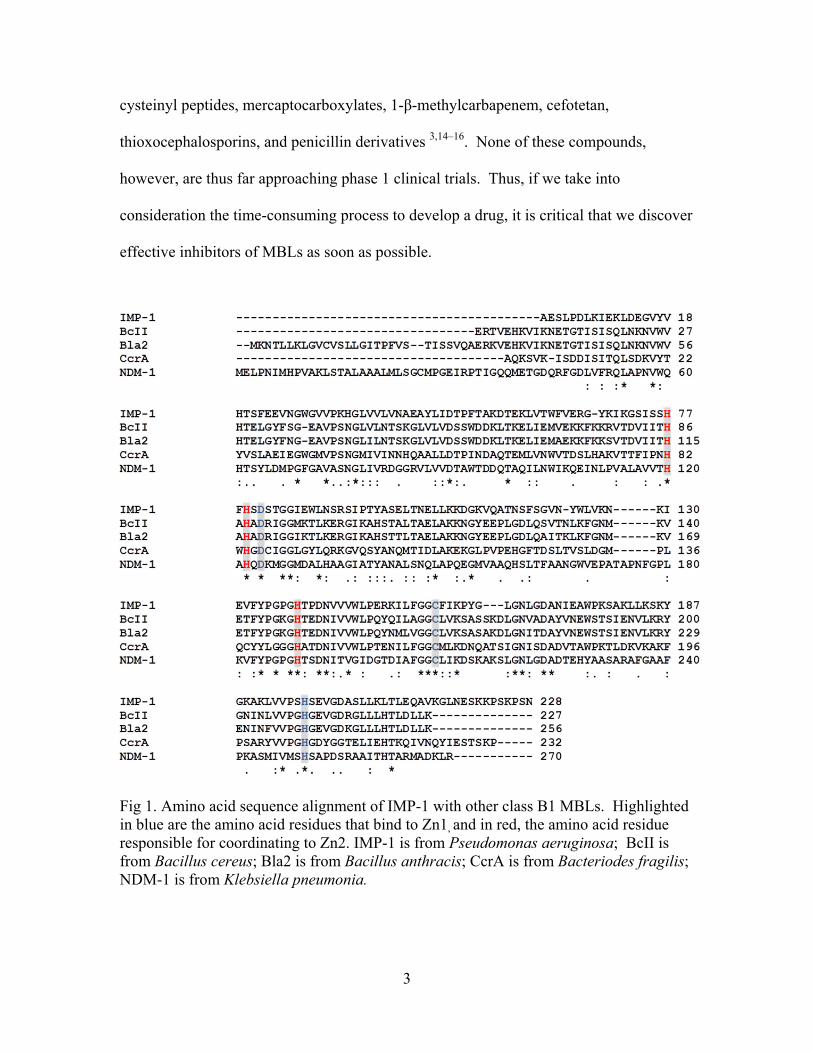
IMP-1 is a subclass B1 MBL9, and was initially isolated only from Pseudomonas
aeruginosa 10,11. In the amino acid sequence, IMP-1 possesses the key conserved
sequences that hold two zinc ions (Fig 1) and shows its ability to hydrolyze carbapenems,
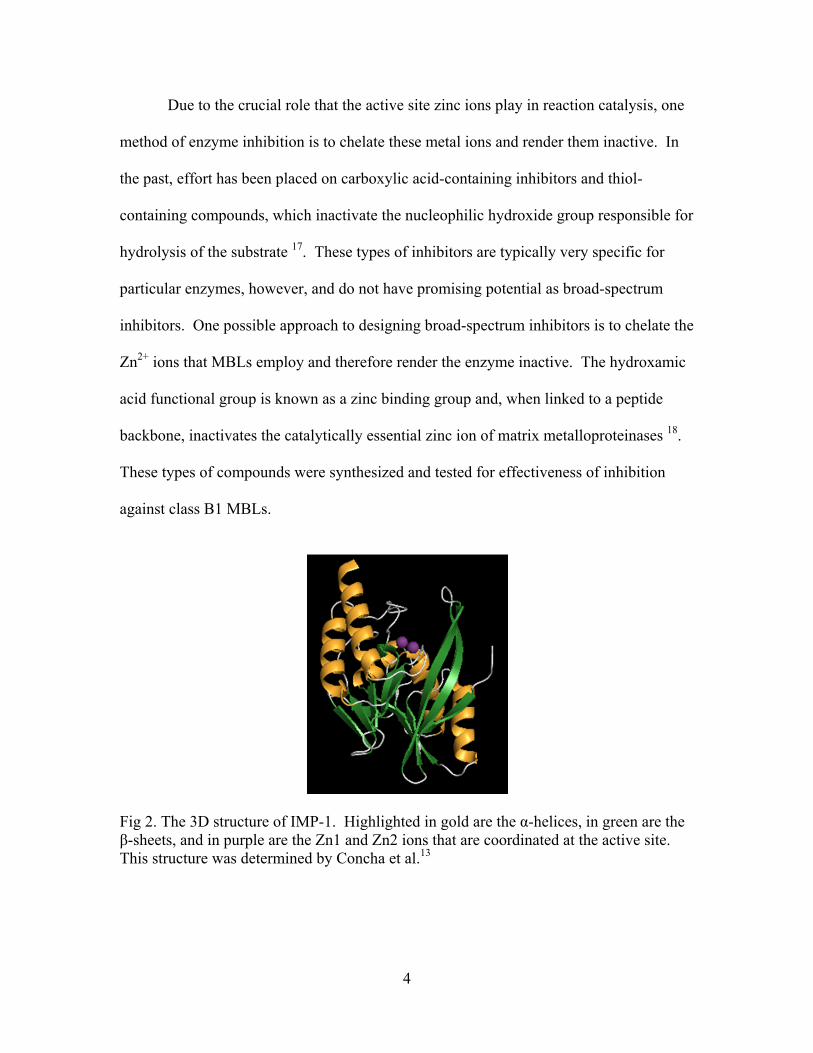
cephalosporins, and penicillins 1,12. The 3D structure of IMP-1 has been solved, as
shown in Figure 2, and shows that the overall structure of IMP-1 is similar to other B1
MBLs in its characteristic α-β-β-α folding 13. IMP-1 has shown its ability to be spread
through horizontal gene transfer through plasmids and transposons 10,11; thus, the gene
blaIMP-1 has been isolated in several pathological bacteria, including P. aeruginosa and
Klebsiella pneumoniae 1.
IMP-1 is clinically important because it has an extended spectrum of substrate
specificity, lacks clinically useful inhibitors, and, as mentioned previously, can be spread
between species and genera of Gram-negative bacteria 3. With increasing resistance in
bacteria, especially opportunistic pathogens that can infect those with weakened immune
systems, it is important to combat this resistance by finding inhibitors that will allow for
current drugs to be useful again. Inhibitor design has been extensively studied and
includes thioester derivatives, trifluoromethyl alcohols and ketones, thiols, sulfonyl
hydrazones, tricyclic natural products, succinic acid derivatives, biphenyl tetrazoles,
3
cysteinyl peptides, mercaptocarboxylates, 1-β-methylcarbapenem, cefotetan,
thioxocephalosporins, and penicillin derivatives 3,14–16. None of these compounds,
however, are thus far approaching phase 1 clinical trials. Thus, if we take into
consideration the time-consuming process to develop a drug, it is critical that we discover
effective inhibitors of MBLs as soon as possible.
Fig 1. Amino acid sequence alignment of IMP-1 with other class B1 MBLs. Highlighted in blue are the amino acid residues that bind to Zn1, and in red, the amino acid residue responsible for coordinating to Zn2. IMP-1 is from Pseudomonas aeruginosa; BcII is from Bacillus cereus; Bla2 is from Bacillus anthracis; CcrA is from Bacteriodes fragilis; NDM-1 is from Klebsiella pneumonia.
4
Due to the crucial role that the active site zinc ions play in reaction catalysis, one
method of enzyme inhibition is to chelate these metal ions and render them inactive. In
the past, effort has been placed on carboxylic acid-containing inhibitors and thiol-
containing compounds, which inactivate the nucleophilic hydroxide group responsible for
hydrolysis of the substrate 17. These types of inhibitors are typically very specific for
particular enzymes, however, and do not have promising potential as broad-spectrum
inhibitors. One possible approach to designing broad-spectrum inhibitors is to chelate the
Zn2+ ions that MBLs employ and therefore render the enzyme inactive. The hydroxamic
acid functional group is known as a zinc binding group and, when linked to a peptide
backbone, inactivates the catalytically essential zinc ion of matrix metalloproteinases 18.
These types of compounds were synthesized and tested for effectiveness of inhibition
against class B1 MBLs.
Fig 2. The 3D structure of IMP-1. Highlighted in gold are the α-helices, in green are the β-sheets, and in purple are the Zn1 and Zn2 ions that are coordinated at the active site. This structure was determined by Concha et al.13
5
This body of work is focused on describing an improved purification method for
IMP-1 from P. aeruginosa and characterizing this enzyme with respect to optimal
temperature and pH and reporting enzyme kinetic parameters that provide insight into the
acid-base chemical mechanism of IMP-1. Furthermore, the susceptibility of IMP-1 to
ethylenediamineteraacetic acid (EDTA) and β-mercaptoethanol (βME) was investigated
and results are reported in the form of an IC50 determination. In addition, the MBL from
Bacillus anthracis, known as Bla2, was expressed in Bacillus subtilis cells and
compounds containing hydroxamic acid moieties were utilized for examining their effect
on the growth of these bacterial cells. Lastly, a G-quadruplex aptamer was developed for
potential research projects involving the neuraminidase enzyme (H5N1) and a DNA
affinity column was generated for purification purposes.
6
CHAPTER TWO
Materials and Methods
Expression and Purification of IMP-1
Plasmid pET15b-IMP-1, a pET 15b vector containing a cloned copy of the blaIMP
gene of P. aeruginosa (GenBank: DQ842025.1), was purchased from Genewiz, Inc.
(South Plainfield, NJ). The plasmid pET15b-IMP-1 was transformed in E. coli
BL21(DE3). For large scale expression, a 40 mL overnight culture of E. coli BL21(DE3)
with the pET15b-IMP-1 plasmid was used to inoculate 4 × 1 L of Luria-Bertani (LB)
medium containing ampicillin (50 μg/mL), where LB is composed of trypsin, yeast
extract and sodium chloride: 10g:5g:10g in one liter. The culture was grown at 37 °C
with shaking at 250 rpm using a New Brunswick Scientific Excella E25 incubator/shaker
until it reached an optical density at 600 nm (OD600nm) of 0.6 - 1.0. The optical density
was measured using an Eppendorf BioPhotometer plus photometer. Protein expression
was induced by the addition of isopropylthio-β-D-galactopyranoside (IPTG) to a final
concentration of 1 mM. The cultures were further incubated at 30 °C with shaking at 250
rpm for another 6 hrs. The bacteria were then harvested by centrifuging the cultures in
Beckman bottles at 4750 rpm for 20 min using a Beckman Coulter Allegra® X-15R
centrifuge. The supernatant was discarded and the cell pellet stored in a -80 ºC freezer.
IMP-1 was purified according to Schlesinger et al.19 with several modifications.
The frozen cells were thawed and transferred into a beaker with 5 mL of buffer A (30
mM Tris-HCl at pH 8.0 with 100 mM NaCl) per liter of medium used, for a total 20 mL.
7
The resuspended cells were then lysed through a French press (Thermo Electron
Corporation French Press Cell Disruptor) at 1200 psi for 6 min. This process was
repeated for a total of four times. The cell lysate was then centrifuged (Beckman Coulter
Avanti® J-26 XP) at 20,000 rpm for 20 min. The supernatant was then filtered three
times with 0.8 μm MilliporeTM Millex® Syringe-driven Filter units and twice more with
0.45 μm MilliporeTM Millex® Syringe-driven Filter units before column chromatography.
The filtered supernatant was loaded on to a Ni2+-affinity column (GE Healthcare)
attached to a liquid chromatography system (BioLogic LP, Bio-Rad) that had been
previously equilibrated with buffer A. The column was washed with a linear gradient of
1-3% buffer B (30 mM Tris-HCl at pH 8.0 with 100 mM NaCl and 500 mM imidazole)
with buffer A over 60 min, which was then followed by elution of the protein using a
linear gradient of 3.0 - 50% buffer B with buffer A. The protein was eluted with 26.5
mM NaCl and 132.5 mM imidazole. The fractions containing IMP-1 were collected and
concentrated using Ultra-15 centrifugal filters (EMD Millipore) by centrifuging at 4,000
rpm for 20 min. Precipitation occurred and the samples were centrifuged at 5000 rpm for
5 min in micro-centrifuge tubes. The protein from the micro-centrifuge tubes were
consolidated and concentrated again at the same settings as before. The protein was
extracted from the concentrator and the protein was reloaded for buffer exchange. Buffer
A was added to the concentrator and then centrifuged at the same settings as before for a
total of two times. Once buffer exchange was complete, the protein was concentrated
once more at the same settings. Glycerol was added to 10% (v/v) and the resulting
protein solution was stored at -20oC. The protein concentration was measured at 280 nm
and calculated using an extinction coefficient of 45,000 M-1cm-1 and mass of
8
27,692.52 g/mol for IMP-1. Throughout the purification process, 50 μl aliquots were
taken from the lysed cells, the supernatant, the column fractions and the concentrated
protein to be analyzed for enzymatic activity.
Enzyme Assay with Penicillin G
IMP-1, in 30 mM Tris-HCl buffer at pH 8.0 containing100 mM NaCl and 10%
(v/v) glycerol, was assayed in in a mixture that contained 500 μl of 30 mM Tris-HCl (pH
7.0), 7 μl 0.4025 mg IMP-1/ml (a 20x dilution from the original concentration), varying
volumes of 50 mM penicillin G, and water to give a final volume of 1 mL (a final buffer
concentration of 15 mM Tris-HCl). The assay was performed at room temperature and
the reaction was initiated with the addition of enzyme. UV spectroscopy (Shimadzu UV-
2450) was used to monitor the reaction by measuring the decrease in absorbance due to
hydrolysis of penicillin G at 235 nm. The extinction coefficient (ε) used to perform
calculations was 775 M- 1 cm-1 20. Averages are reported based on three independent
measurements. One activity unit is defined as the amount of enzyme required to catalyze
the hydrolysis of 1μM penicillin G in 1 min at 25°C.
Temperature Stability
To evaluate the temperature stability of IMP-1, the enzyme was incubated in
water baths (Fisher Scientific Isotemp 202) of varying temperatures (20, 30, 40, 50, 60,
and 70°C) and tested for activity every 30 min for up to 4 hrs. The enzymes assays were
performed using 500 μL of 30 mM Tris-HCl (pH 7.0), 40 μL of 50 mM penicillin G, 7
μL 0.4025 mg IMP-1/ml, and 453 μL of dH2O for a total volume of 1 mL (a final
concentration of 2 mM penicillin G as substrate). Again, the change in absorbance at 235
9
nm was monitored, however the temperature of the UV/Vis chamber was adjusted to
match the assay being performed using a Fisher Scientific Isotemp 3016S system.
pH Dependence
To analyze the pH dependence of the enzyme activity, IMP-1 was mixed into
buffers of varying pH and enzyme assays were performed. The assays to investigate the
pH dependence of the rate were performed similarly to the enzyme assay to find the
kinetic parameters, with the only difference being the buffers. kcat and Km were found
using penicillin G as a substrate from pH 5.5 to 9.0, with a 0.5 step. To test the activity
between the pH range from 5.5 to 6.5, 100 mM 2-(N-Morpholino)ethanesulfonic acid (MES)
buffer was used, 100 mM 3-(N-Morpholino)propanesulfonic acid (MOPS) buffer was
employed for the pH range between 6.5 and 7.5, 100 mM 4-(2-hydroxyethyl)-1-
piperazineethanesulfonic acid (HEPES) buffer was utilized for the pH range from 7.0 to
8.0, and 100 mM N-[Tris(hydroxymethyl)methyl]-3-aminopropanesulfonic acid (TAPS) buffer
was used for the pH range between 8.0 and 9.0.
Data for kcat and kcat/Km pH profiles were fitted using Equation 1.
log y = log[C/1 + (K/H)] (Eq. 1)
In Equation 1, K represents the dissociation constant of the enzyme, y is the value of the
parameter observed as a function of pH, H is the hydrogen ion concentration, and C is the
pH-independent value of y.
Inhibition Tests with EDTA and βME
EDTA and βME were used to test for inhibition of IMP-1 activity. An enzyme
assay was performed in the form of an IC50 determination, which defines the
10
concentration of inhibitor necessary to inhibit 50% of the enzyme’s activity. Varying
concentrations of EDTA from 1.0 nM – 1.0 mM or of βME from 1.0 nM – 10 mM were
used before initiating the reaction with penicillin G. Reported values are based on the
averages of three trials.
MIC Testing of B. subtilis
The MIC of β-mercaptoethanol (βME) and compounds 4 and 8 was determined
for Bacillus subtilis cells with or without the Bla2 plasmid. The vector pHT01 containing
the Bla2 gene was constructed and transformed into Bacillus subtilis cells by Soo-Keun
Choi in the Systems and Synthetic Biology Research Center of the Korea Research
Institute of Bioscience and Biotechnology located in Daejeon, Republic of Korea.
Bacterial cells were incubated 24 hours in Luria-Bertani (LB) media with or without
chloramphenicol (5 μg/mL) as a selection agent. A volume of 100 µL of this culture was
then spread on agar plates with or without chloramphenicol (30 μg/mL) and incubated
(Fisher Scientific Isotemp Incubator) at 37°C for 12 hours to determine the CFU of the 24
hour culture. The 24 hour culture was stored at room temperature while the CFU was
being determined.
After determining the CFU, the 24 hour culture was able to be diluted with sterile
LB media to give approximately 106 bacteria per mL. Ampicillin was prepared fresh to a
final concentration of 1.5 μg/mL in Mueller-Hinton broth. β-mercaptoethanol solution
was also freshly prepared to a stock concentration of 17.2 mg/mL and then serially
diluted twofold in MH broth.
Two novel hydroxamate compounds, named compound 4 and compound 7, were
synthesized under the guidance of Dr. Shin at McMurry University. Solutions of
11
compounds 4 and 7 were prepared by dissolving the compound in 30% DMSO in water,
followed by dilution to the final stock concentration in MH broth without additional
DMSO, and then immediately added to a 96-well microplate. A volume of 50 μL of
Ampicillin was added to the wells of a 96-well microplate with either 50 μL βME for the
MIC determination of βME, 50 μL MH broth containing compound 4 for the MIC
determination of compound 4, or 50 μL MH broth containing compound 7 for the MIC
determination of compound 7. After the addition of 50 μL of the bacterial cell samples,
the wells were mixed and incubated at 37°C for 24 hours. The plates were measured
every 4 hours (except hour 20) at 620 nm with a Thermo Scientific Multiscan MCC/340
microplate reader after 20 seconds of shaking at 1200 rpm.
Preparation of DNA Affinity Column
The DNA affinity column was prepared according to Chockalingam et al.21 with
several modifications. The oligonucleotide 5’-NH2-C6-GCAAGCTTCCCCCCA-3’, an
amine-modified “linker” that contains a sequence complementary to the template DNA,
was purchased from IDT (Integrated DNA Technologies), Inc. (Coralville, IA). This
oligonucleotide was prepared to a concentration of 100 µM in sterilized water prior to
preparation of the column, and stored at -20°C.
The base silica used was from VWR (300 Å pore, cat. no. AA44099-09). 1 gram
of dry silica was measured and transferred to a glass pear-shaped flask. The system was
placed under vacuum. To the flask, 2 mL of 2-propanol containing 96 mg (0.5 mmol) of
1-(3-dimethylaminopropyl)-3-ethyl-carbodiimide hydrochloride (EDAC) was added and
mixed thoroughly. This was followed by bath sonication for 1 minute. To this mixture, 2
mL of 2-propanol containing 58 mg (0.5 mmol) of N-hydroxysuccinimide (NHS) was
12
added and mixed. Bath sonication was continued for an additional minute. The mixture
was then removed from the sonicator and placed above a stir plate. While still under
vacuum, the mixture was stirred at room temperature (19-22°C) for 1 hour.
The silica was then removed from the vacuum system and transferred to a 15 mL
polypropylene Falcon tube. The silica was washed with 4 mL portions of 2-propanol (3
times), methanol (2 times), DI water, and 0.5 M sodium phosphate buffer, pH 7.5, by
centrifugation at top speed for 1 minute. After removing the last wash, 2 mL of 0.5 M
sodium phosphate buffer, pH 7.5, and containing 11 nmol of 5’-NH2-C6-
GCAAGCTTCCCCCCA-3’ was added to the silica. This mixture was shaken for 75
minutes at room temperature. 10 mM Tris-HCl, 1 mM EDTA, pH 8.0 (TE) buffer was
added to the silica mixture and stored refrigerated at 4°C until needed.
Determination of Amine-modified Linker Coupling
The 58 base ssDNA oligonucleotide containing 12 bases of randomized sequence
(N6), 5’-GCGGATCCGGGGGGT(N6)TGGGGGGATGGGGGGT(N6)TGGGGGG-
AAGCTTGC-3’, was obtained from IDT (Integrated DNA Technologies), Inc.
(Coralville, IA). This DNA was prepared to a concentration of 500 ng/µL (27.4 µM) in
TE buffer and stored at -20°C until needed.
100 mg of the amine-modified silica (11 nmol/g) was transferred to a 2 mL
microcentrifuge tube and washed three times with 1 mL portions of Buffer A (50 mM
Tris-HCl, 75 mM KCl, 3 mM MgCl2, 10 mM dithiothreitol, pH 8.3) via centrifugation in
order to remove the storage buffer. The silica was then mixed with 5 nmol of the DNA
oligonucleotide.
13
Prior to mixing, the DNA was pretreated to form single-stranded DNA fragments.
Buffer A was added to the 5 nmol of DNA to obtain a final volume of 1 mL. The
mixture was heated to 90°C for 10 minutes, and then cooled quickly on ice for 30
minutes. The absorbance at 260 nm was measured.
After the full volume of DNA (1 mL) was added to the silica mixture, the entire
system was heated to 65°C for 10 minutes and then cooled slowly to room temperature
over the next 30 minutes. The silica was then washed (5 times) with 0.8 mL portions of
Buffer A by centrifugation for 1 minute at max speed. The washes were collected and
the absorbance was measured at 260 nm after diluting to a final volume of 1 mL. This
will allow us to observe the change in absorbance value due to the annealing of the DNA
to the column.
The column material was then washed with 0.8 mL TE buffer at 42°C via
centrifugation. The wash was collected and diluted to a final volume of 1 mL for
measuring the absorbance at 260 nm. This process was repeated with TE buffer at 90°C
and water at 90°C. Absorption values at 260 nm from the high temperature washes will
indicate success of the column. The template should elute from the amine-modified silica
in 90°C TE or water. TE buffer was added to the silica for storage in refrigeration.
To confirm that the template DNA had eluted from the column, PCR was
performed and PAGE was run to visualize the amplification of DNA. PCR was
performed using the TE buffer wash at 42°C, the TE buffer wash at 90°C, the first water
wash at 90°C, and the second water wash at 90°C as the template DNA sample. The
forward and reverse primers used were generated by IDT (Integrated DNA
Technologies), Inc. (Coralville, IA). The forward primer sequence was
14
5’-GCGGATCCGGGGGGT-3’ and the reverse primer sequence was 5’-GCAAGC
TTCCCCCCA-3’. A PCR control test was run at the same time as the wash samples to
either confirm or negate PCR success. For the control test, 1 µL of 50 ng/mL template
DNA, 1 µL of 25 µM forward primer, 1 µL of 25 µM reverse primer, 25 µL of GoTaq
Green Master Mix (Promega), and 22 µL of dH2O were pipetted into a PCR tube. These
conditions were kept constant for all experimental samples on which PCR was run. The
PCR machine was setup to perform the following program: (1) initial denaturation at
95°C for 10 minutes, (2) denaturation at 95°C for 40 sec, (3) annealing at 55°C for 40
sec, (4) elongation at 72°C for 20 sec, (5) steps 2-4 were repeated an additional 39 times
to have a total of 40 cycles, (6) final elongation step at 72°C for 5 minutes, (7) lower
temperature and hold at 4°C.
The PCR products obtained were run on polyacrylamide gel to confirm
amplification of the template DNA. A NuPage 4-12% 1.0 mm Bis-Tris gel (Novex by
Life Technologies) was set up, and 12 µL each of control PCR test, product of TE buffer
wash at 42°C, product of TE buffer wash at 90°C, product of first water wash at 90°C,
and product of second water wash at 90°C were loaded into separate wells. The gel was
run at 100 volts for 1 hour 15 minutes. Afterwards, the gel was stained with ethidium
bromide in 1x TBE buffer for 30 minutes and an image was taken under UV light.
15
CHAPTER THREE
Results
Purification of IMP-1 and Kinetic Parameters
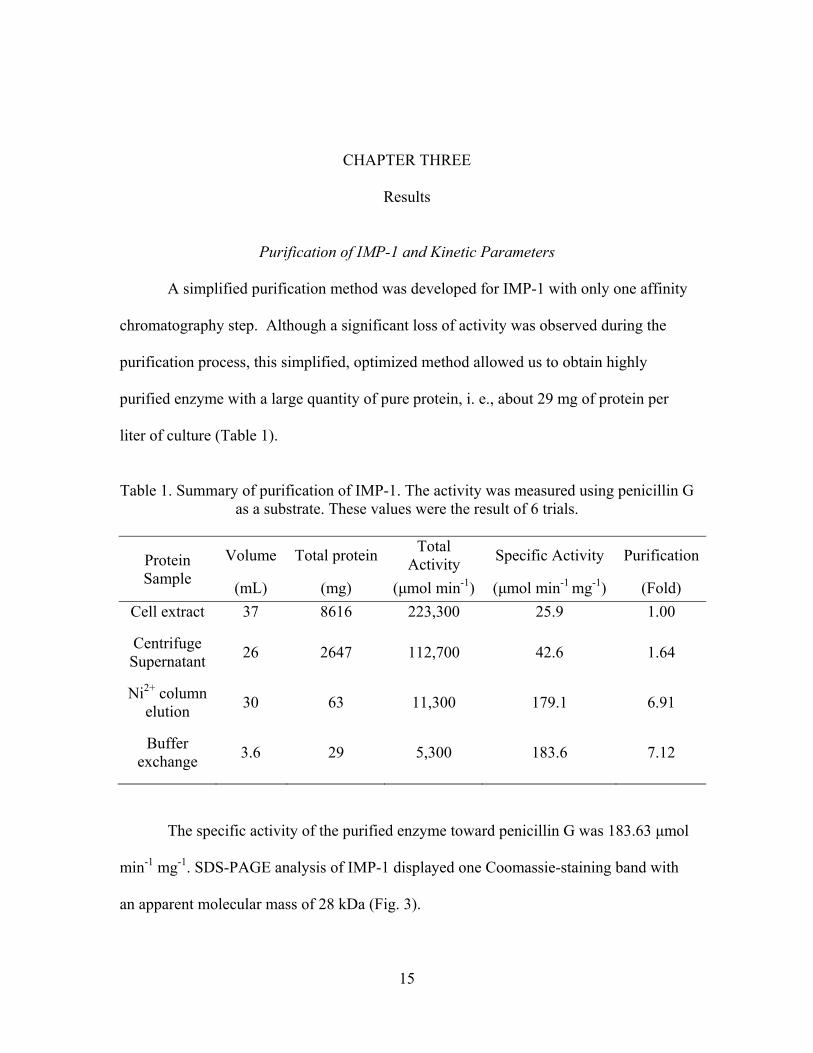
A simplified purification method was developed for IMP-1 with only one affinity
chromatography step. Although a significant loss of activity was observed during the
purification process, this simplified, optimized method allowed us to obtain highly
purified enzyme with a large quantity of pure protein, i. e., about 29 mg of protein per
liter of culture (Table 1).
Table 1. Summary of purification of IMP-1. The activity was measured using penicillin G
as a substrate. These values were the result of 6 trials.
Protein Sample
Volume Total proteinTotal
Activity Specific Activity Purification
(mL) (mg) (μmol min-1) (μmol min-1 mg-1) (Fold)
Cell extract 37 8616 223,300 25.9 1.00
Centrifuge Supernatant
26 2647 112,700 42.6 1.64
Ni2+ column elution
30 63 11,300 179.1 6.91
Buffer exchange
3.6 29 5,300 183.6 7.12
The specific activity of the purified enzyme toward penicillin G was 183.63 μmol
min-1 mg-1. SDS-PAGE analysis of IMP-1 displayed one Coomassie-staining band with
an apparent molecular mass of 28 kDa (Fig. 3).
16
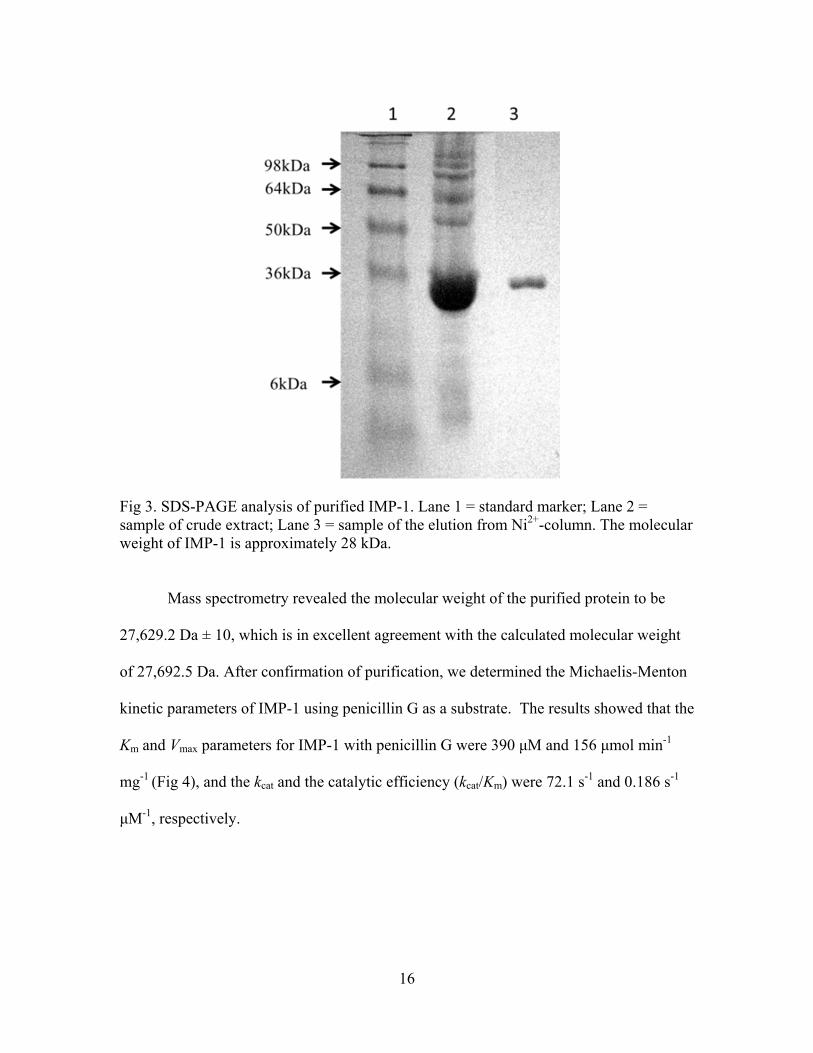
Fig 3. SDS-PAGE analysis of purified IMP-1. Lane 1 = standard marker; Lane 2 = sample of crude extract; Lane 3 = sample of the elution from Ni2+-column. The molecular weight of IMP-1 is approximately 28 kDa. Mass spectrometry revealed the molecular weight of the purified protein to be
27,629.2 Da ± 10, which is in excellent agreement with the calculated molecular weight
of 27,692.5 Da. After confirmation of purification, we determined the Michaelis-Menton
kinetic parameters of IMP-1 using penicillin G as a substrate. The results showed that the
Km and Vmax parameters for IMP-1 with penicillin G were 390 μM and 156 μmol min-1
mg-1 (Fig 4), and the kcat and the catalytic efficiency (kcat/Km) were 72.1 s-1 and 0.186 s-1
μM-1, respectively.
17
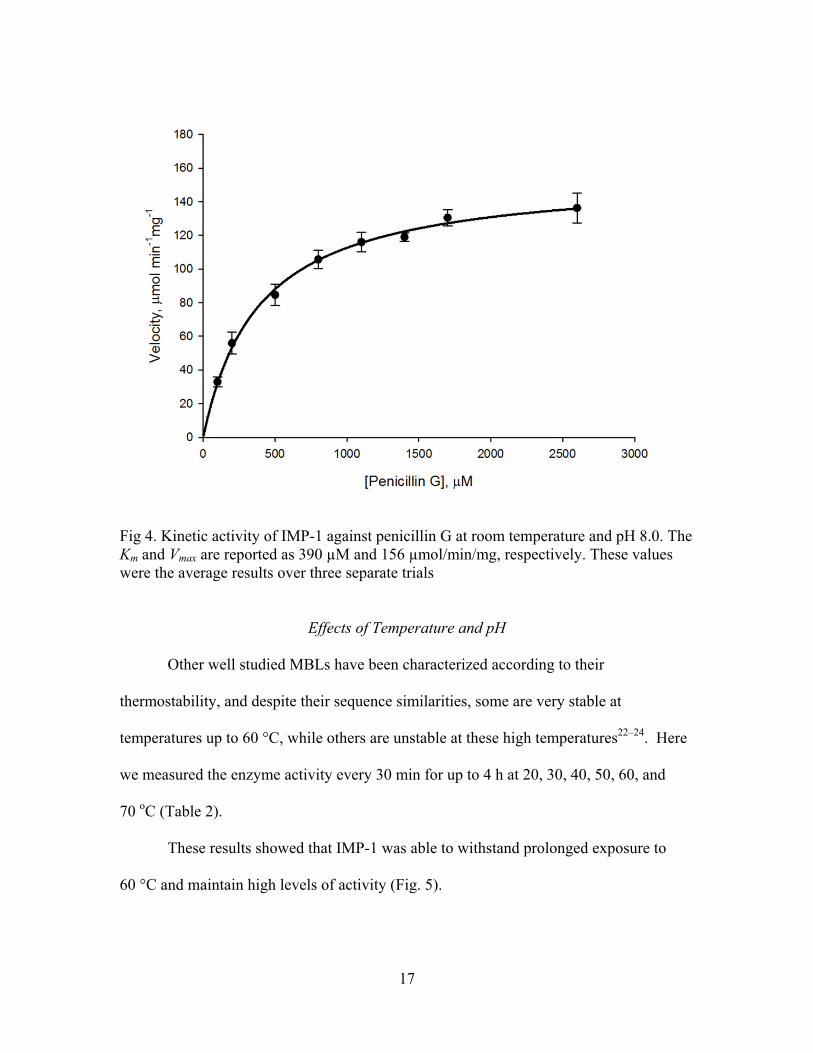
Fig 4. Kinetic activity of IMP-1 against penicillin G at room temperature and pH 8.0. The Km and Vmax are reported as 390 µM and 156 µmol/min/mg, respectively. These values were the average results over three separate trials
Effects of Temperature and pH
Other well studied MBLs have been characterized according to their
thermostability, and despite their sequence similarities, some are very stable at
temperatures up to 60 °C, while others are unstable at these high temperatures22–24. Here
we measured the enzyme activity every 30 min for up to 4 h at 20, 30, 40, 50, 60, and
70 oC (Table 2).
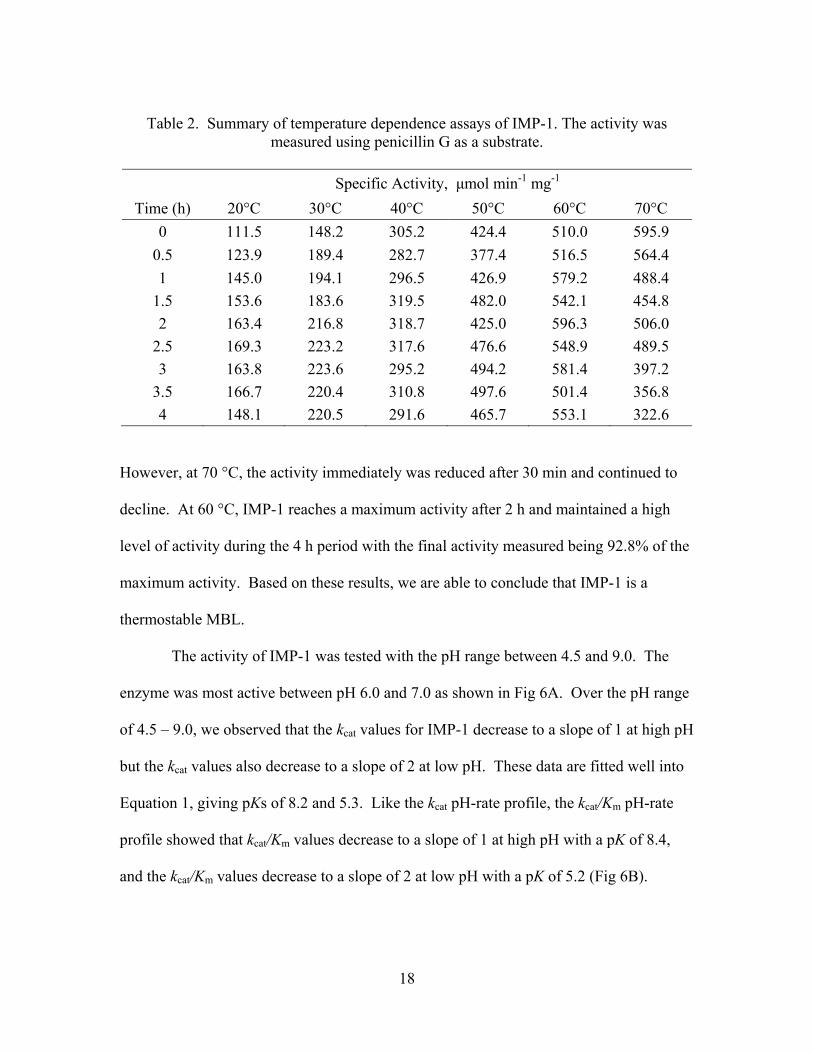
These results showed that IMP-1 was able to withstand prolonged exposure to
60 °C and maintain high levels of activity (Fig. 5).
18
Table 2. Summary of temperature dependence assays of IMP-1. The activity was
measured using penicillin G as a substrate.
Specific Activity, μmol min-1 mg-1
Time (h) 20°C 30°C 40°C 50°C 60°C 70°C
0 111.5 148.2 305.2 424.4 510.0 595.9
0.5 123.9 189.4 282.7 377.4 516.5 564.4
1 145.0 194.1 296.5 426.9 579.2 488.4
1.5 153.6 183.6 319.5 482.0 542.1 454.8
2 163.4 216.8 318.7 425.0 596.3 506.0
2.5 169.3 223.2 317.6 476.6 548.9 489.5
3 163.8 223.6 295.2 494.2 581.4 397.2
3.5 166.7 220.4 310.8 497.6 501.4 356.8
4 148.1 220.5 291.6 465.7 553.1 322.6 However, at 70 °C, the activity immediately was reduced after 30 min and continued to
decline. At 60 °C, IMP-1 reaches a maximum activity after 2 h and maintained a high
level of activity during the 4 h period with the final activity measured being 92.8% of the
maximum activity. Based on these results, we are able to conclude that IMP-1 is a
thermostable MBL.
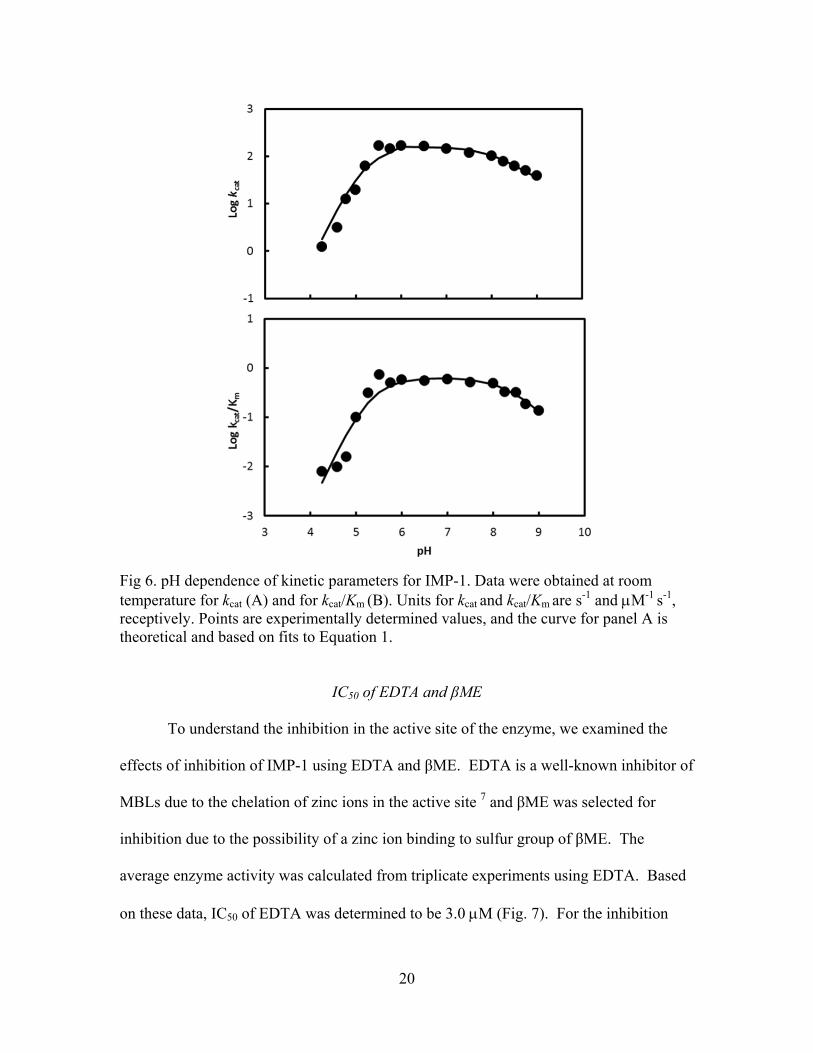
The activity of IMP-1 was tested with the pH range between 4.5 and 9.0. The
enzyme was most active between pH 6.0 and 7.0 as shown in Fig 6A. Over the pH range
of 4.5 – 9.0, we observed that the kcat values for IMP-1 decrease to a slope of 1 at high pH
but the kcat values also decrease to a slope of 2 at low pH. These data are fitted well into
Equation 1, giving pKs of 8.2 and 5.3. Like the kcat pH-rate profile, the kcat/Km pH-rate
profile showed that kcat/Km values decrease to a slope of 1 at high pH with a pK of 8.4,
and the kcat/Km values decrease to a slope of 2 at low pH with a pK of 5.2 (Fig 6B).
19
Fig 5. Graphic analysis of IMP-1 temperature stability data. The temperatures represented are 20 °C (♦), 30 °C (■), 40 °C (▲), 50 °C (●), 60 °C (☼), 70 °C (▬). This kcat pH-rate profile indicates the requirement of one group unprotonated and one
group protonated for catalysis. Similarly, the kcat/Km profile indicates that unprotonated
and protonated groups are involved for substrate binding and catalysis. The similarity of
the pK values observed for both kcat and kcat/Km pH-rate profiles suggests that in the
course of the complex formation of the substrate and enzyme, there are no substantial
changes in the environment of the active site pocket.
On the acidic side of the kcat/Km pH-rate profile, we were able to determine the pK
value to be 5.2. This result is consistent with the fact that Laraki et al. 20 showed a
decrease in the activity of IMP-1 at pH below 5.5.
0
100
200
300
400
500
600
700
0 0.5 1 1.5 2 2.5 3 3.5 4 4.5
Spe
cifi
c A
ctiv
ity,
μm
ol m
in-1
mg-1
Time, hours
20
Fig 6. pH dependence of kinetic parameters for IMP-1. Data were obtained at room temperature for kcat (A) and for kcat/Km (B). Units for kcat and kcat/Km are s-1 and M-1 s-1, receptively. Points are experimentally determined values, and the curve for panel A is theoretical and based on fits to Equation 1.
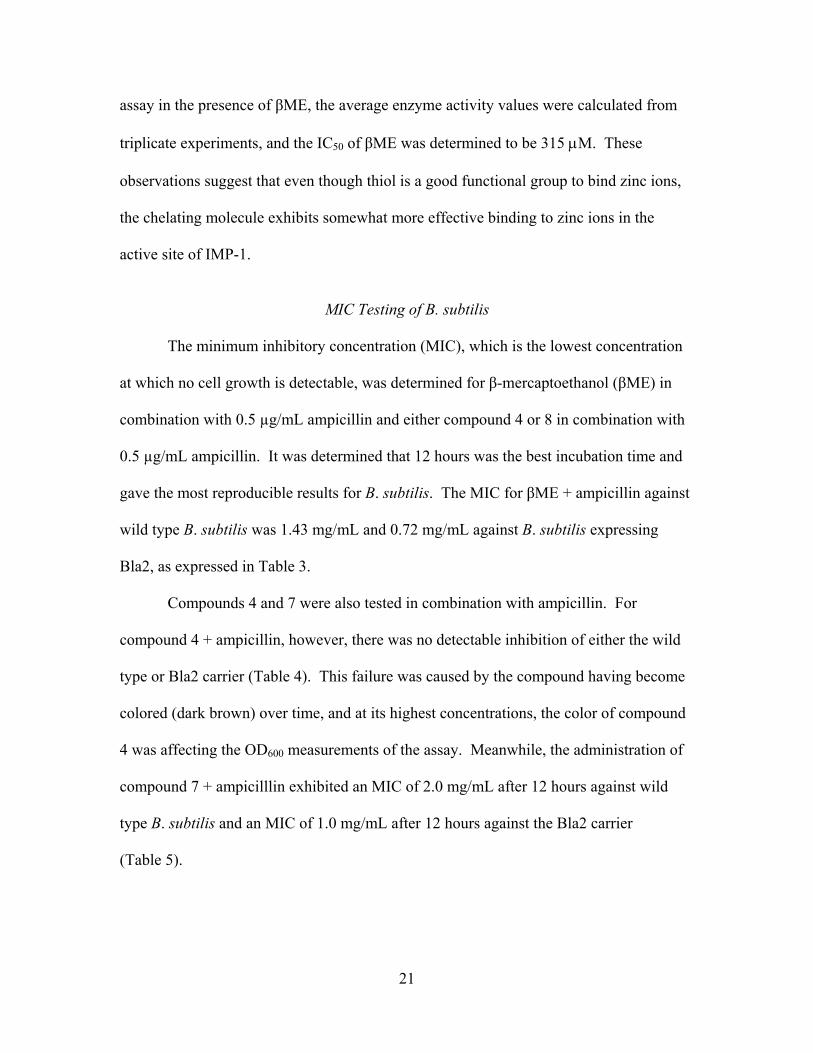
IC50 of EDTA and βME
To understand the inhibition in the active site of the enzyme, we examined the
effects of inhibition of IMP-1 using EDTA and βME. EDTA is a well-known inhibitor of
MBLs due to the chelation of zinc ions in the active site 7 and βME was selected for
inhibition due to the possibility of a zinc ion binding to sulfur group of βME. The
average enzyme activity was calculated from triplicate experiments using EDTA. Based
on these data, IC50 of EDTA was determined to be 3.0 M (Fig. 7). For the inhibition
21
assay in the presence of βME, the average enzyme activity values were calculated from
triplicate experiments, and the IC50 of βME was determined to be 315 M. These
observations suggest that even though thiol is a good functional group to bind zinc ions,
the chelating molecule exhibits somewhat more effective binding to zinc ions in the
active site of IMP-1.
MIC Testing of B. subtilis
The minimum inhibitory concentration (MIC), which is the lowest concentration
at which no cell growth is detectable, was determined for β-mercaptoethanol (βME) in
combination with 0.5 µg/mL ampicillin and either compound 4 or 8 in combination with
0.5 µg/mL ampicillin. It was determined that 12 hours was the best incubation time and
gave the most reproducible results for B. subtilis. The MIC for βME + ampicillin against
wild type B. subtilis was 1.43 mg/mL and 0.72 mg/mL against B. subtilis expressing
Bla2, as expressed in Table 3.
Compounds 4 and 7 were also tested in combination with ampicillin. For
compound 4 + ampicillin, however, there was no detectable inhibition of either the wild
type or Bla2 carrier (Table 4). This failure was caused by the compound having become
colored (dark brown) over time, and at its highest concentrations, the color of compound
4 was affecting the OD600 measurements of the assay. Meanwhile, the administration of
compound 7 + ampicilllin exhibited an MIC of 2.0 mg/mL after 12 hours against wild
type B. subtilis and an MIC of 1.0 mg/mL after 12 hours against the Bla2 carrier
(Table 5).
22
Fig 7. Determination of IC50 of EDTA and βME for IMP-1. The enzyme (10 mL of 0.4025 mg/mL IMP-1) was incubated with various EDTA (A) and βME (B) in 50 mM MOPS buffer (pH 7.0) at room temp before being assayed with penicillin G as a substrate.
23
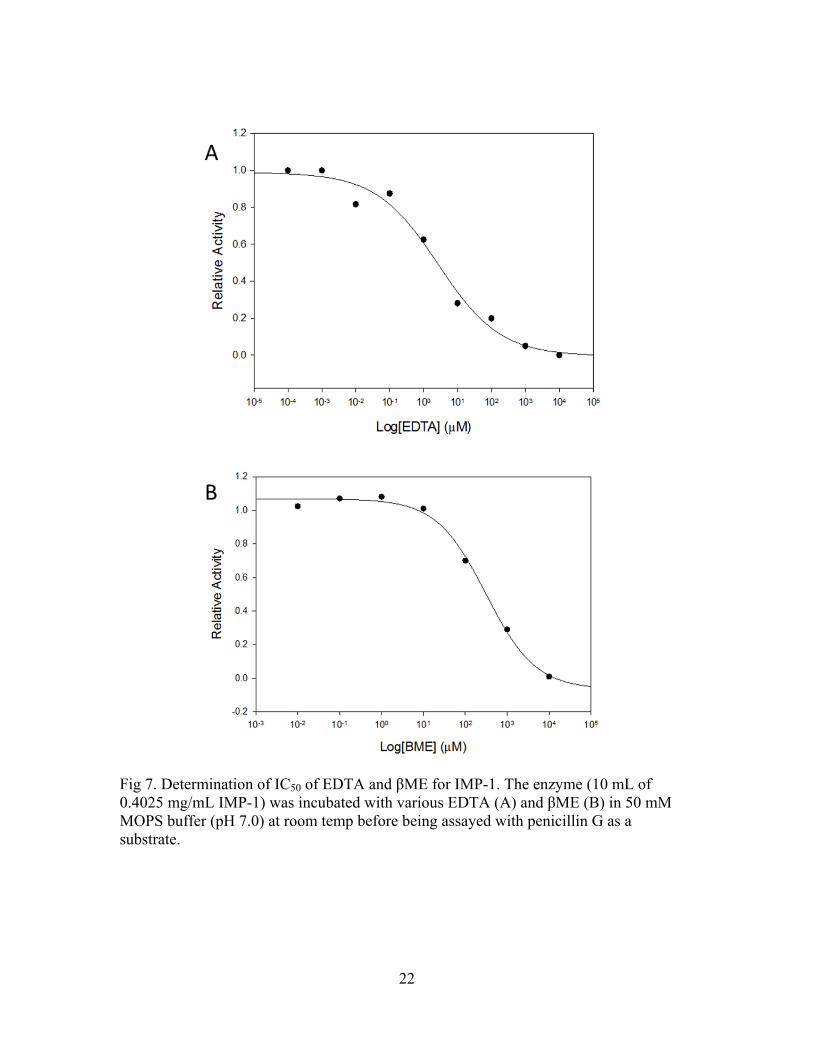
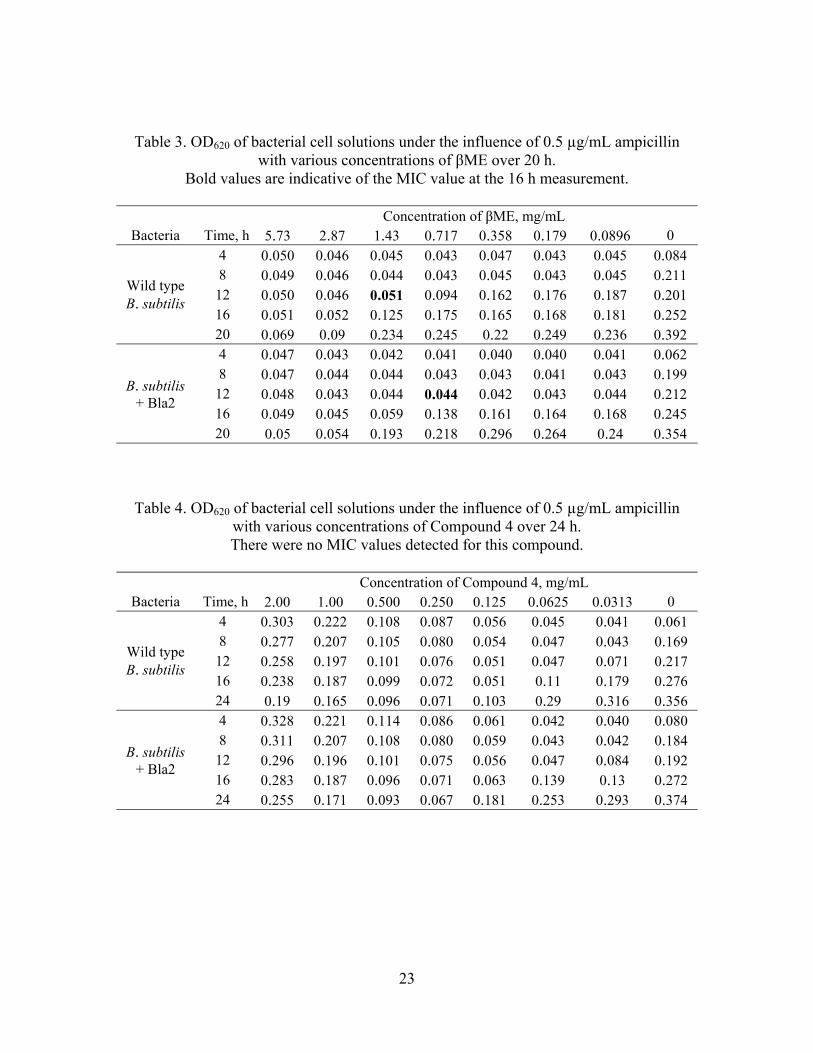
Table 3. OD620 of bacterial cell solutions under the influence of 0.5 µg/mL ampicillin with various concentrations of βME over 20 h.
Bold values are indicative of the MIC value at the 16 h measurement.
Concentration of βME, mg/mL Bacteria Time, h 5.73 2.87 1.43 0.717 0.358 0.179 0.0896 0
Wild type B. subtilis
4 0.050 0.046 0.045 0.043 0.047 0.043 0.045 0.084 8 0.049 0.046 0.044 0.043 0.045 0.043 0.045 0.211
12 0.050 0.046 0.051 0.094 0.162 0.176 0.187 0.201 16 0.051 0.052 0.125 0.175 0.165 0.168 0.181 0.252 20 0.069 0.09 0.234 0.245 0.22 0.249 0.236 0.392
B. subtilis + Bla2
4 0.047 0.043 0.042 0.041 0.040 0.040 0.041 0.062 8 0.047 0.044 0.044 0.043 0.043 0.041 0.043 0.199
12 0.048 0.043 0.044 0.044 0.042 0.043 0.044 0.212 16 0.049 0.045 0.059 0.138 0.161 0.164 0.168 0.245 20 0.05 0.054 0.193 0.218 0.296 0.264 0.24 0.354
Table 4. OD620 of bacterial cell solutions under the influence of 0.5 µg/mL ampicillin with various concentrations of Compound 4 over 24 h. There were no MIC values detected for this compound.
Concentration of Compound 4, mg/mL
Bacteria Time, h 2.00 1.00 0.500 0.250 0.125 0.0625 0.0313 0
Wild type B. subtilis
4 0.303 0.222 0.108 0.087 0.056 0.045 0.041 0.061 8 0.277 0.207 0.105 0.080 0.054 0.047 0.043 0.169
12 0.258 0.197 0.101 0.076 0.051 0.047 0.071 0.217 16 0.238 0.187 0.099 0.072 0.051 0.11 0.179 0.276 24 0.19 0.165 0.096 0.071 0.103 0.29 0.316 0.356
B. subtilis + Bla2
4 0.328 0.221 0.114 0.086 0.061 0.042 0.040 0.080 8 0.311 0.207 0.108 0.080 0.059 0.043 0.042 0.184
12 0.296 0.196 0.101 0.075 0.056 0.047 0.084 0.192 16 0.283 0.187 0.096 0.071 0.063 0.139 0.13 0.272 24 0.255 0.171 0.093 0.067 0.181 0.253 0.293 0.374
24
Table 5. OD620 of bacterial cell solutions under the influence of 0.5 µg/mL ampicillin with various concentrations of Compound 7 over 24 h.
Bold values are indicative of the MIC value at the 12 h measurement.
Concentration of Compound 7, mg/mL Bacteria Time, h 2.00 1.00 0.500 0.250 0.125 0.0625 0.0313 0
Wild type B. subtilis
4 0.045 0.047 0.043 0.047 0.046 0.046 0.049 0.070 8 0.044 0.047 0.046 0.046 0.047 0.047 0.048 0.196
12 0.049 0.047 0.086 0.09 0.096 0.123 0.125 0.195 16 0.046 0.112 0.153 0.146 0.15 0.155 0.157 0.259 24 0.053 0.236 0.255 0.246 0.248 0.228 0.238 0.374
B. subtilis + Bla2
4 0.041 0.041 0.040 0.042 0.041 0.041 0.041 0.057 8 0.041 0.041 0.041 0.042 0.042 0.043 0.043 0.186
12 0.043 0.042 0.052 0.086 0.116 0.115 0.112 0.218 16 0.042 0.085 0.153 0.171 0.186 0.185 0.191 0.280 24 0.046 0.199 0.29 0.311 0.334 0.314 0.311 0.394
Confirmation of Linker Coupling to DNA Affinity Column
The DNA affinity column generated was assessed for its ability to effectively bind
the G-quadruplex DNA oligonucleotide, and then subsequently release the purified
oligonucleotide via washes with TE buffer at 42 and 90 °C and water at 90 °C (Table 6).
The DNA binding and removal events were monitored by measuring the absorbance at
260 nm. The results indicate that after washing the column material with the template
DNA in buffer A, more than half of the DNA material remained on the column (was not
present in the wash solution as seen by lowered absorbance values). The column was
then washed with TE buffer and water at elevated temperatures in an effort to remove the
bound DNA. Some of the DNA was able to be removed from the column, however, only
approximately half of the original template DNA was recovered.
25
Table 6. Summary of results from assay measuring the amount of template DNA being attached and subsequently removed from the prepared DNA affinity column.
Absorbance at 260 nm
Trial Template DNA
in Buffer A Column Washes: Buffer A, 20°C
Column Wash: TE, 42°C
Column Wash: TE, 90°C
Column Wash: Water, 90°C
1 1.715 0.540 0.205 0.152 0.185
2 1.798 0.540 0.292 0.241 0.388
Average 1.757 0.540 0.249 0.197 0.287
The washes used to remove the template DNA from the column were then used to
perform PCR, in an effort to confirm the presence of the template DNA. A control test
was run alongside the experimental tests as confirmation of the PCR program used. The
gel image obtained confirmed the amplification of the control test, as well as all of the
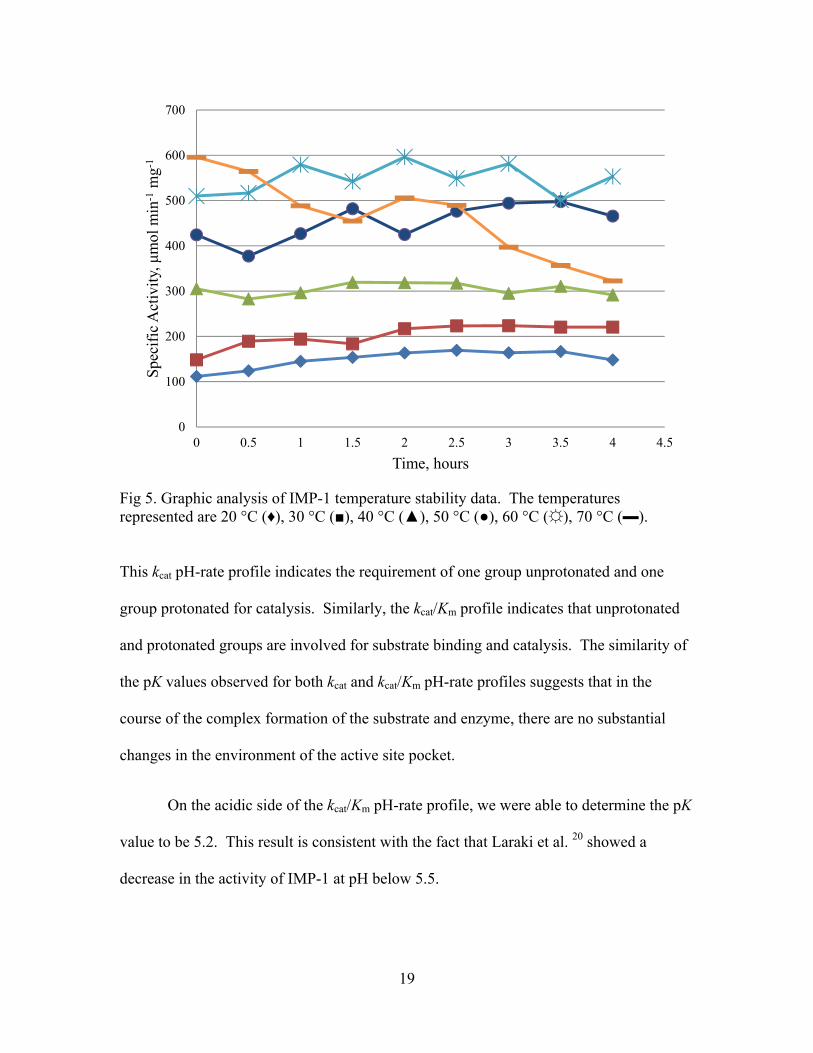
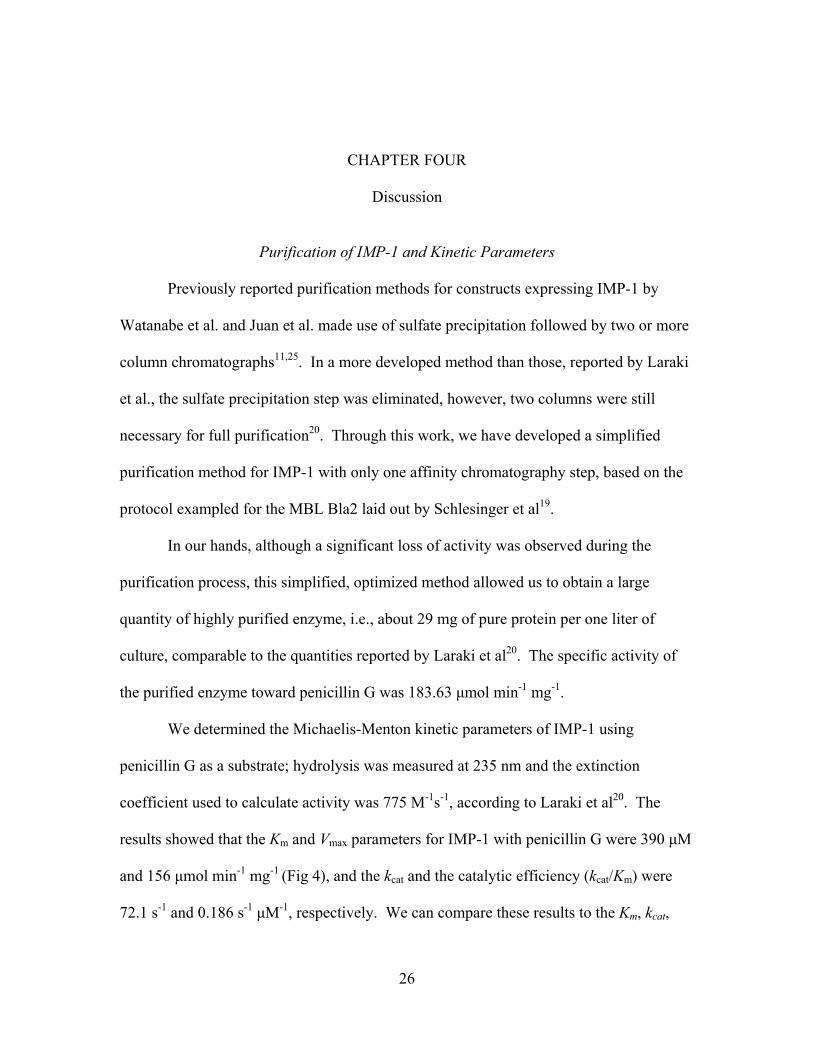
experimental samples run (Fig 8).
Fig 8. PCR results of washes removing template DNA from affinity column. C is a control test, run to confirm PCR program; 1 is the product of using the TE wash at 42°C as a template; 2 is the product of using the TE wash at 90°C as a template; 3 is the product of using the first water wash at 90°C as a template; 4 is the product of using the second water wash at 90°C as a template.
C 1 2 3 4
26
CHAPTER FOUR
Discussion
Purification of IMP-1 and Kinetic Parameters
Previously reported purification methods for constructs expressing IMP-1 by
Watanabe et al. and Juan et al. made use of sulfate precipitation followed by two or more
column chromatographs11,25. In a more developed method than those, reported by Laraki
et al., the sulfate precipitation step was eliminated, however, two columns were still
necessary for full purification20. Through this work, we have developed a simplified
purification method for IMP-1 with only one affinity chromatography step, based on the
protocol exampled for the MBL Bla2 laid out by Schlesinger et al19.
In our hands, although a significant loss of activity was observed during the
purification process, this simplified, optimized method allowed us to obtain a large
quantity of highly purified enzyme, i.e., about 29 mg of pure protein per one liter of
culture, comparable to the quantities reported by Laraki et al20. The specific activity of
the purified enzyme toward penicillin G was 183.63 μmol min-1 mg-1.
We determined the Michaelis-Menton kinetic parameters of IMP-1 using
penicillin G as a substrate; hydrolysis was measured at 235 nm and the extinction
coefficient used to calculate activity was 775 M-1s-1, according to Laraki et al20. The
results showed that the Km and Vmax parameters for IMP-1 with penicillin G were 390 μM
and 156 μmol min-1 mg-1 (Fig 4), and the kcat and the catalytic efficiency (kcat/Km) were
72.1 s-1 and 0.186 s-1 μM-1, respectively. We can compare these results to the Km, kcat,
27
and the catalytic efficiency (kcat/Km) reported by Rasmussen and Bush, which were 440
µM, 370 s-1 and 0.840 s-1 µM-1, respectively26. Similarly, the Km, kcat, and the catalytic
efficiency (kcat/Km) reported by Laraki et al. for IMP-1 with penicillin G were 600 µM,
280 s-1 and 0.470 s-1 µM-1, respectively.
In addition, the specific activity observed for IMP-1 after purification by the
Ni2+-affinity column was 183.63 units/mg and had a more than 7-fold increase in specific
activity over the course of the purification (Table 1). The purified IMP-1 appeared as one
primary band on SDS-PAGE at approximately 28 kDa (Fig 3), which is in excellent
agreement with the calculated molecular weight of 27,692.5 Da. This shows that the
application of the Ni2+ affinity column as a simple purification method for IMP-1 is an
effective means as well.
Effects of Temperature and pH
Some studied -lactamases have been characterized as thermostable proteins 22.
Previously published literatures showed that while the MBL from Bacillus cereus, BcII,
is stable at 60 oC 22, the MBL from B. anthracis, Bla2, is unstable at 60 oC 19. Even
though BcII shares 92% amino acid sequence similarity with Bla2 27,28, the 8% sequence
difference showed a significant change in thermostability 19. It seems likely that the
environment of active sites significantly contribute to zinc ion binding stability,
particularly for the second zinc ion binding site 29. Thus, it is of interest to determine
whether IMP-1 is stable at high temperatures.
The results obtained here show that IMP-1 was able to withstand prolonged
exposure to 60 °C with high levels of activity (Fig. 5). Once at 60 °C, IMP-1 reaches a
maximum activity after 2 h and maintained a high level of activity during the 4 h period,
28
with the final activity measured being 92.8% of the maximum activity. From this we are
able to conclude that IMP-1 is a thermostable MBL, and that the zinc ion binding in the
active site of IMP-1 may be stronger than other MBLs that are not able to withstand these
high temperatures.
When the kinetic assay for IMP-1 was altered to determine the effect of pH, we
observed the enzyme to be most active between pH 6.0 and 7.0 as shown in Fig 6A.
Over the tested pH range of 4.5 – 9.0, the kcat values for IMP-1 decreased to a slope of 1
at high pH, but the kcat values also decreased to a slope of 2 at low pH. This data was
fitted into Equation 1, and showed pKs of 8.2 and 5.3. Similarly, the kcat/Km pH-rate
profile showed that kcat/Km values decreased to a slope of 1 at high pH with a pK of 8.4,
and the kcat/Km values decreased to a slope of 2 at low pH with a pK of 5.2 (Fig 6B).
Unlike the typical bell-shaped curve that is characteristic to pH-rate profiles,
where the slope is only 1 at low pH 30, the kcat pH-rate profile obtained for
IMP-1indicates the requirement for one group unprotonated and one group protonated for
catalysis. Similarly, the kcat/Km profile provides idea that unprotonated and protonated
groups are involved for substrate binding and catalysis. The similarity of the pK values
observed for both kcat and kcat/Km pH-rate profiles suggests that in the course of the
complex formation of the substrate and enzyme, there are no substantial changes in the
environment of the active site pocket.
In addition, previous studies by Bounaga et al. 30 reported that the kcat/Km pH-rate
profile using BcII for penicillin G showed a pK value of 5.6 on the acidic side with a
slope of 2, which suggests that two protonation events would occur with similar pK
value. Further studies in this report assigned the pK value to both Zn1-hydroxide and to
29
Asp90 of BcII, which is corresponding to Asp81 of IMP-1 as shown in Figure 1. Hence,
it appears that the water molecule bound to Zn1 and Asp81 would account for the slope
of 2. There are no published sources to date that have reported a kcat/Km pH-rate profile
using IMP-1 for penicillin G hydrolysis and showed a pK value in the acidic range of
pHs.
IC50 of EDTA and βME
We examined the effects of inhibition of IMP-1 using EDTA and βME to gain an
understanding of the active site of the enzyme, as well as to weigh the effects of these
inhibitors on IMP-1 versus other MBLs. EDTA is a well-known inhibitor of MBLs due
to the chelation of zinc ions in the active site 7 and βME was selected for inhibition
testing due to the possibility of a zinc ion binding to the sulfur group of βME.
The IC50 of EDTA against IMP-1 was determined to be 3.0 M and the IC50 of
βME against IMP-1 was determined to be 315 M (Fig. 7). Compared to other subclass
B1 MBLs, IMP-1 appears more susceptible to EDTA. For example, the IC50 of EDTA
for DIM-1 from P. stutzeri and VIM-1, -2 and -13 from P. aeruginosa are 176, 9.3, 50
and 253 M, respectively 25,31. However, IMP-1 is less susceptible to EDTA than Bla2
(IC50 of EDTA for Bla2 is 0.63 µM) 19 There were no other studies that tested βME as an
inhibitor of IMP-1. The results of our βME inhibition test suggest that even though thiols
are good functional groups for binding zinc ions, the chelating molecule (EDTA) exhibits
somewhat more effective binding to zinc ions in the active site of IMP-1.
30
MIC Testing of B. subtilis
An MIC is the lowest concentration of an inhibitor at which no bacterial growth is
detectable (by a measure of optical density, or OD). In this study the MIC was
determined for βME in combination with 0.5 µg/mL ampicillin and either compound 4 or
7 in combination with 0.5 µg/mL ampicillin. These tests were performed on Bacillus
subtilis cells that were either wild type or expressing Bla2 as part of a collaborative study
to test these hydroxamate compounds for their effectiveness as potential broad spectrum
MBL inhibitors in both Gram positive and Gram negative bacterial strains.
The MIC for βME + ampicillin against wild type B. subtilis was 1.43 mg/mL and
0.72 mg/mL against B. subtilis expressing Bla2, as expressed in Table 3. These MIC
values were detected at 12 hours, which over multiple trials was found to be the best
incubation time for giving reproducible results. In this set of experiments, βME is used
as a control test. The IC50 value of βME against Bla2 had been determined as 218 µM as
part of a collaborative test performed by Sara R. Schlesinger. Due to the micromolar
concentration range of the IC50 value, we would expect for βME to also inhibit microbial
growth in cells expressing this enzyme. The MIC value of 720 µg/mL is more than three
times the IC50 value, and while βME is able to inhibit cellular growth at a micromolar
concentration, this large gap between MIC and IC50 values may indicate that the
interactions of βME with the cell are nonspecific for Bla2.
The MIC test for compound 4 + ampicillin against both the wild type and Bla2
expressing B. subtilis showed no detectable inhibition (Table 4). This failure was caused
by the compound having become colored (dark brown) over time, and at its highest
31
concentrations, the color of compound 4 was affecting the OD620 measurements of the
assay.
Alternatively, the administration of compound 7 + ampicilllin exhibited an MIC
value of 1.0 mg/mL after 12 hours against the Bla2 carrier, as seen in Table 5. We can
compare this MIC value to a previously determined IC50 value for of compound 7 against
Bla2, performed by Megan Hermann. The IC50 value determined was 0.48 ± 0.2 nM. In
comparison, the MIC value obtained was substantially greater than the IC50value. Again,
this discrepancy could be attributed to nonspecific binding of compound 7 to B. subtilis,
decreasing the concentration of compound available to inhibit the enzyme. However, if
we are able to employ concentrations of compound 7 that are within the enzyme
inhibition range, the ampicillin used in combination with compound 7 will be free to
inhibit cell growth without risk of hydrolysis.
DNA Affinity Column
We constructed a DNA affinity column as the first step towards a future project
that is focused on the study of G-quadruplex aptamers as potential enzyme inhibitors.
The DNA affinity column serves as a mode of purification for the template DNA, which
had twelve randomized nucleotide bases and whose sequence follows: 5’-GCGGAT-
CCGGGGGGT(N6)TGGGGGGATGGGGGGT(N6)TGGGGGGAAGCTTGC-3’. This
affinity column was generated using silica that had a short oligonucleotide sequence,
complementary to the template DNA, synthetically linked. This oligonucleotide allowed
for the binding and subsequent removal of the template DNA to the column. The results
of our assay indicated that we were successful in generating an affinity column that was
specific for our DNA template, as seen in Table 6. More than half of the template DNA
32
that was loaded onto the column had attached, evidenced by low absorbance values in the
wash buffer after having been blanked with the original template DNA solution. In
addition, subsequent washes of the column with buffer at elevated temperatures allowed
for the removal of approximately half the attached DNA. While these results do not have
maximal recovery of purified template DNA, there is promise. Further modifications are
necessary to optimize the column conditions in order to gain a useful tool in the
purification of aptamer sequences.

33
CHAPTER FIVE
Conclusions
The metallo-β-lactamase from Pseudomonas aeruginosa, IMP-1, has drawn
increasing attention due to its increasing prevalence and its ability to spread across
bacterial species. Thus, in order to effectively study and characterize this enzyme, it is
necessary to obtain a pure sample of enzyme. In this study, we have successfully
introduced a facile method for obtaining large quantities of pure IMP-1. To characterize
the IMP-1 enzyme, temperature stability and pH dependent studies were completed. This
enzyme was thermostable, showing activity for prolonged periods at high temperatures,
indicating that the zinc binding in the active site of IMP-1 is as stable, or more stable,
than other MBLs. The pH dependent experiments revealed that the enzyme is most
stable within a pH range of 6.0-7.0, based on activity levels. These experiments also
provided insight into the acid-base chemistry of the active site, suggesting that IMP-1
requires one protonated and one unprotonated group for catalysis to occur. In addition,
we were able to identify a pK in the acidic range of 5.2. No other published works have
reported an acidic pK value for the hydrolysis of penicillin G by IMP-1. The inhibition
studies with EDTA and βME show that IMP-1 is susceptible to these compounds, with
the zinc chelating molecule being the more effective inhibitor, which provides us with
information for designing effective inhibitors of IMP-1 in the future.
In a collaborative study of novel hydroxamate compounds as inhibitors of the
metallo-β-lactamase from Bacillus anthracis, Bla2, MIC testing was done to investigate
34
the potential of these compounds (4 and 7) as inhibitors of Gram positive cell growth.
This testing was performed on Bacillus subtilis cells either with or without Bla2. While
compound 4 displayed no inhibition of cell growth, compound 7 was successful in
deterring cell growth in the presence of 0.5 µg/mL ampicillin. Thus, compound 7 could
be further investigated as a lead for the development of effective MBL inhibitors.
In a final study, we focused on the development of G-quadruplex aptamers as
potential enzyme inhibitors. We began foundation work by designing a template DNA
with twelve random nucleotide bases, and generated a DNA affinity column for use as a
tool in purifying this specific ssDNA sequence. Analysis of the affinity column
displayed its ability to effectively purify the template by binding and subsequently
releasing the target DNA. This tool can be further optimized for its use in purification of
aptamer molecules designed to target enzymes of interest.

35
APPENDIX
36
APPENDIX
Supplementary Figures
Figure A.1 Michaelis-Menton curve of IMP-1 at pH 4.5 .................................................37 Figure A.2 Michaelis-Menton curve of IMP-1 at pH 4.75 ...............................................38 Figure A.3 Michaelis-Menton curve of IMP-1 at pH 5.0 .................................................39 Figure A.4 Michaelis-Menton curve of IMP-1 at pH 5.25 ...............................................40 Figure A.5 Michaelis-Menton curve of IMP-1 at pH 5.5 .................................................41
37
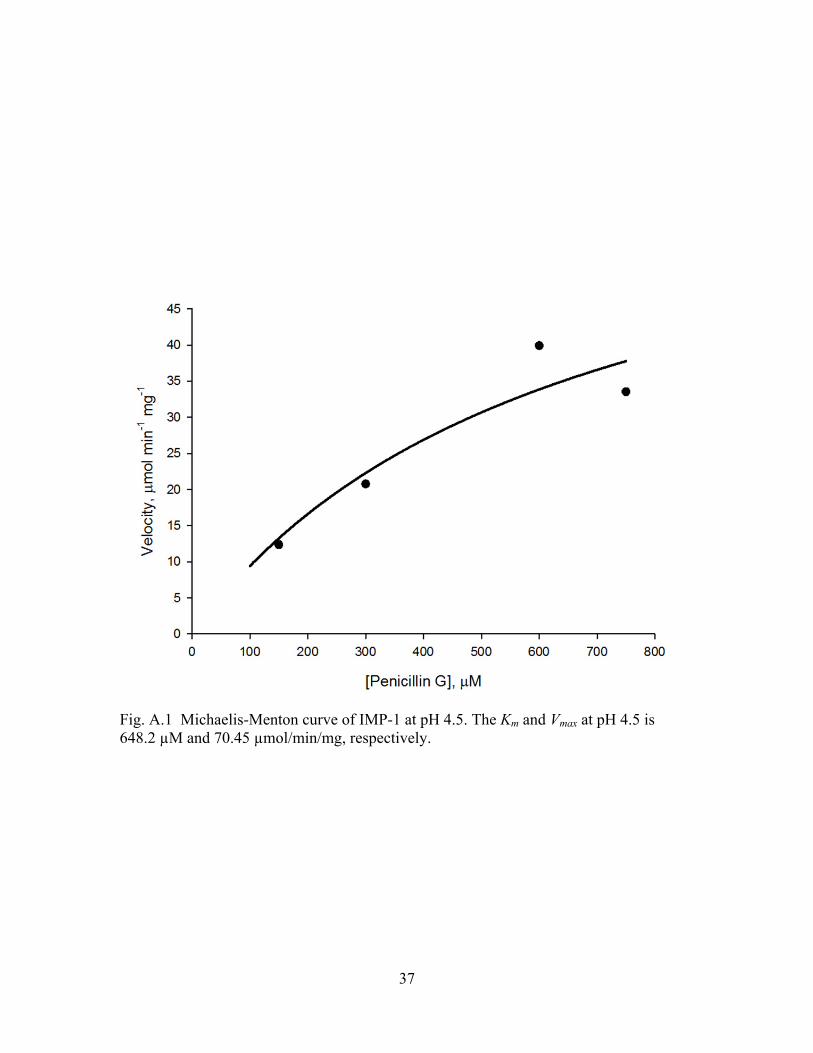
Fig. A.1 Michaelis-Menton curve of IMP-1 at pH 4.5. The Km and Vmax at pH 4.5 is 648.2 µM and 70.45 µmol/min/mg, respectively.
38
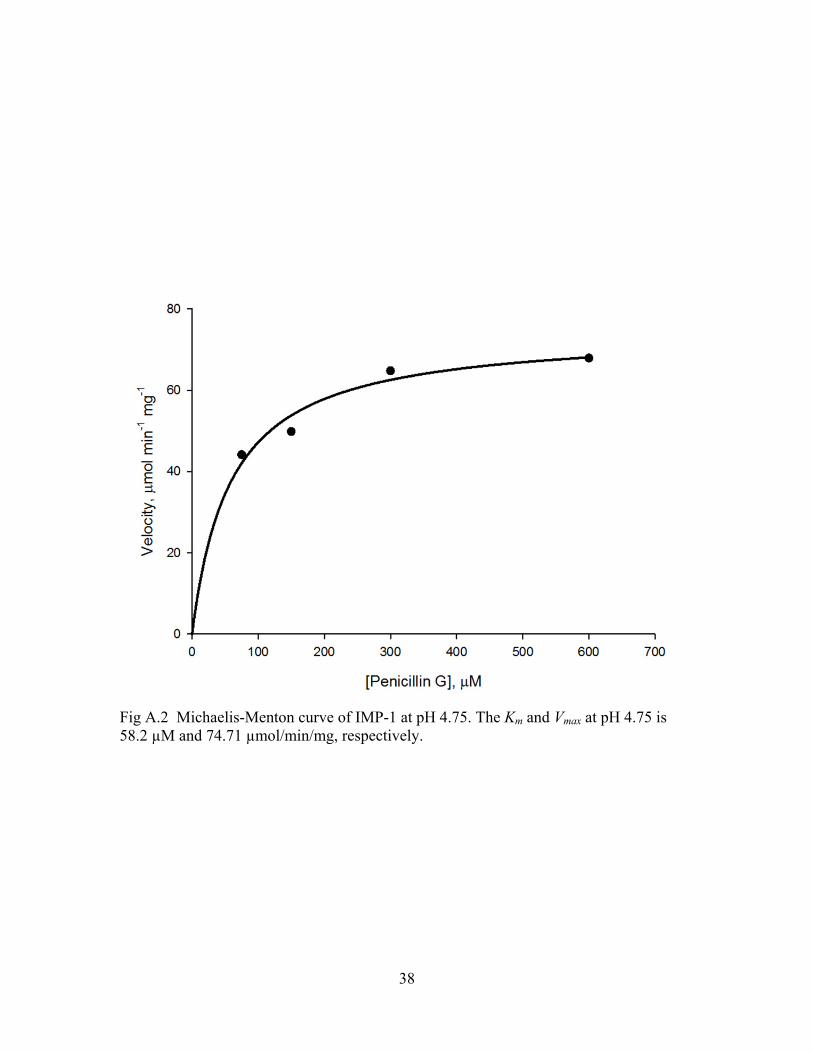
Fig A.2 Michaelis-Menton curve of IMP-1 at pH 4.75. The Km and Vmax at pH 4.75 is 58.2 µM and 74.71 µmol/min/mg, respectively.
39
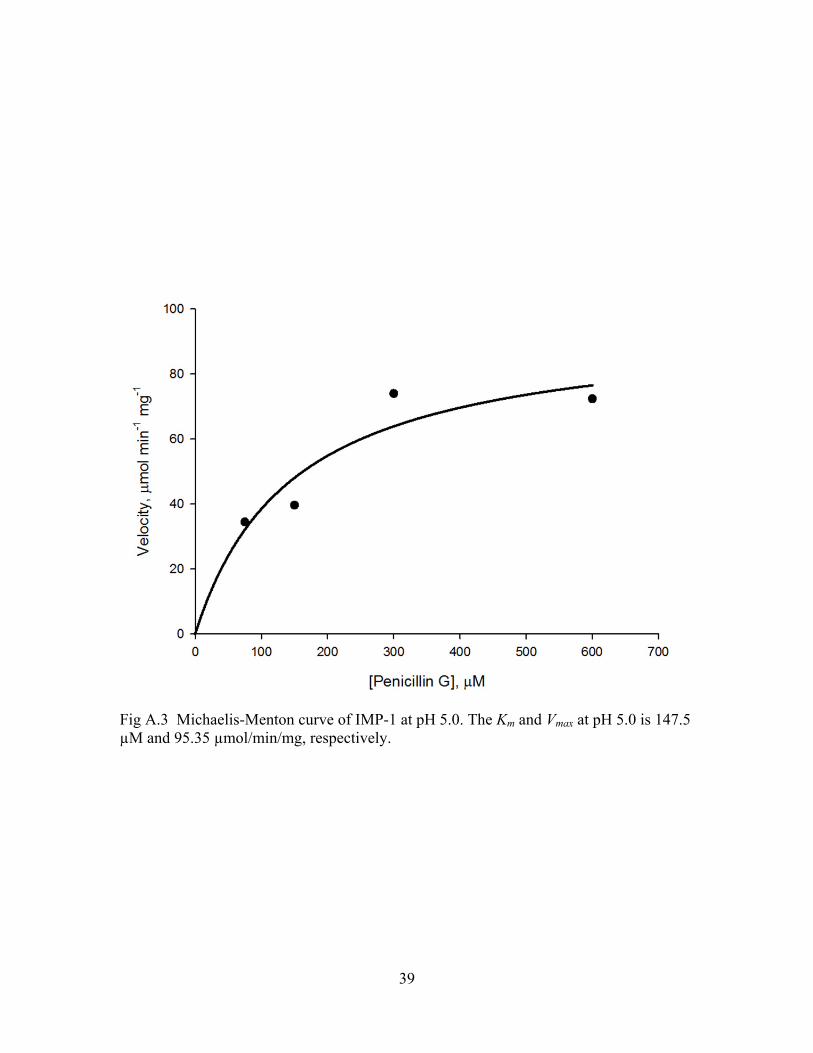
Fig A.3 Michaelis-Menton curve of IMP-1 at pH 5.0. The Km and Vmax at pH 5.0 is 147.5 µM and 95.35 µmol/min/mg, respectively.
40
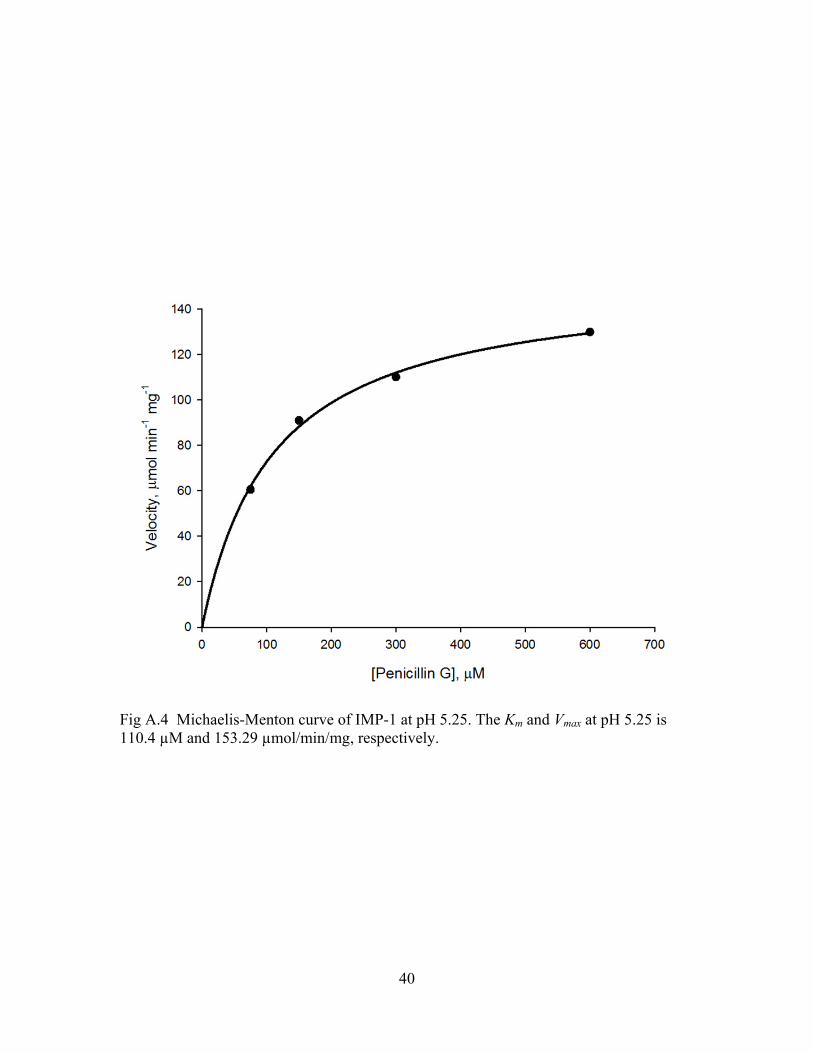
Fig A.4 Michaelis-Menton curve of IMP-1 at pH 5.25. The Km and Vmax at pH 5.25 is 110.4 µM and 153.29 µmol/min/mg, respectively.

41
Fig A.5 Michaelis-Menton curve of IMP-1 at pH 5.5. The Km and Vmax at pH 5.5 is 193.4 µM and 235.46 µmol/min/mg, respectively.
42
REFERENCES
(1) Gupta, V. Expert Opin. Investig. Drugs 2008, 17, 131–143.
(2) Perez, F.; Endimiani, A.; Hujer, K. M.; Bonomo, R. A. Curr. Opin. Pharmacol. 2007, 7, 459–469.
(3) Walsh, T. R.; Toleman, M. A.; Poirel, L.; Nordmann, P. Clin. Microbiol. Rev. 2005, 18, 306–325.
(4) Wright, G. D. Chem. Commun. Camb. Engl. 2011, 47, 4055–4061.
(5) Bush, K.; Jacoby, G. A. Antimicrob. Agents Chemother. 2010, 54, 969–976.
(6) Payne, D. J. J. Med. Microbiol. 1993, 39, 93–99.
(7) Yang, Y.; Bush, K. FEMS Microbiol. Lett. 1996, 137, 193–200.
(8) Bebrone, C. Biochem. Pharmacol. 2007, 74, 1686–1701.
(9) Crowder, M. W.; Spencer, J.; Vila, A. J. Acc. Chem. Res. 2006, 39, 721–728.
(10) Osano, E.; Arakawa, Y.; Wacharotayankun, R.; Ohta, M.; Horii, T.; Ito, H.; Yoshimura, F.; Kato, N. Antimicrob. Agents Chemother. 1994, 38, 71–78.
(11) Watanabe, M.; Iyobe, S.; Inoue, M.; Mitsuhashi, S. Antimicrob. Agents Chemother. 1991, 35, 147–151.
(12) Oelschlaeger, P.; Ai, N.; DuPrez, K. T.; Welsh, W. J.; Toney, J. H. J. Med. Chem. 2010, 53, 3013–3027.
(13) Concha, N. O.; Janson, C. A.; Rowling, P.; Pearson, S.; Cheever, C. A.; Clarke, B. P.; Lewis, C.; Galleni, M.; Frère, J.-M.; Payne, D. J.; Bateson, J. H.; Abdel-Meguid, S. S. Biochemistry (Mosc.) 2000, 39, 4288–4298.
(14) Heinz, U.; Adolph, H.-W. Cell. Mol. Life Sci. 2004, 61, 2827–2839.
(15) Toney, J. H.; Moloughney, J. G. Curr. Opin. Investig. Drugs 2004, 5, 823–826.
(16) Buynak, J. D.; Chen, H.; Vogeti, L.; Gadhachanda, V. R.; Buchanan, C. A.; Palzkill, T.; Shaw, R. W.; Spencer, J.; Walsh, T. R. Bioorg. Med. Chem. Lett. 2004, 14, 1299–1304.
(17) Spencer, J.; Walsh, T. R. Angew. Chem. Int. Ed. 2006, 45, 1022–1026.
43
(18) Puerta, D. T.; Cohen, S. M. Inorg. Chem. 2002, 41, 5075–5082.
(19) Schlesinger, S. R.; Kim, S. G.; Lee, J.-S.; Kim, S.-K. Biotechnol. Lett. 2011, 33, 1417–1422.
(20) Laraki, N.; Franceschini, N.; Rossolini, G. M.; Santucci, P.; Meunier, C.; De Pauw, E.; Amicosante, G.; Frere, J. M.; Galleni, M. Antimicrob. Agents Chemother. 1999, 43, 902–906.
(21) Chockalingam, P. S.; Jurado, L. A.; Jarrett, H. W. Mol. Biotechnol. 2001, 19, 189–200.
(22) Davies, R. B.; Abraham, E. P.; Melling, J. Biochem. J. 1974, 143, 115–127.
(23) Iwai, H.; Plückthun, A. FEBS Lett. 1999, 459, 166–172.
(24) Wang, X.; Minasov, G.; Shoichet, B. K. Proteins Struct. Funct. Genet. 2002, 47, 86–96.
(25) Juan, C.; Beceiro, A.; Gutierrez, O.; Alberti, S.; Garau, M.; Perez, J. L.; Bou, G.; Oliver, A. Antimicrob. Agents Chemother. 2008, 52, 3589–3596.
(26) Rasmussen, B. A.; Bush, K. Antimicrob. Agents Chemother. 1997, 41, 223–232.
(27) Chen, Y.; Tenover, F. C.; Koehler, T. M. Antimicrob. Agents Chemother. 2004, 48, 4873–4877.
(28) Materon, I. C.; Queenan, A. M.; Koehler, T. M.; Bush, K.; Palzkill, T. Antimicrob. Agents Chemother. 2003, 47, 2040–2042.
(29) Tomatis, P. E.; Rasia, R. M.; Segovia, L.; Vila, A. J. Proc. Natl. Acad. Sci. 2005, 102, 13761–13766.
(30) Bounaga, S.; Laws, A. P.; Galleni, M.; Page, M. I. Biochem. J. 1998, 331, 703–711.
(31) Poirel, L.; Rodriguez-Martinez, J. M.; Al Naiemi, N.; Debets-Ossenkopp, Y. J.; Nordmann, P. Antimicrob. Agents Chemother. 2010, 54, 2420–2424.