TE MVJCE 2014 - Web viewIn this chapter we study the noise ... The modulation index β = J is...
64
DEPARTMENT - ECE SEMESTER-5 SUBCODE -10EC53 SUBJECT NAME-ANALOG COMMUNICATION Author Details: Name: Benjamin I & Sushma Designation: Assistant professor Department: E & C Dept.
Transcript of TE MVJCE 2014 - Web viewIn this chapter we study the noise ... The modulation index β = J is...
DEPARTMENT - ECE
SEMESTER-5
SUBCODE -10EC53
SUBJECT NAME-ANALOG COMMUNICATION
Author Details: Name: Benjamin I & Sushma Designation: Assistant professorDepartment: E & C Dept.
ECE MVJCE 2014
UNIT 8
NOISE IN CONTINUOUS WAVE MODULATION SYSTEMS
In this chapter we study the noise performance of analog (continuous wave) modulation system. We begin the study by describing signal to noise ratios that provide basis for evaluating the noise performance of an analog communication receiver.
Signal to Noise ratios:
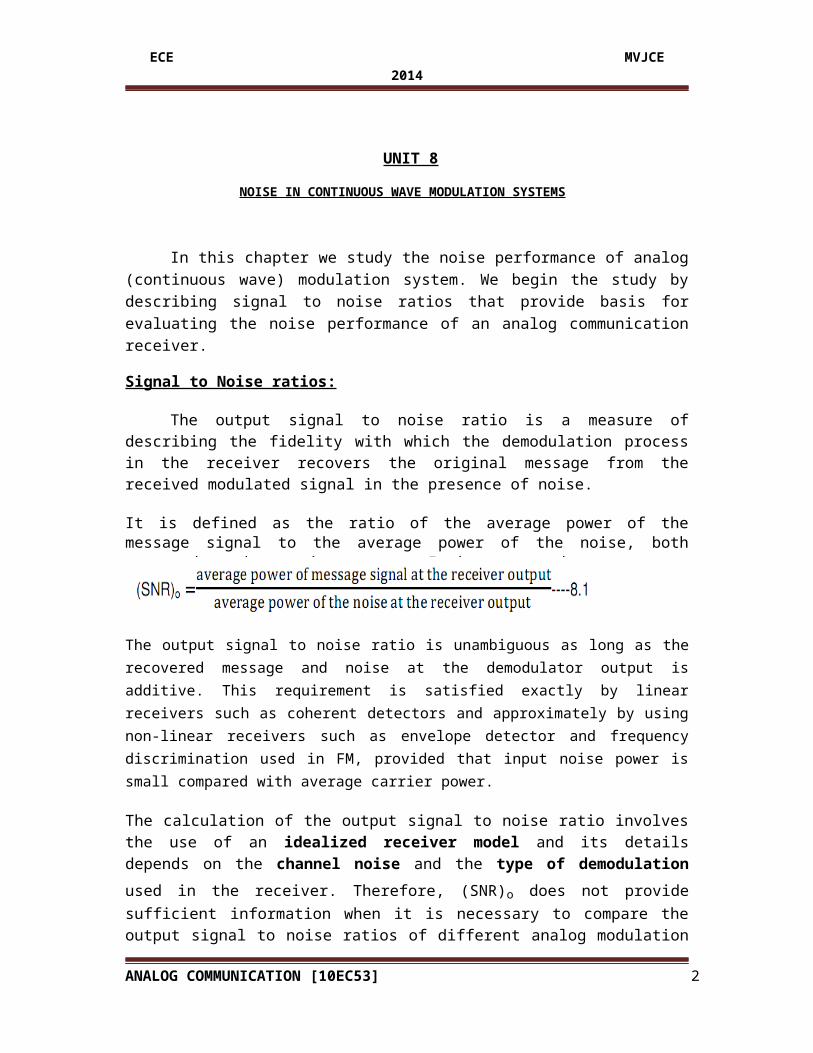
The output signal to noise ratio is a measure of describing the fidelity with which the demodulation process in the receiver recovers the original message from the received modulated signal in the presence of noise.
It is defined as the ratio of the average power of the message signal to the average power of the noise, both measured at the receiver output. It is expressed as
The output signal to noise ratio is unambiguous as long as the recovered message and noise at the demodulator output is additive. This requirement is satisfied exactly by linear receivers such as coherent detectors and approximately by using non-linear receivers such as envelope detector and frequency discrimination used in FM, provided that input noise power is small compared with average carrier power.
The calculation of the output signal to noise ratio involves the use of an idealized receiver model and its details depends on the channel noise and the type of demodulation used in the receiver. Therefore, (SNR)o does not provide sufficient information when it is necessary to compare the output signal to noise ratios of different analog modulation – demodulation schemes. To make such comparison, baseband transmission model is used. The baseband transmission model is shown in fig 8.1 below,
Low pass filter ofMessage signal with + Σ Bandwidth equal to the Output
the same power as message bandwidth
the modulated wave +
Channel noise
Fig 8.1baseband transmission model.
ANALOG COMMUNICATION [10EC53] 2

ECE MVJCE 2014
The baseband transmission model assumes:
2.1 The transmitted or modulated message signal power is fixed 2.2 The baseband low pass filter passes the message signal, and rejects out of band
noise.
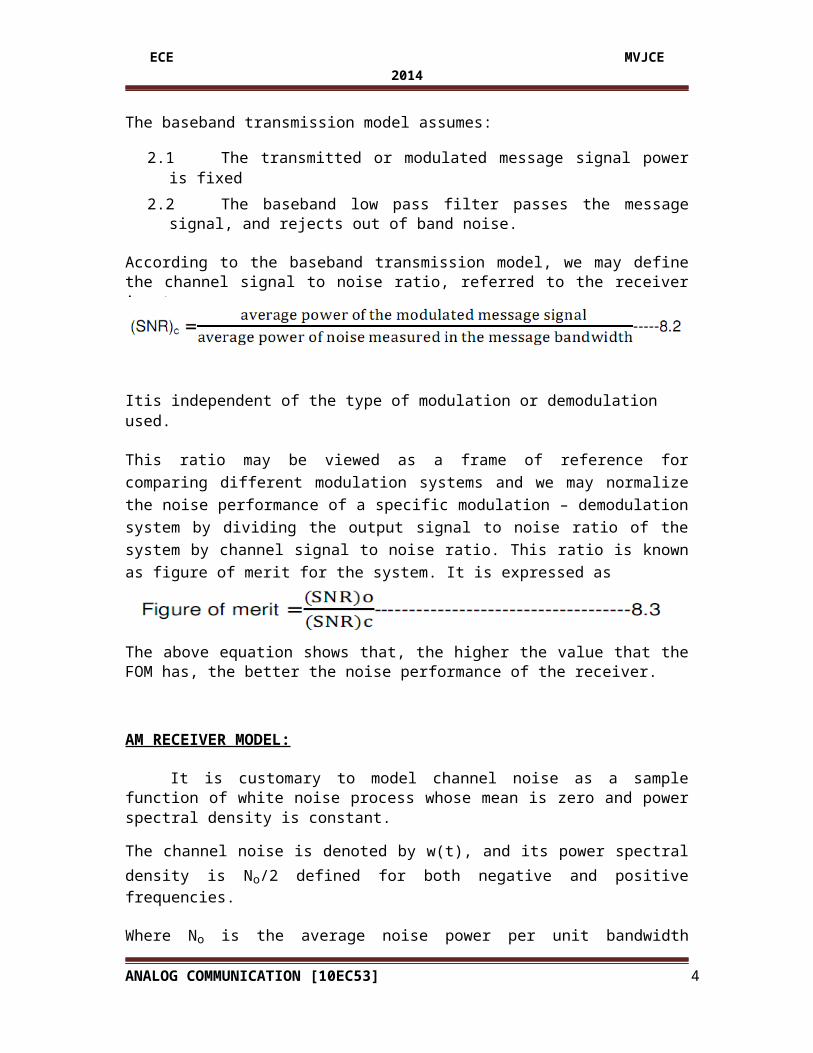
According to the baseband transmission model, we may define the channel signal to noise ratio, referred to the receiver input as
Itis independent of the type of modulation or demodulation used.
This ratio may be viewed as a frame of reference for comparing different modulation systems and we may normalize the noise performance of a specific modulation – demodulation system by dividing the output signal to noise ratio of the system by channel signal to noise ratio. This ratio is known as figure of merit for the system. It is expressed as
The above equation shows that, the higher the value that the FOM has, the better the noise performance of the receiver.
AM RECEIVER MODEL:
It is customary to model channel noise as a sample function of white noise process whose mean is zero and power spectral density is constant.
The channel noise is denoted by w(t), and its power spectral density is No/2 defined for both negative and positive frequencies.
Where No is the average noise power per unit bandwidth measured at the front end of the receiver.
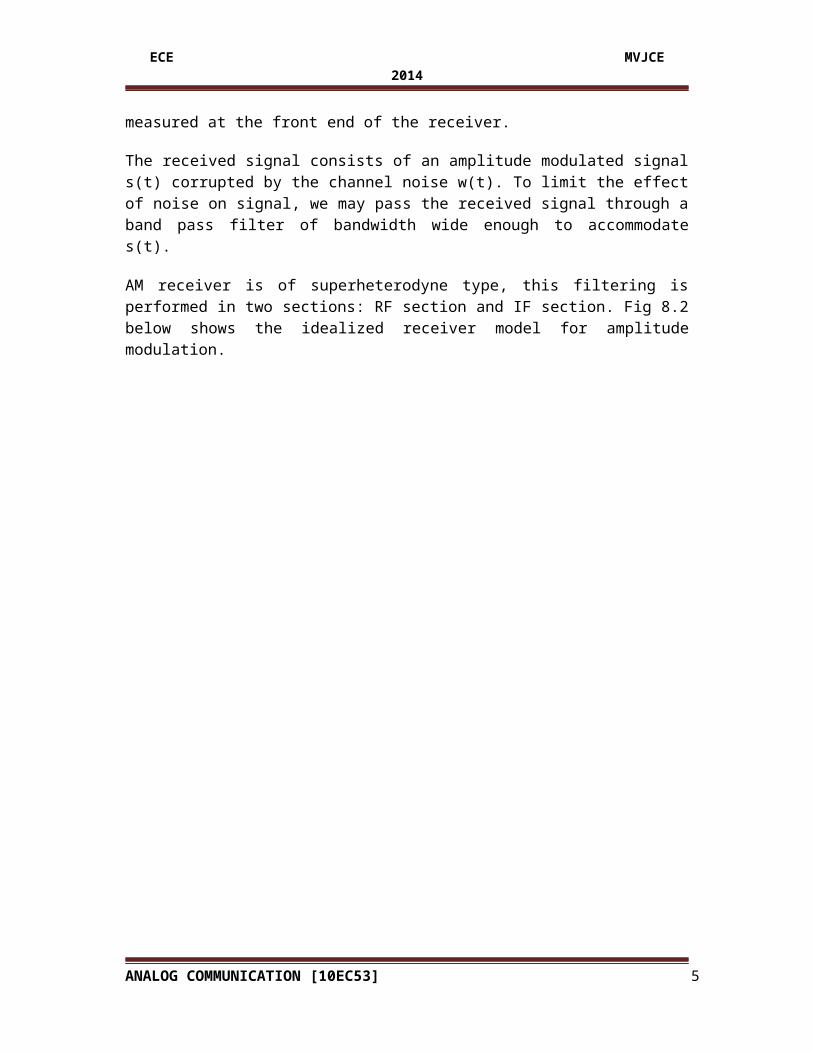
The received signal consists of an amplitude modulated signal s(t) corrupted by the channel noise w(t). To limit the effect of noise on signal, we may pass the received signal through a band pass filter of bandwidth wide enough to accommodate s(t).
AM receiver is of superheterodyne type, this filtering is performed in two sections: RF section and IF section. Fig 8.2 below shows the idealized receiver model for amplitude modulation.
ANALOG COMMUNICATION [10EC53] 3
ECE MVJCE 2014
s(t) + Σ IF Filter x(t) Demodulator signal
+
w(t)
Fig 8.2 Idealized receiver model for amplitude modulation
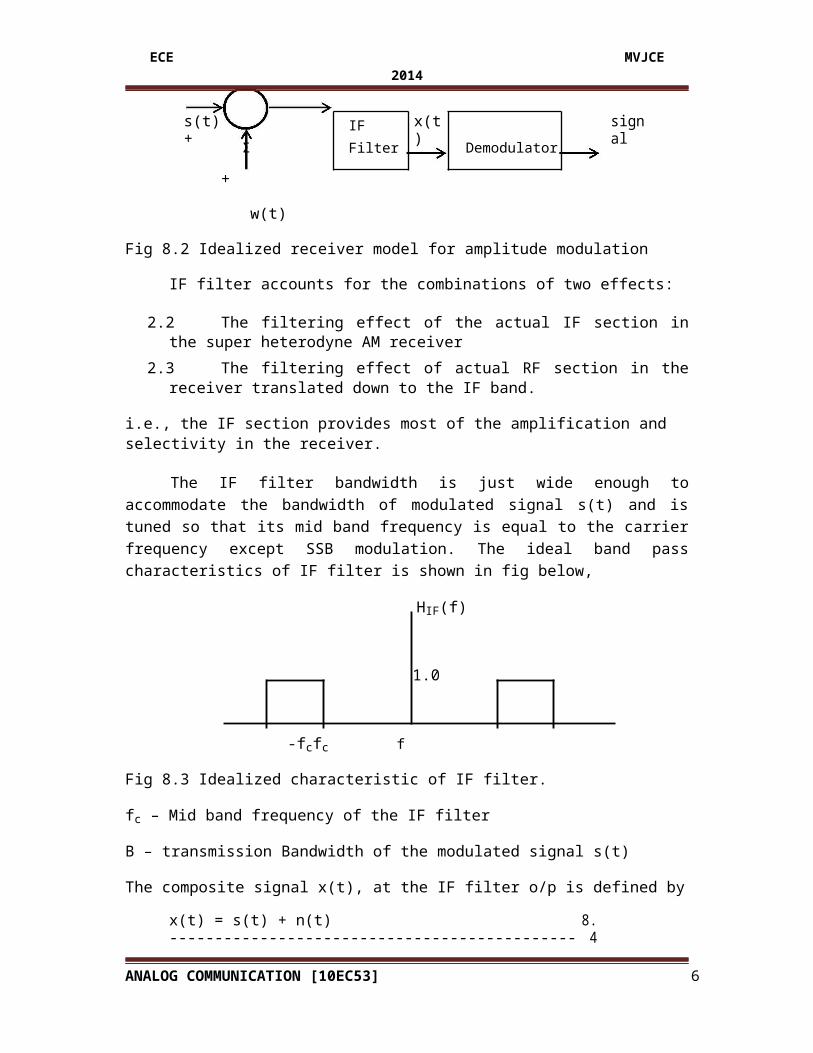
IF filter accounts for the combinations of two effects:
2.2 The filtering effect of the actual IF section in the super heterodyne AM receiver 2.3 The filtering effect of actual RF section in the receiver translated down to the IF
band.
i.e., the IF section provides most of the amplification and selectivity in the receiver.
The IF filter bandwidth is just wide enough to accommodate the bandwidth of modulated signal s(t) and is tuned so that its mid band frequency is equal to the carrier frequency except SSB modulation. The ideal band pass characteristics of IF filter is shown in fig below,
HIF(f)
1.0
-fcfc f
Fig 8.3 Idealized characteristic of IF filter.
fc – Mid band frequency of the IF filter
B – transmission Bandwidth of the modulated signal s(t)
The composite signal x(t), at the IF filter o/p is defined by
x(t) = s(t) + n(t) ----------------------------------------------------------- 8.4
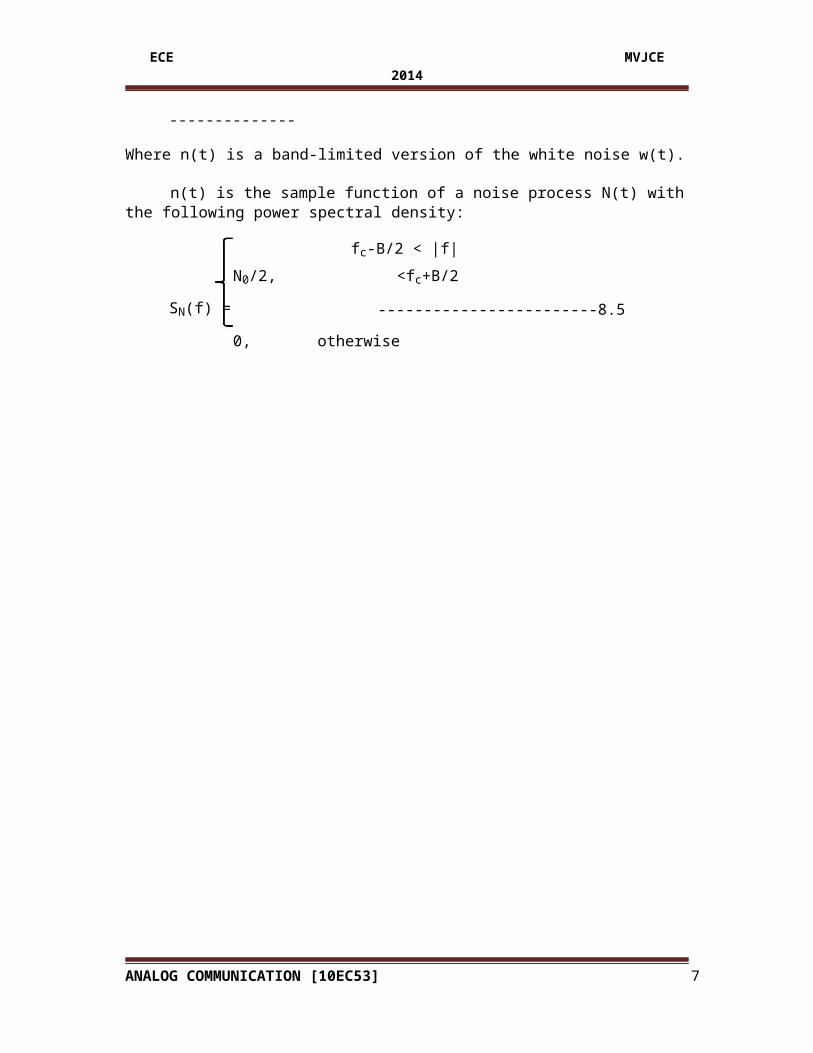
Where n(t) is a band-limited version of the white noise w(t).
n(t) is the sample function of a noise process N(t) with the following power spectral density:
N0/2, fc-B/2 < |f| <fc+B/2
SN(f) = ------------------------8.5
0, otherwise
ANALOG COMMUNICATION [10EC53] 4
ECE MVJCE 2014
ANALOG COMMUNICATION [10EC53] 5
ECE MVJCE 2014
The band limited noise n(t) may be considered as narrow band noise.
The modulated signal s(t) is a band pass signal , its exact description is depends on the type of modulation used.
The time domain representation of narrow band noise can be expressed in two different ways,
(1) Represented in terms of in-phase and quadrature components.
This method is well suited for the noise analysis of AM receivers using coherent detector and also for envelope detection.
(2) Represented in terms of envelope and phase. This method is well suited for the noise analysis of FM receivers.
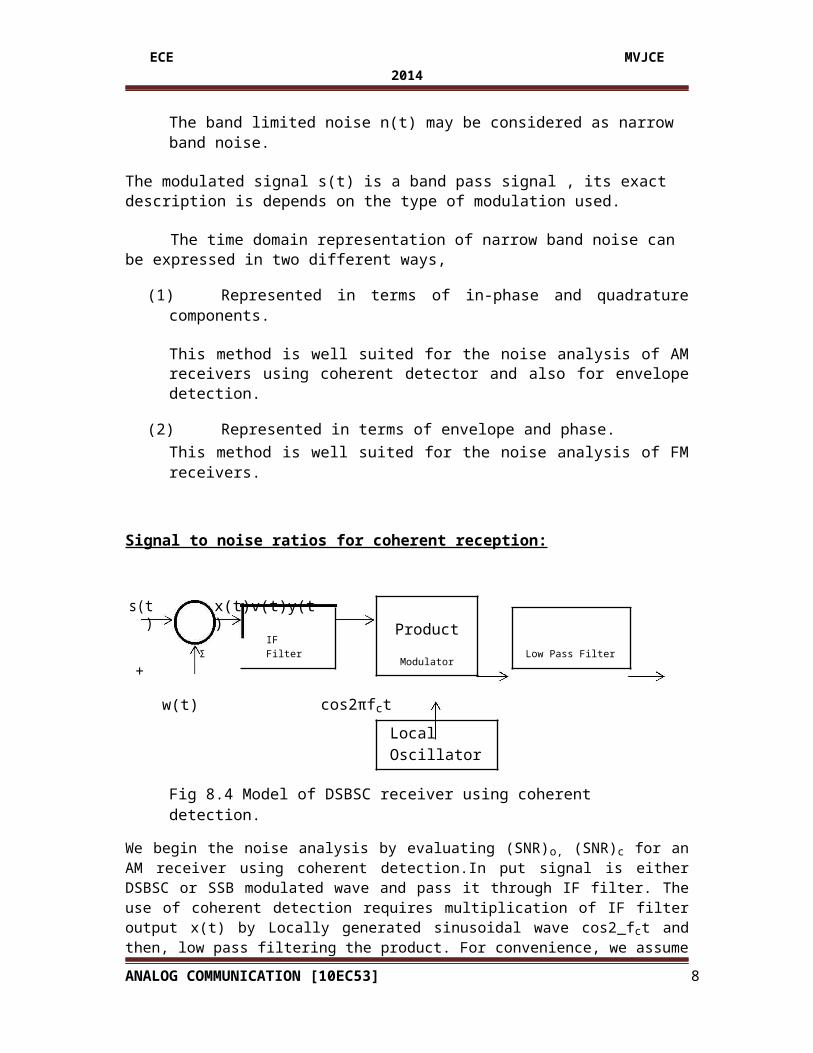
Signal to noise ratios for coherent reception:
s(t) x(t)v(t)y(t) ProductΣ IF Filter Low Pass Filter
Modulator+
cos2πfctw(t)
Local Oscillator
Fig 8.4 Model of DSBSC receiver using coherent detection.
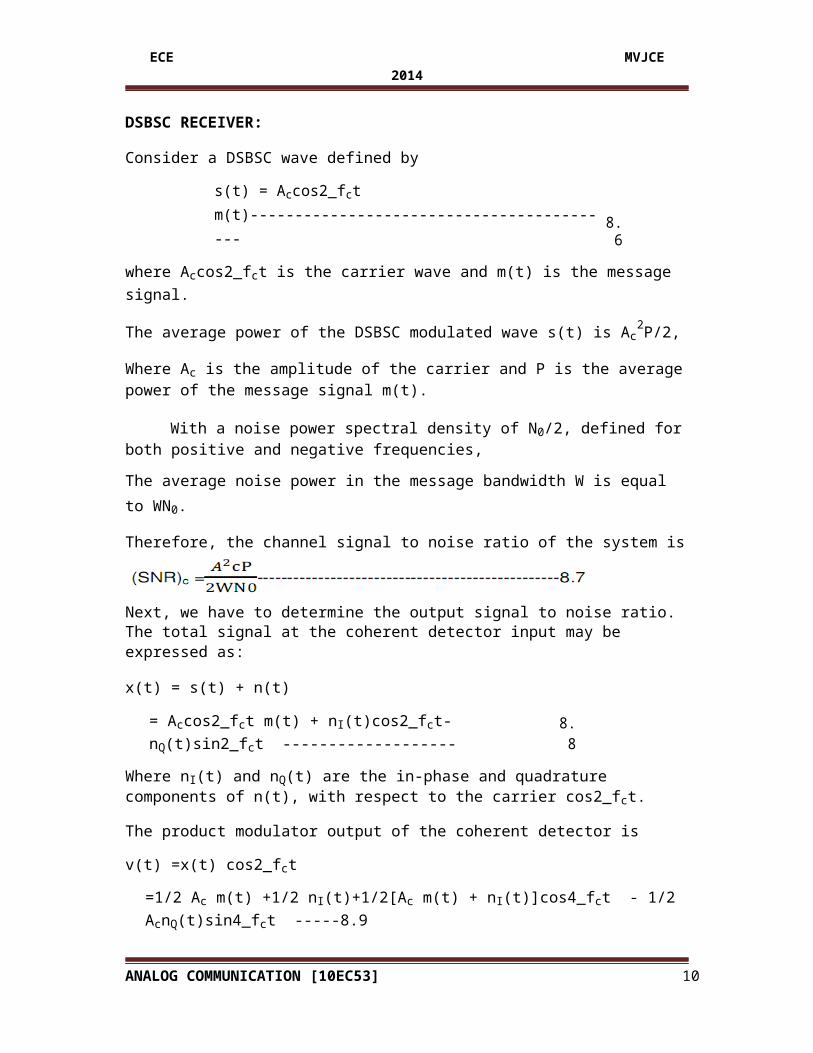
We begin the noise analysis by evaluating (SNR)o, (SNR)c for an AM receiver using coherent detection.In put signal is either DSBSC or SSB modulated wave and pass it through IF filter. The use of coherent detection requires multiplication of IF filter output x(t) by Locally generated sinusoidal wave cos2_fct and then, low pass filtering the product. For convenience, we assume that amplitude of locally generated signal is unity. For satisfactory operation local oscillator must be synchronized to carrier both in frequency and phase, we assume that perfect synchronization.
Coherent detection has the unique feature that for any signal-to-noise ratio, an output strictly proportional to the original message signal always present. That is., the output message component is unmutilated and the noise component always appears additively with the message irrespective of the signal-to-noise ratio.
ANALOG COMMUNICATION [10EC53] 6
ECE MVJCE 2014
DSBSC RECEIVER:
Consider a DSBSC wave defined by
s(t) = Accos2_fct m(t)------------------------------------------ 8.6
where Accos2_fct is the carrier wave and m(t) is the message signal.
The average power of the DSBSC modulated wave s(t) is Ac2P/2,
Where Ac is the amplitude of the carrier and P is the average power of the message signal m(t).
With a noise power spectral density of N0/2, defined for both positive and negative frequencies,
The average noise power in the message bandwidth W is equal to WN0.
Therefore, the channel signal to noise ratio of the system is
Next, we have to determine the output signal to noise ratio. The total signal at the coherent detector input may be expressed as:
x(t) = s(t) + n(t)
= Accos2_fct m(t) + nI(t)cos2_fct-nQ(t)sin2_fct ------------------- 8.8
Where nI(t) and nQ(t) are the in-phase and quadrature components of n(t), with respect to the carrier cos2_fct.
The product modulator output of the coherent detector is
v(t) =x(t) cos2_fct
=1/2 Ac m(t) +1/2 nI(t)+1/2[Ac m(t) + nI(t)]cos4_fct - 1/2 AcnQ(t)sin4_fct -----8.9
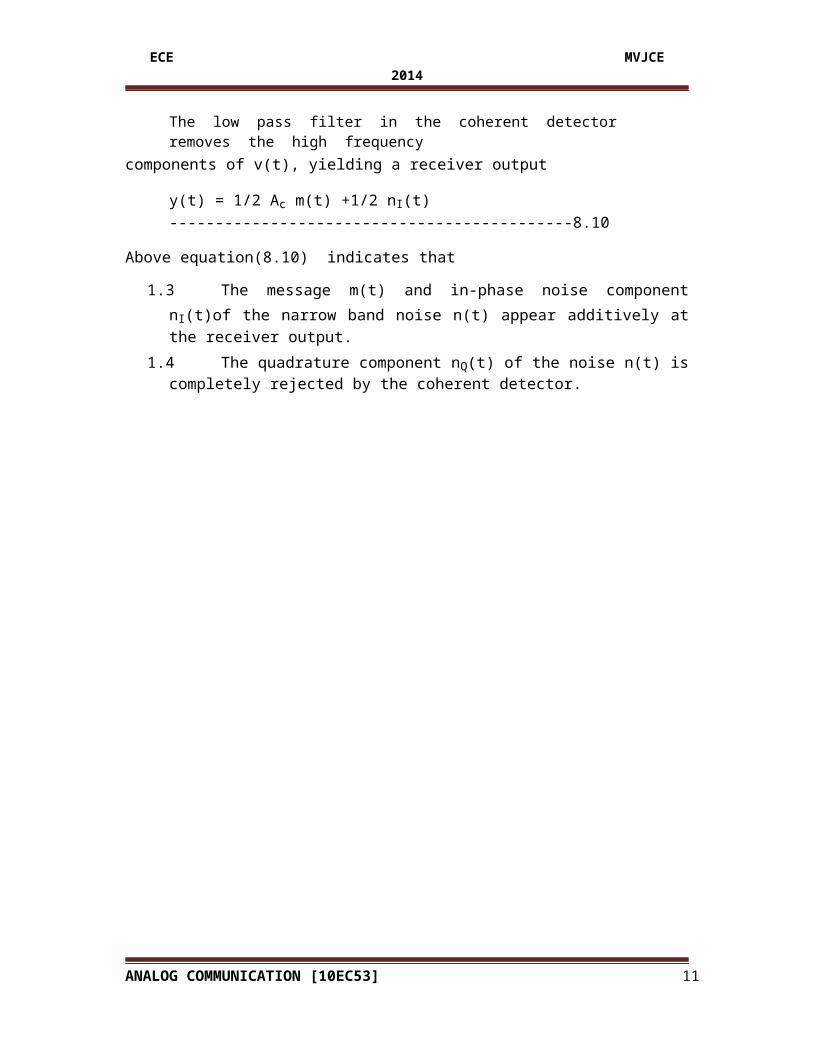
The low pass filter in the coherent detector removes the high frequencycomponents of v(t), yielding a receiver output
y(t) = 1/2 Ac m(t) +1/2 nI(t) --------------------------------------------8.10
Above equation(8.10) indicates that
1.3 The message m(t) and in-phase noise component nI(t)of the narrow band noise n(t) appear additively at the receiver output.
1.4 The quadrature component nQ(t) of the noise n(t) is completely rejected by the coherent detector.
ANALOG COMMUNICATION [10EC53] 7
ECE MVJCE 2014
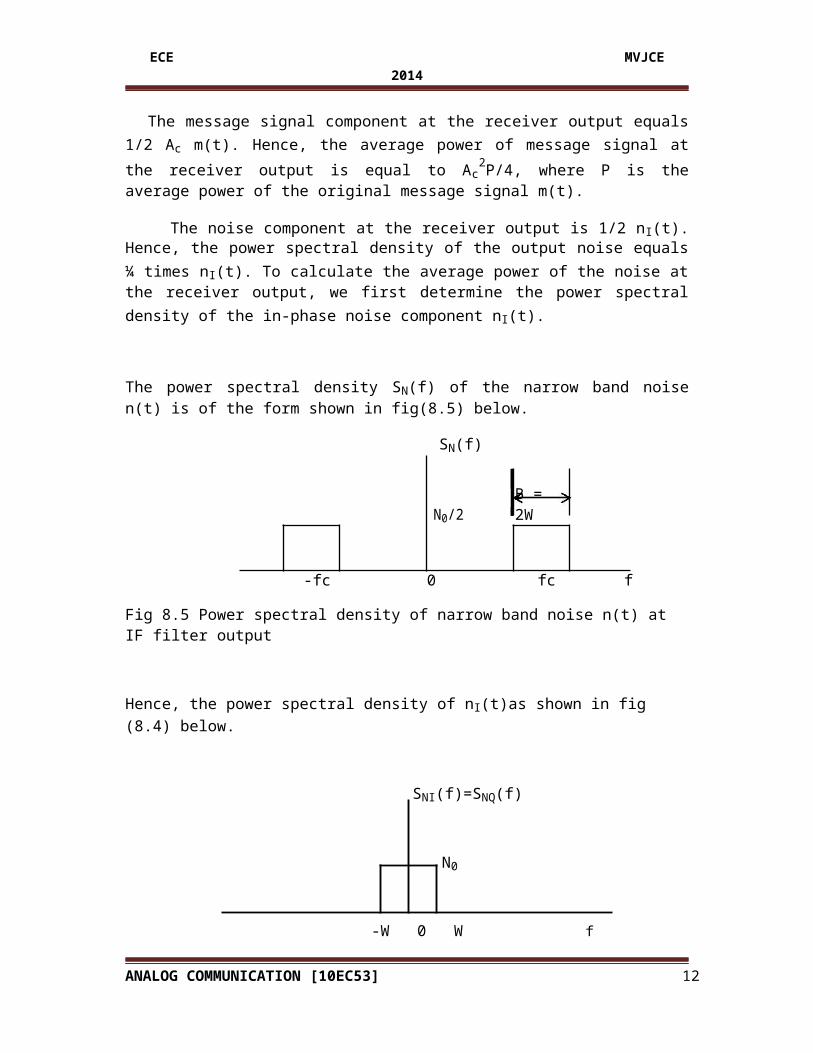
The message signal component at the receiver output equals 1/2 Ac m(t). Hence, the average power of message signal at the receiver output is equal to Ac
2P/4, where P is the average power of the original message signal m(t).
The noise component at the receiver output is 1/2 nI(t). Hence, the power spectral density of the output noise equals ¼ times nI(t). To calculate the average power of the noise at the receiver output, we first determine the power spectral density of the in-phase noise component nI(t).
The power spectral density SN(f) of the narrow band noise n(t) is of the form shown in fig(8.5) below.
SN(f)
N0/2 B = 2W
-fc 0 fc f
Fig 8.5 Power spectral density of narrow band noise n(t) at IF filter output
Hence, the power spectral density of nI(t)as shown in fig (8.4) below.
SNI(f)=SNQ(f)
N0
-W 0 W f
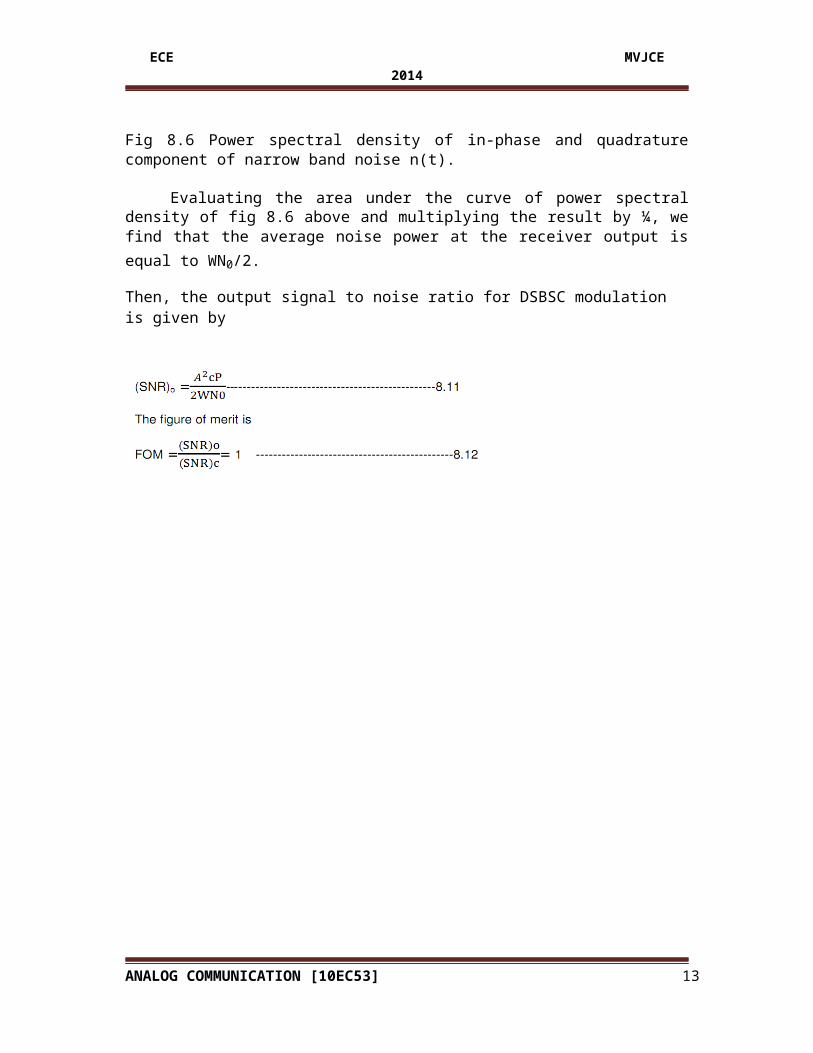
Fig 8.6 Power spectral density of in-phase and quadrature component of narrow band noise n(t).
Evaluating the area under the curve of power spectral density of fig 8.6 above and multiplying the result by ¼, we find that the average noise power at the receiver output is equal to WN0/2.
Then, the output signal to noise ratio for DSBSC modulation is given by
ANALOG COMMUNICATION [10EC53] 8
ECE MVJCE 2014
ANALOG COMMUNICATION [10EC53] 9
ECE MVJCE 2014
EXERCISE 8.1
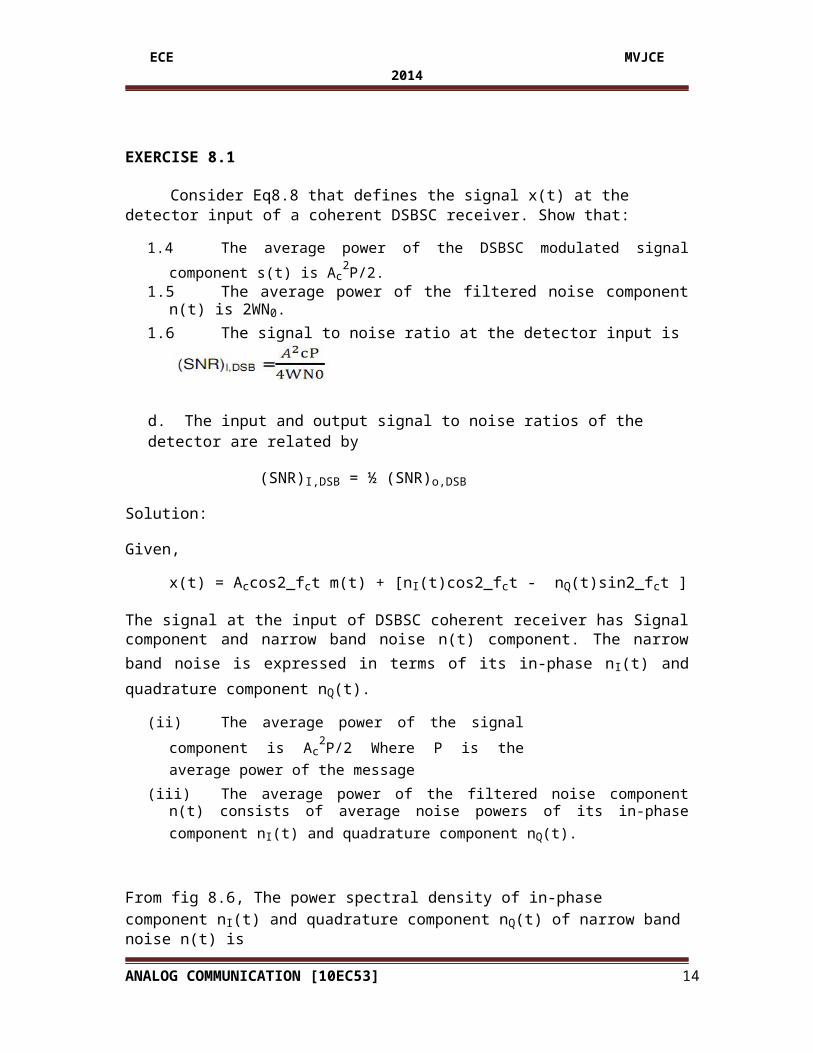
Consider Eq8.8 that defines the signal x(t) at the detector input of a coherent DSBSC receiver. Show that:
1.4 The average power of the DSBSC modulated signal component s(t) is Ac2P/2.
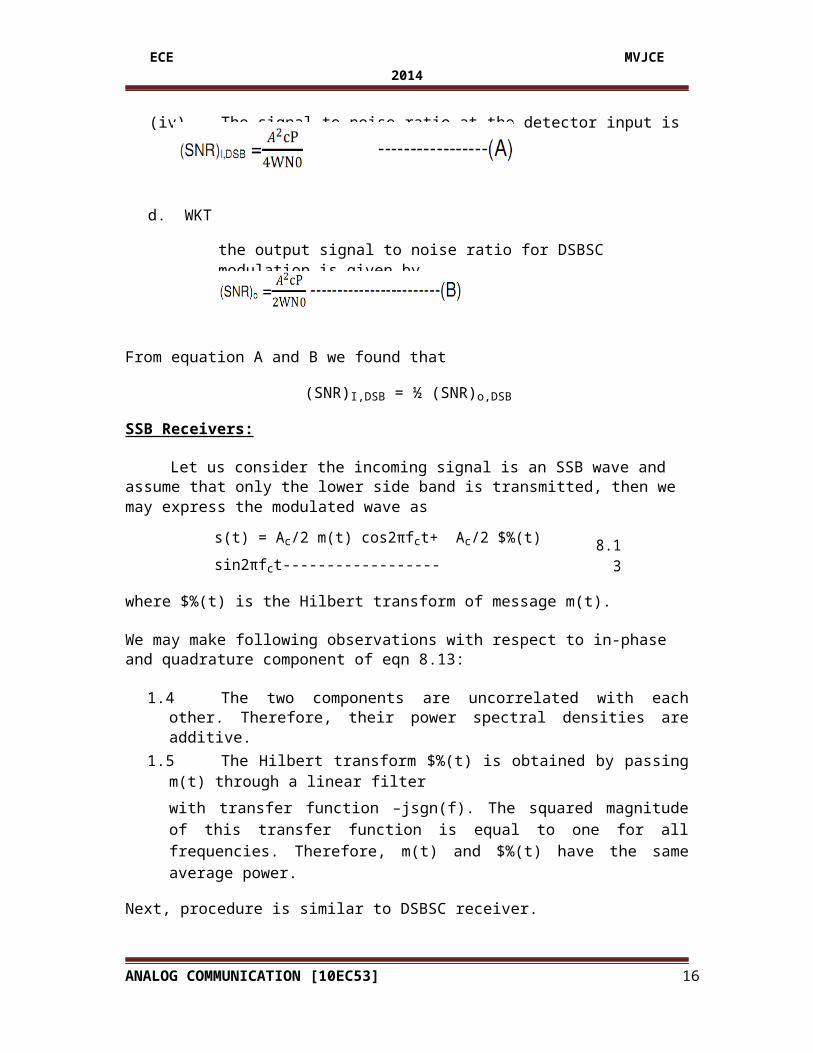
1.5 The average power of the filtered noise component n(t) is 2WN0. 1.6 The signal to noise ratio at the detector input is
d. The input and output signal to noise ratios of the detector are related by
(SNR)I,DSB = ½ (SNR)o,DSB
Solution:
Given,
x(t) = Accos2_fct m(t) + [nI(t)cos2_fct - nQ(t)sin2_fct ]
The signal at the input of DSBSC coherent receiver has Signal component and narrow band noise n(t) component. The narrow band noise is expressed in terms of its in-phase n I(t) and quadrature component nQ(t).
(ii) The average power of the signal component is Ac2P/2
Where P is the average power of the message (iii) The average power of the filtered noise component n(t) consists of average noise
powers of its in-phase component nI(t) and quadrature component nQ(t).
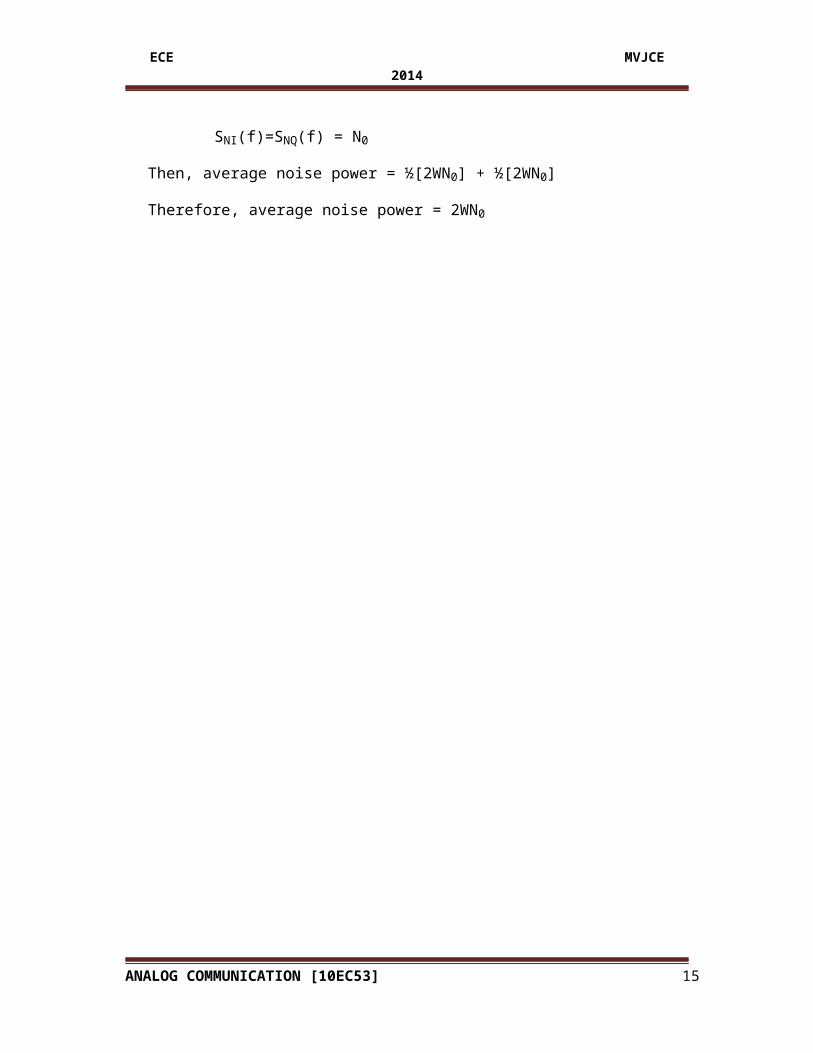
From fig 8.6, The power spectral density of in-phase component nI(t) and quadrature component nQ(t) of narrow band noise n(t) is
SNI(f)=SNQ(f) = N0
Then, average noise power = ½[2WN0] + ½[2WN0]
Therefore, average noise power = 2WN0
ANALOG COMMUNICATION [10EC53] 10
ECE MVJCE 2014
(iv)The signal to noise ratio at the detector input is
d. WKT
the output signal to noise ratio for DSBSC modulation is given by
From equation A and B we found that
(SNR)I,DSB = ½ (SNR)o,DSB
SSB Receivers:
Let us consider the incoming signal is an SSB wave and assume that only the lower side band is transmitted, then we may express the modulated wave as
s(t) = Ac/2 m(t) cos2πfct+ Ac/2 $%(t) sin2πfct------------------ 8.13
where $%(t) is the Hilbert transform of message m(t).
We may make following observations with respect to in-phase and quadrature component of eqn 8.13:
1.4 The two components are uncorrelated with each other. Therefore, their power spectral densities are additive.
1.5 The Hilbert transform $%(t) is obtained by passing m(t) through a linear filter with transfer function –jsgn(f). The squared magnitude of this transfer function is equal to one for all frequencies. Therefore, m(t) and $%(t) have the same average power.
Next, procedure is similar to DSBSC receiver.
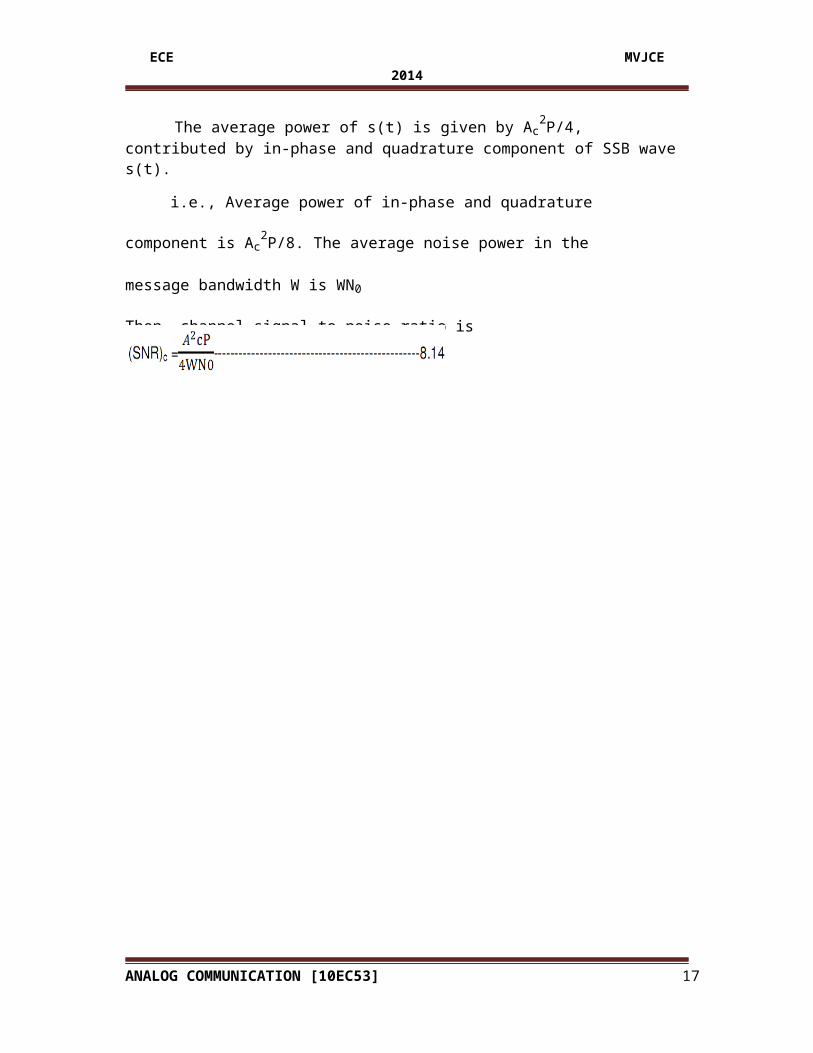
The average power of s(t) is given by Ac2P/4, contributed by in-phase and
quadrature component of SSB wave s(t).
i.e., Average power of in-phase and quadrature component is Ac2P/8. The
average noise power in the message bandwidth W is WN0
Then, channel signal to noise ratio is
ANALOG COMMUNICATION [10EC53] 11
ECE MVJCE 2014
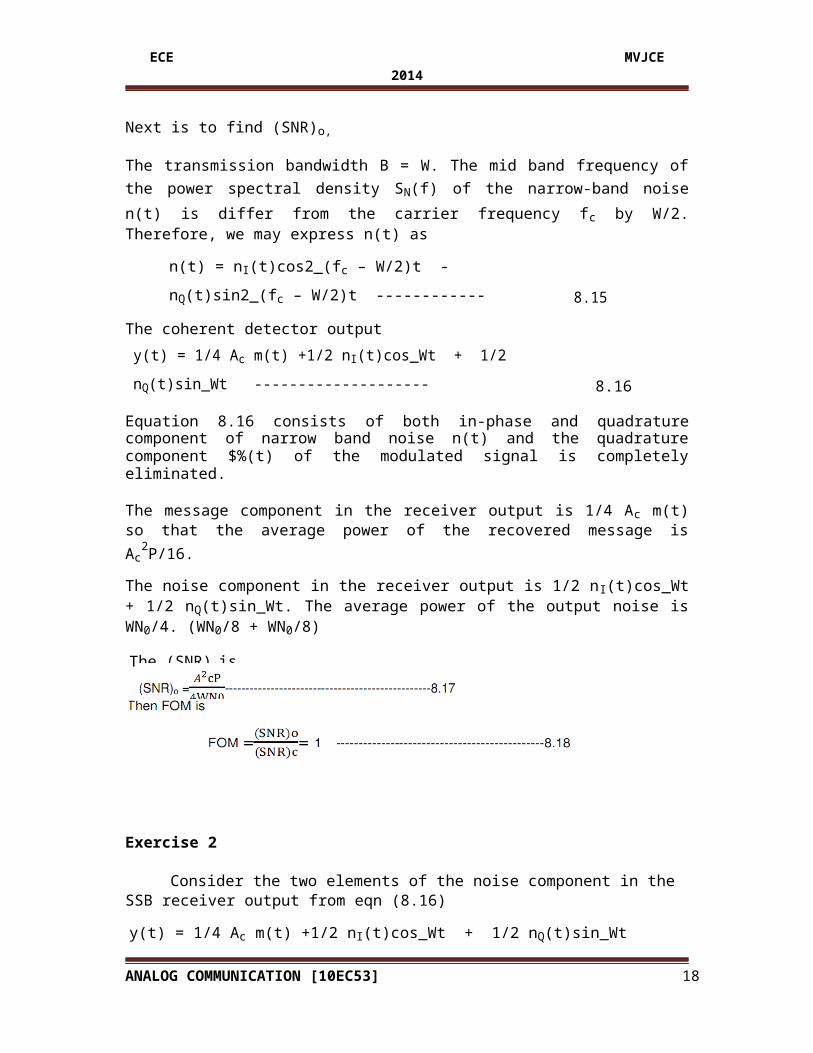
Next is to find (SNR)o,
The transmission bandwidth B = W. The mid band frequency of the power spectral density SN(f) of the narrow-band noise n(t) is differ from the carrier frequency fc by W/2. Therefore, we may express n(t) as
n(t) = nI(t)cos2_(fc – W/2)t - nQ(t)sin2_(fc – W/2)t ------------ 8.15
The coherent detector output
y(t) = 1/4 Ac m(t) +1/2 nI(t)cos_Wt + 1/2 nQ(t)sin_Wt -------------------- 8.16
Equation 8.16 consists of both in-phase and quadrature component of narrow band noise n(t) and the quadrature component $%(t) of the modulated signal is completely eliminated.
The message component in the receiver output is 1/4 Ac m(t) so that the average power of the recovered message is Ac
2P/16.
The noise component in the receiver output is 1/2 nI(t)cos_Wt + 1/2 nQ(t)sin_Wt. The average power of the output noise is WN0/4. (WN0/8 + WN0/8)
The (SNR)ois
Exercise 2
Consider the two elements of the noise component in the SSB receiver output from eqn (8.16)
y(t) = 1/4 Ac m(t) +1/2 nI(t)cos_Wt + 1/2 nQ(t)sin_Wt
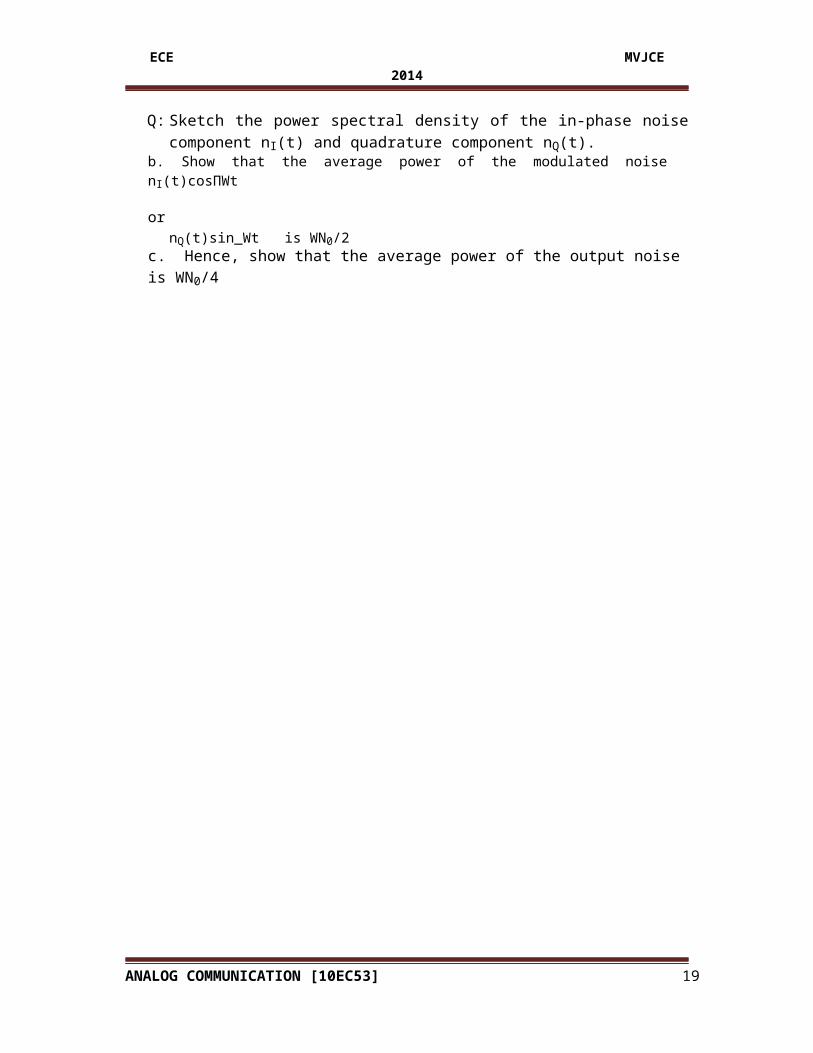
Q: Sketch the power spectral density of the in-phase noise component n I(t) and quadrature component nQ(t).
b. Show that the average power of the modulated noise nI(t)cosΠWt ornQ(t)sin_Wt is WN0/2
c. Hence, show that the average power of the output noise is WN0/4
ANALOG COMMUNICATION [10EC53] 12
ECE MVJCE 2014
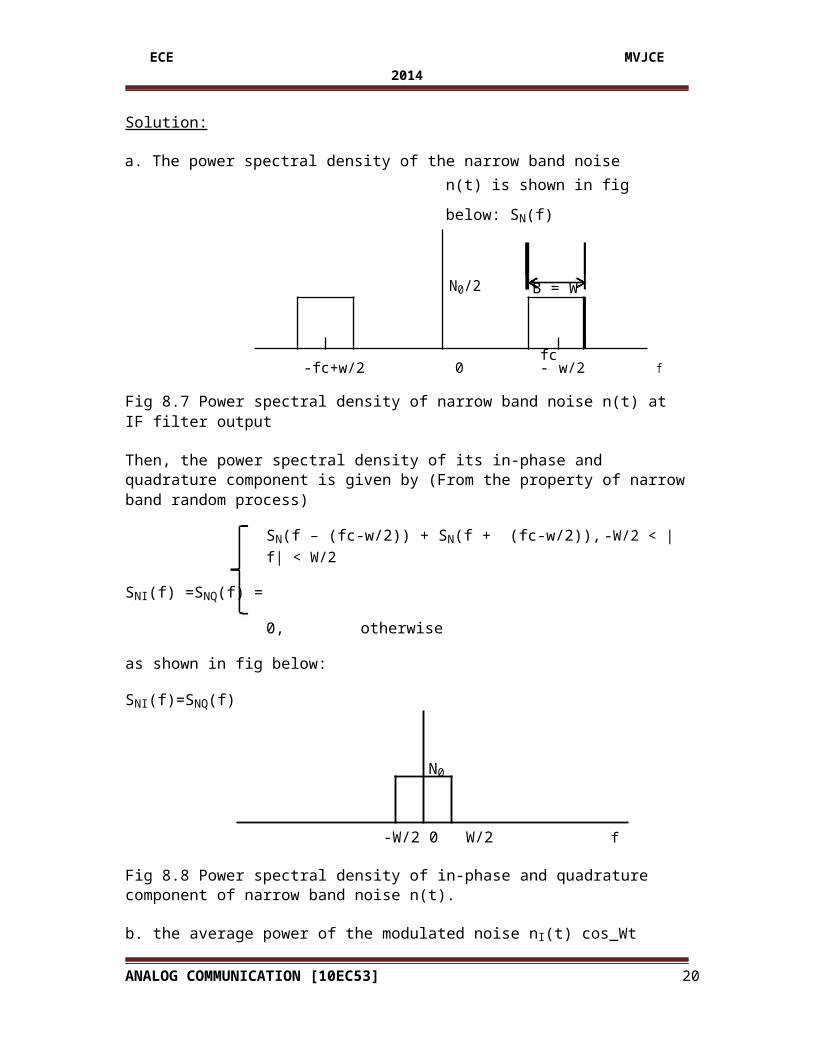
Solution:
a. The power spectral density of the narrow band noise n(t) is shown in fig below: SN(f)
N0/2 B = W
-fc+w/2 0 fc- w/2 f
Fig 8.7 Power spectral density of narrow band noise n(t) at IF filter output
Then, the power spectral density of its in-phase and quadrature component is given by (From the property of narrow band random process)
SN(f – (fc-w/2)) + SN(f + (fc-w/2)), -W/2 < |f| < W/2
SNI(f) =SNQ(f) =
0, otherwise
as shown in fig below:
SNI(f)=SNQ(f)
N0
-W/2 0 W/2 f
Fig 8.8 Power spectral density of in-phase and quadrature component of narrow band noise n(t).
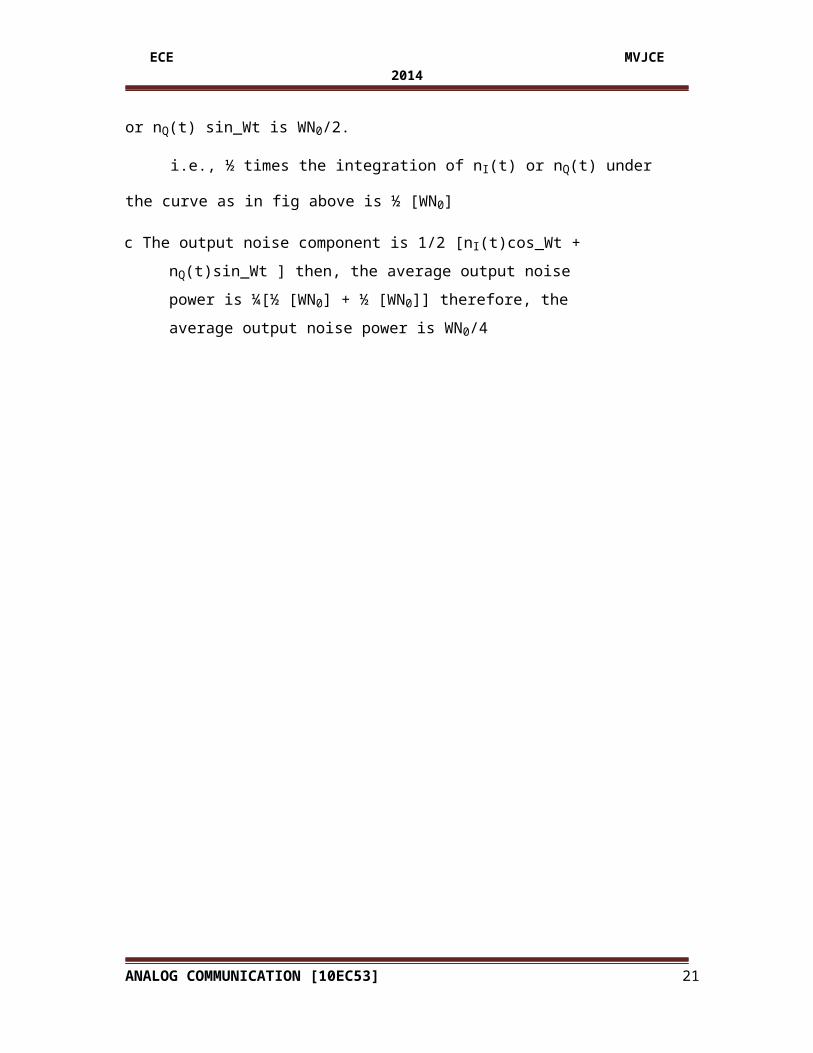
b. the average power of the modulated noise nI(t) cos_Wt or nQ(t) sin_Wt is WN0/2.
i.e., ½ times the integration of nI(t) or nQ(t) under the curve as in fig above is ½
[WN0]
c The output noise component is 1/2 [nI(t)cos_Wt + nQ(t)sin_Wt ] then, the
average output noise power is ¼[½ [WN0] + ½ [WN0]] therefore,
the average output noise power is WN0/4
ANALOG COMMUNICATION [10EC53] 13
ECE MVJCE 2014
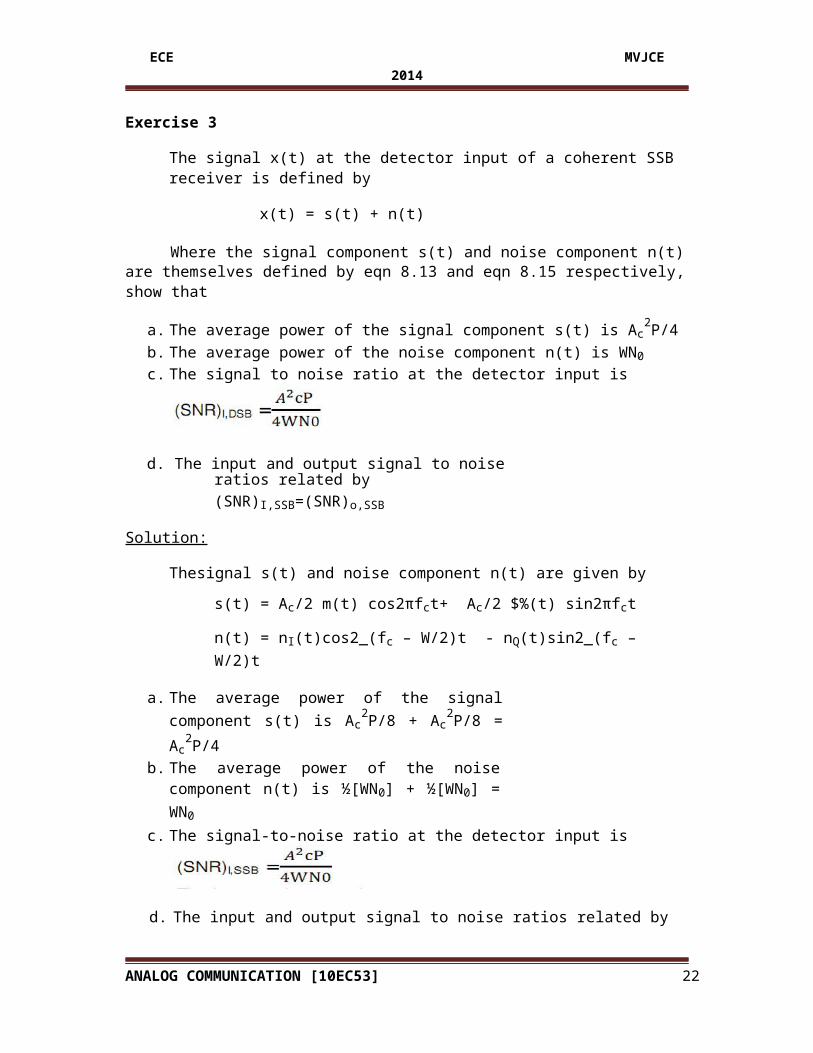
Exercise 3
The signal x(t) at the detector input of a coherent SSB receiver is defined by
x(t) = s(t) + n(t)
Where the signal component s(t) and noise component n(t) are themselves defined by eqn 8.13 and eqn 8.15 respectively, show that
a. The average power of the signal component s(t) is Ac2P/4
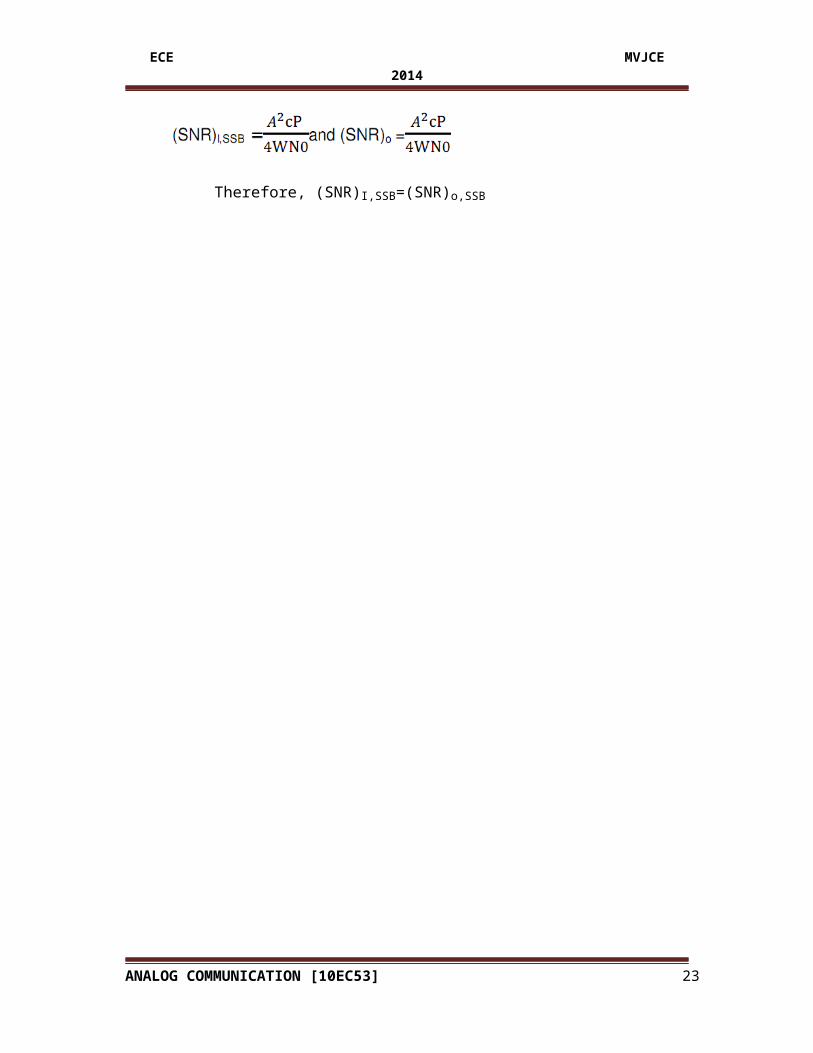
b. The average power of the noise component n(t) is WN0 c. The signal to noise ratio at the detector input is
d. The input and output signal to noise ratios related by (SNR)I,SSB=(SNR)o,SSB
Solution:
Thesignal s(t) and noise component n(t) are given by
s(t) = Ac/2 m(t) cos2πfct+ Ac/2 $%(t) sin2πfct
n(t) = nI(t)cos2_(fc – W/2)t - nQ(t)sin2_(fc – W/2)t
a. The average power of the signal component s(t) is Ac
2P/8 + Ac2P/8 = Ac
2P/4 b. The average power of the noise component n(t) is
½[WN0] + ½[WN0] = WN0 c. The signal-to-noise ratio at the detector input is
d. The input and output signal to noise ratios related by
Therefore, (SNR)I,SSB=(SNR)o,SSB
ANALOG COMMUNICATION [10EC53] 14
ECE MVJCE 2014
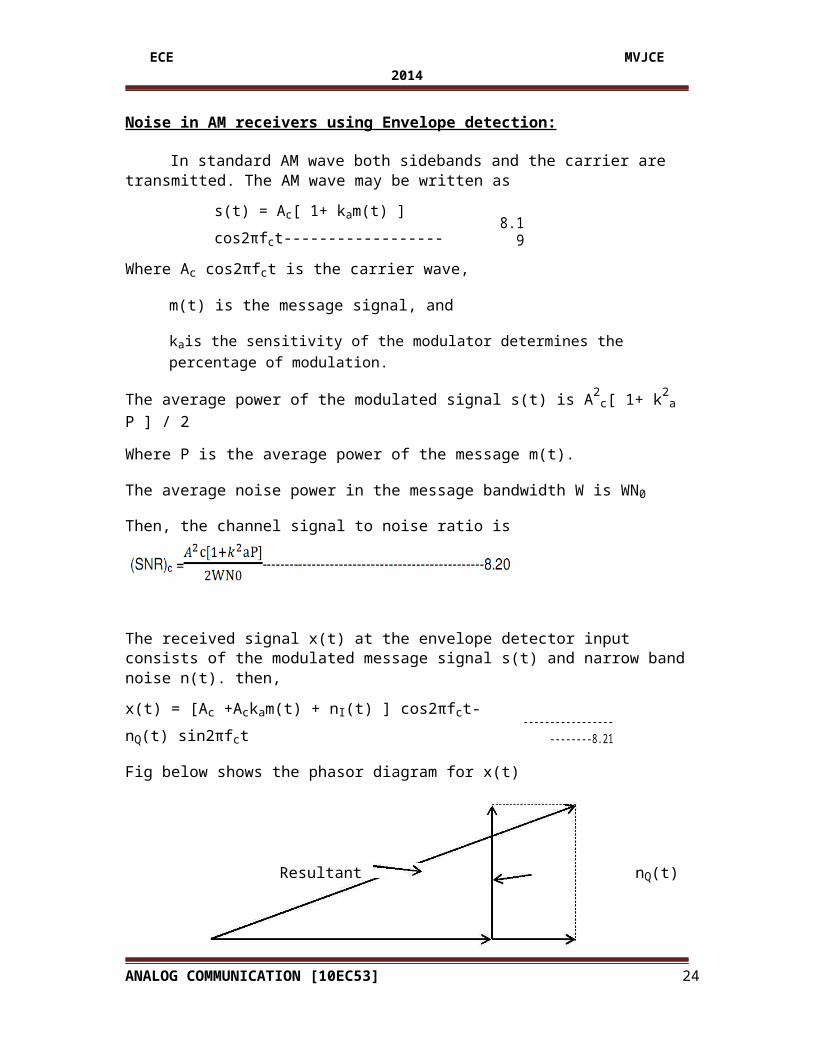
Noise in AM receivers using Envelope detection:
In standard AM wave both sidebands and the carrier are transmitted. The AM wave may be written as
s(t) = Ac[ 1+ kam(t) ] cos2πfct------------------ 8.19
Where Ac cos2πfct is the carrier wave,
m(t) is the message signal, and
kais the sensitivity of the modulator determines the percentage of modulation.
The average power of the modulated signal s(t) is A2c[ 1+ k2
a P ] / 2
Where P is the average power of the message m(t).
The average noise power in the message bandwidth W is WN0
Then, the channel signal to noise ratio is
The received signal x(t) at the envelope detector input consists of the modulated message signal s(t) and narrow band noise n(t). then,
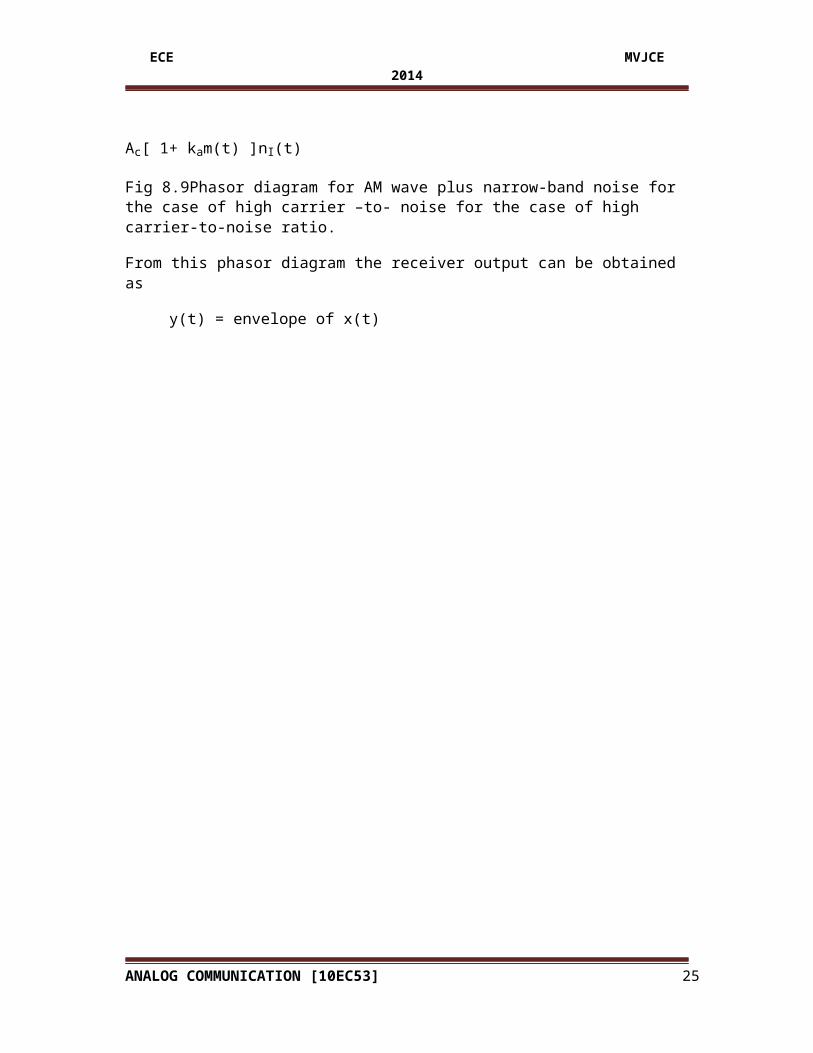
x(t) = [Ac +Ackam(t) + nI(t) ] cos2πfct- nQ(t) sin2πfct -------------------------8.21
Fig below shows the phasor diagram for x(t)
Resultant nQ(t)
Ac[ 1+ kam(t) ]nI(t)
Fig 8.9Phasor diagram for AM wave plus narrow-band noise for the case of high carrier –to- noise for the case of high carrier-to-noise ratio.
From this phasor diagram the receiver output can be obtained as
y(t) = envelope of x(t)
ANALOG COMMUNICATION [10EC53] 15
ECE MVJCE 2014
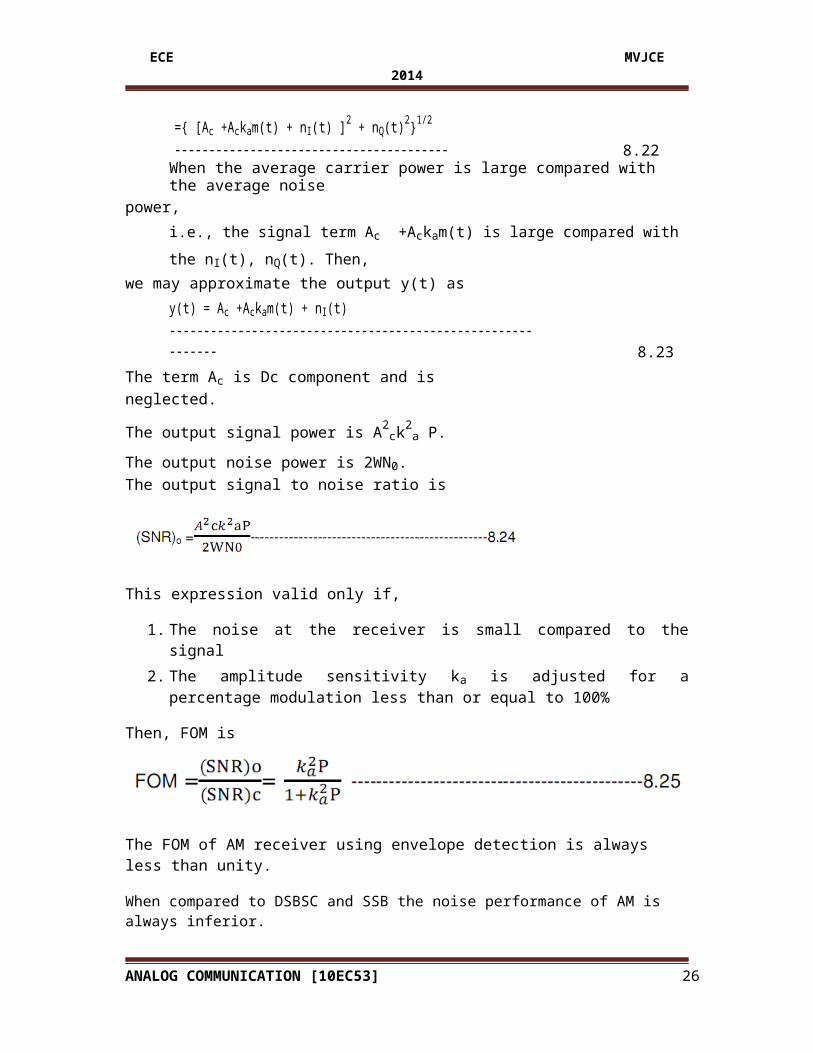
={ [Ac +Ackam(t) + nI(t) ]2 + nQ(t)2}1/2 ---------------------------------------- 8.22
When the average carrier power is large compared with the average noisepower,
i.e., the signal term Ac +Ackam(t) is large compared with the nI(t), nQ(t). Then,we may approximate the output y(t) as
y(t) = Ac +Ackam(t) + nI(t) ------------------------------------------------------------ 8.23
The term Ac is Dc component and is neglected.
The output signal power is A2ck2
a P.
The output noise power is 2WN0.The output signal to noise ratio is
This expression valid only if,
1. The noise at the receiver is small compared to the signal 2. The amplitude sensitivity ka is adjusted for a percentage modulation less than or
equal to 100%
Then, FOM is
The FOM of AM receiver using envelope detection is always less than unity.
When compared to DSBSC and SSB the noise performance of AM is always inferior.
Exampe1. Single-Tone Modulation
Consider the message m(t) is a single- tone or single frequency signal as m(t) = Amcos2πfmt
where Am – Amplitude of the message and fm
– frequency of the message.
Then, the AM wave is given by
ANALOG COMMUNICATION [10EC53] 16
ECE MVJCE 2014
s(t) = Ac[ 1+ µ cos2πfmt] cos2πfct
ANALOG COMMUNICATION [10EC53] 17
ECE MVJCE 2014
where µ = Amka is the modulation factor.
The average power of the modulating wave m(t) is
P = ½ A2m
Therefore, Eqn 8.25 becomes
When µ = 1, FOM is 1/3.
This means that, AM system must transmit three times as much average power as a suppressed carrier system in order to achieve the same quality of noise performance.
Exercise 4
The carrier-to-noise ratio of a communication receiver is defined by
Express the output signal-to-noise ratio of eqn 8.24 interms of the carrier to noise ratio ρ.
Solution:
The carrier is Ac cos2πfct.
The signal at the receiver input is given by
x(t) = [Ac +Ackam(t) + nI(t) ] cos2πfct- nQ(t) sin2πfct
then, the carrier power is ½ A2c .
The average noise power is derived from both in-phase component and quadrature component,
ANALOG COMMUNICATION [10EC53] 18
ECE MVJCE 2014
i.e., the average noise power is ½[2WN0] + ½[2WN0] = 2WN0
therefore, The carrier to noise ratio is
The output signal-to-noise ratio is given by
Or(SNR)o =ρ2k2
a P
Threshold effect:
When the carrier-to-noise ratio at the receiver input of a standard AM is small compared to unity, the noise term dominates and the performance of the envelope detector changes completely.
In this case it is convenient to represent the narrow band noise n(t) in terms of its envelope r(t) and phase Ψ(t), as given by
n(t) = r(t) cos [ 2πfct + Ψ(t) ] ------------------------------------------------- 8.29
The phasor diagram of the detector input x(t) = s(t) + n(t) is shown in fig below,
Resultant Ac[ 1+ kam(t) ]
r(t) Ψ(t)
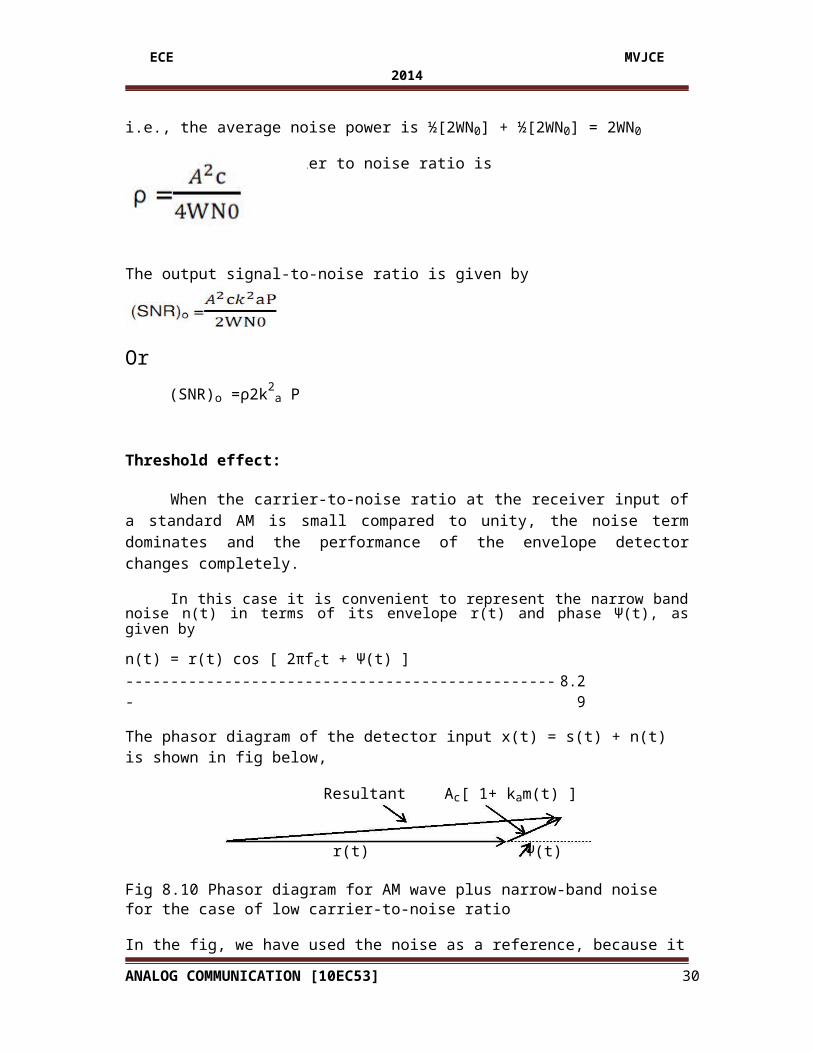
Fig 8.10 Phasor diagram for AM wave plus narrow-band noise for the case of low carrier-to-noise ratio
In the fig, we have used the noise as a reference, because it is a dominant term.
To the noise phasor, we added a phasor representing the signal term Ac[ 1+ kam(t) ], with the angle between them is Ψ(t).
From the fig it is observed that carrier amplitude is small compared to the noise envelope r(t). Then, we may approximate the envelope detector output as
y(t) = r(t) + Accos [ Ψ(t) ] + Ackam(t)cos [ Ψ(t) ] ------------------------ 8.30
ANALOG COMMUNICATION [10EC53] 19
ECE MVJCE 2014
The above relation shows that, the detector output is not proportional to the message signal m(t). The last term contains the message signal m(t) multiplied by noise in the form of cos [ Ψ(t) ]. The phase Ψ(t) of a noise uniformly distributed over 2π radians, and it can have values between 0 to 2π with equal probability.
Therefore, we have a complete loss of information. The loss of a message in an envelope detector that operates at a low carrier to noise ratio is referred to as threshold effect.
It means a value of the carrier to noise ratio below which the noise performance of a detector deteriorates much more rapidly than high carrier to noise rario as in eqn8.24((SNR)o).
FM Receiver Model:
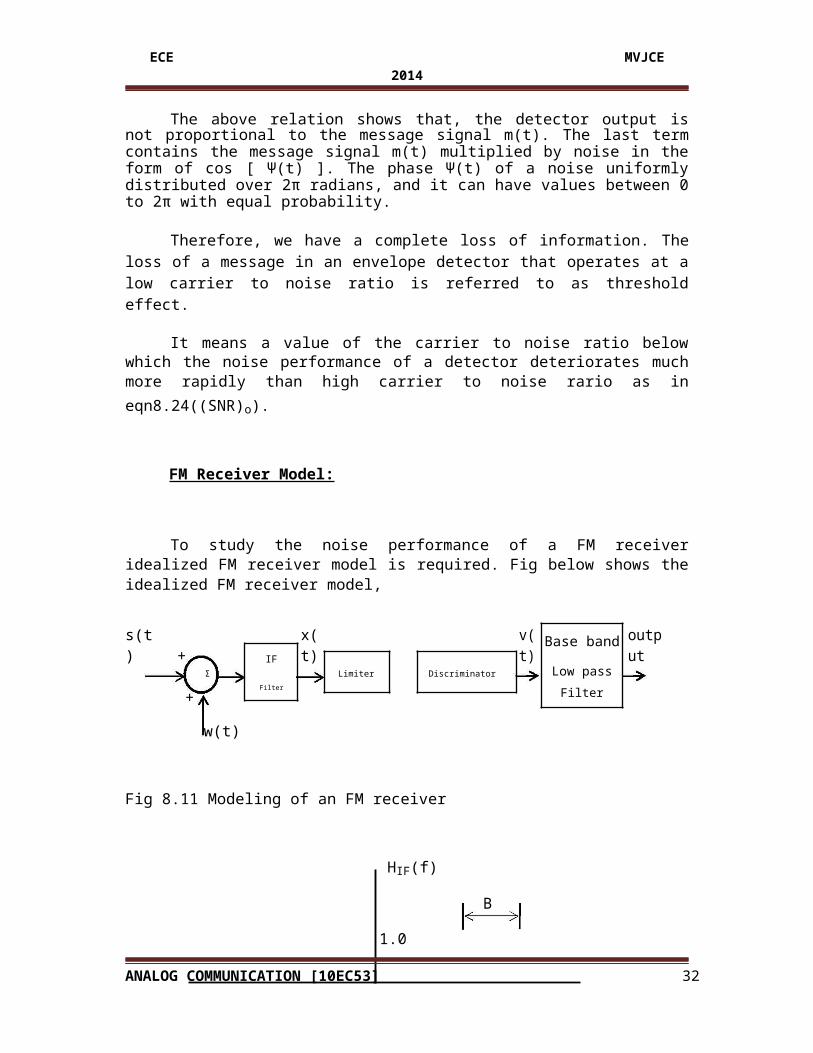
To study the noise performance of a FM receiver idealized FM receiver model is required. Fig below shows the idealized FM receiver model,
s(t) + x(t) v(t)Base band
outputIFLow passΣ Limiter Discriminator
+Filter Filter
w(t)
Fig 8.11 Modeling of an FM receiver
HIF(f)
B
1.0
-fc 0 fc f
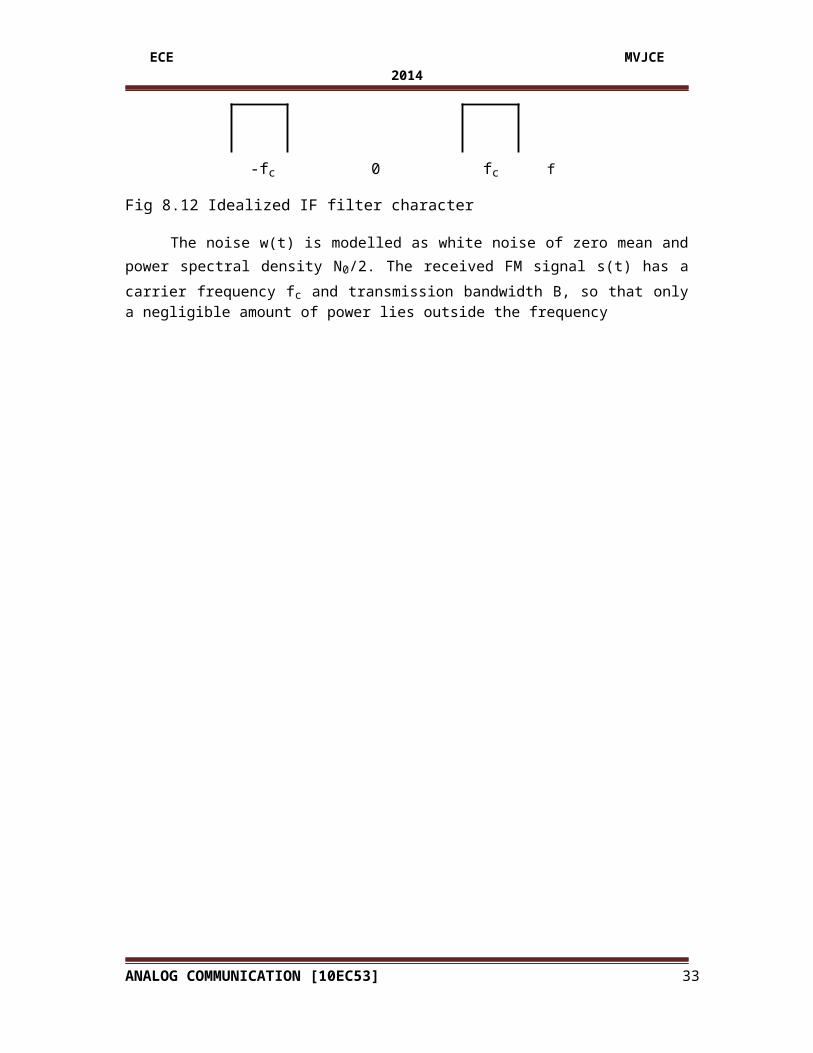
Fig 8.12 Idealized IF filter character
The noise w(t) is modelled as white noise of zero mean and power spectral density N0/2. The received FM signal s(t) has a carrier frequency fc and transmission bandwidth B, so that only a negligible amount of power lies outside the frequency
ANALOG COMMUNICATION [10EC53] 20
ECE MVJCE 2014
band fc- B/2 ≤ |f| ≤ fc+ B/2. The FM transmission bandwidth B is in excess of twice the message bandwidth W by an amount that depends on the deviation ratio of the incoming FM wave.
The IF filter in fig 8.11 above represents the combined filtering effect of RF sectionand IF sections of an FM receiver of the superheterodyne type. The filter has a midband frequency fc and bandwidth B, passes the FM signal without any distortion. The bandwidth B is small compared with the mid band frequency fc. The transfer function of the IF filter is shown in fig 8.12 above. The filtered narrow band noise n(t) is represented in terms of its in-phase and quadrature components.
The limiter in fig 8.11 is used to remove any amplitude variations at the IF output. The discriminator is assumed to be ideal and its output proportional to the deviation in the instantaneous frequency of the carrier away from fc. The base band low pass filter is ideal and its bandwidth is equal to message bandwidth.
Noise in FM Reception:
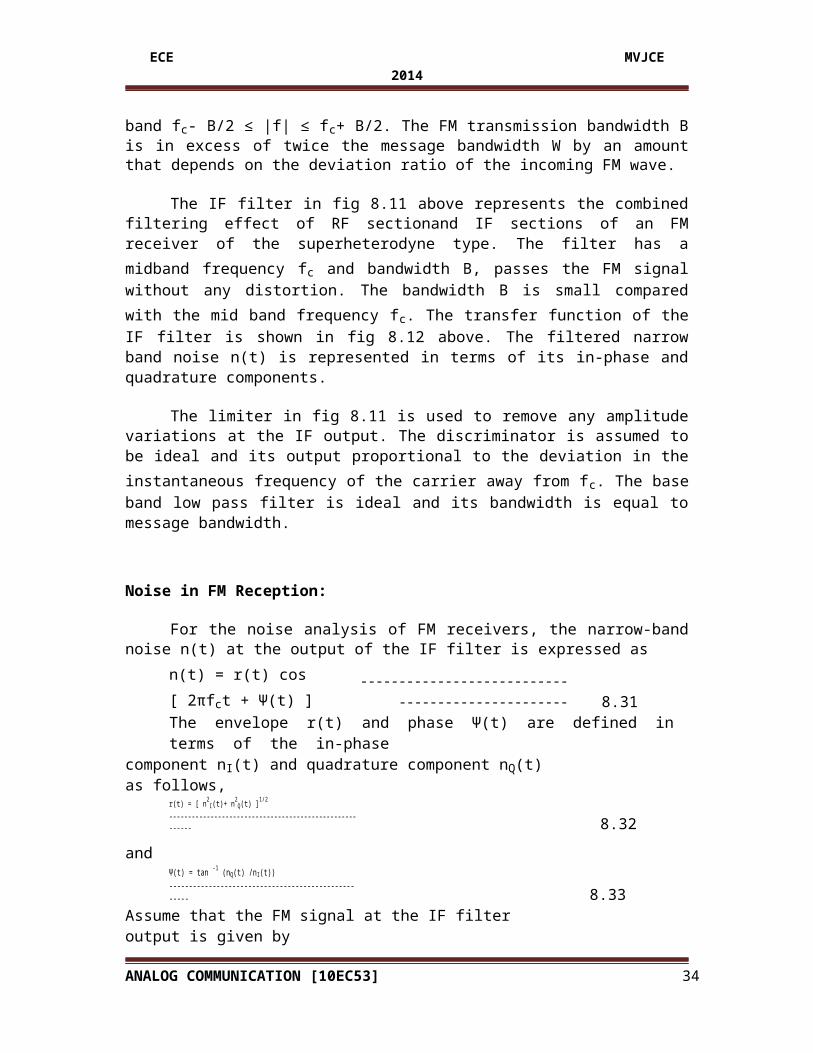
For the noise analysis of FM receivers, the narrow-band noise n(t) at the output of the IF filter is expressed as
n(t) = r(t) cos [ 2πfct + Ψ(t) ] ------------------------------------------------- 8.31
The envelope r(t) and phase Ψ(t) are defined in terms of the in-phasecomponent nI(t) and quadrature component nQ(t) as follows,
r(t) = [ n2I(t)+ n2
Q(t) ]1/2 -------------------------------------------------------- 8.32
and
Ψ(t) = tan -1 (nQ(t) /nI(t)) ---------------------------------------------------- 8.33
Assume that the FM signal at the IF filter output is given by
s(t) = Accos [ 2πfct + 2πkf25
$(3)43 ] ----------------------------- 8.34"
where Ac -- carrier amplitude
fc – carrier frequency
kf–frequency sensitivity
m(t) – message
For convenience, we define
Φ(t) = 2πkf25 $(3)43 --------------------------------------------------- 8.35
ANALOG COMMUNICATION [10EC53] 21
ECE MVJCE 2014
"
ANALOG COMMUNICATION [10EC53] 22
ECE MVJCE 2014
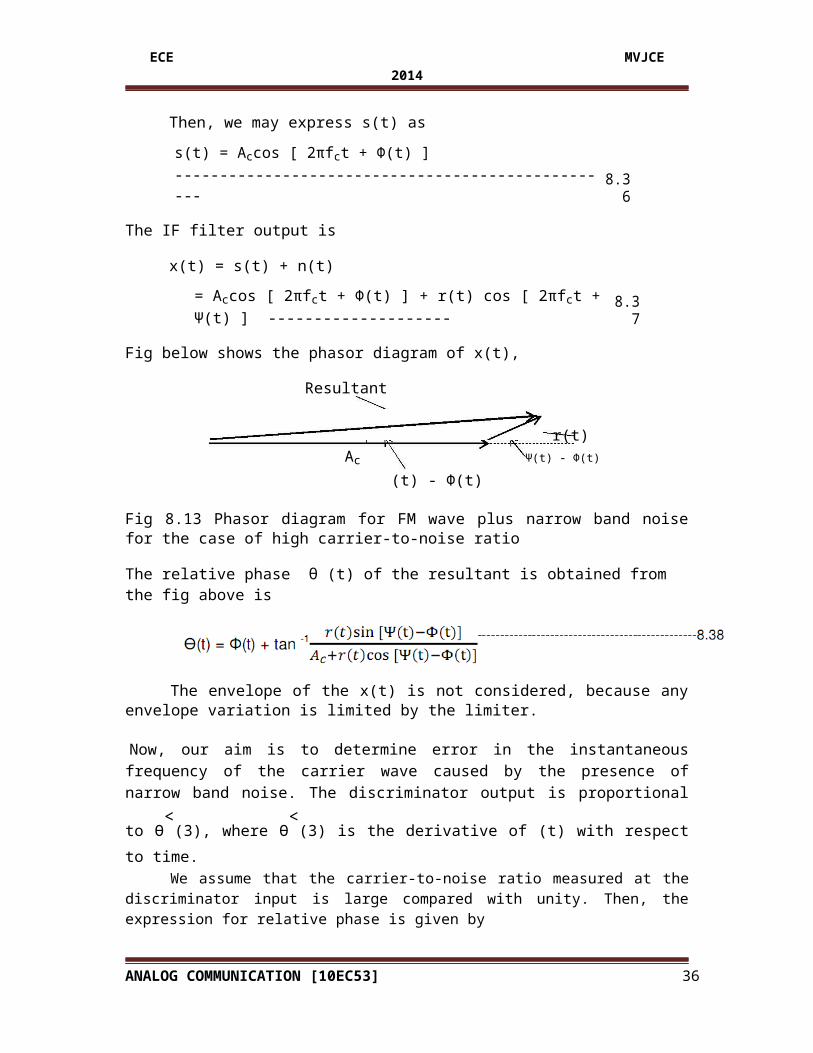
Then, we may express s(t) as
s(t) = Accos [ 2πfct + Φ(t) ] -------------------------------------------------- 8.36
The IF filter output is
x(t) = s(t) + n(t)
= Accos [ 2πfct + Φ(t) ] + r(t) cos [ 2πfct + Ψ(t) ] -------------------- 8.37
Fig below shows the phasor diagram of x(t),
Resultant
r(t)Ac Ψ(t) - Φ(t)
(t) - Φ(t)
Fig 8.13 Phasor diagram for FM wave plus narrow band noise for the case of high carrier-to-noise ratio
The relative phase θ (t) of the resultant is obtained from the fig above is
The envelope of the x(t) is not considered, because any envelope variation is limited by the limiter.
Now, our aim is to determine error in the instantaneous frequency of the carrier wave caused by the presence of narrow band noise. The discriminator output is proportional to
Ɵ<(3), where Ɵ<
(3) is the derivative of (t) with respect to time.We assume that the carrier-to-noise ratio measured at the discriminator input is large
compared with unity. Then, the expression for relative phase is given by
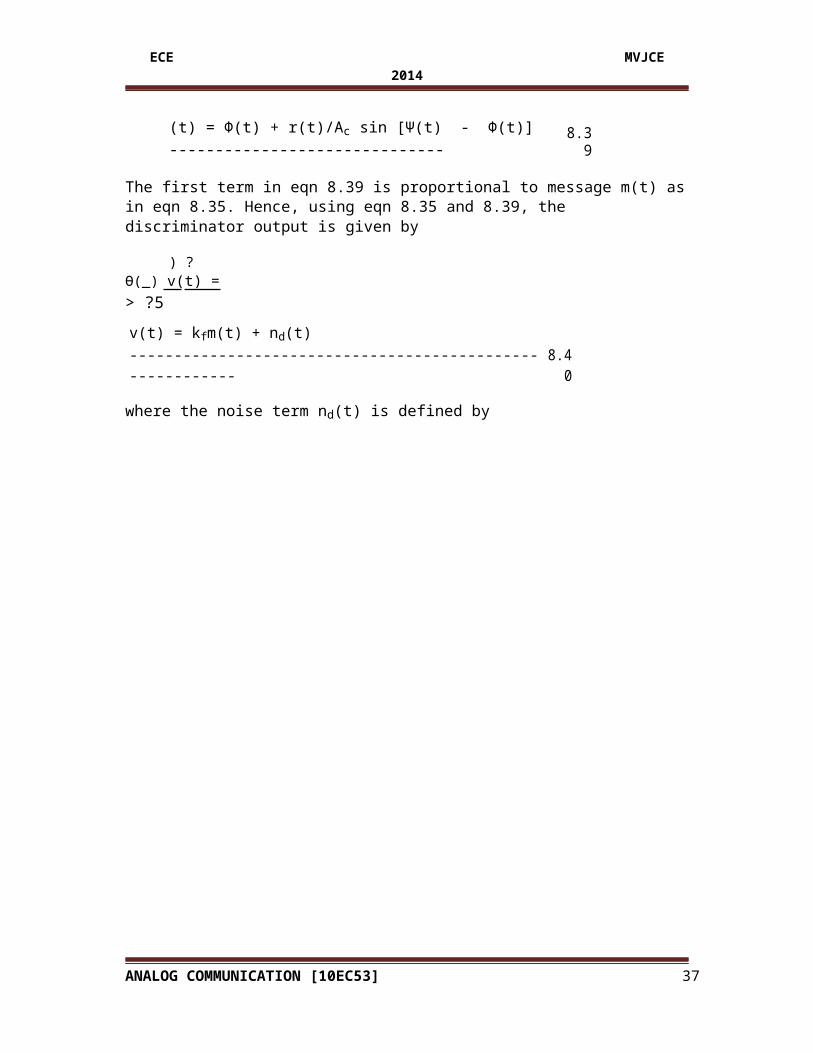
(t) = Φ(t) + r(t)/Ac sin [Ψ(t) - Φ(t)] ------------------------------ 8.39
The first term in eqn 8.39 is proportional to message m(t) as in eqn 8.35. Hence, using eqn 8.35 and 8.39, the discriminator output is given by
) ?Ɵ(_) v(t) = > ?5
v(t) = kfm(t) + nd(t) ---------------------------------------------------------- 8.40
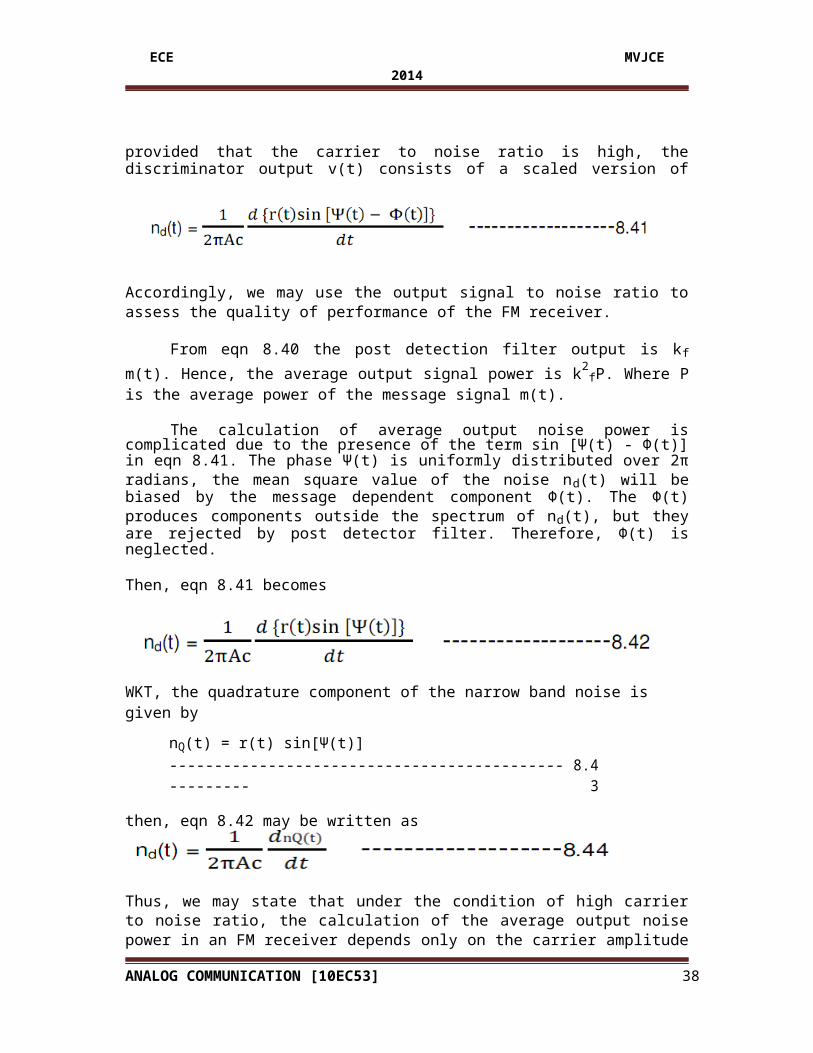
where the noise term nd(t) is defined by
ANALOG COMMUNICATION [10EC53] 23
ECE MVJCE 2014
provided that the carrier to noise ratio is high, the discriminator output v(t) consists of a scaled version of message m(t) and noise component nd(t).
Accordingly, we may use the output signal to noise ratio to assess the quality of performance of the FM receiver.
From eqn 8.40 the post detection filter output is kf m(t). Hence, the average output signal power is k2
fP. Where P is the average power of the message signal m(t).
The calculation of average output noise power is complicated due to the presence of the term sin [Ψ(t) - Φ(t)] in eqn 8.41. The phase Ψ(t) is uniformly distributed over 2π radians, the mean square value of the noise nd(t) will be biased by the message dependent component Φ(t). The Φ(t) produces components outside the spectrum of nd(t), but they are rejected by post detector filter. Therefore, Φ(t) is neglected.
Then, eqn 8.41 becomes
WKT, the quadrature component of the narrow band noise is given by
nQ(t) = r(t) sin[Ψ(t)] ----------------------------------------------------- 8.43
then, eqn 8.42 may be written as
Thus, we may state that under the condition of high carrier to noise ratio, the calculation of the average output noise power in an FM receiver depends only on the carrier amplitude A c
and the quadrature noise component nQ(t).
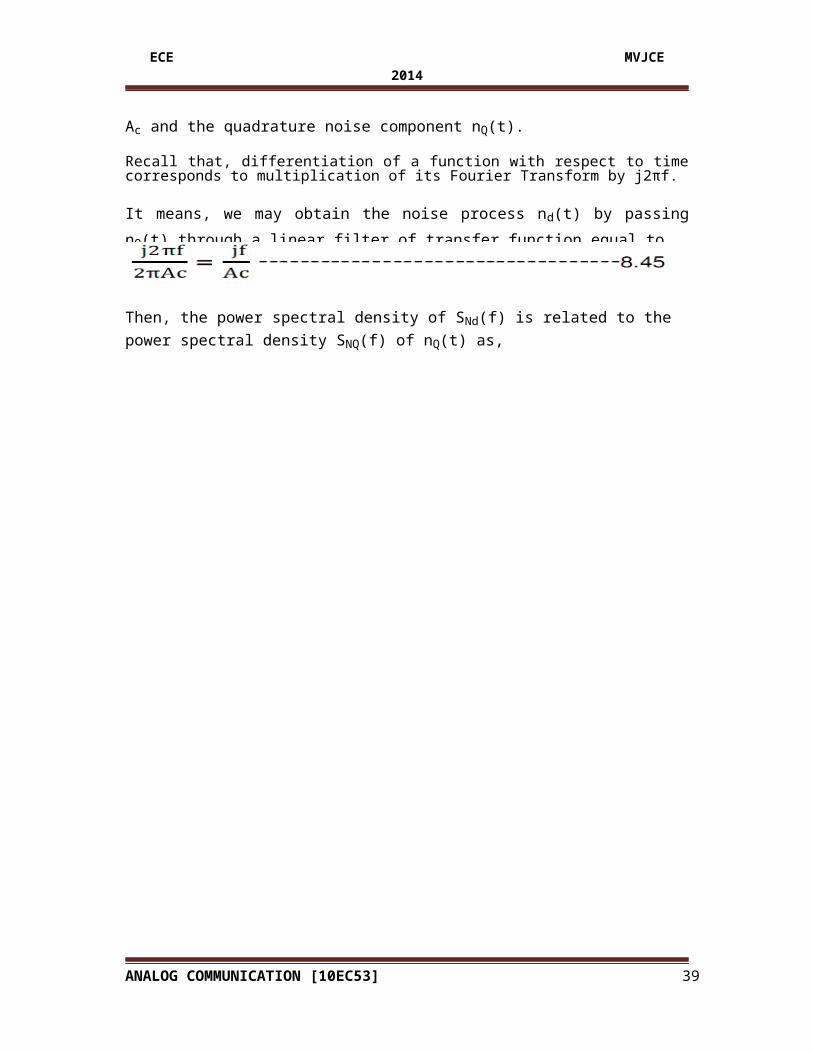
Recall that, differentiation of a function with respect to time corresponds to multiplication of its Fourier Transform by j2πf.
It means, we may obtain the noise process nd(t) by passing nQ(t) through a linear filter of transfer function equal to
Then, the power spectral density of SNd(f) is related to the power spectral density SNQ(f) of nQ(t) as,
ANALOG COMMUNICATION [10EC53] 24
ECE MVJCE 2014
The power spectral density of the quadrature component SNQ(f) is shown in fig 8.14 below:
SNQ(f)
N0
-B/2 0 B/2 f
Fig 8.14 Power spectral density of quadrature component nQ(t) of narrow band noise n(t)
SNd(f)
-B/2 0 B/2 f
Fig 8.15 Power spectral density of quadrature component nd(t) at discriminator output
SNo(f)
-W 0 W f
Fig 8.16 Power spectral density of noise no(t) at receiver output
The corresponding power spectral density of the noise nd(t) is shown in fig 8.15 above ,
ANALOG COMMUNICATION [10EC53] 25
ECE MVJCE 2014
The discriminator output is applied to a low pass filter of bandwidth equal to message bandwidth W.
For wide band FM, W is very small compare to B/2 where B is the transmission bandwidth of the FM signal. It means out of band components of noise nd(t) will be rejected.
Therefore, power spectral density SNo(f) of output noise no(t) appear at the output of low pass filter is defined by
Note that the average output noise power is inversely proportional to the average carrier power A2
c/2.
The output signal to noise ratio is given by
The average power in the modulated signal s(t) is A2c/2, and the average noise power in the
message bandwidth is WN0. Thus the channel signal to noise ratio is
ANALOG COMMUNICATION [10EC53] 26
ECE MVJCE 2014
FOM is
The frequency deviation ∆I_ is proportional to the frequency sensitivity kf of the modulator. Also, the deviation ratio D is equal to
D = ∆F
J
Therefore, from eqn 8.52 the FOM of a wide band FM system is a quadratic function of the deviation ratio.
In wide band FM, the transmission bandwidth is approximately proportional to the deviation ratio D. Accordingly, we may state that when the carrier to noise ratio is high, an increase in the transmission bandwidth B provides a corresponding quadratic increase in the output signal to noise ratio or FOM of the system.
Example: Single Tone Modulation
Consider the case of a sinusoidal wave of frequency fm as the modulating wave, and assume a frequency deviation ∆I. The modulated wave is defined by
∆F
s(t) = Accos [ 2πfct + F/sin 2πfmt ]
where we have made the substitution as
∆F sin 2πfct = 2πkf25 $(3)43
F/ "
Differentiating both sides w.r.t time
∆F
m(t) = +Mcos2πfmt
Hence, the average power of the message signal is
ANALOG COMMUNICATION [10EC53] 27
ECE MVJCE 2014
Note:
∆F
1. The modulation index β = J is determined by the bandwidth W of the post detector filter and is not related to the message bandwidth fm. But the filter is chosen to pass the spectrum of the message.
2. If fm may lie anywhere b/n 0 and W, it will gives same output SNR.
Let us compare the performance of AM and FM systems,
For single tone modulation in AM,
FOM = 1/3 for 100% modulation
For FM FOM is
FOM =3/2 β2
Then FM has improved signal to noise ratio over AM
If 3/2 β2> 1/3Or β> 0.5
Therefore, β = 0.5 roughly defines the transition from narrow band FM to wide band FM.
Capture effect:
In the frequency modulation, the signal can be affected by another frequency modulated signal whose frequency content is close to the carrier frequency of the desired FM wave. The receiver may lock such an interference signal and suppress the desired FM wave when interference signal is stronger than the desired signal. When the strength of the desired signal and interference signal are nearly equal, the receiver fluctuates back and forth between them, i.e., receiver locks interference signal for some times and desired signal for some time and this goes on randomly. This phenomenon is known as the capture effect.
ANALOG COMMUNICATION [10EC53] 28
ECE MVJCE 2014
FM Threshold Effect:
The output signal to noise ratio of FM receiver is valid only if the carrier to noise ratio is measured at the discriminator input is high compared to unity. It is observed that as the input noise is increased so that the carrier to noise ratio decreased, the FM receiver breaks. At first individual clicks are heard in the receiver outputand as the carrier to noise ratio decreases still further, the clicks rapidly merge in to a crackling or sputtering sound.
Near the break point eqn8.50 begins to fail predicting values of output SNR larger than the actual ones. This phenomenonis known as the threshold effect.
The threshold effect is defined as the minimum carrier to noise ratio that gives the output SNR not less than the value predicted by the usual signal to noise formula assuming a small noise power.
For a qualitative discussion of the FM threshold effect,
Consider, when there is no signal present, so that the carrier is unmodulated. Then the composite signal at the frequency discriminator input is
x(t) = [Ac +nI(t)] cos 2πfct – nQ(t) sin 2πfct-------------------------- 8.55
Where nI(t) and nQ(t) are inphase and quadrature component of the narrow band noise n(t) with respect tocarrier wave Accos 2πfct. The phasor diagram of fig8.17 below shows the phase relations b/n the various components of x(t) in eqn(8.55).
P
x(t) r(t) n
(t) Ψ(t)Ac Q nI(t)
Fig 8.17 A phasor diagram interpretation of eqn 8.55
As the amplitudes and phases of nI(t) and nQ(t) change randomly with time the point P wanders around the point Q.
When the carrier to noise ratio is large nI(t) and nQ(t) are small compared to Ac, so that point P always around Q. Thus the angle (t) small and within a multiple of 2π radians.
ANALOG COMMUNICATION [10EC53] 29
ECE MVJCE 2014
The point P occasionally sweeps around the origin and (t) increases or decreases by 2π radians, When the carrier to noise ratio is small. The clicks are produced only when (t) changes by ±2π radians.
From the phasor diagram of fig above, we may deduce the condition required for clicks to occur.
A positive going click occurs when the envelope r(t) and phase Ψ(t) of the narrow band noise n(t) satisfy the following conditions:
r(t) > Ac
Ψ(t) < π < Ψ(t) + dΨ(t)dΨ(t)/dt> 0
These conditions ensure that (t) changes by 2π radians in the time incrementdt, during which the phase of the narrow band noise increases by the incremental amount dΨ(t).
Similarly, the condition for negative going click to occur are
r(t) > Ac
Ψ(t) < - π < Ψ(t) + dΨ(t)dΨ(t)/dt< 0
These conditions ensure that (t) changes by - 2π radians in the time incrementdt As the carrier to noise ratio decreased, the average number of clicks per unit time increases.
Whenthis number becomes large, the threshold is said to occur.Consequently, the output SNR deviates from a linearfunction of the carrier to noise ratio when the latter falls below the threshold.
This effect is shown in fig below, this calculation is based on the following two assumptions:
1. The output signal is taken as the receiver output measured in the absence of noise. The average output signal poweris calculated for a sinusoidal modulation that produces a frequency deviation ∆Iequal to 1/2 of the IF filter bandwidth B, The carrier is thus enabled to swing back and forth across the entire IF band.
2. The average output noise power is calculated when there is no signal present, i.e., the carrier is unmodulated, with no restriction placed on the value of the carrier to noise ratio.
ANALOG COMMUNICATION [10EC53] 30
ECE MVJCE 2014
SNRo (dB) 40
30 SNRo = 3ρ(B/2W)3
20
10 0 10 20
Input carrier to noise ratio 10 log 10 ρ, dB
Fig 8.18 Variation of output SNR with carrier to noise ratio, demonstrating the FM threshold effect
The curve plotted in fig above for the ratio (B/2W) = 5. The linear portion of the curve corresponds to the limiting value 3ρ(B/2W)3. From the fig we may observe that the output SNR deviates appreciably from a linear function of the carrier to noise ratio ρ, when ρ becomes less than a threshold of 10dB.
The threshold carrier to noise ratio ρthdepends on the ratio of IF filter bandwidth to message bandwidth B/W and ρthis influenced by the presence of modulation.
We may state that the loss of message at an FM receiver outputis negligible ifthe carriertonoise ratio satisfies the condition
The IF filter bandwidth B is designed to equal the FM transmission bandwidth. Hence, we may use carson's rule to relate B to the message bandwidth W as follows
B = 2W(1+D)
where D is the deviation ratio, for sinusoidal modulation, the modulation index β is used in place of D. therefore, For no significant loss of message at an FM receiver output as,
ANALOG COMMUNICATION [10EC53] 31
ECE MVJCE 2014
(SNR)c ≥ 20(1+D) ------------------------------------------------------- 8.58
or interms of decibels,
10log10 (SNR)c ≥ 13 + 10 log10(1+D) ------------------------------------- 8.59
FM threshold reduction:
In Specific applications such as space communications, It is required toreduce the noise threshold in an FM receiverso as to satisfactorily operate the receiver with the minimum signal power possible.
This can be achieved by using an FM demodulator with negative feedback(FMFB) or by using a phase locked loopdemodulator.
Base bandProduct LimiterIF Filter Low passFM wave Outputmodulator Discriminator Filter
Signal
VCO
Fig 8.19FMFB demodulator
Fig above is a block diagram of an FMFB demodulator. The conventional local oscillator is replaced by VCO. To understand the operation of this receiver, suppose that VCO is removed from the circuit and the feedback path is leftopen.
Assume that the wide band FM is applied to the receiver input, and a second FM from the same source but with amodulation index a fraction smaller is applied to the VCO terminal of the product modulator. The output of theproduct modulator consists of sum and difference frequency components. The IF filter is designed to pass only difference frequency component. The frequency deviation of the IF filter output would be small, although the frequency deviation of both input FM wave is large, since the difference between their instantaneous deviations is small. Hence, the modulation indices would subtract, and the resulting FM wave at the IF filter output have a smaller modulation index than the input FM waves. This means that the IF filter bandwidth in fig above need only be a fraction of that required for either wideband FM wave. The FM wave with reduced modulation index passed by the IF filter is then frequency - demodulated by the combination of limiter/discriminator and finally
ANALOG COMMUNICATION [10EC53] 32
ECE MVJCE 2014
ANALOG COMMUNICATION [10EC53] 33
ECE MVJCE 2014
processed by the base band filter. It is now apparent thatSecond wide band FM waves replaced by VCO feed by o/p of low pass filter as in fig above.
Now, It will be shown that the SNR of an FMFB receiver is same as that of conventional FM receiver with the same input signal and noise power if the carrier to noise ratio is sufficiently large. Assume for the moment there is no feedback around the demodulator.In the combined presence of an unmodulated carrier Ac cos2πfct and a narrow band noise
n(t) = nI(t)cos2_fct - nQ(t)sin2_fct,
the phase of the compositesignal x(t) at the limiter - discriminator input is approximately equal to nQ(t)/Ac. This assumes that the carrier to noise ratio is high. The envelope of x(t) is of no interest to us, because the limiter removes all variations in the envelope. Thus the composite signal at the frequency discriminator input consists of a small index phase - modulated wave with the modulation derived from the component nQ(t) of noise that is in phase quadrature with the carrier. When feedback is applied, the VCO generates a wave that reduces the phase - modulation index of the wave at the IF filter output, i.e., the quadrature component nQ(t) of noise.
Thus we see that as long as the carrier - to noise ratio is sufficiently large, the FMFB receiver does not respond to the in-phase noise component n I(t), but it would demodulate the quadrature noise like a signal. Signal and quadrature noise are reduced in the same proportion by the applied feedback, with the result that the base band SNR is independentof feedback.For large carrier to noise ratio the baseband SNR of an FMFB receiver is same as that of a conventional receiver.
The FMFB users a very important piece of a priori information that even though the carrier frequency of the incoming FM wave will usually have large frequency deviations, its rate of change will be at the base band rate.
An FMFB demodulator is essentially a tracking filter that can track only the slowly varying the frequency of widebandFM waves. Consequently it responds only to a narrow band of noise centered about the instantaneous carrier frequency. The bandwidth of noise to which the FMFB receiver responds is precisely the band of noise that the VCO tracks. As a result, FMFB receivers allow a threshold extention.
Like the FMFB demodulator, the PLL is also a tracking filter and hence it also provides threshold extension.
ANALOG COMMUNICATION [10EC53] 34
ECE MVJCE 2014
Pre-Emphasis and De-Emphasis in FM:
WKT the power spectral density of the noise at the receiver output has a square law dependence on the operating frequency as shown in fig below.
SNo(f)
-W 0 W f
Fig 8.20PSD of Noise at FM receiver Output
SM(f)
-W 0 W f
Fig 8.21 PSD of typical message source
Fig 8.20 shows the PSD of message source have spectra of this form. We see that the PSD of the message falls off appreciably at higher frequencies. On the other hand PSD of noise increases rapidly with frequency. Thus at ±W, relative spectral density of message is low, where as that of the output noise is very high. It means, the message is not using the allocated bandwidth efficiently. So, to improve the noise performance by slightly reducing the bandwidth of the low pass filter to reject large amount of noise power while losing only a small amount of message power. But this approach is not satisfactory because the distortion of the message.
A more satisfactory approach is the use of pre-emphasis in the transmitter and de-emphasis in the receiver as shown in fig below.
ANALOG COMMUNICATION [10EC53] 35
ECE MVJCE 2014
Pre- De-m(t) FM Σ FM message +emphasis emphasis
transmitter Receiverfilter Hpe(f) filter Hde(f) Noise
w(t)
Fig 8.22Use of Pre-Emphasis and De-Emphasis in an FM system
In this method, we artificially emphasize the high frequency components of the message signal prior modulation in the transmitter before the noise is introduced in the receiver. The low frequency and high frequency portions of the PSD of the message are equalized in such a way that the message fully occupies the frequency band allotted to it. Then, at the discriminator output in the receiver perform the inverse operation by de-emphasizing the high frequency components to restore the message. In this process, the high frequency noise is reduced thereby effectively increasing the output SNR of the system.
To produce an undistorted version of the message at the receiver the filter transfer functions are the inverse of each other.
i.e., Hde(f) = 1/ Hpe(f) -W < f < W --------------------------------------------------- 8.60
The average message power is independent of filter transfer functions.
The pre-emphasis filter is selected so that the average power of the emphasized message m1(t) (o/p of pre-emphasis ) has the same average power as of the message m(t). Then,
2V|S (I)| SM(f) df=2V
WX
(f)_ df ---------------------------------- 8.61
8V TU 8V
It is a constraint on the transfer function Hpe(f) of pre-emphasis filter.i.e., the bandwidth of the transmitted signal remains same, with or without pre-emphasis.
WKT, the PSD of the nd(t) at the discriminator output is
Therefore, the PSD of the noise at the de-emphasis filter output is equal to |Hde(f)2SNd(f).
ANALOG COMMUNICATION [10EC53] 36
The bandwidth of the post detection filter is W and is less than B/2, then, the average power of the modified noise at the receiver output is
Average o/p noise power with de-emphasisBecause the average message power at the receiver output is unaffected by the pre-emphasis and de-emphasis. The improvement in output SNR due to pre-emphasis and de-emphasis is defined by
Note: Improvement factor assumes high carrier to noise ratio at the discriminator input.
Example:
A simple and commonly used pre- emphasis filter that emphasizes high frequencies, whose transfer function is defined by
Hpe(f) = k(1+if/fo) ----------------------------------------------8.65
This is closely realized by an RC – Amplifier network shown in fig below.
ECE MVJCE 2014
R << r and 2πfRC<< 1 inside the frequency band, Amplifier is used to make up attenuation produced by the RC n/w at low frequencies. The frequency parameter
fo = 1/(2πrC).
The de-emphasis filter transfer function in the receiver is defined by
)j_k
Hde(f) =()*j_)__ ---------------------------------------------- 8.66
The constant k is chosen to satisfy the constraint, which requires that the average power of the pre-emphasized message signal be the same as the average power of the original message signal.
Assume that the PSD of the original message m(t) is
ANALOG COMMUNICATION [10EC53] 38
ECE MVJCE 2014
Typical values for FM broadcasting are
Fo = 2.1 kHz, W = 15 kHz
Then eqn 8.69 gives
I = 4.7
Or I = 6.7dB
The output signal to noise ratio of an FM receiver without pre-emphasis and de-emphasis is typically 40 – 50 dB. By using the simple pre-emphasis and de-emphasis filter noise performance will improved.
ANALOG COMMUNICATION [10EC53] 39