Supplementary Figure 1 - images.nature.com › original › nature-assets › nm › journal ›...
17
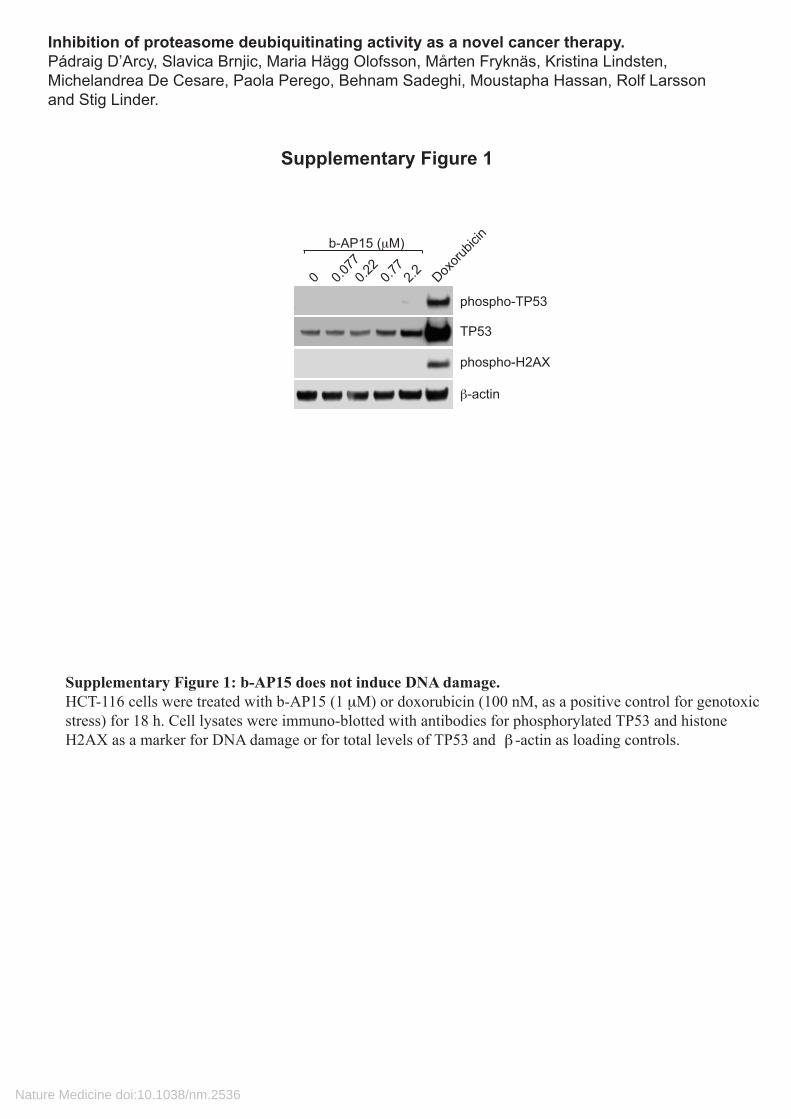
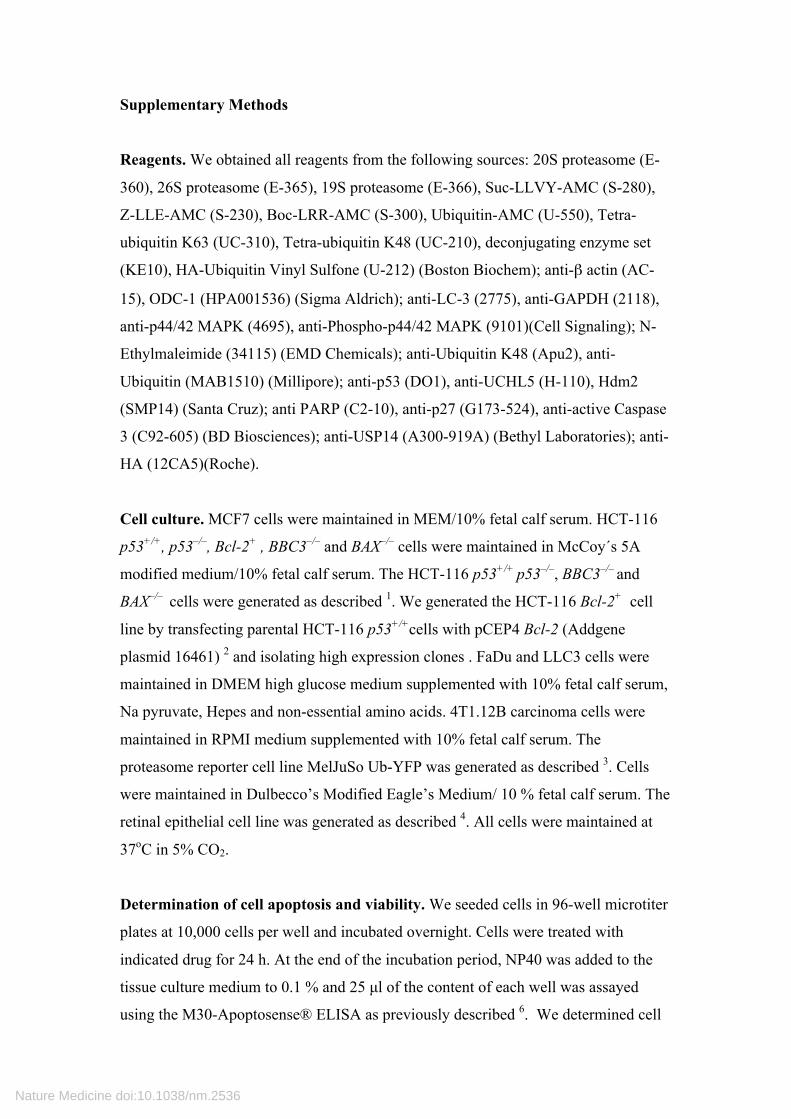
b-AP15 (μM) 0.077 0.22 0.77 2.2 0 Doxorubicin β-actin TP53 phospho-TP53 phospho-H2AX Supplementary Figure 1 Supplementary Figure 1: b-AP15 does not induce DNA damage. HCT-116 cells were treated with b-AP15 (1 μM) or doxorubicin (100 nM, as a positive control for genotoxic stress) for 18 h. Cell lysates were immuno-blotted with antibodies for phosphorylated TP53 and histone H2AX as a marker for DNA damage or for total levels of TP53 and β -actin as loading controls. Inhibition of proteasome deubiquitinating activity as a novel cancer therapy. Pádraig D’Arcy, Slavica Brnjic, Maria Hägg Olofsson, Mårten Fryknäs, Kristina Lindsten, Michelandrea De Cesare, Paola Perego, Behnam Sadeghi, Moustapha Hassan, Rolf Larsson and Stig Linder. Nature Medicine doi:10.1038/nm.2536
Transcript of Supplementary Figure 1 - images.nature.com › original › nature-assets › nm › journal ›...
b-AP15 (μM)
0.077
0.22
0.77
2.20 Doxoru
bicin
β-actin
TP53
phospho-TP53
phospho-H2AX
Supplementary Figure 1
Supplementary Figure 1: b-AP15 does not induce DNA damage.HCT-116 cells were treated with b-AP15 (1 μM) or doxorubicin (100 nM, as a positive control for genotoxic stress) for 18 h. Cell lysates were immuno-blotted with antibodies for phosphorylated TP53 and histone H2AX as a marker for DNA damage or for total levels of TP53 and β -actin as loading controls.
Inhibition of proteasome deubiquitinating activity as a novel cancer therapy.Pádraig D’Arcy, Slavica Brnjic, Maria Hägg Olofsson, Mårten Fryknäs, Kristina Lindsten, Michelandrea De Cesare, Paola Perego, Behnam Sadeghi, Moustapha Hassan, Rolf Larssonand Stig Linder.
Nature Medicine doi:10.1038/nm.2536
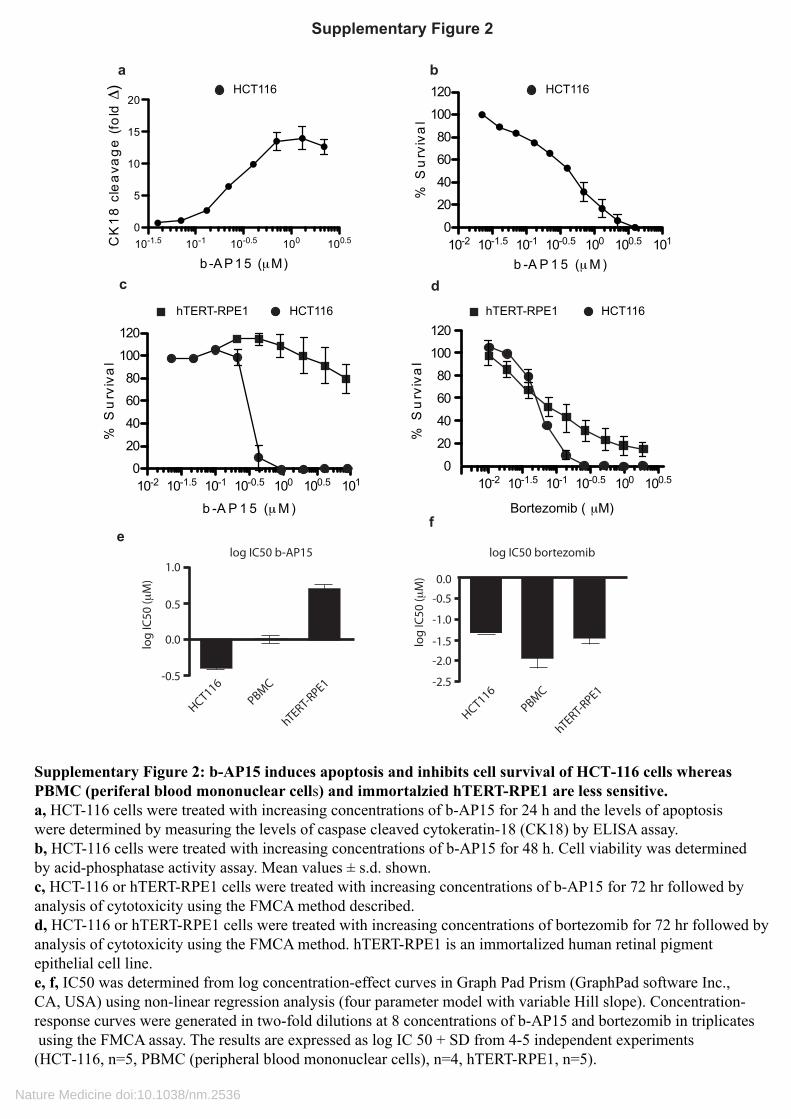
Supplementary Figure 2: b-AP15 induces apoptosis and inhibits cell survival of HCT-116 cells whereasPBMC (periferal blood mononuclear cells) and immortalzied hTERT-RPE1 are less sensitive.a, HCT-116 cells were treated with increasing concentrations of b-AP15 for 24 h and the levels of apoptosiswere determined by measuring the levels of caspase cleaved cytokeratin-18 (CK18) by ELISA assay.b, HCT-116 cells were treated with increasing concentrations of b-AP15 for 48 h. Cell viability was determinedby acid-phosphatase activity assay. Mean values ± s.d. shown.c, HCT-116 or hTERT-RPE1 cells were treated with increasing concentrations of b-AP15 for 72 hr followed byanalysis of cytotoxicity using the FMCA method described.d, HCT-116 or hTERT-RPE1 cells were treated with increasing concentrations of bortezomib for 72 hr followed byanalysis of cytotoxicity using the FMCA method. hTERT-RPE1 is an immortalized human retinal pigmentepithelial cell line.e, f, IC50 was determined from log concentration-effect curves in Graph Pad Prism (GraphPad software Inc., CA, USA) using non-linear regression analysis (four parameter model with variable Hill slope). Concentration-response curves were generated in two-fold dilutions at 8 concentrations of b-AP15 and bortezomib in triplicates using the FMCA assay. The results are expressed as log IC 50 + SD from 4-5 independent experiments (HCT-116, n=5, PBMC (peripheral blood mononuclear cells), n=4, hTERT-RPE1, n=5).
Supplementary Figure 2
10-2 10-1.5 10-1 10-0.5 100 100.5 1010
20
40
60
80
100
120
b -A P 1 5 (μM )
%S
urv
iva
l
10-1.5 10-1 10-0.5 100 100.50
5
10
15
20
b -AP15 (μM)
CK
18
cle
ava
ge
(fold
)
10-2 10-1.5 10-1 10-0.5 100 100.5 1010
20
40
60
80
100
120
b -A P 1 5 (μM )
%S
urv
iva
l
hTERT-RPE1 HCT116 hTERT-RPE1 HCT116
10-2 10-1.5 10-1 10-0.5 100 100.50
20
40
60
80
100
120
%S
urv
iva
l
Bortezomib ( μM)
a b
c d
1.0
-1.00.5
0.0
-0.5
0.0
-0.5
-1.5
-2.0
-2.5
log IC50 b-AP15 log IC50 bortezomib
HCT116PBMC
hTERT-RPE1
log
IC50
(μM
)
log
IC50
(μM
)
HCT116PBMC
hTERT-RPE1
ef
HCT116 HCT116
Nature Medicine doi:10.1038/nm.2536
Supplementary Figure 3
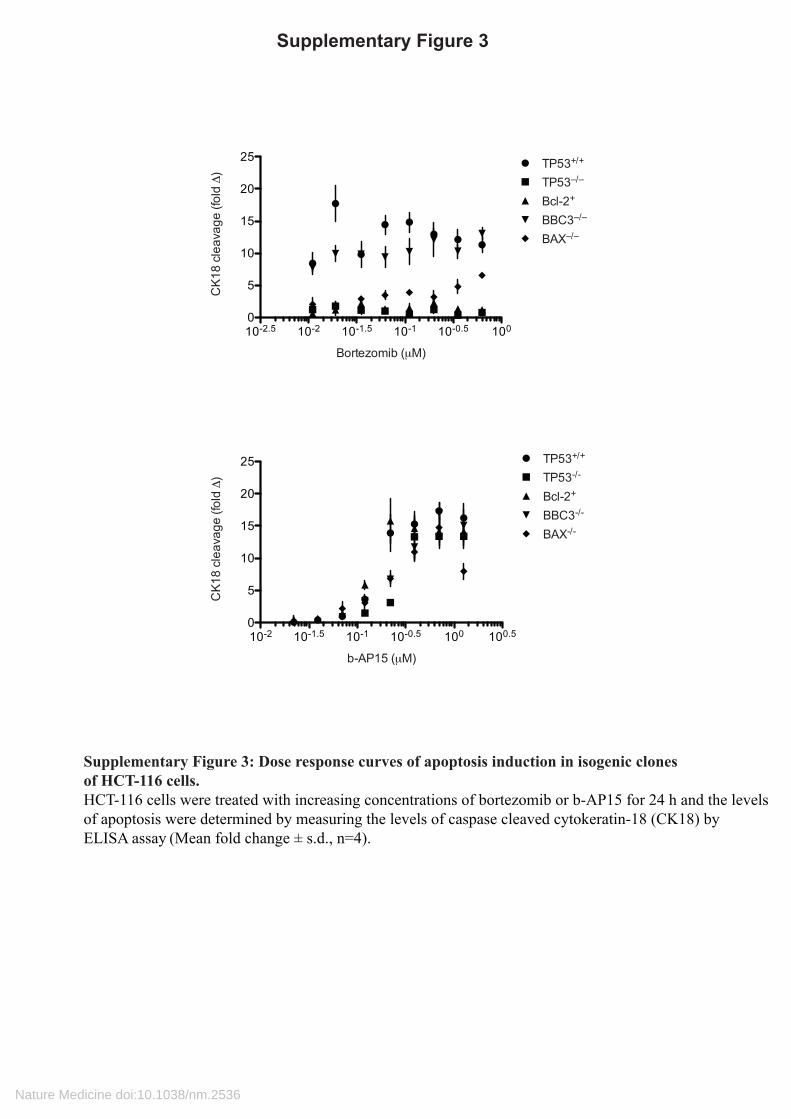
Supplementary Figure 3: Dose response curves of apoptosis induction in isogenic clones of HCT-116 cells.HCT-116 cells were treated with increasing concentrations of bortezomib or b-AP15 for 24 h and the levels of apoptosis were determined by measuring the levels of caspase cleaved cytokeratin-18 (CK18) by ELISA assay (Mean fold change ± s.d., n=4).
10-2.5 10-2 10-1.5 10-1 10-0.5 1000
5
10
15
20
25 TP53+/+
TP53–/–
Bcl-2+
BBC3–/–
BAX–/–
Bortezomib (μM)
CK1
8 cl
eava
ge (f
old
)
10-2 10-1.5 10-1 10-0.5 100 100.50
5
10
15
20
25
BAX-/-BBC3-/-Bcl-2+TP53-/-TP53+/+
b-AP15 (μM)
CK1
8 cl
eava
ge (f
old
)
Nature Medicine doi:10.1038/nm.2536
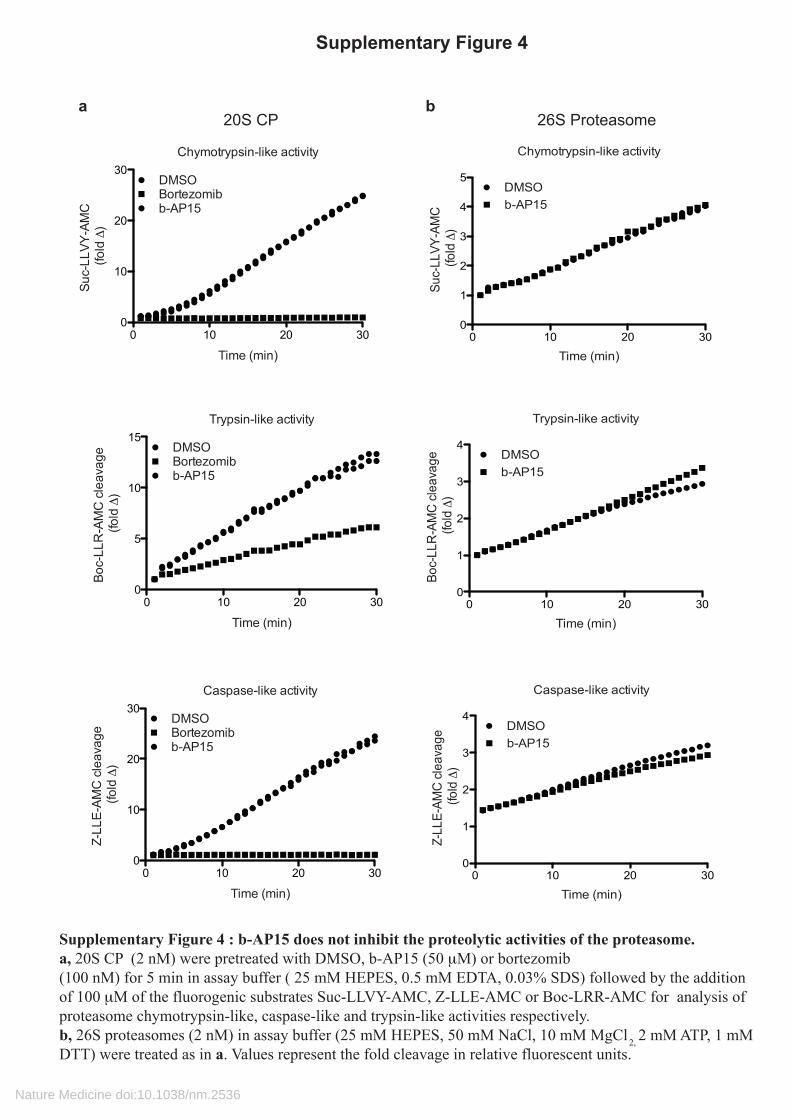
Supplementary Figure 4 : b-AP15 does not inhibit the proteolytic activities of the proteasome.a, 20S CP (2 nM) were pretreated with DMSO, b-AP15 (50 μM) or bortezomib (100 nM) for 5 min in assay buffer ( 25 mM HEPES, 0.5 mM EDTA, 0.03% SDS) followed by the addition of 100 μM of the fluorogenic substrates Suc-LLVY-AMC, Z-LLE-AMC or Boc-LRR-AMC for analysis of proteasome chymotrypsin-like, caspase-like and trypsin-like activities respectively. b, 26S proteasomes (2 nM) in assay buffer (25 mM HEPES, 50 mM NaCl, 10 mM MgCl 2, 2 mM ATP, 1 mM DTT) were treated as in a. Values represent the fold cleavage in relative fluorescent units.
Supplementary Figure 4
Chymotrypsin-like activity
0 10 20 300
1
2
3
4
5DMSOb-AP15
Time (min)
Suc-
LLVY
-AM
C (f
old
)
Trypsin-like activity
0 10 20 300
1
2
3
4DMSOb-AP15
Time (min)
Boc-
LLR
-AM
C c
leav
age
(fol
d )
Caspase-like activity
0 10 20 300
1
2
3
4DMSOb-AP15
Time (min)
Z-LL
E-AM
C c
leav
age
(fol
d )
Chymotrypsin-like activity
0 10 20 300
10
20
30DMSOBortezomibb-AP15
Time (min)
Suc-
LLVY
-AM
C (f
old
)
Trypsin-like activity
0 10 20 300
5
10
15DMSOBortezomibb-AP15
Time (min)
Boc-
LLR
-AM
C c
leav
age
(fol
d )
Caspase-like activity
0 10 20 300
10
20
30DMSOBortezomibb-AP15
Time (min)
Z-LL
E-AM
C c
leav
age
(fol
d )
a b20S CP 26S Proteasome
Nature Medicine doi:10.1038/nm.2536
Supplementary Figure 5
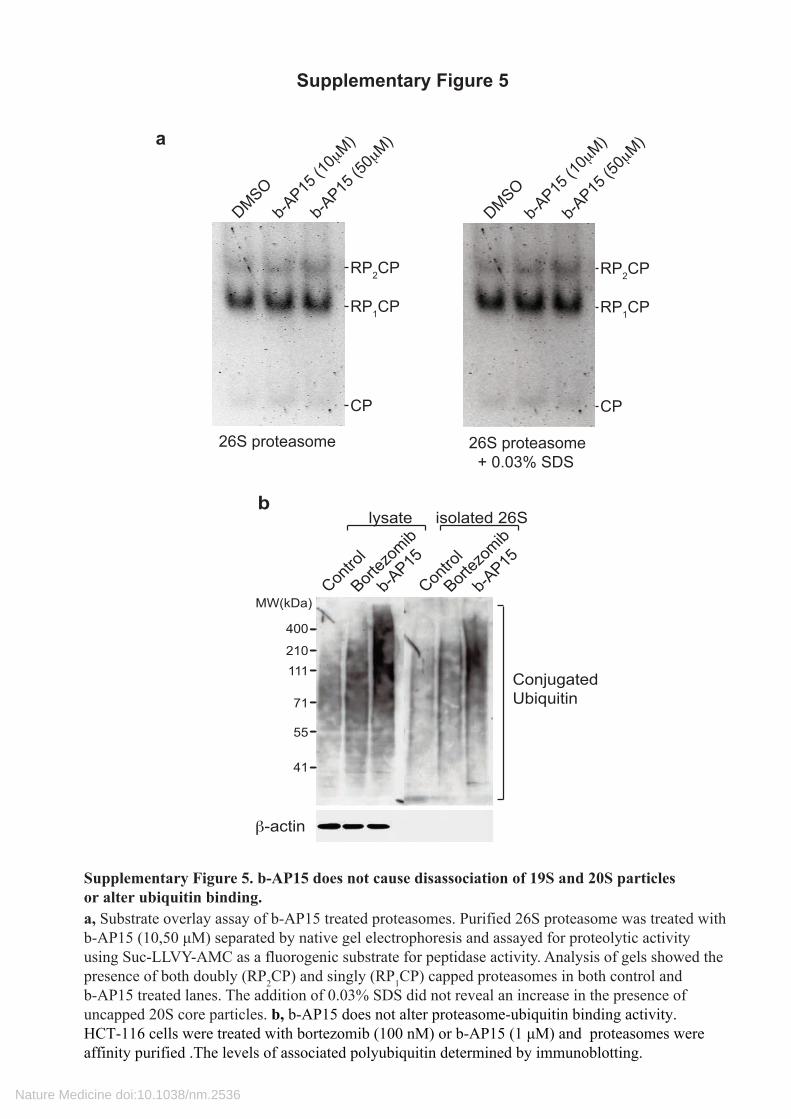
Supplementary Figure 5. b-AP15 does not cause disassociation of 19S and 20S particlesor alter ubiquitin binding. a, Substrate overlay assay of b-AP15 treated proteasomes. Purified 26S proteasome was treated with b-AP15 (10,50 μM) separated by native gel electrophoresis and assayed for proteolytic activity using Suc-LLVY-AMC as a fluorogenic substrate for peptidase activity. Analysis of gels showed the presence of both doubly (RP2CP) and singly (RP1CP) capped proteasomes in both control and b-AP15 treated lanes. The addition of 0.03% SDS did not reveal an increase in the presence of uncapped 20S core particles. b, b-AP15 does not alter proteasome-ubiquitin binding activity.HCT-116 cells were treated with bortezomib (100 nM) or b-AP15 (1 μM) and proteasomes were affinity purified .The levels of associated polyubiquitin determined by immunoblotting.
DMSOb-A
P15 (1
0μM)
b-AP15
(50μ
M)
26S proteasome
RP2CP
RP1CP
CP
RP2CP
RP1CP
26S proteasome + 0.03% SDS
CP
DMSOb-A
P15 (1
0μM)
b-AP15
(50μ
M)
lysate isolated 26S
Contro
l
Bortez
omib
β-actin
b-AP15
Contro
l
Bortez
omib
b-AP15
ConjugatedUbiquitin
b
400
210111
71
55
41
MW(kDa)
a
Nature Medicine doi:10.1038/nm.2536

0 200 400 6000
2000
4000
6000DMSOb-AP15NEM
Ub-A
MC
clea
vage
(RFU
)
Time (sec)
Supplementary Figure 6
Supplementary Figure 6: b-AP15 does not inhibit total DUB activity. a, HCT-116 cells were treated for 3 h with b-AP15 (1 μM). Lysates treated with 10 mM N-ethylmaleimide (NEM) were included as a control for total DUB inhibition. DUB activity was determined from cell lysates by measuring the cleavage of the fluorogenic substrate ubiquitin-7-amido-4-methylcoumarin (Ub-AMC).
Nature Medicine doi:10.1038/nm.2536
10-0.5 100 100.5 101 101.50
25
50
75
100
125
b-AP15 (μM)
0 100 200 300 4000
20000
40000
60000DMSODMSO+GSHb-AP15b-AP15+GSH
Time (sec)
RFU
0 100 200 300 4000
10000
20000
30000
40000
50000
DMSOb-AP15
Time (sec)
RFU
Supplementary Figure 7
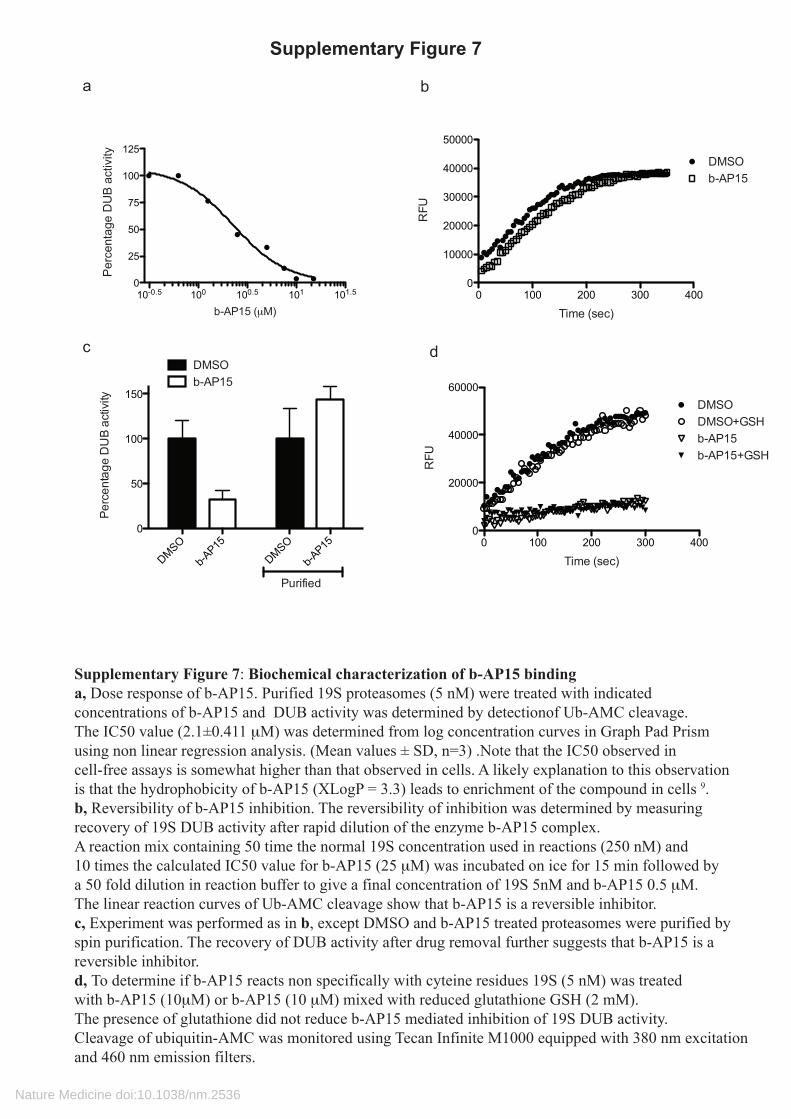
Supplementary Figure 7: Biochemical characterization of b-AP15 bindinga, Dose response of b-AP15. Purified 19S proteasomes (5 nM) were treated with indicatedconcentrations of b-AP15 and DUB activity was determined by detectionof Ub-AMC cleavage. The IC50 value (2.1±0.411 μM) was determined from log concentration curves in Graph Pad Prism using non linear regression analysis. (Mean values ± SD, n=3) .Note that the IC50 observed in cell-free assays is somewhat higher than that observed in cells. A likely explanation to this observation is that the hydrophobicity of b-AP15 (XLogP = 3.3) leads to enrichment of the compound in cells 9. b, Reversibility of b-AP15 inhibition. The reversibility of inhibition was determined by measuring recovery of 19S DUB activity after rapid dilution of the enzyme b-AP15 complex. A reaction mix containing 50 time the normal 19S concentration used in reactions (250 nM) and 10 times the calculated IC50 value for b-AP15 (25 μM) was incubated on ice for 15 min followed bya 50 fold dilution in reaction buffer to give a final concentration of 19S 5nM and b-AP15 0.5 μM.The linear reaction curves of Ub-AMC cleavage show that b-AP15 is a reversible inhibitor.c, Experiment was performed as in b, except DMSO and b-AP15 treated proteasomes were purified byspin purification. The recovery of DUB activity after drug removal further suggests that b-AP15 is a reversible inhibitor. d, To determine if b-AP15 reacts non specifically with cyteine residues 19S (5 nM) was treated with b-AP15 (10μM) or b-AP15 (10 μM) mixed with reduced glutathione GSH (2 mM). The presence of glutathione did not reduce b-AP15 mediated inhibition of 19S DUB activity. Cleavage of ubiquitin-AMC was monitored using Tecan Infinite M1000 equipped with 380 nm excitation and 460 nm emission filters.
a b
DMSO
b-AP15
DMSO
b-AP15
0
50
100
150
DMSOb-AP15
Perc
enta
ge D
UB
activ
ity
Purified
dc
Per
cent
age
DU
B a
ctiv
ity
Nature Medicine doi:10.1038/nm.2536
Supplementary Figure 8
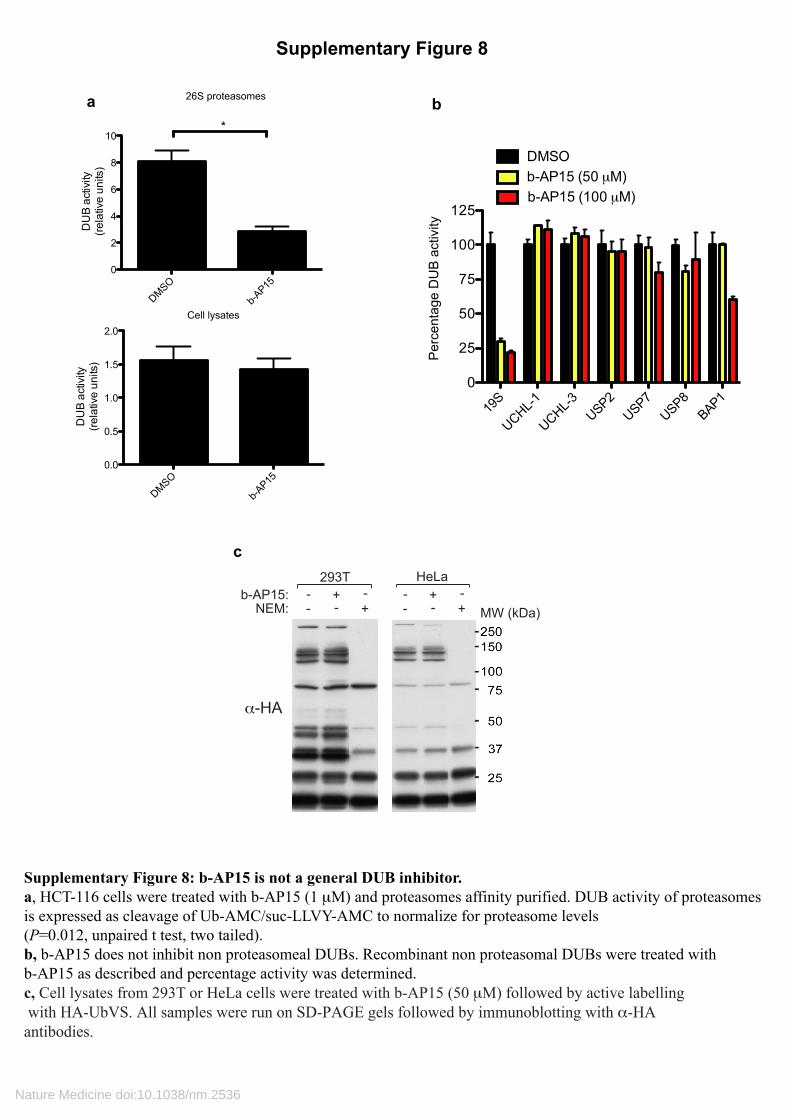
Supplementary Figure 8: b-AP15 is not a general DUB inhibitor. a, HCT-116 cells were treated with b-AP15 (1 μM) and proteasomes affinity purified. DUB activity of proteasomesis expressed as cleavage of Ub-AMC/suc-LLVY-AMC to normalize for proteasome levels (P=0.012, unpaired t test, two tailed). b, b-AP15 does not inhibit non proteasomeal DUBs. Recombinant non proteasomal DUBs were treated with b-AP15 as described and percentage activity was determined.c, Cell lysates from 293T or HeLa cells were treated with b-AP15 (50 μM) followed by active labelling with HA-UbVS. All samples were run on SD-PAGE gels followed by immunoblotting with α-HA antibodies.
26S proteasomes
DMSO
b-AP15
0.0
0.5
1.0
1.5
2.0
DU
B ac
tivity
(re
lativ
e un
its)
DMSO
b-AP15
0
2
4
6
8
10*
DU
B ac
tivity
(re
lativ
e un
its)
a
Cell lysates
19S
UCHL-1
UCHL-3USP2
USP7USP8
BAP10
25
50
75
100
125
DMSOb-AP15 (50 μM)b-AP15 (100 μM)
Per
cent
age
DU
B a
ctiv
ity
NEM:b-AP15:
- --
+-+
α-HA
- --
+-+
HeLa
MW (kDa)
293T
c
b
Nature Medicine doi:10.1038/nm.2536
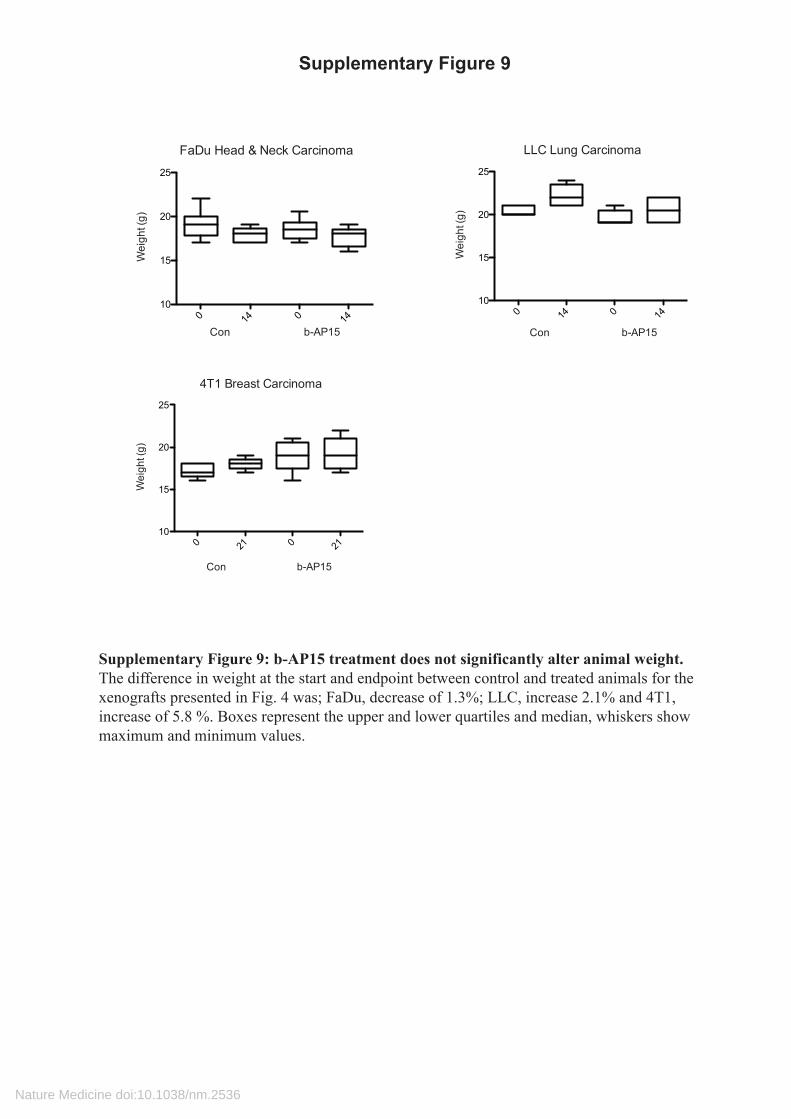
Supplementary Figure 9: b-AP15 treatment does not significantly alter animal weight.The difference in weight at the start and endpoint between control and treated animals for thexenografts presented in Fig. 4 was; FaDu, decrease of 1.3%; LLC, increase 2.1% and 4T1, increase of 5.8 %. Boxes represent the upper and lower quartiles and median, whiskers show maximum and minimum values.
Supplementary Figure 9
FaDu Head & Neck Carcinoma
0 14 0 1410
15
20
25
Wei
ght (
g)
Con b-AP15
4T1 Breast Carcinoma
0 21 0 2110
15
20
25
Wei
ght (
g)
Con b-AP15
LLC Lung Carcinoma
0 14 0 1410
15
20
25
Wei
ght (
g)
Con b-AP15
Nature Medicine doi:10.1038/nm.2536
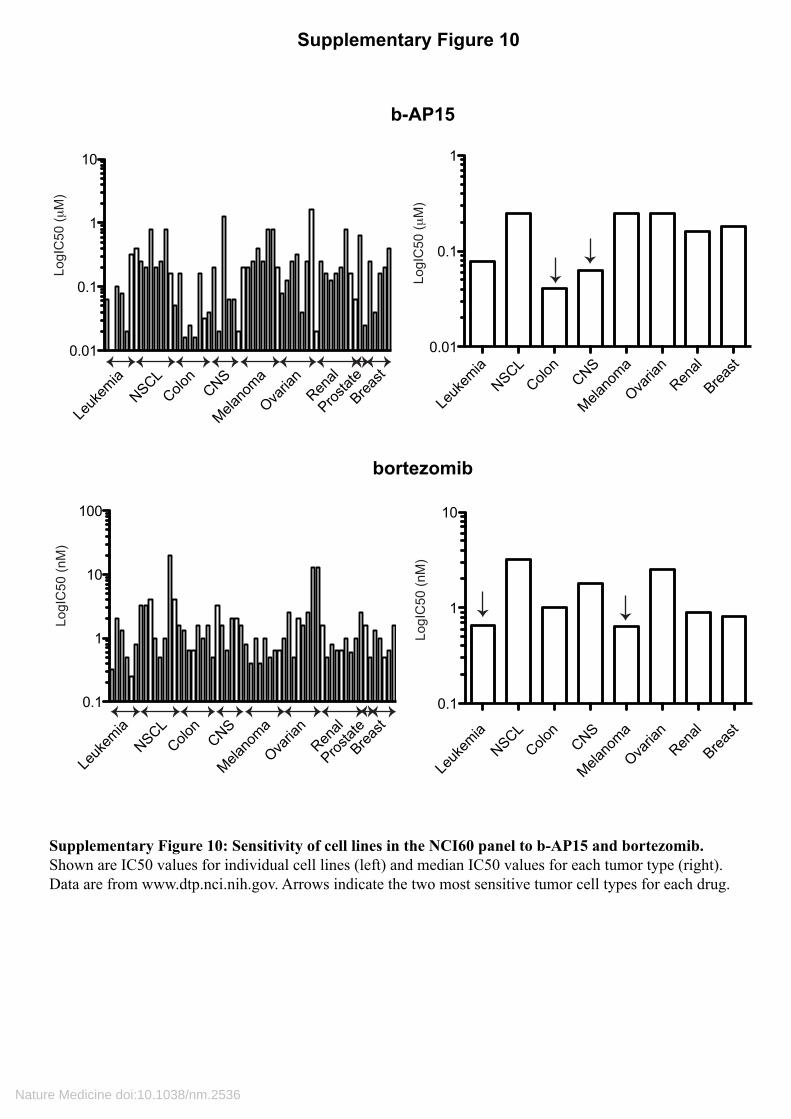
Supplementary Figure 10: Sensitivity of cell lines in the NCI60 panel to b-AP15 and bortezomib.Shown are IC50 values for individual cell lines (left) and median IC50 values for each tumor type (right).Data are from www.dtp.nci.nih.gov. Arrows indicate the two most sensitive tumor cell types for each drug.
Supplementary Figure 10
0.1
1
10
Leuk
emia
NSCLColo
nCNS
Melano
ma
Ovaria
nRen
al
Breast
0.01
0.1
1
Leuk
emia
NSCLColo
nCNS
Melano
ma
Ovaria
nRen
al
Breast
LogI
C50
(μM
)Lo
gIC
50 (n
M)
LogI
C50
(μM
)Lo
gIC
50 (n
M)
Leuk
emia
NSCLColo
nCNS
Melano
ma
Ovaria
nRen
al
Breast
0.1
1
10
100
0.01
0.1
1
10
Prostat
e
Leuk
emia
NSCLColo
nCNS
Melano
ma
Ovaria
nRen
al
Breast
Prostat
e
b-AP15
bortezomib
Nature Medicine doi:10.1038/nm.2536

Supplementary Table 1. Induction of chaperone expression after b-AP15 treatment
Expression
values Probe Set ID Gene Title
Gene Symbol b-AP15 Vehicle
Fold change
117_at heat shock 70kDa protein 6 (HSP70B') HSPA6 24149 33 725 225061_at DnaJ (Hsp40) homolog, A4 DNAJA4 21103 711 30 203810_at DnaJ (Hsp40) homolog, B4 DNAJB4 1955 123 16 205543_at heat shock 70kDa protein 4-like HSPA4L 5452 406 13 200666_s_at DnaJ (Hsp40) homolog, B1 DNAJB1 33900 5251 6 241716_at heat shock 60kDa protein 1 HSPD1 487 77 6 203811_s_at DnaJ (Hsp40) homolog, B4 DNAJB4 960 178 5 202581_at heat shock 70kDa protein 1B HSPA1B 31068 6382 5 206976_s_at heat shock 105kDa/110kDa protein 1 HSPH1 40974 8427 5 211016_x_at heat shock 70kDa protein 4 HSPA4 1803 422 4 202843_at DnaJ (Hsp40) homolog, B9 DNAJB9 1879 449 4 200880_at DnaJ (Hsp40) homolog, A1 DNAJA1 19970 4872 4 200800_s_at heat shock 70kDa protein 1A HSPA1A 57478 14352 4
Nature Medicine doi:10.1038/nm.2536
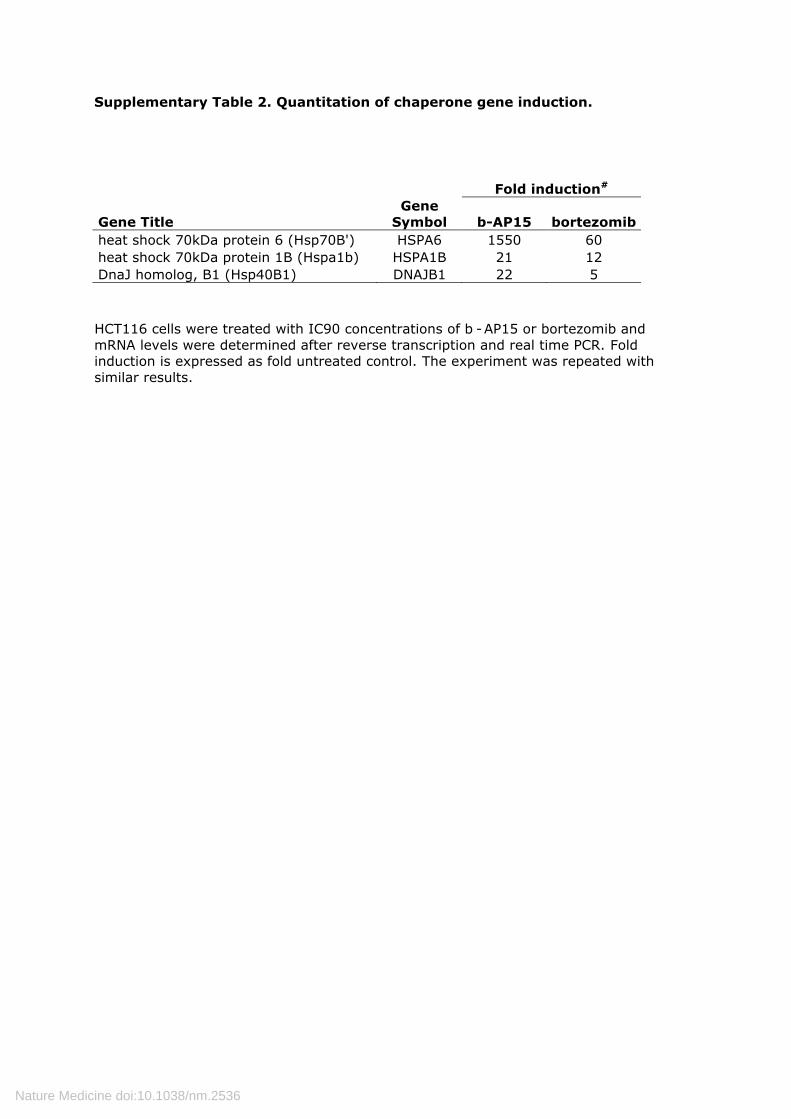
Supplementary Table 2. Quantitation of chaperone gene induction.
Fold induction#
Gene Title Gene
Symbol b-AP15 bortezomib heat shock 70kDa protein 6 (Hsp70B') HSPA6 1550 60 heat shock 70kDa protein 1B (Hspa1b) HSPA1B 21 12 DnaJ homolog, B1 (Hsp40B1) DNAJB1 22 5
HCT116 cells were treated with IC90 concentrations of b -AP15 or bortezomib and mRNA levels were determined after reverse transcription and real time PCR. Fold induction is expressed as fold untreated control. The experiment was repeated with similar results.
Nature Medicine doi:10.1038/nm.2536
Supplementary Methods
Reagents. We obtained all reagents from the following sources: 20S proteasome (E-
360), 26S proteasome (E-365), 19S proteasome (E-366), Suc-LLVY-AMC (S-280),
Z-LLE-AMC (S-230), Boc-LRR-AMC (S-300), Ubiquitin-AMC (U-550), Tetra-
ubiquitin K63 (UC-310), Tetra-ubiquitin K48 (UC-210), deconjugating enzyme set
(KE10), HA-Ubiquitin Vinyl Sulfone (U-212) (Boston Biochem); anti-β actin (AC-
15), ODC-1 (HPA001536) (Sigma Aldrich); anti-LC-3 (2775), anti-GAPDH (2118),
anti-p44/42 MAPK (4695), anti-Phospho-p44/42 MAPK (9101)(Cell Signaling); N-
Ethylmaleimide (34115) (EMD Chemicals); anti-Ubiquitin K48 (Apu2), anti-
Ubiquitin (MAB1510) (Millipore); anti-p53 (DO1), anti-UCHL5 (H-110), Hdm2
(SMP14) (Santa Cruz); anti PARP (C2-10), anti-p27 (G173-524), anti-active Caspase
3 (C92-605) (BD Biosciences); anti-USP14 (A300-919A) (Bethyl Laboratories); anti-
HA (12CA5)(Roche).
Cell culture. MCF7 cells were maintained in MEM/10% fetal calf serum. HCT-116
p53+/+, p53–/–, Bcl-2+ , BBC3–/– and BAX–/– cells were maintained in McCoy´s 5A
modified medium/10% fetal calf serum. The HCT-116 p53+/+ p53–/–, BBC3–/– and
BAX–/– cells were generated as described 1. We generated the HCT-116 Bcl-2+ cell
line by transfecting parental HCT-116 p53+/+cells with pCEP4 Bcl-2 (Addgene
plasmid 16461) 2 and isolating high expression clones . FaDu and LLC3 cells were
maintained in DMEM high glucose medium supplemented with 10% fetal calf serum,
Na pyruvate, Hepes and non-essential amino acids. 4T1.12B carcinoma cells were
maintained in RPMI medium supplemented with 10% fetal calf serum. The
proteasome reporter cell line MelJuSo Ub-YFP was generated as described 3. Cells
were maintained in Dulbecco’s Modified Eagle’s Medium/ 10 % fetal calf serum. The
retinal epithelial cell line was generated as described 4. All cells were maintained at
37oC in 5% CO2.
Determination of cell apoptosis and viability. We seeded cells in 96-well microtiter
plates at 10,000 cells per well and incubated overnight. Cells were treated with
indicated drug for 24 h. At the end of the incubation period, NP40 was added to the
tissue culture medium to 0.1 % and 25 µl of the content of each well was assayed
using the M30-Apoptosense® ELISA as previously described 6. We determined cell
Nature Medicine doi:10.1038/nm.2536
viability by measuring acid phosphatase activity or by FMCA 7. For the acid
phosphatase activity cells were seeded at 5,000 cells per well in 96-well culture plates
and incubated for 12 h at 37oC. Compounds were added to the cells in growth media
and incubated for 72 h at 37oC. Cells were washed with 200 µl warm PBS. 100 µl of
para-nitrophenyl phosphate (pNPP, 2mg/ml) in Na acetate buffer pH 5 (NaAc 0.1 M,
0.1% Triton-X-100) was added per well. Cells were incubated for 2 h after which
reaction was stopped by addition of 1N NaOH. Absorbance was measured at 405 nm.
For the FMCA assay cells were seeded in the drug-prepared 384-well plates using the
pipetting robot Precision 2000 (Bio-Tek Instruments Inc., Winooski, VT). The plates
were incubated for 72 h and then transferred to an integrated HTS SAIGAN Core
System consisting of an ORCA robot (Beckman Coulter) with CO2 incubator
(Cytomat 2C, Kendro, Sollentuna, Sweden), dispenser module (Multidrop 384,
Titertek, Huntsville, AL), washer module (ELx 405, Bio-Tek Instruments Inc),
delidding station, plate holder, barcode reader (Beckman Coulter), liquid handler
(Biomek 2000, Beckman Coulter) and a multipurpose reader (FLUOstar Optima,
BMG Labtech GmbH, Offenburg, Germany) for automated FMCA. Survival index
(SI) is defined as the fluorescence of test wells in percentage of controls with blank
values subtracted.
Substrate overlay assays. We performed native gel electrophoresis essentially as
described 5. In brief 4 µg of purified 26S proteasome (Boston Biochem) was mixed
with 10 or 50 µM b-AP15 and incubated at 37oC for 10 min. We resolved samples on
4% non-denaturing PAGE and submerged gels in assay buffer (20 mM Tris-HCL, 5
mM MgCl2, 1 mM ATP, 0.1 mM Suc-LLVY-AMC) and visualized proteasomes
under UV illumination.
Ubiquitin-cleavage assay. The recombinant Ub-GFP plasmid pet19b Ub-M-GFP was
generated as described 23. We purified recombinant Ub-GFP from BL21 e.coli cells
by His affinity purification. For cleavage assays we incubated 19S RP (25 nM) with
10 mM NEM, 250 µM TPEN or 50 µM b-AP15 for 10 min followed by the addition
of recombinant Ub-GFP (200 nM). We performed ubiquitin chain disassembly
reactions as above except K48- or K63-linked ubiquitin tetramers (50 ng) were
substituted for Ub-GFP. We generated the ubiquitinated HDM2 substrate according to
Nature Medicine doi:10.1038/nm.2536
the Boston Biochem protocol (K-200). For the cleavage assay we incubated 19S RP
(25 nM) with 50 µM b-AP15 or DMSO for 10 min followed by the addition of
ubiquitinated HDM2 (100 nM).
Proteasome isolation: We treated HCT-116 cells with bortezomib (100 nM) or b-
AP15 (1 µM) for 3 hours. We lysed in 50 mM HEPES pH 7.4, 250 mM sucrose, 10
mM MgCl2, 2 mM ATP, 1 mM DTT and 0.025 % digitonin. Samples were sonicated
briefly followed by incubation on ice and proteasomes were isolated according to
manufacturers protocol.
UbVS labeling. We lysed cell pellets from control or treated cells with buffer (50
mM HEPES pH 7.4, 250 mM sucrose, 10 mM MgCl2, 2 mM ATP, 1 mM DTT) on ice
for 15 min and removed debris by centrifugation. We labeled 25 µg of protein with 1
µM HA-UbVS for 30 min at 37oC. We resolved samples by SDS-PAGE and
performed immunoblotting.
Cell-cycle analysis. For determination of cell cycle HCT-116 cells were treated with
b-AP15 or DMSO Cells were harvested by trypsinisation, washed and fixed in 70%
ice cold EtOH for 12 h. Cells were re-suspended in staining solution containing
propidium iodide (50 µg/ml) and RNAse A (0.5 µg/ml) in PBS. Samples were run on
BD FACScalibur. The percentage of cells in each phase of the cell cycle was
determined using ModFit software.
Determination of pulmonary metastases. Since the 4T1 cells are resistant to 6-
thioguanine, metastases can be determined by culturing homogonized tissue in the
presence of 6-thioguanine. For determination of metatastic 4T1 cells the protocol was
as described 8. In brief lungs from treated or untreated animals were homogenized and
treated with collagenase and elastase. Cells were grown in the presence of 60 µM 6-
thioguanine for 2 weeks and the number of metastatic colonies determined by giemsa
staining.
Determination of caspase-cleaved CK18 in mouse plasma. For measurement of the
apoptosis-related CK18-Asp396 fragment, 12.5 ml of plasma was collected 24 h after
Nature Medicine doi:10.1038/nm.2536
last treatment and analyzed using the M30 M30-Apoptosense® assay. Each sample
was mixed with 0.4 ml of heterophilic blocking reagent (Scantibodies laboratory Inc).
Immunostaining. Tumor sections were de-paraffinised with xylene, rehydrated and
then incubated over-night with K-48 ubiquitin or active-caspase 3 (1/500) diluted in
1% (wt/vol) bovine serum albumin and visualized by standard avidin–biotin–
peroxidase complex technique (Vector Laboratories). Counterstaining was performed
with Mayer's haematoxylin.
Statistical analyses. For comparisons of treatment groups, we performed the
unpaired t test (Mann-Whitney), repeated measures ANOVA and Kaplan-Meier
survival (Mantel-Cox test). All statistical analyses were performed using GraphPad
Prism Software (version 5.0). Statistical significance was achieved when P was less
than 0.05.
Nature Medicine doi:10.1038/nm.2536
1. Bunz, F., et al. Requirement for p53 and p21 to sustain G2 arrest after DNA damage. Science 282, 1497-1501 (1998).
2. Pietenpol, J.A., et al. Paradoxical inhibition of solid tumor cell growth by bcl2. Cancer Res 54, 3714-3717 (1994).
3. Menendez-Benito, V., Verhoef, L.G., Masucci, M.G. & Dantuma, N.P. Endoplasmic reticulum stress compromises the ubiquitin-proteasome system. Hum Mol Genet 14, 2787-2799 (2005).
4. Bodnar, A.G., et al. Extension of life-span by introduction of telomerase into normal human cells. Science 279, 349-352 (1998).
5. Elsasser, S., Schmidt, M. & Finley, D. Characterization of the proteasome using native gel electrophoresis. Methods Enzymol 398, 353-363 (2005).
6. Hagg, M., et al. A novel high-through-put assay for screening of pro-apoptotic drugs. Invest New Drugs 20, 253-259 (2002).
7. Lindhagen, E., Nygren, P. & Larsson, R. The fluorometric microculture cytotoxicity assay. Nat Protoc 3, 1364-1369 (2008).
8. Pulaski, B.A. & Ostrand-Rosenberg, S. Mouse 4T1 breast tumor model. Curr Protoc Immunol Chapter 20, Unit 20 22 (2001).
9. Sawada, G. A. et al. Increased lipophilicity and subsequent cell partitioning decrease passive transcellular diffusion of novel, highly lipophilic antioxidants. J Pharmacol Exp Ther 288, 1317-1326 (1999).
Nature Medicine doi:10.1038/nm.2536