plementary Figure 1 (a) (b) - images.nature.com · Sr2+ conto wn for com ifference m contoured Same...
11
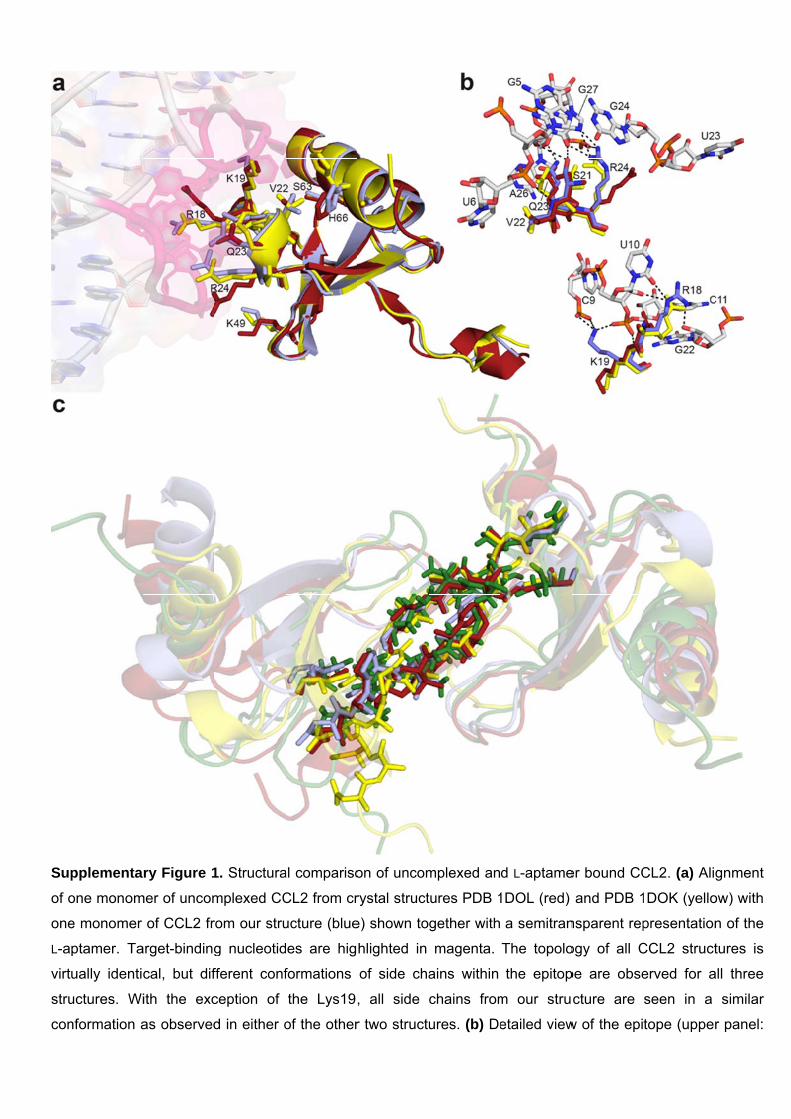
Sup of o one L-a virtu stru con pplementa one monom e monomer ptamer. Ta ually identi uctures. Wi nformation a ry Figure 1 mer of uncom of CCL2 fr arget-binding cal, but dif ith the exc as observed 1. Structura mplexed CC rom our stru g nucleotid fferent conf ception of d in either o al compariso CL2 from cr ucture (blue es are hig formations the Lys19, of the other on of uncom rystal struct e) shown to hlighted in of side cha , all side r two structu mplexed an tures PDB 1 gether with magenta. ains within chains from ures. (b) De d L-aptame 1DOL (red) a semitran The topolo the epitop m our stru etailed view er bound CC and PDB 1 nsparent rep ogy of all C pe are obse cture are w of the epi CL2. (a) Ali 1DOK (yello presentation CCL2 struct erved for a seen in a tope (uppe gnment ow) with n of the tures is all three similar r panel:
Transcript of plementary Figure 1 (a) (b) - images.nature.com · Sr2+ conto wn for com ifference m contoured Same...
Sup
of o
one
L-a
virtu
stru
con
pplementa
one monom
e monomer
ptamer. Ta
ually identi
uctures. Wi
nformation a
ry Figure 1
mer of uncom
of CCL2 fr
arget-binding
cal, but dif
ith the exc
as observed
1. Structura
mplexed CC
rom our stru
g nucleotid
fferent conf
ception of
d in either o
al compariso
CL2 from cr
ucture (blue
es are hig
formations
the Lys19,
of the other
on of uncom
rystal struct
e) shown to
hlighted in
of side cha
, all side
r two structu
mplexed an
tures PDB 1
gether with
magenta.
ains within
chains from
ures. (b) De
d L-aptame
1DOL (red)
a semitran
The topolo
the epitop
m our stru
etailed view
er bound CC
and PDB 1
nsparent rep
ogy of all C
pe are obse
cture are
w of the epi
CL2. (a) Ali
1DOK (yello
presentation
CCL2 struct
erved for a
seen in a
tope (uppe
gnment
ow) with
n of the
tures is
all three
similar
r panel:
amino acids 20-24, lower panel: Arg18 and Lys19). (c) Detailed view and comparison of the CCL2
dimerization region from different structures. CCL2 in complex with the NOX-E36 L-aptamer is shown in blue.
CCL2 is a dimer in the asymmetric unit for crystal structure PDB: 1DOK, shown in yellow and CCL2 is a
monomer in the asymmetric unit for crystal structure PDB: 1DOL, shown in red, CCL2 derived from NMR
studies, PDB: 1DOM, is shown in green. Interacting residues are displayed as sticks and the remaining part of
the protein is shown as cartoon plot to highlight the overall orientation. For clarity reasons, the NOX-E36
L-aptamer was omitted in this figure.
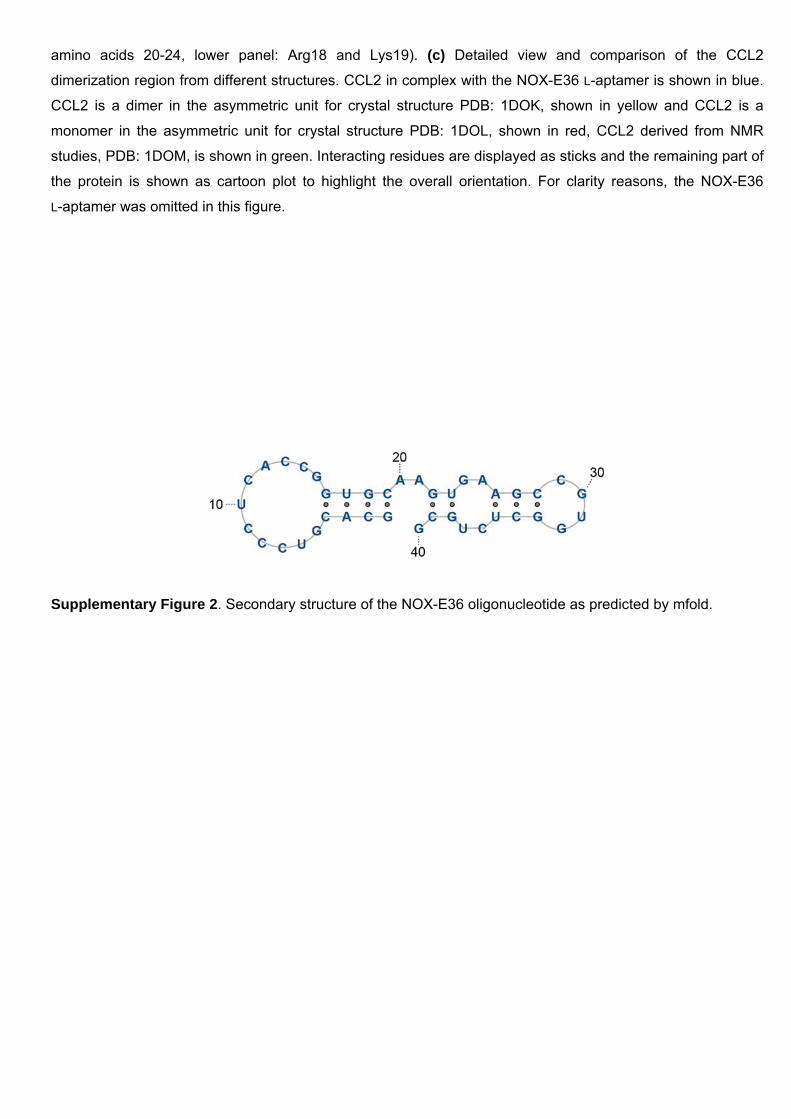
Supplementary Figure 2. Secondary structure of the NOX-E36 oligonucleotide as predicted by mfold.
Sup
ove
mo
pos
sho
pea
ano
Na+
obs
pplementa
erlaid onto t
del with the
sition of Sr2
own in (a),
ak at 3σ wa
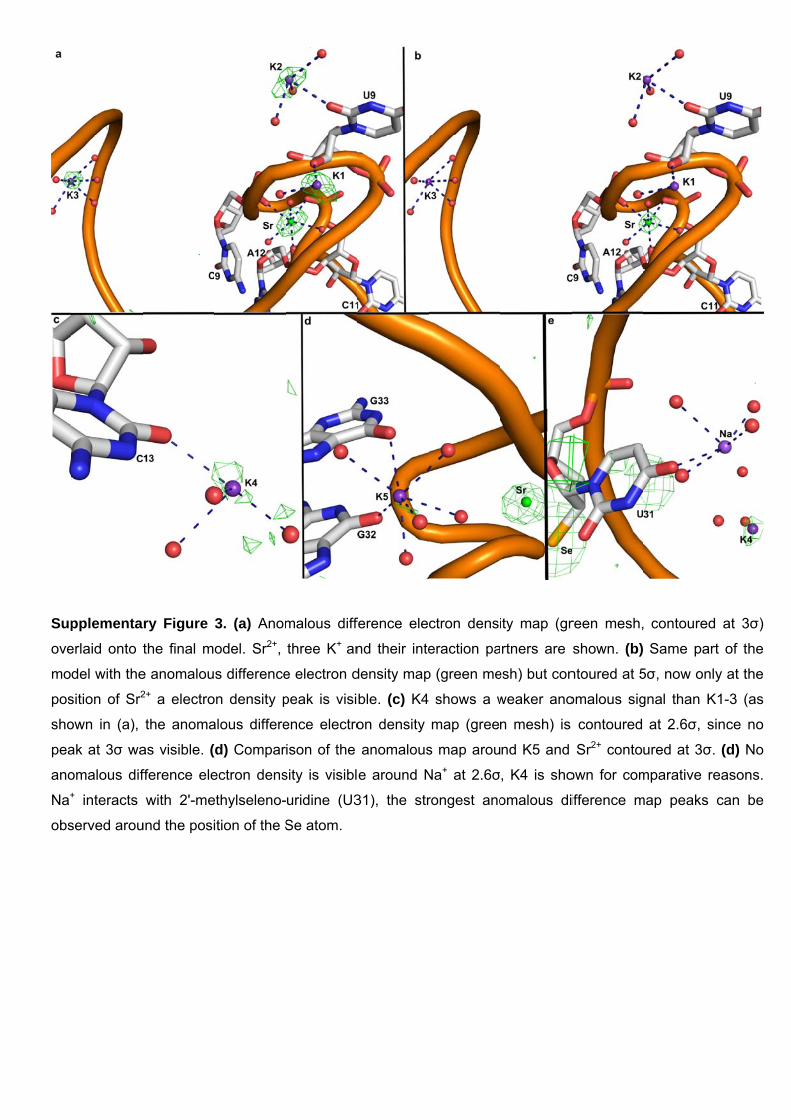
omalous dif+ interacts
served arou
ry Figure
the final m
e anomalou2+ a electro
the anoma
as visible. (
fference ele
with 2'-me
und the posi
3. (a) Anom
odel. Sr2+,
s difference
on density p
alous differe
d) Compar
ectron dens
ethylseleno-
ition of the S
malous diff
three K+ an
e electron d
peak is visi
ence electro
ison of the
sity is visibl
uridine (U3
Se atom.
ference ele
nd their inte
density map
ble. (c) K4
on density
anomalous
e around N
31), the str
ctron densi
eraction pa
p (green me
shows a w
map (gree
s map arou
Na+ at 2.6σ
rongest ano
ity map (gr
rtners are
esh) but con
weaker ano
n mesh) is
nd K5 and
, K4 is sho
omalous di
reen mesh,
shown. (b)
ntoured at 5
omalous sig
contoured
Sr2+ conto
own for com
ifference m
contoured
Same par
5σ, now onl
gnal than K
at 2.6σ, s
ured at 3σ.
mparative re
map peaks
d at 3σ)
rt of the
y at the
K1-3 (as
ince no
(d) No
easons.
can be
Sup
inte
ove
con
pplementa
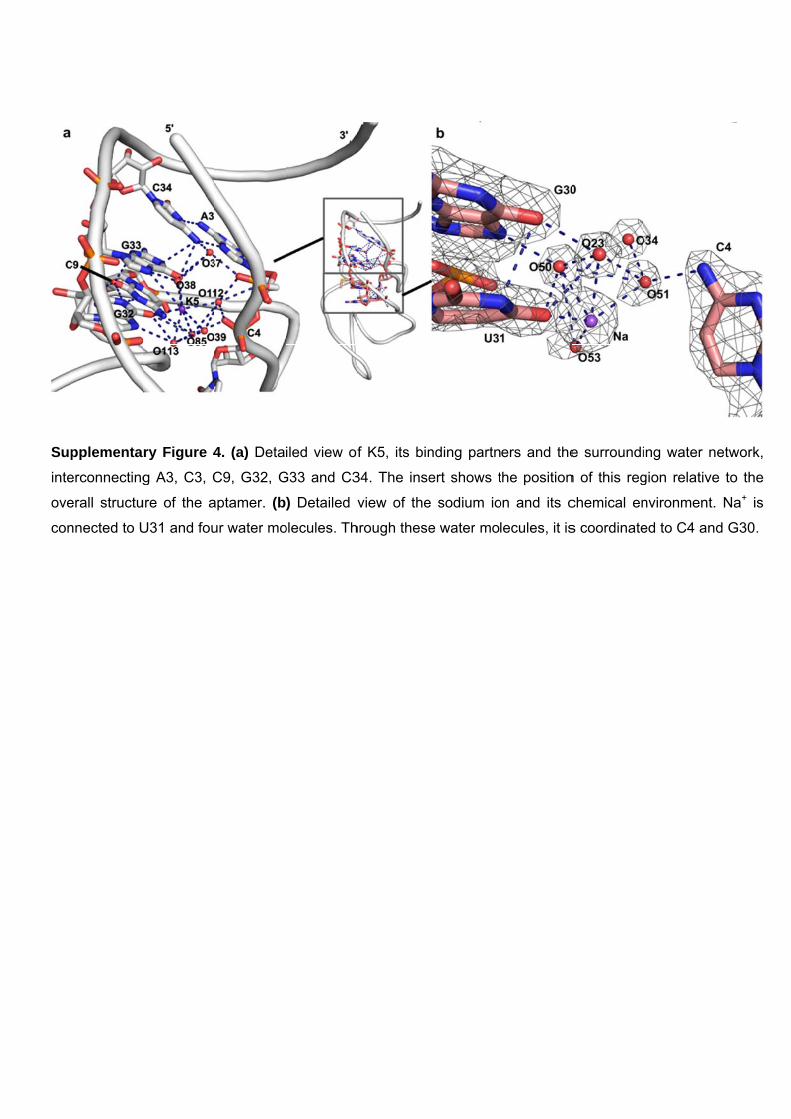
erconnecting
erall structu
nnected to U
ry Figure 4
g A3, C3, C
ure of the a
U31 and fou
4. (a) Deta
C9, G32, G
aptamer. (b
ur water mo
iled view of
G33 and C3
) Detailed v
olecules. Th
f K5, its bin
34. The inse
view of the
hrough these
nding partn
ert shows t
e sodium io
e water mo
ers and the
the position
on and its c
lecules, it is
e surroundi
n of this reg
chemical en
s coordinate
ing water n
gion relative
nvironment.
ed to C4 an
network,
e to the
. Na+ is
d G30.
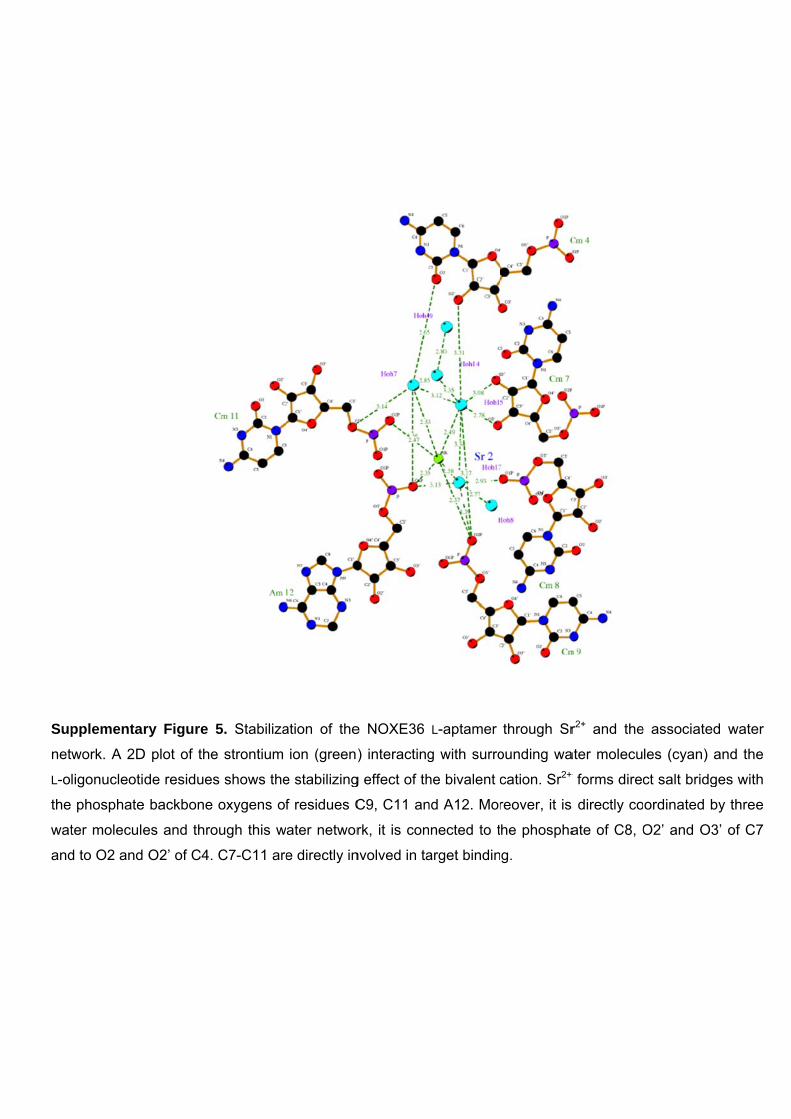
Sup
netw
L-o
the
wat
and
pplementa
work. A 2D
ligonucleoti
phosphate
ter molecule
d to O2 and
ry Figure
D plot of the
de residues
e backbone
es and thro
O2’ of C4.
5. Stabiliza
e strontium
s shows the
oxygens of
ough this w
C7-C11 are
ation of the
ion (green)
e stabilizing
f residues C
water networ
e directly in
e NOXE36
) interacting
g effect of th
C9, C11 an
rk, it is con
nvolved in ta
L-aptamer
g with surro
he bivalent c
nd A12. Mor
nected to t
arget bindin
through Sr
ounding wa
cation. Sr2+
reover, it is
he phospha
g.
r2+ and the
ater molecu+ forms direc
s directly co
ate of C8, O
e associated
les (cyan) a
ct salt bridg
ordinated b
O2’ and O3
d water
and the
ges with
by three
3’ of C7
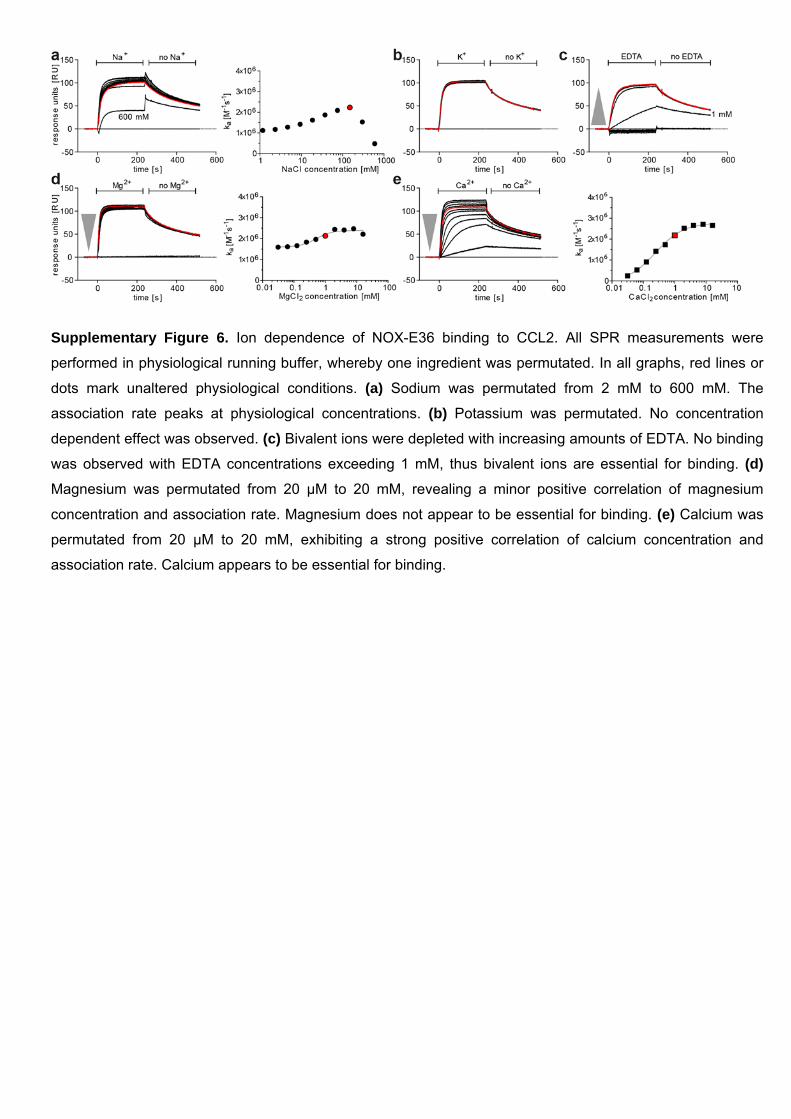
Supplementary Figure 6. Ion dependence of NOX-E36 binding to CCL2. All SPR measurements were
performed in physiological running buffer, whereby one ingredient was permutated. In all graphs, red lines or
dots mark unaltered physiological conditions. (a) Sodium was permutated from 2 mM to 600 mM. The
association rate peaks at physiological concentrations. (b) Potassium was permutated. No concentration
dependent effect was observed. (c) Bivalent ions were depleted with increasing amounts of EDTA. No binding
was observed with EDTA concentrations exceeding 1 mM, thus bivalent ions are essential for binding. (d)
Magnesium was permutated from 20 µM to 20 mM, revealing a minor positive correlation of magnesium
concentration and association rate. Magnesium does not appear to be essential for binding. (e) Calcium was
permutated from 20 µM to 20 mM, exhibiting a strong positive correlation of calcium concentration and
association rate. Calcium appears to be essential for binding.
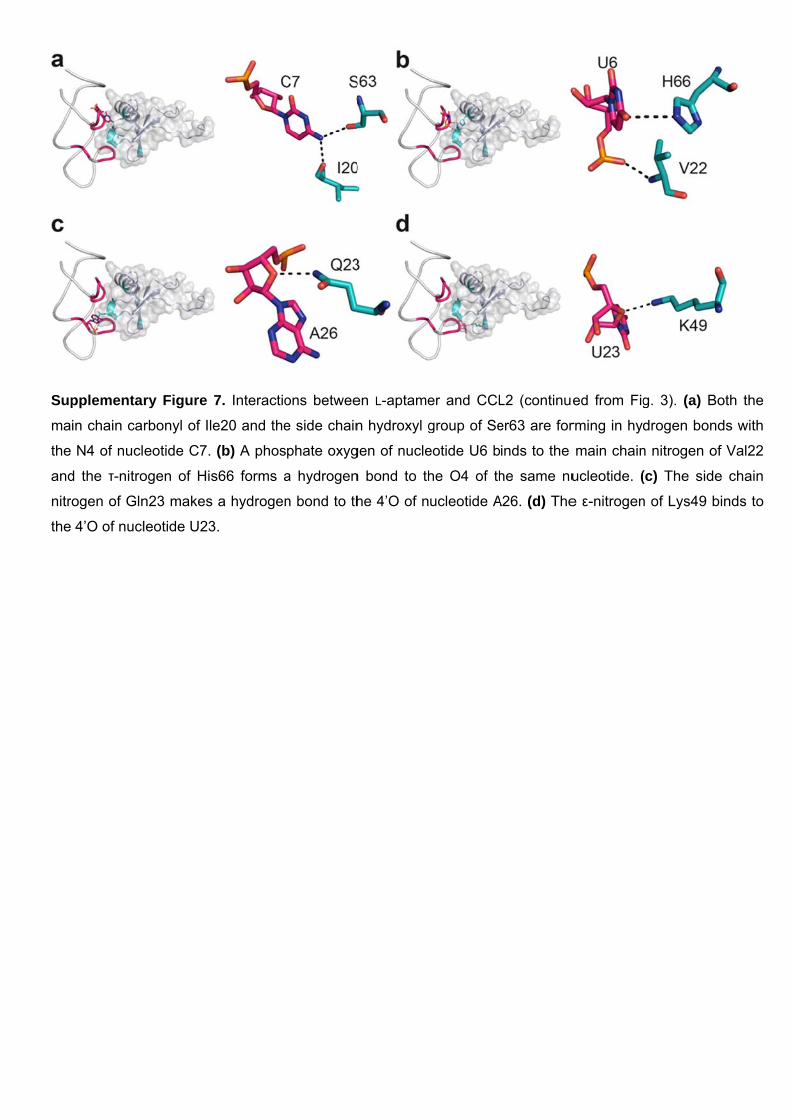
Sup
ma
the
and
nitr
the
pplementa
in chain ca
N4 of nucl
d the τ-nitro
ogen of Gln
4’O of nucl
ry Figure 7
rbonyl of Ile
eotide C7.
ogen of His
n23 makes
leotide U23
7. Interactio
e20 and the
(b) A phos
s66 forms a
a hydrogen
3.
ons betwee
e side chain
phate oxyg
a hydrogen
n bond to th
en L-aptame
n hydroxyl g
gen of nucle
n bond to th
he 4’O of n
er and CCL
group of Se
eotide U6 b
he O4 of th
ucleotide A
L2 (continu
er63 are for
inds to the
he same nu
A26. (d) The
ed from Fig
rming in hyd
main chain
ucleotide. (
e ε-nitrogen
g. 3). (a) B
drogen bon
n nitrogen o
(c) The side
n of Lys49 b
Both the
nds with
of Val22
e chain
binds to
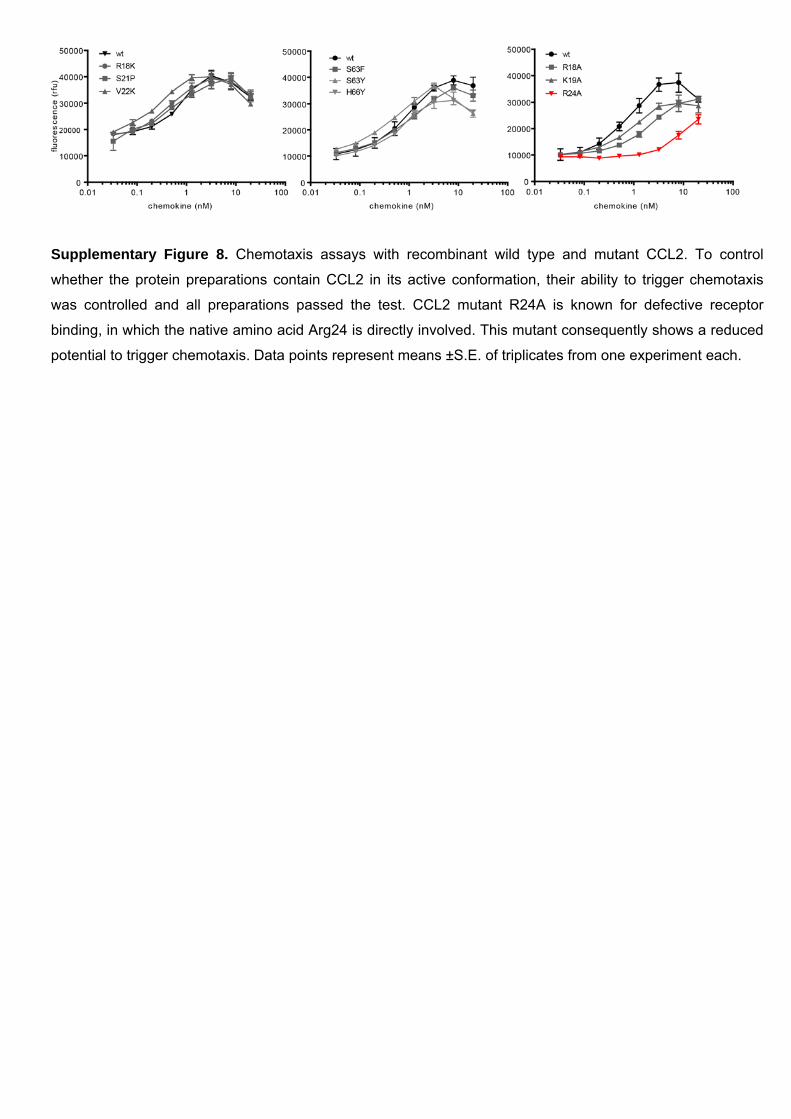
Supplementary Figure 8. Chemotaxis assays with recombinant wild type and mutant CCL2. To control
whether the protein preparations contain CCL2 in its active conformation, their ability to trigger chemotaxis
was controlled and all preparations passed the test. CCL2 mutant R24A is known for defective receptor
binding, in which the native amino acid Arg24 is directly involved. This mutant consequently shows a reduced
potential to trigger chemotaxis. Data points represent means ±S.E. of triplicates from one experiment each.
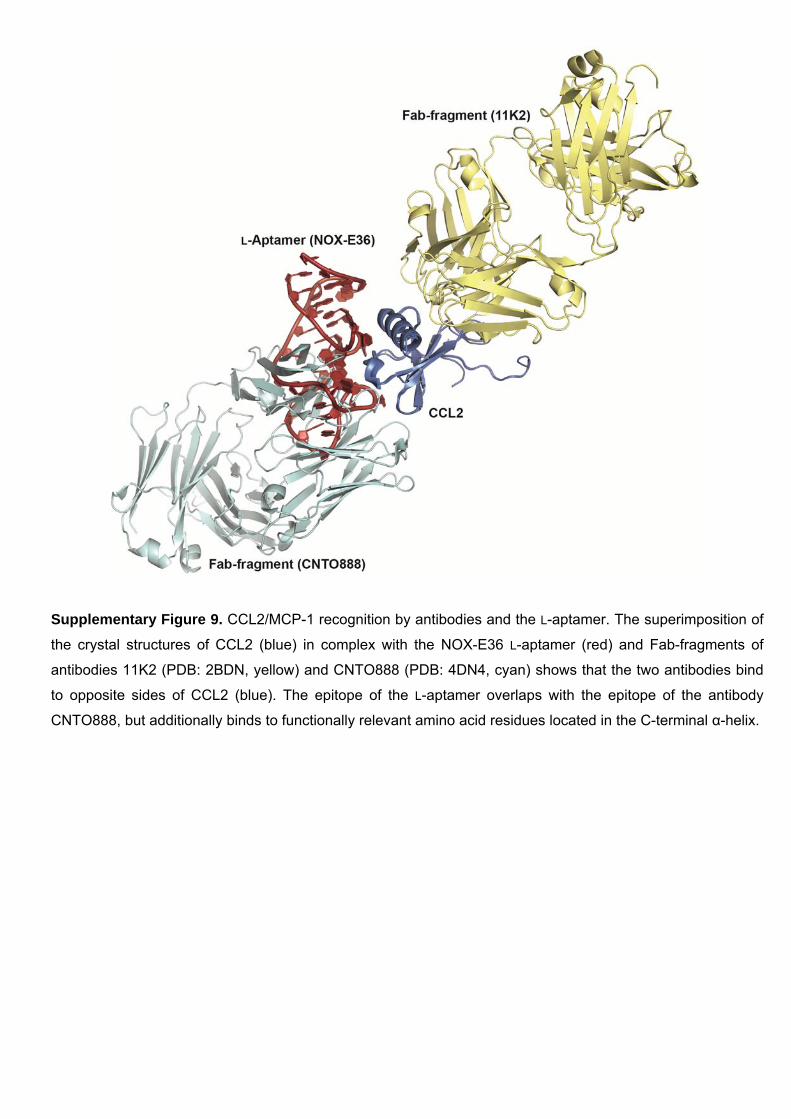
Supplementary Figure 9. CCL2/MCP-1 recognition by antibodies and the L-aptamer. The superimposition of
the crystal structures of CCL2 (blue) in complex with the NOX-E36 L-aptamer (red) and Fab-fragments of
antibodies 11K2 (PDB: 2BDN, yellow) and CNTO888 (PDB: 4DN4, cyan) shows that the two antibodies bind
to opposite sides of CCL2 (blue). The epitope of the L-aptamer overlaps with the epitope of the antibody
CNTO888, but additionally binds to functionally relevant amino acid residues located in the C-terminal α-helix.
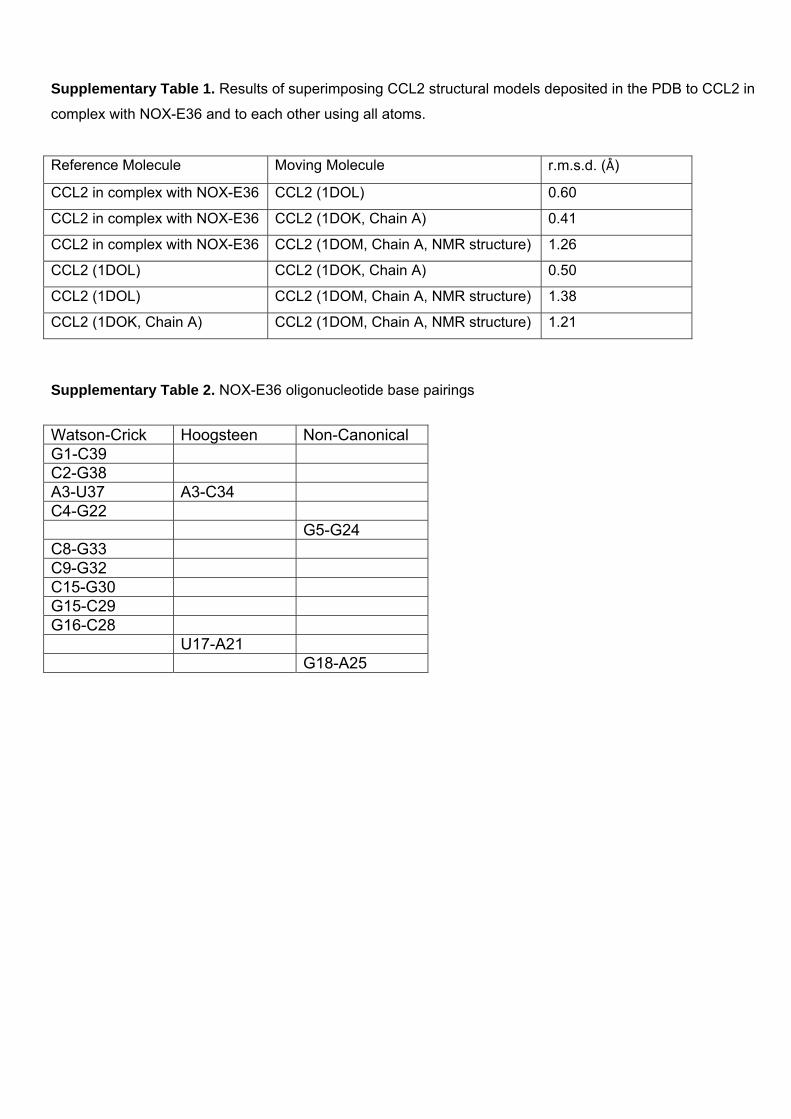
Supplementary Table 1. Results of superimposing CCL2 structural models deposited in the PDB to CCL2 in
complex with NOX-E36 and to each other using all atoms.
Reference Molecule Moving Molecule r.m.s.d. (Å)
CCL2 in complex with NOX-E36 CCL2 (1DOL) 0.60
CCL2 in complex with NOX-E36 CCL2 (1DOK, Chain A) 0.41
CCL2 in complex with NOX-E36 CCL2 (1DOM, Chain A, NMR structure) 1.26
CCL2 (1DOL) CCL2 (1DOK, Chain A) 0.50
CCL2 (1DOL) CCL2 (1DOM, Chain A, NMR structure) 1.38
CCL2 (1DOK, Chain A) CCL2 (1DOM, Chain A, NMR structure) 1.21
Supplementary Table 2. NOX-E36 oligonucleotide base pairings
Watson-Crick Hoogsteen Non-Canonical G1-C39 C2-G38 A3-U37 A3-C34 C4-G22 G5-G24 C8-G33 C9-G32 C15-G30 G15-C29 G16-C28 U17-A21 G18-A25
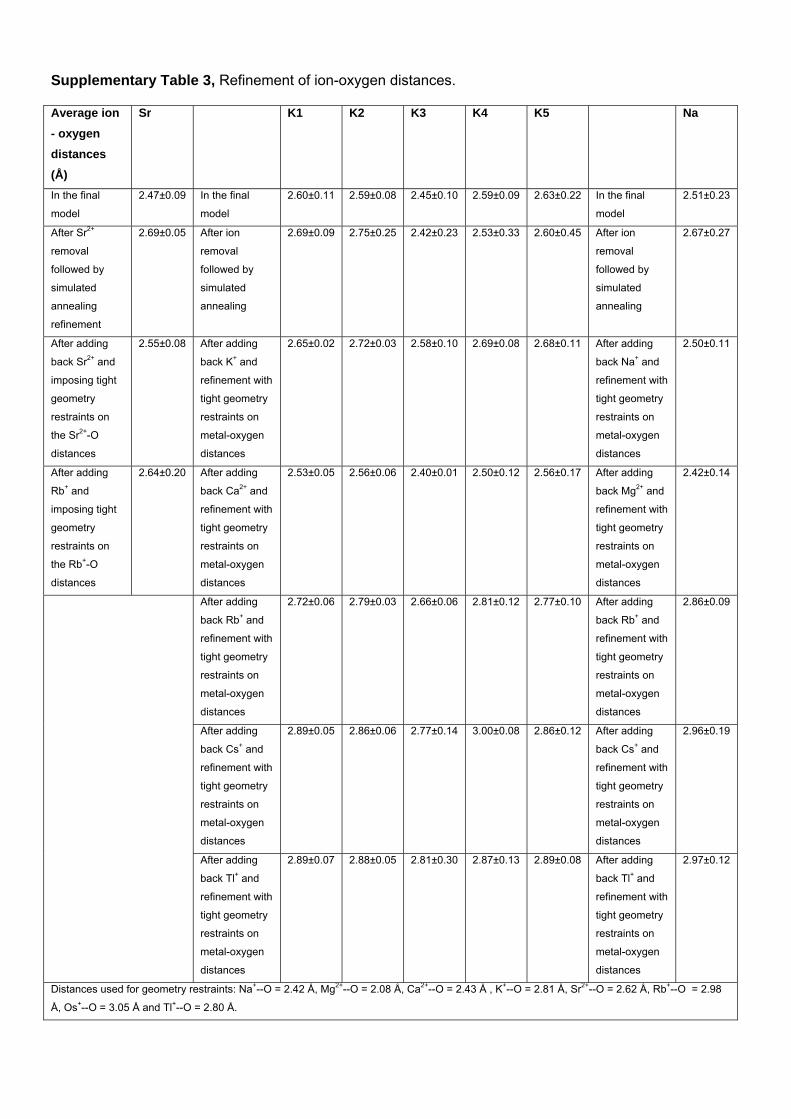
Supplementary Table 3, Refinement of ion-oxygen distances. Average ion
- oxygen
distances
(Å)
Sr K1 K2 K3 K4 K5 Na
In the final
model
2.47±0.09 In the final
model
2.60±0.11 2.59±0.08 2.45±0.10 2.59±0.09 2.63±0.22 In the final
model
2.51±0.23
After Sr2+
removal
followed by
simulated
annealing
refinement
2.69±0.05 After ion
removal
followed by
simulated
annealing
2.69±0.09 2.75±0.25 2.42±0.23 2.53±0.33 2.60±0.45 After ion
removal
followed by
simulated
annealing
2.67±0.27
After adding
back Sr2+ and
imposing tight
geometry
restraints on
the Sr2+-O
distances
2.55±0.08 After adding
back K+ and
refinement with
tight geometry
restraints on
metal-oxygen
distances
2.65±0.02 2.72±0.03 2.58±0.10 2.69±0.08 2.68±0.11 After adding
back Na+ and
refinement with
tight geometry
restraints on
metal-oxygen
distances
2.50±0.11
After adding
Rb+ and
imposing tight
geometry
restraints on
the Rb+-O
distances
2.64±0.20 After adding
back Ca2+ and
refinement with
tight geometry
restraints on
metal-oxygen
distances
2.53±0.05 2.56±0.06 2.40±0.01 2.50±0.12 2.56±0.17 After adding
back Mg2+ and
refinement with
tight geometry
restraints on
metal-oxygen
distances
2.42±0.14
After adding
back Rb+ and
refinement with
tight geometry
restraints on
metal-oxygen
distances
2.72±0.06 2.79±0.03 2.66±0.06 2.81±0.12 2.77±0.10 After adding
back Rb+ and
refinement with
tight geometry
restraints on
metal-oxygen
distances
2.86±0.09
After adding
back Cs+ and
refinement with
tight geometry
restraints on
metal-oxygen
distances
2.89±0.05 2.86±0.06 2.77±0.14 3.00±0.08 2.86±0.12 After adding
back Cs+ and
refinement with
tight geometry
restraints on
metal-oxygen
distances
2.96±0.19
After adding
back Tl+ and
refinement with
tight geometry
restraints on
metal-oxygen
distances
2.89±0.07 2.88±0.05 2.81±0.30 2.87±0.13 2.89±0.08 After adding
back Tl+ and
refinement with
tight geometry
restraints on
metal-oxygen
distances
2.97±0.12
Distances used for geometry restraints: Na+--O = 2.42 Å, Mg2+--O = 2.08 Å, Ca2+--O = 2.43 Å , K+--O = 2.81 Å, Sr2+--O = 2.62 Å, Rb+--O = 2.98
Å, Os+--O = 3.05 Å and Tl+--O = 2.80 Å.