Some Optical Properties of S -β-(4-Pyridylethyl)- L ...
8
Some Optical Properties of S pE(4Pyridylethy1)-~=Cystehe and its Wheat Gluten and Ser Albumin Derivatives Northern RegionaI Research L~bomtory, ~o~t&0$rn Marketi~g and Nutrition Reseorch Diuision, Agricultural Research Service, U.S. Department of Agricalfure, Peoria, Illhois 61604 Received March 16, 1971 Wv, Y. V., CLUSKEY, J. E., KR~L, E. H., and FRIEDMAN, M. Some optical properties of S-P-(- pvidylethy1)-L-cysteine and its wheat gluten and serum albumin derivatives. Can. J. Bimhern. 49, 1042-1049 (1971). The optical properties of PB-(4-pyridylethy1)-~-cysteiwe @EC) and its bovine serum albumin (BSA) and wheat gluten derivatives were studied in 0.014.1 N HCI. Optical rotatory dispersions (O.R.D.), circular dichroism (C.D.), ultraviolet (U.V.), and infrared (I.R.) spectra were obtained of PEC, BSA, BSA reduced with mercaptoethano1 and alkylated with 4-vinylpyridine (PE-BSA), BBL reduced with mercaptoethanol and alkylated with acrylsnitrile (CN-BSA), gluten, gluten reduced with mercaptoeth- an01 and alkylatd with 4-viraylpyridine (PE-gluten), and gluten reduced with mercaptoethanol and alkylated with acrylonitrile (CN-gluten). 1.8. spectra of the proteins showed the presence of a-helical and unordered conformations. The U.V. absorption at 254 mp of PEC and PE-BSA depends on pH; a pK value near 6 for the pyridyl goup was obtained by spwtrophotometric titration. The possible use of PEC as a conformation probe was explored. The O.R.D. of PEC depends on concentration, solvent, and pH but not on ionic strength. The 8.R.D. data of proteins were analyzed by the Msfitt-Yang method to g t a-helical contents. These helical contents indicate that there is not enough interaction left to support a-helix in gluten with dislalfide bonds broken at pH 2.2. However, approximately one- third of the helical content of BSA persists without the aid of disulfidebonds. Wu, YeV., CLUSKEY, J. E., MRULL, E. H., et FRIEDMAN, M. Some optical properties of S-k(4-pyridyl- ethyl)-L-cysteineand its wheat gluten and serum albumin derivatives. Can. J. Bimhem. 49,1042-1049 (1971). Les propriCtCs optiques de la S-D-(4-pyridylCthyI)-~-cyst6ine (PEC) et de ses dCrivCs, i'albmine s6rique du beuf (BSA) et le gluten du blC, sont Ctudi6es dams le HCl 0.014.1 N. Nous obtenons les dispersions rotatoires optiques (O.R.D.), le dickoisme circulaire (C.D.), ks spectres ultraviolet (U.V.) et infrarouge (H.R.) de %a PEC, de la BSA, de la BSA rtduite avec le mercaptdthanol et alkylCe avec la 4-vinylpy~idine (PE-BSA), de H a BSA rkduite avec le mercaptodthanolet alkylk avec l'acrylonitrile (CN-BSPI), du gluten, du gluten rkduit avec le meraptoCthamol et alkyl6 a v a H a 4-vinylpyridine (PE-gluten) et du gluten rdduit avec le mercaptodthanoH et dkylk avec l'acrylonitrile (CN-gluten). Ees spectres H.W. des protdines mntrent la phence de confornations a-hClicoYdaks et de conformations won ordonmdes. L'absorption U.V. 2i 254 mH de la BEC et Qe la PE-BSA dCpend du pH; le titrage spectrophotsm6trique permet d90btenir une valeur de pK pr&s de 6 pour le groupement pyridyle. Nous recherchons h possibilitC d9utiliserla PEC pour scruter la eomformatisn. L90.R.D. de la PEC dbpmd de la concentration, du solvamt et du pH mais non de la force ionique, Les rdsultats de 170.R.D.des prot6ines sont analysts par H a rnethode QeMasfitt-Yang pour obtemir l a teneurs en a-hdlim. Ces teneurs en a-hdliw montrent que dans b gluten dont les ponts disulfure sont brisCs k pH 2.2, I'interaction n'est plus suffisante pour supporter I'a-helice. Cependant, dans k BSA, approximativement m ties de la temeur hC1icoldale persiste sans l'aide des ponts disulfures. Imtrodnction residues in hydrolyzed proteins as PEC were The use of S-~-(4-pyridyEethyl)-~-cysteine (PEC) as an internal standard for amino acid analyses was reported by Cavins and Friedman (1) The chromatographic and spectrophoto- metric determinations of cystine rand cysteine dso reported (2, 3). This paper reports the optical rotatory dispersion (8.R.D.) and ultra- violet (U.V.) spectrum of PEG as a function of pH and solvent. In addition the effect of diaulfide bonds on the conformational stability of wheat gluten and bovine serum albumin (BSAB BPresemt address : Western Regional Research Labora- was stu&ed by reducing the proteins' wit6 tory, Agricultural Research Senice, Alhmy. California merca~toethanol and dkylating the sulfh~dr~l 94710. groups with 4-vinylpyridine or acrylonifrile. Can. J. Biochem. Downloaded from www.nrcresearchpress.com by UNIVERSITY OF MICHIGAN on 11/10/14 For personal use only.
Transcript of Some Optical Properties of S -β-(4-Pyridylethyl)- L ...

Some Optical Properties of S pE(4Pyridylethy1)-~=Cystehe and its Wheat Gluten and Ser Albumin Derivatives
Northern RegionaI Research L~bomtory, ~ o ~ t & 0 $ r n Marketi~g and Nutrition Reseorch Diuision, Agricultural Research Service, U.S. Department of Agricalfure, Peoria, Illhois 61604
Received March 16, 1971
Wv, Y. V., CLUSKEY, J. E., K R ~ L , E. H., and FRIEDMAN, M. Some optical properties of S-P-(- pvidylethy1)-L-cysteine and its wheat gluten and serum albumin derivatives. Can. J. Bimhern. 49, 1042-1049 (1971).
The optical properties of PB-(4-pyridylethy1)-~-cysteiwe @EC) and its bovine serum albumin (BSA) and wheat gluten derivatives were studied in 0.014.1 N HCI. Optical rotatory dispersions (O.R.D.), circular dichroism (C.D.), ultraviolet (U.V.), and infrared (I.R.) spectra were obtained of PEC, BSA, BSA reduced with mercaptoethano1 and alkylated with 4-vinylpyridine (PE-BSA), BBL reduced with mercaptoethanol and alkylated with acrylsnitrile (CN-BSA), gluten, gluten reduced with mercaptoeth- an01 and alkylatd with 4-viraylpyridine (PE-gluten), and gluten reduced with mercaptoethanol and alkylated with acrylonitrile (CN-gluten). 1.8. spectra of the proteins showed the presence of a-helical and unordered conformations. The U.V. absorption at 254 mp of PEC and PE-BSA depends on pH; a pK value near 6 for the pyridyl goup was obtained by spwtrophotometric titration. The possible use of PEC as a conformation probe was explored. The O.R.D. of PEC depends on concentration, solvent, and pH but not on ionic strength. The 8.R.D. data of proteins were analyzed by the Msfitt-Yang method to g t a-helical contents. These helical contents indicate that there is not enough interaction left to support a-helix in gluten with dislalfide bonds broken at pH 2.2. However, approximately one- third of the helical content of BSA persists without the aid of disulfide bonds.
Wu, Ye V., CLUSKEY, J. E., MRULL, E. H., et FRIEDMAN, M. Some optical properties of S-k(4-pyridyl- ethyl)-L-cysteine and its wheat gluten and serum albumin derivatives. Can. J. Bimhem. 49,1042-1049 (1971).
Les propriCtCs optiques de la S-D-(4-pyridylCthyI)-~-cyst6ine (PEC) et de ses dCrivCs, i'albmine s6rique du beuf (BSA) et le gluten du blC, sont Ctudi6es dams le HCl 0.014.1 N. Nous obtenons les dispersions rotatoires optiques (O.R.D.), le dickoisme circulaire (C.D.), ks spectres ultraviolet (U.V.) et infrarouge (H.R.) de %a PEC, de la BSA, de la BSA rtduite avec le mercaptdthanol et alkylCe avec la 4-vinylpy~idine (PE-BSA), de Ha BSA rkduite avec le mercaptodthanol et alkylk avec l'acrylonitrile (CN-BSPI), du gluten, du gluten rkduit avec le meraptoCthamol et alkyl6 a v a Ha 4-vinylpyridine (PE-gluten) et du gluten rdduit avec le mercaptodthanoH et dkylk avec l'acrylonitrile (CN-gluten). Ees spectres H.W. des protdines mntrent la phence de confornations a-hClicoYdaks et de conformations won ordonmdes. L'absorption U.V. 2 i 254 mH de la BEC et Qe la PE-BSA dCpend du pH; le titrage spectrophotsm6trique permet d90btenir une valeur de pK pr&s de 6 pour le groupement pyridyle. Nous recherchons h possibilitC d9utiliser la PEC pour scruter la eomformatisn. L90.R.D. de la PEC dbpmd de la concentration, du solvamt et du pH mais non de la force ionique, Les rdsultats de 170.R.D. des prot6ines sont analysts par Ha rnethode Qe Masfitt-Yang pour obtemir l a teneurs en a-hdlim. Ces teneurs en a-hdliw montrent que dans b gluten dont les ponts disulfure sont brisCs k pH 2.2, I'interaction n'est plus suffisante pour supporter I'a-helice. Cependant, dans k BSA, approximativement m ties de la temeur hC1icoldale persiste sans l'aide des ponts disulfures.
Imtrodnction residues in hydrolyzed proteins as PEC were
The use of S-~-(4-pyridyEethyl)-~-cysteine (PEC) as an internal standard for amino acid analyses was reported by Cavins and Friedman (1) The chromatographic and spectrophoto- metric determinations of cystine rand cysteine
dso reported (2, 3). This paper reports the optical rotatory dispersion (8.R.D.) and ultra- violet (U.V.) spectrum of PEG as a function of pH and solvent. In addition the effect of diaulfide bonds on the conformational stability of wheat gluten and bovine serum albumin (BSAB
BPresemt address : Western Regional Research Labora- was stu&ed by reducing the proteins' wit6
tory, Agricultural Research Senice, Alhmy. California merca~toethanol and dkylating the s u l f h ~ d r ~ l 94710. groups with 4-vinylpyridine or acrylonifrile.
Can
. J. B
ioch
em. D
ownl
oade
d fr
om w
ww
.nrc
rese
arch
pres
s.co
m b
y U
NIV
ER
SIT
Y O
F M
ICH
IGA
N o
n 11
/10/
14Fo
r pe
rson
al u
se o
nly.
WU ET AL. : S-&(4PYRIDYLBTHn>WYSmINE 1043
The native and reduced-alkylated proteins were investigated by U.V. and infrared (I.R.) spec- troscopy and O.R.D.
Experimental h f ~ f e r l b l ~
M e a t gluten was prepared from Ponca wheat by the procedure of Jones et a]. (4). BSA, four times recrys- tallized, and lysozyme came from Pentex2 (Kmka- kee, Ill.); Cvinylpyridline, from %ley Tar Company; mercaptoethano%, from Eastman; sodium lamy1 sulfate, from Du Pont; and tris(hydroxymethyl)aminomethme, from Fisher. All liquid organic reagents were redistilled before use. Deionized, distilled, and nitrogen-saturated HzO was used in all modification studies.
PEC was prepared from ~:ysteine (Mann Rewarch Laboratories) and Cvinylpyridine by the method of Cavins and Friedman (1). The structure of PEC was confirmed by I.W., nuclear magnetic resonance, and mass spectroscopic analyses. The calculated percentage of C, H, N, and S of PEC agreed well with the values found.
Metho673 Reduction a d Alkylation of Proteins One gram of the protein was dissolved in 38 mI of 6 M
urea-pH 7.5 Tris buffer. One milliliter of mercapto- ethanol (about 100 M excess over total clisulfides) was then added and the reaction mixture was stirred for 16 h at 38 "C. The free sdfhydryl groups were then alkylated with 4vinylpyridine or acxylonitrile (1 to 1 mole ratio with respect to all sulfhydryl groups) and stirred for 30-120 min. The solution was adjusted to pH 3 with glacial acetic acid, dialyzed against 0.81 N acetic acid, and lyophilkd. Alkylation was complete and there was no modification of other amins acids in each instance based on the following facts. Amino acid analyses of the alkylated proteins showed that: (I) no half-eystine was present, (2) the number of PHC groups was equal to the haif-cystine content of the protein, and (3) no change occurred in any other amino acid. In addition, no free sulfhydsgrl group can be detected by amgerometric titration of the alkylated proteins.
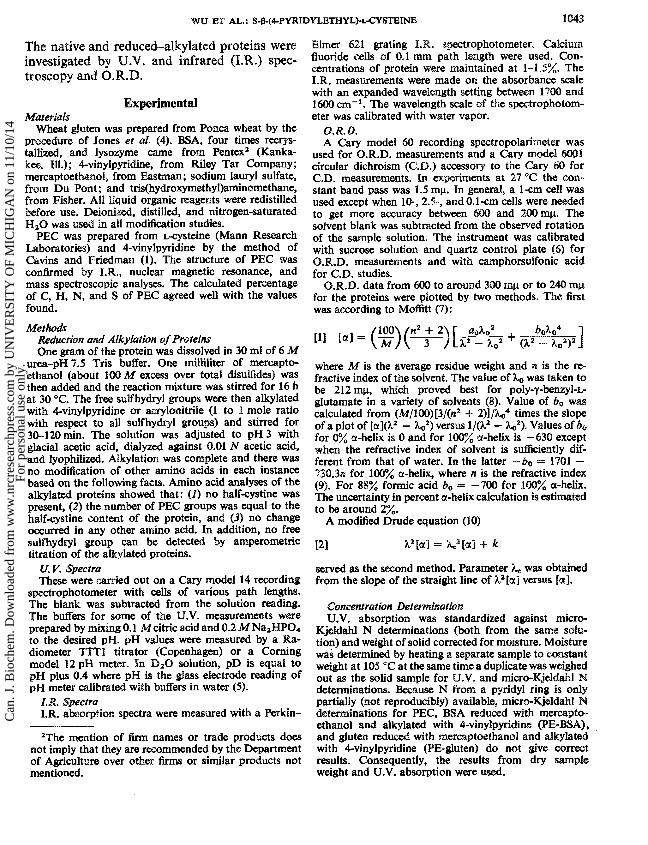
61.64 Spectra These were carried out on a Cary model 14 recording
spectrophotometer with cells of various path lengths. The blank was subtracted from the solution reading. The buflfers for some of the U.V. measurements were prepared by mixing 0.1 Mcitric acid and 0.2 M Na2HP04 to the desired pH. pH values were measured by a Ra- diometer TIT1 titrator (Copenhagen) or a Corning model 12 pH meter. In D 2 0 solution, pD is equal to pH plus 0.4 where pH is the glass electrode reading of pH meter calibrated with buffers in water (4).
H.R. Spectra I.R. absorption spectra were measured with a Perkin-
"The mention of firm names or trade products does not imply that they are recommended by the Department of Agriculture over other Rrms or similar products not mentioned.
E h e r 621 grating I.R. spectrophstometer. Calcium fluoride cells of 8.1 mm path length were used. Con- centrations of protein were maintained at 1-1 -5%. The I.R. measurements were made on the absorbance scale with an expanded wavekngth setting betwen 1700 and 1600 cm-I. The wavelength scale of the spectrophotom- eter was calibrated with water vapor.
O.R.D. A Cary model 60 recording spectropolarimeter was
used for O.R.D. measurements and a Cary model gOO1 circular dichroism ((31.B.) accessory to the Cary 60 for C.D. measurements. In experiments at 27 '(31 the con- stant band pass was 1.5 mp. In gaeral, a l e m cell was used except when 18-, 2 5 , and 0.1em cells were needed to get more accuracy between 600 and 200 my. The solvent blank was subtracted from the observed rotation of the sample solution. The instrument was calibrated with sucrose solution and quartz control plate (6) for 0.W.D. measurements and with camphorsdfonic acid for C.D. studies.
0.R.D. data from 600 to around 300 mp or to 2 4 rnp for the proteins were plotted by two methods. The fist was according to Moffitt (7%:
where M is the average residue weight and n is the re- fractive index of the solvent. The value of X, was taken to be 212 mp, which proved best for poly-y-&nzyI-~- glutmate in a variety of solvents (8). Value of bo was calculated from (M/18(%)[3/(n2 + 2)l/ho4 times the slope of a plot of [a](h2 - A$) versus 1/(3a2 - Xo2). Values of b, for 0% a-helix is Q and for 100% a-helix is -630 except when the refractive index of solvent b su6ciently M- ferent from that of water. In the latter -bo = 1701 - 730.3n for 100% a-helix, where n is the refractive index (99. For 88% formic acid bo = - 700 for 100% a-hdix. The uncertainty in percent a-helix calculation is estimated to be around 2%.
A modified Drude equation (10)
served as the seeond method. Parameter & was obtained from the slope of the straight line of 3a2 [ex] versus [a].
Concmtration Determination U.V. absorption was standardized against micro-
Kjddahl N determinations (both from the same solu- tion) and weight of solid corrected for moisture. Moisture was determined by heating a separate sample to constant weight at 105 'C at the same time a duplicate was weighed out as the solid sample for U.V. and micro-Qeldahl N determinations. Because N from a pyridyl ring is only partially (not reproducibly) available, micro-Kjddahl N determinations for PEC, BSA reduced with memapto- ethanol and alkylated with 4-vinylpyridine @E-BSA), and gluten reduced with marcaptoethanol and alkylated with Qvinylpyridine (PE-gluten) do not give correct results. Consequently, the results from dry s m p k weight and U.V. absorption were used.
Can
. J. B
ioch
em. D
ownl
oade
d fr
om w
ww
.nrc
rese
arch
pres
s.co
m b
y U
NIV
ER
SIT
Y O
F M
ICH
IGA
N o
n 11
/10/
14Fo
r pe
rson
al u
se o
nly.

1 0 4 CANADIAN JOURNAL OF BIOCHEMISTRY. VOL. 4% 1971
TABLE 1. and characteristics of ultraviolet spectra of P E C in 0.05 N He%, pH 1.4, and proteins in 0.01 N HCI, pH 2.2
PEC 0.039" - - 226 - 68.8 314 Gluten - 6.20 (276) - - 3.88(250) - - PB-glw ten - 7.07(275) 6.98 12.1 10 .0 (245) - - CN-gluten - 6.58 (276) - - 3.58(258) - - BSA - 6.62 (278) - - 3.65 (252) - - PE-BSA - 12 .0 (274) 11.4 2 7 f 8 . 5 ( 2 4 3 ) - - =PEC, 9f3-(4-p idylethyl)-L-cpteine; BE-gluten, gluten reduced with mereaptoettsanol and dkylated with
Cvinylpyddins; &-gluten, gluten reduced with mercaptoefbanol and dkylated with acrylonitrilo; BSA. bovine serum albumin; PE-BSA, BSA reduced with mercaptmthanol and sslkylated with 4-vinylpyridine.
B&xilads near 276 my, actual wavelength given in parentheses after El"/. ,, values. Minima near 248 nap, actual wavelength giwn in parentheses aflar Em &,, vdues. *pH of this solution is near 5.1 due to the high concentration of BEC used.
Results Ua V. Spectra
Table 1 shows the El", ., and characteristics of U.V. spectra of PEC and proteins in dilute hydrochloric acid. PEC has a we& shoulder at 370 mp with E'%, ., value of 0.039. There is a strong maximum at 254 mp with I?"",., value of 226, a minimum at 235 mp with E'", ., value of 68.8, and a stronger maximum at 216 rnp with E"",., value of 314. Both gluten and BSA have the typical maxima and minima of proteins. Gluten reduced with mercaptoethanol and alkylakd with acrylonitrile (CN-gluten) has the same characteristic maximum and minimum at the same wavelengths as gluten, and the mag- nitudes are also about the same. However, PE- gluten diflers greatly from gluten in its U.V. spectra (both in wavelength and in magnitude). The original prominent maximum of gluten at 276 mp with E'", ,., of 6.20 is barely visible in PE-gluten with El%, ,, of 7.07 at 275 mp followed by a minimum at 271 rnp with E'", ,, of 6.98. A prominent maximum is observed at 254 mp with E'", ,, of 12.1 and another minimum at 245 mp with E'", .., of 10.0 compared with a minimum in gluten at 258 mp with E'%, ,., of 3.88. For PE-BSA the maximum at 278 mp for BSA is shifted to 274 mp and has about twice the intensity. This maximum at 274 mp, however, is barely visible and is followed by a minimum at 271 mp of about the same magnitude. A large and prominent maximum at 254 mp is fo1Iowed by a minimum at 243 my, as compared with the 252 mp minimum for BSA. There is no absorption maximum or shoulder between 240 and 202 mp for PE-BSA and PE-
gluten. Apparently the absorption maximum of PEC at 216 mp in PE-proteins is masked by the strong peptide absorption En this region.
The spectrophotometric titration of PEC at 255 mp is shown in Fig. 1. The U.V. absorption of BEC drops considerably as the pH is increased from 2 to 9. There is no large change in U.V. spectrum when 8 M urea is added to the buffer solutions. The U.V. absorption of PEC is the same from pH 2.4 to 1.5 in 0.005 N to 0.05 N HCI, and there is no change in U.V. spectrum when 0.2 M KC1 or 0.1 M sodium lauql sulfate is a d d d to the PEC solution near pH 2.0 (not shown in Fig. 1).
The differential spectrophotometric titrations of BSA and its derivatives are shown in Fig. 2. The BE-BSA versus BSA curve is quite similar to PE-BSA versus BSA reduced with mercapto- ethanol and dkylated with aerylonitrile (CN-
2,,,+-0 4 PH
FIG. 1. Variation of molar extinction coeficicnt of S-~-(4-pyridylathy1)-~-6:ysteiwe (PEQ at 255 mp with pH of the buffer: (0) with 8 M urea; (A) without urea.
Can
. J. B
ioch
em. D
ownl
oade
d fr
om w
ww
.nrc
rese
arch
pres
s.co
m b
y U
NIV
ER
SIT
Y O
F M
ICH
IGA
N o
n 11
/10/
14Fo
r pe
rson
al u
se o
nly.

FIG. 2. DifFerential sptrophotsmetric titrations of bovine serum albumin @SA) and its derivatives in buffer containing 8 M urea at 25% mp. ( 0 ) BSA reduced with mercaptwthanoE and aIkylated with 4-vinylpysidine gPE-BSA) versus BSA. (0) PE-BSA versus BSA reduced with meraptoethanol a d alkylated with acrylonitrile (CN-BSA). Protein concentration is 1 mg/ml in each case.
BSA) curve, and both curves in Fig. 2 are of the same shape as those in Fig. 1. The absorbance of BE-BSA at 255 my is constant between pH 2 and 2.8 in 0.01 N HCl with and without 0.1 A4 KC1 or 0.1 M sodium lauryl sulfate (not shown in figure), while the presence of 8 A4 urea de- creases the absorbance slightly. The pH de- pendence of U.V. absorption at 255 mp in Figs. 1 and 2 is a result sf the protonation equilibrium of the pyridine ring, m d pK values near 6 for pyridine nitrogen are obtained from the midpoint of these curves.
The possible use of PEC as a conformational probe in proteins was studied with gluten, lysozyrne, and BSA. The molar extinction coefficient, s, of PEC in PE-proteins in 0.01 N HCl was compared with that of free BEC in the same solvent and pH at 254 my. The number of PEC groups in each protein was obtained from the PEC peaks in the amino acid analysis of PE-proteins. PE-lysozyme, BE-gluten, and PE- BSA have essentially the same E value for PEC in bound form as that of free PEC. Unfortunately PE-proteins are rather insoluble at neutral pH, and this poor soBubi1ity makes E versus pH studies very dificult.
1.R. Spectrtz Table 2 lists the 1.W. absorption maxima of
proteins in 0.82 N D@1 in D,O. Since the
TABLE 2, Infrared absorption maxima of proteins in 0.02 N DC1 in D28
-
Absorption maximum, Protein cm-l PD
Gluten 1640-1 645 2.41 PE-gluten 1 641-1644 2.49 CN-gluten 1639-1 642 2.42 BSA 1642-1651 2.63 PE-BSA 1643-4 650 3.48 CN-BSA" 4 643-1 648 3.02
CN-BSA, BSA reduced with rnercagtoethranol and alkylratsd with acrylonitrile.
maximum for each protein is quite broad, a range of wave numbers is used. Gluten and its derivatives have their absorption maxima at 1639-1645 cm-I, while those of BSA and its derivatives range from 1642 to 1651 cm-I. No peak or shoulder was observed near I632 em-'.
0.13.0. The specific rotation of PEC in dilute HCl
was measured from 600 to 320 mp (Fig. 3). From 0.05% (pH 1.43) to 0.26% (pH 1 .$), because the specific rotation of PEC did not show any concentration dependence, results sf the five experiments were averaged. Because of the low specific rotation values and limited sslubility of
FIG. 3. Specific rotation of PEC from 589 t s 320 rnp in 0.054.1 N H a . <a> BB.054.26%, pH 1.43-1.8 in 0.0% NHCI (average of five experiments from ME%, pH 1.43, to 0.26%, pH 1.8); ( 0 ) 2.1%, pH 1.52 in 0.1 NHCB, with and without 0.1 M s r 1 MKCI; (A) 1.86%, pH 5.84 in 0.05 N HCE; (V) 2%, pH 1.63 with 0.1 M sodium lauryl sulfate + 0-1 N HCI; (@I 2%, pH 3.82 with 8 M urea + 0.1 NHCB.
Can
. J. B
ioch
em. D
ownl
oade
d fr
om w
ww
.nrc
rese
arch
pres
s.co
m b
y U
NIV
ER
SIT
Y O
F M
ICH
IGA
N o
n 11
/10/
14Fo
r pe
rson
al u
se o
nly.

1046 CANADIAN JOURNAL OF BIOCHEMISTRY. V6L. 49, 1971
TABLE 3, Optid rotatory properties of gluten, CN-gluten, PE-gfuten, BSA, CN-BSA, and PE-BSA in 0.01 N HCl -.
"/, !a15889 5 9 k a09 ~ O S Protein PH Concentration degrees rnp 10" degrem degrees Helme
Zo
Gluten 2.24 0 . 4 0 . 2 - 8 4 229 -26.5 -549 - 95 15 CN-gluten 2.26 0.4 -127 211 -38.6 -769 0 0 PE-gluten 2.23 0.4-0.2 -123 214 -37.7 -764 - 32 5 BSA 2.56 0.6 - 86 238 -25.0 -512 - 182 29 CN-BSA 2.53 0.6 - 9 9 220 -29.4 -624 - 67 11 PE-BSA 2.59 0.6 - 8 6 223 -24.6 -611 - 72 11
aPercent helix bO/ -6.3.
PEC, reliable data cannot be obtained above 4 0 mp for 0.05-0.26% solutions, and below 300 mp the absorption of the PEC solution increased rapidly compared with increase in specific rotation so that specific rotation results for this substance me reliable only in the range
300 mp. To get maximum accuracy for specific rotation values of PEC, the maximum cell path (10 cm) and the maximum concentra- tion (about 2%) were chosen. PEC (approxi- mately 2%) showed negative specific rotations in the visible range but changed to positive specific rotations around 400 mp for pH 18.5 solution and 330 mp for pH 5 solution. In all solutions without urea, the specific rotation became more positive with decreasing wave- lengths, except around the 5 where a minimum in specific rotation is observed for pH 5 and 18.5 solutions. For pH 1.5 solution 2.1% PEC gave essentially the same O.R.D. curve whether 0.1 M or 4 M KC1 was induded OH not. Therefore, the O.R.D, of PEC is in- dependent of ionic strength. The addition of 0.1 M sodium lauryl sulfate shifted the specific rotation at all wavelengths to more positive values without change in the general shape sf O.R.D. curve. However, 8 M urea shifted the O.R.D. curve to more negative values at all wave- lengths and the specific rotation was negative and became more negative with decreasing wave- length. Figure 3 shows that the specific rotation of PEC depends on concentration, solvent, and pH but not on ionic strength.
Two typical MoEtt plots for PE-BSA and PE-gluten are shown in Fig. 4, and the optical rotatory properties of gluten, CN-gluten, PE- gluten, BSA, CN-BSA, and PE-BSA are given in Table 3. Gluten has an [a],,, sf -84", h, of 229, m d 15% a-helix. When the disulfide bonds of gluten were broken and the sulfhydvl groups alkylated, there was a significant decrease of a, and in the percentage of a-helix but more
FIG. 4. (0) Mofitt plot sf 0.6"/, PE-BA pH 2.59, (A) and 0.4% PE-gluten pH 2.24, in 0.01 NHC1 from m to 300 mp.
negative [a],,, and k values. While CN-gluten has no a-helix, PE-gluten still has 5% leftm BSA has an [a],,, of -86", h, of 238, a d 29% a-helix. While CN-BSA and PB-BSA have greatly reduced a-helix contents and A,, no large change occurs il 60&],,, and k values.
The far U.V., O.R.D., and C.D. of PE-gluten and PE-BSA were also studied from 260 to 2B3Bmp. The O.R.D. of PE-BSA showed a shallow minimum or shoulder at 225-230 mp with specific rotation of -4500" to -4600" and a moderately sharp minimum at 208 mp with specific rotation of - 5888". The O.R.D. of PE-gluten had a minimum at 210 mp with specific rotation of -5400" and possibly a shoulder near 230 my of specific rotation sf -3300". The specific rotation at 233 my is -4400" for PGBSA and -3300" for PE- gluten. The C.D. spectra of both PE-BSA and PE-gluten showed no special feature other than a more negative value with decreasing wavelength from 250 to 200 mp. Both 0.W.D. and C.D. were negative in this iegion, Mean residue ellipticities of PE-gluten and PE-BSA are -4200" and -4000" at 222 mp. The a-helical content can also be estimated by - ( [ m f + 2000)/
Can
. J. B
ioch
em. D
ownl
oade
d fr
om w
ww
.nrc
rese
arch
pres
s.co
m b
y U
NIV
ER
SIT
Y O
F M
ICH
IGA
N o
n 11
/10/
14Fo
r pe
rson
al u
se o
nly.

13 000 where [mqIz,, is the reduced mean residue rotation at 233 mp (1 1) and by -([@],,, -k 29UO)/38 000 where [@I2,, is the mean residue ellipticity at 222 mp (12). The a-helix content from the average of far U.V., O.R.D., and C.D. data is 10% for PE-BSA and 5% for PE-gluten. The a-helical values from these data are con- sidered to be less accurate than those from Moffitt b, values.
Discussion O.R.D. of PEC depends on pH, solvent, and
concentration (Fig. 3). The crossover point (zero optical rotation) of the 2.1% solution, pH 1.52, is near 400 mp, whereas that of the pH 5.04 solution is 330 rnp. These minima are quite broad and probably are related to the weak shoulder around 370 mp in the U.V. spectra of PEC shown in Table I . The effect of ionic strength on the O.R.D. of PEC was studied by adding 8.1 M and 1 M KC1 to 2.1% solution of pH 1.52 and then comparing with the same solution without added KCl. Since no significant difference in O.R.D. of PEC was found for the two solutions that differ greatly in ionic strengths, electrostatic effect (+ or - charges on PEC) does not aiTect O.R.D. at a fixed pH value. Since the charge on a PEC moIwu%e depends on pH and since the PEC charge may influence the symmetry or environment of the molecule, pH dependence sf O.R.D. may arise from the dif- ference in charges on PEC. The pH dependence of the O.R.D. between pH 1.5 and 5 for 2% PEC solution is likely related to the ionization of the carboxyl group which titrates in this pH region. The concentration dependence of O.R.D. may arise from hydrophobic and hydrogen bonding because electrostatic effect at a fixed pH value is not significant, but both urea and sodium lauryl sulfate influence the O.R.D. curve sf PEC.
The similarity of the U.V. spectra of gluten and CN-gluten is not surprising because no new chromophsre is introduced in CN-gluten in the wavelength range recorded in Table 1 . The large difference in U.V. spectra between gluten and PE-gluten results from a new chromsphore (pyridylethyl) group introduced in PE-gluten. The strong maximum of PEC at 254 mp not only increases the magnitude of gluten maximum at 276 mp, but also changes the shape and magni- tude of the U.V. spectrum of gluten below 276 my. The change in U.V. spectrum from BSA
to PE-BSA is more drastic compared with the difference between gluten and PE-gluten; there are three times as many half-cystine residues in BSA as compared with gluten per lQ5 g protein and, therefore, three times as many PEC groups in BSA (3).
The I.R. absorption band of proteins in Table 2 can be compared with those proteins of known conformations in D,O. Timasheff et al. (13) reported that the prominent amide 1 frequencies of proteins in D,O for a-helix, unordered, and p-structures are 1650, 1643, and 1432 cm- I,
respectively. The observed maximum frequencies for proteins in Table 2 indicate the presence of a-helix and unordered structures. The absence of any peak or shoulder at or near 1632 cm-I indicates that b-structure is not present in any significant amount in gluten, BSA, and their derivatives. Therefore, the O.R.D. data on the proteins can be analyzed by the Moffitt equation to get the a-helix content.
The question arises whether any possible con- tribution of PE-chromophore on PE-proteins will influence the a-helix calculation from Mofitt plot in 600-300 mp range. Since the O.R.B. data above 300 mp for PE-BSA and PE-gluten can be represented by good straight lines in Fig. 4, and the a. and bbO values of PE-BSA and PE- gluten in Table 3 are not much diEerent from those of CN-BSA and CN-gluten, respectively, where no PE-chromophore is present, any possible contribution of PE-chrornophore on the a-helix calculation from 600 to 300 my is not significant. The absence sf a significant con- tribution of PE-chromophore above 3W my in the O.R.B. of PE-proteins suggests that there are no significant optically active transitions due to PE-chromophores in PE-proteins in the far U.V. range, because the O.R.D. of proteins above 308 mp is due primarily to optically active transitions in the 190-230 mp region. O.R.B. curves of PE-gluten and PE-BSA between 340 and 240 mp showed no Cotton eBect, and good Moffitt and Drude plots were also obtained in this region. These O.R.D. data in the 340- 240 mp range suggest that the PE-chromophore are not optically active around the 250 mp ab- sorption band. The O.R.D. minimum of PE- BSA and PE-gluten at 208-210 mp probably is due to the 205 mp minimum of unorderd structure, and the shallow minimum of PE-BSA at 225-230 mp is likely a result of the small
Can
. J. B
ioch
em. D
ownl
oade
d fr
om w
ww
.nrc
rese
arch
pres
s.co
m b
y U
NIV
ER
SIT
Y O
F M
ICH
IGA
N o
n 11
/10/
14Fo
r pe
rson
al u
se o
nly.

amount of a-helix, the 6.R.D. minimum of which is at 233 mp. The O.R.D. and C . in the 270-195 mp range suggest the absence of
c d activity of the PE-chromophore in and PE-gluten, because the same a- ntents were obtained from 600 to
and from far U.V. data. ptical rotatory pr
proteins in the literature can those in Table 3. Gluten has 15% a-helix at
2.24 and 21% at pH 4.0 (6). Since gluten has a higher number of positive charges at pH 2.24 than at pH 4.0, electrostatic positive charges at the lower account for the lower a-hel
out equal weights of glutenin and ince both CN-gluten and gliadin
mercaptoethanol and alkylated with acqlonitrile (CN-gliadin) (14) have no a-helix, CN-glutenin will have no a-helix either.
SA has 49% a-helix (15) at pH 5.4 but t -helix content drops to 33% (16) at pH 2.
and to 8% in 88% formic acid $1'7). Our value sf 29% a-helix for SA at pH 2.56 is in reasonable agreement with the litera optical rotatory properties bonds broken were reps investigators. In S-carbo there is 14% a-helix (1 8) and oxidized pH 9 has essentially n
Although no 6.R.D. measurement was available for the reoxidized- ed glutenin, it seems reasonable to conc at wheat gluten can
e successfully restored to the native rmation by reoxidation of the disulfide
The loss of a-helix in C indicates that there is not enough interac structure left to support a- ix in gluten with &sulfide bonds broken at 2.2, because ex- posure of gluten to 6 M urea (during reduction of disulfide bonds) did not influence a-helix content of reoxidized gluten, Gluten has relatively low a-helix content at pH 2.2 and has 17.5 hdf- cystines per 105 g (3) a-helical content at pH per l obg . Since paramy form of a-helix (21) Q22), there is no pos a-helix and halficystine content of
are capable of interacting with others may contribute to the stability of even after the disulfide bonds
Since the pyridine ring is both and hydrophilic, its possible use as a csn-
here.
to stabilize its relatively low a-helix content but
that reduced-alkylate considerable amount presumably structural order. Also, the descr
Can
. J. B
ioch
em. D
ownl
oade
d fr
om w
ww
.nrc
rese
arch
pres
s.co
m b
y U
NIV
ER
SIT
Y O
F M
ICH
IGA
N o
n 11
/10/
14Fo
r pe
rson
al u
se o
nly.

approach may make it possible to differentiate between contributions of disulfide bonds and other forces to the tertiary structure sf proteins.
We also noted a strong effect of solute con- centration, solvent, and pH on the optical rotation of pyridylethylcystei~le. This observa- tion may be evidence of a tendency of the pyridyl groups toward parallel alignment, analogous to the recognized effects of base-stacking in nucleic acids.
We thank Mrs. C. E. McGrew for micro-Kjeldahl nitrogen analyses.
1. C A V ~ S , J. F., and FNEDMAN, M.: Anal. Biochem. 35, 489 (1 9769).
2. FRIEDMAN, hd., %(RWLL, E. H., and CAVINS, 9. P.: J. Biol. Chern. 2.445, 3868 (1970).
3. F ~ D ~ N , M., and KRULL, L. M. : Biwhem. Biophys. Res. Cornrnun. 37, 630 (1 969).
4. JONES, W. W., TAYLOR, N. W., and SENTI, F. R.: Arch. Biochem. Biophys. 84, 363 (1959).
5. G L A ~ E , P. K., and LONG, F. A.: J. Phys. Chem. 64,188 (1960).
6. Ww, Y. V., and CLUSKBY, P. E.: Arch. Biochern. Biophys. 112, 32 (1965).
7. M o ~ n r r , W.: J, Chern. Phys. 25,467 (1956). 8. M o F ~ , W., and YANG, 9. T.: ROC. Nat. A a d .
%i. U.S. 42, 596 (1 956)e 9. CASIM, J. Y., and TAYLOR, E. W.: Biophys. J. 5,
553 (1965). 169. YANG, J. T., and D o n , I?. M.: J. Am. Chem. Ssc.
79, 761 (1957).
11. YANG, J. T. : In Poly-a-amins acids. Mifed by Fasman, G. D. Dekker, New York. 1967. p. 266.
12. HASHIZUMB, H., SHIWAKI, M., and IMAHORI, K.: J. Biochem. Tokyo, 62, 543 (1967).
13. T~ASHEFF, S. N., SUSB, HI., TOWNEND, R., STEVENS, E., GORBUNOFF, M. J., and KUMOS~SKI, T. P.: In Conformation of biopolyrners. Vol. 1. Edited by Ramachandran, G. N. Academic Press, Pnc., New York. 1967. p. 182.
14. BECKWITH, A. C., WALL, J. S., and JORDAN, R. W.: Arch. Biochem. Fiophys. 812, 16 (1965).
15. H~ws~svms, T. T., and MESCANTK, L.: J. Biol. Chern. 2-40, 639 (1965).
86. LEONARD, W. J., JR., and FOSTER, J. F.: J. Bid. Chem. 236, 2662 (1961).
17. MARSH, M. M. : J. Am. Chem. Soc. 84,1896 (1962). 18. HARRAP, B. S., and W m ~ s , E. F. : Biogolymers, 3,
595 (1965). 19. STAUFF, J., and JAENICKE, R.: K(4lIoid-23. 1875, 1
(8968). 20. BECKWITH, A. C,, and WALL, J. S: Biwhim. Biophys.
Acta, 130, 155 (1966). 21. RIDDI~WD, L. M., and SCHEWAGA, H. A.: Bio-
chemistry, 1, 108 (1 962). 22. SZENT-GY~WGYI, A. G., BENESCH, R. E., and
Bsrassca, R. : In Sulfur in proteins. Editedby Hjenesch, R., knesch, R. E., Boyer, P. D., Wotz, 1. M., Middkbrook, W. W., Szent-Gy6rgyi9 A. G., and Schwarz, B. R. Academic Press, Pne., New York. 1959. p. 291.
23. SCATCHARD, G., Wu, Y. V., and SHEN, A. L.: J. Am. Chern. Soc. 81,6104 (1959).
24. DOWBEN, R. M., and KOEHLER, W. R.: Arch. Biochem. Biophys. 93,496 (1961).
Can
. J. B
ioch
em. D
ownl
oade
d fr
om w
ww
.nrc
rese
arch
pres
s.co
m b
y U
NIV
ER
SIT
Y O
F M
ICH
IGA
N o
n 11
/10/
14Fo
r pe
rson
al u
se o
nly.