An Efficient Design Procedure to Implement the Fractional ...

Laboratory Procedure Manual
Analyte: Urinary Albumin Matrix: Urine
Method: Sequoia-Turner Digital Fluorometer, Model 450
Method No.: Revised: Revised July 2000 as performed by: University of Minnesota
Contact: Important Information for Users The University of Minnesota Laboratory periodically refines these laboratory methods. It is the responsibility of the user to contact the person listed on the title page of each write-up before using the analytical method to find out whether any changes have been made and what revisions, if any, have been incorporated.
Albumin in Urine NHANES 2007-2008
page 2 of 21
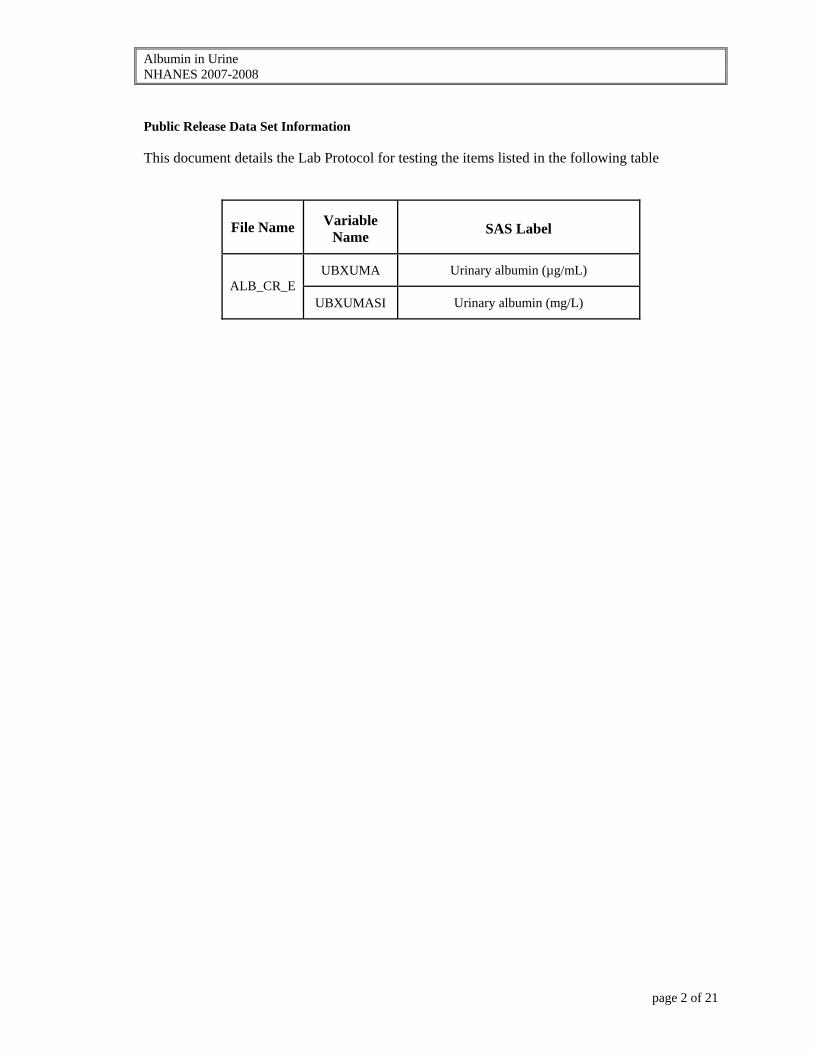
Public Release Data Set Information This document details the Lab Protocol for testing the items listed in the following table
File Name Variable Name SAS Label
UBXUMA Urinary albumin (µg/mL) ALB_CR_E
UBXUMASI Urinary albumin (mg/L)
Albumin in Urine NHANES 2007-2008
page 3 of 21
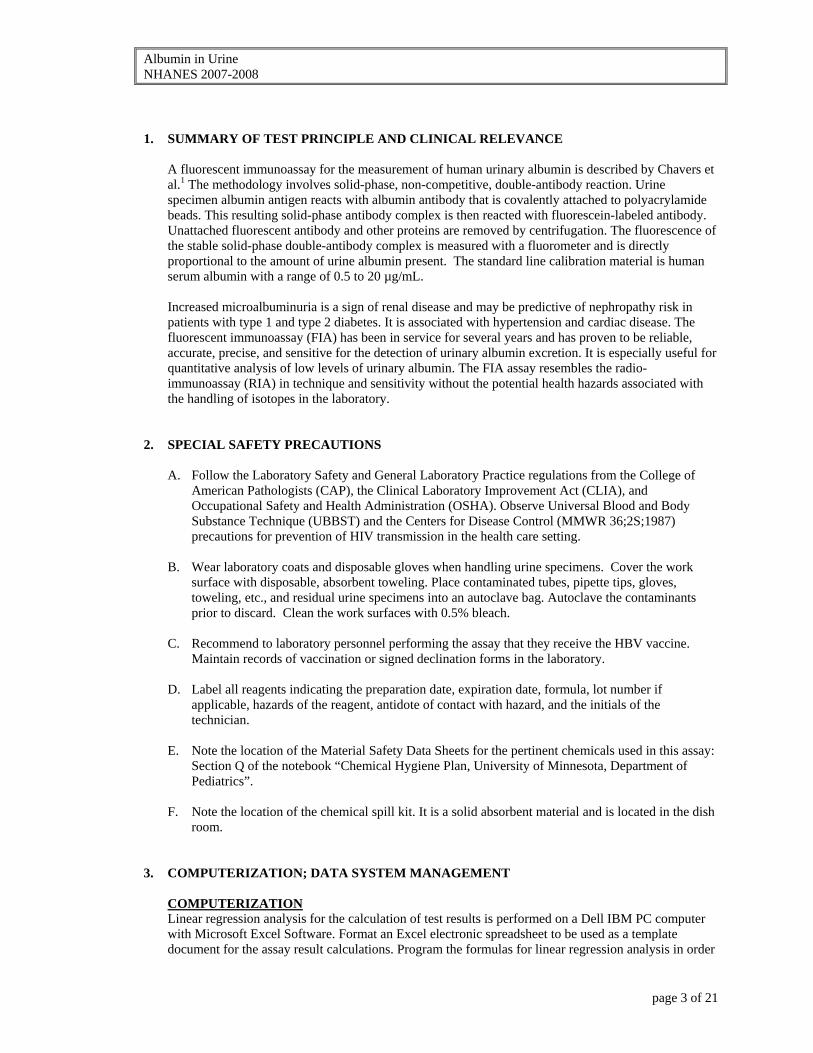
1. SUMMARY OF TEST PRINCIPLE AND CLINICAL RELEVANCE
A fluorescent immunoassay for the measurement of human urinary albumin is described by Chavers et al.1 The methodology involves solid-phase, non-competitive, double-antibody reaction. Urine specimen albumin antigen reacts with albumin antibody that is covalently attached to polyacrylamide beads. This resulting solid-phase antibody complex is then reacted with fluorescein-labeled antibody. Unattached fluorescent antibody and other proteins are removed by centrifugation. The fluorescence of the stable solid-phase double-antibody complex is measured with a fluorometer and is directly proportional to the amount of urine albumin present. The standard line calibration material is human serum albumin with a range of 0.5 to 20 µg/mL. Increased microalbuminuria is a sign of renal disease and may be predictive of nephropathy risk in patients with type 1 and type 2 diabetes. It is associated with hypertension and cardiac disease. The fluorescent immunoassay (FIA) has been in service for several years and has proven to be reliable, accurate, precise, and sensitive for the detection of urinary albumin excretion. It is especially useful for quantitative analysis of low levels of urinary albumin. The FIA assay resembles the radio-immunoassay (RIA) in technique and sensitivity without the potential health hazards associated with the handling of isotopes in the laboratory.
2. SPECIAL SAFETY PRECAUTIONS
A. Follow the Laboratory Safety and General Laboratory Practice regulations from the College of American Pathologists (CAP), the Clinical Laboratory Improvement Act (CLIA), and Occupational Safety and Health Administration (OSHA). Observe Universal Blood and Body Substance Technique (UBBST) and the Centers for Disease Control (MMWR 36;2S;1987) precautions for prevention of HIV transmission in the health care setting.
B. Wear laboratory coats and disposable gloves when handling urine specimens. Cover the work
surface with disposable, absorbent toweling. Place contaminated tubes, pipette tips, gloves, toweling, etc., and residual urine specimens into an autoclave bag. Autoclave the contaminants prior to discard. Clean the work surfaces with 0.5% bleach.
C. Recommend to laboratory personnel performing the assay that they receive the HBV vaccine.
Maintain records of vaccination or signed declination forms in the laboratory.
D. Label all reagents indicating the preparation date, expiration date, formula, lot number if applicable, hazards of the reagent, antidote of contact with hazard, and the initials of the technician.
E. Note the location of the Material Safety Data Sheets for the pertinent chemicals used in this assay:
Section Q of the notebook “Chemical Hygiene Plan, University of Minnesota, Department of Pediatrics”.
F. Note the location of the chemical spill kit. It is a solid absorbent material and is located in the dish
room. 3. COMPUTERIZATION; DATA SYSTEM MANAGEMENT
COMPUTERIZATION Linear regression analysis for the calculation of test results is performed on a Dell IBM PC computer with Microsoft Excel Software. Format an Excel electronic spreadsheet to be used as a template document for the assay result calculations. Program the formulas for linear regression analysis in order

Albumin in Urine NHANES 2007-2008
page 4 of 21
to perform a fill-down of calculations for the unknown specimen values. On this document include sample identification information, (urine collection time and volume, if applicable), the specimen Albustix value, the dilution factor, the duplicate percent relative fluorescence (% RF) values, the specimen values converted to µg/mL, and the calculated total µg/mL albumin concentration. Prepare a spreadsheet from the template for each assay.
INFORMATION SECURITY SYSTEM University computer firewall and password protection are established at startup. All programs and files are backed up monthly to prevent loss due to alteration or destruction. System passwords are used to limit computer access to authorized users. Access codes are never posted and must be memorized and are altered with changes in personnel. University Information Technology policies regarding privacy and security and e-mail are followed. The laboratory reports are verified against hardcopy before results are reported electronically. The laboratory personnel have received HIPPA training. The medical director has approved the content and format of computer-generated reports. DATA SYSTEM MANAGEMENT The integrity of the specimen data is established by routine verification of the transcribed information against the identification on the specimen tube and the hard copy that accompanies all specimens. Urine albumin results with pertinent specimen information are reviewed by the laboratory supervisor and are returned by hard copy or electronic transmission as per study protocols. (For the NHANES IV, results are returned by e-mail onto formatted worksheets that were transmitted to us by the NHANES contract laboratory, Westat). The data is stored on the computer hard drive and backed-up monthly onto zip disks. The hard copies are organized in notebooks. Worksheets and results are archived indefinitely and located in the laboratory. All sample person values are linked to analytic batch and date of analysis, QC, lot numbers and expiration dates of reagents.
4. SPECIMEN COLLECTION, STORAGE, AND HANDLING PROCEDURES; CRITERIA FOR SPECIMEN REJECTION SPECIMEN COLLECTION PROCEDURE A. Timed or random urine collections are obtained from study subjects as per study protocols. (For
the NHANES IV, random urine specimens are collected at the survey mobile examination centers.)
B. No special instructions such as fasting or special diets are requested.
C. The optimum specimen tube is a 3- to 5-mL screw-top cryogenic vial. Tubes are selected per study
protocols.
D. The optimum sample volume is 3 mL, and the minimum acceptable volume is 1 mL.
E. Design study protocols to ensure consistent specimen collection procedures for the variables that affect urine albumin excretion (such as exercise, time of day, water loading, and posture).
SPECIMEN STORAGE PROCEDURE A. Urine specimens arrive frozen (on dry ice) or fresh (2-8 °C) as per study protocols. (For the
NHANES IV, specimens are shipped on dry ice by overnight courier and stored at -70 °C upon arrival.) Frozen specimens are thawed for analysis at refrigeration temperature (2-8 °C) and remain at refrigeration temperature up to 3 weeks until analyses are complete.
B. Analyzed specimens are returned to frozen storage (-20 °C or -70 °C) or discarded as per study
protocols. Specimen stability at -20 °C for at least 1 year has been documented. (For the NHANES IV, specimens are returned to -70 °C freezers after analysis. Specimens are shipped on dry ice by overnight courier to the storage facility, McKesson Bioservices, Rockville, MD as requested).
Albumin in Urine NHANES 2007-2008
page 5 of 21
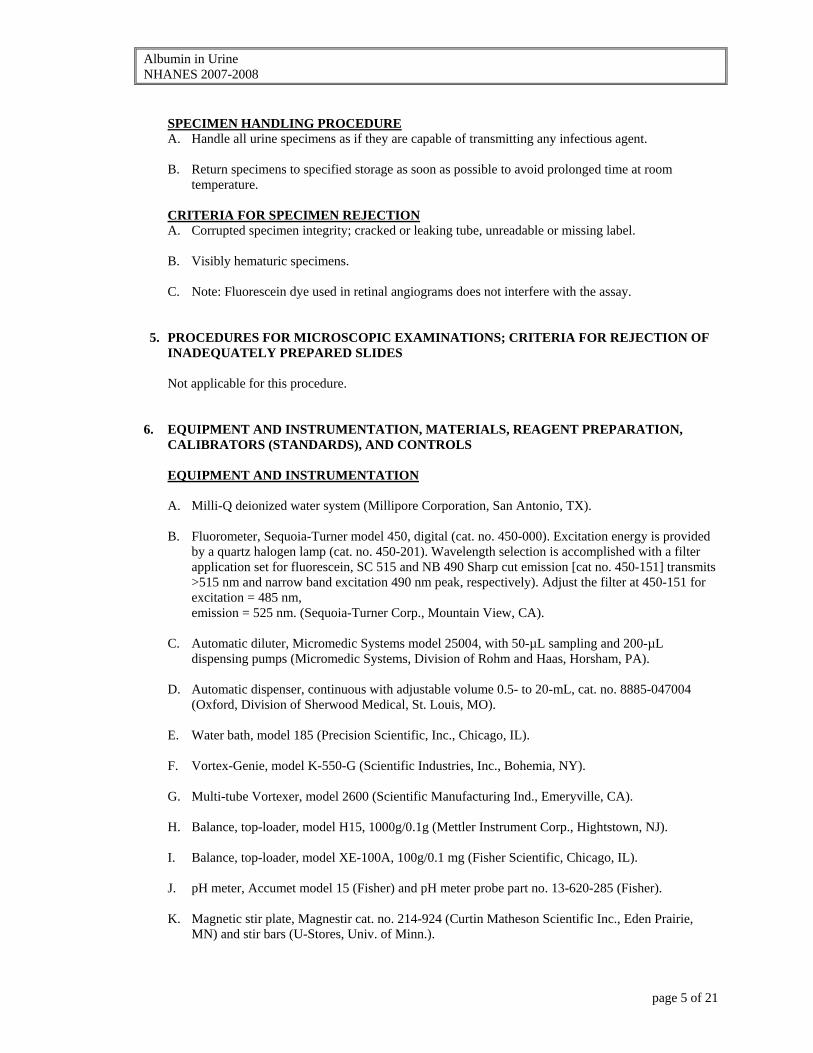
SPECIMEN HANDLING PROCEDURE A. Handle all urine specimens as if they are capable of transmitting any infectious agent.
B. Return specimens to specified storage as soon as possible to avoid prolonged time at room
temperature.
CRITERIA FOR SPECIMEN REJECTION A. Corrupted specimen integrity; cracked or leaking tube, unreadable or missing label.
B. Visibly hematuric specimens.
C. Note: Fluorescein dye used in retinal angiograms does not interfere with the assay.
5. PROCEDURES FOR MICROSCOPIC EXAMINATIONS; CRITERIA FOR REJECTION OF
INADEQUATELY PREPARED SLIDES
Not applicable for this procedure. 6. EQUIPMENT AND INSTRUMENTATION, MATERIALS, REAGENT PREPARATION,
CALIBRATORS (STANDARDS), AND CONTROLS
EQUIPMENT AND INSTRUMENTATION A. Milli-Q deionized water system (Millipore Corporation, San Antonio, TX). B. Fluorometer, Sequoia-Turner model 450, digital (cat. no. 450-000). Excitation energy is provided
by a quartz halogen lamp (cat. no. 450-201). Wavelength selection is accomplished with a filter application set for fluorescein, SC 515 and NB 490 Sharp cut emission [cat no. 450-151] transmits >515 nm and narrow band excitation 490 nm peak, respectively). Adjust the filter at 450-151 for excitation = 485 nm,
emission = 525 nm. (Sequoia-Turner Corp., Mountain View, CA).
C. Automatic diluter, Micromedic Systems model 25004, with 50-µL sampling and 200-µL dispensing pumps (Micromedic Systems, Division of Rohm and Haas, Horsham, PA).
D. Automatic dispenser, continuous with adjustable volume 0.5- to 20-mL, cat. no. 8885-047004
(Oxford, Division of Sherwood Medical, St. Louis, MO). E. Water bath, model 185 (Precision Scientific, Inc., Chicago, IL). F. Vortex-Genie, model K-550-G (Scientific Industries, Inc., Bohemia, NY). G. Multi-tube Vortexer, model 2600 (Scientific Manufacturing Ind., Emeryville, CA). H. Balance, top-loader, model H15, 1000g/0.1g (Mettler Instrument Corp., Hightstown, NJ). I. Balance, top-loader, model XE-100A, 100g/0.1 mg (Fisher Scientific, Chicago, IL). J. pH meter, Accumet model 15 (Fisher) and pH meter probe part no. 13-620-285 (Fisher). K. Magnetic stir plate, Magnestir cat. no. 214-924 (Curtin Matheson Scientific Inc., Eden Prairie,
MN) and stir bars (U-Stores, Univ. of Minn.).
Albumin in Urine NHANES 2007-2008
page 6 of 21
L. Micro-centrifuge, model 235C (Fisher). M. Centrifuge, IEC model UV, with swinging buckets to hold 12- X 75- mm tubes (International
Equipment Co., Boston, MA). N. Centrifuge, Beckman Avanti J-25, with JLA-16.250 fixed-angle rotor and six 250-mL centrifuge
bottles, clear polycarbonate, part no. 356-013 (Beckman Instruments, Palo Alto, CA). O. Autoclave, isothermal, Eagle series 2022 (AMSCO Scientific, Apex, NC). P. Micro-pipette, 0.5- to 10-μL, Oxford P-7000 series (Oxford) and Fisher Oxford-style tips, cat no. 21-197-2F (Fisher). Q. Pipette, 20-µL, Eppendorf (Brinkman Instruments Inc., Westbury, NY) and CLP-2000 universal
tip, 200 μL, (Continental Lab Products, San Diego, CA). R. Pipetman, Gilson, P-100 and P-200 adjustable (Rainin Instrument Co., Inc., Woburn, MA) and
CLP-2000 universal tip, 200 μL (Continental Lab Products). S. Pipetman, Gilson, P-1000 adjustable (Rainin) and tips 100- to 1000-µL (Rainin). T. Pipetman, Gilson, P-5000 adjustable (Rainin) and tips 500- to 5000-µL (Rainin). U. Repeater pipettor, Eppendorf, cat. no. P-3880-1 (Fisher) and Combitips sizes 500-µl and 2.5-mL
(Brinkman). V. Calculator, model TI-30Xa Solar, and operator’s manual (Texas Instruments, Dallas, TX). W. Dell IBM PC compatible platform computer, Dell Dimension XPS, R400 Pentium II (Dell
Computer Corporation, Round Rock, TX) and manufacturer's operating manuals (EPS Technologies, Jefferson, SD). Computer printer, HP DeskJet 722C (Hewlett-Packard Company, Palo Alto, CA).
MATERIALS A. Type 1 water, deionized and distilled, Milli-Q (Millipore). B. Type 2 water, distilled, 6 gallons (Kandiyohi Bottled Water Co., Willmar, MN). C. Hydrochloric acid, HCl, F.W. 36.46, A.C.S. grade (EM Science, Gibbstown, NJ). Store in acid
cabinet at D. 20-25 °C up to 2 years. HAZARD: Caustic and poisonous. E. Potassium hydroxide, KOH, F.W. 56.11, A.C.S. grade (EM Science). Store at 20-25 °C up to 5
years. HAZARD: Caustic and poisonous. F. Potassium phosphate monobasic, KH2PO4, F.W. 136.09, A.C.S. grade (Mallinckrodt, Paris, KY).
Store at G. 20-25 °C up to 5 years. H. Sodium chloride, NaCl, F.W. 58.44 , A.C.S. grade (Fisher). Store at 20-25 °C up to 5 years. I. Sodium azide, NaN3, F.W. 65.02, Laboratory grade (Sigma, St. Louis, MO). Store at 20-25 °C up
to 5 years. CAUTION: Toxic. Wear safety goggles, mask, and gloves when handling the dry powder.
Albumin in Urine NHANES 2007-2008
page 7 of 21
J. Ovalbumin, chicken egg albumin, average F.W. 42,699, grade V, cat. no. A-5503 (Sigma). Store
at 2-8 °C, with desiccant according to the package expiration date. CAUTION: Dust hazard. Wear mask.
K. Activated immunobead matrix (“beads”), 200-mg vial lyophilized polyacrylamide beads with
phosphate buffer salts, cat. no. 15391 (Irvine Scientific, Santa Ana, CA). Store at 2-8 °C up to 5 years.
L. Goat anti-human albumin (“GAHA”), IgG fraction, 5-mL vial of 40-50 mg lyophilized antibody
protein per vial, cat. no. 55028 (ICN Biomedical, Inc., Costa Mesa, CA). Store at -70 °C up to 5 years.
M. 1-ethyl-3-(3-dimethyl-aminopropyl) carbodiimide HCl (“EDAC”), M.W. 191.7, cat. no. E-6383,
protein sequencing grade (Sigma). Allow for complete return to 20-25 °C before opening to avoid condensation. Store at -70 °C with desiccant up to 5 years. CAUTION: Toxic. Wear safety goggles, mask and gloves when handling the dry powder.
N. Fluorescein-conjugated goat anti-human albumin (“Fl-GAHA”), IgG fraction, cat. no. 55162
(ICN). Store at -70 °C protected from light up to 5 years. O. Dialysis tubing, Spectra-Por molecularporous membrane, reorder no. 132678, 2.0 mL/cm, 12-
14,000 MWCO. (Spectrum Medical Industries, Los Angeles, CA). Store at 2-8 °C. P. Urine specimen tubes: 3.5-mL cryogenic storage vials, cat. no. 223-9835, for most urine specimen
protocols and for storage of aliquots of Fl-GAHA (Bio-Rad Laboratories, Richmond, CA) (For the NHANES IV: 5-mL Nalge cryogenic storage vials, Fisher part no. 03-337-7H, (Fisher Scientific Co., Hanover Park, IL).)
Q. Micro-centrifuge tube, 0.65-mL, siliconized, colors, cat. no. C3259 (Intermountain Scientific,
Bountiful, UT). R. Micro-centrifuge tube, 1.5-mL, cat. no. 72-690 (Sarstedt, Inc., Princeton, NJ). S. Glass test tubes, borosilicate, sizes 12- X 75-mm and 16- X 100-mm, (Kimble Co, Toledo, OH). T. Micro-filters, external filter tips, 45-µm polyethylene, cat. no. OFT 2002-45M (Labsciences,
Reno, NV). U. Filterware, Nalgene, 0.2-µm, sterile, 115-mL, disposable (Nalge Nunc International). V. Albustix test strips, cat. no. 2191 (Bayer Corporation, Diagnostics Division, Elkhart, IN). Follow
the package insert for explicit directions for use. Store at 20-25 °C according to package instructions and expiration date.
W. General laboratory supplies: gloves, lab coats, safety glasses, 5% bleach, 99% isopropyl alcohol,
autoclave bags, disposable absorbent bench-top toweling, transfer pipettes, weighing boats, parafilm, pH meter solutions,
X. four 100-mL wide-mouth Nalgene bottles for immunobead storage, eight 4-L wide-mouth Nalgene bottles for solution storage, graduated cylinders, two 500-mL beakers, one 50-mL volumetric flask (U-Stores).
Y. Human serum albumin (“HSA”), cat. no. A-8763 (Sigma), approximately 99% pure by agarose
electrophoresis, essentially globulin-free, derived from Sigma cat. no. A-1653 Cohn Fraction V.
Albumin in Urine NHANES 2007-2008
page 8 of 21
Store with desiccant at 2-8 °C according to the product expiration date. CAUTION: Handle as if capable of transmitting infectious agents.
Z. CAP Urine Protein Reference Material, human albumin Cohn Fraction V (College of American Pathologists, Skokie, IL). Store according to product directions. CAUTION: Handle as if capable of transmitting infectious agents
REAGENT PREPARATION A. Sterile distilled water
B. Filter the Type 1 or the Type 2 (depending on procedure) distilled water through sterile, 115-mL,
0.2-µm, disposable Nalgene Filterware under vacuum. Discard unused water. C. 1 mol/L HCl (pH adjusting solution) Dilute 8.3 mL in 100 mL Type 2 water and mix well. Store at 20-25 °C up to 1 year. CAUTION: Prepare in safety hood. Wear safety glasses and gloves. Add acid to water. D. 5 mol/L KOH (pH adjusting solution) Dissolve 70.1 g KOH in 250 mL Type 2 water and mix well. Store at 20-25 °C up to 1 year. CAUTION: Prepare in safety hood. E. 0.3 mol/L KH2PO4 stock solution Dissolve 40.8 g of KH2PO4 in 1 L of Type 2 water and mix well. Store at 20-25 °C up to 1 year. F. 0.003 mol/L KH2PO4 (dialysis buffer for immunobead coupling)
Dilute 20 mL of 0.3 mol/L KH2PO4 to 2 L with Type 2 water and mix well. Adjust the pH to 6.3 with 5 mol/L KOH. Prepare the day before use and store at 2-8 °C overnight. Use cold. Discard after use.
G. Phosphate buffered saline stock solution concentrated (20X PBS) Dissolve 175.4 g NaCl and 2 g NaN3 in 666 mL of 0.3 mol/L KH2PO4. Dilute to l L with Type 2 water and mix well. Store at 20-25 °C up to 1 year.
WARNING: NaN3 is toxic and may react explosively with lead and copper plumbing. H. Physiological phosphate buffered saline (1X PBS)
Dilute 200 mL of 20X PBS to 4 L with Type 2 water and mix well. Adjust pH to 7.2 with 5 mol/L KOH. The final concentration is 0.01 mol/L KH2PO4, 0.15 mol/L NaCl, 0.015 mmol/L NaN3. Prepare 4L for assay performance and prepare 12 L for the immunobead coupling procedure. Use cold. Store at 2-8 °C up to
3 weeks. I. 1.4 mol/L NaCl in PBS (NaCl-PBS)
Dissolve 245.5 g NaCl in 3 L PBS for immunobead coupling preparation. Mix well. Prepare the day before use and store at 2-8 °C overnight. Use cold and discard unused solution.
J. Ovalbumin in physiological phosphate buffered saline (oval/PBS) Dissolve 0.5 g ovalbumin in 100 mL PBS and filter through 0.2-µm sterile Nalgene Filterware. Store in this filter unit at 2-8 °C up to 3 weeks. K. Immunobeads: beads coupled to goat anti-human albumin, a two-day procedure
Day 1:
Prepare 400 mL. Do not prepare more than a 3-month supply. For an estimated 4,000 specimens per year prepare four grams (400 mL) of immunobeads on a quarterly basis. The final
Albumin in Urine NHANES 2007-2008
page 9 of 21
concentration of the immunobeads is 10 mg/mL in oval/PBS with 0.15 mmol/L NaN3. (This procedure is adapted from the Bio-Rad package insert6.) 1. Reconstitute each of four vials of GAHA with 5 mL of sterile Type 2 water and incubate at
2-8 °C for 1 hour. Combine the vials into approximately 25 cm of dialysis tubing and use an additional
2. 2 mL of sterile Type 2 water to rinse the vials. Dialyze against 2 L of 0.003 mol/L KH2PO4, pH 6.3, for 4 hours at 2-8 °C.
3. Reconstitute 4 grams (twenty 200-mg vials) of lyophilized beads in a 500-mL beaker with 400
mL sterile 4. Type 2 water. Adjust the pH to 6.3 with 1 mol/L HCl as needed. Cover and incubate at 2-8 °C
for 1 hour. 5. Add dialyzed GAHA to the beads, adjust the pH to 6.3 with 1 mol/L HCl or 5 mol/L KOH as
needed and incubate at 2-8 °C for 1 hour. The final concentration is 40- to 50-mg of antibody protein per 1 gram of beads.
6. Perform the bead coupling procedure: Set the pH meter probe in the solution, stirring. Have
ready the pH solutions 1 mol/L HCL and 5 mol/L KOH. Quickly add 800 mg of EDAC while stirring. The pH will oscillate rapidly. Use the pH solutions as needed to maintain the pH at 6.3 for 30 min during this equilibration process. Initially, 1 mol/L HCl will be required to maintain pH 6.3. After 30 minutes the pH will stabilize.
7. Divide the immunobeads equally into each of six 250-mL centrifuge bottles. Incubate at 2-8 °C
overnight. 8. Prepare the Beckman Avanti J-25 centrifuge. Insert the JLA-16.250 rotor, set the temperature
at 4 °C, and allow the centrifuge to cool overnight. Prepare the immunobead washing buffers (12 L of PBS and 3 L of 1.4 mol/L NaCl-PBS) and store at 2-8 °C overnight. Continue the procedure the following day.
Day 2: Perform six washing procedures with cold buffers and centrifuge set at 4 °C. For each wash, fill the bottle with buffer, centrifuge at 2900 rpm (2000 x g) for 8 minutes with the brake set on high, decant, blot, and resuspend the immunobeads with a small volume of the next wash solution with a gentle rolling motion. Perform the wash procedure 2 times with PBS and then wash 2 times with 1.4 mol/L NaCl-PBS. Wash 2 times more with PBS. Resuspend the contents of each bottle with 100 mL of PBS and incubate at 2-8 °C for 3 hours. Fill the bottle with PBS and do a final centrifugation. Decant.
L. Resuspend the contents of each bottle with a small volume of oval/PBS. Combine and adjust the
total volume to 400 mL in a 500-mL beaker. Add 0.4 g of NaN3. Divide into four 100-mL portions in the 100 mL Nalgene bottles. Store at 2-8 °C for 3 months, never allow beads to freeze.
M. Fl-GAHA stock solution
Reconstitute each vial of lyophilized product with 2 mL of sterile Type 2 water. Combine all vials together and place them at 2-8 °C, protected from light, for 1 hour. Aliquot 0.4 mL into 3.5-mL cryogenic storage vials (Bio-Rad). Use the repeater pipette 2 times set on #4 with the 2.5-mL Combitip to deliver 0.4 mL. Store the vials at -20 °C protected from light up to 2 years.
N. Fl-GAHA working solution
Prepare a 1:10 dilution. Add 3.6 mL of oval/PBS to the cryogenic vial containing the 0.4-mL aliquot of Fl-GAHA stock solution (or other proportions as determined by the limiting curve data, see below). Before use on each assay day, use the IEC centrifuge at 2100 rpm (1000 x g) for 5 min
Albumin in Urine NHANES 2007-2008
page 10 of 21
to remove cryo-precipitates. Transfer the supernatant to a 16- X 100-mm tube and leave the supernatant in a light-protected container at room temperature until use. Return the excess to a light-protected container. Store at 2-8 °C up to 1 month.
O. Test new lots of Fl-GAHA to determine the optimum concentration to use when the fluorescein/protein ratio (F/P) varies. Plot a limiting curve: assay the “20 µg/mL HSA” from the standard line preparation against serial dilutions of Fl-GAHA and graph the data. Select a dilution that is 2 times the concentration at the point (or “limit”) where the graph detours from a straight line and begins to plateau.
CALIBRATORS (STANDARDS) Standard line calibration material: human serum albumin (HSA) Prepare frozen aliquots of a 1mg/mL solution of HSA in order to thaw and use one for every assay. Weigh 50 mg of lyophilized HSA on a balance of 0.1 mg sensitivity and dissolve in 50 mL of sterile Type 1 (Milli-Q) water using a 50-mL volumetric flask. Pipette 0.4 mL into 0.65-mL micro-centrifuge tubes. Use the repeater pipette 2 times set on #4 with the 2.5-mL Combitip to deliver 0.4 mL. Label each aliquot "HSA." Attempt to prepare adequate numbers of aliquots in order that one set of materials could last the duration of a study. When these materials change, perform a comparability study of at least 100 specimens to demonstrate the relationship of the values before and after the change. Store at -70 °C. CAUTION: Handle as if capable of transmitting infectious agents. Primary standard reference material The primary calibration standard for the fluorescent immunoassay is “CAP Urine Protein Reference Material, human albumin Cohn Fraction V”. Reconstitute the material as described in the package insert and devise a dilution schematic that correlates with the concentrations of the standard line calibration material for comparison. CONTROLS Quality control material: control pool urine, three levels Prepare frozen aliquots of three control pools in order to thaw and use one of each for every assay. The three levels of control represent low, middle, and high positions on the standard line. Pool urine from a number of healthy volunteers to obtain albumin concentrations of approximately 1, 7, and 15 µg/mL. Filter each urine pool through sterile 0.2-µm Nalgene Filterware under vacuum. Mix well. Pipette 0.4 mL into 0.65-mL micro-centrifuge tubes that are labeled with pool ID for each concentration level. Use the repeater pipette 2 times set on #3 with the 2.5-mL Combitip to deliver 0.4 mL. Label each aliquot. Attempt to prepare adequate numbers of aliquots in order that one set of materials could last for the duration of a study. When these materials change, perform a comparability study of at least 100 specimens to demonstrate the relationship of the values before and after the change in the controls. One vial of each control is thawed for use during the day of assay is performance. The controls are not used on another assay day or re-frozen, they are discarded. Store at -70 °C. CAUTION: Handle as if capable of transmitting infectious agents.
7. CALIBRATION AND CALIBRATION VERIFICATION PROCEDURES
CALIBRATION PROCEDURE A. For each assay prepare a calibration curve from the results of the dilutions of standard line
material, 0 µg/mL to 20 µg/mL HSA, as decribed in Table 1.
B. For each assay calibrate the fluorometer instrument. Adjust the fluorometer to read 0% relative fluorescence (RF) and 100% RF for the HSA standard line calibration limits 0 µg/mL and 20
Albumin in Urine NHANES 2007-2008
page 11 of 21
µg/mL, respectively. This will establish a known relationship between the instrument measurement and the true value of the albumin analyte.
CALIBRATION VERIFICATION PROCEDURE A. Verify that the instrument remains in calibration during the fluorometry procedure by periodically
re-checking that the 0 µg/mL and the 20 µg/mL HSA samples remain in adjustment at 0% RF and 100% RF, respectively.
B. Verify that the standard line calibration curve is linear with a y-intercept near zero. For each assay, the calibration curve correlation coefficient (R2) must be > 0.9900.
C. Verify that at least two of the three quality control urine specimens are within the expected 95% limits as described by the Westgard Rules7. Check the other rules regarding “out of control” criteria as listed in the QC section.
D. Verify the concentration of the “1 mg/mL HSA” standard line calibration material by checking it
against the primary standard, “CAP Urine Protein Reference Material, human albumin Cohn Fraction V”, a reference material of known value.
8. PROCEDURE OPERATING INSTRUCTIONS; CALCULATIONS; INTERPRETATION OF
RESULTS
PROCEDURE OPERATING INSTRUCTIONS
A. Preliminaries prior to the assay day 1. Attach the micro-filters to the pipette tips. 2. Number single 1.5-mL micro-centrifuge tubes to correspond with each urine specimen.
3. Number duplicate 12- X 75-mm tubes (use a waterproof marker) for each of the three quality control urine samples, the standard line samples (labeled from 0 to 20 µg/mL), and for each urine specimen. Perform in triplicate any specimen that requires immediate reporting.
4. Prepare a worksheet to compile the information corresponding with the information on the
Excel spreadsheet described in section 3. On the worksheet place one of the 3 quality control urine samples in the 0 position before specimen number 1, one near the middle, and the third after the specimens. Rotate these positions in subsequent assays.
5. Adjust the water bath for optimum volume and maintain at 37 °C temperature.
B. Sample preparation on the assay day
1. Control pool urine preparation for the assay day
Thaw and vortex one aliquot of each of the three control pools on the day of an assay. Transfer each to a 12- X 75-mm tube. Filter and transfer each to a 1.5-mL micro-centrifuge tube with the P-200 pipette and pipette tip with the attached micro-filter. Centrifuge the tubes for 2 min in the micro-centrifuge. Assay with the same conditions as the unknown specimens. The dilution factor is 1. Use the Micromedic sampling syringe set at 40%.
2. Urine specimen preparation for the assay day
a. Thaw and mix the urine specimens by inverting the tubes a minimum of eight times. Number the specimen tubes to correspond with the specimen identification numbers and the worksheet. Filter and transfer 200 µL of urine specimen to the corresponding 1.5-mL micro-centrifuge tube with the P-200 pipette and pipette tip with the attached micro-filter.
Albumin in Urine NHANES 2007-2008
page 12 of 21
Centrifuge the tubes for 2 min in the micro-centrifuge. Assay with the same conditions as the standard line material and controls. The dilution factor and the Micromedic sampling syringe setting is determined by the Albustix value as described below.
b. Measure the Albustix value of each specimen as directed on the package insert. Knowledge of the approximate concentration of the specimen enables the technician to prepare the specimen so that it will fall within the standard curve, 0 µg/mL to 20 µg/mL. Record Albustix values and the corresponding dilution factors on the worksheet as described in Table 2. The Albustix value determines the dilution factor. Assay each specimen at the specified dilution and corresponding Micromedic sampling syringe setting as determined by the Albustix value:
Urine specimens with very low albustix values
Specimens with “negative” or “non-detect” (negative and colorless) Albustix values may require analysis at 2X the concentration (i.e. dilution factor of “2”). This is adjusted with the Micromedic sampling syringe set at 80%. Note: Specimens that fail to fall on the standard curve at this setting are considered < LOD.
Urine specimens with low to moderate albustix values Specimens with Albustix values of “negative”, or “negative-trace” have dilution factors “1”, and “.5”, respectively. They are adjusted directly on the Micromedic. The Micromedic sampling syringe is set at 40% and 20%, respectively.
Urine specimens with high albustix values
Specimens with Albustix values of “trace”, “+”, “++”, or “+++” must be diluted. Dilute with oval/PBS as directed in Table 2. The dilution factors will be “.1”, “.02”, “.01”, “and .001”, respectively. The Micromedic sampling syringe is set at 40%.
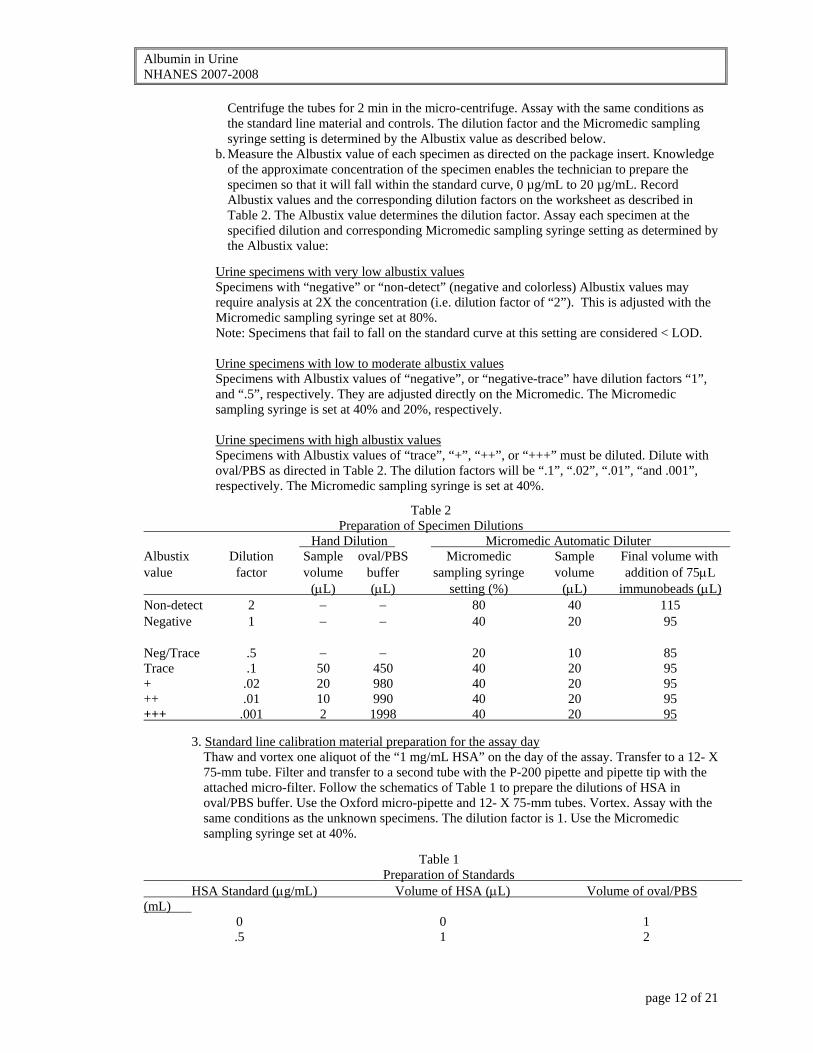
Table 2 Preparation of Specimen Dilutions Hand Dilution Micromedic Automatic Diluter Albustix Dilution Sample oval/PBS Micromedic Sample Final volume with value factor volume buffer sampling syringe volume addition of 75μL (μL) (μL) setting (%) (μL) immunobeads (μL) Non-detect 2 − − 80 40 115 Negative 1 − − 40 20 95 Neg/Trace .5 − − 20 10 85 Trace .1 50 450 40 20 95 + .02 20 980 40 20 95 ++ .01 10 990 40 20 95 +++ .001 2 1998 40 20 95
3. Standard line calibration material preparation for the assay day Thaw and vortex one aliquot of the “1 mg/mL HSA” on the day of the assay. Transfer to a 12- X 75-mm tube. Filter and transfer to a second tube with the P-200 pipette and pipette tip with the attached micro-filter. Follow the schematics of Table 1 to prepare the dilutions of HSA in oval/PBS buffer. Use the Oxford micro-pipette and 12- X 75-mm tubes. Vortex. Assay with the same conditions as the unknown specimens. The dilution factor is 1. Use the Micromedic sampling syringe set at 40%.
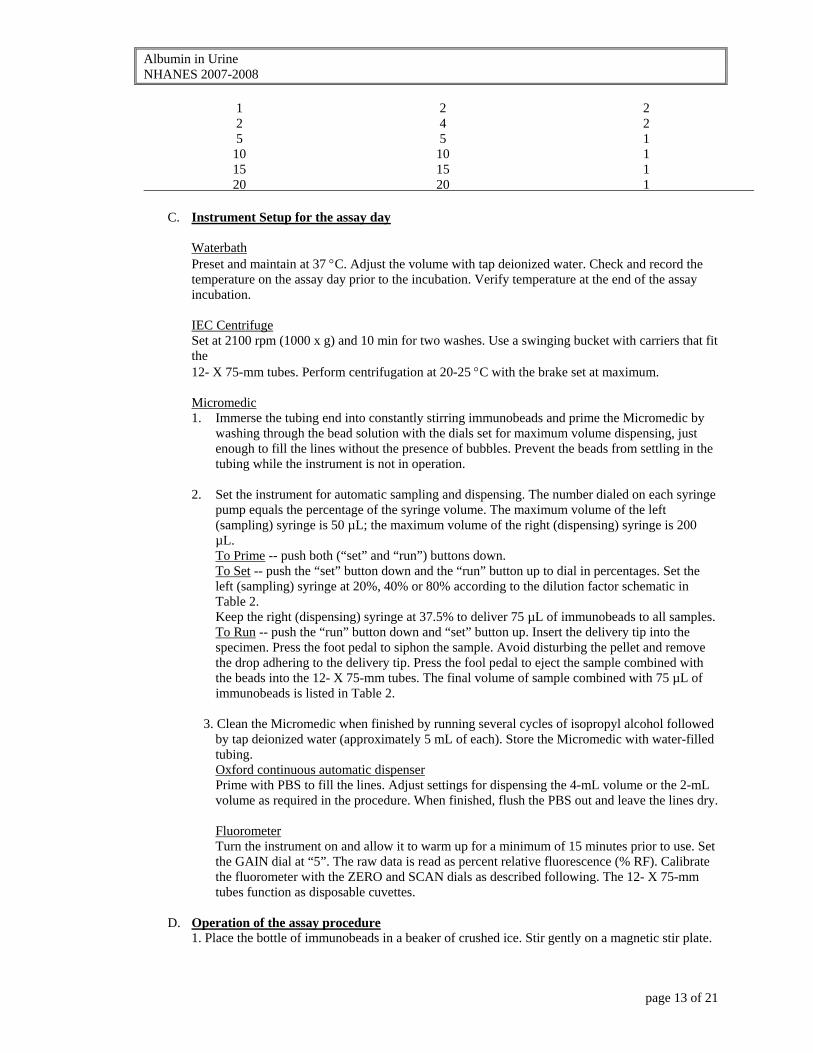
Table 1 Preparation of Standards HSA Standard (μg/mL) Volume of HSA (μL) Volume of oval/PBS (mL) 0 0 1 .5 1 2
Albumin in Urine NHANES 2007-2008
page 13 of 21
1 2 2 2 4 2 5 5 1 10 10 1 15 15 1 20 20 1
C. Instrument Setup for the assay day
Waterbath Preset and maintain at 37 °C. Adjust the volume with tap deionized water. Check and record the temperature on the assay day prior to the incubation. Verify temperature at the end of the assay incubation. IEC Centrifuge Set at 2100 rpm (1000 x g) and 10 min for two washes. Use a swinging bucket with carriers that fit the 12- X 75-mm tubes. Perform centrifugation at 20-25 °C with the brake set at maximum. Micromedic
1. Immerse the tubing end into constantly stirring immunobeads and prime the Micromedic by washing through the bead solution with the dials set for maximum volume dispensing, just enough to fill the lines without the presence of bubbles. Prevent the beads from settling in the tubing while the instrument is not in operation.
2. Set the instrument for automatic sampling and dispensing. The number dialed on each syringe
pump equals the percentage of the syringe volume. The maximum volume of the left (sampling) syringe is 50 µL; the maximum volume of the right (dispensing) syringe is 200 µL. To Prime -- push both (“set” and “run”) buttons down. To Set -- push the “set” button down and the “run” button up to dial in percentages. Set the left (sampling) syringe at 20%, 40% or 80% according to the dilution factor schematic in Table 2. Keep the right (dispensing) syringe at 37.5% to deliver 75 µL of immunobeads to all samples. To Run -- push the “run” button down and “set” button up. Insert the delivery tip into the specimen. Press the foot pedal to siphon the sample. Avoid disturbing the pellet and remove the drop adhering to the delivery tip. Press the fool pedal to eject the sample combined with the beads into the 12- X 75-mm tubes. The final volume of sample combined with 75 µL of immunobeads is listed in Table 2.
3. Clean the Micromedic when finished by running several cycles of isopropyl alcohol followed
by tap deionized water (approximately 5 mL of each). Store the Micromedic with water-filled tubing.
Oxford continuous automatic dispenser Prime with PBS to fill the lines. Adjust settings for dispensing the 4-mL volume or the 2-mL volume as required in the procedure. When finished, flush the PBS out and leave the lines dry.
Fluorometer Turn the instrument on and allow it to warm up for a minimum of 15 minutes prior to use. Set the GAIN dial at “5”. The raw data is read as percent relative fluorescence (% RF). Calibrate the fluorometer with the ZERO and SCAN dials as described following. The 12- X 75-mm tubes function as disposable cuvettes.
D. Operation of the assay procedure
1. Place the bottle of immunobeads in a beaker of crushed ice. Stir gently on a magnetic stir plate.
Albumin in Urine NHANES 2007-2008
page 14 of 21
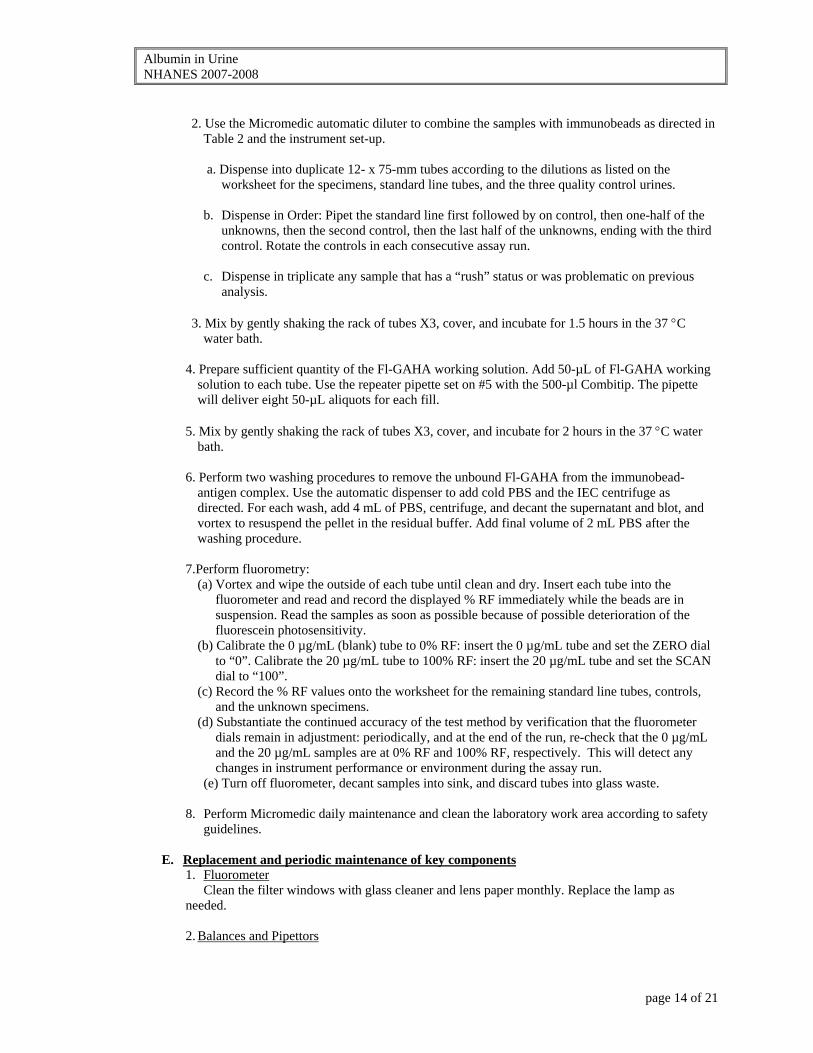
2. Use the Micromedic automatic diluter to combine the samples with immunobeads as directed in
Table 2 and the instrument set-up.
a. Dispense into duplicate 12- x 75-mm tubes according to the dilutions as listed on the worksheet for the specimens, standard line tubes, and the three quality control urines.
b. Dispense in Order: Pipet the standard line first followed by on control, then one-half of the
unknowns, then the second control, then the last half of the unknowns, ending with the third control. Rotate the controls in each consecutive assay run.
c. Dispense in triplicate any sample that has a “rush” status or was problematic on previous
analysis.
3. Mix by gently shaking the rack of tubes X3, cover, and incubate for 1.5 hours in the 37 °C water bath.
4. Prepare sufficient quantity of the Fl-GAHA working solution. Add 50-µL of Fl-GAHA working
solution to each tube. Use the repeater pipette set on #5 with the 500-µl Combitip. The pipette will deliver eight 50-µL aliquots for each fill.
5. Mix by gently shaking the rack of tubes X3, cover, and incubate for 2 hours in the 37 °C water
bath.
6. Perform two washing procedures to remove the unbound Fl-GAHA from the immunobead-antigen complex. Use the automatic dispenser to add cold PBS and the IEC centrifuge as directed. For each wash, add 4 mL of PBS, centrifuge, and decant the supernatant and blot, and vortex to resuspend the pellet in the residual buffer. Add final volume of 2 mL PBS after the washing procedure.
7.Perform fluorometry:
(a) Vortex and wipe the outside of each tube until clean and dry. Insert each tube into the fluorometer and read and record the displayed % RF immediately while the beads are in suspension. Read the samples as soon as possible because of possible deterioration of the fluorescein photosensitivity.
(b) Calibrate the 0 µg/mL (blank) tube to 0% RF: insert the 0 µg/mL tube and set the ZERO dial to “0”. Calibrate the 20 µg/mL tube to 100% RF: insert the 20 µg/mL tube and set the SCAN dial to “100”.
(c) Record the % RF values onto the worksheet for the remaining standard line tubes, controls, and the unknown specimens.
(d) Substantiate the continued accuracy of the test method by verification that the fluorometer dials remain in adjustment: periodically, and at the end of the run, re-check that the 0 µg/mL and the 20 µg/mL samples are at 0% RF and 100% RF, respectively. This will detect any changes in instrument performance or environment during the assay run.
(e) Turn off fluorometer, decant samples into sink, and discard tubes into glass waste. 8. Perform Micromedic daily maintenance and clean the laboratory work area according to safety
guidelines.
E. Replacement and periodic maintenance of key components 1. Fluorometer Clean the filter windows with glass cleaner and lens paper monthly. Replace the lamp as needed.
2. Balances and Pipettors
Albumin in Urine NHANES 2007-2008
page 15 of 21
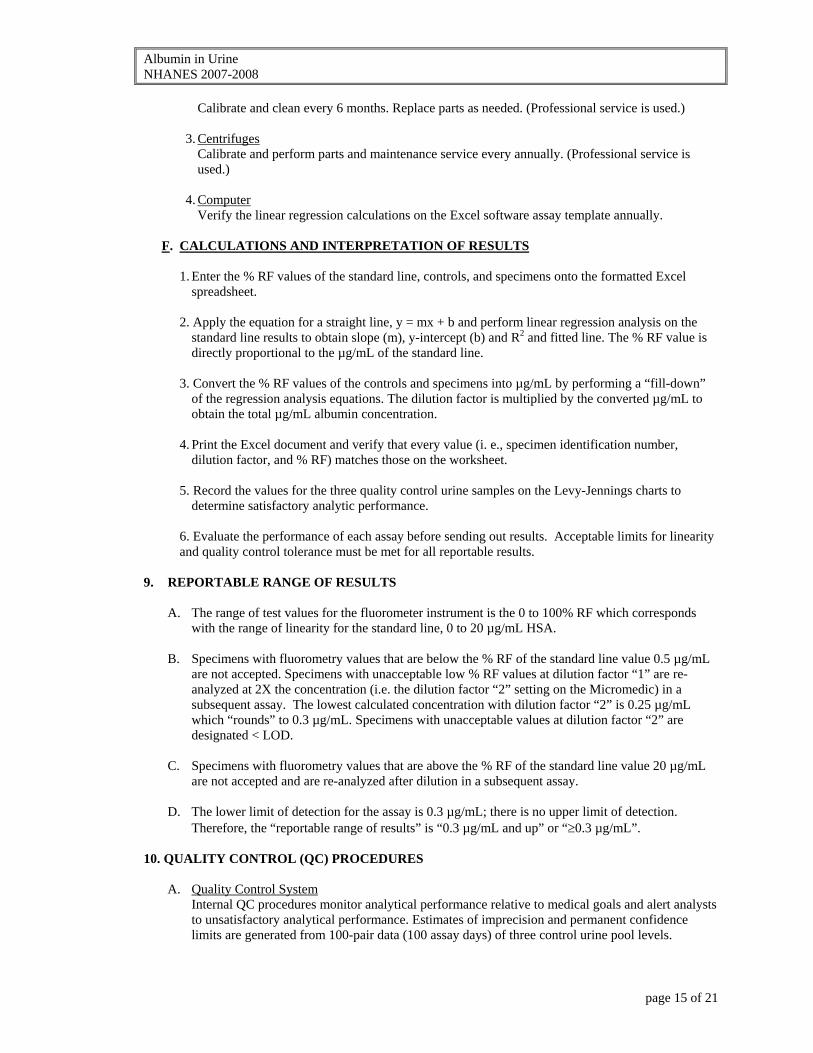
Calibrate and clean every 6 months. Replace parts as needed. (Professional service is used.) 3. Centrifuges
Calibrate and perform parts and maintenance service every annually. (Professional service is used.)
4. Computer Verify the linear regression calculations on the Excel software assay template annually.
F. CALCULATIONS AND INTERPRETATION OF RESULTS
1. Enter the % RF values of the standard line, controls, and specimens onto the formatted Excel
spreadsheet. 2. Apply the equation for a straight line, y = mx + b and perform linear regression analysis on the
standard line results to obtain slope (m), y-intercept (b) and R2 and fitted line. The % RF value is directly proportional to the µg/mL of the standard line.
3. Convert the % RF values of the controls and specimens into µg/mL by performing a “fill-down”
of the regression analysis equations. The dilution factor is multiplied by the converted µg/mL to obtain the total µg/mL albumin concentration.
4. Print the Excel document and verify that every value (i. e., specimen identification number,
dilution factor, and % RF) matches those on the worksheet. 5. Record the values for the three quality control urine samples on the Levy-Jennings charts to
determine satisfactory analytic performance.
6. Evaluate the performance of each assay before sending out results. Acceptable limits for linearity and quality control tolerance must be met for all reportable results.
9. REPORTABLE RANGE OF RESULTS
A. The range of test values for the fluorometer instrument is the 0 to 100% RF which corresponds with the range of linearity for the standard line, 0 to 20 µg/mL HSA.
B. Specimens with fluorometry values that are below the % RF of the standard line value 0.5 µg/mL
are not accepted. Specimens with unacceptable low % RF values at dilution factor “1” are re-analyzed at 2X the concentration (i.e. the dilution factor “2” setting on the Micromedic) in a subsequent assay. The lowest calculated concentration with dilution factor “2” is 0.25 µg/mL which “rounds” to 0.3 µg/mL. Specimens with unacceptable values at dilution factor “2” are designated < LOD.
C. Specimens with fluorometry values that are above the % RF of the standard line value 20 µg/mL
are not accepted and are re-analyzed after dilution in a subsequent assay.
D. The lower limit of detection for the assay is 0.3 µg/mL; there is no upper limit of detection. Therefore, the “reportable range of results” is “0.3 µg/mL and up” or “≥0.3 µg/mL”.
10. QUALITY CONTROL (QC) PROCEDURES
A. Quality Control System Internal QC procedures monitor analytical performance relative to medical goals and alert analysts to unsatisfactory analytical performance. Estimates of imprecision and permanent confidence limits are generated from 100-pair data (100 assay days) of three control urine pool levels.
Albumin in Urine NHANES 2007-2008
page 16 of 21
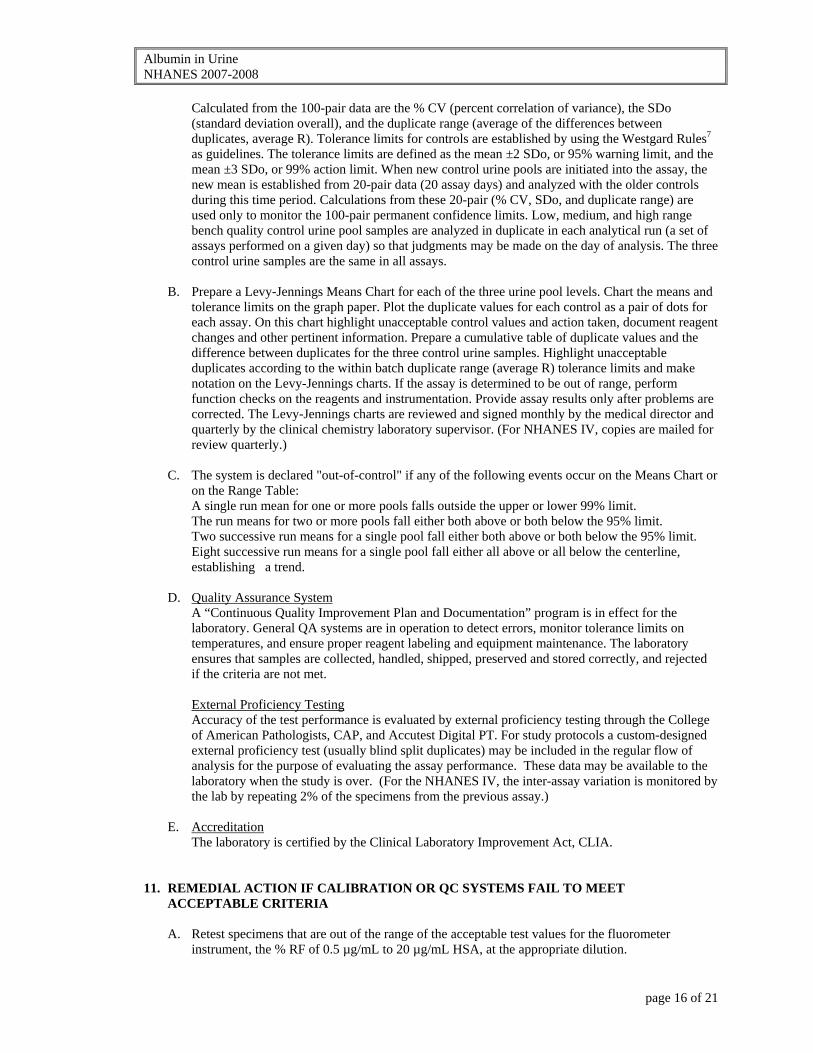
Calculated from the 100-pair data are the % CV (percent correlation of variance), the SDo (standard deviation overall), and the duplicate range (average of the differences between duplicates, average R). Tolerance limits for controls are established by using the Westgard Rules7
as guidelines. The tolerance limits are defined as the mean ±2 SDo, or 95% warning limit, and the mean ±3 SDo, or 99% action limit. When new control urine pools are initiated into the assay, the new mean is established from 20-pair data (20 assay days) and analyzed with the older controls during this time period. Calculations from these 20-pair (% CV, SDo, and duplicate range) are used only to monitor the 100-pair permanent confidence limits. Low, medium, and high range bench quality control urine pool samples are analyzed in duplicate in each analytical run (a set of assays performed on a given day) so that judgments may be made on the day of analysis. The three control urine samples are the same in all assays.
B. Prepare a Levy-Jennings Means Chart for each of the three urine pool levels. Chart the means and
tolerance limits on the graph paper. Plot the duplicate values for each control as a pair of dots for each assay. On this chart highlight unacceptable control values and action taken, document reagent changes and other pertinent information. Prepare a cumulative table of duplicate values and the difference between duplicates for the three control urine samples. Highlight unacceptable duplicates according to the within batch duplicate range (average R) tolerance limits and make notation on the Levy-Jennings charts. If the assay is determined to be out of range, perform function checks on the reagents and instrumentation. Provide assay results only after problems are corrected. The Levy-Jennings charts are reviewed and signed monthly by the medical director and quarterly by the clinical chemistry laboratory supervisor. (For NHANES IV, copies are mailed for review quarterly.)
C. The system is declared "out-of-control" if any of the following events occur on the Means Chart or
on the Range Table: A single run mean for one or more pools falls outside the upper or lower 99% limit. The run means for two or more pools fall either both above or both below the 95% limit. Two successive run means for a single pool fall either both above or both below the 95% limit. Eight successive run means for a single pool fall either all above or all below the centerline, establishing a trend.
D. Quality Assurance System A “Continuous Quality Improvement Plan and Documentation” program is in effect for the laboratory. General QA systems are in operation to detect errors, monitor tolerance limits on temperatures, and ensure proper reagent labeling and equipment maintenance. The laboratory ensures that samples are collected, handled, shipped, preserved and stored correctly, and rejected if the criteria are not met.
External Proficiency Testing
Accuracy of the test performance is evaluated by external proficiency testing through the College of American Pathologists, CAP, and Accutest Digital PT. For study protocols a custom-designed external proficiency test (usually blind split duplicates) may be included in the regular flow of analysis for the purpose of evaluating the assay performance. These data may be available to the laboratory when the study is over. (For the NHANES IV, the inter-assay variation is monitored by the lab by repeating 2% of the specimens from the previous assay.)
E. Accreditation The laboratory is certified by the Clinical Laboratory Improvement Act, CLIA.
11. REMEDIAL ACTION IF CALIBRATION OR QC SYSTEMS FAIL TO MEET
ACCEPTABLE CRITERIA A. Retest specimens that are out of the range of the acceptable test values for the fluorometer
instrument, the % RF of 0.5 µg/mL to 20 µg/mL HSA, at the appropriate dilution.
Albumin in Urine NHANES 2007-2008
page 17 of 21
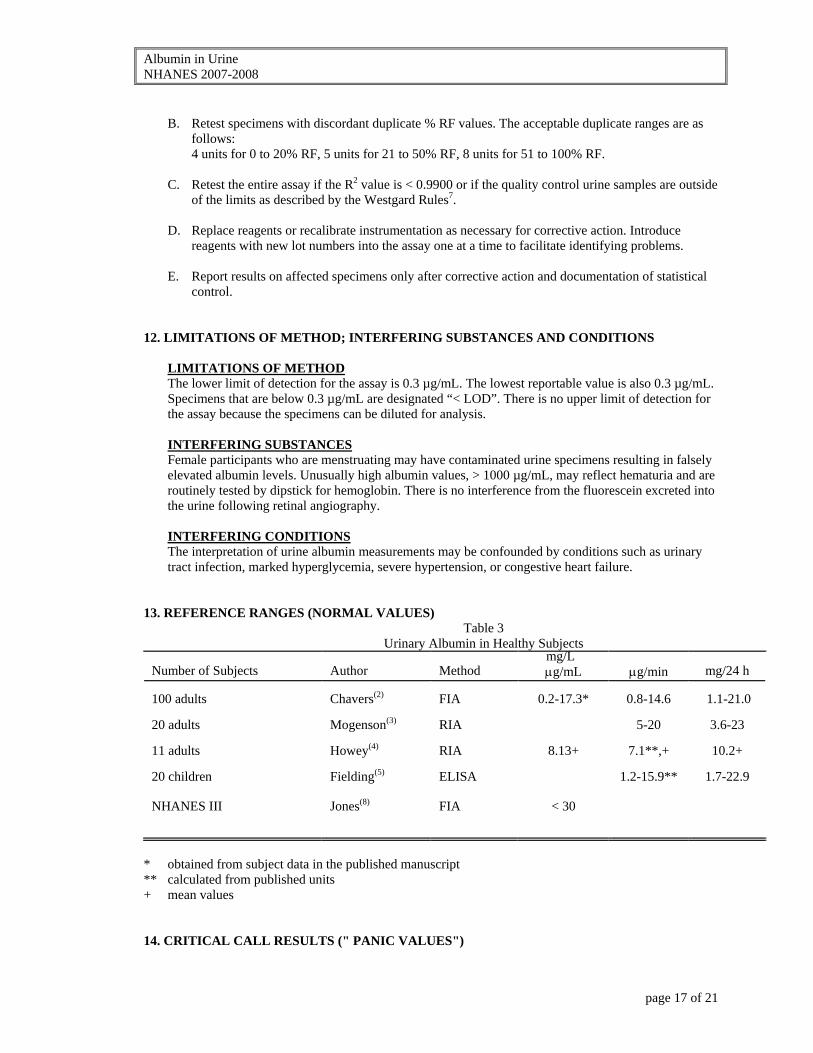
B. Retest specimens with discordant duplicate % RF values. The acceptable duplicate ranges are as
follows: 4 units for 0 to 20% RF, 5 units for 21 to 50% RF, 8 units for 51 to 100% RF.
C. Retest the entire assay if the R2 value is < 0.9900 or if the quality control urine samples are outside
of the limits as described by the Westgard Rules7. D. Replace reagents or recalibrate instrumentation as necessary for corrective action. Introduce
reagents with new lot numbers into the assay one at a time to facilitate identifying problems.
E. Report results on affected specimens only after corrective action and documentation of statistical control.
12. LIMITATIONS OF METHOD; INTERFERING SUBSTANCES AND CONDITIONS
LIMITATIONS OF METHOD The lower limit of detection for the assay is 0.3 µg/mL. The lowest reportable value is also 0.3 µg/mL. Specimens that are below 0.3 µg/mL are designated “< LOD”. There is no upper limit of detection for the assay because the specimens can be diluted for analysis. INTERFERING SUBSTANCES Female participants who are menstruating may have contaminated urine specimens resulting in falsely elevated albumin levels. Unusually high albumin values, > 1000 µg/mL, may reflect hematuria and are routinely tested by dipstick for hemoglobin. There is no interference from the fluorescein excreted into the urine following retinal angiography. INTERFERING CONDITIONS The interpretation of urine albumin measurements may be confounded by conditions such as urinary tract infection, marked hyperglycemia, severe hypertension, or congestive heart failure.
13. REFERENCE RANGES (NORMAL VALUES) Table 3 Urinary Albumin in Healthy Subjects
Number of Subjects
Author
Method
mg/L μg/mL
μg/min
mg/24 h
100 adults
Chavers(2)
FIA
0.2-17.3*
0.8-14.6
1.1-21.0
20 adults
Mogenson(3)
RIA
5-20
3.6-23
11 adults
Howey(4)
RIA
8.13+
7.1**,+
10.2+
20 children
Fielding(5)
ELISA
1.2-15.9**
1.7-22.9
NHANES III
Jones(8)
FIA
< 30
* obtained from subject data in the published manuscript ** calculated from published units + mean values 14. CRITICAL CALL RESULTS (" PANIC VALUES")
Albumin in Urine NHANES 2007-2008
page 18 of 21
There are no “panic values” which indicate immediate medical intervention for unusual urine albumin values. Diabetic nephropathy can be defined by increased urine albumin values when measured by urine albumin excretion rate or urine albumin/creatinine ratio.
15. SPECIMEN STORAGE AND HANDLING DURING TESTING
Specimens are stored at 2-8 °C during preparation of testing. Specimens may reach room temperature during the following procedures: pipeting, micro-centrifugation, and during the Micromedic procedure. A critical temperature during the testing procedure is the 37 °C incubation. When incubation ends, cold buffer is introduced to quench the reaction and to begin the centrifugation/washing procedure. During fluorometry, the samples are relatively cool and approach room temperature.
16. ALTERNATIVE METHODS FOR PERFORMING TEST OR STORING SPECIMENS IF
TEST SYSTEM FAILS
A. We do not have an alternative method for performing the test if the test system fails.
B. Manual pipettes can be substituted for the automatic dispensers. An identical fluorometer is ready for backup.
C. Return specimens to -20 °C or -70 °C if the test system is out of operation for > 3 weeks.
17. TEST RESULT REPORTING SYSTEM; PROTOCOL FOR REPORTING CRITICAL CALLS
(IF APPLICABLE)
TEST RESULT REPORTING SYSTEM A. Test results are reported by hard copy or by electronic transmission as designated by individual
study protocols. B. The albumin test result is reported as µg/mL with one decimal point.
C. Other test result reporting systems for albumin are designated by individual study protocols.
Examples: albumin excretion rate is calculated from timed (overnight or 24-hour) urine collections and reported as µg/min or
D. mg/24 h and albumin-to-creatinine ratio is calculated from random urine spot collections and is
reported as mg/g, µg/mg, or mg/mmol.
E. Unusual albumin values that are designated "< LOD" or are > 1000 µg/mL are flagged for attention.
18. PROTOCOL FOR REPORTING CRITICAL CALLS
Not applicable for this procedure. 19. TRANSFER OR REFERRAL OF SPECIMENS; PROCEDURES FOR SPECIMEN
ACCOUNTABILITY AND TRACKING Specimens are logged into data books by the laboratory upon receipt. They are received by the laboratory in batches or as single specimens, frozen or fresh, arriving by overnight courier or hand-carried by study personnel from coordinating centers. (For the NHANES IV batches of frozen
Albumin in Urine NHANES 2007-2008
page 19 of 21
specimens are received by Fed-Ex. Completed specimens are re-frozen in the original tubes at -70°C and returned on dry ice to the contract storage facility McKesson Bioservices.) All communications, notebooks, discs, and files containing raw data, final data, QC information, etc. are saved in the laboratory. These serve as documentation for specimen accountability and tracking.
Albumin in Urine NHANES 2007-2008
page 20 of 21
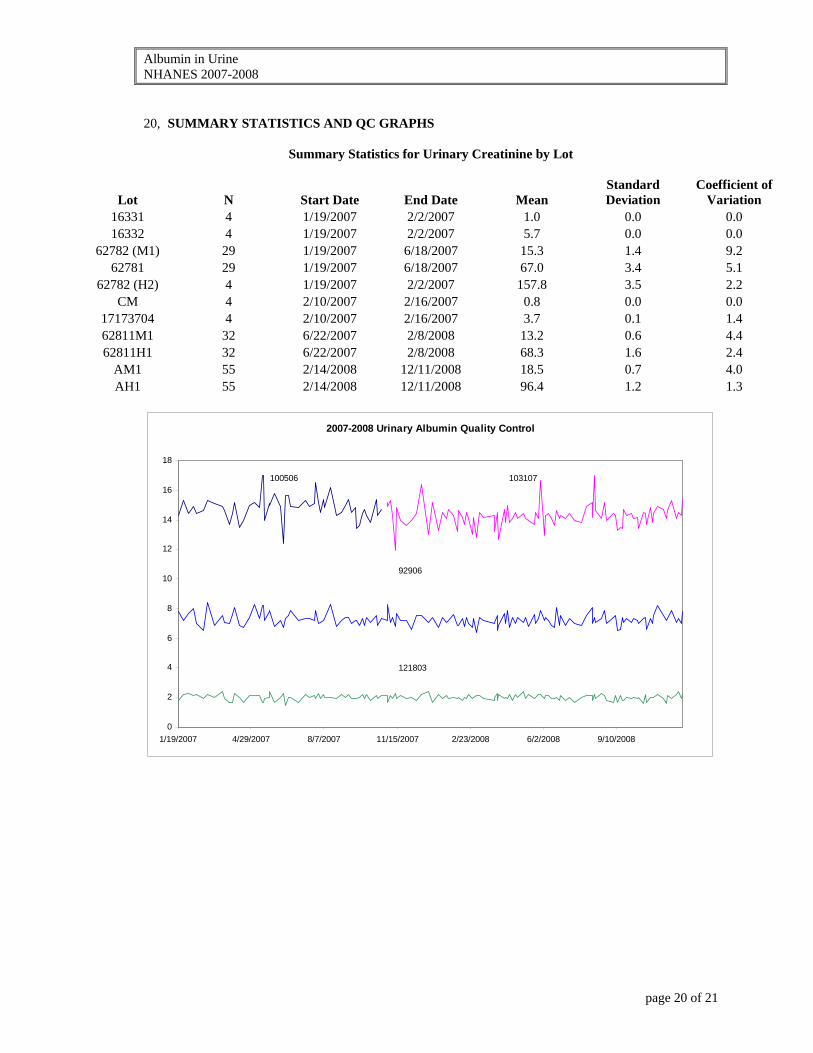
20, SUMMARY STATISTICS AND QC GRAPHS
Summary Statistics for Urinary Creatinine by Lot
Lot N Start Date End Date Mean Standard Deviation
Coefficient of Variation
16331 4 1/19/2007 2/2/2007 1.0 0.0 0.0 16332 4 1/19/2007 2/2/2007 5.7 0.0 0.0
62782 (M1) 29 1/19/2007 6/18/2007 15.3 1.4 9.2 62781 29 1/19/2007 6/18/2007 67.0 3.4 5.1
62782 (H2) 4 1/19/2007 2/2/2007 157.8 3.5 2.2 CM 4 2/10/2007 2/16/2007 0.8 0.0 0.0
17173704 4 2/10/2007 2/16/2007 3.7 0.1 1.4 62811M1 32 6/22/2007 2/8/2008 13.2 0.6 4.4 62811H1 32 6/22/2007 2/8/2008 68.3 1.6 2.4
AM1 55 2/14/2008 12/11/2008 18.5 0.7 4.0 AH1 55 2/14/2008 12/11/2008 96.4 1.2 1.3
2007-2008 Urinary Albumin Quality Control
0
2
4
6
8
10
12
14
16
18
1/19/2007 4/29/2007 8/7/2007 11/15/2007 2/23/2008 6/2/2008 9/10/2008
100506 103107
121803
92906
Albumin in Urine NHANES 2007-2008
page 21 of 21
REFERENCES 1. Chavers BM, Simonson J, Michael AF. A solid-phase fluorescent immunoassay for the measurement of
human urinary albumin. Kidney Int. 1984; 25: 576-8. 2. Chavers BM, Mauer SM, Ramsay RC, Steffes MW. Relationship between retinal and glomerular lesions
in IDDM patients. Diabetes 1994; 43: 441-6. 3. Mogenson CE. Renal function changes in diabetes. Diabetes 1976; 25: 872-9. 4. Howey JEA, Browning MCK, Fraser CG. Selecting the optimum specimen for assessing slight
albuminuria, and a strategy for clinical investigation: novel uses of data on biological variation. Clin Chem 1987; 33: 2032-8.
5. Fielding BA, Price DA, Houlton CA. Enzyme immunoassay for urinary albumin. Clin Chem 1983; 29: 355-7. 6. Instructions for immunobead reagent coupling kits. Richmond (CA): Bio-Rad Laboratories, 1979: 2-4. 7. Westgard JO, Carey RN, Wold S. Criteria for judging precision and accuracy in method development and evaluation. Clin Chem 1974; 20: 825-33.
8. Jones CA, Francis ME, Eberhardt MS, et al. Microalbuminuria in the US Population: Third National
Health and Nutrition Examination Survey. Am L Kidney Dis 2002;39:445-459.