Sartorius Group Annual Report 2020
245
Sartorius Group
Transcript of Sartorius Group Annual Report 2020
Sartorius Group
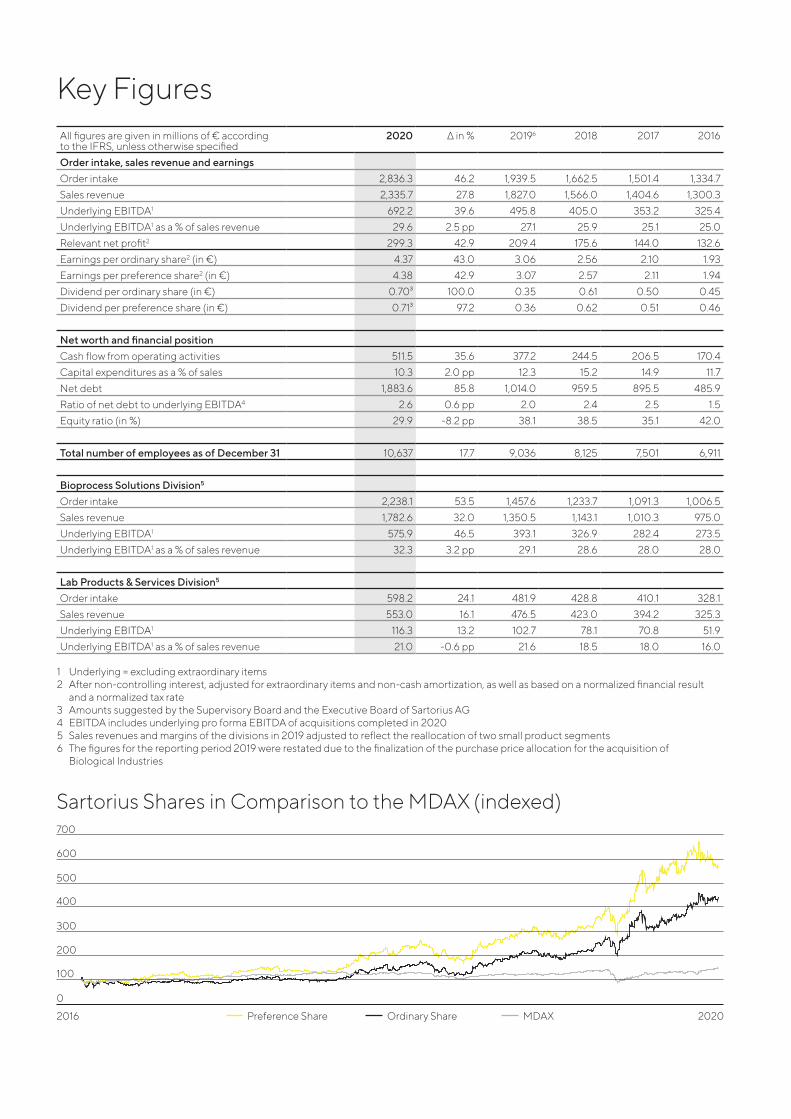
Key FiguresAll figures are given in millions of € accordingto the IFRS, unless otherwise specified
2020 Δ in % 20196 2018 2017 2016
Order intake, sales revenue and earningsOrder intake 2,836.3 46.2 1,939.5 1,662.5 1,501.4 1,334.7Sales revenue 2,335.7 27.8 1,827.0 1,566.0 1,404.6 1,300.3Underlying EBITDA1 692.2 39.6 495.8 405.0 353.2 325.4Underlying EBITDA1 as a % of sales revenue 29.6 2.5 pp 27.1 25.9 25.1 25.0Relevant net profit2 299.3 42.9 209.4 175.6 144.0 132.6Earnings per ordinary share2 (in €) 4.37 43.0 3.06 2.56 2.10 1.93Earnings per preference share2 (in €) 4.38 42.9 3.07 2.57 2.11 1.94Dividend per ordinary share (in €) 0.70³ 100.0 0.35 0.61 0.50 0.45Dividend per preference share (in €) 0.71³ 97.2 0.36 0.62 0.51 0.46
Net worth and financial positionCash flow from operating activities 511.5 35.6 377.2 244.5 206.5 170.4Capital expenditures as a % of sales 10.3 2.0 pp 12.3 15.2 14.9 11.7Net debt 1,883.6 85.8 1,014.0 959.5 895.5 485.9Ratio of net debt to underlying EBITDA4 2.6 0.6 pp 2.0 2.4 2.5 1.5Equity ratio (in %) 29.9 -8.2 pp 38.1 38.5 35.1 42.0
Total number of employees as of December 31 10,637 17.7 9,036 8,125 7,501 6,911
Bioprocess Solutions Division5
Order intake 2,238.1 53.5 1,457.6 1,233.7 1,091.3 1,006.5Sales revenue 1,782.6 32.0 1,350.5 1,143.1 1,010.3 975.0Underlying EBITDA1 575.9 46.5 393.1 326.9 282.4 273.5Underlying EBITDA1 as a % of sales revenue 32.3 3.2 pp 29.1 28.6 28.0 28.0
Lab Products & Services Division5
Order intake 598.2 24.1 481.9 428.8 410.1 328.1Sales revenue 553.0 16.1 476.5 423.0 394.2 325.3Underlying EBITDA1 116.3 13.2 102.7 78.1 70.8 51.9Underlying EBITDA1 as a % of sales revenue 21.0 -0.6 pp 21.6 18.5 18.0 16.0
1 Underlying = excluding extraordinary items2 After non-controlling interest, adjusted for extraordinary items and non-cash amortization, as well as based on a normalized financial result and a normalized tax rate3 Amounts suggested by the Supervisory Board and the Executive Board of Sartorius AG4 EBITDA includes underlying pro forma EBITDA of acquisitions completed in 20205 Sales revenues and margins of the divisions in 2019 adjusted to reflect the reallocation of two small product segments6 The figures for the reporting period 2019 were restated due to the finalization of the purchase price allocation for the acquisition of Biological Industries
Sartorius Shares in Comparison to the MDAX (indexed)
20202016
0
100
200
300
400
500
600
700
Preference Share MDAXOrdinary Share
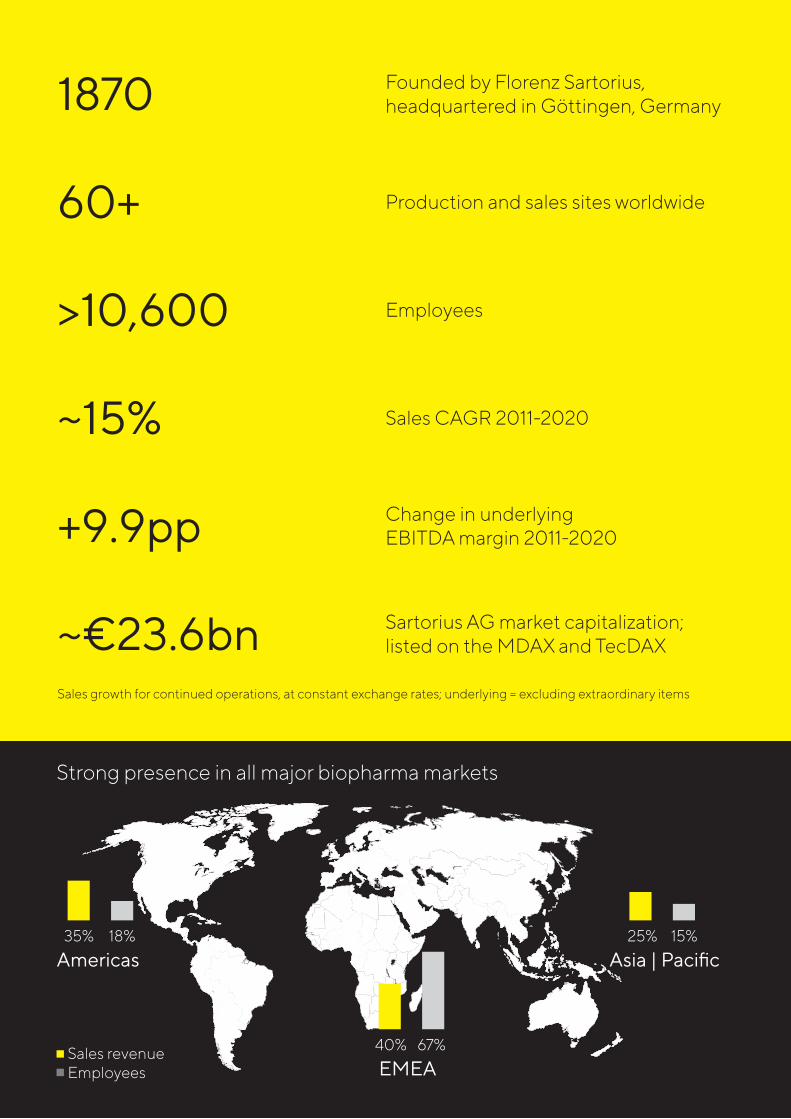
Strong presence in all major biopharma markets
Americas18%35%
EMEA67%40%
Asia | Pacific 15%25%
Sales revenue Employees
1870
60+
>10,600
~15%
+9.9pp
~€23.6bn
Founded by Florenz Sartorius,headquartered in Göttingen, Germany
Production and sales sites worldwide
Sartorius AG market capitalization; listed on the MDAX and TecDAX
Employees
Change in underlying EBITDA margin 2011-2020
Sales CAGR 2011-2020
Sales growth for continued operations, at constant exchange rates; underlying = excluding extraordinary items

Innovative solutions for better medicationsWith its pioneering spirit and a profound understanding of customer requirements, Sartorius has evolved throughout its 150-year history into a key partner for biopharmaceutical research and the industry. Our goal is to make complex and expensive development of biotech medicines and their production safer and more efficient. We cover the entire value-added chain of the biopharmaceutical industry and help with our products and services to ensure that novel therapies and vaccines reach the market faster and are accessible to more people worldwide.
See page 26, Sartorius Group at a Glance
MissionWe empower scientists and engineers to simplify and accelerate progress in life science and bioprocessing, enabling the development of new and better therapiesand more affordable medicine.
VisionAs pioneers, we are a magnet and a dynamic platform for the leading experts in our field. We bring creative minds together for a common goal: technological breakthroughs that lead to better health for more people.
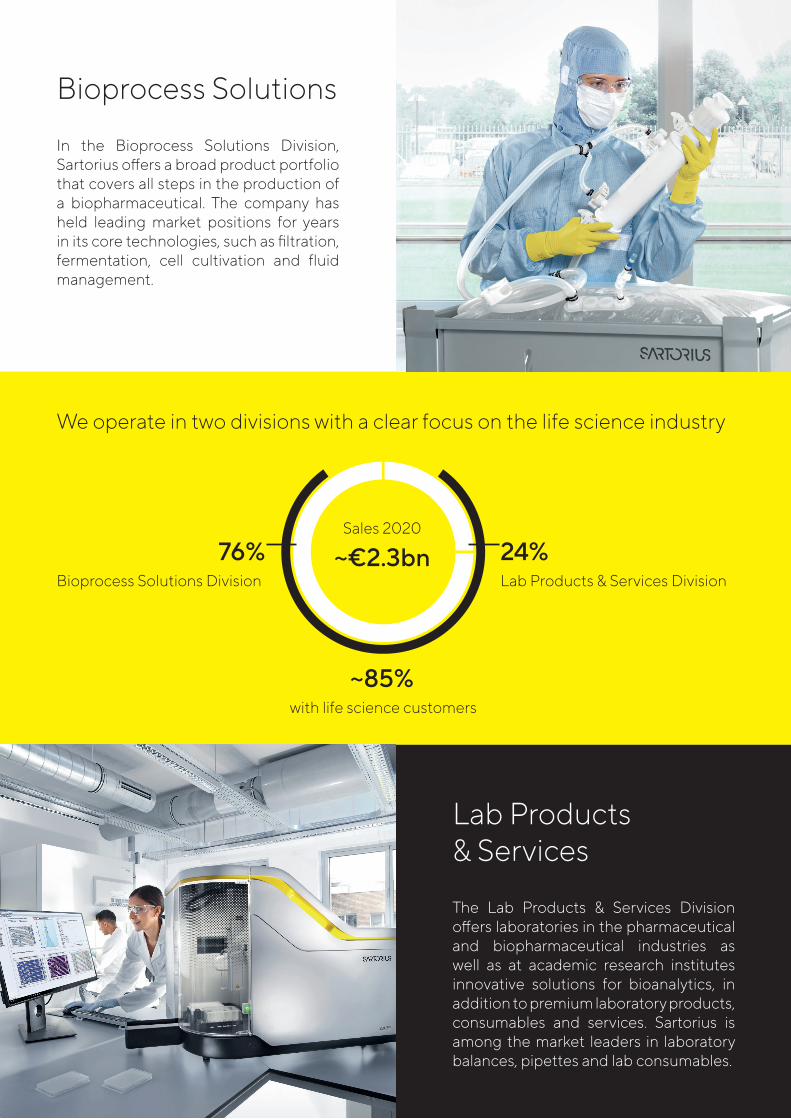
Bioprocess Solutions
In the Bioprocess Solutions Division, Sartorius offers a broad product portfolio that covers all steps in the production of a biopharmaceutical. The company has held leading market positions for years in its core technologies, such as filtration, fermentation, cell cultivation and fluid management.
The Lab Products & Services Division off ers laboratories in the pharmaceutical and biopharmaceutical industries as well as at academic research institutes innovative solutions for bioanalytics, in addition to premium laboratory products, consumables and services. Sartorius is among the market leaders in laboratory balances, pipettes and lab consumables.
Lab Products & Services
~85%with life science customers
24% Lab Products & Services Division
76%Bioprocess Solutions Division
Sales 2020 ~€2.3bn
We operate in two divisions with a clear focus on the life science industry
Sartorius 2020 Annual Report Content 6
Content
To Our Shareholders 8Report of the Executive Board 9
Executive Board 13
Report of the Supervisory Board 14
Sartorius Shares 19
Combined Group Management Report 26Structure and Management of the Group 27
Business Model, Strategy and Goals 30
Research and Development 36
Macroeconomic Environment and Conditions in the Sectors 37
Group Business Development 42
Net Worth and Financial Position 53
Business Development of Bioprocess Solutions 57
Business Development of Lab Products & Services 63
Assessment of Economic Position 68
Annual Financial Statements of Sartorius AG 70
Opportunity and Risk Report 74
Forecast Report 86
Report on Material Events 91
Description of the Key Features of the Internal Control Management System 92
Explanatory Report of the Executive Board On the Disclosures Pursuant to Section 289a, Subsection 1, and Section 315a, Subsection 1, of the German Commercial Code (HGB) 95
Corporate Governance Report 97
Remuneration Report 105
Non-financial Group statement 121
Responsibility at Sartorius 122
Innovation & Social Contribution 128
Employees 130
Responsible Business Practices 136
Environment 141
Report of the Independent Auditor 146
Sartorius 2020 Annual Report Content 7
Consolidated Financial Statements and Notes 149Statement of Profit or Loss | Other Comprehensive Income 150
Statement of Comprehensive Income 151
Statement of Financial Position 152
Statement of Cash Flows 153
Statement of Changes in Equity 154
Notes to the Financial Statements 157
Notes to the Statement of Profit or Loss 176
Notes to the Statement of Financial Position 181
Other Disclosures 215
Declaration of the Executive Board 218
Independent Auditors’ Report 219
Executive Board and Supervisory Board 229
Supplementary Information 237Glossary 238
Financial Schedule 244

To Our Shareholders
Sartorius To Our Shareholders Report of the Executive Board 9
Start
Report of the Executive Board
Dear Shareholders and Business Partners,
We are currently experiencing extraordinary times. The coronavirus pandemic has already lasted for more than a year, with far-reaching consequences for each and every one of us and societies across the globe. Our sector is facing major challenges posed by the pandemic and is making key contributions towards overcoming this situation. The scope of the efforts undertaken, the intensity of global collaboration and the speed of progress on coronavirus vaccines and Covid-19 medications is unprecedented: Some of our customers went from mapping the coronavirus genome to delivering vaccines to patients in only nine months so biopharma has really demonstrated what it is able to achieve when it cooperates on a global scale and focuses all its efforts on achieving a common goal. In the process, it has also rewritten some implicit rules by which it used to operate. And I am convinced that further important development potential will probably be the outcome of these efforts.
Sartorius is contributing directly to overcome this pandemic – we are therefore part of the solution. Each and every day, we deliver essential products and technologies to customers all over the world so they can develop and manufacture coronavirus vaccines and medications for Covid-19 treatment. At first, we focused on providing vaccine researchers with powerful tools to accelerate complex development cycles. Regarding production, we then worked very closely with our customers to develop high-performance and robust platforms for process-scale manufacturing of vaccines. The complexity of production is very high on account of the variety of vaccine types; for this reason, there are no standards out there to guide us in the right direction. Rather, the process layout must be adapted and optimized. Just as for the production of other vaccines and medications, we at Sartorius rely above all on our flexible and efficient single-use solutions that can be rapidly scaled up and then set up worldwide. Meanwhile, the stakes are high to enable manufacturers to produce record quantities of vaccines or even of antibodies for antiviral medications. To make it possible to achieve this enormous pace required, we work very closely and at all levels with our customers and suppliers.
This year underscores what also applies beyond the current pandemic: With our technologies, platform solutions and partnerships, we help to ensure that new scientific discoveries can be translated more quickly and efficiently into effective medications and that these become accessible to more people as a result. Therefore, our company’s purpose most directly addresses the Sustainable Development Goal formulated by the United Nations called “Health and Wellbeing,” placing it right at the center of our efforts.
In the past year, a major focus was on meeting the sharply growing needs of customers as quickly as possible and, as a result on ramping up production capacity. Still, an even higher priority was to ensure the safety of our employees at all our Group sites. We are thankful to report that we did not have any serious illnesses among our employees and that nobody was infected with coronavirus while at work. This was also due to the diligence of our Environmental Health & Safety team who quickly provided protective materials and implemented coronavirus testing and hygiene measures at all sites. My thanks go out to these team members for their prudent efforts.
Sartorius To Our Shareholders Report of the Executive Board 10
Start
Looking at our business results, in 2020 we closed the year with the strongest growth in the most recent history of our company in this very intensive and demanding environment. Sartorius grew in all its geographies, with this growth driven primarily by strong organic development and further by several acquisitions as well as additional pandemic-related demand. Sales revenue surged by around 30% to €2,336 million and thus far exceeded our original forecast of 10% to 13% issued at the beginning of the year. Underlying EBITDA, our Group’s most important earnings indicator, also rose close to 40% to €692 million. The respective margin climbed to 29.6% and relevant net profit reached €299 million.
Both divisions contributed significant rates to sales revenue growth. The Bioprocess Solutions Division expanded at an exceptionally dynamic rate of a good 34% to €1,783 million. The division’s underlying EBITDA of €576 million was significantly up from the prior-year figure, and the corresponding margin rose markedly to 32.3%. In 2020, the Lab Products & Services Division achieved a sales increase of around 18% to €553 million despite an extremely challenging economic environment in the first half, especially in China and the USA, due to the pandemic. The division’s underlying EBITDA rose to €116 million; its respective margin reached 21.0%.
We are also pleased to report that we were again able to increase the number of our employees significantly, to now over 10,600, a gain of more than 1,600 people. This workforce includes around 440 new team members who joined us through acquisitions, and we also hired a substantial number of people particularly in manufacturing to cope with strong demand. As a company that continues to grow rapidly, we will continue our future drive to recruit new people who share our ambitions and values.
Beyond this, we were also able to complete key strategic acquisitions which, in particular, have strengthened our position in downstream processing, in production technologies for advanced therapeutics, and bioanalytics. In the latter field, the protein analysis business acquired from Danaher Corporation is an excellent strategic and operational fit with our Lab Products & Services Division. Along with two other companies acquired in the past years in the field of cell analysis, we now have a highly innovative and relevant product array for the discovery and development of active pharmaceutical ingredients in our portfolio.
Efficient downstream processing has remained a challenge in our industry for years, and Sartorius is committed to helping accelerate and simplify this crucial production step. Through the acquisitions of the chromatography systems and resins businesses from Danaher Corporation as well as the Slovenian purification specialist BIA Separations, we significantly expanded our chromatography portfolio for essential steps in the purification of biopharmaceuticals. At the same time, we have reinforced our positioning in new modalities, such as cell and gene therapies, which are likely to play a significant role in conquering a number of severe diseases and are currently the subject of hundreds of ongoing clinical trials. We are also pleased to welcome the WaterSep BioSeparations team to our company that provides hollow-fiber membrane devices and pre-sterilized assemblies for upstream and downstream bioprocessing applications.
Sartorius To Our Shareholders Report of the Executive Board 11
Start
In early 2021, we announced that we agreed to acquire the chromatography process equipment division of Novasep. This division of approximately 100 people specializes in resin-based batch and intensified chromatography systems, and its product portfolio would perfectly complement our existing chromatography offering. The proposed transaction is still subject to antitrust approvals and is expected to close during the first half of 2021.
Let’s take a look at how our shares performed this year, which showed high volatility on the capital markets. The positive business performance of our Group resulted in a further rise in the valuation of Sartorius shares. Preference shares closed the year 2020 at, €343.60 up around 80% from year-end 2019. Ordinary shares ended the trading year at around 97% higher, at €345.00. With respect to dividends, the Supervisory Board decided, based on the recommendation of the Executive Board, to submit a proposal to the Annual Shareholders’ Meeting on March 26, 2021, to pay out €0.71 per preference share and €0.70 per ordinary share.
What can we expect of 2021? The pandemic is not yet over so protecting the health of our employees continues to be our top priority. In such an environment, even short-term forecasts are, of course, subject to increased uncertainty. Yet we are optimistic about our future and, from today’s perspective, expect continuous strong growth for the current fiscal year and beyond. For 2021, we project sales revenue to increase by about 19% to 25% and regarding profitability, we forecast an underlying EBITDA margin of about 30.5%, up from 29.6% in 2020.
To support this growth, we have started to accelerate and extend the expansion of our production capacities very significantly in all geographies, the Americas, Europe, and Asia. We will also expand our presence with customers, particularly in China and the U.S., by setting up Customer Interaction Centers and invest in a very significant extension of our activities in South Korea. Therefore, our CAPEX ratio in 2021 is expected to be at a relatively high level of around 15%.
The integration of the above-mentioned acquisitions has progressed very well, and we continue to be interested in innovative companies that extend our offering by complementary products and technologies. In this context, we will also further invest in the rapidly evolving technology fields for the development and manufacture of cell and gene therapeutics and other next generation biopharmaceuticals, which can significantly change the biopharma industry in the long term. Helping customers digitalize their processes and making the most of their data will also remain on our agenda, and we will continue to leverage our partnerships for sourcing further innovation.
We increased our mid-range targets given the strong results we achieved in 2020 and the resulting higher relevant baseline values, as well as raised expectations of future organic growth potential. Accordingly, we now plan to double our consolidated sales revenue again to around €5 billion in the five-year period up to 2025. We intend to achieve this increase primarily through organic growth, as well as additionally by acquisitions, and now project that the Group’s underlying EBITDA margin will rise to around 32% by 2025.
We will achieve these ambitious targets only with an outstanding team, just as we have done before. In 2020, a year that was a great challenge for all of us, both personally and professionally, Sartorius proved its team spirit and capabilities. We were able to successfully master the challenges thanks to the great commitment and flexibility of all our employees. In this special year, a considerable amount of extra work was done to ensure the stability of supply chains, maintain production, ramp up capacity, and intensively interact with customers. Therefore, a big thank you goes out to the entire international Sartorius team who did a fantastic job.
Sartorius To Our Shareholders Report of the Executive Board 12
Start
I would also like to thank you, our valued customers, business partners, and shareholders. Based on the trust you have placed in us – often throughout many years – you have contributed significantly to the positive development of Sartorius. We would be pleased if you would continue to accompany us in 2021 and beyond and share in the future success of our company.
Sincerely,
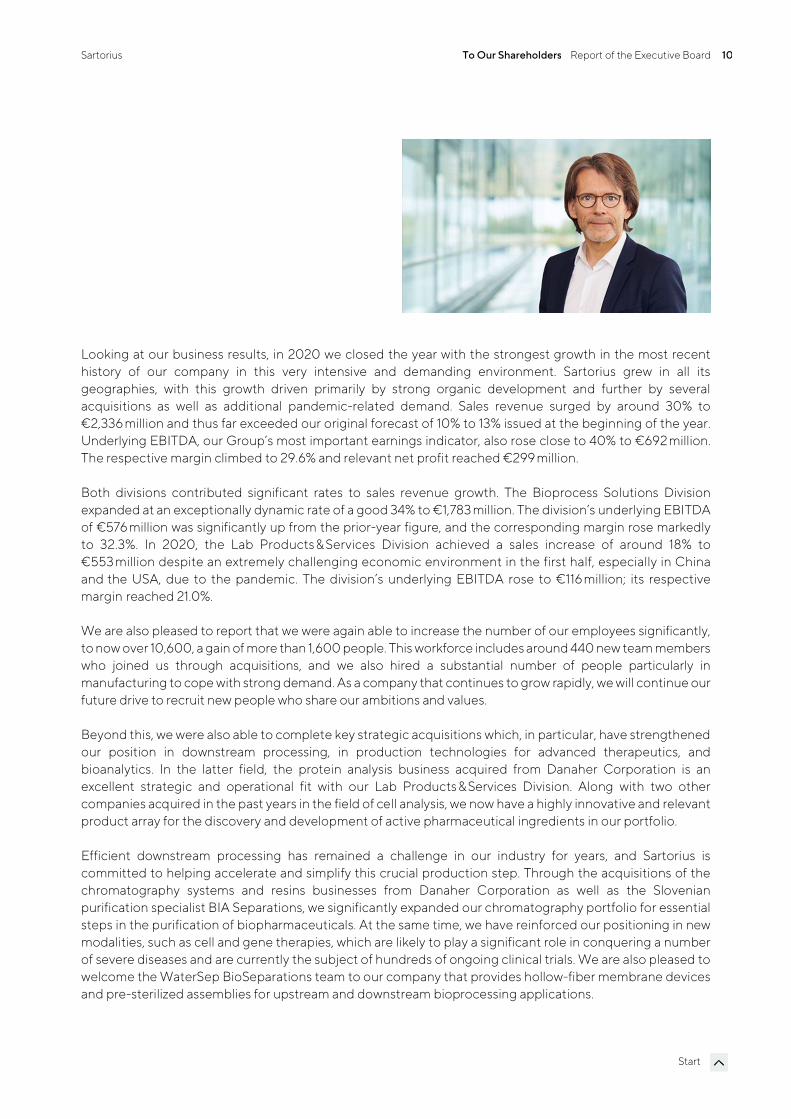
Dr. Joachim Kreuzburg CEO and Executive Board Chairman
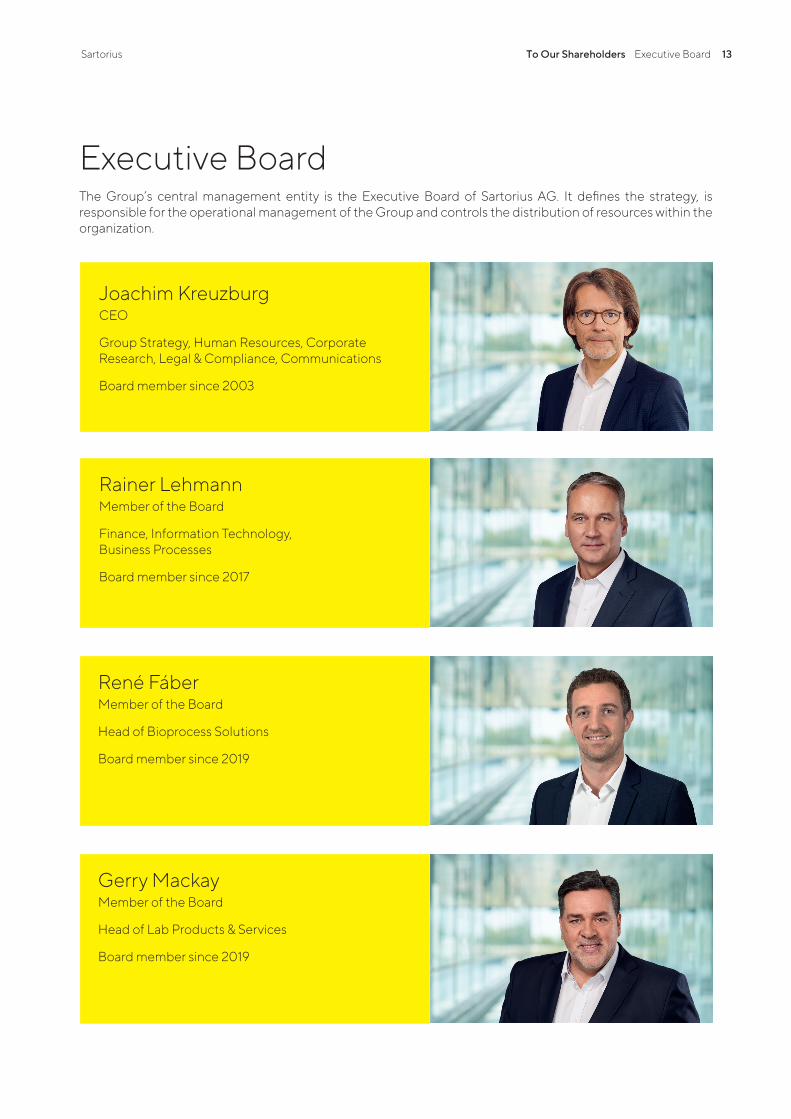
Executive BoardThe Group’s central management entity is the Executive Board of Sartorius AG. It defines the strategy, is responsible for the operational management of the Group and controls the distribution of resources within the organization.
Joachim KreuzburgCEO
Group Strategy, Human Resources, Corporate Research, Legal & Compliance, Communications
Board member since 2003
Rainer LehmannMember of the Board
Finance, Information Technology, Business Processes
Board member since 2017
René FáberMember of the Board
Head of Bioprocess Solutions
Board member since 2019
Gerry MackayMember of the Board
Head of Lab Products & Services
Board member since 2019
13Sartorius An unsere Aktionäre Bericht des Aufsichtsrats 15
Start
In unserer Bilanzsitzung am 13. Februar 2020 beschlossen wir nach umfassender Befassung und auf Basis des Be-richts des Auditausschusses sowie der bei diesem Tagesordnungspunkt anwesenden Abschlussprüfer den Jahres- und Konzernabschluss für das Geschäftsjahr 2019. Nach Berichterstattung durch den Prüfer und Diskussion billig-ten wir auch die nichtfinanzielle Konzernerklärung für das Berichtsjahr. Darüber hinaus wurden die Tagesordnung mit den Beschlussvorschlägen für die Hauptversammlung 2020 inklusive des Gewinnverwendungsvorschlags be-sprochen und verabschiedet sowie die Vorstandsvergütung für das Jahr 2020 festgelegt. Der Vorstand berichtete uns über den Stand der Gespräche mit dem Danaher Konzern sowie den Kartellbehörden über den Vollzug der im Oktober 2019 vereinbarten Übernahme ausgewählter Life-Science-Geschäfte und legte Planungen zur Integra-tion dieser Geschäfte nach erfolgter Übernahme vor. Zudem erörterten wir verschiedene Erweiterungsmöglich-keiten des Sartorius-Portfolios in den Bereichen der Zell- und Gentherapien. Überdies gab der Vorstand einen Überblick über die Weiterentwicklung der Sartorius-Marke und des überarbeiteten Markenauftritts.
In unserer Sitzung am 26. März 2020 berichtete der Vorstand im Zusammenhang mit der Coronavirus- Pandemie ausführlich zu den getroffenen Sicherheitsmaßnahmen zum Schutz der Mitarbeiter. Weitere The-men waren die Auswirkungen der Pandemie auf die Lieferketten, verschiedenste Vorkehrungen zur Aufrecht-erhaltung der Produktion in den weltweiten Werken sowie die Absicherung der finanziellen Stabilität des Unternehmens. In letztgenanntem Zusammenhang stimmten wir dem Vorhaben des Vorstands zu, im Sinne eines risikoaversen Liquiditätsmanagements zusätzliche Kredite aufzunehmen. Überdies sprachen wir über den Status der Integration des zum Jahresende 2019 erworbenen israelischen Unternehmens Biological Industries. Weiterhin unterrichtete uns der Vorstand über die Planungen, die Hauptversammlung in diesem Jahr pandemiebedingt zu verschieben und ohne physische Teilnahme von Aktionären virtuell durchzuführen. Nach Diskussion beschlossen wir zudem über das vom Auditausschuss vorbereitete Verfahren zur Prüfung von Geschäften mit nahestehenden Personen.
Im Rahmen einer Sitzung am 28. April 2020 befassten wir uns eingehend mit verschiedenen Personalthemen und Aspekten des Risikomanagements.
In einer weiteren Aufsichtsratssitzung am 13. Mai 2020 besprachen und beschlossen wir das angepasste Budget für das Jahr 2020, das nach den beiden Akquisitionen von Biological Industries und den Geschäften von Danaher aktu-alisiert worden war. Ein weiterer Tagesordnungspunkt war die Einladung zur Hauptversammlung am 28. Juni 2020 inklusive des modifizierten Dividendenvorschlags, die nach eingehender Beratung beschlossen wurde.
Bei der Aufsichtsratssitzung am 13. August 2020 standen verschiedene Initiativen zur strategischen Weiter-entwicklung beider Unternehmenssparten auf der Agenda, die von den jeweils fachlich zuständigen Mitarbei-tern des oberen Managements vorgestellt wurden. Weiterhin berichtete der Vorstand zu zwei Akquisitions-projekten, beide mit Potenzial, die Positionierung von Sartorius bei Technologien zur Aufreinigung von Wirkstoffen zu verstärken. In diesem Zusammenhang gaben wir nach gründlicher Diskussion unsere Zustim-mung zum Erwerb des Chromatografie-Geschäfts des französischen Life-Science-Unternehmens Novasep. Weitere Themen waren die organisatorische Weiterentwicklung des Personalbereichs sowie die Vorstellung
Sartorius To Our Shareholders Report of the Executive Board 12
Start
I would also like to thank you, our valued customers, business partners, and shareholders. Based on the trust you have placed in us – often throughout many years – you have contributed significantly to the positive development of Sartorius. We would be pleased if you would continue to accompany us in 2021 and beyond and share in the future success of our company.
Sincerely,
Dr. Joachim Kreuzburg CEO and Executive Board Chairman
Sartorius To Our Shareholders Report of the Supervisory Board 14
Start
Report of the Supervisory Board
Dear Shareholders and Business Partners,
For Sartorius, too, the pandemic year 2020 was an exceptional year, filled with unexpected events and major challenges. Instead of celebrating its 150th anniversary, the company saw its primary task since January in protecting the health of employees at their workplaces against coronavirus infections, first in China and then worldwide. At the same time, supply chains had to be maintained and the high demand from biopharmaceutical customers, and increasingly also from vaccine manufacturers, had to be met. The Executive Board and employees took on these challenges in an exemplary manner and mastered them with a great deal of creativity, flexibility and the necessary perseverance. At the same time, the company worked intensively on the further strategic development of its portfolio and was able to close several important acquisitions.
In 2020, the Supervisory Board intensively dealt with the situation and prospects of the company. We advised the Executive Board on corporate management and performed the tasks assigned by German corporate law and the company’s Articles of Association. The Executive Board kept us informed by providing regular, prompt and comprehensive reports, both written and verbal, about all relevant corporate planning and strategic development issues, the progress of business in the divisions, the situation of the Group, including its risk situation, risk management and internal control systems, as well as about compliance. In view of the pandemic, we also received regular reports on the health situation within the company, the precautionary and hygiene concepts, measures to keep supply chains and production up and running, and on the financial risk provisions and stability. The company's significant transactions were discussed in depth by the respective committees responsible as well as by the full Supervisory Board, on the basis of the reports provided by the Executive Board. Following thorough review of the Executive Board's reports and proposed resolutions, we voted on these to the extent that our vote was required.
Our cooperation with the Executive Board was always characterized by openness, constructive dialogue and trust.
Focus of the Supervisory Board’s Conferences
In the reporting year, the Supervisory Board convened slightly more frequently than on average at seven meetings, which was due to the increased need for information and consultation in connection with the pandemic and with various acquisitions. As a rule, we generally met in full session, although two Supervisory Board members were each unable to attend a meeting for personal reasons. A list of the participants by name at the meetings of the Supervisory Board and of its committees is provided on the company’s website. The Executive Board participated in the majority of our conferences, unless only the latter board's matters were concerned in which cases we met without the Executive Board members at our meetings on February 13, 2020; September 15, 2020; and, partly, on December 3, 2020; as well as on April 28, 2020.
Sartorius To Our Shareholders Report of the Supervisory Board 15
Start
On the regular agenda of our meetings were the development of sales revenue, earnings and employment for the Group and the financial situation of the company and of its affiliates. In addition, we conferred on agenda items entailing the further development of our portfolio and acquisition topics, as well as investments, risk management and human resources topics.
At our meeting on February 13, 2020, we fully reviewed the annual and consolidated financial statements for fiscal 2019 and endorsed them based on the reports given by the Audit Committee and the independent auditors who were present during this item of the agenda. Following the report given by the independent auditors and a discussion, we endorsed the non-financial Group statement for the year under review. Beyond this, we conferred upon and approved the agenda, along with the proposed resolutions, for the 2020 Annual Shareholders' Meeting and the proposal for appropriation of the annual profit, as well as decided upon the remuneration of the Executive Board members for 2020. The Executive Board gave us an oral report on the status of meetings with the Danaher Corporation as well as the antitrust authorities about completion of the acquisition of selected life science businesses as agreed in October 2019 and presented plans for integration of these businesses upon closing of the transaction. In addition, we discussed various options to expand the Sartorius portfolio in the areas of cell and gene therapies. Moreover, the Executive Board provided an overview on the further development of the Sartorius brand and its revised look.
At our meeting on March 26, 2020, the Executive Board reported in detail on the safety measures taken to protect employees from the coronavirus pandemic. Additional topics were the impacts of the pandemic on supply chains, the most diverse precautions adopted for keeping production up and running at our plants worldwide, and ensuring the financial stability of the company. Within the context of the last topic, we agreed to the Executive Board’s plans to take out additional credit lines for the purpose of risk-averse liquidity management. Furthermore, we discussed the status of the integration of Biological Industries, the Israeli company acquired at the end of 2019. The Executive Board also informed us about the plans to postpone the Annual Shareholders’ Meeting this year due to the pandemic and to instead hold this meeting virtually without the in-person attendance of shareholders. After this discussion, we additionally approved the procedure prepared by the Audit Committee to review related party transactions.
During our meeting on April 28, 2020, we thoroughly dealt with various personnel topics and the aspects of our risk management.
In a further meeting on May 13, 2020, we discussed and approved the budget for 2020, which had been updated following the two acquisitions of Biological Industries and the Danaher businesses. A further item on the agenda was the invitation to the Annual Shareholders’ Meeting on June 28, 2020, including the modified dividend proposal that was approved following extensive consultations.
On the agenda at the Supervisory Board meeting on August 13, 2020, were various initiatives on the further strategic development of the company and of both divisions for which the respective senior managers responsible held presentations on their assigned areas. Going forward, the Executive Board reported on two
Sartorius To Our Shareholders Report of the Supervisory Board 16
Start
acquisition projects, both with the potential to strengthen the positioning of Sartorius technologies and products for purification of pharmaceutical compounds. After thorough deliberation, we consented to the acquisition of the chromatography business of the French life science company Novasep. Further topics were the organizational further development of the Human Resources Management unit and a presentation on selected HR initiatives. Moreover, the Executive Board gave an overview on liquidity planning for the coming years and of the maturity profiles of various financing components. In this context, we approved the conclusion of a new syndicated loan contract.
Our meeting on September 15, 2020, began with a joint training session for all members of the Supervisory Board on established and more recent applications of Sartorius products, as well as on the respective market trends and opportunities. Afterwards, we conferred on the opportunity for acquiring BIA Separations, which we had already discussed at our August meeting. The Executive Board informed us in depth about the results of the due diligence reviews as well as the transaction structure negotiated. After thorough discussion, we approved the transaction that will significantly strengthen the position of Sartorius for applications in cell and gene therapies. In addition, we decided to adapt the remuneration policy for the Executive Board.
At our meeting on December 3, 2020, we dealt with various topics on corporate governance and compliance. Following our consultations, we approved the wording of our Declaration of Compliance in accordance with the German Corporate Governance Code (GCGC), with this Declaration confirming that Sartorius has complied in full with the recommendations of the current Code up to March 20, 2020. The company fulfills the Code in force since March 21, 2020, with an exception concerning one aspect of the variable remuneration of the Executive Board. Details are provided in the respective Declaration of the Executive Board and of the Supervisory Board printed on page 95 of this Annual Report. Beyond this, we examined the results of the efficiency review of our work and approved the budget submitted by the Executive Board for 2021. We approved the transaction presented by the Executive Board on the acquisition of the filtration specialist WaterSep Bioseparations, which would add another complementary technology to Sartorius' separation portfolio.
Activity Report of the Committees
Four committees support the work of the Supervisory Board. These prepare topics that are then dealt with by the full Supervisory Board and, in individual cases, take decisions instead of the full board, as far as permitted. The committee chairpersons reported regularly to the Supervisory Board on the details of their committee work.
The Executive Task Committee met six times during the reporting year. A member was absent for personal reasons from one meeting; otherwise, the full number of committee members attended all meetings. Its discussions primarily focused on the company’s various strategic actions and on Executive Board matters and succession planning for selected functions, as well as topics on risk management and compliance. In addition, the committee obtained information on the progress of several Group projects and larger investments. It also conferred on the pending regulatory changes to ARUG II and the GCGC to prepare for the discussions and the resolutions to be taken by the full Supervisory Board.
In the year under review, the Audit Committee held four meetings attended by all members. The committee prepared for the full Supervisory Board's conference on endorsement and approval of the consolidated annual financial statements for fiscal 2019 and discussed the quarterly releases and first-half financial reports of 2020. Additional focal points were monitoring the effectiveness of the Group-wide risk management and internal control system by the Internal Auditing Department, as well as measures for further improvement of compliance. The committee also conferred on the subjects of Group financing.
Sartorius To Our Shareholders Report of the Supervisory Board 17
Start
Beyond these items, the committee reviewed the Internal Auditing Department report, which did not indicate any material discrepancies in business transactions, and also considered the department's plans for the upcoming months. With respect to the audit of the annual financial statements for fiscal 2020, the committee confirmed the independence of the auditors and deliberated in detail on selecting auditors to recommend at the Annual Shareholder’s Meeting for appointment and commissioning to perform an audit review, as well as on defining and monitoring the audit procedure and the focal points of the audit.
The Nomination Committee that draws up election proposals to be submitted to the Annual Shareholders' Meeting for shareholder representatives on the Supervisory Board did not meet in the reporting year. The Conciliation Committee pursuant to Section 27, Subsection 3, of the German Codetermination Law ("MitBestG") did not have to be convened either.
Training and Further Education Measures
As a matter of principle, the members of the Supervisory Board proactively undertake the training and further education measures required for their duties. On September 15, 2020, a joint training session organized by the company was attended by all members of the Supervisory Board on selected application areas of Sartorius products as well as on the respective market trends and opportunities.
Audit of the Annual and Consolidated Financial Statements; Review of the Non-Financial Group Statement The annual and consolidated financial statements prepared by the Executive Board for fiscal 2020 and the management report of Sartorius AG were reviewed by the independent auditing company KPMG AG Wirtschaftsprüfungsgesellschaft based in Hanover, Germany. This company had been commissioned by the Audit Committee of the Supervisory Board pursuant to the resolution passed at the Annual Shareholders’ Meeting on June 28, 2020. The independent auditors issued an unqualified audit certificate.
The auditors attended the Audit Committee meeting on February 10, 2021, and the Supervisory Board Meeting on February 11, 2021, and reported on the essential results of their audits.
Sufficient time was allotted for discussion of all issues with the auditors. Written information and audit reports had been sent to all Supervisory Board members on time and were discussed in detail during the meetings mentioned. On the basis of its own examination of the annual Sartorius AG and consolidated financial statements, the Sartorius AG management report and the Group management report, the Supervisory Board concurred with the results of the audit conducted by KPMG and, at the meeting on February 11, 2021, endorsed the financial statements of Sartorius AG and the Group on recommendation by the Audit Committee. The annual financial statements were thus approved. The Supervisory Board and the Executive Board will submit a proposal at the Annual Shareholders’ Meeting on March 26, 2021, to pay dividends of €0.71 per preference share and €0.70 per ordinary share to shareholders from the retained profit.
Furthermore, the Executive Board submitted a Non-Financial Group Statement based on the German Law to Strengthen Companies’ Non-Financial Reporting to implement the EU CSR Directive. The content of this statement was submitted to a voluntary review by KPMG AG Wirtschaftsprüfungsgesellschaft based on a limited assurance engagement. On the basis of this review, KPMG issued an unqualified opinion. The auditing company attended the Supervisory Board meeting on February 11, 2020, and reported on the results of its audit review. Following intensive discussions and examination, the Non-Financial Group Statement was also endorsed by the Supervisory Board members.
Sartorius To Our Shareholders Report of the Supervisory Board 18
Start
Composition of the Supervisory Board and the Executive Board
In fiscal 2020, there was a change in personnel in the employee representatives on the Supervisory Board. Following his many years of service on this board, Michael Dohrmann retired on May 15, 2020, after reaching early retirement age. We would like to thank Mr. Dohrmann for his highly dedicated and constructive collaboration over many years. The company’s local court of registration Amtsgericht Göttingen appointed Dietmar Müller, effective May 16, 2020, as a new Supervisory Board member. Regarding the Executive Board, there were no personnel changes in 2020.
We would like to thank the Executive Board and all employees across the globe for their exceptionally intensive and successful work throughout the fiscal year ended. In addition, we would like to express our appreciation to our shareholders for the confidence they have shown yet again in Sartorius.
Hamburg, February 2021
For the Supervisory Board
Dr. Lothar Kappich
Chairman
Sartorius To Our Shareholders Sartorius Shares 19
Start
Sartorius Shares Stock Markets Impacted by Pandemic The coronavirus pandemic and the measures taken to stem it caused global economic activity to drop sharply and company profit expectations to fall in the first quarter of 2020. Global stock markets recorded significant losses as a result of which leading indices dropped to a multi-year low in mid-March. Supported by governments’ extensive economic-stimulus packages and a further loosening of monetary policy, a countermovement set in at the beginning of the second quarter that held through the end of the year. Against this backdrop, the Dow Jones reached a new all-time high, closing the reporting period up 6.0% at 30,606 points. The German benchmark index DAX likewise reached a record high, closing up 3.5% at 13,719 points. The MDAX and the German technology index TecDAX, to which Sartorius preference shares belong, also saw a rise of 8.8% and 6.6%, respectively.
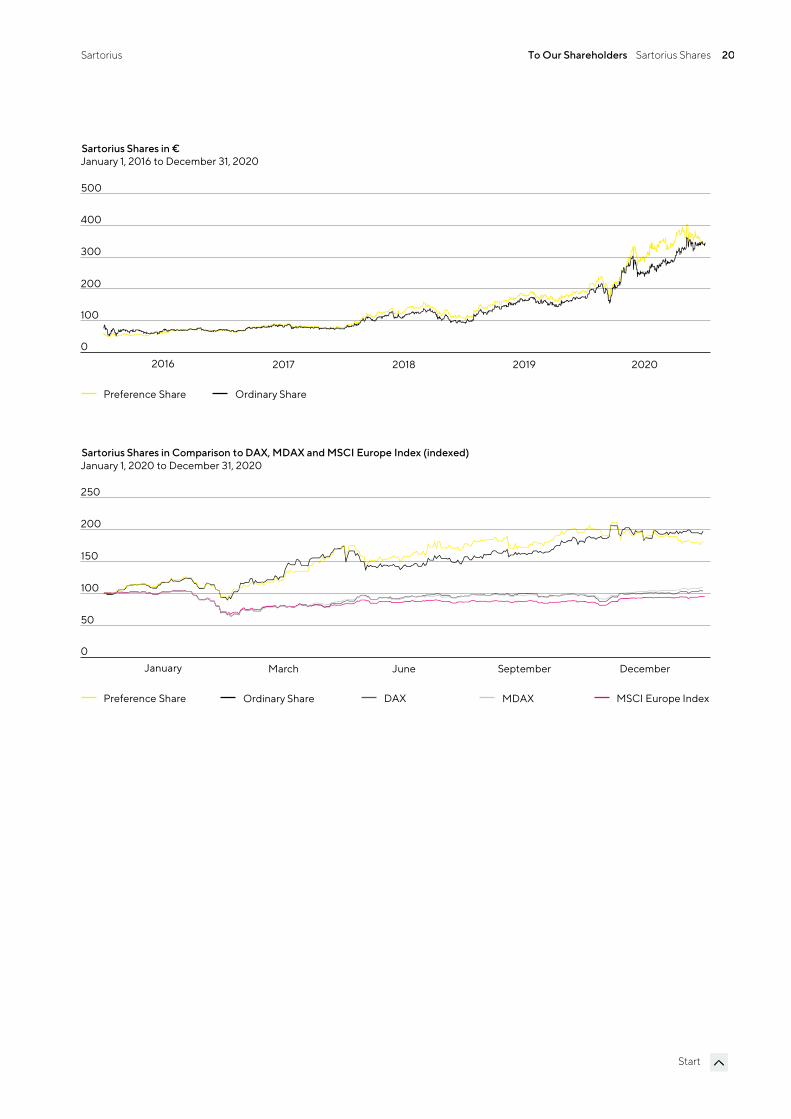
Sartorius Shares Rise Sharply The prices of both classes of Sartorius AG shares developed positively yet again. Contributing factors included better-than-expected business performance, several revisions to forecasts, particularly in the Bioprocess Solutions Division, and the completion of three acquisitions. Sartorius preference shares closed the 2020 stock-market year up 80.1% at €343.6. Ordinary shares closed around 97.1% higher, at €345.0.
Sartorius AG preference shares have been listed on the TecDAX since 2012 and additionally on the MDAX since 2018. At the end of 2020, the company’s shares on the MDAX ranked 10th by market capitalization (2019: 11th) and 19th by trading volume (2019: 36th). On the TecDAX, the rankings for Sartorius shares were 6th place for market capitalization (2019: 6th place) and 8th place based on trading volume (2019: 16th place). In the reporting period, Sartorius shares were also admitted to the DAX 50 ESG, a new index for sustainable investments operated by Deutsche Börse.
Facts about the Shares
ISIN DE0007165607 (ordinary shares)
DE0007165631 (preference shares)
Designated sponsor Oddo Seydler Bank AG | M.M. Warburg & Co. (AG & Co.) KGaA
Market segment Prime Standard
Indexes MDAX | TecDAX | MSCI Germany Index | CDAX| Prime All Share-Index | Technology All Share-
Index | NISAX20 | STOXX Europe 600 | DAX 50 ESG
Stock exchanges XETRA | Frankfurt Main | Hanover | Hamburg | Berlin | Munich |Dusseldorf |Stuttgart | Tradegate
Number of shares 74,880,000 no-par individual share certificates with a calculated par value of €1 per share
Of which 37,440,000 ordinary shares
37,440,000 preference shares
Of which shares outstanding 34,226,009 ordinary shares
34,189,853 preference shares
Sartorius To Our Shareholders Sartorius Shares 20
Start
200
300
400
January 1, 2016 to December 31, 2020Sartorius Shares in €
0
100
Preference Share
2016 2020201920182017
Ordinary Share
500
January 1, 2020 to December 31, 2020Sartorius Shares in Comparison to DAX, MDAX and MSCI Europe Index (indexed)
Preference Share Ordinary Share
January DecemberSeptemberJuneMarch
DAX MDAX MSCI Europe Index
100
150
200
0
50
250
Sartorius To Our Shareholders Sartorius Shares 21
Start
Market Capitalization and Trading Volume The market capitalization of Sartorius AG ordinary and preference shares rose by around 88.3% in the reporting period to €23.6 billion as of December 31, 2020, up from €12.5 billion in 2019.
The average number of preference shares traded daily on the Frankfurt Stock Exchange (Xetra and trading floor) was 80,572 during the period under review compared with 65,810 the previous year. The trading volume was €5.9 billion (2019: €2.7 billion).
Due to the low free float of Sartorius’ ordinary shares, they are traded only to a limited extent. Thus, the average number of ordinary shares traded daily was 2,774 compared with 1,238 in the previous year. The corresponding trading volume was around €179.6 million (2019: €45.7 million).
Investor Relations Sartorius investor relations activities follow the objective of making the current and future development of the company transparent for its stakeholders. To achieve this objective, Sartorius maintains an ongoing, open dialog with shareholders, potential investors and financial analysts.
Besides providing quarterly, first-half and annual reports, we inform the capital market and the interested public at quarterly teleconferences and in regularly published press releases about the current development of our business and other material events at the company. Moreover, Group management and the IR team were available to communicate with capital market participants at mostly virtual conferences and roadshows.
During the reporting period, Sartorius received the Investors’ Darling award from Manager Magazin and the HHL Leipzig Graduate School of Management in recognition of its financial market communications; it took second place in the MDAX category. The IR team was also recognized by the trade magazine Institutional Investor.
All information and publications about our company and its shares are available on our website at www.sartorius.com.
Sartorius To Our Shareholders Sartorius Shares 22
Start
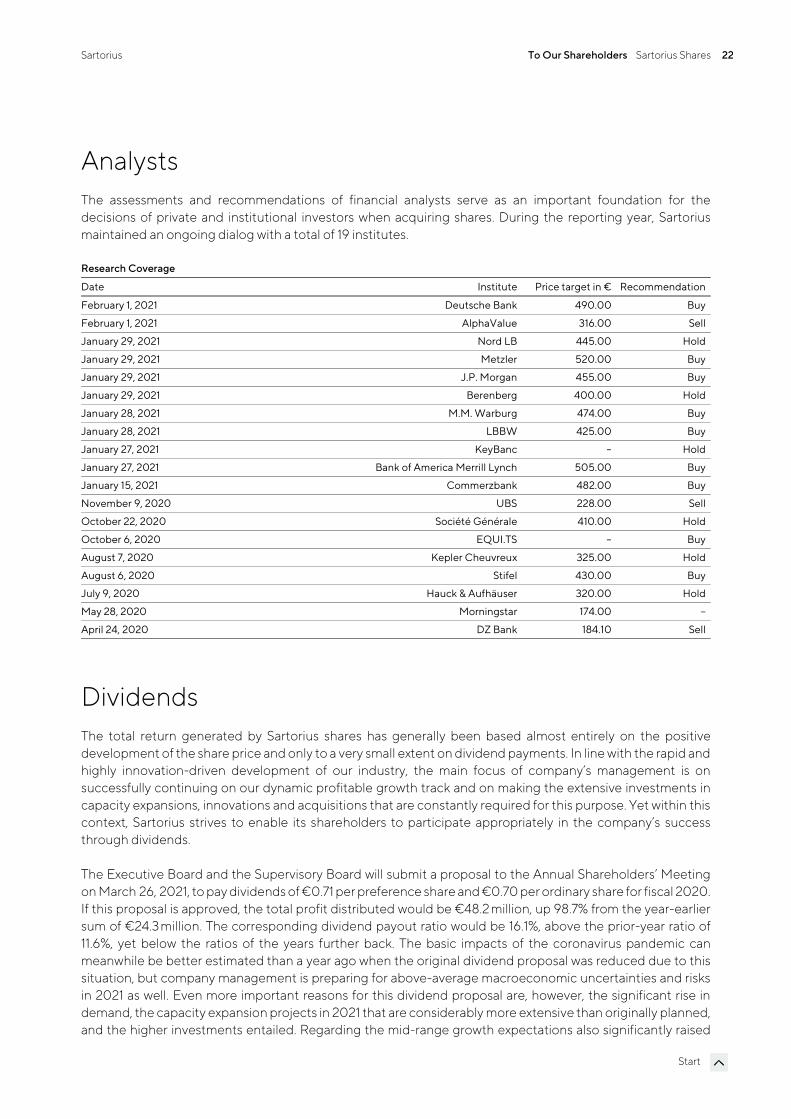
Analysts The assessments and recommendations of financial analysts serve as an important foundation for the decisions of private and institutional investors when acquiring shares. During the reporting year, Sartorius maintained an ongoing dialog with a total of 19 institutes.
Research Coverage
Date Institute Price target in € Recommendation
February 1, 2021 Deutsche Bank 490.00 Buy
February 1, 2021 AlphaValue 316.00 Sell
January 29, 2021 Nord LB 445.00 Hold
January 29, 2021 Metzler 520.00 Buy
January 29, 2021 J.P. Morgan 455.00 Buy
January 29, 2021 Berenberg 400.00 Hold
January 28, 2021 M.M. Warburg 474.00 Buy
January 28, 2021 LBBW 425.00 Buy
January 27, 2021 KeyBanc – Hold
January 27, 2021 Bank of America Merrill Lynch 505.00 Buy
January 15, 2021 Commerzbank 482.00 Buy
November 9, 2020 UBS 228.00 Sell
October 22, 2020 Société Générale 410.00 Hold
October 6, 2020 EQUI.TS – Buy
August 7, 2020 Kepler Cheuvreux 325.00 Hold
August 6, 2020 Stifel 430.00 Buy
July 9, 2020 Hauck & Aufhäuser 320.00 Hold
May 28, 2020 Morningstar 174.00 –
April 24, 2020 DZ Bank 184.10 Sell
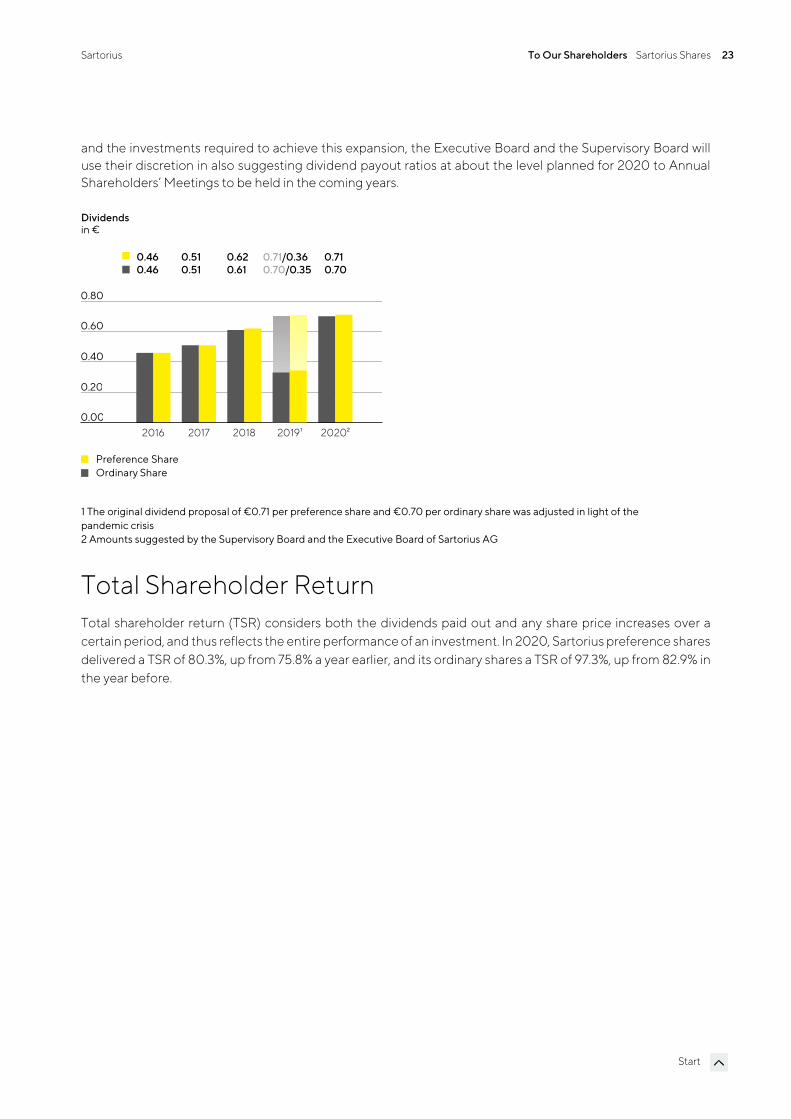
Dividends The total return generated by Sartorius shares has generally been based almost entirely on the positive development of the share price and only to a very small extent on dividend payments. In line with the rapid and highly innovation-driven development of our industry, the main focus of company’s management is on successfully continuing on our dynamic profitable growth track and on making the extensive investments in capacity expansions, innovations and acquisitions that are constantly required for this purpose. Yet within this context, Sartorius strives to enable its shareholders to participate appropriately in the company’s success through dividends.
The Executive Board and the Supervisory Board will submit a proposal to the Annual Shareholders’ Meeting on March 26, 2021, to pay dividends of €0.71 per preference share and €0.70 per ordinary share for fiscal 2020. If this proposal is approved, the total profit distributed would be €48.2 million, up 98.7% from the year-earlier sum of €24.3 million. The corresponding dividend payout ratio would be 16.1%, above the prior-year ratio of 11.6%, yet below the ratios of the years further back. The basic impacts of the coronavirus pandemic can meanwhile be better estimated than a year ago when the original dividend proposal was reduced due to this situation, but company management is preparing for above-average macroeconomic uncertainties and risks in 2021 as well. Even more important reasons for this dividend proposal are, however, the significant rise in demand, the capacity expansion projects in 2021 that are considerably more extensive than originally planned, and the higher investments entailed. Regarding the mid-range growth expectations also significantly raised
Sartorius To Our Shareholders Sartorius Shares 23
Start
and the investments required to achieve this expansion, the Executive Board and the Supervisory Board will use their discretion in also suggesting dividend payout ratios at about the level planned for 2020 to Annual Shareholders’ Meetings to be held in the coming years.
1 The original dividend proposal of €0.71 per preference share and €0.70 per ordinary share was adjusted in light of the pandemic crisis 2 Amounts suggested by the Supervisory Board and the Executive Board of Sartorius AG
Total Shareholder Return Total shareholder return (TSR) considers both the dividends paid out and any share price increases over a certain period, and thus reflects the entire performance of an investment. In 2020, Sartorius preference shares delivered a TSR of 80.3%, up from 75.8% a year earlier, and its ordinary shares a TSR of 97.3%, up from 82.9% in the year before.
2016 2017 2018 2019¹ 2020²0.00
0.20
0.40
0.60
0.80
Preference ShareOrdinary Share
in €Dividends
0.46 0.51 0.62 0.71/0.36 0.710.46 0.51 0.61 0.70/0.35 0.70
Sartorius To Our Shareholders Sartorius Shares 24
Start
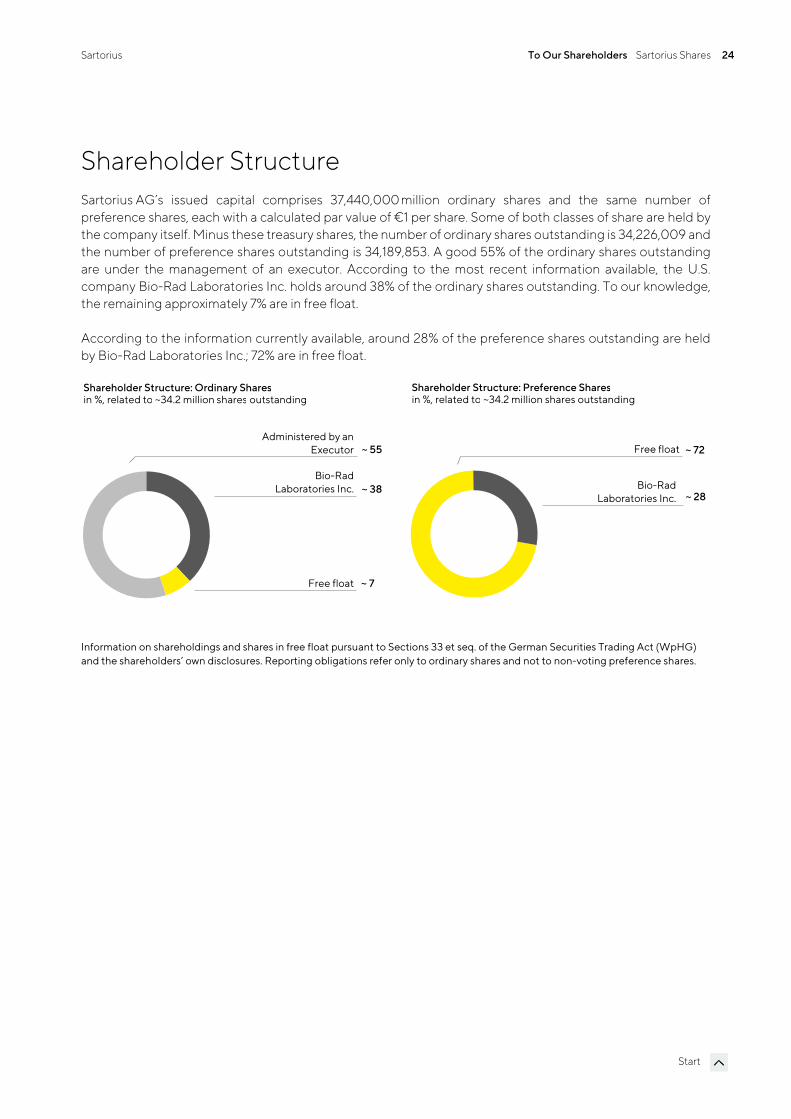
Shareholder Structure Sartorius AG’s issued capital comprises 37,440,000 million ordinary shares and the same number of preference shares, each with a calculated par value of €1 per share. Some of both classes of share are held by the company itself. Minus these treasury shares, the number of ordinary shares outstanding is 34,226,009 and the number of preference shares outstanding is 34,189,853. A good 55% of the ordinary shares outstanding are under the management of an executor. According to the most recent information available, the U.S. company Bio-Rad Laboratories Inc. holds around 38% of the ordinary shares outstanding. To our knowledge, the remaining approximately 7% are in free float.
According to the information currently available, around 28% of the preference shares outstanding are held by Bio-Rad Laboratories Inc.; 72% are in free float.
Information on shareholdings and shares in free float pursuant to Sections 33 et seq. of the German Securities Trading Act (WpHG) and the shareholders’ own disclosures. Reporting obligations refer only to ordinary shares and not to non-voting preference shares.
Shareholder Structure: Ordinary Sharesin %, related to ~34.2 million shares outstanding
Administered by an Executor
Bio-RadLaboratories Inc.
Free float
~ 55
~ 38
~ 7
Shareholder Structure: Preference Sharesin %, related to ~34.2 million shares outstanding
Free float ~ 72
~ 28Bio-Rad
Laboratories Inc.
Sartorius To Our Shareholders Sartorius Shares 25
Start
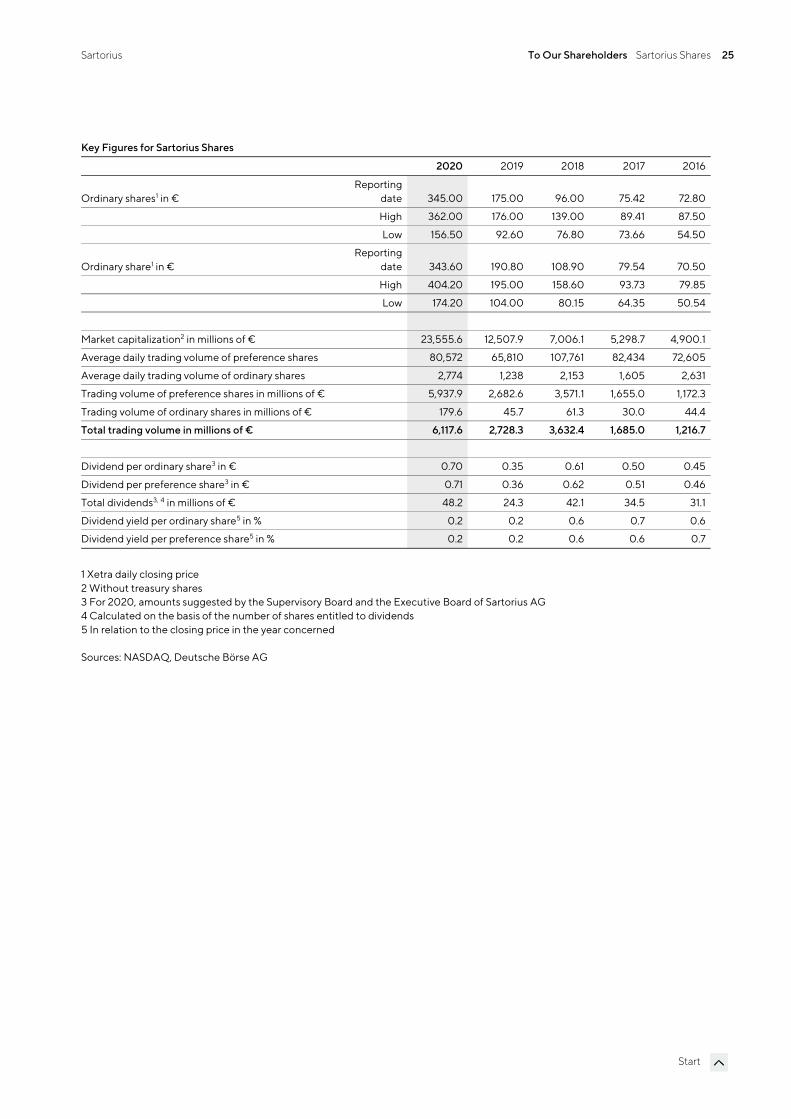
Key Figures for Sartorius Shares
2020 2019 2018 2017 2016
Ordinary shares1 in € Reporting
date 345.00 175.00 96.00 75.42 72.80
High 362.00 176.00 139.00 89.41 87.50
Low 156.50 92.60 76.80 73.66 54.50
Ordinary share1 in € Reporting
date 343.60 190.80 108.90 79.54 70.50
High 404.20 195.00 158.60 93.73 79.85
Low 174.20 104.00 80.15 64.35 50.54
Market capitalization2 in millions of € 23,555.6 12,507.9 7,006.1 5,298.7 4,900.1
Average daily trading volume of preference shares 80,572 65,810 107,761 82,434 72,605
Average daily trading volume of ordinary shares 2,774 1,238 2,153 1,605 2,631
Trading volume of preference shares in millions of € 5,937.9 2,682.6 3,571.1 1,655.0 1,172.3
Trading volume of ordinary shares in millions of € 179.6 45.7 61.3 30.0 44.4
Total trading volume in millions of € 6,117.6 2,728.3 3,632.4 1,685.0 1,216.7
Dividend per ordinary share3 in € 0.70 0.35 0.61 0.50 0.45
Dividend per preference share3 in € 0.71 0.36 0.62 0.51 0.46
Total dividends3, 4 in millions of € 48.2 24.3 42.1 34.5 31.1
Dividend yield per ordinary share5 in % 0.2 0.2 0.6 0.7 0.6
Dividend yield per preference share5 in % 0.2 0.2 0.6 0.6 0.7
1 Xetra daily closing price 2 Without treasury shares 3 For 2020, amounts suggested by the Supervisory Board and the Executive Board of Sartorius AG 4 Calculated on the basis of the number of shares entitled to dividends 5 In relation to the closing price in the year concerned
Sources: NASDAQ, Deutsche Börse AG
Combined Group Management Report
Sartorius Combined Group Management Report Structure and Management of the Group 27
Start
Structure and Management of the Group
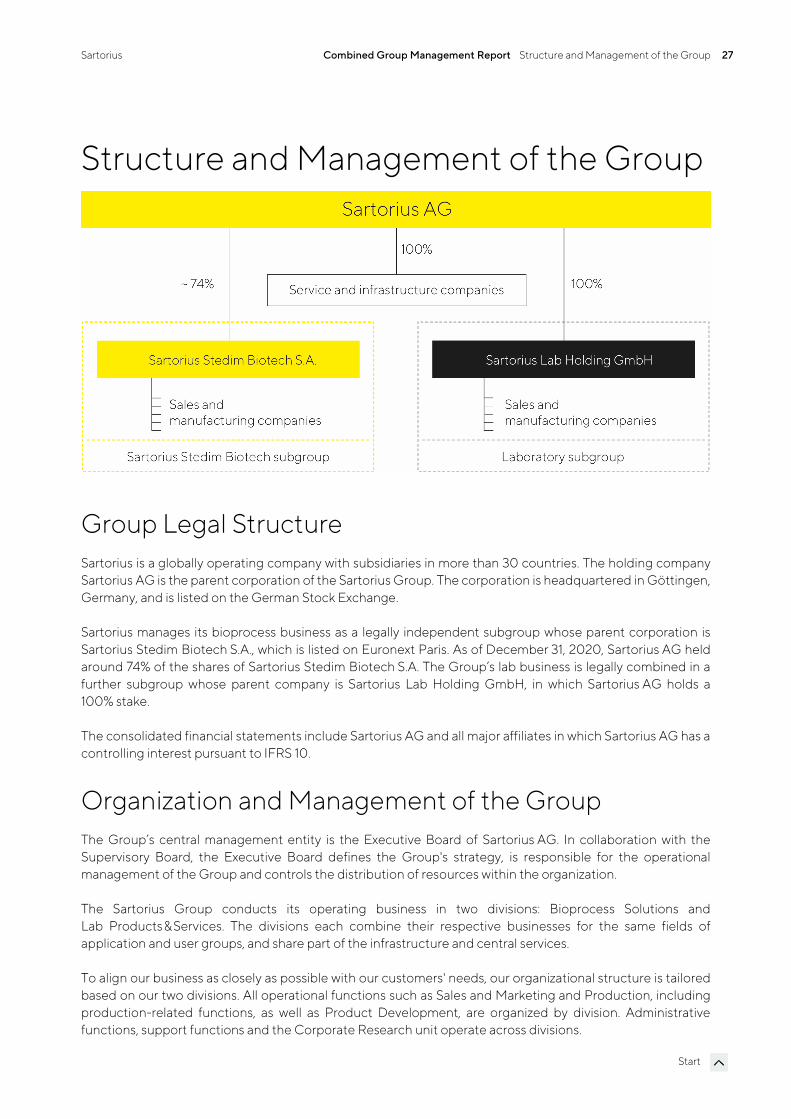
Group Legal Structure Sartorius is a globally operating company with subsidiaries in more than 30 countries. The holding company Sartorius AG is the parent corporation of the Sartorius Group. The corporation is headquartered in Göttingen, Germany, and is listed on the German Stock Exchange.
Sartorius manages its bioprocess business as a legally independent subgroup whose parent corporation is Sartorius Stedim Biotech S.A., which is listed on Euronext Paris. As of December 31, 2020, Sartorius AG held around 74% of the shares of Sartorius Stedim Biotech S.A. The Group’s lab business is legally combined in a further subgroup whose parent company is Sartorius Lab Holding GmbH, in which Sartorius AG holds a 100% stake.
The consolidated financial statements include Sartorius AG and all major affiliates in which Sartorius AG has a controlling interest pursuant to IFRS 10.
Organization and Management of the Group The Group’s central management entity is the Executive Board of Sartorius AG. In collaboration with the Supervisory Board, the Executive Board defines the Group's strategy, is responsible for the operational management of the Group and controls the distribution of resources within the organization.
The Sartorius Group conducts its operating business in two divisions: Bioprocess Solutions and Lab Products &Services. The divisions each combine their respective businesses for the same fields of application and user groups, and share part of the infrastructure and central services.
To align our business as closely as possible with our customers' needs, our organizational structure is tailored based on our two divisions. All operational functions such as Sales and Marketing and Production, including production-related functions, as well as Product Development, are organized by division. Administrative functions, support functions and the Corporate Research unit operate across divisions.
Sartorius Combined Group Management Report Structure and Management of the Group 28
Start
Implementing the Group’s various strategies and projects at the local level is the responsibility of the national affiliates. The management bodies of the local companies run their organizations in accordance with the applicable statutory provisions, articles of association and rules of procedure and in keeping with the principles of corporate governance that apply throughout the Sartorius Group worldwide.
Changes in the Group Portfolio In the reporting year, Sartorius successfully closed the acquisition, announced in October 2019, of selected life science businesses from Danaher Corporation. The transaction was completed on April 30, 2020, after receiving the required regulatory approvals. The businesses acquired contributed around €105 million to Group sales in 2020 and cover various bioprocessing and laboratory technologies, which are complementary to the portfolio lineups of both divisions. Sartorius is thus extending its market position in bioanalytics as well as in the purification and filtration of medications manufactured using biotechnological methods. The company’s broader offering will support customers even more comprehensively in the development of biotech medicines and vaccines, as well as in the safe and efficient production of such biopharmaceuticals. As a result of the acquisition, some 300 new employees joined the Sartorius Group: around 100 employees were assigned to the Bioprocess Solutions Division and 200 to the Lab Products &Services Division.
In addition, Sartorius through its subgroup Sartorius Stedim Biotech acquired the Slovenian purification specialist BIA Separations in November 2020. With sales revenue of around €25 million reported for 2020 and around 120 employees, BIA Separations develops and manufactures market-leading products for purification and analysis of large molecules, such as viruses, plasmids and mRNA, which are used in gene and cell therapies and other advanced therapies. BIA Separation’s technology for manufacturing-scale purification is already used in the production of the first commercialized advanced therapeutics, and this company has a strong presence with new drug candidates that are still in the clinical trial pipeline. The business will be allocated to the Bioprocess Solutions Division.
In December 2020, Sartorius acquired the U.S. filtration expert WaterSep BioSeparations LLC through its subgroup Sartorius Stedim Biotech. WaterSep BioSeparations develops, manufactures and markets single-use and reusable hollow-fiber membrane devices and pre-sterilized assemblies for upstream and downstream biopharmaceutical applications. Headquartered in Marlborough, Massachusetts, USA, the company employs around 15 people and in 2020 earned sales revenue of around U.S. $2.5 million.
Financial Controlling and Key Performance Indicators The Sartorius Group is managed using a number of key performance indicators, which are also decisive for the determination of the variable remuneration component for the Executive Board and managers.
A key management parameter that Sartorius uses to measure the development of its size is currency-adjusted growth of sales revenue, i.e., sales in constant currencies. The key profitability measure is EBITDA adjusted for extraordinary items, i.e., underlying EBITDA, and the corresponding margin.
With respect to the Sartorius Group's debt financing capacity, the key indicator is the ratio of net debt to underlying EBITDA for the last twelve months. Furthermore, the CAPEX ratio, i.e., capital expenditures in proportion to sales revenue, represents a key control parameter.
Sartorius Combined Group Management Report Structure and Management of the Group 29
Start
In addition, the following financial and non-financial indicators are reported on a regular basis:
Order intake
Relevant net profit |Earnings per share
Annual net profit | Earnings per share
Equity ratio
Net working capital
Net cash flow from operating activities
Number of employees
The annual financial forecast that is published at the beginning of a fiscal year for the Group and the divisions refers, as a rule, to the development of sales revenue and of the underlying EBITDA margin. The expected CAPEX ratio, as well as a directional forecast for the ratio of net debt to underlying EBITDA, is additionally indicated for the Group.
Further non-financial indicators are disclosed in the non-financial statement.
Sartorius Combined Group Management Report Business Model, Strategy and Goals 30
Start
Business Model, Strategy and Goals As a leading partner of life science research and the biopharmaceutical industry, Sartorius helps its customers in the development and manufacture of biotech medications and vaccines – from initial idea in the lab to commercial-scale production.
Biopharmaceuticals are integral components of advanced medicine and are used to treat many illnesses, mostly of a serious nature. However, long development times and complex production make these medications very expensive. This leads to high healthcare costs in industrialized countries and to the situation that patients in less developed countries are often excluded from treatment with such drugs. The development of a biopharmaceutical medication is a long haul: It takes more than ten years on average to bring a new drug out on the market, costing more than two billion dollars. On top of this, biotechnological manufacturing processes for such high-tech medications are demanding and must be developed individually for each biologic compound. As a pioneer and technology leader in the biopharma sector, Sartorius with its products and services is enabling its customers to make their research, development and production processes easier and more efficient so that advanced therapeutics can reach the market faster and become accessible for more people worldwide.
The maturity and intensity of competition in this still comparably young industry are successively increasing. To support customers in meeting this challenge, we are constantly further developing our portfolio. A key competitive advantage is our broad understanding of applications based on our clear focus on the sector. We are thoroughly familiar with the value-added chains of our customers and understand the interaction of the employed systems particularly well. A further important success factor of the company is to offer highly differentiating technologies. Our innovative power rests on three pillars: our own specialized product development, alliances with partners, and the integration of innovations through acquisitions.
With the biopharma industry, Sartorius is focusing on an attractive market, which is characterized by strong growth momentum and long-term trends. Medical progress provides positive impetus, leading to the discovery and approval of new biopharmaceuticals. The biopharmaceutical industry is thus increasingly relying on advanced therapies, such as cell and gene therapeutics and biotech tissue products. Further primary growth drivers are a growing world population and an increase in age-related diseases in industrialized countries. In addition, rising incomes in emerging countries are leading to improved access to healthcare and rising demand for medications. Biosimilars, the generic versions of reference biologics that have lost their patent protection, account for a share of the biopharma market that is currently still small, but especially fast-growing. As a result of these factors, the volumes of biotech medications and the demand for the appropriate production technologies are steadily increasing, with market growth largely independent of business cycles.
The Sartorius Group has organized its business in two divisions: Bioprocess Solutions and Lab Products&Services. We will outline the divisions' market positioning and strategy in the sections that follow.
Sartorius Combined Group Management Report Business Model, Strategy and Goals 31
Start
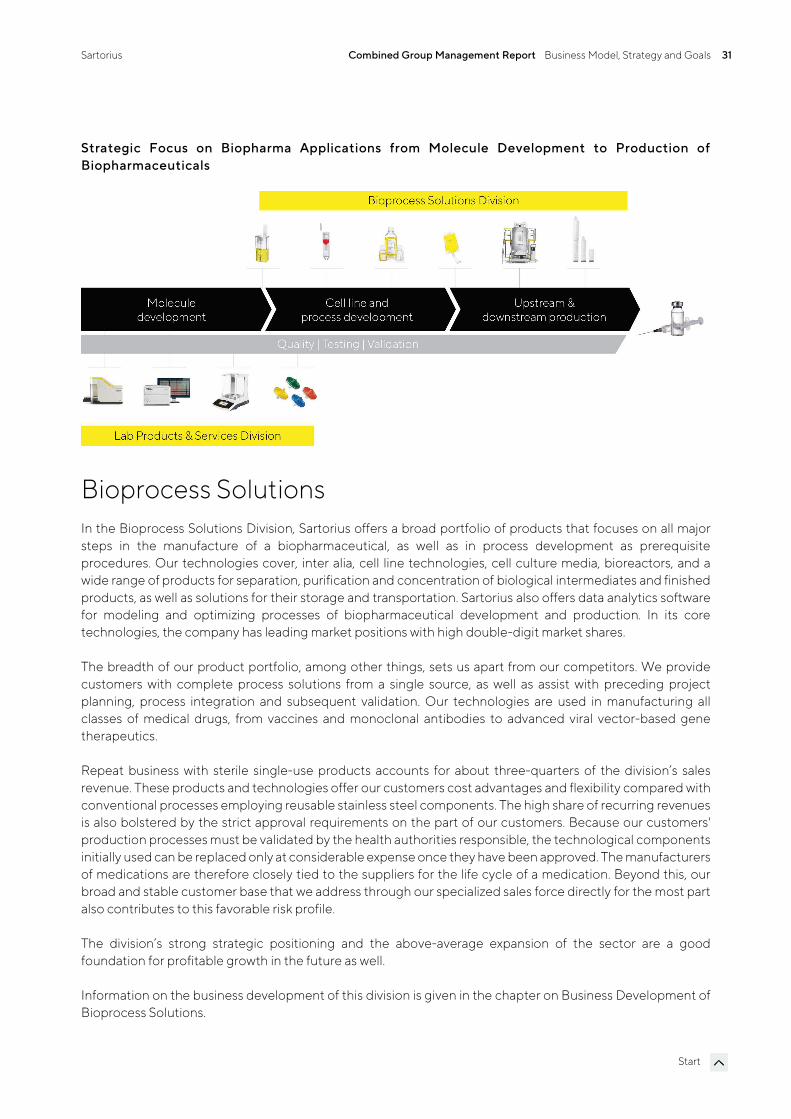
Strategic Focus on Biopharma Applications from Molecule Development to Production of Biopharmaceuticals
Bioprocess Solutions In the Bioprocess Solutions Division, Sartorius offers a broad portfolio of products that focuses on all major steps in the manufacture of a biopharmaceutical, as well as in process development as prerequisite procedures. Our technologies cover, inter alia, cell line technologies, cell culture media, bioreactors, and a wide range of products for separation, purification and concentration of biological intermediates and finished products, as well as solutions for their storage and transportation. Sartorius also offers data analytics software for modeling and optimizing processes of biopharmaceutical development and production. In its core technologies, the company has leading market positions with high double-digit market shares.
The breadth of our product portfolio, among other things, sets us apart from our competitors. We provide customers with complete process solutions from a single source, as well as assist with preceding project planning, process integration and subsequent validation. Our technologies are used in manufacturing all classes of medical drugs, from vaccines and monoclonal antibodies to advanced viral vector-based gene therapeutics.
Repeat business with sterile single-use products accounts for about three-quarters of the division’s sales revenue. These products and technologies offer our customers cost advantages and flexibility compared with conventional processes employing reusable stainless steel components. The high share of recurring revenues is also bolstered by the strict approval requirements on the part of our customers. Because our customers' production processes must be validated by the health authorities responsible, the technological components initially used can be replaced only at considerable expense once they have been approved. The manufacturers of medications are therefore closely tied to the suppliers for the life cycle of a medication. Beyond this, our broad and stable customer base that we address through our specialized sales force directly for the most part also contributes to this favorable risk profile.
The division’s strong strategic positioning and the above-average expansion of the sector are a good foundation for profitable growth in the future as well.
Information on the business development of this division is given in the chapter on Business Development of Bioprocess Solutions.
Sartorius Combined Group Management Report Business Model, Strategy and Goals 32
Start
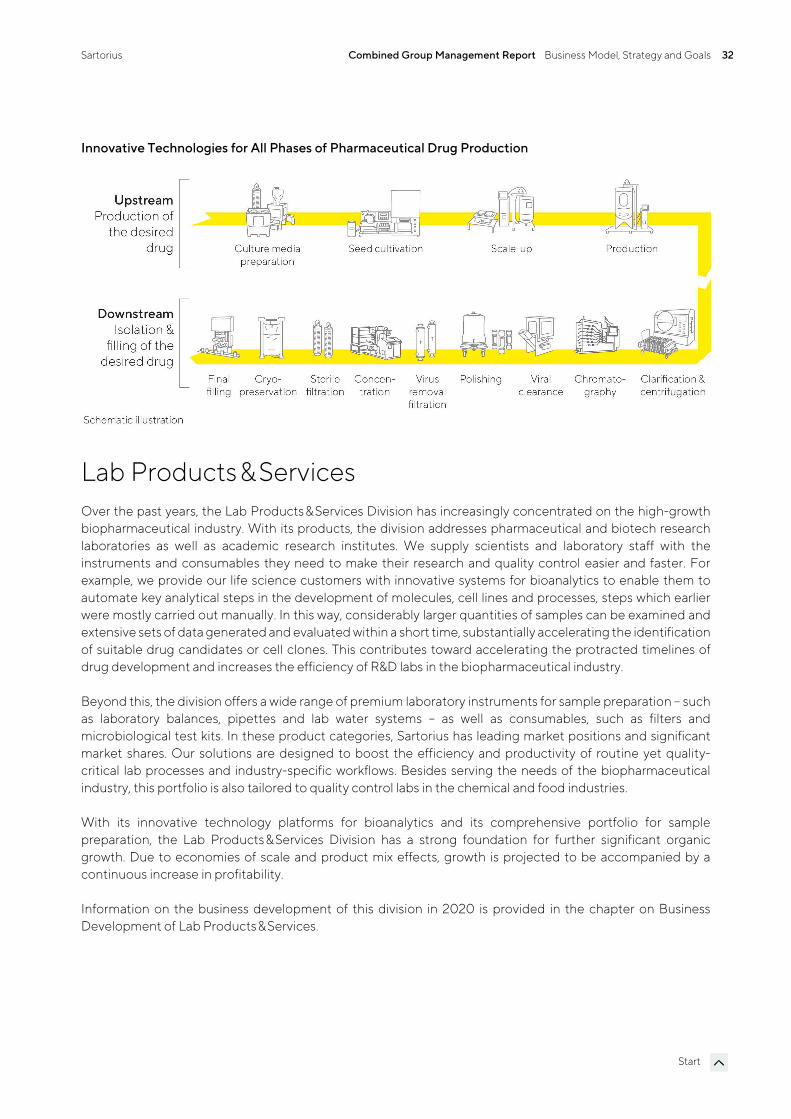
Innovative Technologies for All Phases of Pharmaceutical Drug Production
Lab Products &Services Over the past years, the Lab Products &Services Division has increasingly concentrated on the high-growth biopharmaceutical industry. With its products, the division addresses pharmaceutical and biotech research laboratories as well as academic research institutes. We supply scientists and laboratory staff with the instruments and consumables they need to make their research and quality control easier and faster. For example, we provide our life science customers with innovative systems for bioanalytics to enable them to automate key analytical steps in the development of molecules, cell lines and processes, steps which earlier were mostly carried out manually. In this way, considerably larger quantities of samples can be examined and extensive sets of data generated and evaluated within a short time, substantially accelerating the identification of suitable drug candidates or cell clones. This contributes toward accelerating the protracted timelines of drug development and increases the efficiency of R&D labs in the biopharmaceutical industry.
Beyond this, the division offers a wide range of premium laboratory instruments for sample preparation – such as laboratory balances, pipettes and lab water systems – as well as consumables, such as filters and microbiological test kits. In these product categories, Sartorius has leading market positions and significant market shares. Our solutions are designed to boost the efficiency and productivity of routine yet quality-critical lab processes and industry-specific workflows. Besides serving the needs of the biopharmaceutical industry, this portfolio is also tailored to quality control labs in the chemical and food industries.
With its innovative technology platforms for bioanalytics and its comprehensive portfolio for sample preparation, the Lab Products &Services Division has a strong foundation for further significant organic growth. Due to economies of scale and product mix effects, growth is projected to be accompanied by a continuous increase in profitability.
Information on the business development of this division in 2020 is provided in the chapter on Business Development of Lab Products &Services.
Sartorius Combined Group Management Report Business Model, Strategy and Goals 33
Start
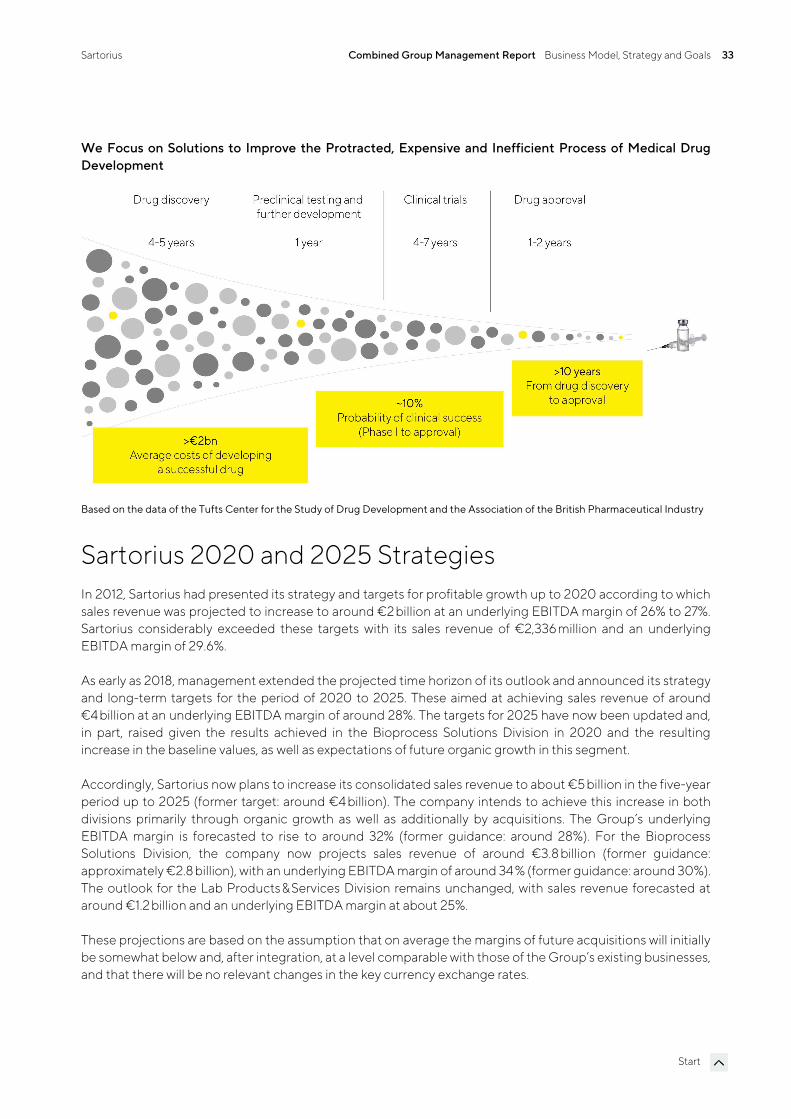
We Focus on Solutions to Improve the Protracted, Expensive and Inefficient Process of Medical Drug Development
Based on the data of the Tufts Center for the Study of Drug Development and the Association of the British Pharmaceutical Industry
Sartorius 2020 and 2025 Strategies In 2012, Sartorius had presented its strategy and targets for profitable growth up to 2020 according to which sales revenue was projected to increase to around €2 billion at an underlying EBITDA margin of 26% to 27%. Sartorius considerably exceeded these targets with its sales revenue of €2,336 million and an underlying EBITDA margin of 29.6%.
As early as 2018, management extended the projected time horizon of its outlook and announced its strategy and long-term targets for the period of 2020 to 2025. These aimed at achieving sales revenue of around €4 billion at an underlying EBITDA margin of around 28%. The targets for 2025 have now been updated and, in part, raised given the results achieved in the Bioprocess Solutions Division in 2020 and the resulting increase in the baseline values, as well as expectations of future organic growth in this segment.
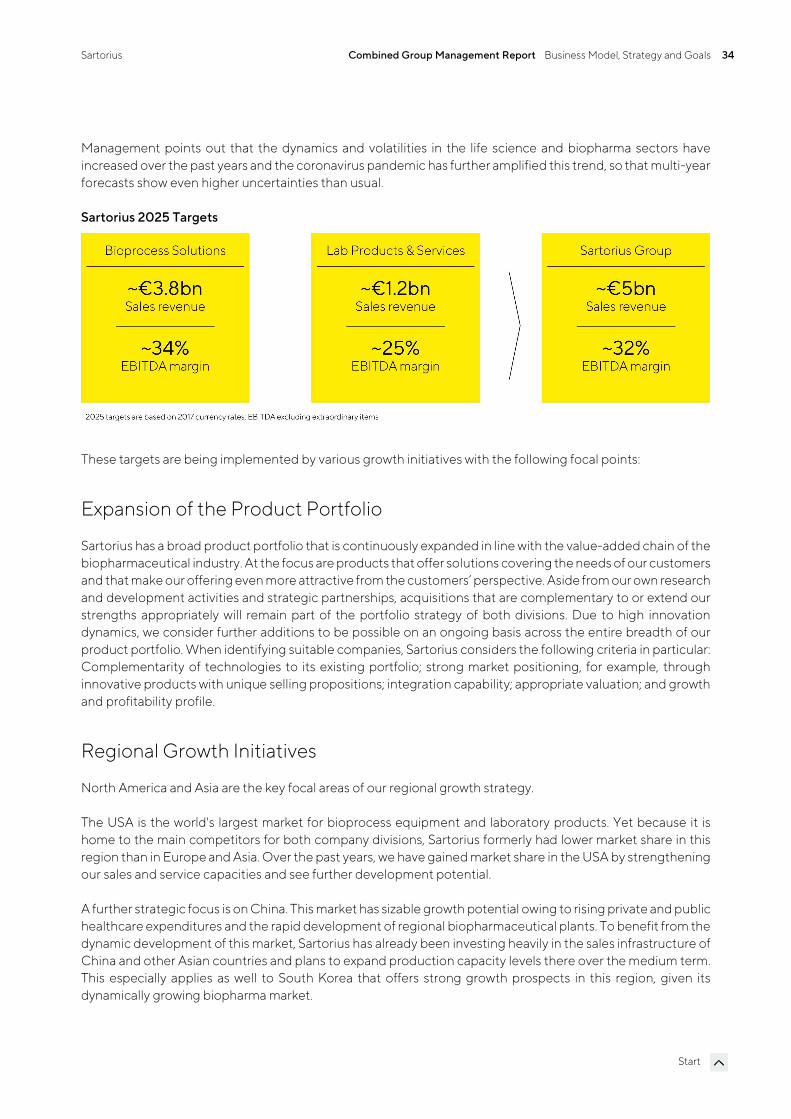
Accordingly, Sartorius now plans to increase its consolidated sales revenue to about €5 billion in the five-year period up to 2025 (former target: around €4 billion). The company intends to achieve this increase in both divisions primarily through organic growth as well as additionally by acquisitions. The Group’s underlying EBITDA margin is forecasted to rise to around 32% (former guidance: around 28%). For the Bioprocess Solutions Division, the company now projects sales revenue of around €3.8 billion (former guidance: approximately €2.8 billion), with an underlying EBITDA margin of around 34 % (former guidance: around 30%). The outlook for the Lab Products &Services Division remains unchanged, with sales revenue forecasted at around €1.2 billion and an underlying EBITDA margin at about 25%.
These projections are based on the assumption that on average the margins of future acquisitions will initially be somewhat below and, after integration, at a level comparable with those of the Group’s existing businesses, and that there will be no relevant changes in the key currency exchange rates.
Sartorius Combined Group Management Report Business Model, Strategy and Goals 34
Start
Management points out that the dynamics and volatilities in the life science and biopharma sectors have increased over the past years and the coronavirus pandemic has further amplified this trend, so that multi-year forecasts show even higher uncertainties than usual.
Sartorius 2025 Targets
These targets are being implemented by various growth initiatives with the following focal points:
Expansion of the Product Portfolio
Sartorius has a broad product portfolio that is continuously expanded in line with the value-added chain of the biopharmaceutical industry. At the focus are products that offer solutions covering the needs of our customers and that make our offering even more attractive from the customers’ perspective. Aside from our own research and development activities and strategic partnerships, acquisitions that are complementary to or extend our strengths appropriately will remain part of the portfolio strategy of both divisions. Due to high innovation dynamics, we consider further additions to be possible on an ongoing basis across the entire breadth of our product portfolio. When identifying suitable companies, Sartorius considers the following criteria in particular: Complementarity of technologies to its existing portfolio; strong market positioning, for example, through innovative products with unique selling propositions; integration capability; appropriate valuation; and growth and profitability profile.
Regional Growth Initiatives
North America and Asia are the key focal areas of our regional growth strategy.
The USA is the world's largest market for bioprocess equipment and laboratory products. Yet because it is home to the main competitors for both company divisions, Sartorius formerly had lower market share in this region than in Europe and Asia. Over the past years, we have gained market share in the USA by strengthening our sales and service capacities and see further development potential.
A further strategic focus is on China. This market has sizable growth potential owing to rising private and public healthcare expenditures and the rapid development of regional biopharmaceutical plants. To benefit from the dynamic development of this market, Sartorius has already been investing heavily in the sales infrastructure of China and other Asian countries and plans to expand production capacity levels there over the medium term. This especially applies as well to South Korea that offers strong growth prospects in this region, given its dynamically growing biopharma market.
Sartorius Combined Group Management Report Business Model, Strategy and Goals 35
Start
Optimization of Work Processes
Sufficient production capacity and a powerful supply chain are an essential foundation of future growth. For this reason, in recent years Sartorius has substantially expanded its capacities for membranes, filters and aseptic bags at various Group sites in order to shorten delivery times and reliably maintain delivery capability even in the event of local transport restrictions. Beyond this, the company with its multidisciplinary team is working on the further optimization of its network of suppliers and partners to accommodate increasing customer requirements.
Sartorius is driving forward digitalization and automation in many areas to further accelerate and enhance processes and, wherever meaningful, to standardize such processes throughout the Group.
This also includes extending our activities in the areas of e-commerce, digital marketing and analytics.
Sartorius Combined Group Management Report Research and Development 36
Start
Research and Development Sartorius conducts research and development in its two divisions as well as in Corporate Research, a functional area that operates Group-wide. A detailed explanation of our R&D focal points is given in the chapters about the divisions on pages 57 and 67.
Corporate Research works in close cooperation with external partners on overarching innovation projects. Its most important task and objective consists of identifying and developing key technologies and application fields of the future. In addition to collaborating closely with customers, research institutes and startups, Corporate Research pursues its own research activities in selected fields. These include, for instance, innovative technologies in live-cell analysis, materials with new functionalities and improved properties, and data analysis. Moreover, in the reporting year, Sartorius established a dedicated unit with Group-wide activities in the field of advanced therapies.
A further component attesting to the innovative capability of Sartorius are alliances and partnerships with research institutes. In 2020, Sartorius joined the group of shareholders of the German Research Center for Artificial Intelligence (DFKI). Sartorius and DFKI have already been working together for some time in a joint research laboratory on the development of future-focused tools and AI applications for the production of advanced medications. Currently, Sartorius and the DFKI are conducting research on deep learning algorithms and methods for image recognition of cells and organoids, analysis and modeling of biological systems, and for simulation and optimization of biopharmaceutical production processes. AI can unfold its powerful capabilities, above all in the accelerated development of more efficient medical drug manufacturing processes. In the medium term, Sartorius moreover sees the potential of using AI processes to develop active pharmaceutical ingredients faster and more cost-effectively than the time-consuming and cost-intensive trial-and-error processes that are common today, thus making new therapeutics available earlier and to more patients.
Accordingly, Sartorius is funding a new laboratory for AI-based cell analysis and an endowed junior professorship for computational cell analytics at the University of Göttingen. The objective is to utilize advances in this field to enable faster identification of disease mechanisms and accelerated development of medications, thus contributing to medical progress. Beyond this, Sartorius aims to promote translation of new research results into innovative, commercially usable technologies.
Furthermore, in the reporting year, Sartorius together with Evotec, a leading research and development company for active pharmaceutical ingredients, entered into a partnership with Curexsys GmbH that specializes in the emerging field of therapeutic exosomes. Curexsys delivers a proprietary isolation technology for exosomes based on a traceless immune-affinity process. Sartorius acquired a minority stake of about 21% in this company and will support the startup in setting up a production platform.
Sartorius Combined Group Management Report Macroeconomic Environment and Conditions in the Sectors 37
Start
Macroeconomic Environment and Conditions in the Sectors The sectors in which the Sartorius Group is active differ in their dependence on the economy. The Bioprocess Solutions Division, for instance, operates in an environment that is largely independent of economic fluctuations. The Lab Products &Services Division, in contrast, is partly active in sectors whose development is more strongly affected by economic factors.
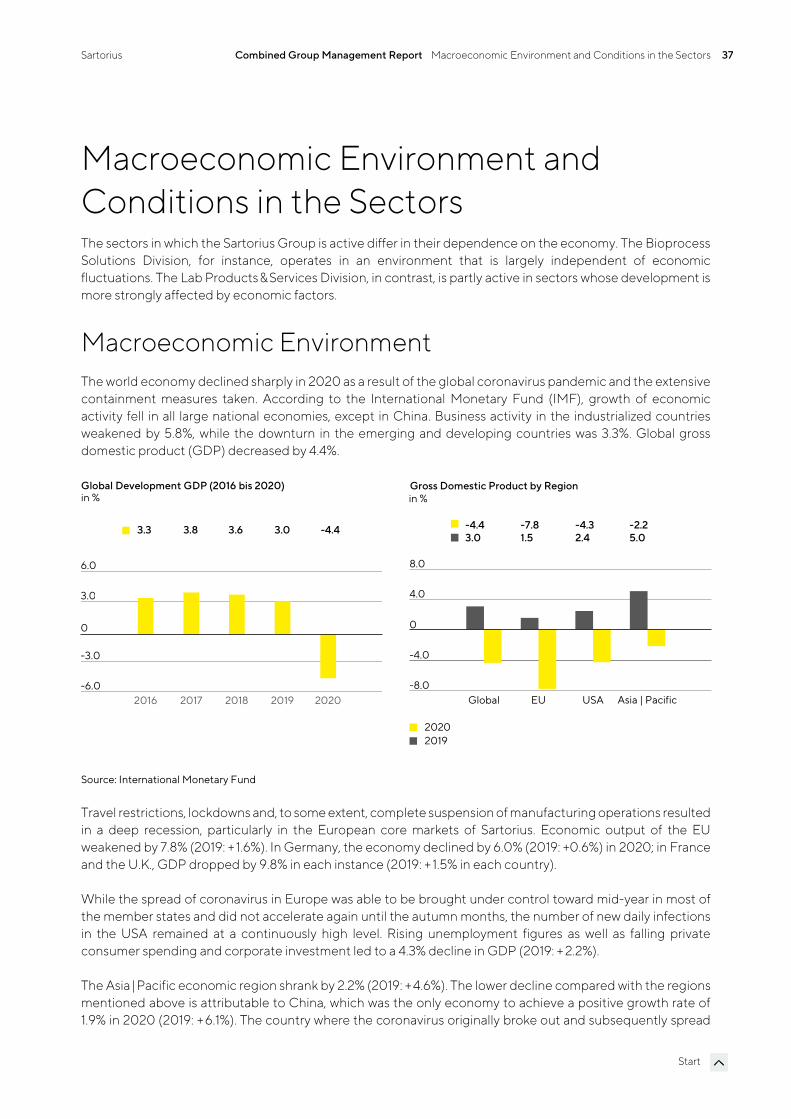
Macroeconomic Environment The world economy declined sharply in 2020 as a result of the global coronavirus pandemic and the extensive containment measures taken. According to the International Monetary Fund (IMF), growth of economic activity fell in all large national economies, except in China. Business activity in the industrialized countries weakened by 5.8%, while the downturn in the emerging and developing countries was 3.3%. Global gross domestic product (GDP) decreased by 4.4%.
Source: International Monetary Fund
Travel restrictions, lockdowns and, to some extent, complete suspension of manufacturing operations resulted in a deep recession, particularly in the European core markets of Sartorius. Economic output of the EU weakened by 7.8% (2019: + 1.6%). In Germany, the economy declined by 6.0% (2019: +0.6%) in 2020; in France and the U.K., GDP dropped by 9.8% in each instance (2019: + 1.5% in each country).
While the spread of coronavirus in Europe was able to be brought under control toward mid-year in most of the member states and did not accelerate again until the autumn months, the number of new daily infections in the USA remained at a continuously high level. Rising unemployment figures as well as falling private consumer spending and corporate investment led to a 4.3% decline in GDP (2019: + 2.2%).
The Asia|Pacific economic region shrank by 2.2% (2019: + 4.6%). The lower decline compared with the regions mentioned above is attributable to China, which was the only economy to achieve a positive growth rate of 1.9% in 2020 (2019: + 6.1%). The country where the coronavirus originally broke out and subsequently spread
Global Development GDP (2016 bis 2020)in %
2016 2017 2018 2019 2020-6.0
-3.0
0
3.0
6.0
3.3 3.8 3.6 3.0 -4.4
Global EU USA Asien|Paz.-8.0
-4.0
0
4.0
8.0
20202019
in %Gross Domestic Product by Region
-4.4 -7.8 -4.3 -2.23.0 1.5 2.4 5.0
Asia | Pacific
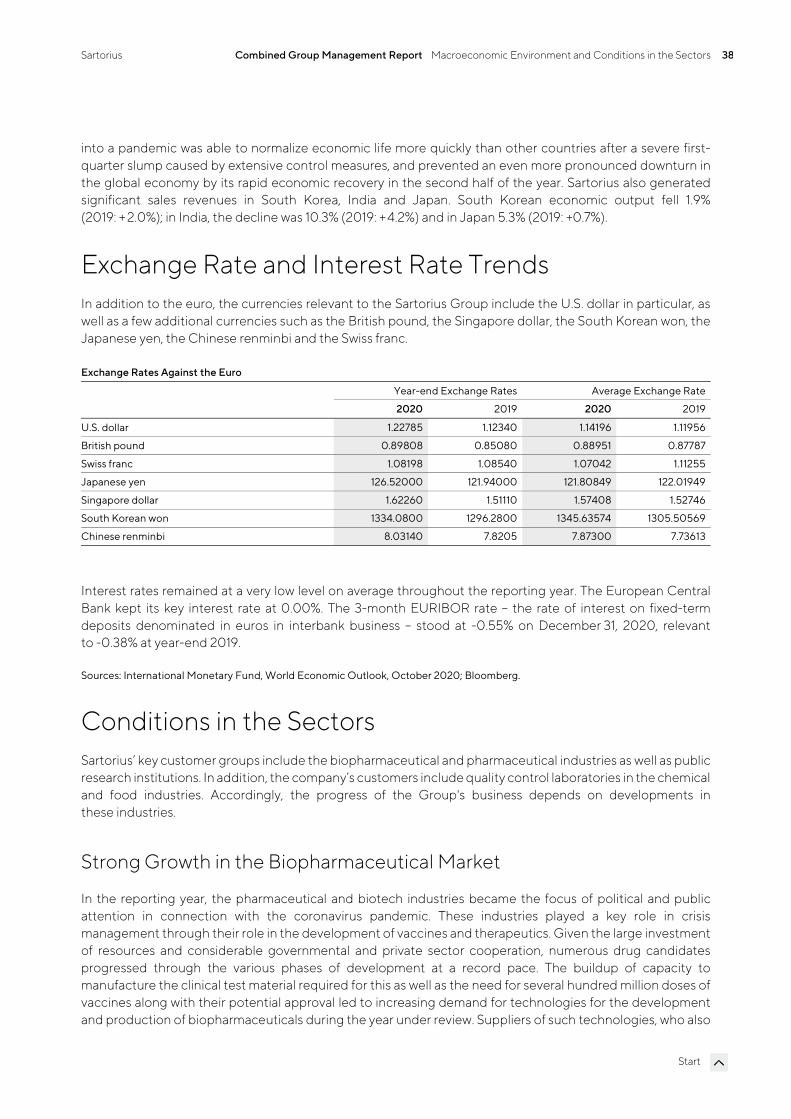
Sartorius Combined Group Management Report Macroeconomic Environment and Conditions in the Sectors 38
Start
into a pandemic was able to normalize economic life more quickly than other countries after a severe first-quarter slump caused by extensive control measures, and prevented an even more pronounced downturn in the global economy by its rapid economic recovery in the second half of the year. Sartorius also generated significant sales revenues in South Korea, India and Japan. South Korean economic output fell 1.9% (2019: + 2.0%); in India, the decline was 10.3% (2019: + 4.2%) and in Japan 5.3% (2019: +0.7%).
Exchange Rate and Interest Rate Trends In addition to the euro, the currencies relevant to the Sartorius Group include the U.S. dollar in particular, as well as a few additional currencies such as the British pound, the Singapore dollar, the South Korean won, the Japanese yen, the Chinese renminbi and the Swiss franc.
Exchange Rates Against the Euro
Year-end Exchange Rates Average Exchange Rate
2020 2019 2020 2019
U.S. dollar 1.22785 1.12340 1.14196 1.11956
British pound 0.89808 0.85080 0.88951 0.87787
Swiss franc 1.08198 1.08540 1.07042 1.11255
Japanese yen 126.52000 121.94000 121.80849 122.01949
Singapore dollar 1.62260 1.51110 1.57408 1.52746
South Korean won 1334.0800 1296.2800 1345.63574 1305.50569
Chinese renminbi 8.03140 7.8205 7.87300 7.73613
Interest rates remained at a very low level on average throughout the reporting year. The European Central Bank kept its key interest rate at 0.00%. The 3-month EURIBOR rate – the rate of interest on fixed-term deposits denominated in euros in interbank business – stood at -0.55% on December 31, 2020, relevant to -0.38% at year-end 2019.
Sources: International Monetary Fund, World Economic Outlook, October 2020; Bloomberg.
Conditions in the Sectors Sartorius’ key customer groups include the biopharmaceutical and pharmaceutical industries as well as public research institutions. In addition, the company’s customers include quality control laboratories in the chemical and food industries. Accordingly, the progress of the Group's business depends on developments in these industries.
Strong Growth in the Biopharmaceutical Market
In the reporting year, the pharmaceutical and biotech industries became the focus of political and public attention in connection with the coronavirus pandemic. These industries played a key role in crisis management through their role in the development of vaccines and therapeutics. Given the large investment of resources and considerable governmental and private sector cooperation, numerous drug candidates progressed through the various phases of development at a record pace. The buildup of capacity to manufacture the clinical test material required for this as well as the need for several hundred million doses of vaccines along with their potential approval led to increasing demand for technologies for the development and production of biopharmaceuticals during the year under review. Suppliers of such technologies, who also
Sartorius Combined Group Management Report Macroeconomic Environment and Conditions in the Sectors 39
Start
benefited from strong development of demand independently of the pandemic, were able to increase their sales dynamically against this backdrop in 2020.
Due to its importance for healthcare, the pharmaceutical industry was exempted from many pandemic-related restrictions in the reporting year and proved robust overall despite the global recession. According to estimates by EvaluatePharma, growth was nearly at the previous year’s level, around 3% to 4%. Sales of biotechnologically manufactured drugs and vaccines in particular continued to grow overproportionately by around 7% to approximately €247 billion. The increasing importance and acceptance of biopharmaceutical active ingredients is reflected not only in the growing share of sales in the global pharmaceutical market, but also in the R&D activities of the pharmaceutical industry. The share of biopharmaceutical compounds in the R&D pipeline is over 40%.
While market growth was only marginally impacted by coronavirus compared to other industries, the measures taken to fight the pandemic still substantially affected certain areas of the pharmaceutical and biotech industries. For example, over 1,000 clinical studies for non-coronavirus-related development projects had to be interrupted or could not start as planned because clinical study volunteers could only be treated in hospitals, or recruited in sufficiently large numbers, to a limited extent owing to contact restrictions and quarantine measures imposed. This development could lead to the delayed approval of new drugs. Yet in 2020, no such effect was apparent, and the number of new product approvals by the U.S. Food and Drug Administration (FDA) remained at a high level of 26.
The growth of the biopharma market fundamentally depends more on medium- to long-term trends than on short-term economic developments. In addition to the market launch of innovative biopharmaceuticals, significant impetus is provided by the world’s rising demand for medications as well as the expanded range of indications for approved medications and their further market penetration. A growing number of active substances manufactured using biotech production methods is being approved for the treatment of rare illnesses that have been incurable so far. In the process, the pharmaceutical industry is increasingly concentrating on advanced therapies, such as gene and cell therapies and biotechnologically processed tissue products. At the end of 2020, there were over 1,000 clinical studies based on such treatment approaches so this field offers significant growth potential over the mid to long term. The rising number of approved biopharmaceuticals as well as an increasing variety of therapy types and substance classes coupled with growing demand for medications are the main drivers for the worldwide increase in production capacities for biopharmaceuticals.
Biosimilars, the generic versions of reference biologics that have lost their patent protection, are also playing an increasingly important role in the biotechnology market. At an estimated sales volume of €14.5 billion, the biosimilars market was still quite moderate in 2020, but it is expected to grow strongly during the years to come owing to the expiration of several patents for high-selling biopharmaceuticals and an increasing number of new approvals and new launches of biosimilars. In particular in the USA, where regulatory, patent law-related and marketing hurdles have traditionally resulted in comparatively slow market penetration of biosimilars, development is forecasted to accelerate significantly in the coming years. According to data provided by the IQVIA research institute, the market volume for biosimilars could quintuple until 2024. Globally, a compound annual growth rate of around 30% is projected for this segment for the period up to 2025.
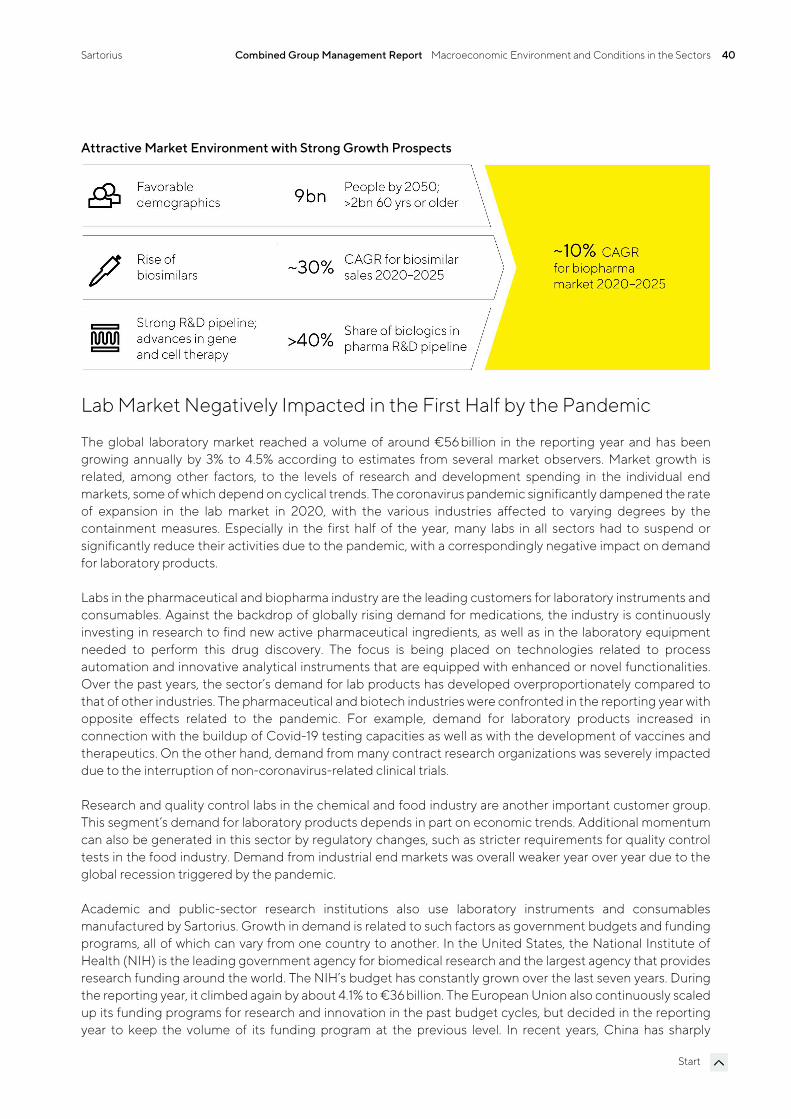
Sartorius Combined Group Management Report Macroeconomic Environment and Conditions in the Sectors 40
Start
Attractive Market Environment with Strong Growth Prospects
Lab Market Negatively Impacted in the First Half by the Pandemic
The global laboratory market reached a volume of around €56 billion in the reporting year and has been growing annually by 3% to 4.5% according to estimates from several market observers. Market growth is related, among other factors, to the levels of research and development spending in the individual end markets, some of which depend on cyclical trends. The coronavirus pandemic significantly dampened the rate of expansion in the lab market in 2020, with the various industries affected to varying degrees by the containment measures. Especially in the first half of the year, many labs in all sectors had to suspend or significantly reduce their activities due to the pandemic, with a correspondingly negative impact on demand for laboratory products.
Labs in the pharmaceutical and biopharma industry are the leading customers for laboratory instruments and consumables. Against the backdrop of globally rising demand for medications, the industry is continuously investing in research to find new active pharmaceutical ingredients, as well as in the laboratory equipment needed to perform this drug discovery. The focus is being placed on technologies related to process automation and innovative analytical instruments that are equipped with enhanced or novel functionalities. Over the past years, the sector’s demand for lab products has developed overproportionately compared to that of other industries. The pharmaceutical and biotech industries were confronted in the reporting year with opposite effects related to the pandemic. For example, demand for laboratory products increased in connection with the buildup of Covid-19 testing capacities as well as with the development of vaccines and therapeutics. On the other hand, demand from many contract research organizations was severely impacted due to the interruption of non-coronavirus-related clinical trials.
Research and quality control labs in the chemical and food industry are another important customer group. This segment’s demand for laboratory products depends in part on economic trends. Additional momentum can also be generated in this sector by regulatory changes, such as stricter requirements for quality control tests in the food industry. Demand from industrial end markets was overall weaker year over year due to the global recession triggered by the pandemic.
Academic and public-sector research institutions also use laboratory instruments and consumables manufactured by Sartorius. Growth in demand is related to such factors as government budgets and funding programs, all of which can vary from one country to another. In the United States, the National Institute of Health (NIH) is the leading government agency for biomedical research and the largest agency that provides research funding around the world. The NIH’s budget has constantly grown over the last seven years. During the reporting year, it climbed again by about 4.1% to €36 billion. The European Union also continuously scaled up its funding programs for research and innovation in the past budget cycles, but decided in the reporting year to keep the volume of its funding program at the previous level. In recent years, China has sharply
Sartorius Combined Group Management Report Macroeconomic Environment and Conditions in the Sectors 41
Start
increased government R&D funding, a trend that has fueled dynamic growth in the laboratory market there. Many manufacturers of laboratory products experienced weaker year-over-year demand from academic and public research institutions, a significant proportion of which were completely closed for extended periods or could only operate at limited capacity in 2020.
Competitive Position
The competitive environment of the Bioprocess Solutions Division is characterized by relatively high entry barriers arising in part from the biopharmaceutical industry’s strong degree of regulation and its technological complexity. In addition, the supply industry has consolidated strongly in recent years owing to numerous takeovers, so that the majority of the market is served by just a few suppliers. In this environment, the Bioprocess Solutions Division operates as a total solutions provider, covering the core process steps in biopharmaceutical production and preceding process development. It has leading market positions in key technologies, especially in the areas of bioreactors, filtration and the transport and storage of liquids. The Bioprocess Solutions Division's principal competitors include certain business units at Merck KGaA, Thermo Fisher Scientific Inc., and Danaher Corporation that took over the biopharmaceutical businesses of General Electric Co. in the year under review.
The Lab Products &Services Division is positioned as a premium provider of laboratory instruments. It serves both R&D laboratories and quality control laboratories with a focus on the biopharmaceutical industry. The division’s product range includes laboratory balances, pipettes, and instruments for bioanalytics, as well as a wide range of consumables. The division ranks among the leading providers worldwide in most of these areas. Its main competitors include divisions of the companies Thermo Fisher Inc., Merck KGaA and Danaher Corporation. For laboratory balances in particular, Mettler-Toledo Intl. Inc. is among these competitors. Eppendorf AG is a rival for pipettes, and companies like Agilent Technologies Inc., Becton Dickinson Co. and PerkinElmer Inc. are competitors in the segment of cell analysis.
Sources: BioPlan: 17th Annual Report and Survey of Biopharmaceutical Manufacturing Capacity and Production, April 2020; Daedal Research: Global Biologics Market: Size, Trends & Forecasts, December 2020; IQVIA Institute: Global Medicine Spending and Usage Trends, March 2020; IQVIA Institute: German-language publication “Fokus Biosimilars,” May 2020; Evaluate Pharma: World Preview 2020, Outlook to 2026, July 2020; SDi: Global Assessment Report 2018, February 2018; www.fda.gov

Sartorius Combined Group Management Report Group Business Development 42
Start
Group Business Development Sales Revenue and Order Intake In the reporting year, Sartorius grew at an exceptionally dynamic rate of 30.2% to €2,335.7 million in constant currencies (reported: +27.8%). As a result, the Group exceeded the forecast given at the beginning of the year, which had projected an increase in consolidated sales revenue by 10% to 13% and had last been raised upon release of its nine-month figures, with this latter forecast projecting revenue to increase at the upper end of, or slightly above, the range of 22% to 26%. In addition to strong development of its core business, the Group’s strong organic growth was fueled, inter alia, by orders in connection with coronavirus vaccines and Covid-19 therapeutics, as well as by inventory buildup by customers. The impact of all pandemic-related effects on consolidated growth was a good 8 percentage points. Initial consolidation of the most recent acquisitions contributed a good 7 percentage points.
Order intake was influenced slightly more strongly by the pandemic than consolidated sales revenue and rose by 49.0% to €2,836.3 million in constant currencies (reported: +46.2%), with pandemic effects accounting for close to 14 percentage points.
For a full comparison of the Group’s business development with its forecast, see page 68.
Sales Revenue and Order Intake
€ in millions 2020 2019in %
reportedin %
cc1
Sales revenue 2,335.7 1,827.0 27.8 30.2
Order intake 2,836.3 1,939.5 46.2 49.0
1 In constant currencies
2016 2017 2018 2019 20200
750
1,500
2,250
3,000
Sales Revenue 2016 to 2020
1,300.3 1,404.6 1,566.0 1,827.0 2,335.7
€ in millions
2016 2017 2018 2019 20200
750
1,500
2,250
3,000
Order Intake 2016 to 2020
1,334.7 1,501.4 1,662.5 1,939.5 2,836.3
€ in millions
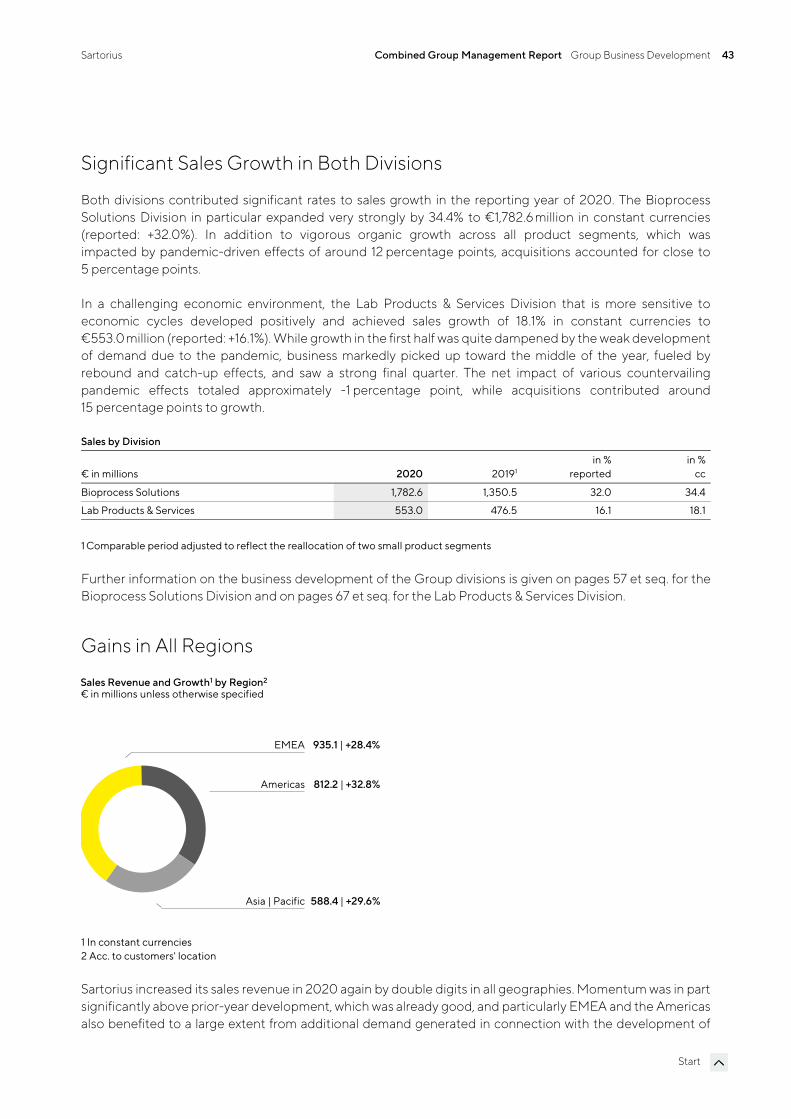
Sartorius Combined Group Management Report Group Business Development 43
Start
Significant Sales Growth in Both Divisions
Both divisions contributed significant rates to sales growth in the reporting year of 2020. The Bioprocess Solutions Division in particular expanded very strongly by 34.4% to €1,782.6 million in constant currencies (reported: +32.0%). In addition to vigorous organic growth across all product segments, which was impacted by pandemic-driven effects of around 12 percentage points, acquisitions accounted for close to 5 percentage points.
In a challenging economic environment, the Lab Products & Services Division that is more sensitive to economic cycles developed positively and achieved sales growth of 18.1% in constant currencies to €553.0 million (reported: +16.1%). While growth in the first half was quite dampened by the weak development of demand due to the pandemic, business markedly picked up toward the middle of the year, fueled by rebound and catch-up effects, and saw a strong final quarter. The net impact of various countervailing pandemic effects totaled approximately -1 percentage point, while acquisitions contributed around 15 percentage points to growth.
Sales by Division
€ in millions 2020 20191in %
reportedin %
cc
Bioprocess Solutions 1,782.6 1,350.5 32.0 34.4
Lab Products & Services 553.0 476.5 16.1 18.1
1 Comparable period adjusted to reflect the reallocation of two small product segments
Further information on the business development of the Group divisions is given on pages 57 et seq. for the Bioprocess Solutions Division and on pages 67 et seq. for the Lab Products & Services Division.
Gains in All Regions
1 In constant currencies 2 Acc. to customers' location
Sartorius increased its sales revenue in 2020 again by double digits in all geographies. Momentum was in part significantly above prior-year development, which was already good, and particularly EMEA and the Americas also benefited to a large extent from additional demand generated in connection with the development of
€ in millions unless otherwise specified
EMEA
Americas
Asia | Pacific
812.2 | +32.8%
935.1 | +28.4%
588.4 | +29.6%
Sales Revenue and Growth1 by Region2
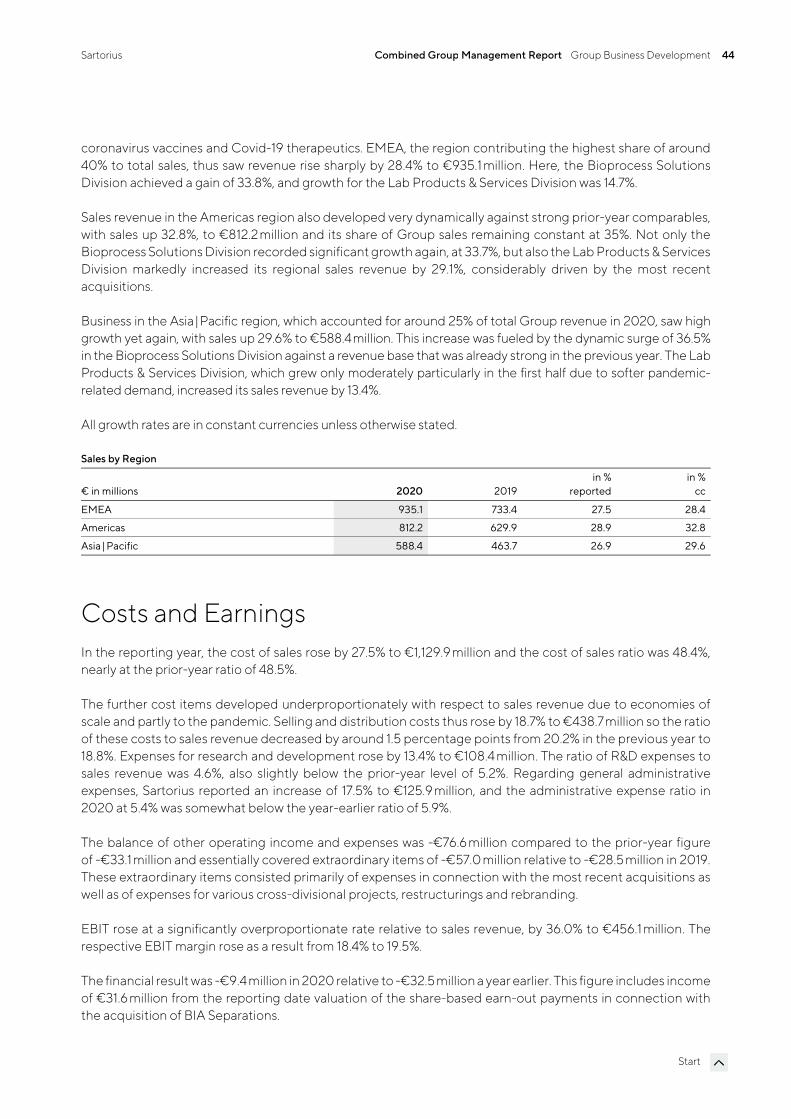
Sartorius Combined Group Management Report Group Business Development 44
Start
coronavirus vaccines and Covid-19 therapeutics. EMEA, the region contributing the highest share of around 40% to total sales, thus saw revenue rise sharply by 28.4% to €935.1 million. Here, the Bioprocess Solutions Division achieved a gain of 33.8%, and growth for the Lab Products & Services Division was 14.7%.
Sales revenue in the Americas region also developed very dynamically against strong prior-year comparables, with sales up 32.8%, to €812.2 million and its share of Group sales remaining constant at 35%. Not only the Bioprocess Solutions Division recorded significant growth again, at 33.7%, but also the Lab Products & Services Division markedly increased its regional sales revenue by 29.1%, considerably driven by the most recent acquisitions.
Business in the Asia|Pacific region, which accounted for around 25% of total Group revenue in 2020, saw high growth yet again, with sales up 29.6% to €588.4million. This increase was fueled by the dynamic surge of 36.5% in the Bioprocess Solutions Division against a revenue base that was already strong in the previous year. The Lab Products & Services Division, which grew only moderately particularly in the first half due to softer pandemic-related demand, increased its sales revenue by 13.4%.
All growth rates are in constant currencies unless otherwise stated.
Sales by Region
€ in millions 2020 2019in %
reportedin %
cc
EMEA 935.1 733.4 27.5 28.4
Americas 812.2 629.9 28.9 32.8
Asia | Pacific 588.4 463.7 26.9 29.6
Costs and Earnings In the reporting year, the cost of sales rose by 27.5% to €1,129.9 million and the cost of sales ratio was 48.4%, nearly at the prior-year ratio of 48.5%.
The further cost items developed underproportionately with respect to sales revenue due to economies of scale and partly to the pandemic. Selling and distribution costs thus rose by 18.7% to €438.7million so the ratio of these costs to sales revenue decreased by around 1.5 percentage points from 20.2% in the previous year to 18.8%. Expenses for research and development rose by 13.4% to €108.4 million. The ratio of R&D expenses to sales revenue was 4.6%, also slightly below the prior-year level of 5.2%. Regarding general administrative expenses, Sartorius reported an increase of 17.5% to €125.9 million, and the administrative expense ratio in 2020 at 5.4% was somewhat below the year-earlier ratio of 5.9%.
The balance of other operating income and expenses was -€76.6 million compared to the prior-year figure of -€33.1 million and essentially covered extraordinary items of -€57.0 million relative to -€28.5 million in 2019. These extraordinary items consisted primarily of expenses in connection with the most recent acquisitions as well as of expenses for various cross-divisional projects, restructurings and rebranding.
EBIT rose at a significantly overproportionate rate relative to sales revenue, by 36.0% to €456.1 million. The respective EBIT margin rose as a result from 18.4% to 19.5%.
The financial result was -€9.4 million in 2020 relative to -€32.5 million a year earlier. This figure includes income of €31.6 million from the reporting date valuation of the share-based earn-out payments in connection with the acquisition of BIA Separations.

Sartorius Combined Group Management Report Group Business Development 45
Start
In the reporting year, tax expenses of €125.2 million were above the prior-year total of €84.4 million. The tax rate was 28.0% after 27.9% in the previous year. It should be noted that the valuation effect mentioned above will not result in any subsequent tax impact in the financial result for the reporting year. Adjustment would yield a tax rate of 30.2%.
Net profit for the period increased at a significantly overproportionate rate in relation to sales revenue, by 47.1% to €321.5 million (2019: €218.6 million).
Net profit attributable to shareholders of Sartorius AG surged 44.4% to €226.3 million in the reporting year, up from €156.7million in 2019. Non-controlling interest stood at €95.2 million (previous year: €61.9 million), which essentially reflected shares in Sartorius Stedim Biotech S.A. not held by the Sartorius Group.
Statement of Profit or Loss
€ in millions 2020 2019 ∆ in %
Sales revenue 2,335.7 1,827.0 27.8
Cost of sales – 1,129.9 – 885.9 – 27.5
Gross profit on sales 1,205.8 941.1 28.1
Selling and distribution costs – 438.7 – 369.8 – 18.7
Research and development costs – 108.4 – 95.6 – 13.4
General administrative expenses – 125.9 – 107.2 – 17.5
Other operating income and expenses – 76.6 – 33.1 – 131.6
Earnings before interest and taxes (EBIT) 456.1 335.5 36.0
Financial income 57.7 9.4 513.9
Financial expenses – 67.1 – 41.9 – 60.2
Financial result –9.4 –32.5 71.0
Profit before tax 446.7 303.0 47.4
Income taxes –125.2 –84.4 –48.4
Net profit for the period 321.5 218.6 47.1
Attributable to:
Equity holders of Sartorius AG 226.3 156.7 44.4
Non-controlling interest 95.2 61.9 53.8
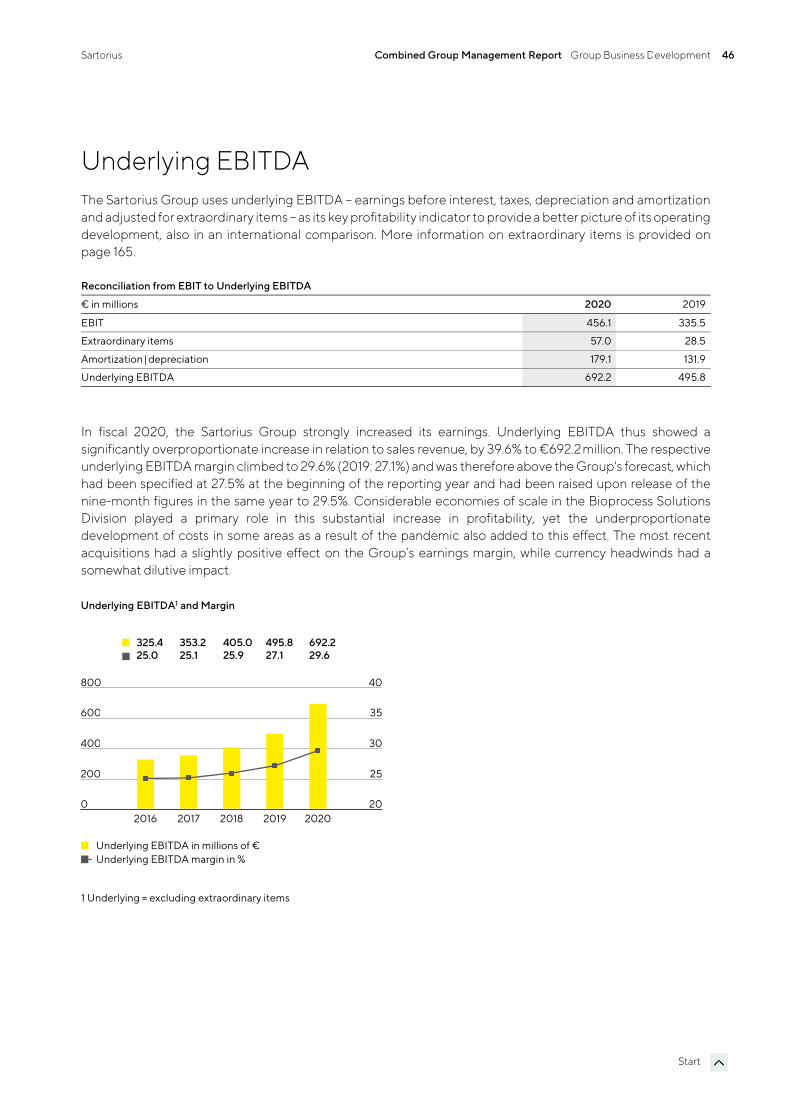
Sartorius Combined Group Management Report Group Business Development 46
Start
Underlying EBITDA The Sartorius Group uses underlying EBITDA – earnings before interest, taxes, depreciation and amortization and adjusted for extraordinary items – as its key profitability indicator to provide a better picture of its operating development, also in an international comparison. More information on extraordinary items is provided on page 165.
Reconciliation from EBIT to Underlying EBITDA
€ in millions 2020 2019
EBIT 456.1 335.5
Extraordinary items 57.0 28.5
Amortization| depreciation 179.1 131.9
Underlying EBITDA 692.2 495.8
In fiscal 2020, the Sartorius Group strongly increased its earnings. Underlying EBITDA thus showed a significantly overproportionate increase in relation to sales revenue, by 39.6% to €692.2million. The respective underlying EBITDA margin climbed to 29.6% (2019: 27.1%) and was therefore above the Group's forecast, which had been specified at 27.5% at the beginning of the reporting year and had been raised upon release of the nine-month figures in the same year to 29.5%. Considerable economies of scale in the Bioprocess Solutions Division played a primary role in this substantial increase in profitability, yet the underproportionate development of costs in some areas as a result of the pandemic also added to this effect. The most recent acquisitions had a slightly positive effect on the Group’s earnings margin, while currency headwinds had a somewhat dilutive impact.
1 Underlying = excluding extraordinary items
2016 2017 2018 2019 20200
200
400
600
800
Underlying EBITDA in millions of €Underlying EBITDA margin in %
Underlying EBITDA1 and Margin
325.4 353.2 405.0 495.8 692.225.0 25.1 25.9 27.1 29.6
20
25
30
35
40
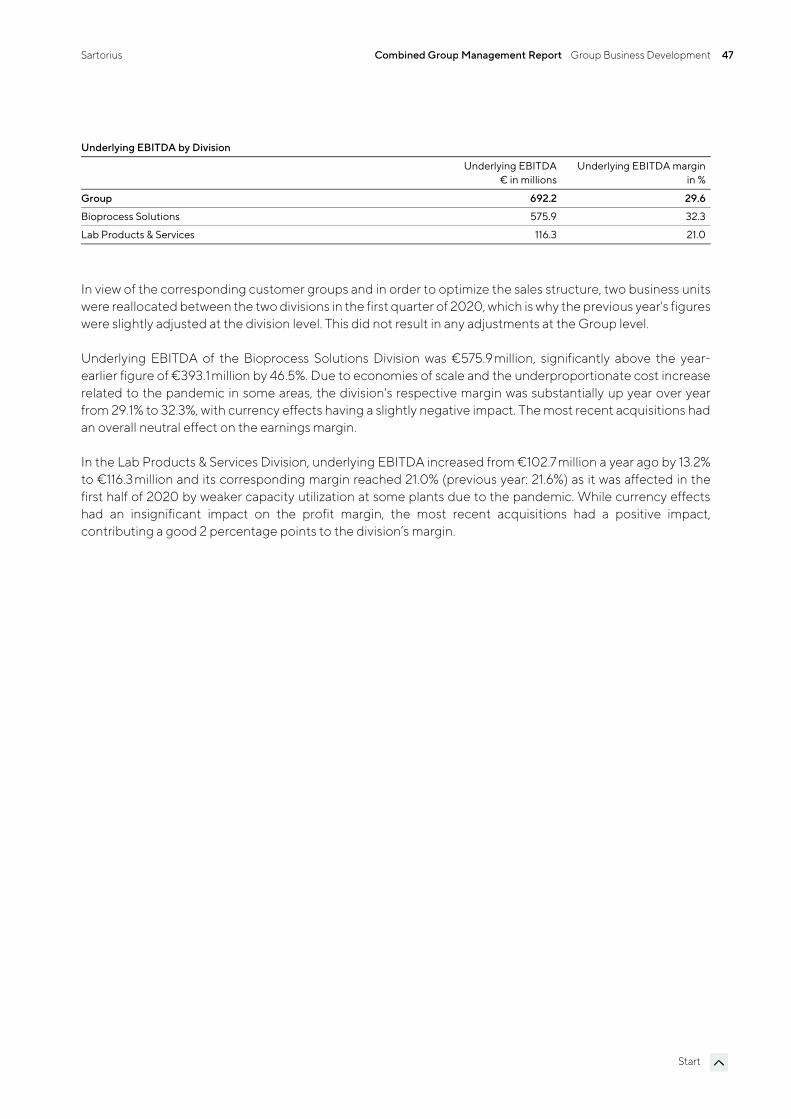
Sartorius Combined Group Management Report Group Business Development 47
Start
Underlying EBITDA by Division
Underlying EBITDA€ in millions
Underlying EBITDA margin in %
Group 692.2 29.6
Bioprocess Solutions 575.9 32.3
Lab Products & Services 116.3 21.0
In view of the corresponding customer groups and in order to optimize the sales structure, two business units were reallocated between the two divisions in the first quarter of 2020, which is why the previous year's figures were slightly adjusted at the division level. This did not result in any adjustments at the Group level.
Underlying EBITDA of the Bioprocess Solutions Division was €575.9 million, significantly above the year-earlier figure of €393.1 million by 46.5%. Due to economies of scale and the underproportionate cost increase related to the pandemic in some areas, the division's respective margin was substantially up year over year from 29.1% to 32.3%, with currency effects having a slightly negative impact. The most recent acquisitions had an overall neutral effect on the earnings margin.
In the Lab Products & Services Division, underlying EBITDA increased from €102.7 million a year ago by 13.2% to €116.3 million and its corresponding margin reached 21.0% (previous year: 21.6%) as it was affected in the first half of 2020 by weaker capacity utilization at some plants due to the pandemic. While currency effects had an insignificant impact on the profit margin, the most recent acquisitions had a positive impact, contributing a good 2 percentage points to the division’s margin.
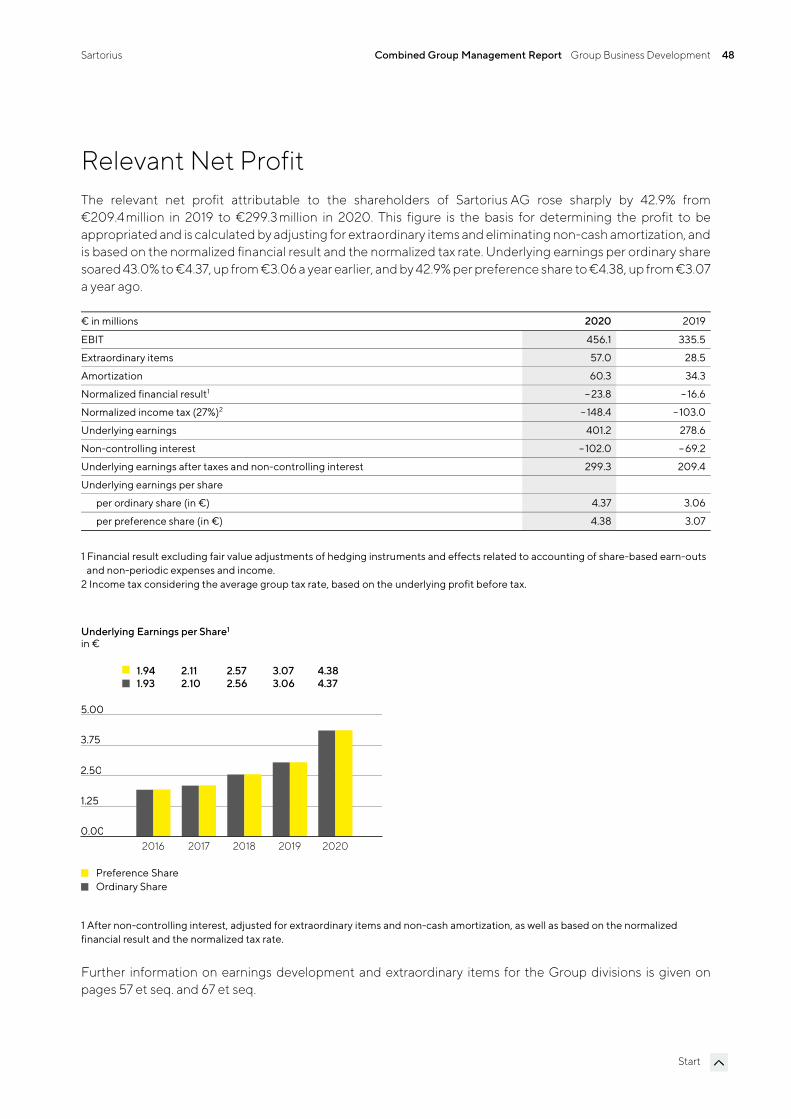
Sartorius Combined Group Management Report Group Business Development 48
Start
Relevant Net Profit The relevant net profit attributable to the shareholders of Sartorius AG rose sharply by 42.9% from €209.4million in 2019 to €299.3 million in 2020. This figure is the basis for determining the profit to be appropriated and is calculated by adjusting for extraordinary items and eliminating non-cash amortization, and is based on the normalized financial result and the normalized tax rate. Underlying earnings per ordinary share soared 43.0% to €4.37, up from €3.06 a year earlier, and by 42.9% per preference share to €4.38, up from €3.07 a year ago.
€ in millions 2020 2019
EBIT 456.1 335.5
Extraordinary items 57.0 28.5
Amortization 60.3 34.3
Normalized financial result1 – 23.8 – 16.6
Normalized income tax (27%)2 – 148.4 – 103.0
Underlying earnings 401.2 278.6
Non-controlling interest –102.0 – 69.2
Underlying earnings after taxes and non-controlling interest 299.3 209.4
Underlying earnings per share
per ordinary share (in €) 4.37 3.06
per preference share (in €) 4.38 3.07
1 Financial result excluding fair value adjustments of hedging instruments and effects related to accounting of share-based earn-outs and non-periodic expenses and income.
2 Income tax considering the average group tax rate, based on the underlying profit before tax.
1 After non-controlling interest, adjusted for extraordinary items and non-cash amortization, as well as based on the normalized financial result and the normalized tax rate.
Further information on earnings development and extraordinary items for the Group divisions is given on pages 57 et seq. and 67 et seq.
2016 2017 2018 2019 20200.00
1.25
2.50
3.75
5.00
Preference ShareOrdinary Share
in €Underlying Earnings per Share1
1.94 2.11 2.57 3.07 4.381.93 2.10 2.56 3.06 4.37
Sartorius Combined Group Management Report Group Business Development 49
Start
Research and Development Sartorius continuously expands its product portfolio by investing in both the new and further development of its products, as well as in the integration of new technologies through alliances. In 2020, the Sartorius Group spent €108.4million on R&D, corresponding to an increase of 13.4% over the previous year's investment of €95.6 million. The ratio of R&D costs to sales revenue stood at 4.6%, slightly below the previous year’s level of 5.2%.
The International Financial Reporting Standards (IFRS) require certain development costs to be capitalized on the statement of financial position and then to be amortized over subsequent years. In the reporting year, these development investments amounted to €43.6 million compared with €40.1 million the year before. This equates to a share of 28.7% (previous year: 29.5%) of the Group’s total R&D expenses. Scheduled amortization related to capitalized development costs totaled €22.1 million in 2020 (previous year: €11.9 million). These expenses were disclosed in the cost of sales. The gross capital expenditure ratio at 6.5% was below the prior-year ratio of 7.4%; this ratio is even more meaningful for assessment of innovation-related expenses and includes capitalized development costs.
We pursue a strategic intellectual and industrial property rights policy across our divisions to protect our expertise. The Sartorius Group systematically monitors compliance with these rights on a cost |benefit basis to determine which specific individual rights are to be maintained.
In 2020, we filed a total of 273 applications for intellectual and industrial property rights (2019: 194). As a result of these applications, including those of prior years, we were issued 459 patents and trademarks during the reporting year (2019: 300). As of the reporting date, we had a total of 5,110 patents and trademarks in our portfolio (2019: 4,235).
Further information is provided in the sections covering the individual divisions on pages 57 et seq. and 67 et seq.
Sartorius Combined Group Management Report Group Business Development 50
Start
Capital Expenditures Against a backdrop of strong organic growth, Sartorius made above-average investments in new capacity over the past years. Several large expansion projects were completed in 2019. In the reporting year, the company further ramped up its production capacities at many sites due to exceptionally high demand. For this reason, capital expenditures of €240.3 million in 2020 were higher than originally planned (2019: €225.6 million). However, due to strong sales revenue growth the ratio of capital expenditures to sales revenue was 10.3% and therefore within the range of our guidance (2019: 12.3%).
At Group headquarters in Göttingen, Germany, laboratory areas for product development are currently being extended following large-scale expansion of production capacity at this location in previous years.
At the site in Yauco, Puerto Rico, Sartorius invested in production capacities for membranes. In 2019, manufacturing capacity for filters and aseptic bags had already been doubled when operations were started up at the expanded production facilities.
Due to strong growth in demand and order intake, bioprocessing capacities were also expanded in the reporting year at some additional sites. For instance, expansion projects were conducted in Germany, France, Israel, the U.K. and Tunisia. In the laboratory business, production capacities for pipette tips were ramped up in Finland.
Beyond these expansion projects, investments were made in the digital infrastructure of the Group. Among other things, a platform for the global standardization and management of HR processes was extended, and the company began to implement a new CRM system in the USA, which is to be rolled out in further regions in 2021.
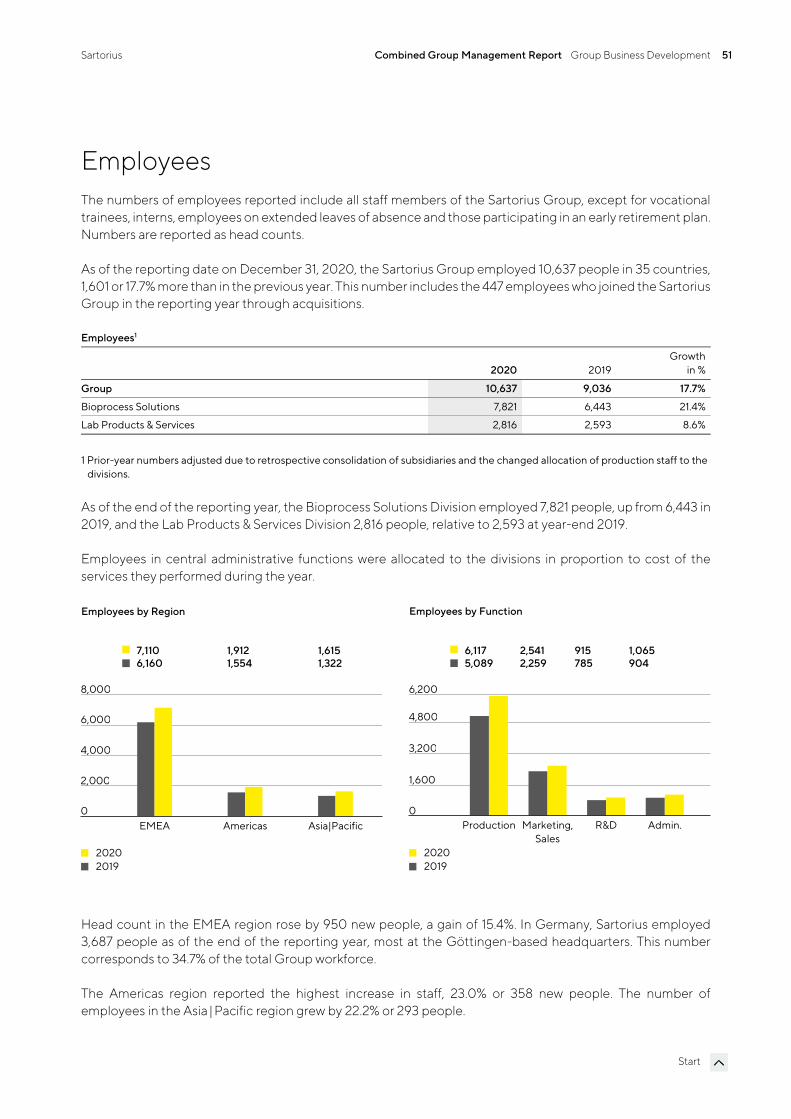
Sartorius Combined Group Management Report Group Business Development 51
Start
Employees The numbers of employees reported include all staff members of the Sartorius Group, except for vocational trainees, interns, employees on extended leaves of absence and those participating in an early retirement plan. Numbers are reported as head counts.
As of the reporting date on December 31, 2020, the Sartorius Group employed 10,637 people in 35 countries, 1,601 or 17.7% more than in the previous year. This number includes the 447 employees who joined the Sartorius Group in the reporting year through acquisitions.
Employees1
2020 2019Growth
in %
Group 10,637 9,036 17.7%
Bioprocess Solutions 7,821 6,443 21.4%
Lab Products & Services 2,816 2,593 8.6%
1 Prior-year numbers adjusted due to retrospective consolidation of subsidiaries and the changed allocation of production staff to the divisions.
As of the end of the reporting year, the Bioprocess Solutions Division employed 7,821 people, up from 6,443 in 2019, and the Lab Products & Services Division 2,816 people, relative to 2,593 at year-end 2019.
Employees in central administrative functions were allocated to the divisions in proportion to cost of the services they performed during the year.
Head count in the EMEA region rose by 950 new people, a gain of 15.4%. In Germany, Sartorius employed 3,687 people as of the end of the reporting year, most at the Göttingen-based headquarters. This number corresponds to 34.7% of the total Group workforce.
The Americas region reported the highest increase in staff, 23.0% or 358 new people. The number of employees in the Asia | Pacific region grew by 22.2% or 293 people.
EMEA Americas Asia|Pacific0
2,000
4,000
6,000
8,000
20202019
Employees by Region
7,110 1,912 1,6156,160 1,554 1,322
0
1,600
3,200
4,800
6,200
20202019
Employees by Function
6,117 2,541 915 1,0655,089 2,259 785 904
Production Marketing,Sales
R&D Admin.
Sartorius Combined Group Management Report Group Business Development 52
Start
At the end of 2020, around 57% of all Sartorius employees worked in production. This head count includes production staff and employees in other areas such as technical services. The number of employees in this area was 6,117 or 20.2% more than in the prior year.
In marketing and sales, 2,541 people were employed at year-end, equating to an increase of 12.5% and to about 24% of the total Group workforce.
A good 9% of all employees worked in research and development in 2020, an increase of 130 people or 16.6% more than in a year earlier.
As of the reporting date, co-workers in administration numbered 1,065, a year-over-year increase of 17.8% in comparison to the prior-year period and more than 10% of all Sartorius staff.
For more information on employees, see the Non-Financial Group Statement starting on page 121.
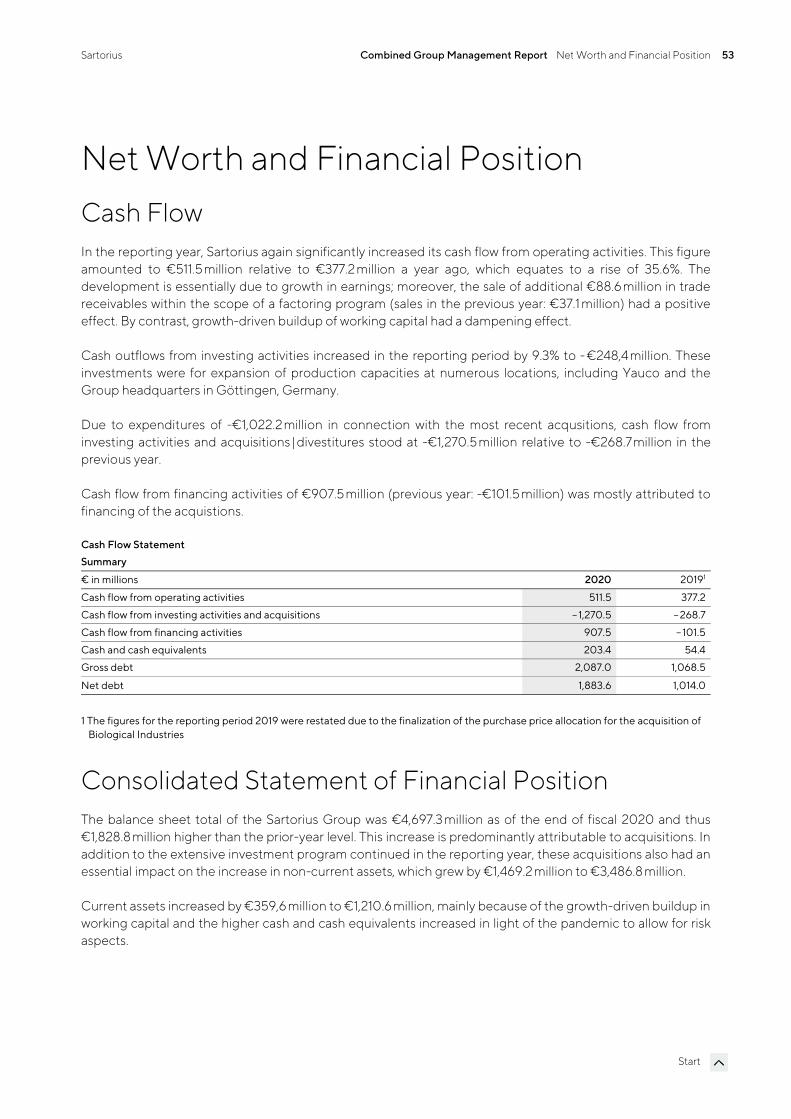
Sartorius Combined Group Management Report Net Worth and Financial Position 53
Start
Net Worth and Financial Position Cash Flow In the reporting year, Sartorius again significantly increased its cash flow from operating activities. This figure amounted to €511.5 million relative to €377.2 million a year ago, which equates to a rise of 35.6%. The development is essentially due to growth in earnings; moreover, the sale of additional €88.6 million in trade receivables within the scope of a factoring program (sales in the previous year: €37.1 million) had a positive effect. By contrast, growth-driven buildup of working capital had a dampening effect.
Cash outflows from investing activities increased in the reporting period by 9.3% to - €248,4million. These investments were for expansion of production capacities at numerous locations, including Yauco and the Group headquarters in Göttingen, Germany.
Due to expenditures of -€1,022.2 million in connection with the most recent acqusitions, cash flow from investing activities and acquisitions |divestitures stood at -€1,270.5 million relative to -€268.7million in the previous year.
Cash flow from financing activities of €907.5 million (previous year: -€101.5 million) was mostly attributed to financing of the acquistions.
Cash Flow Statement Summary
€ in millions 2020 20191
Cash flow from operating activities 511.5 377.2
Cash flow from investing activities and acquisitions – 1,270.5 – 268.7
Cash flow from financing activities 907.5 – 101.5
Cash and cash equivalents 203.4 54.4
Gross debt 2,087.0 1,068.5
Net debt 1,883.6 1,014.0
1 The figures for the reporting period 2019 were restated due to the finalization of the purchase price allocation for the acquisition of Biological Industries
Consolidated Statement of Financial Position The balance sheet total of the Sartorius Group was €4,697.3 million as of the end of fiscal 2020 and thus €1,828.8 million higher than the prior-year level. This increase is predominantly attributable to acquisitions. In addition to the extensive investment program continued in the reporting year, these acquisitions also had an essential impact on the increase in non-current assets, which grew by €1,469.2 million to €3,486.8 million.
Current assets increased by €359,6 million to €1,210.6 million, mainly because of the growth-driven buildup in working capital and the higher cash and cash equivalents increased in light of the pandemic to allow for risk aspects.
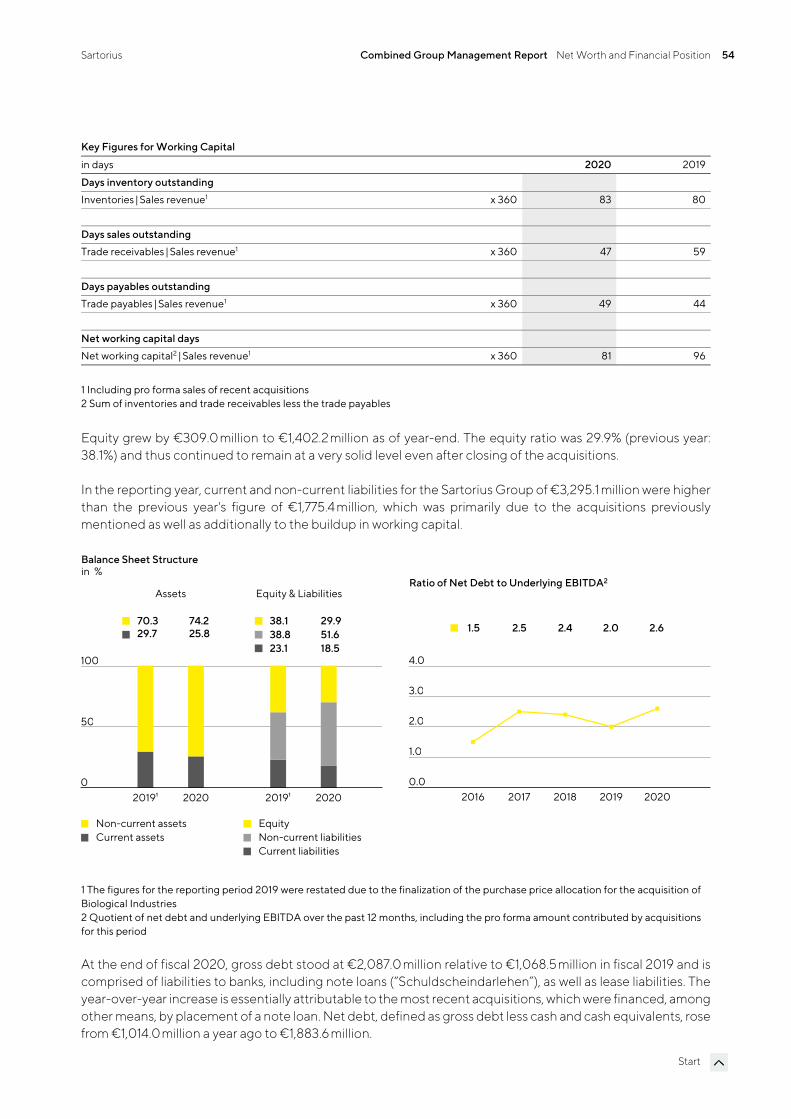
Sartorius Combined Group Management Report Net Worth and Financial Position 54
Start
Key Figures for Working Capital
in days 2020 2019
Days inventory outstanding
Inventories | Sales revenue1 x 360 83 80
Days sales outstanding
Trade receivables | Sales revenue1 x 360 47 59
Days payables outstanding
Trade payables | Sales revenue1 x 360 49 44
Net working capital days
Net working capital2 | Sales revenue1 x 360 81 96
1 Including pro forma sales of recent acquisitions 2 Sum of inventories and trade receivables less the trade payables
Equity grew by €309.0 million to €1,402.2 million as of year-end. The equity ratio was 29.9% (previous year: 38.1%) and thus continued to remain at a very solid level even after closing of the acquisitions.
In the reporting year, current and non-current liabilities for the Sartorius Group of €3,295.1 million were higher than the previous year's figure of €1,775.4 million, which was primarily due to the acquisitions previously mentioned as well as additionally to the buildup in working capital.
1 The figures for the reporting period 2019 were restated due to the finalization of the purchase price allocation for the acquisition of Biological Industries 2 Quotient of net debt and underlying EBITDA over the past 12 months, including the pro forma amount contributed by acquisitions for this period
At the end of fiscal 2020, gross debt stood at €2,087.0 million relative to €1,068.5 million in fiscal 2019 and is comprised of liabilities to banks, including note loans (“Schuldscheindarlehen”), as well as lease liabilities. The year-over-year increase is essentially attributable to the most recent acquisitions, which were financed, among other means, by placement of a note loan. Net debt, defined as gross debt less cash and cash equivalents, rose from €1,014.0million a year ago to €1,883.6 million.
2019¹ 20202019¹ 20200
50
100
Current assetsNon-current assets
in %Balance Sheet Structure
70.3 74.229.7 25.8
Non-current liabilitiesEquity
Current liabilities
38.1 29.938.8 51.623.1 18.5
Assets Equity & Liabilities
2016 2017 2018 2019 20200.0
1.0
2.0
3.0
4.0
Ratio of Net Debt to Underlying EBITDA2
1.5 2.5 2.4 2.0 2.6
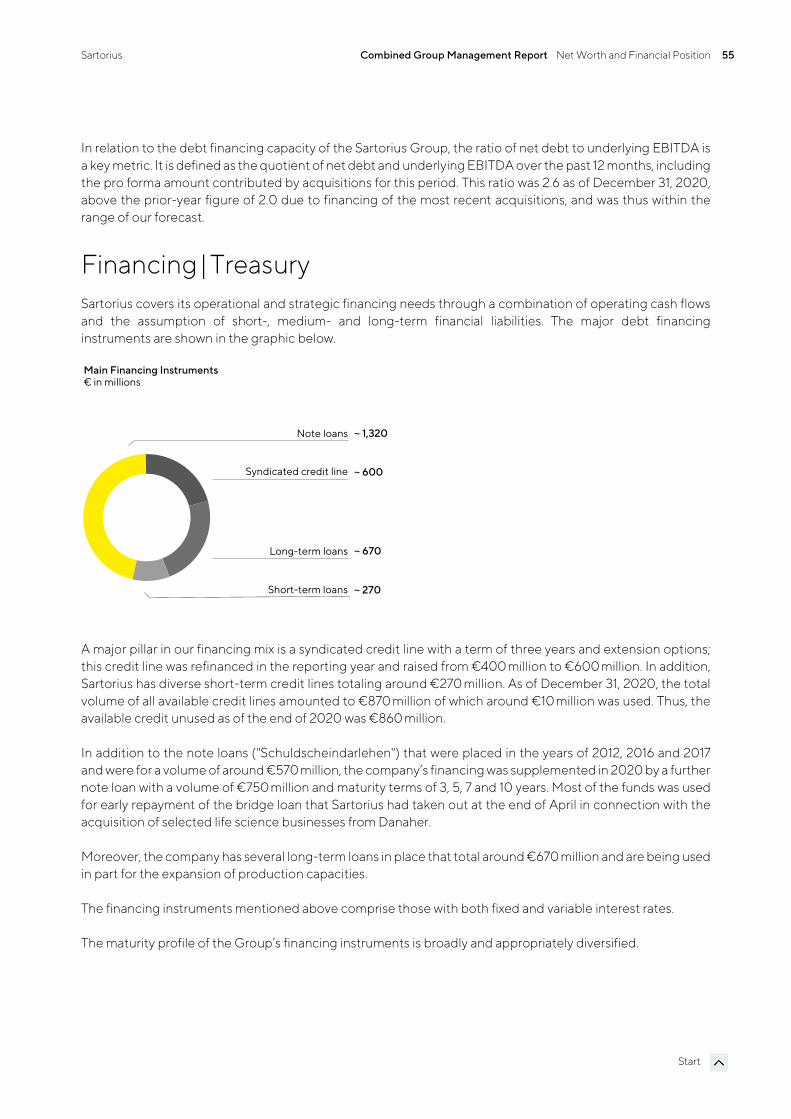
Sartorius Combined Group Management Report Net Worth and Financial Position 55
Start
In relation to the debt financing capacity of the Sartorius Group, the ratio of net debt to underlying EBITDA is a key metric. It is defined as the quotient of net debt and underlying EBITDA over the past 12 months, including the pro forma amount contributed by acquisitions for this period. This ratio was 2.6 as of December 31, 2020, above the prior-year figure of 2.0 due to financing of the most recent acquisitions, and was thus within the range of our forecast.
Financing|Treasury Sartorius covers its operational and strategic financing needs through a combination of operating cash flows and the assumption of short-, medium- and long-term financial liabilities. The major debt financing instruments are shown in the graphic below.
A major pillar in our financing mix is a syndicated credit line with a term of three years and extension options; this credit line was refinanced in the reporting year and raised from €400 million to €600 million. In addition, Sartorius has diverse short-term credit lines totaling around €270 million. As of December 31, 2020, the total volume of all available credit lines amounted to €870 million of which around €10 million was used. Thus, the available credit unused as of the end of 2020 was €860 million.
In addition to the note loans ("Schuldscheindarlehen") that were placed in the years of 2012, 2016 and 2017 and were for a volume of around €570 million, the company’s financing was supplemented in 2020 by a further note loan with a volume of €750 million and maturity terms of 3, 5, 7 and 10 years. Most of the funds was used for early repayment of the bridge loan that Sartorius had taken out at the end of April in connection with the acquisition of selected life science businesses from Danaher.
Moreover, the company has several long-term loans in place that total around €670 million and are being used in part for the expansion of production capacities.
The financing instruments mentioned above comprise those with both fixed and variable interest rates.
The maturity profile of the Group’s financing instruments is broadly and appropriately diversified.
Main Financing Instruments€ in millions
Note loans
Syndicated credit line
Long-term loans
Short-term loans
~ 1,320
~ 600
~ 670
~ 270
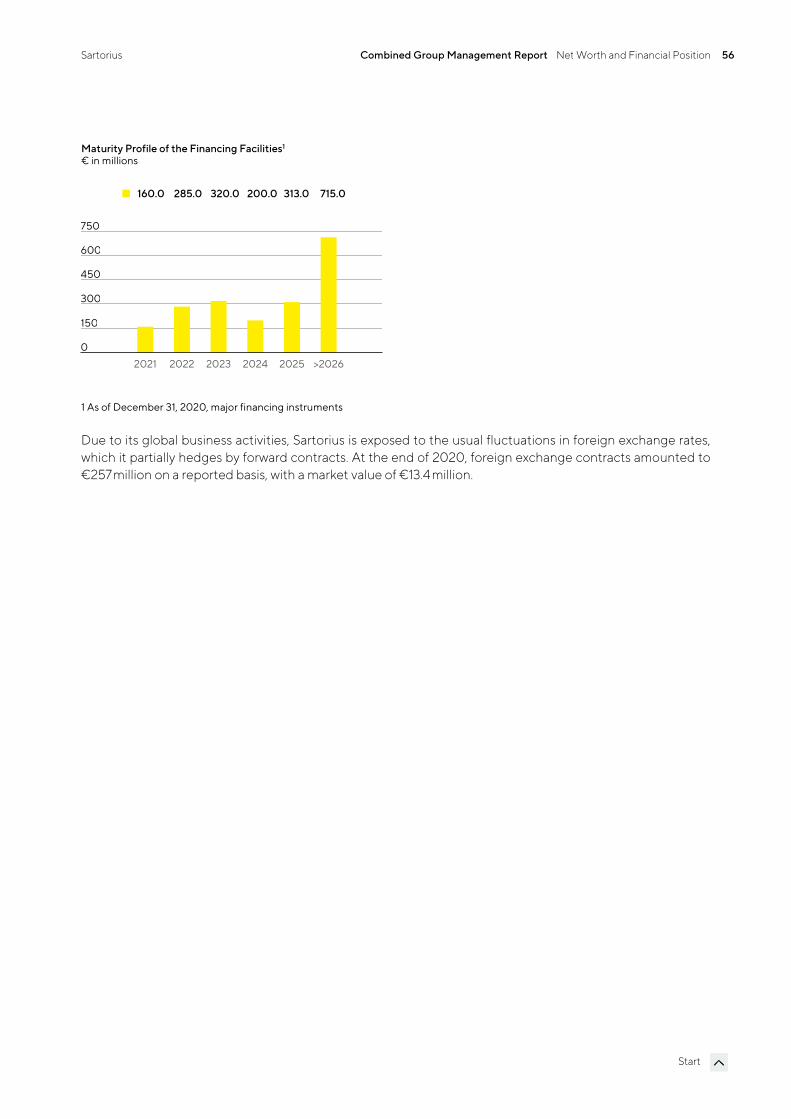
Sartorius Combined Group Management Report Net Worth and Financial Position 56
Start
1 As of December 31, 2020, major financing instruments
Due to its global business activities, Sartorius is exposed to the usual fluctuations in foreign exchange rates, which it partially hedges by forward contracts. At the end of 2020, foreign exchange contracts amounted to €257million on a reported basis, with a market value of €13.4 million.
Maturity Profile of the Financing Facilities1
€ in millions
160.0 285.0 320.0 313.0 715.0200.0
0
150
300
750
600
450
2021 2022 2023 2024 2025 >2026
Business Development of Bioprocess Solutions
Extraordinarily dynamic growth in sales revenue and earnings
Strong gains across all product categories and geographies
Division with a key role in vaccine production; benefited from strong development of acquisitions
Division sales
€1,782.6m In constant FX: +34.4%
Underlying EBITDA margin
32.3%+3.2 percentage points
Order intake
€2,238.1mIn constant FX: +56.4%
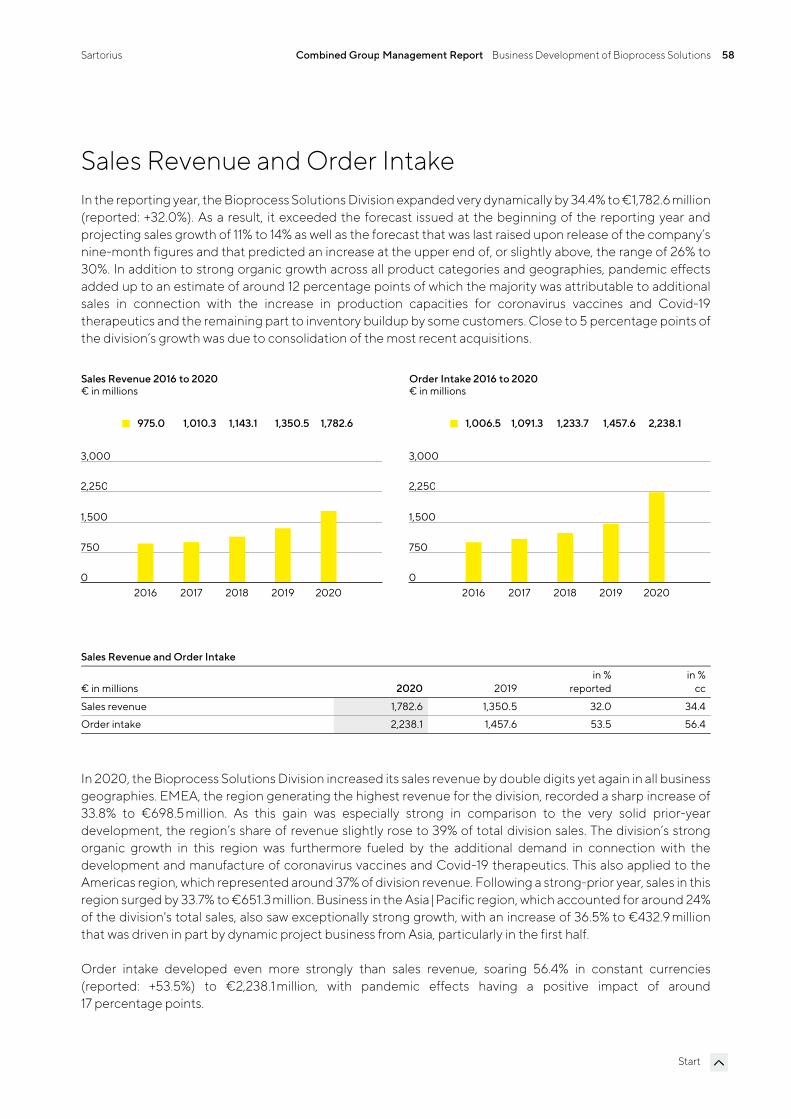
Sartorius Combined Group Management Report Business Development of Bioprocess Solutions 58
Start
Sales Revenue and Order Intake In the reporting year, the Bioprocess Solutions Division expanded very dynamically by 34.4% to €1,782.6 million (reported: +32.0%). As a result, it exceeded the forecast issued at the beginning of the reporting year and projecting sales growth of 11% to 14% as well as the forecast that was last raised upon release of the company’s nine-month figures and that predicted an increase at the upper end of, or slightly above, the range of 26% to 30%. In addition to strong organic growth across all product categories and geographies, pandemic effects added up to an estimate of around 12 percentage points of which the majority was attributable to additional sales in connection with the increase in production capacities for coronavirus vaccines and Covid-19 therapeutics and the remaining part to inventory buildup by some customers. Close to 5 percentage points of the division’s growth was due to consolidation of the most recent acquisitions.
Sales Revenue and Order Intake
€ in millions 2020 2019in %
reportedin %
cc
Sales revenue 1,782.6 1,350.5 32.0 34.4
Order intake 2,238.1 1,457.6 53.5 56.4
In 2020, the Bioprocess Solutions Division increased its sales revenue by double digits yet again in all business geographies. EMEA, the region generating the highest revenue for the division, recorded a sharp increase of 33.8% to €698.5 million. As this gain was especially strong in comparison to the very solid prior-year development, the region’s share of revenue slightly rose to 39% of total division sales. The division’s strong organic growth in this region was furthermore fueled by the additional demand in connection with the development and manufacture of coronavirus vaccines and Covid-19 therapeutics. This also applied to the Americas region, which represented around 37% of division revenue. Following a strong-prior year, sales in this region surged by 33.7% to €651.3 million. Business in the Asia|Pacific region, which accounted for around 24% of the division's total sales, also saw exceptionally strong growth, with an increase of 36.5% to €432.9 million that was driven in part by dynamic project business from Asia, particularly in the first half.
Order intake developed even more strongly than sales revenue, soaring 56.4% in constant currencies (reported: +53.5%) to €2,238.1 million, with pandemic effects having a positive impact of around 17 percentage points.
2016 2017 2018 2019 20200
750
1,500
2,250
3,000
Sales Revenue 2016 to 2020
975.0 1,010.3 1,143.1 1,350.5 1,782.6
€ in millions
2016 2017 2018 2019 20200
750
1,500
2,250
3,000
Order Intake 2016 to 2020
1,006.5 1,091.3 1,233.7 1,457.6 2,238.1
€ in millions
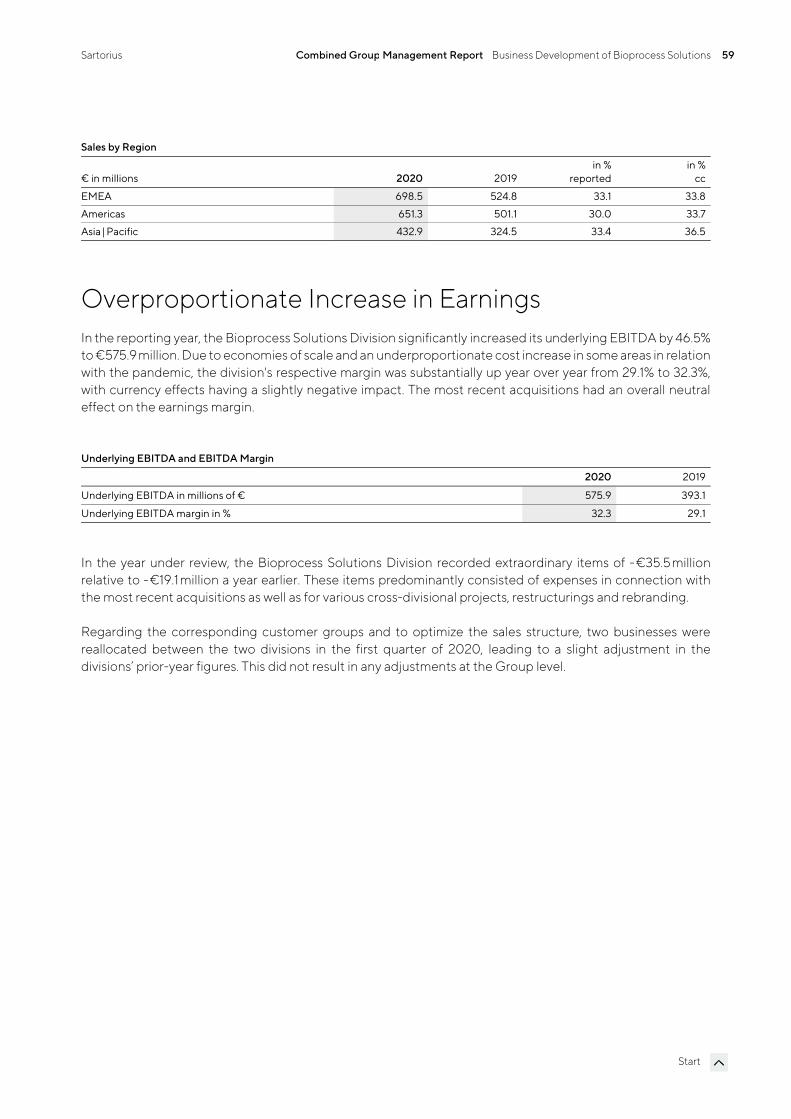
Sartorius Combined Group Management Report Business Development of Bioprocess Solutions 59
Start
Sales by Region
€ in millions 2020 2019in %
reportedin %
cc
EMEA 698.5 524.8 33.1 33.8
Americas 651.3 501.1 30.0 33.7
Asia | Pacific 432.9 324.5 33.4 36.5
Overproportionate Increase in Earnings In the reporting year, the Bioprocess Solutions Division significantly increased its underlying EBITDA by 46.5% to €575.9 million. Due to economies of scale and an underproportionate cost increase in some areas in relation with the pandemic, the division's respective margin was substantially up year over year from 29.1% to 32.3%, with currency effects having a slightly negative impact. The most recent acquisitions had an overall neutral effect on the earnings margin.
Underlying EBITDA and EBITDA Margin
2020 2019
Underlying EBITDA in millions of € 575.9 393.1
Underlying EBITDA margin in % 32.3 29.1
In the year under review, the Bioprocess Solutions Division recorded extraordinary items of - €35.5 million relative to -€19.1 million a year earlier. These items predominantly consisted of expenses in connection with the most recent acquisitions as well as for various cross-divisional projects, restructurings and rebranding.
Regarding the corresponding customer groups and to optimize the sales structure, two businesses were reallocated between the two divisions in the first quarter of 2020, leading to a slight adjustment in the divisions’ prior-year figures. This did not result in any adjustments at the Group level.
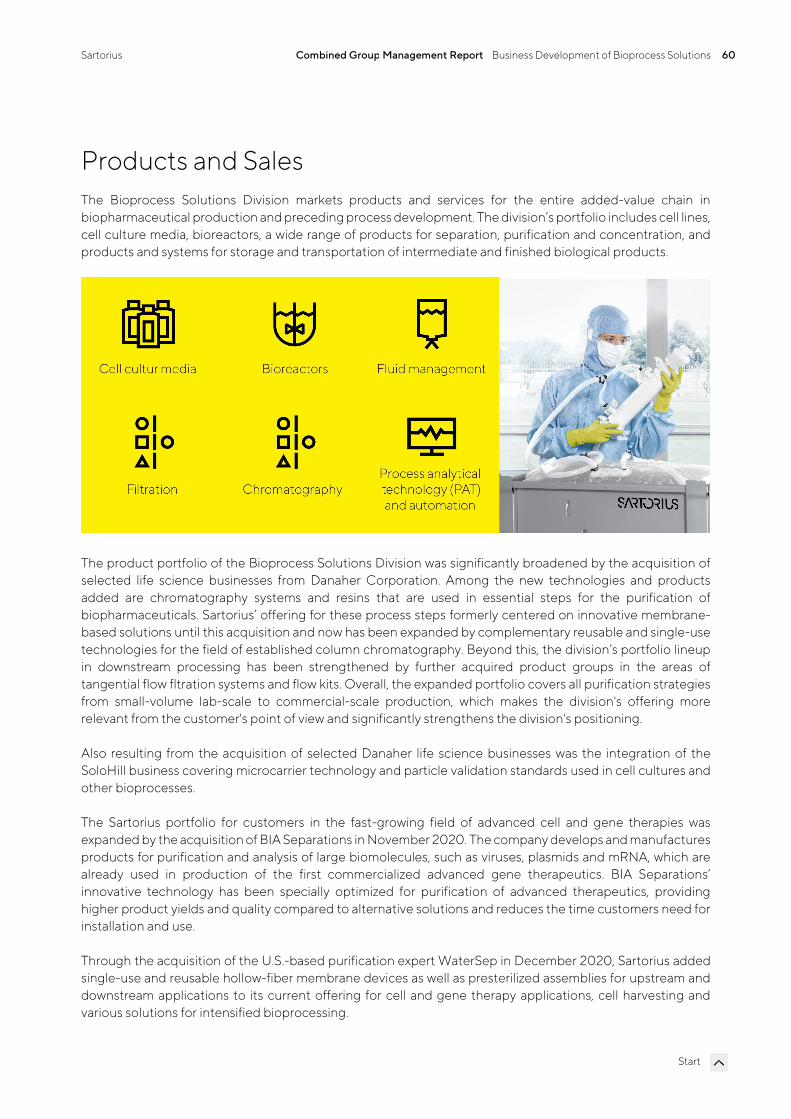
Sartorius Combined Group Management Report Business Development of Bioprocess Solutions 60
Start
Products and Sales The Bioprocess Solutions Division markets products and services for the entire added-value chain in biopharmaceutical production and preceding process development. The division’s portfolio includes cell lines, cell culture media, bioreactors, a wide range of products for separation, purification and concentration, and products and systems for storage and transportation of intermediate and finished biological products.
The product portfolio of the Bioprocess Solutions Division was significantly broadened by the acquisition of selected life science businesses from Danaher Corporation. Among the new technologies and products added are chromatography systems and resins that are used in essential steps for the purification of biopharmaceuticals. Sartorius’ offering for these process steps formerly centered on innovative membrane-based solutions until this acquisition and now has been expanded by complementary reusable and single-use technologies for the field of established column chromatography. Beyond this, the division’s portfolio lineup in downstream processing has been strengthened by further acquired product groups in the areas of tangential flow fltration systems and flow kits. Overall, the expanded portfolio covers all purification strategies from small-volume lab-scale to commercial-scale production, which makes the division's offering more relevant from the customer's point of view and significantly strengthens the division's positioning.
Also resulting from the acquisition of selected Danaher life science businesses was the integration of the SoloHill business covering microcarrier technology and particle validation standards used in cell cultures and other bioprocesses.
The Sartorius portfolio for customers in the fast-growing field of advanced cell and gene therapies was expanded by the acquisition of BIA Separations in November 2020. The company develops and manufactures products for purification and analysis of large biomolecules, such as viruses, plasmids and mRNA, which are already used in production of the first commercialized advanced gene therapeutics. BIA Separations’ innovative technology has been specially optimized for purification of advanced therapeutics, providing higher product yields and quality compared to alternative solutions and reduces the time customers need for installation and use.
Through the acquisition of the U.S.-based purification expert WaterSep in December 2020, Sartorius added single-use and reusable hollow-fiber membrane devices as well as presterilized assemblies for upstream and downstream applications to its current offering for cell and gene therapy applications, cell harvesting and various solutions for intensified bioprocessing.
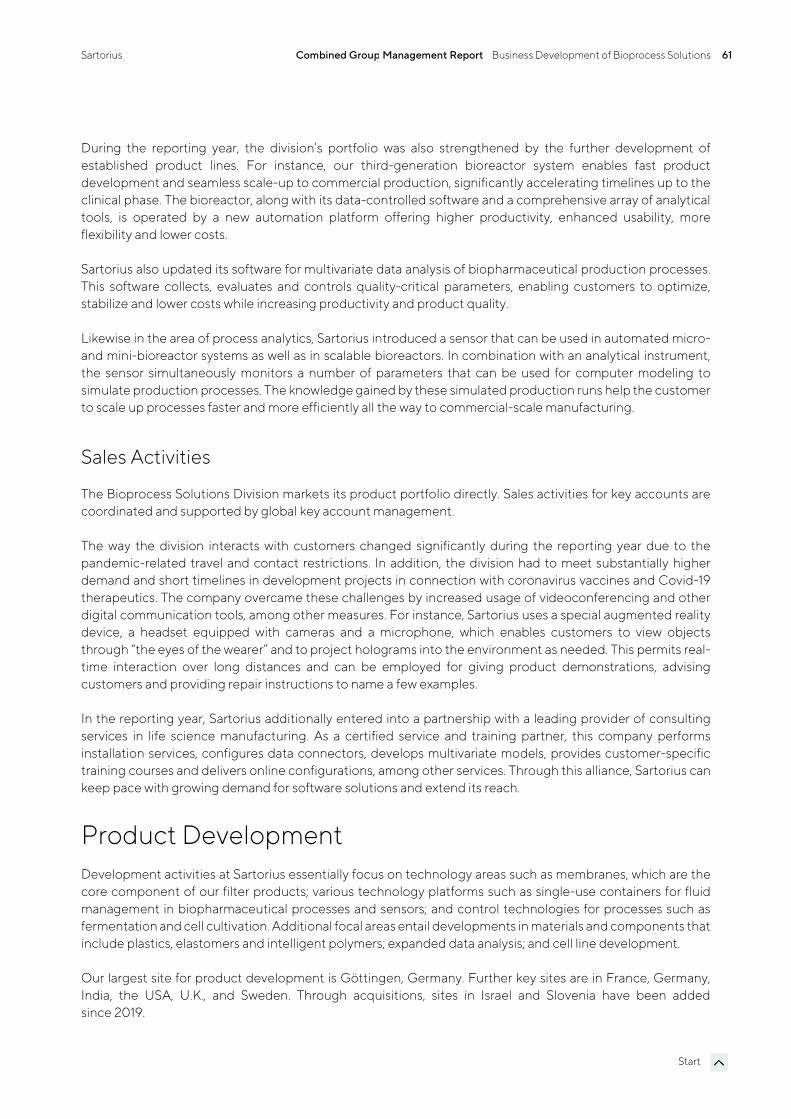
Sartorius Combined Group Management Report Business Development of Bioprocess Solutions 61
Start
During the reporting year, the division’s portfolio was also strengthened by the further development of established product lines. For instance, our third-generation bioreactor system enables fast product development and seamless scale-up to commercial production, significantly accelerating timelines up to the clinical phase. The bioreactor, along with its data-controlled software and a comprehensive array of analytical tools, is operated by a new automation platform offering higher productivity, enhanced usability, more flexibility and lower costs.
Sartorius also updated its software for multivariate data analysis of biopharmaceutical production processes. This software collects, evaluates and controls quality-critical parameters, enabling customers to optimize, stabilize and lower costs while increasing productivity and product quality.
Likewise in the area of process analytics, Sartorius introduced a sensor that can be used in automated micro- and mini-bioreactor systems as well as in scalable bioreactors. In combination with an analytical instrument, the sensor simultaneously monitors a number of parameters that can be used for computer modeling to simulate production processes. The knowledge gained by these simulated production runs help the customer to scale up processes faster and more efficiently all the way to commercial-scale manufacturing.
Sales Activities
The Bioprocess Solutions Division markets its product portfolio directly. Sales activities for key accounts are coordinated and supported by global key account management.
The way the division interacts with customers changed significantly during the reporting year due to the pandemic-related travel and contact restrictions. In addition, the division had to meet substantially higher demand and short timelines in development projects in connection with coronavirus vaccines and Covid-19 therapeutics. The company overcame these challenges by increased usage of videoconferencing and other digital communication tools, among other measures. For instance, Sartorius uses a special augmented reality device, a headset equipped with cameras and a microphone, which enables customers to view objects through “the eyes of the wearer” and to project holograms into the environment as needed. This permits real-time interaction over long distances and can be employed for giving product demonstrations, advising customers and providing repair instructions to name a few examples.
In the reporting year, Sartorius additionally entered into a partnership with a leading provider of consulting services in life science manufacturing. As a certified service and training partner, this company performs installation services, configures data connectors, develops multivariate models, provides customer-specific training courses and delivers online configurations, among other services. Through this alliance, Sartorius can keep pace with growing demand for software solutions and extend its reach.
Product Development Development activities at Sartorius essentially focus on technology areas such as membranes, which are the core component of our filter products; various technology platforms such as single-use containers for fluid management in biopharmaceutical processes and sensors; and control technologies for processes such as fermentation and cell cultivation. Additional focal areas entail developments in materials and components that include plastics, elastomers and intelligent polymers; expanded data analysis; and cell line development.
Our largest site for product development is Göttingen, Germany. Further key sites are in France, Germany, India, the USA, U.K., and Sweden. Through acquisitions, sites in Israel and Slovenia have been added since 2019.
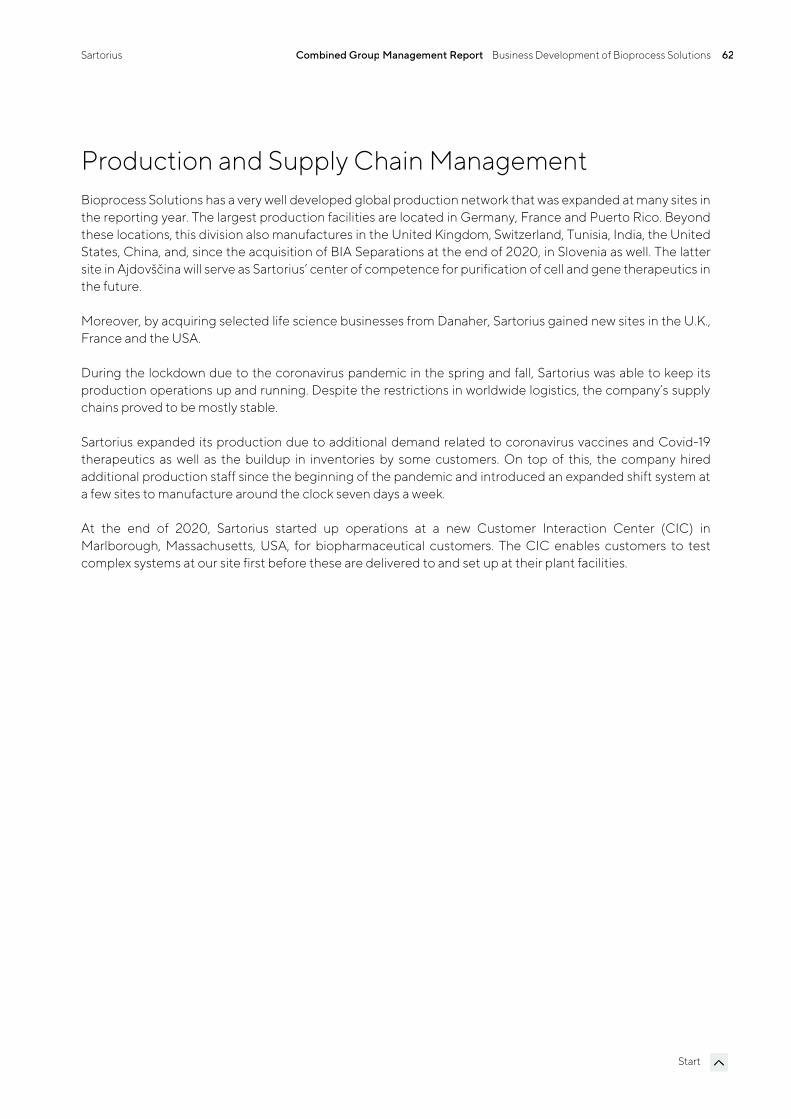
Sartorius Combined Group Management Report Business Development of Bioprocess Solutions 62
Start
Production and Supply Chain Management Bioprocess Solutions has a very well developed global production network that was expanded at many sites in the reporting year. The largest production facilities are located in Germany, France and Puerto Rico. Beyond these locations, this division also manufactures in the United Kingdom, Switzerland, Tunisia, India, the United States, China, and, since the acquisition of BIA Separations at the end of 2020, in Slovenia as well. The latter site in Ajdovščina will serve as Sartorius’ center of competence for purification of cell and gene therapeutics in the future.
Moreover, by acquiring selected life science businesses from Danaher, Sartorius gained new sites in the U.K., France and the USA.
During the lockdown due to the coronavirus pandemic in the spring and fall, Sartorius was able to keep its production operations up and running. Despite the restrictions in worldwide logistics, the company’s supply chains proved to be mostly stable.
Sartorius expanded its production due to additional demand related to coronavirus vaccines and Covid-19 therapeutics as well as the buildup in inventories by some customers. On top of this, the company hired additional production staff since the beginning of the pandemic and introduced an expanded shift system at a few sites to manufacture around the clock seven days a week.
At the end of 2020, Sartorius started up operations at a new Customer Interaction Center (CIC) in Marlborough, Massachusetts, USA, for biopharmaceutical customers. The CIC enables customers to test complex systems at our site first before these are delivered to and set up at their plant facilities.
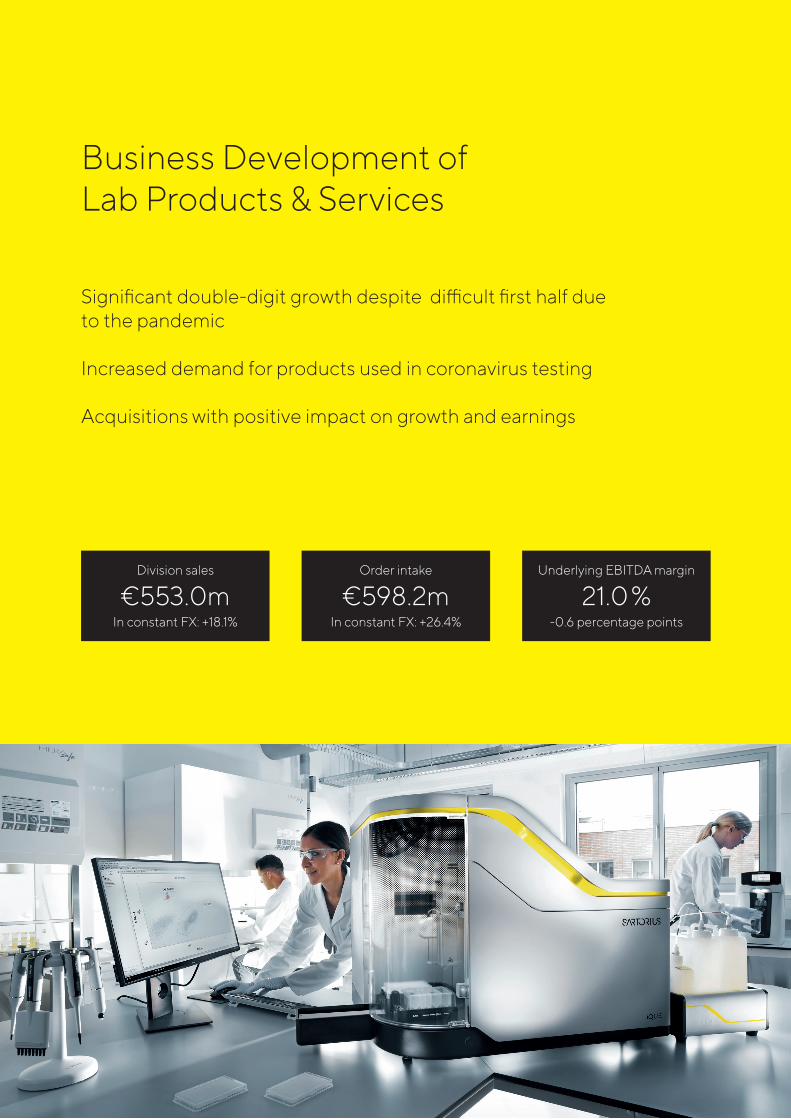
Business Development of Lab Products & Services
Significant double-digit growth despite difficult first half due to the pandemic
Increased demand for products used in coronavirus testing
Acquisitions with positive impact on growth and earnings
Division sales
€553.0mIn constant FX: +18.1%
Underlying EBITDA margin
21.0%-0.6 percentage points
Order intake
€598.2mIn constant FX: +26.4%
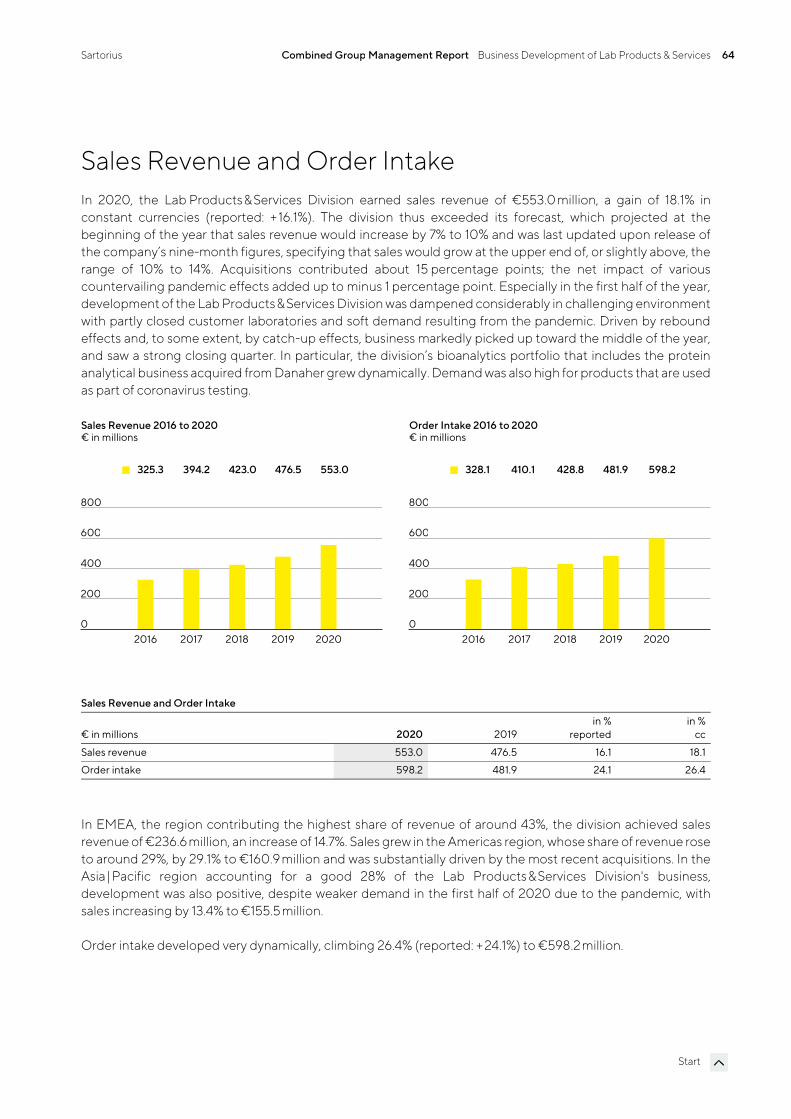
Sartorius Combined Group Management Report Business Development of Lab Products & Services 64
Start
Sales Revenue and Order Intake In 2020, the Lab Products &Services Division earned sales revenue of €553.0 million, a gain of 18.1% in constant currencies (reported: + 16.1%). The division thus exceeded its forecast, which projected at the beginning of the year that sales revenue would increase by 7% to 10% and was last updated upon release of the company’s nine-month figures, specifying that sales would grow at the upper end of, or slightly above, the range of 10% to 14%. Acquisitions contributed about 15 percentage points; the net impact of various countervailing pandemic effects added up to minus 1 percentage point. Especially in the first half of the year, development of the Lab Products &Services Division was dampened considerably in challenging environment with partly closed customer laboratories and soft demand resulting from the pandemic. Driven by rebound effects and, to some extent, by catch-up effects, business markedly picked up toward the middle of the year, and saw a strong closing quarter. In particular, the division’s bioanalytics portfolio that includes the protein analytical business acquired from Danaher grew dynamically. Demand was also high for products that are used as part of coronavirus testing.
Sales Revenue and Order Intake
€ in millions 2020 2019in %
reportedin %
cc
Sales revenue 553.0 476.5 16.1 18.1
Order intake 598.2 481.9 24.1 26.4
In EMEA, the region contributing the highest share of revenue of around 43%, the division achieved sales revenue of €236.6 million, an increase of 14.7%. Sales grew in the Americas region, whose share of revenue rose to around 29%, by 29.1% to €160.9 million and was substantially driven by the most recent acquisitions. In the Asia|Pacific region accounting for a good 28% of the Lab Products &Services Division's business, development was also positive, despite weaker demand in the first half of 2020 due to the pandemic, with sales increasing by 13.4% to €155.5 million.
Order intake developed very dynamically, climbing 26.4% (reported: + 24.1%) to €598.2 million.
2016 2017 2018 2019 20200
200
400
600
800
Sales Revenue 2016 to 2020
325.3 394.2 423.0 476.5 553.0
€ in millions
2016 2017 2018 2019 20200
200
400
600
800
Order Intake 2016 to 2020
328.1 410.1 428.8 481.9 598.2
€ in millions
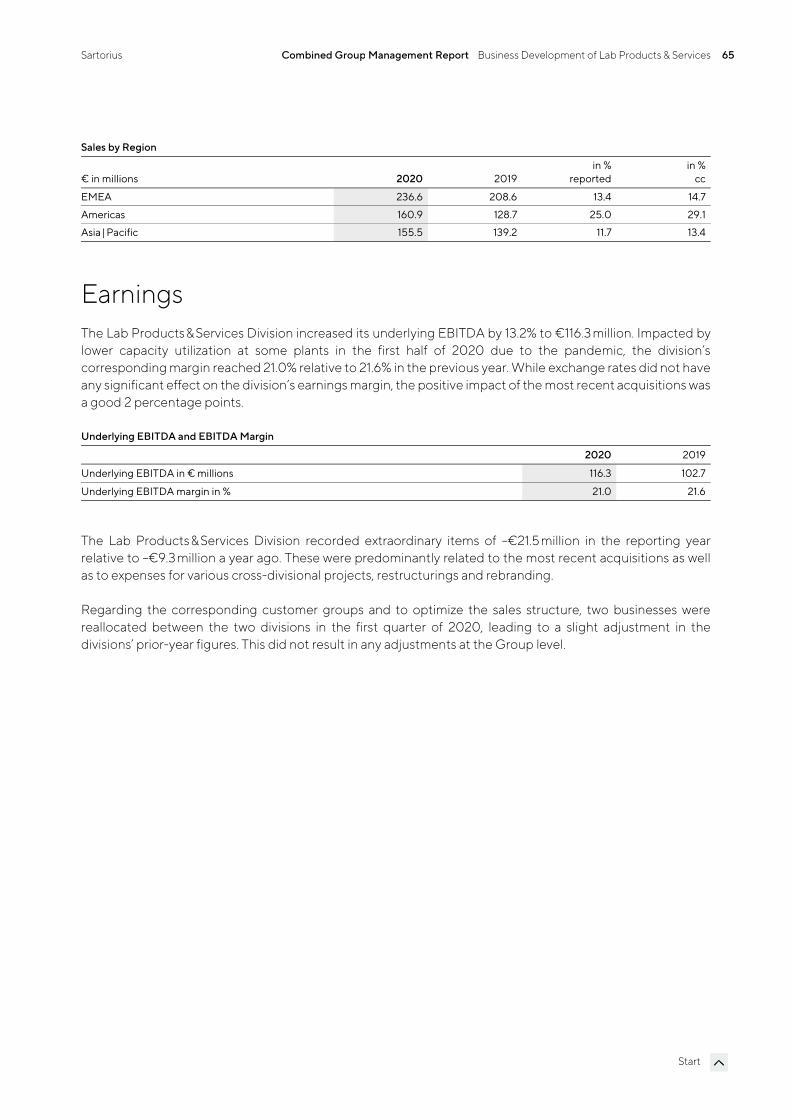
Sartorius Combined Group Management Report Business Development of Lab Products & Services 65
Start
Sales by Region
€ in millions 2020 2019in %
reportedin %
cc
EMEA 236.6 208.6 13.4 14.7
Americas 160.9 128.7 25.0 29.1
Asia | Pacific 155.5 139.2 11.7 13.4
Earnings The Lab Products &Services Division increased its underlying EBITDA by 13.2% to €116.3 million. Impacted by lower capacity utilization at some plants in the first half of 2020 due to the pandemic, the division’s corresponding margin reached 21.0% relative to 21.6% in the previous year. While exchange rates did not have any significant effect on the division’s earnings margin, the positive impact of the most recent acquisitions was a good 2 percentage points.
Underlying EBITDA and EBITDA Margin
2020 2019
Underlying EBITDA in € millions 116.3 102.7
Underlying EBITDA margin in % 21.0 21.6
The Lab Products &Services Division recorded extraordinary items of –€21.5 million in the reporting year relative to –€9.3 million a year ago. These were predominantly related to the most recent acquisitions as well as to expenses for various cross-divisional projects, restructurings and rebranding.
Regarding the corresponding customer groups and to optimize the sales structure, two businesses were reallocated between the two divisions in the first quarter of 2020, leading to a slight adjustment in the divisions’ prior-year figures. This did not result in any adjustments at the Group level.
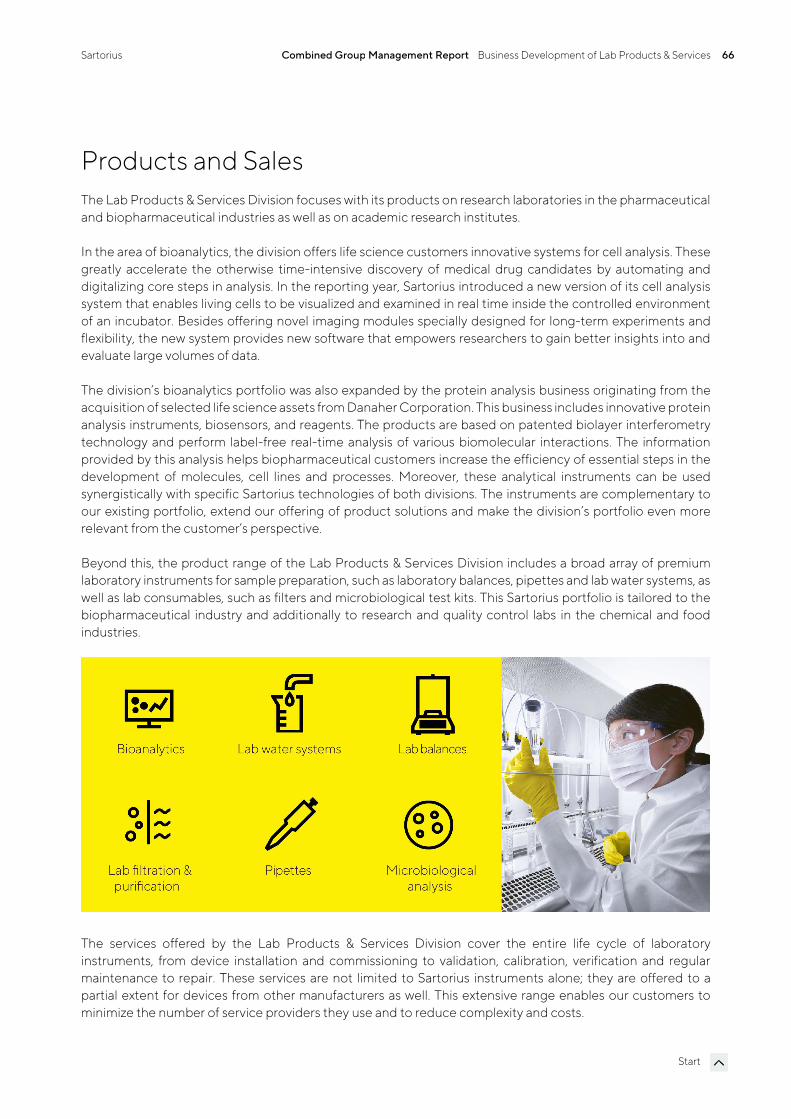
Sartorius Combined Group Management Report Business Development of Lab Products & Services 66
Start
Products and Sales The Lab Products & Services Division focuses with its products on research laboratories in the pharmaceutical and biopharmaceutical industries as well as on academic research institutes.
In the area of bioanalytics, the division offers life science customers innovative systems for cell analysis. These greatly accelerate the otherwise time-intensive discovery of medical drug candidates by automating and digitalizing core steps in analysis. In the reporting year, Sartorius introduced a new version of its cell analysis system that enables living cells to be visualized and examined in real time inside the controlled environment of an incubator. Besides offering novel imaging modules specially designed for long-term experiments and flexibility, the new system provides new software that empowers researchers to gain better insights into and evaluate large volumes of data.
The division’s bioanalytics portfolio was also expanded by the protein analysis business originating from the acquisition of selected life science assets from Danaher Corporation. This business includes innovative protein analysis instruments, biosensors, and reagents. The products are based on patented biolayer interferometry technology and perform label-free real-time analysis of various biomolecular interactions. The information provided by this analysis helps biopharmaceutical customers increase the efficiency of essential steps in the development of molecules, cell lines and processes. Moreover, these analytical instruments can be used synergistically with specific Sartorius technologies of both divisions. The instruments are complementary to our existing portfolio, extend our offering of product solutions and make the division’s portfolio even more relevant from the customer’s perspective.
Beyond this, the product range of the Lab Products & Services Division includes a broad array of premium laboratory instruments for sample preparation, such as laboratory balances, pipettes and lab water systems, as well as lab consumables, such as filters and microbiological test kits. This Sartorius portfolio is tailored to the biopharmaceutical industry and additionally to research and quality control labs in the chemical and food industries.
The services offered by the Lab Products & Services Division cover the entire life cycle of laboratory instruments, from device installation and commissioning to validation, calibration, verification and regular maintenance to repair. These services are not limited to Sartorius instruments alone; they are offered to a partial extent for devices from other manufacturers as well. This extensive range enables our customers to minimize the number of service providers they use and to reduce complexity and costs.
Sartorius Combined Group Management Report Business Development of Lab Products & Services 67
Start
Sartorius application laboratories in all regions offer customers the opportunity to test Sartorius products, even using their own samples, and to take training courses.
Sales Activities
The division sells its products through three channels: laboratory distributors, e-business, and direct sales. Its sales activities center on direct sales as well as digital sales channels, both of which are being expanded continually with an increasing focus on life science customers.
Besides extending our sales structures, we also concentrate on the ongoing enhancement of sales efficiency, in part through the creation of synergies between the two divisions. The Lab Products & Service Division therefore gains access to customers of the Bioprocess Solutions Division, and the latter can likewise tap into new sales opportunities in return.
Product Development The division has extensive technological expertise in the areas of bioanalytics, laboratory instruments and laboratory consumables. Software and hardware advancements in our cell analysis products create many new evaluation opportunities for our customers. They are the foundation for the development of new tools capable of processing and visualizing vast quantities of data appropriately based on specific applications. We expect that such software solutions will become increasingly important.
Compliance with regulatory requirements is critical for our customers. Product development priorities for Sartorius therefore include data management, connectivity and process automation.
Most of the research and development for the Lab Products & Services Division is conducted at Group headquarters in Göttingen, Germany, but Sartorius also carries out R&D activities at its sites in Finland and the U.K. as well as in the USA.
Production and Supply Chain Management The Lab Products & Services Division operates plants in Germany, China, Finland, the U.K. and the USA. These plants serve as centers of competence and tend to focus on one product group or a small set of product groups. In the reporting year, laboratory balances were manufactured in Germany and China, for example, and pipettes in Finland. Bioanalytical systems are made in the USA and, following the acquisition of Danaher's life science businesses, also in China. Microbiological test kits are produced in the U.K. and most membrane-based products in Germany.
Sartorius was hardly affected by production restrictions due to lockdowns caused by the coronavirus pandemic. Even during the lockdowns, the company kept its manufacturing operations up and running in all countries. Despite the restrictions in global logistics, Sartorius supply chains proved to be largely stable. Due to high demand generated by the coronavirus pandemic for products such as pipette tips, production was expanded in Finland.
Sartorius Combined Group Management Report Assessment of Economic Position 68
Start
Assessment of Economic Position In 2020, Sartorius grew at an exceptionally dynamic rate. Already in the first three months of the reporting year, the Bioprocess Solutions Division in particular reported highly positive business performance. Based on the results and in connection with the pending closing of an acquisition, management adjusted its forecast for both divisions and thus for the entire Group upon release of its business figures for the first quarter of 2020. Besides strong growth across all product segments and geographies, the Bioprocess Solutions Division recorded an increasing number of orders in connection with coronavirus vaccines and Covid-19 therapeutics as well as due to customers’ inventory buildup during the further course of the year. The sales and earnings forecasts of the Bioprocess Solutions Division as well as of the Group were accordingly raised once again upon publication of the company’s first-half report and upon release of its nine-month figures, specifying that sales revenue would grow at upper end of, or slightly above, the ranges indicated.
Even the Lab Products & Services Division that is more sensitive to economic cycles developed overall positively during the full year, with first-half growth dampened considerably due to soft demand in some product segments and regions due to the pandemic. The forecast for division sales was raised upon publication of the figures for the first quarter of 2020; the reason for this was the acquisition already mentioned above. Expectations for the division’s earnings margin remained unchanged. Due to rebound effects and, in part, catch-up effects, business picked up markedly as of the third quarter of 2020 so that upon release of the nine-month figures in 2020, the division outlook for sales growth was specified at the upper end of, or slightly above, the range indicated and its profitability guidance was raised.
Consolidated sales revenue surged during 2020 by 30.2% in constant currencies to €2,335.7 million. The Group’s underlying EBITDA margin rose to 29.6%, thus exceeding the forecast specified upon release of the company’s nine-month figures. The Bioprocess Solutions Division was above expectations with its sharp rise in sales of 34.4% in constant currencies to €1,782.6 million and an underlying EBITDA margin of 32.3%. Similar development applies to the Lab Products & Services Division, which, after a strong final quarter, achieved a full-year increase in sales of 18.1% to €553.0 million in constant currencies, with an earnings margin of 21.0%.
The ratio of net debt to underlying EBITDA for the last twelve months rose to 2.6 as of December 31, 2020, due to financing of the most recent acquisitions and, therefore, also was within the forecast. The Sartorius Group continues to have significant financing flexibility to implement its strategy.
In the context of its ambitious growth targets, Sartorius has been making considerable investments over the past few years in the ramp-up of its manufacturing capacities and in its digital infrastructure. In the reporting year, the ratio of capital expenditures (CAPEX) to sales revenue was 10.3%.
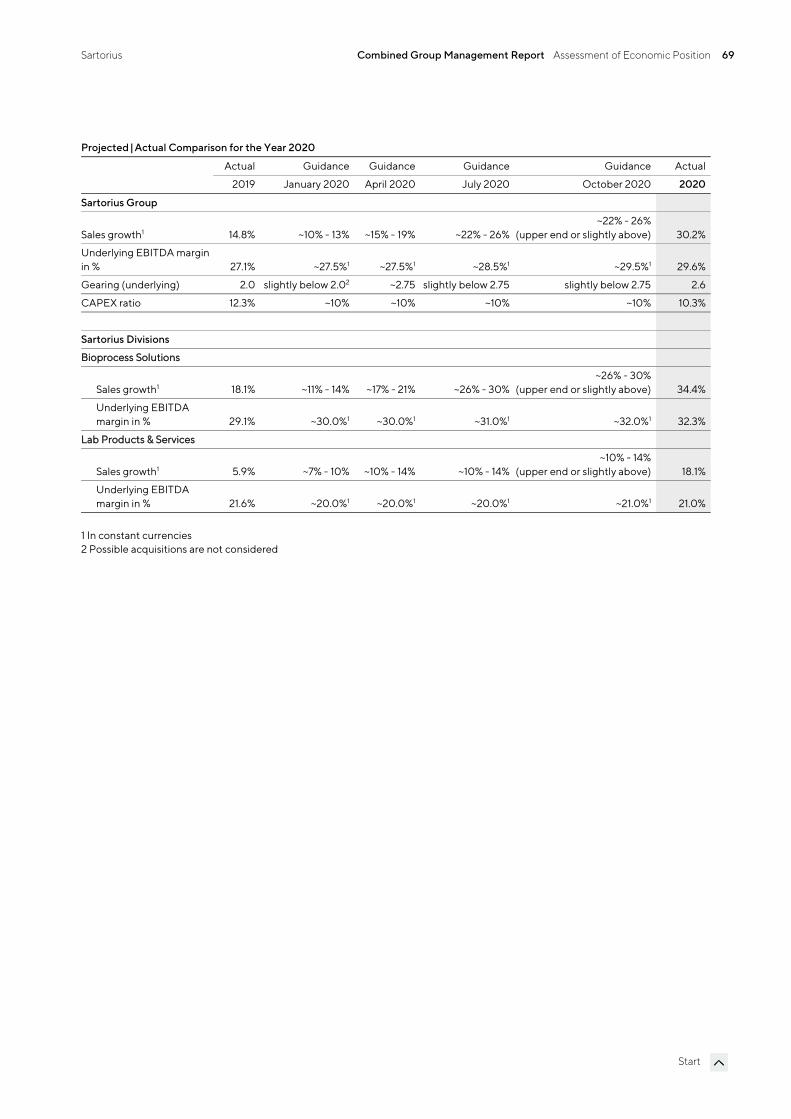
Sartorius Combined Group Management Report Assessment of Economic Position 69
Start
Projected |Actual Comparison for the Year 2020
Actual Guidance Guidance Guidance Guidance Actual
2019 January 2020 April 2020 July 2020 October 2020 2020
Sartorius Group
Sales growth1 14.8% ~10% - 13% ~15% - 19% ~22% - 26%~22% - 26%
(upper end or slightly above) 30.2%
Underlying EBITDA margin in % 27.1% ~27.5%1 ~27.5%1 ~28.5%1 ~29.5%1 29.6%
Gearing (underlying) 2.0 slightly below 2.02 ~2.75 slightly below 2.75 slightly below 2.75 2.6
CAPEX ratio 12.3% ~10% ~10% ~10% ~10% 10.3%
Sartorius Divisions
Bioprocess Solutions
Sales growth1 18.1% ~11% - 14% ~17% - 21% ~26% - 30%~26% - 30%
(upper end or slightly above) 34.4%
Underlying EBITDA margin in % 29.1% ~30.0%1 ~30.0%1 ~31.0%1 ~32.0%1 32.3%
Lab Products & Services
Sales growth1 5.9% ~7% - 10% ~10% - 14% ~10% - 14%~10% - 14%
(upper end or slightly above) 18.1%
Underlying EBITDA margin in % 21.6% ~20.0%1 ~20.0%1 ~20.0%1 ~21.0%1 21.0%
1 In constant currencies 2 Possible acquisitions are not considered
Sartorius Combined Group Management Report Annual Financial Statements of Sartorius AG 70
Start
Annual Financial Statements of Sartorius AG The retained profit of Sartorius AG is the key reference value for the payment of dividends to our shareholders. Whereas the Sartorius Group financial statements are drawn up according to the International Financial Reporting Standards (IFRS), the annual financial statements for Sartorius AG are prepared by applying the rules and regulations of the German Commercial Code (HGB).
The Management Report of Sartorius AG and the Group Management Report for fiscal 2020 are combined. The HGB annual financial statements of Sartorius AG and the combined management report are published simultaneously in the German Federal Gazette (Bundesanzeiger).
Business Operations, Corporate Strategy, Corporate Management and Oversight, Overview of Business Development Sartorius AG has exercised only the functions of the strategic, group-leading management holding entity for the Sartorius Group since the beginning of fiscal 2011, and we refer in this connection to the explanatory reports concerning business operations, corporate strategy, corporate management and oversight, as well as the overview of business development, presented on pages 26 et seq. of the combined management report of Sartorius AG and the Group.
Earnings Situation Sales revenue of Sartorius AG essentially consists of cost transfers to affiliated companies within the Group for management services rendered as well as of the rental of buildings on Sartorius Campus.
Other operating income consists of book profits from asset sales in the amount of €131.0 million. These resulted from the sale of shares of Sartorius Stedim Biotech as part of the acquisition of BIA Separations.
Income from investments of €23.3 million relative to €39.0 million a year ago concerns dividends paid out for the French subsidiary Sartorius Stedim Biotech S.A.
Due to profit and loss transfer agreements, Sartorius AG received a profit of €4.2 million from Sartorius Corporate Administration GmbH (2019: €0.3 million). Moreover, Sartorius Lab Holding GmbH transferred a loss of €28.4 million (2019: profit of €3.1 million). The loss reported by Sartorius Lab Holding GmbH essentially resulted from its one-time assumption of losses recorded by Sartorius Lab Instruments GmbH & Co. KG for fiscal 2020.
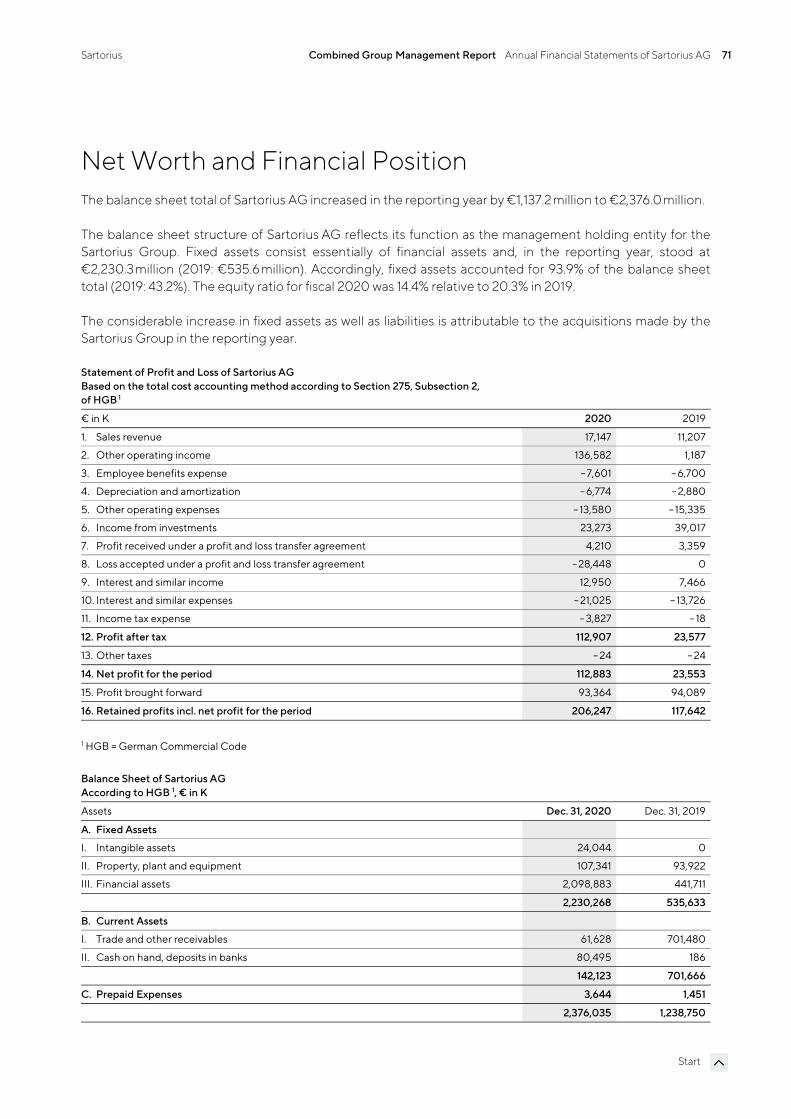
Sartorius Combined Group Management Report Annual Financial Statements of Sartorius AG 71
Start
Net Worth and Financial Position The balance sheet total of Sartorius AG increased in the reporting year by €1,137.2 million to €2,376.0 million.
The balance sheet structure of Sartorius AG reflects its function as the management holding entity for the Sartorius Group. Fixed assets consist essentially of financial assets and, in the reporting year, stood at €2,230.3million (2019: €535.6 million). Accordingly, fixed assets accounted for 93.9% of the balance sheet total (2019: 43.2%). The equity ratio for fiscal 2020 was 14.4% relative to 20.3% in 2019.
The considerable increase in fixed assets as well as liabilities is attributable to the acquisitions made by the Sartorius Group in the reporting year.
Statement of Profit and Loss of Sartorius AG Based on the total cost accounting method according to Section 275, Subsection 2, of HGB 1
€ in K 2020 2019
1. Sales revenue 17,147 11,207
2. Other operating income 136,582 1,187
3. Employee benefits expense –7,601 – 6,700
4. Depreciation and amortization –6,774 – 2,880
5. Other operating expenses – 13,580 – 15,335
6. Income from investments 23,273 39,017
7. Profit received under a profit and loss transfer agreement 4,210 3,359
8. Loss accepted under a profit and loss transfer agreement – 28,448 0
9. Interest and similar income 12,950 7,466
10. Interest and similar expenses – 21,025 – 13,726
11. Income tax expense – 3,827 – 18
12. Profit after tax 112,907 23,577
13. Other taxes – 24 – 24
14. Net profit for the period 112,883 23,553
15. Profit brought forward 93,364 94,089
16. Retained profits incl. net profit for the period 206,247 117,642
1 HGB = German Commercial Code
Balance Sheet of Sartorius AG According to HGB 1, € in K
Assets Dec. 31, 2020 Dec. 31, 2019
A. Fixed Assets
I. Intangible assets 24,044 0
II. Property, plant and equipment 107,341 93,922
III. Financial assets 2,098,883 441,711
2,230,268 535,633
B. Current Assets
I. Trade and other receivables 61,628 701,480
II. Cash on hand, deposits in banks 80,495 186
142,123 701,666
C. Prepaid Expenses 3,644 1,451
2,376,035 1,238,750
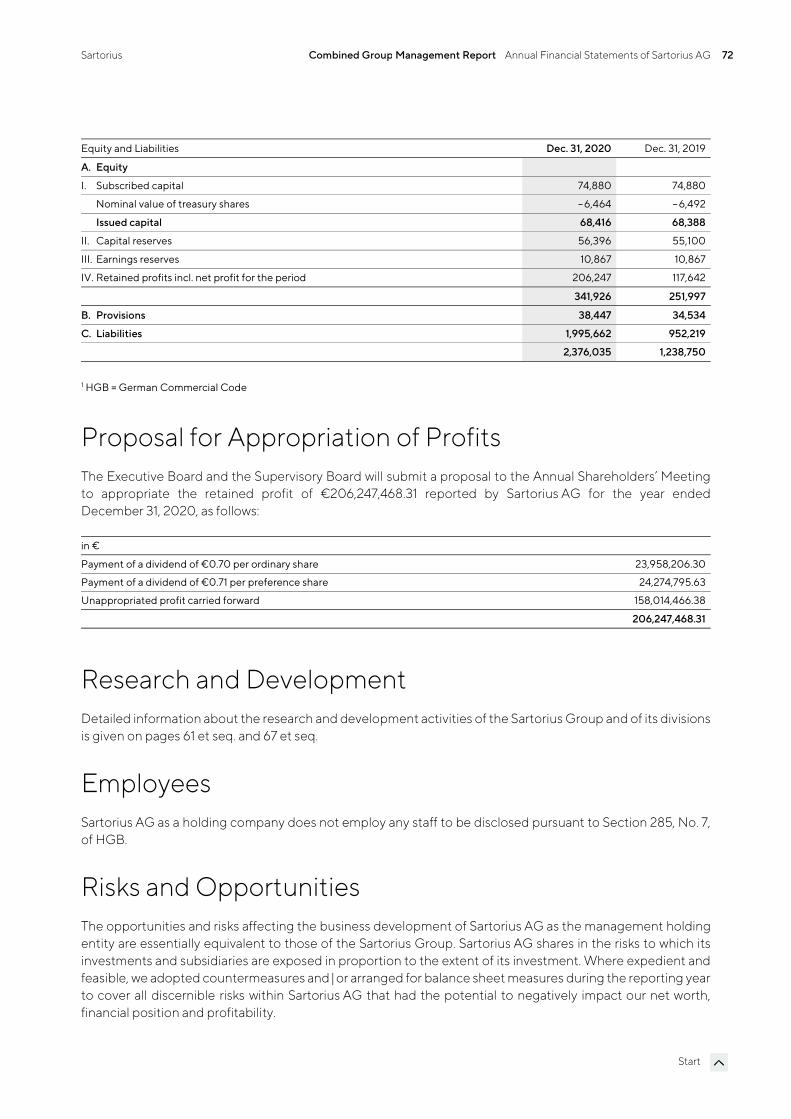
Sartorius Combined Group Management Report Annual Financial Statements of Sartorius AG 72
Start
Equity and Liabilities Dec. 31, 2020 Dec. 31, 2019
A. Equity
I. Subscribed capital 74,880 74,880
Nominal value of treasury shares –6,464 – 6,492
Issued capital 68,416 68,388
II. Capital reserves 56,396 55,100
III. Earnings reserves 10,867 10,867
IV. Retained profits incl. net profit for the period 206,247 117,642
341,926 251,997
B. Provisions 38,447 34,534
C. Liabilities 1,995,662 952,219
2,376,035 1,238,750
1 HGB = German Commercial Code
Proposal for Appropriation of Profits The Executive Board and the Supervisory Board will submit a proposal to the Annual Shareholders’ Meeting to appropriate the retained profit of €206,247,468.31 reported by Sartorius AG for the year ended December 31, 2020, as follows:
in €
Payment of a dividend of €0.70 per ordinary share 23,958,206.30
Payment of a dividend of €0.71 per preference share 24,274,795.63
Unappropriated profit carried forward 158,014,466.38
206,247,468.31
Research and Development Detailed information about the research and development activities of the Sartorius Group and of its divisions is given on pages 61 et seq. and 67 et seq.
Employees Sartorius AG as a holding company does not employ any staff to be disclosed pursuant to Section 285, No. 7, of HGB.
Risks and Opportunities The opportunities and risks affecting the business development of Sartorius AG as the management holding entity are essentially equivalent to those of the Sartorius Group. Sartorius AG shares in the risks to which its investments and subsidiaries are exposed in proportion to the extent of its investment. Where expedient and feasible, we adopted countermeasures and | or arranged for balance sheet measures during the reporting year to cover all discernible risks within Sartorius AG that had the potential to negatively impact our net worth, financial position and profitability.
Sartorius Combined Group Management Report Annual Financial Statements of Sartorius AG 73
Start
A detailed Opportunity and Risk Report for the Sartorius Group is provided on pages 74 to 85; a description of the internal control and risk management system, on page 92.
Report on Material Events Please refer to page 91 to read the Report on Material Events for Sartorius AG and the Sartorius Group.
Forecast Report Earnings trends for Sartorius AG depend substantially on the progress of its subsidiaries and, hence, on the Sartorius Group.
The development of the Sartorius Group's business is discussed in the Forecast Report on pages 86 to 90.
Sartorius Combined Group Management Report Opportunity and Risk Report 74
Start
Opportunity and Risk Report Principles Every business activity entails opportunities and risks, which have to be managed. The skill with which this is done is a decisive success factor in determining the future development of a company's shareholder value.
It is not the task of risk management to eliminate all possible risks. Rather, our approach is to intentionally take a certain measure of risk in our business activities in order to be successful in unlocking opportunities. In this endeavor, it is important to keep risks contained within acceptable limits and to control them carefully. Through appropriate guidelines, we ensure that risk assessments are taken into account in the decision-making processes from the very beginning.
At Sartorius, identification and management of opportunities and risks is a cross-functional component of Group management. To this extent, our risk management organization reflects a global functional organization in the two divisions of Bioprocess Solutions and Lab Products & Services. Within this organization, individuals heading a functional area, so-called "risk owners," are each responsible for their own management of opportunities and risks. The cross-divisional Finance & Controlling department is responsible for organizing the respective reporting process, including further developing the Group's risk management system.
Managing Opportunities Our opportunity management centers on the analysis of target markets and sector environments, as well as the assessment of trends, both of which give strong indications as to future business opportunities. The identification of the potential for development in this context is one of the key roles of the relevant managers and initially takes place at the local rather than the central level. Particularly the market-facing functions, such as strategic marketing and product management in each of the two divisions, play a leading role in this respect. The central Business Development unit additionally supports these areas with market monitoring, data analysis and the implementation of strategic projects.
The Group strategy is regularly reviewed and adapted where necessary. As part of these reviews, the members of the Executive Board together with managers having operational responsibility regularly discuss short-, medium- and long-term opportunity potential for the various business areas. If the opportunities are short-term in nature, they are considered in annual budget planning. Medium- and longer-term opportunities are tracked systematically as part of strategic planning.
As a partner of the biopharmaceutical and laboratory industries, Sartorius operates in future-oriented and high-growth sectors. The significant opportunities generated by the various market and technology trends are described in detail in the sections entitled "Sector Conditions" and "Outlook for the Sectors" on pages 37 and 86, respectively.
Our assessments rank Sartorius as one of the global market leaders in many subsegments and product areas. We believe the high quality of our products, our high brand recognition and our established customer relationships give us strong opportunities to stabilize and continue extending our market leadership. The corresponding division strategies and the growth opportunities and initiatives based on them are discussed in the section on the strategy of the Bioprocess Solutions Division, which begins on page 31, and in the section on the strategy of the Lab Products & Services Division, which starts on page 32.
Sartorius Combined Group Management Report Opportunity and Risk Report 75
Start
Risk Management
Organization
Overall responsibility for the maintenance of an effective risk management system ensuring comprehensive and consistent management of all material risks rests with the Executive Board. The Finance & Controlling Department is responsible for coordinating and developing this system and for consolidated risk reporting, while the particular functional areas are responsible for identifying, analyzing and reporting individual risks, as well as for assessing their potential impact and taking the appropriate countermeasures.
The Supervisory Board of Sartorius AG monitors the effectiveness of the risk management system, with the preparatory work being performed by the Audit Committee of this board. While carrying out their statutory audit mandate for the annual financial statements and consolidated financial statements, the independent auditors assess whether the early warning system in place is capable of prompt identification of risks that could jeopardize the future of the company. Finally, the Internal Audit Department regularly reviews the risk management process and system.
Insurance
We have taken out insurance policies to cover a wide range of risks where possible and economically advisable. These insurance policies include coverage against product liability, property damage, business interruption, transport, material and pecuniary damages and other risks, and provide comprehensive coverage for legal costs. An independent department working in conjunction with an external insurance broker regularly reviews the nature and extent of our insurance protection and makes any adjustments as necessary.
When choosing our insurers, we particularly consider the credit rating of these entities as potential contractual partners, as well as aim to achieve a high degree of diversity in order to mitigate the related risks.
Risk Management System and Risk Reporting
The risk management system of the Sartorius Group is documented in a Risk Management Handbook that applies throughout the entire Group and includes definitions of the framework, the structural organization, processes, risk reporting and monitoring and controls of the effectiveness of the risk management system. This Handbook is based as a whole on the ISO 31000 "Risk management – Guidelines" standard and the COSO standard (COSO = Committee of Sponsoring Organizations of the Treadway Commission). There are also a number of other sources that contain stipulations for handling risks, including the articles of association and rules of procedure of the Group companies and other internal guidelines. The strong growth of the Group over the past years and the rising demands of customers and regulators meanwhile require that we continue to adapt our guidelines and rules. In the fiscal year ended, changes were made to the risk management process and risk management software introduced to further improve documentation.
The prescribed reporting process in the risk categories subsequently described establishes the rules for the ongoing review of and information on risk situations. If any specific risks are discernible, these are documented with respect to their assessment, probability of occurrence and measures to be taken to eliminate such risks or to mitigate their impact. As a matter of policy, assessment of risks is governed by the remaining net risk, i.e., after any risk-mitigating action has been taken. In addition, as soon as these risks reach defined size criteria, they are reported to the central risk management system. We have an urgent reporting procedure in place to
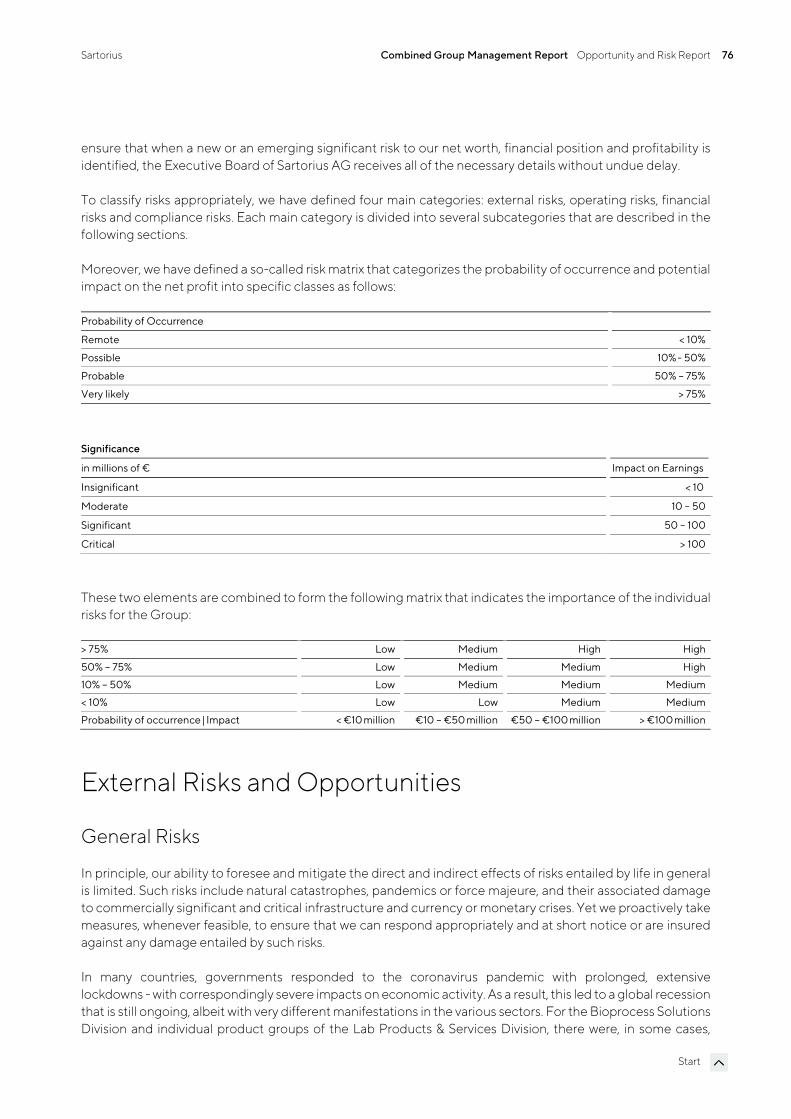
Sartorius Combined Group Management Report Opportunity and Risk Report 76
Start
ensure that when a new or an emerging significant risk to our net worth, financial position and profitability is identified, the Executive Board of Sartorius AG receives all of the necessary details without undue delay.
To classify risks appropriately, we have defined four main categories: external risks, operating risks, financial risks and compliance risks. Each main category is divided into several subcategories that are described in the following sections.
Moreover, we have defined a so-called risk matrix that categorizes the probability of occurrence and potential impact on the net profit into specific classes as follows:
Probability of Occurrence
Remote < 10%
Possible 10% - 50%
Probable 50% – 75%
Very likely > 75%
Significance
in millions of € Impact on Earnings
Insignificant < 10
Moderate 10 – 50
Significant 50 – 100
Critical > 100
These two elements are combined to form the following matrix that indicates the importance of the individual risks for the Group:
> 75% Low Medium High High
50% – 75% Low Medium Medium High
10% – 50% Low Medium Medium Medium
< 10% Low Low Medium Medium
Probability of occurrence | Impact < €10 million €10 – €50 million €50 – €100 million > €100million
External Risks and Opportunities
General Risks
In principle, our ability to foresee and mitigate the direct and indirect effects of risks entailed by life in general is limited. Such risks include natural catastrophes, pandemics or force majeure, and their associated damage to commercially significant and critical infrastructure and currency or monetary crises. Yet we proactively take measures, whenever feasible, to ensure that we can respond appropriately and at short notice or are insured against any damage entailed by such risks.
In many countries, governments responded to the coronavirus pandemic with prolonged, extensive lockdowns - with correspondingly severe impacts on economic activity. As a result, this led to a global recession that is still ongoing, albeit with very different manifestations in the various sectors. For the Bioprocess Solutions Division and individual product groups of the Lab Products & Services Division, there were, in some cases,
Sartorius Combined Group Management Report Opportunity and Risk Report 77
Start
significant increases in demand in connection with the development of coronavirus vaccines, therapeutics and test methods, as well as a buildup in customer inventories. Production capacities were accordingly ramped up at many Group sites. However, at the same time, the Lab Products & Services Division was affected especially in the first half of the year by the closure of many laboratories and saw temporarily dampened demand in a number of product segments in view of the challenging macroeconomic environment.
The changing requirements for interaction with customers were met, among other things, by increasing the use of video conferencing and other digital communication tools, including augmented reality. Various task forces in the different functional areas and regions also ensured that it was possible to respond immediately and appropriately to the constantly changing operating environment. In particular, supply chains have proven to be largely stable in this respect despite the restrictions on global logistics.
The health of our employees has always been a priority in all the measures we have taken. In addition, maintaining our delivery capability is essential, as our products are used in the development and manufacture of vaccines and medicines to combat the pandemic. As the coronavirus pandemic persists, negative consequences for the future cannot be ruled out. Many of the vaccine and therapeutics developers are among our customers so we do not currently anticipate any negative effects overall in 2021. However, it should be noted that these developments will be at the expense of other customer projects and that the pandemic-related postponement of studies for other indications also harbors risks for the course of our business.
Our largest sites in Germany and France do not face any major risks from natural catastrophes, while, for example, our production plants in Puerto Rico and in Fremont, California, are exposed to the risks of severe hurricanes or earthquakes and could be impacted accordingly. We endeavor to counteract this risk by applying the highest possible safety standards to the buildings and explicitly consider this risk in our warehousing and international production network strategies.
Furthermore, political developments, such as the United Kingdom’s leaving the European Union ("Brexit") or the change in the foreign trade policy of various countries, such as the USA and China, can have an impact on the Group’s business.
In the U.K., the Group operates several manufacturing and sales entities accounting for a significant business volume. Any developments that have a negative impact on trade between the U.K. and other countries, such as the introduction of customs duties could therefore result in a corresponding decrease in Group's earnings. Further developments are being closely observed, and some measures to reduce risks have already been taken, such as maintaining safety stock.
Since our Group companies operate globally and have international interdependencies, punitive tariffs and trade conflicts can have negative effects on our business activities. To reduce any possible impacts, various measures are currently being reviewed, such as an extension of our supplier network.
Sartorius Combined Group Management Report Opportunity and Risk Report 78
Start
Business Cycle Risks
The nature of our different business activities entails that Sartorius is exposed as a whole to a much lesser extent to cyclical business effects. The Bioprocess Solutions Division focuses on the biopharmaceutical industry, which is largely independent of economic cycles. In contrast, the Lab Products & Services Division is partly susceptible to business cycles that can pose a risk to its growth. Our strategy of also aligning the Lab Products & Services Division more strongly with the biopharma sector reduces these risks.
Operating Risks and Opportunities Our supply chain extends from procurement to production to sales and distribution. Problems within this workflow can have consequential effects, including delays in deliveries. The supply chain management system we have instituted throughout our value-added chain to prevent such problems largely minimizes the associated risks by analyzing and controlling all operations involved. On the other hand, the strongly international alignment of our organization opens up a whole series of opportunities. The various risks and opportunities encountered within our supply chain are explained in detail below.
Procurement Risks and Opportunities
We purchase a wide range of raw materials, components, parts and services from suppliers and are consequently exposed to the risks of unexpected delivery bottlenecks and|or price increases.
Over the past years, we have implemented powerful tools and robust processes in our Materials Management unit to manage risks arising from critical materials. These means enable us to meet the expectations of our customers with respect to assurance of supply and transparency. Important measures in this respect are to maintain safety stock and to define alternative suppliers as part of our second supplier policy. In addition, we conduct regular supplier reviews and and carefully monitor the delivery status and inventory coverage of critical raw materials.
Risks arising from raw material prices play a rather subordinate role in most of our business areas. On the one hand, the proportion of raw materials in our production costs is rather low. On the other hand, we have alternative purchasing options for a wide range of raw materials based on our supplier network.
Opportunities can arise in the area of procurement when our growth enables us to increase order quantities and thereby strengthen our position with our suppliers, such as by receiving price discounts or preferential treatment as a "preferred customer." In addition, we maintain a list of preferred suppliers for key vendors in parallel, with whom we enter into long-term business relationships to our mutual benefit.
Production Risks and Opportunities
Based on our core technology expertise, we ourselves manufacture a significant proportion of the products that involve a high level of vertical integration. Examples include filters and laboratory balances. Other products, such as reusable fermenters and bioreactors, are manufactured in collaboration with suppliers so that some of the production risks are transferred to external third parties. Where we manufacture products ourselves, we also bear the associated risks of capacity bottlenecks or overcapacity, production downtimes, excessive reject rates and high levels of tied-up working capital, as well as dependency on individual manufacturing sites.
Sartorius Combined Group Management Report Opportunity and Risk Report 79
Start
We contain these risks by planning production capacities carefully, using versatile machines, semi-automated individual workstations and flextime work schedules, and by continuously monitoring production processes. Moreover, our global manufacturing network enables us to compensate for any capacity bottlenecks by shifting production to other regional plants and to limit our dependency on individual local manufacturing sites. Furthermore, we have taken out policies for business interruption insurance to compensate for any possible losses due to production downtimes.
Some of our production processes use mildly flammable or explosive materials. The improper handling of such materials can result in significant damage to property and business interruptions. We have taken all necessary organizational and structural measures at the affected locations to mitigate this risk as much as possible.
We consider it an opportunity that our investments in infrastructure and production resources, among other things, have given us high flexibility in our manufacturing operations and that we are capable of meeting our customers' requirements and regulatory standards with respect to business continuity concepts. In addition, this approach ensures that our international production sites can concentrate on specific manufacturing technologies, leveraging regional cost advantages as a result. Our international manufacturing network also makes it possible to capitalize on the cost advantages offered by individual sites. Continuous improvements in production, such as simplifying processes and increasing levels of automation, also help drive manufacturing efficiency even higher.
Sales and Distribution Risks and Opportunities
We use a variety of channels to sell and distribute our products around the world. The potential risks entailed are unexpected changes in the demand structure, growing price pressure and non-compliance with supply agreements concluded with customers. We employ targeted market analyses to identify emerging demand trends in individual segments early on so that we have time to respond appropriately. Our technical innovations and the fact that a large number of our products are used in validated production processes in the biopharmaceutical industry reduce our exposure to the risk of growing price pressure. We have lowered our risk exposure in the area of logistics in recent years by setting up and using central warehouses to optimize distribution logistics.
Opportunities arise in the area of sales and distribution when the increasing breadth of our product range – in both bioprocess and lab segments – puts us in a position to sell new products to existing customers. Moreover, our business relationships, most of which are established for the long term, and our global presence provide opportunities. Finally, through our acquisitions in cell analysis, we offer customers in the biopharmaceutical industry, a key sector for us, comprehensive product solutions to address needs ranging from research laboratories all the way to production processes.
Sartorius sources its key customers from the pharmaceutical, chemical and food industries and from research and educational institutions of the public sector. These customers are usually relatively large organizations that have been in existence for some time and have strong credit ratings. Most of our business areas have a highly diversified customer base so the Group as a whole is not dependent on individual key accounts to any significant degree.
Competitive Risks and Opportunities
Sartorius has a leading competitive position in its core technologies and competes with mainly larger rivals sharing our status as a globally operating company. As we serve a large number of customers from highly regulated sectors like the pharmaceutical and food industries, and the technology barriers to market entry are fairly high, we regard the probability of new competitors emerging within the short term as relatively low.
Sartorius Combined Group Management Report Opportunity and Risk Report 80
Start
The fact that many of our products are used in validated processes, especially those in the biopharmaceutical industry, reduces the risk of losing significant market share within a short timeframe. Conversely, the hurdles Sartorius faces in winning over customers from our competitors in this industry are also higher.
Changes in the competitive environment, for example, further consolidation in the markets, can pose further risks but also opportunities. Sartorius has been continuously making acquisitions in recent years, thus further strengthening its market position and opening up new potential synergies.
Quality Risks and Opportunities
Our customers use Sartorius products in a wide range of critical production processes, including the manufacture of medications, foods and chemicals, and in research and development laboratories. The main risk encountered in these areas is non-compliance with agreed quality criteria, which can lead to losses for our customers, or their customers, for which we may be made liable through compensation claims.
We employ rigorous quality checks and advanced production methods and processes, such as cleanroom technology, to ensure that our products satisfy the most stringent quality standards and high regulatory requirements. These manufacturing methods and processes are subject to constant review under our continual improvement processes, moreover, and are optimized as requirements evolve. Thus, in-process control tests of critical or essential product properties are implemented in our production processes to ensure that the relevant specifications are met. Our successful completion of a host of annual audits by customers and implementation of quality systems compliant with ISO 9001 and, where applicable, with ISO 13485 document the high level of quality achieved in Sartorius products and processes. Irrespective of these measures, we also maintain significant insurance coverage against product liability risks. In addition, Sartorius has established a traceability system that enables us to recall an entire production batch immediately, if necessary, and minimize any adverse consequences in the event that a defect or non-conforming item is discovered in a product.
We have also installed a complaints management system to deal with customer requests promptly and to ensure efficient documentation.
In the sectors we address, quality requirements are growing more and more stringent all the time, not least as a result of increasing requirements on protection of medical patients and on product safety by regulatory authorities. Changing requirements typically entail the risk that a new prerequisite might be overlooked or be difficult to achieve, but for Sartorius these are opportunities that open up new market prospects. The reason is that challenging quality demands represent a considerable barrier to entry for potential new competitors and provide stimulus for further technical innovation. Moreover, through our work on professional committees, membership in industry associations and standards committees, we actively take part in drafting new standards and guidelines, and are able to identify these emerging requirements at an early stage and prepare ourselves accordingly.
Research and Development Risks and Opportunities
We devote a considerable share of our resources to research and development. Potential risks in this area may arise from development results that diverge from market needs and application requirements and from exceeding planned development deadlines. Our advanced project management, intensive R&D controlling and early involvement of our customers in the development process substantially limit these R&D risks. In particular, we ensure that product developments are always reviewed promptly with regard to how well they meet customers' needs so products can be adapted accordingly as required. Patents and continuous tracking of the technologies and competitors relevant to us secure our technology and marketing position.
Sartorius Combined Group Management Report Opportunity and Risk Report 81
Start
On the other hand, we see a number of opportunities in the area of R&D. Not least, our intensive collaboration with partners that rank among the global market leaders in their own fields opens up the opportunity for us to jointly develop products with an especially high level of innovation. In areas such as membrane technology and plastics technology, sensorics and biopharmaceutical process engineering, as well as measurement technology for laboratory applications, in turn, the expertise of our own specialists puts us at the very forefront of global research and development, presenting us with an opportunity to turn this technical knowledge into potential sales and an even stronger position on the market. The combination of different innovative activities in a separate Corporate Research Department further enables us to identify and benefit from promising developments and emerging trends at universities, startups and at our customers' plants.
Acquisition Risks and Opportunities
By nature, acquisitions provide many opportunities, such as sales growth, extension of our product portfolio and development of new markets. By contrast, the purchase and sale of companies or parts of companies entail a number of typical risks, such as incorrect valuation assumptions or insufficient usage of anticipated synergy effects.
To prevent these risks, we take various measures, such as performing a thorough due diligence review of important areas and carrying out comprehensive analysis of the market concerned. In addition, we involve external consultants and experts in the purchase or sales process as required. We especially focus on drafting transaction contracts so that they adequately counter such risks, especially by clauses assuring specific characteristics or by contractual warranty or guarantee provisions, as well as agreements on mechanisms for adjustment of the purchase price and on liability clauses and, moreover, by taking out the appropriate insurance policies, if required. Immediately after an acquisition has taken place, an integration phase is initiated in which any potential risks can likewise be detected as early as possible and prevented or minimized by taking the appropriate counteractions. A Post Merger Integration (PMI) Office was established as an independent function in the Business Process Management Department to ensure the efficiency of the integration process and minimization of the associated risks.
Personnel Risks and Opportunities
As an innovative technology group, Sartorius employs a large percentage of highly qualified people. This entails the risk that Sartorius may not be able to hire sufficient numbers of highly qualified employees in the future or may lose high performers currently at the company. We therefore endeavor to retain employees in key positions over the long term by offering performance-related remuneration models, targeted continuing professional development options, attractive social benefits and interesting people development opportunities. The success of these measures is apparent in the low attrition rates of recent years. Employment contracts in certain cases contain a clause prohibiting any move to a direct competitor.
We counter the risk posed by demographic change primarily by offering continuous education and training of junior staff. This, in turn, results in opportunities for Sartorius as we can further qualify employees on our own and retain such staff over the long term, thus covering company needs for qualified personnel particularly well.
Sartorius Combined Group Management Report Opportunity and Risk Report 82
Start
IT Risks and Opportunities
The business processes of the Sartorius Group are supported by a large number of specific IT applications and systems. Failure or other impairment of the relevant IT systems or (cyber)attacks can considerably disrupt the smooth functioning of the company's business processes and lead to manipulation or to uncontrolled loss or leakage of knowledge or data.
We reduce these risks by continuously investing in the setup and operation of secure IT systems and applications and by continuously further developing and implementing our concepts and security measures based on the International Standard ISO 27001, Information Security Management System. In addition, we incorporate the results of regular audits and vulnerability assessments carried out by external companies specializing in IT security.
Protection of our data against misuse is ensured by specific authorization and authentication policies based on the assignment of rights limited to a "need-to-know" basis for performing certain tasks, and the application of such policies is reviewed at regular intervals.
We protect our systems against failure and data loss by regular data backups, recovery testing based on rolling disaster scenarios and risk-based use of redundant IT infrastructures. Multi-factor authentication solutions enable us to prevent malware threats.
We assume that the threat of cyberattacks is growing worldwide, both in number and intensity. This is why we are continuously extending and strengthening our activities: We are improving our activities by further automating management of authorizations and reducing the potential for data misuse, among other measures. We inform our staff in a targeted way about possible threats and risks, involving our employees by providing them with simple but effective options for decentralized defense and for reporting suspicious incidents to IT for checking.
By extending our means for competent and fast response to cyberattacks, including other IT security incidents, we supplement our organizational basis for running the Sartorius system and applications at the lowest possible risk across the entire landscape.
Financial Risks The global nature of the Sartorius Group’s operations entails that its business activities are inevitably exposed to financial risks. The most significant of these are exchange rate risks, interest rate risks, liquidity risks and tax risks. Conversely, financial risks, most notably exchange rate risks and interest rate risks, are balanced by opportunities of approximately equal magnitude.
Sartorius Combined Group Management Report Opportunity and Risk Report 83
Start
Exchange Rate Risks
As a consequence of its global business activities, the Sartorius Group is exposed to risks arising from foreign currency fluctuations. Since we generate around two thirds of consolidated sales revenue in foreign currencies and, in turn, approximately two thirds of this total revenue in U.S. dollars or in currencies pegged to the U.S. dollar, we are positively or negatively impacted by currency effects, especially when converting the currencies of balance sheet items and profit or loss items, respectively. Other currencies relevant to the Sartorius Group are the British pound, the Singapore dollar, the South Korean won, the Japanese yen, Chinese renminbi and the Swiss franc.
Our global production network enables us to offset the lion’s share of sales revenues received in foreign currency within the Group against costs likewise incurred in foreign currency. For example, we manufacture many of our products for the North American market locally, and are not disadvantaged on the cost side in competing with our U.S. rivals, insofar as this risk is concerned.
We continuously calculate our risk exposure with a cash flow at-risk model in order to evaluate and steer the remaining risk based on the expected net exposure for the next 12 months and take into consideration hedging transactions already executed. This is the basis we use to decide on whether to employ additional derivative financial instruments, especially spot, forward and swap transactions, to adjust for maximum loss. Hedging transactions are set up by one group of staff and monitored by another, separate group.
Interest Rate Risks
We have concluded fixed interest agreements for more than 80% of our loans outstanding so that any changes in the interest rate will not have any positive or negative effects on consolidated earnings. The remaining portion of the financial instruments outstanding on the reporting date is subject to variable interest based on the market rate. We monitor interest rate trends and our interest rate exposure constantly and arrange for hedging transactions where we consider it necessary and economically advisable to do so for individual loans. As of December 31, 2020, we did not have any interest rate derivatives in our portfolio of financial instruments.
Liquidity Risks
The Sartorius Group actively manages liquidity centrally in order to check and minimize liquidity risks in the individual Group companies, on the one hand, and to optimize liquidity management within the organization, on the other. For this purpose, we use various long- and short-term financial instruments. Regarding the maturities of our loans, we make it a policy to take a risk-averse approach.
For short-term liquidity procurement, we also employ various instruments. In addition to the syndicated credit line that can be accessed and repaid at short notice, we have a number of bilateral credit lines in place on a smaller scale for individual Group companies. Furthermore, we use cash pooling agreements between selected Group companies as the primary tool to manage liquidity within the Group.
Under individual, older loan agreements, the Group is required to comply with certain standard financial key ratios, or covenants. In this context, the ratio of net debt to underlying EBITDA may not be greater than 3.75 up to March 31, 2021; 3.50 up to September 30, 2021, and afterwards not greater than 3.25. If these key ratios are exceeded, this may result in the termination of the Group’s loan agreements. Based on the current information available, this is considered extremely unlikely. Moreover, the obligation to comply with financial covenants is also expected to be eliminated for existing loan agreements in the current year.
Sartorius Combined Group Management Report Opportunity and Risk Report 84
Start
Tax Risks
The Sartorius Group and its subsidiaries do business across the globe and are therefore subject to the tax laws and policies of various countries. Changes in tax laws, rulings by the courts and interpretation of the law by the fiscal authorities or courts in these countries can result in additional tax expenses and payments and thus also affect the corresponding tax items in the statements of financial position and profit or loss.
We manage the resulting risks by continually monitoring and analyzing tax conditions along with our central Tax department with the support of third-party consultants in the respective countries.
Compliance Risks
Regulatory Risks
Our role as a partner of the biopharmaceutical industry and healthcare providers means that Sartorius can also be affected by underlying developments in these areas. In this context, the principle source of risk is the possibility that regulatory authorities, such as the U.S. Food and Drug Administration (FDA), the European Medicines Agency (EMA) and the Chinese National Medical Products Administration (NMPA), might adopt a more restrictive approach to the approval of new medications or the medical devices of our customers. In addition, adherence to the regulations of other relevant authorities like the Environmental Protection Agency or the Department of Agriculture in the USA is important to contain local or global regulatory risks.
Such a move would reduce the number of new pharmaceutical products to be marketed and would consequently downgrade future prospects for Sartorius over the medium term.
Environmental Risks
Sartorius has established an environmental management system that encompasses both divisions to minimize environmental risks. Most of its large production sites are additionally certified for compliance with ISO 14001:2015. Corresponding company organizational units ensure at the respective sites that the related legal and regulatory requirements are observed and that sustainable technical innovations for improving environmental aspects are implemented in our production processes on an ongoing basis. In this effort, it is important for Sartorius to include environmental considerations in the widest array of decision-making processes as early as possible in order to counter possible environmental risks systematically and to do business in a manner that is sustainable and environmentally friendly.
The growing importance of sustainability considerations in many industries and in society increasingly offers Sartorius the opportunity as well to demand heightened environmental awareness from other companies. That is why this aspect is a key element in our supplier selection process for assessing the suitability of a particular company as a business partner. For further information on this group of topics, please refer to our Non-Financial Group Statement.
Litigation Risks
Litigation risks for Sartorius can arise from pending or forthcoming legal disputes or from administrative proceedings. All judicial or extrajudicial disputes are attended to by the company’s own attorneys and legal experts, who engage external lawyers as needed.
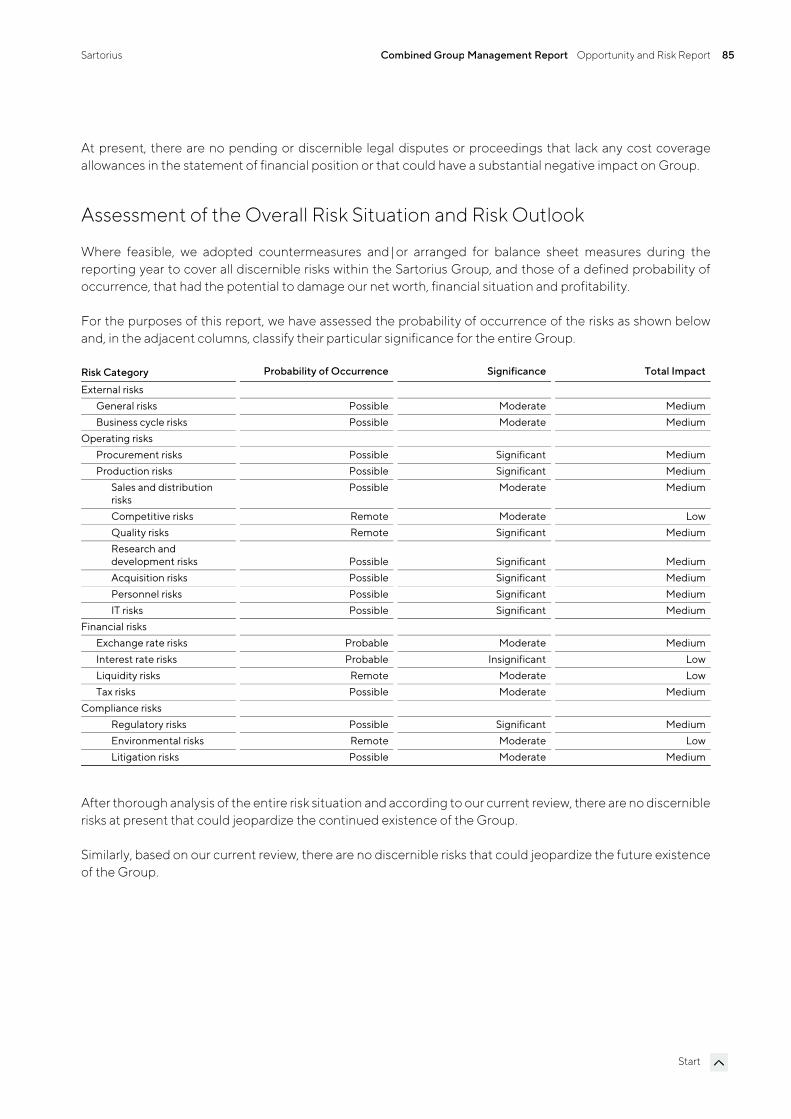
Sartorius Combined Group Management Report Opportunity and Risk Report 85
Start
At present, there are no pending or discernible legal disputes or proceedings that lack any cost coverage allowances in the statement of financial position or that could have a substantial negative impact on Group.
Assessment of the Overall Risk Situation and Risk Outlook
Where feasible, we adopted countermeasures and |or arranged for balance sheet measures during the reporting year to cover all discernible risks within the Sartorius Group, and those of a defined probability of occurrence, that had the potential to damage our net worth, financial situation and profitability.
For the purposes of this report, we have assessed the probability of occurrence of the risks as shown below and, in the adjacent columns, classify their particular significance for the entire Group.
Risk Category Probability of Occurrence Significance Total Impact
External risks General risks Possible Moderate MediumBusiness cycle risks Possible Moderate Medium
Operating risks Procurement risks Possible Significant MediumProduction risks Possible Significant Medium
Sales and distribution risks
Possible Moderate Medium
Competitive risks Remote Moderate LowQuality risks Remote Significant MediumResearch and development risks Possible Significant MediumAcquisition risks Possible Significant MediumPersonnel risks Possible Significant MediumIT risks Possible Significant Medium
Financial risks Exchange rate risks Probable Moderate MediumInterest rate risks Probable Insignificant LowLiquidity risks Remote Moderate LowTax risks Possible Moderate Medium
Compliance risks Regulatory risks Possible Significant MediumEnvironmental risks Remote Moderate LowLitigation risks Possible Moderate Medium
After thorough analysis of the entire risk situation and according to our current review, there are no discernible risks at present that could jeopardize the continued existence of the Group.
Similarly, based on our current review, there are no discernible risks that could jeopardize the future existence of the Group.
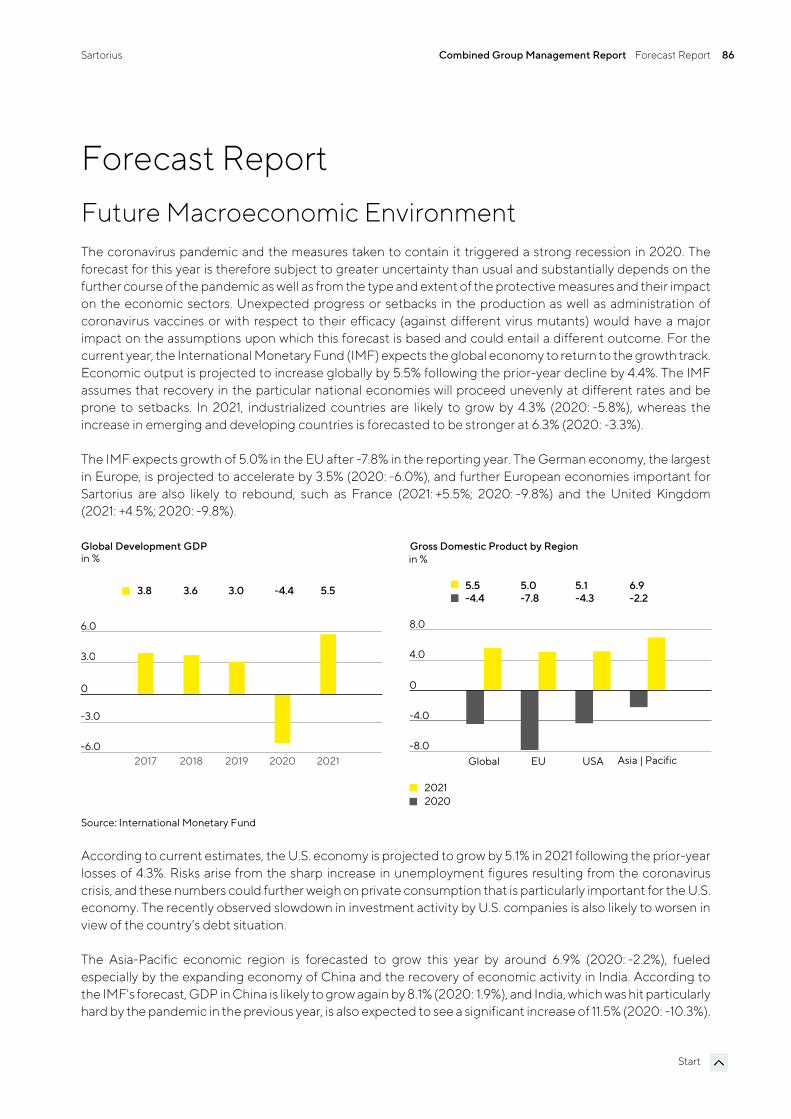
Sartorius Combined Group Management Report Forecast Report 86
Start
Forecast Report Future Macroeconomic Environment The coronavirus pandemic and the measures taken to contain it triggered a strong recession in 2020. The forecast for this year is therefore subject to greater uncertainty than usual and substantially depends on the further course of the pandemic as well as from the type and extent of the protective measures and their impact on the economic sectors. Unexpected progress or setbacks in the production as well as administration of coronavirus vaccines or with respect to their efficacy (against different virus mutants) would have a major impact on the assumptions upon which this forecast is based and could entail a different outcome. For the current year, the International Monetary Fund (IMF) expects the global economy to return to the growth track. Economic output is projected to increase globally by 5.5% following the prior-year decline by 4.4%. The IMF assumes that recovery in the particular national economies will proceed unevenly at different rates and be prone to setbacks. In 2021, industrialized countries are likely to grow by 4.3% (2020: -5.8%), whereas the increase in emerging and developing countries is forecasted to be stronger at 6.3% (2020: -3.3%).
The IMF expects growth of 5.0% in the EU after -7.8% in the reporting year. The German economy, the largest in Europe, is projected to accelerate by 3.5% (2020: -6.0%), and further European economies important for Sartorius are also likely to rebound, such as France (2021: +5.5%; 2020: -9.8%) and the United Kingdom (2021: +4.5%; 2020: -9.8%).
Source: International Monetary Fund
According to current estimates, the U.S. economy is projected to grow by 5.1% in 2021 following the prior-year losses of 4.3%. Risks arise from the sharp increase in unemployment figures resulting from the coronavirus crisis, and these numbers could further weigh on private consumption that is particularly important for the U.S. economy. The recently observed slowdown in investment activity by U.S. companies is also likely to worsen in view of the country’s debt situation.
The Asia-Pacific economic region is forecasted to grow this year by around 6.9% (2020: -2.2%), fueled especially by the expanding economy of China and the recovery of economic activity in India. According to the IMF's forecast, GDP in China is likely to grow again by 8.1% (2020: 1.9%), and India, which was hit particularly hard by the pandemic in the previous year, is also expected to see a significant increase of 11.5% (2020: -10.3%).
Global Development GDPin %
2017 2018 2019 2020 2021-6.0
-3.0
0
3.0
6.0
3.8 3.6 3.0 -4.4 5.5
Global EU USA Asien|Paz.-8.0
-4.0
0
4.0
8.0
20212020
in %Gross Domestic Product by Region
5.5 5.0 5.1 6.9-4.4 -7.8 -4.3 -2.2
Asia | Pacific
Sartorius Combined Group Management Report Forecast Report 87
Start
Other countries important for Sartorius in this region are also estimated to return to the growth path. For South Korea, growth is forecasted at 3.1% (2020: -1.9%) and for Japan, at 3.1% as well (2020: -5.3%).
Exchange and Interest Rate Trends
Experts predict that the base interest rates will remain unchanged at a low level in 2021 as well.
The market consensus on the exchange rate of the euro to the U.S. dollar for the course of 2021 is that it will range between 1.15 euros to the U.S. dollar and 1.32 euros to the U.S. dollar.
Sources: International Monetary Fund, World Economic Outlook, October 2020; Bloomberg L.P., January 2021.
Outlook for the Sectors
Biopharmaceutical Industry Maintains Dynamic Growth
Strong, long-term trends drive growth in the pharmaceutical industry, which is almost entirely independent of business cycles. EvaluatePharma estimates that the global pharmaceutical market will grow by around 7% annually during the period up to 2026. The biopharma segment of the pharmaceutical market, which has been enjoying particularly strong growth for years, will continue to outperform the market. For the period of 2020 to 2026, the compound annual growth rate is projected to average about 10%. This would equate to an increase in market volume from the current level of €247 billion to €440 billion. The share of biological medications and vaccines in the total revenue generated by the global pharmaceutical market is forecasted to continue rising. Based on current information, the coronavirus pandemic is not expected to have any impact on long-term sector growth or thus on demand for products and technologies needed for the development and manufacture of biopharmaceuticals. However, suppliers of such technologies again anticipate additional sales in 2021 in connection with the development of a coronavirus vaccine and Covid-19 therapeutics. By contrast, demand in the coming years could be dampened by delayed approval of new medications due to the interruption of many clinical studies or by the reduction in inventories that were built up in the reporting year by some biopharma companies due to uncertainties related to the pandemic.
In the coming years, the most dynamic market will likely be China. Positive regulatory and political conditions, a constantly rising number of local biotech companies and increasing demand for advanced biopharmaceuticals have been fueling above-average growth for several years now. This trend could continue as a result of the huge amount of catch-up potential in the market and the improved availability of biotech medications. Considerable growth in the United States and Europe is also anticipated, driven in particular by a growing need for medications for aging societies and by the rising number of chronically ill and multi-morbid patients. In addition, more and more medications are being approved. For example, biologics are increasingly being used in yet-to-be fully explored therapeutic areas and in the treatment of rare diseases that have so far been incurable. The biopharmaceutical industry is increasingly relying on advanced therapies, such as gene and cell therapeutics and biotechnologically processed tissue products. At the end of 2020, there were over 1,000 clinical studies based on such treatment approaches so this field offers significant growth potential over the mid to long term. Innovative types of therapy for regenerative medicine and new substance classes, such as antibody-drug conjugates (ADCs), are increasing the number and range of approved biopharmaceuticals as well as necessitating investments in innovative production technologies. As a result, they are key growth drivers.
This relatively young biopharma segment is driving sector growth with its high innovative power, as reflected in the strong research and development pipelines. Of the estimated 10,000+ medications in R&D pipelines,
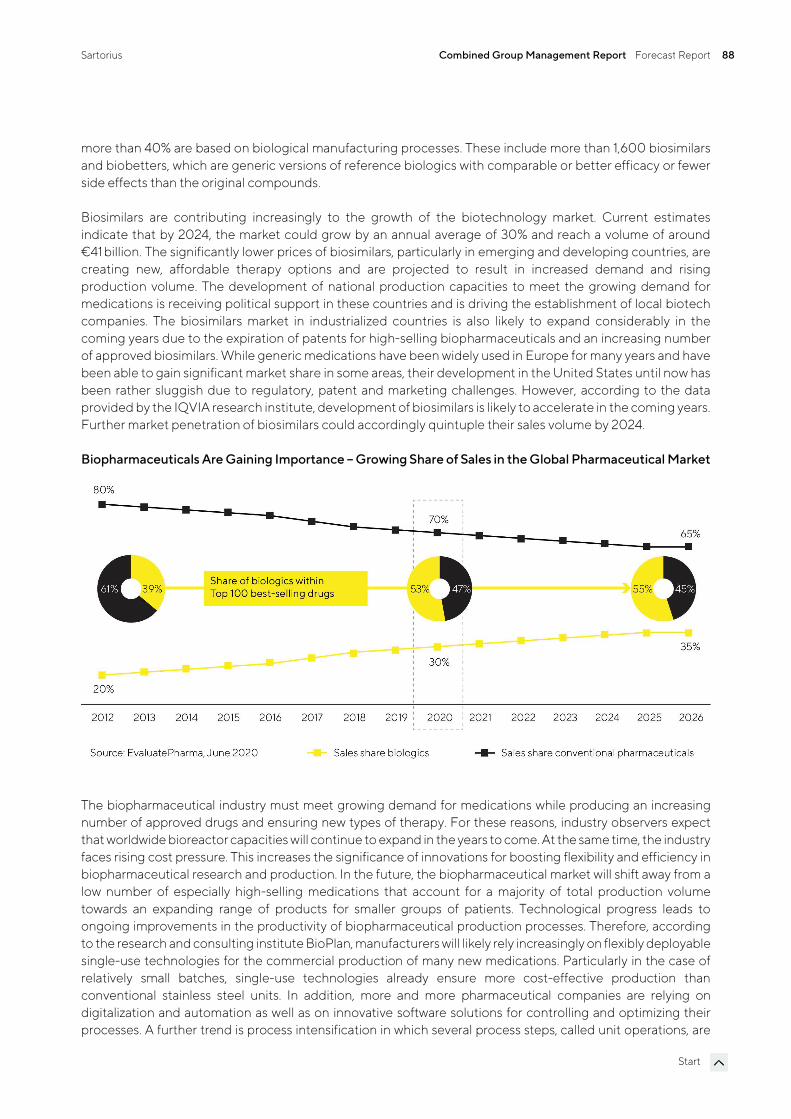
Sartorius Combined Group Management Report Forecast Report 88
Start
more than 40% are based on biological manufacturing processes. These include more than 1,600 biosimilars and biobetters, which are generic versions of reference biologics with comparable or better efficacy or fewer side effects than the original compounds.
Biosimilars are contributing increasingly to the growth of the biotechnology market. Current estimates indicate that by 2024, the market could grow by an annual average of 30% and reach a volume of around €41 billion. The significantly lower prices of biosimilars, particularly in emerging and developing countries, are creating new, affordable therapy options and are projected to result in increased demand and rising production volume. The development of national production capacities to meet the growing demand for medications is receiving political support in these countries and is driving the establishment of local biotech companies. The biosimilars market in industrialized countries is also likely to expand considerably in the coming years due to the expiration of patents for high-selling biopharmaceuticals and an increasing number of approved biosimilars. While generic medications have been widely used in Europe for many years and have been able to gain significant market share in some areas, their development in the United States until now has been rather sluggish due to regulatory, patent and marketing challenges. However, according to the data provided by the IQVIA research institute, development of biosimilars is likely to accelerate in the coming years. Further market penetration of biosimilars could accordingly quintuple their sales volume by 2024.
Biopharmaceuticals Are Gaining Importance – Growing Share of Sales in the Global Pharmaceutical Market
The biopharmaceutical industry must meet growing demand for medications while producing an increasing number of approved drugs and ensuring new types of therapy. For these reasons, industry observers expect that worldwide bioreactor capacities will continue to expand in the years to come. At the same time, the industry faces rising cost pressure. This increases the significance of innovations for boosting flexibility and efficiency in biopharmaceutical research and production. In the future, the biopharmaceutical market will shift away from a low number of especially high-selling medications that account for a majority of total production volume towards an expanding range of products for smaller groups of patients. Technological progress leads to ongoing improvements in the productivity of biopharmaceutical production processes. Therefore, according to the research and consulting institute BioPlan, manufacturers will likely rely increasingly on flexibly deployable single-use technologies for the commercial production of many new medications. Particularly in the case of relatively small batches, single-use technologies already ensure more cost-effective production than conventional stainless steel units. In addition, more and more pharmaceutical companies are relying on digitalization and automation as well as on innovative software solutions for controlling and optimizing their processes. A further trend is process intensification in which several process steps, called unit operations, are
Sartorius Combined Group Management Report Forecast Report 89
Start
interconnected and a smooth transition is created, among other things, in order to manufacture larger product quantities faster while simultaneously achieving higher quality.
Recovery of the Laboratory Market Expected
According to several independent analysts, the market for laboratory instruments and consumables is expected to grow by about 3% to 4.5% annually in future years. During the reporting year, the coronavirus pandemic and the containment measures associated with it significantly dampened the development of this market. In 2021, growth is expected to pick up as a result of the effects of catch-up demand and weaker prior-year comparables. The greatest demand should continue to come in particular from the pharmaceutical and biopharma industry as a result of continuous research into and approval of new medications, the high momentum of scientific and technological innovations and of strong growth in China. For instance, Evaluate Pharma estimates that sector-specific research spending will climb annually by 3.2% during the period of 2020 to 2026.
Budget increases for academic and public-sector research institutions in some countries are also expected to stimulate growth. On the other hand, the pandemic and potential lockdowns or production suspensions as well as an unexpected further weakening of global economic growth could put demand at risk in industrial end markets. Market observers continue to expect Asian countries like China and India to generate the highest growth rates. Stricter regulatory requirements in a range of industries are also stimulating increased demand for instruments used in sample analysis and quality control. Investments in laboratory infrastructure are becoming more attractive, particularly in China as a result of improved protection of intellectual property rights and government-supported efforts to promote innovativeness in several key industries.
Sources: BioPlan: 17th Annual Report and Survey of Biopharmaceutical Manufacturing Capacity and Production, April 2020; Daedal Research: Global Biologics Market: Size, Trends & Forecasts, December 2020; IQVIA Institute: Global Medicine Spending and Usage Trends, March 2020; IQVIA Institute: German-language publication “Fokus Biosimilars”, May 2020; Evaluate Pharma: World Preview 2020, Outlook to 2026, July 2020; SDi: Global Assessment Report 2018, February 2018
Sartorius Combined Group Management Report Forecast Report 90
Start
Outlook for 2021 Sartorius plans to grow profitably again in 2021, with consolidated sales revenue projected to increase by 19% to 25%. Initial consolidation of the acquisitions is expected to contribute about 5.5 percentage points to this growth; the impact of the pandemic-related businesses on Group revenue is difficult to estimate at the present time and is likely to amount to up to 6 percentage points. Regarding profitability, the company forecasts that its underlying EBITDA margin will be about 30.5%, up from 29.6% a year earlier. The impact of acquisitions on this margin is forecasted to be at a negligible level.
Due to dynamic organic growth, Sartorius is extending and accelerating the expansion of production capacities and its digital infrastructure. As a result, the CAPEX ratio is expected to be around 15% (previous year: 10.3%).
Looking at the financial situation, management assumes that the ratio of net debt to underlying EBITDA will decrease to slightly below 2.5 at the end of fiscal 2021, without taking any potential acquisitions into account.
For the Bioprocess Solutions Division, the Executive Board expects sales to grow between 22% and 28%, with consolidation of the most recent acquisitions likely to contribute about 6 percentage points and the pandemic effects up to 8 percentage points. As for the division’s underlying EBITDA margin, management forecasts a moderate increase to around 33% (previous year: 32.3%) after the underproportionate cost development as a result of the pandemic had additionally increased the margin in the prior year, especially in this division, and now that corresponding catch-up effects are included in this projection. The acquisitions are not expected to have any significant effect on the division’s profitability.
The Lab Products & Services Division is projected to increase its sales revenue by 10% to 16%, with the most recent acquisitions expected to contribute around 5 percentage points to growth. Pandemic effects are not anticipated unless laboratories will be closed again as part of potentially very extensive lockdowns. For the division’s underlying EBITDA margin, a substantial increase to about 23.0% is forecasted (previous year: 21.0%), with the most recent acquisitions expected to contribute around 0.5 percentage points.
All forecasts are based on constant currencies, as in the past years. In addition, the company assumes that the global economy will increasingly recover as the current year progresses and that supply chains will remain stable.

Sartorius Combined Group Management Report Report on Material Events 91
Start
Report on Material Events No material events occurred after the close of fiscal 2020.
Sartorius Combined Group Management Report Description of the Key Features of the Internal Control Management System 92
Start
Description of the Key Features of the Internal Control Management System In relation to the Group Accounting Process (Section 289, Subsection 4, and Section 315, Subsection 4, of the German Commercial Code [HGB])
Definitions and Elements of the Internal Control Management System at the Sartorius Group The internal control system (ICS) of Sartorius AG and the Sartorius Group encompasses all of the principles, procedures and measures adopted to ensure the organizational implementation of management decisions. The main priority of the system as it relates to Sartorius AG’s and the Group’s accounting process is to make sure that accounting is effective, cost efficient and formally correct and that it complies with the pertinent legal provisions.
The internal control system of Sartorius AG and of the Sartorius Group consists of a combination of process-integrated and non-process-integrated monitoring measures. The process-integrated safeguarding measures are subdivided, in turn, into organizational measures and other control measures. The Supervisory Board, specifically in this case the Audit Committee of Sartorius AG, and the Legal Affairs & Compliance unit with its Group Auditing department are involved in the Sartorius Group’s internal control system through their non-process-integrated audit activities. The Audit Committee regularly reviews quarterly reports in addition to the annual financial statements of the parent corporation and the consolidated annual financial statements.
Moreover, to ensure systematic, early identification of risks across the entire Group, a “monitoring system for early group-wide detection of risks with the potential to jeopardize the company’s continued existence” as defined in Section 91, Subsection 2, of the German Stock Corporation Law (AktG) is in place at the Sartorius Group. The efficacy of the early risk detection system, which the Sartorius Group adapts promptly in response to any relevant changes in circumstances, is assessed by the independent auditors of Sartorius AG in accordance with Section 317, Subsection 4, of the German Commercial Code (HGB). An integral component of this system is also operational risk management, which involves activities such as the transfer of risk to insurance companies through coverage for damage and liability risks, and the arrangement of suitable hedges to limit currency and interest rate risks.
Organizational Measures Accounting processes are strictly organized according to the principle of segregation of functions and comply with the "four-eyes" principle – i.e. review by two individuals, also referred to as the dual-review principle. Duties and responsibilities are clearly assigned to different specialized departments, companies and regional units. The separation of administrative, executive, settlement and approval functions reduces the possibility of fraud. It also continues to play a significant role in ensuring that any possible errors are discovered early and any potential misconduct is prevented.
The IT applications used in the company's accounting processes have access restrictions, which allow only authorized persons to have controlled access to the accounting system and data. Each access right is assigned specifically according to the tasks to be performed and is subject to annual review. Furthermore, the dual-review principle is also applied in IT process design and the assignment of access rights.
Sartorius Combined Group Management Report Description of the Key Features of the Internal Control Management System 93
Start
In addition, defined written local and global operating procedures exist, particularly the Group accounting guidelines, which are regularly updated and communicated throughout the Group. The scope of regulation at Group level also extends to the central definition of measurement rules and parameters, among other factors. Additional data for the presentation of external information in the notes to the financial statements and in the Group management report is also prepared and aggregated at Group level.
Continuous coordination of internal accounting during the year for planning and control with external accounting contributes significantly to the quality of Group financial reporting. Reporting itself is done through a standardized management reporting system implemented throughout the Group. This system visualizes all consolidation processes. Internal controls, on the one hand, and the Group auditors of Sartorius AG, on the other hand, ensure that Group financial reports are accurately generated from the consolidated Group companies' financial statements.
The employees involved in the accounting process meet qualitative standards and receive regular training. The Group Financial Reporting department assists the local units in resolving complex accounting issues, such as measuring fair value, to ensure consistent and accurate reporting in the consolidated financial statements. Complex evaluations, such as actuarial reports and company valuations or purchase price allocations, are assigned to specialized service providers who involve the respectively qualified in-house staff.
Control Measures Comprehensive control activities are performed by managers and staff to ensure effective and reliable accounting. As a result, this ensures compliance with legal requirements and internal guidelines as well as properly conducted business transactions. Examples of such control activities include the analysis of situations and developments with reference to specific key indicators. Moreover, every month individual reporting units comment on and explain special characteristics or variances using Group-wide standardized analytical tools as the basis. Further specific control activities performed to ensure effective and reliable Group accounting encompass the analysis and, where applicable, correction of the individual financial statements submitted by the Sartorius Group companies. A large number of control mechanisms already incorporated into the consolidated reporting system enable erroneous information to be identified and corrected at Group level. Impairment tests are conducted centrally for the specific cash-generating units, known as CGUs, from the Group's perspective to ensure that consistent, standardized evaluation criteria are applied.
The Legal Affairs & Compliance unit annually draws up a risk-based audit plan and reviews in spot checks whether basic legal requirements and internal group guidelines are complied with for the entire control and risk management system of the Group. This monitoring function covers, in particular, audits of the functional efficiency and effectiveness of defined control measures. The results of these audits are reported directly to the audited departments and units, making it possible to efficiently remedy any identified deficiencies and to further enhance the company’s internal control system (ICS). The Executive Board and the Supervisory Board regularly receive reports on audit activities.
A manual on the company's internal control system that focuses on the business processes of our company further contributes toward strengthening our ICS. This manual combines all ICS-relevant requirements that we consider of material importance into one standardized document and will be supplemented by further appropriate rules as necessary.
Sartorius Combined Group Management Report Description of the Key Features of the Internal Control Management System 94
Start
Qualifying Statements The internal control and risk management system enables the complete recording, processing and evaluation of company-related matters on the basis of the organizational, control and monitoring structures defined in the Sartorius Group, as well as their accurate presentation in Group accounting.
In particular, decisions based on personal judgment, erroneous controls, criminal acts and other circumstances cannot be ruled out. They impair the efficacy and reliability of the internal control and risk management system, so that even the application throughout the Group of the systems adopted cannot provide absolute assurance as to the accurate, complete and timely recording of matters in Group accounting.
The statements made relate solely to the subsidiaries included in the consolidated financial statements of Sartorius AG, whose financial and business policies Sartorius AG can directly or indirectly determine in order to obtain benefits from their activities.
Sartorius Combined Group Management Report Explanatory Report of the Executive Board On the Disclosures Pursuant to Section 289a, Subsection 1, and Section 315a, Subsection 1, of the German Commercial Code (HGB)
95
Start
Explanatory Report of the Executive Board On the Disclosures Pursuant to Section 289a, Subsection 1, and Section 315a, Subsection 1, of the German Commercial Code (HGB) Composition of the Issued Capital |Limitations to Voting Rights Sartorius AG’s capital stock totals €74,880,000. It comprises 74,880,000 no par value individual bearer shares, 37,440,000 of which are ordinary shares and 37,440,000 of which are non-voting preference shares. Each share certificate represents a calculated proportion of €1 of the issued capital.
The rights and obligations associated with these shares are governed by the provisions of the German Stock Corporation Law (Aktiengesetz, abbreviated “AktG”). According to the company’s Articles of Association, preference shares are entitled to a dividend payment that is one euro cent higher per share than that for ordinary shares. However, this entitlement to receive dividends shall be at least two euro cents per preference share. Apart from the cases provided for in Sections 140 and 141 of AktG, preference shares are non-voting. Beyond this, preference shares grant all other rights to which every shareholder is entitled.
The company holds 3,213,991 ordinary shares and 3,250,147 preference shares; these do not entitle the company to any membership rights.
Direct or Indirect Equity Ownership Exceeding 10% of Voting Rights The community of heirs consisting of Ms. Ulrike Baro, resident of Munich, Germany; Ms. Christine Franken, resident of Bovenden, Germany; Mr. Andreas Franken, resident of Riemerling, Germany; Mr. Kai Christian Franken, resident of Göttingen, Germany; and Ms. Karin Sartorius-Herbst, resident of Northeim, Germany, holds more than 50% of the voting rights in Sartorius AG according to a memo on voting rights dated March 20, 2018. Concretely, this amounts to 18,754,160 ordinary shares (approximately 50.1% of all issued or around 54.8% of all outstanding ordinary shares), and thus around 25.0% of the total capital stock of Sartorius AG. The decedent Horst Sartorius ordered that his will be administered by an executor. Dr. Lothar Kappich, resident of Hamburg, Germany, is the appointed executor of Horst Sartorius' estate and exercises the specified voting rights at his own discretion as defined by Section 34, Subsection 1, sentence 1, item no. 6, of the German Securities Trading Act (Wertpapierhandelsgesetz, abbreviated “WpHG”).
According to a memo on voting rights dated April 1, 2011, Bio-Rad Laboratories Inc., 1000 Alfred Nobel Drive, Hercules, California 94547, USA, to which the voting rights of Bio-Rad Laboratories GmbH, Heidemannstr. 164, 80939 Munich, are ascribed according to Section 34, Subsection 1, sentence 1, item no. 1, of WpHG, holds more than 30% of the voting rights in Sartorius AG according to a memo on voting rights dated April 1, 2011;
Sartorius Combined Group Management Report Explanatory Report of the Executive Board On the Disclosures Pursuant to Section 289a, Subsection 1, and Section 315a, Subsection 1, of the German Commercial Code (HGB)
96
Start
according to its own quarterly report dated September 30, 2020, this amounts concretely to 12,987,900 ordinary shares (approximately 34.7% of all issued or around 37.9% of all outstanding ordinary shares) as well as 9,588,908 preference shares (approximately 25.6% of all issued or around 28.0% of all outstanding preference shares) and thus around 30.2% of the entire capital stock of Sartorius AG.
Appointment and Dismissal of Executive Board Members |Amendment to the Articles of Association Executive Board members of Sartorius AG are nominated and | or appointed as well as removed from office in accordance with Sections 84 et seq. of the German Stock Corporation Law (AktG) and Sections 31 and 33 of the German Codetermination Law (Mitbestimmungsgesetz, abbreviated “MitBestG”). Amendments to Sartorius AG’s Articles of Association are regulated by Sections 133 and 179 of the German Stock Corporation Law (AktG).
Powers of the Executive Board to Issue Shares Subject to approval by the Supervisory Board, the Executive Board is authorized to sell treasury shares held by the corporation, including selling them through channels other than the stock exchange or by tendering an offer to all shareholders in proportion to their participation in the company, provided that these shares are transferred to third parties as contribution in kind, particularly in the (indirect) acquisition of companies, in return. Under these circumstances, the preemptive rights of the shareholders are excluded.
Material Agreements with Clauses Regulating the Event of a Change of Control The majority of the loan agreements contain customary market clauses regulating the possible event of a change of control and giving participating lenders the option of demanding complete repayment of the outstanding loan.
The affected loans are primarily outstanding note loans (“Schuldscheindarlehen”) and syndicated loan agreements. This also affects a number of bilateral loan agreements with an initial total volume of €1,377 million. The repayment sum outstanding for these material loan agreements stands at €1,957 million as of Thursday, December 31, 2020.
Sartorius Combined Group Management Report Corporate Governance Report 97
Start
Corporate Governance Report Corporate government aligned with the interests of stakeholders, lawful and responsible conduct, and constructive cooperation between the managerial bodies and within the company in a spirit of mutual trust constitute the essential cornerstones of Sartorius' corporate culture.
The Executive Board and the Supervisory Board report in the following declaration on the key aspects of corporate management and governance pursuant to Section 289f of the German Commercial Code ("HGB") and to Article 3.10 of the German Corporate Governance Code.
Declaration of Compliance with Corporate Governance
Declaration of the Executive Board and of the Supervisory Board of Sartorius AG Concerning the Recommendations of the Government Commission on the German Corporate Governance Code Pursuant to Section 161 of the German Stock Corporation Law (“Aktiengesetz”):
1. The Executive Board and the Supervisory Board declare that Sartorius AG complied, and will continue to comply in the future, with the recommendations made by the Government Commission on the German Corporate Governance Code (GCGC) in the version as amended on December 16, 2019, and published by the German Federal Ministry of Justice and Consumer Protection in the official section of the German Federal Gazette ("Bundesanzeiger") since their publication, with the following exception: In divergence from the newly introduced recommendations pursuant to G.10 of GCGC, the variable remuneration of the members of the Executive Board consists only to a minor extent of share-based remuneration components; furthermore, portions of the long-term remuneration with a multi-year assessment basis are available to the members of the Executive Board before the end of four years. The Supervisory Board believes that the terms of variable remuneration in place so far also provide for an incentive structure that is geared towards the sustainable and longterm development of the company. The Supervisory Board will observe and evaluate the implementation of the recommendations according to G.10 of GCGC on the market and, if necessary, propose changes to the remuneration system to the Annual General Shareholders' Meeting at a later time.
2. The Executive Board and the Supervisory Board further declare that Sartorius AG fully complied with the recommendations made by the Government Commission on the German Corporate Governance Code in the version as amended on February 7, 2017, and published by the German Federal Ministry of Justice and Consumer Protection in the official section of the German Federal Gazette ("Bundesanzeiger") on April 24, 2017, and May 19, 2017, respectively, throughout the period from the issuance of last year's Declaration of Compliance in December 2019 to the publication of the new version of the GCGC on March 20, 2020.
Göttingen, December 3, 2020
For the Supervisory Board For the Executive Board
Dr. Lothar Kappich Dr. Joachim Kreuzburg
Sartorius Combined Group Management Report Corporate Governance Report 98
Start
Further Remarks Concerning Corporate Governance Sartorius AG is a joint stock corporation founded under German law and headquartered in Göttingen, Germany. With the Annual General Shareholders' Meeting, Supervisory Board and Executive Board, it has three corporate managerial bodies whose tasks and powers are essentially derived from the German Stock Corporation Law ("Aktiengesetz") and the company's Articles of Association.
As owners of the company, the shareholders exercise their rights at its Annual General Shareholders' Meeting, where they decide, in particular, on the appropriation of profits, measures concerning share capital, amendments to the Articles of Association, discharge of the Supervisory Board and the Executive Board and the appointment of statutory auditors, as well as electing shareholder representatives to the Supervisory Board. The Annual General Shareholders' meeting is held at least once a year within the first eight months of the respective fiscal year.
In managing the company, the Supervisory Board and the Executive Board perform their tasks in a two-tier board structure, each with separate duties and powers.
The Supervisory Board appoints members to the Executive Board, determines their remuneration and monitors and advises the Executive Board in its management of the company. The Supervisory Board is not authorized to take any operational management measures for the business.
The Executive Board is responsible for independently managing the company. In particular, it defines corporate strategy, coordinates and agrees on this approach with the Supervisory Board and implements such corporate strategy. In line with established reporting obligations, the Executive Board regularly informs the Supervisory Board promptly and comprehensively, and requests the latter's approval for certain key business transactions.
Composition and Operating Mode of the Supervisory Board and Its Committees The Supervisory Board has an equal number of shareholder representatives and employee representatives: six shareowner representatives elected by the Annual General Shareholders' Meeting and six employee representatives elected according to the German Codetermination Law ("Mitbestimmungsgesetz"). Details on the members of the Supervisory Board and its committees are provided on pages 230 to 237.
The Supervisory Board Chairman coordinates the work within this board and convokes and conducts Supervisory Board meetings. Furthermore, he is the first individual for the Executive Board to contact and externally represents the matters of the Supervisory Board.
The Supervisory Board holds at least two meetings every six months; as a rule, four or more meetings take place, as required. This board has established four committees: the Executive Task Committee, the Audit Committee, the Conciliation Committee and the Nomination Committee. The Executive Task Committee, Audit Committee and Conciliation Committee each have four members, consisting of an equal number of shareholder representatives and employee representatives (for all three committees named here: Dr. Lothar Kappich (Chairman of the Executive Task Committee and the Conciliation Committee), Prof. Dr. Klaus Rüdiger Trützschler (Chairman of the Audit Committee), Mr. Uwe Bretthauer und Mr. Manfred Zaffke); the Nomination Committee is composed of three shareholder representatives (Dr. Lothar Kappich, Dr. Daniela Favoccia and Prof. Dr. Klaus Rüdiger Trützschler). The Executive Task Committee and Audit Committee hold regular meetings; the Conciliation Committee and the Nomination Committee meet only as necessary.
Sartorius Combined Group Management Report Corporate Governance Report 99
Start
The Executive Task Committee carries out preparatory work for resolutions and issues to be addressed in the meetings of the Supervisory Board. It also oversees the preparations for appointments, including the remuneration and employment contract conditions of members of the Executive Board. The Audit Committee supports the Supervisory Board in performing its supervisory function. The Chairman of the Audit Committee is an independent member of the Supervisory Board and has detailed knowledge and extensive experience in the application of accounting standards and internal control systems from his own professional practice. The Conciliation Committee meets if the majority required in connection with the appointment of members to the bodies authorized to represent the company for legal purposes is not reached. The Nomination Committee comprises representatives of the shareholders only. Its function is to propose suitable candidates to the Supervisory Board for the latter’s election proposals submitted to the Annual Shareholders’ Meeting. More information on the individual meetings held in the reporting year by the Supervisory Board and its committees is given in the Report of the Supervisory Board on pages 14 to 18.
The Supervisory Board carries out an assessment annually to determine how effectively the board as a whole and its committees fulfill their tasks. This self-assessment is based on a questionnaire containing 46 statements on various topics, in part directed especially to shareholder representatives or employee representatives, to which every member of the Supervisory Board can quantify his or her agreement on a scale of 0 to 5. In addition, two open questions solicit suggestions for the improvement of the work of the Supervisory Board as well as other general remarks or feedback. The evaluation of the questionnaires ensures anonymity. The results are discussed regularly in one of the Supervisory Board’s annual meetings.
Appointment Objectives for the Supervisory Board; Diversity Policy and Competence Profile Members of the Supervisory Board of Sartorius AG are to be appointed such that they, on the whole, have the knowledge, skills and experience that are necessary to perform the board's duties properly.
For this purpose and based on the recommendations of the German Corporate Governance Code, the Supervisory Board decided on the following appointment objectives:
Independence: The Supervisory Board should contain at least four members on the shareholder side. Age limit: A fundamental age limit of 70 applies to members of the Supervisory Board at the time they are elected. The age limit may be waived in individual cases, provided there are no reservations about the suitability of the persons proposed and their election is expedient to the interests of the company in spite of the age limit being exceeded.
Maximum number of mandates / time resources: A Supervisory Board member who is not a member of the management board of a listed company should not hold more than five Supervisory Board positions at external listed companies or perform comparable functions; in this regard, the chairmanship of a Supervisory Board counts twice. A Supervisory Board member who is a member of the management board of a listed company should not hold more than two Supervisory Board positions at external listed companies or perform comparable functions, and should not chair the Supervisory Board at an external listed company. Regardless of other mandates held, care must be taken that every member has enough time to fulfill his mandate in the Supervisory Board of Sartorius AG.
Former members of the Executive Board: No more than two former members of the Sartorius Executive Board should serve on the Supervisory Board at any one time.
Sartorius Combined Group Management Report Corporate Governance Report 100
Start
Function at competitor companies: Members of the Supervisory Board should not hold any board function or consulting mandate at companies that are important competitors of Sartorius AG, and should not be in a personal relationship to an important competitor.
In addition, the Supervisory Board has defined a competence profile for itself. It also covers aspects such as diversity, with regard, for example, to professional background and international experience. In view of achieving an appropriate gender balance, the legal quotas of at least 30% women and at least 30% men apply to the Sartorius Supervisory Board. The shareholder representatives and the employee representatives decided to fulfill these legal targets separately.
In its election proposals for membership, the Supervisory Board is required to consider whether candidates have international experience or an international background within the scope of its current members.
The Supervisory Board must have members with expertise in one or several of the international markets relevant for Sartorius.
Members of the Supervisory Board need to bring in knowledge of technologies and products relevant to the Group, as well as of digitalization, and experience in research and development, particularly in the biopharmaceutical industry.
The Supervisory Board must have members who have expertise in setting up and developing innovative business models, as well as knowledge of corporate strategies.
Members of the Supervisory Board need to have in-depth knowledge of financial business processes and competences in financial controlling and risk management; at least one independent member of the Supervisory Board must have expert knowledge of accounting or auditing (Section 100, Subsection 5, of AktG).
Members of the Supervisory Board must have expertise in law, corporate governance and compliance.
The Supervisory Board needs to have in-depth knowledge and a thorough background in issues concerning human resources.
According to the Supervisory Board’s self-assessment, the members on its board meet the diversity and competency requirements. In addition, the board meets the appointment objectives described above.
In the opinion of the shareholder representatives on the Supervisory Board, Prof. Dr. David Ebsworth, Dr. Daniela Favoccia, Ilke Hildegard Panzer, Prof. Dr. Thomas Scheper and Prof. Dr. Klaus Rüdiger Trützschler are independent members of the Supervisory Board. As the executor for the community of heirs of Horst Sartorius, Dr. Lothar Kappich is to be regarded as dependent upon the controlling shareholder. However, despite the fact that Dr. Kappich has served on the Supervisory Board since April 2007 and has thus been a member for more than 12 years, the shareholders on the Supervisory Board regard him as independent of the company and its Executive Board. Thus a Supervisory Board membership of many years alone should not, in this case, lead to the fear of a personal or business relationship with the company or its Executive Board that would justify a significant and not merely temporary conflict of interest. In particular, the circumstance that Dr. Kappich represents the majority of the voting rights in the company counters the presumption of his dependence on the company and its Executive Board.
With a view to achieving an equal gender balance, the Supervisory Board meets the quota of 30% set for the underrepresented gender. The Supervisory Board includes a total of seven men (around 58%), of whom four
Sartorius Combined Group Management Report Corporate Governance Report 101
Start
are shareholder representatives and three are employee representatives. In addition, five women (around 42%) are members of this board, among them two representatives of the share owners and three representatives of the employees. As a result, the gender quota requirements are met on both sides of Supervisory Board representation and on the full Supervisory Board itself.
To facilitate comparison of the appointment objectives, brief resumés of the Supervisory Board members are available on the Sartorius website.
Composition and Operating Mode of the Executive Board The Executive Board of Sartorius AG manages the company under its own responsibility, with the goal of increasing the company's sustainable value. It develops the company's strategy, coordinates it with the Supervisory Board and ensures implementation of this strategy. Beyond that, the rules of procedure for the Executive Board define the legal transactions requiring approval by the Supervisory Board in order for such transactions to be effected. The Executive Board is responsible for compliance with all provisions of the law and the company's internal policies, as well as for appropriate risk management.
Decision-making by the Executive Board is done at its regular meetings, which are convoked and conducted by the Chairman. Other specialists and managers are invited as necessary to provide advice.
The Executive Board members are jointly responsible as a collegiate body for matters of special significance. As for the board's remaining responsibilities, each member independently manages the area assigned to him or her according to the plan for allocation of areas of responsibilities, and is required to notify the Chairman of all material transactions and events.
Composition of the Executive Board, Diversity and Competency Requirements In the opinion of the Supervisory Board, the basic qualification criteria for appointments to positions on the Executive Board are professional qualifications for heading each particular area of responsibility, a proven track record in the individual's career path and convincing managerial skills. In addition, the Supervisory Board also considers the aspect of diversity in its appointment decisions. Therefore, the Supervisory Board strives to appoint people with complementary profiles, professional and personal life experiences and in different age brackets to the Executive Board. Moreover, the latter board is required to have broad international experience.
The Supervisory Board deals regularly with succession planning for the Executive Board in its Executive Task Committee and in its plenary sessions. To identify special talent within the company, promising junior staff are invited to make presentations to the Supervisory Board on specific topics.
An Executive Board member should not be older than 65 years of age at the time of his or her appointment. The age limit can be waived in individual cases, provided there are no reservations about the suitability of the person proposed and his or her appointment is expedient to the interests of the company in spite of the age limit being exceeded.
Pursuant to the German Act on Equal Participation of Women and Men in Executive Positions in the Private and the Public Sectors, the Supervisory Board defined a target quota for the Executive Board that is described in the following section.
Sartorius Combined Group Management Report Corporate Governance Report 102
Start
The Sartorius Executive Board is a committee that presently consists of four members and is therefore relatively small; the establishment of a rigid gender quota can be problematic. The current four members of the Executive Board of Sartorius AG are men. The appointment of at least one woman to the Executive Board was defined as a target to be met by the present deadline of June 30, 2022.
Likewise with regard to the appointment of women to the Executive Board of Sartorius AG, the Supervisory Board supports the activities of the Executive Board to further increase the percentage of female executives at the first two management levels in the company. The Executive Task Committee responsible and the full Supervisory Board regularly receive reports on the development of the proportions of women in senior-level management positions
First and Second Management Levels Below the Executive Board
Over the past years, the percentage of women at the first two management levels below the Executive Board has considerably increased on the whole and is already at a comparably high level.
The Executive Board resolved in 2017 to increase the proportion of women at both levels of management below this board to around 30% by the next deadline of June 30, 2022. Currently, the proportion of women at the first level is around 38% and at the second level around 21%, thus exceeding or approaching the established target quota. In general, it should be noted that owing to the relatively small number of managers at the first level, even individual personnel changes can lead to sizable swings in the quota. Moreover, in the past the consolidation of acquired companies has frequently led to a slight dilution in the proportion of women, and this effect cannot be excluded in the future.
Further Corporate Governance Practices
Risk Management
Conscientious management of commercial risks is a key principle of good corporate governance. Sartorius AG and the Group have at their disposal enterprise-wide and company-specific reporting and control systems designed to facilitate the recording, assessment and management of commercial risks. These systems are developed and adapted continuously as conditions evolve. The Executive Board informs the Supervisory Board regularly of existing risks and their development. The Audit Committee is concerned, in particular, with monitoring of the following: the accounting process including reporting; the efficacy of the internal control system; risk management and the internal auditing system; compliance; and the independent statutory audit. Details on risk management are presented in the Opportunity and Risk Report.
Transparency
Sartorius AG places great importance on disclosing consistent and complete information promptly. Information about the economic position of the Group and new developments is consequently released regularly, without delay, as it becomes known in order to inform participants in the capital market and interested members of the public at large. The annual report, first-half financial report and quarterly reports are published within the timeframes specified for this purpose. Current developments and material events are publicized as press releases and, where appropriate, ad hoc announcements. This information is usually made available in German and English simultaneously and published via suitable media and on the internet.
Sartorius Combined Group Management Report Corporate Governance Report 103
Start
The chief recurring events and publications, such as the Annual General Shareholders’ Meeting, the annual report and the interim reports, are listed on a financial calendar that may be viewed at any time on the Group website.
Share Trading Activities of Supervisory and Executive Board Members
The following notifiable proprietary trading involving shares of Sartorius AG or related financial instruments by the members of the Executive Board and the Supervisory Board or other persons with management responsibilities or their related parties were reported to us: The Chairman of the Executive Board, Dr. Joachim Kreuzburg, informed us on November 30, 2020, of the grant of 13,785 ordinary shares and 13,785 preference shares as share-based remuneration components.
The Chairman of the Executive Board, Dr. Joachim Kreuzburg, holds 113,785 ordinary shares and 113,785 preference shares in the company. They were transferred to him as components of his remuneration on the basis of corresponding agreements in his employment contracts of December 18, 2015, and November 26, 2020, each with a minimum holding period of four years from the beginning of the respective contract. For further information on this transfer, please see the Remuneration Report on pp. 105 et seq.
As executor of the estate of Horst Sartorius, the Supervisory Board Chairman, Dr. Lothar Kappich, holds around 50.1% of the ordinary shares issued by the company. Beyond this, there is no notifiable possession of shares or financial instruments by members of the Executive Board or Supervisory Board consisting directly or indirectly of more than 1% of the shares issued by the company.
Accounting and Independent Statutory Audit
The consolidated financial statements and the Group Management Report, as well as the consolidated interim financial statements and reports, are prepared in accordance with the International Financial Reporting Standards (IFRS) as they are to be applied within the EU, and according to the commercial law regulations to be applied under Section 315e, Subsection 1, of the German Commercial Code, HGB. The annual financial statements of Sartorius AG are prepared in accordance with German commercial law, HGB. The consolidated financial statements and the annual financial statements are prepared by the Executive Board, audited by the independent auditors elected by the Annual General Shareholders’ Meeting and approved by the Supervisory Board.
It has been agreed with the independent auditors that they will notify the Supervisory Board directly of any potential disqualification or bias issues and any material findings and incidents identified during the audit. This also encompasses the corporate governance reporting duties pursuant to Section 161 of the German Stock Corporation Law (Aktiengesetz).
Basic Principles of Our Compliance Management System |Code of Conduct With its compliance management system that is valid worldwide, Sartorius ensures that the members of its individual boards, executives and employees comply with all legal regulations and codes, and perform their activities in accordance with the company’s internal rules and guidelines. Targeted training and awareness-raising prevent any misconduct, as well as economic damage and loss of image.
Sartorius makes every effort to ensure optimal risk management by using a combination of approaches: a preventive compliance approach designed to proactively stop any potential breaches before they occur and
Sartorius Combined Group Management Report Corporate Governance Report 104
Start
a repressive compliance approach intended to continuously monitor compliance with the company's rules. These processes are closely intermeshed, creating a standardized compliance management system that aims to offer the best possible protection against potential violations of rules and regulations. Sartorius has developed a Code of Conduct as a preventive component of its compliance management system and has committed to an Anti-Corruption Code. An internal system is available for reporting any suspicious circumstances involving potential compliance violations.
Further information is given in the Sustainability Report on pp. 92 et seq. and on the company’s internet website at www.sartorius.com.
The Supervisory Board |The Executive Board
Sartorius Combined Group Management Report Remuneration Report 105
Start
Remuneration Report 1. Main Features of the Remuneration Plan for the
Executive Board
A. Main Features of the Remuneration Policy and Contribution Toward Promoting the Corporate Strategy and Long-Term Development of the Company The remuneration policy for the Executive Board aims to remunerate the members of the Executive Board appropriately in line with their tasks and responsibilities and to directly consider the performance of each member of the Executive Board and the success of the company. Accordingly, the remuneration policy includes fixed remuneration components as well as short- and long-term variable remuneration components.
The company strategy is aimed at achieving profitable growth and a sustained, long-term increase in the value of the company. This strategy is the basis from which the structure of the remuneration policy is derived for the Executive Board of Sartorius AG: The short-term variable remuneration depends on annual corporate targets that are aligned with key performance indicators for profitable growth of the company. Long-term remuneration depends on a corporate goal that reflects the sustainable and long-term growth of the company and the Group, on the one hand, and on the long-term performance of the share price, which directly reflects the development of the company's value, on the other. As a result, the company’s remuneration policy creates incentives to promote the long-term and positive sustainable development of the company.
B. Details of the Remuneration Policy
I. Remuneration Components 1. Overview of the Individual Remuneration Components Remuneration consists of fixed and variable components. The fixed components are the fixed annual salary and fringe benefits. The variable performance-based components are comprised of short-term components with a one-year assessment basis and of long-term components with a multi-year assessment basis. In addition, there are pension commitments, which depend, among other things, on the amount of the own contribution made by the respective Executive Board member in the form of deferred compensation for variable remuneration components, and which are therefore also variable.
2. Fixed Remuneration Components a) Fixed Annual Remuneration Fixed annual remuneration is cash compensation related to a specific fiscal year, and is based in particular on the area of duties and responsibilities of the respective Executive Board member. This fixed annual remuneration is paid in twelve monthly installments.
b) Fringe Benefits Beyond the remuneration components stated above, the members of the Executive Board receive the following fringe benefits: each member is entitled to use a company car that can also be used for private purposes and to be covered by accident insurance taken out in the respective Executive Board member’s name as a beneficiary. Moreover, for Executive Board members residing outside Germany, Rainer Lehmann und John Gerard Mackay, the costs for taking flights home, running two households and costs associated herewith are also paid by the company as fringe benefits.
Sartorius Combined Group Management Report Remuneration Report 106
Start
The D&O insurance policy concluded for Executive Board members as beneficiaries is not recognized as salary expenses and therefore is not of a remunerative nature.
3. Variable Performance-Based Remuneration Components a) Short-Term Variable Remuneration with a One-Year Assessment Basis Short-term variable remuneration with a one-year assessment basis consists of three individual components related to the subordinate financial targets of sales revenue |order intake, underlying EBITDA and the ratio of net debt to underlying EBITDA.
These subordinate financial targets are essential control elements for profitable growth as well as for a sustainable and long-term increase in the value of the company and thus serve to implement the company's overall strategic objectives. There are no non-financial target parameters.
For each of these three individual components, a separate individual target amount is set for each Executive Board member. This target amount is used as the basis to determine the specific amount to be paid out according to the particular target achievement of the relevant subordinate target for the fiscal year in question. The targets are weighted differently for the individual Executive Board members according to their area of responsibility and thus relate to different measurement parameters in part (Group or Group and respective division).
Annual short-term variable remuneration is calculated for a fiscal year ended and paid in the following fiscal year. The amount paid out for each subordinate target is capped at a maximum of 120% of the individual target amount.
The subordinate targets within the short-term variable remuneration are weighted for the Executive Board members as follows:
Subordinate Target Executive Board Chairman |
Chief Financial OfficerExecutive Board Members with
Division Responsibility
Related to the Sartorius Group
Average calculated from sales revenue | order intake 30% 9%
Underlying EBITDA 40% 12%
Ratio of net debt to underlying EBITDA 30% 9%
Related to the particular division
Average calculated from sales revenue | order intake -- 30%
Underlying EBITDA -- 40%
Subordinate Target “Average Calculated from Sales Revenue |Order Intake” The subordinate target “average calculated from sales revenue | order intake” is a key performance indicator of growth and is equal to the amount in euros that the Supervisory Board annually de-fines as part of the budget for the Group or division, respectively. The minimum target achievement is 90% of the amount defined in the budget, and this amount is capped at 104%. If 90% of the amount defined in the respective budget is achieved, 50% of the associated individual target sum will be paid out; if the target is achieved at less than 90%, no payment will be made for this subordinate target. If 104% of the amount defined in the budget is achieved, an amount equal to 120% of the corresponding individual target amount will be paid out; if the target is achieved in excess of this percentage, this will not further increase the amount to be paid out. Intermediate values are interpolated linearly. Target achievement is measured on the basis of actual sales and order intake in constant currencies, as reported in the company's consolidated financial statements audited according to the defined audit focal points and approved, as well as adjusted for the amounts contributed by businesses acquired or divested during the respective reporting year to the extent that such businesses are not part of
Sartorius Combined Group Management Report Remuneration Report 107
Start
the budget. Moreover, in individual cases, the Supervisory Board may make further adjustments to the actual amounts to allow for non-recurring, unusual circumstances.
Subordinate Target “Underlying EBITDA” The subordinate target “underlying EBITDA” is a key profitability indicator of the Group. This indicator is used to provide a picture of the Group’s operating development that is also internationally better comparable. Underlying EBITDA stands for earnings before interest, taxes, depreciation and amortization and adjusted for extraordinary items. It is equal to the amount in euros that the Supervisory Board annually defines as part of the budget for the Group or division, respectively. The minimum target achievement is 70% of the amount defined in the budget, and this amount is capped at 120%. The level of the bonus payment is linear to the level of target achievement; i.e., if 70% of the subordinate target is achieved, 70% of the related individual target amount will be paid out, or if 120% of the target is achieved, 120% of the related individual target amount will be paid out. If the target is achieved at less than 70%, no payment will be made for this subordinate target. By contrast, if the target is achieved by 120% or more, this will not further increase the amount to be paid out. Target achievement is measured on the basis of the actual underlying EBITDA figure, as reported in the company's consolidated financial statements audited according to the defined audit focal points and approved, as well as by taking into account current exchange rates and adjusting for non-operating expenses and income (e.g., restructurings, divestitures, etc.). Moreover, in individual cases, the Supervisory Board may make further adjustments to the actual amounts to allow for non-recurring, unusual circumstances.
Subordinate Target “Ratio of Net Debt to Underlying EBITDA” The subordinate target “ratio of net debt to underlying EBITDA” is a key financial ratio regarding the Group’s debt financing capacity. This ratio is calculated as the quotient of net debt and under-lying EBITDA and corresponds to the percentage that the Supervisory Board annually defines as part of the budget for the Group or division, respectively. The level of the bonus paid is between 50% and 120% of the respective subordinate target amount. If the ratio of net debt to underlying EBITDA reaches the ratio defined in the budget, the bonus level to be paid is 100%. If this ratio is above that defined in the budget, the bonus level will decrease proportionately down to 50% if the maximum amount defined by the Supervisory Board for the ratio of net debt to underlying EBITDA is reached. If the ratio exceeds this maximum amount, no bonus will be paid for this subordinate target. By contrast, if net debt to underlying EBITDA is below the value defined in the respective budget, the bonus amount is capped at 120%, with the associated ratio of net debt to underlying EBITDA derived mathematically on a linear proportional basis from the maximum and target values for this ratio as defined by the Supervisory Board. Target achievement is measured on the basis of the actual ratio of net debt to underlying EBITDA in constant currencies, as reported in the company's consolidated financial statements audited according to the defined audit focal points and approved, as well as adjusted for inflows and outflows entailed by strategic (capital) measures, such as acquisitions, provided that such inflows and outflows are not included in the budget. Moreover, in individual cases, the Supervisory Board may make further adjustments to the actual amounts to allow for non-recurring, unusual circumstances.
b) Long-Term Variable Remuneration Components The long-term variable remuneration components for all Executive Board members first consist of the following two individual components: One individual component is related to the development of the consolidated net profit in a three-year assessment period as a target parameter; the other, to the price development of Sartorius AG preference shares in an assessment period of (at least) four years. As a result, the long-term variable remuneration components are also aligned with financial target parameters that measure profitable growth and a sustainable and long-term in-crease in the value of the company, and thus serve to implement the company's overarching strategic objectives. Non-financial target parameters are not provided for the long-term variable remuneration components either.
The two previously mentioned long-term variable remuneration components are each weighted at 50%. For each of both individual components, a separate individual target amount is defined for every Executive Board
Sartorius Combined Group Management Report Remuneration Report 108
Start
member. This target is used as the basis for calculating the specific bonus amount to be paid out based on the degree of achievement of the associated targets defined for the respective fiscal years.
The Executive Board Chairman Dr. Kreuzburg was additionally granted share-based compensation as a further long-term variable remuneration component.
The respective long-term variable remuneration components together generally represent the majority of the variable compensation components for each Executive Board member. Deviations from this arrangement apply only temporarily to Executive Board members René Fáber and John Gerard Mackay for the period up to the end of their current appointment and employment contracts until end of 2021.
Consolidated Net Profit The individual component related to consolidated net profit has an assessment period of three consecutive fiscal years and begins with the fiscal year in which the tranche concerned is granted. A new tranche is granted on a rolling basis for each fiscal year. The amount paid out for a particular tranche depends on the total target achievement for the respective assessment period, which corresponds to the average target achievement for each of the three fiscal years of the relevant assessment period. For each fiscal year, the Supervisory Board annually defines a target for consolidated net profit in euros. To determine the level of target achievement for a fiscal year, the consolidated net profit after non-controlling interest, excluding amortization (impairment of the value of intangible assets due to business combinations pursuant to IFRS 3) – as reported in the company's consolidated financial statements audited according to the defined audit focal points and approved – is compared to the particular target set by the Supervisory Board. In individual cases, the Supervisory Board may make further adjustments to the actual amount to allow for non-recurring, unusual items and/or non-operating items.
This remuneration component is generally paid out upon expiration of the third fiscal year in the respective period of assessment for the tranche concerned. The level of the bonus paid can be be-tween 0% and 120% and increases linearly up to the level of total target achievement, where the minimum amount set by the Supervisory Board for consolidated net profit must at least be exceeded. If this minimum amount is merely reached or goes below the individual subordinate target set, no bonus will be paid. If 120% of the total target is achieved, 120% of the related individual target amount will be paid out. Intermediate values are interpolated linearly. By contrast, if target achievement exceeds 120%, this will not further increase the amount to be paid out as it is capped at this percentage.
However, to smooth the amounts to be paid out, a partial payment amounting to 50% of the target achievement for the first fiscal year of each respective average period of assessment for a tranche will be effected based on the individual subordinate target. Such a partial amount will be calculated and paid out at the end of the first fiscal year of a respective assessment period based on the company’s consolidated financial statements audited according to the defined audit focal points and approved. Any overpayments as a result of these partial payments will be offset against other remuneration components once the total target achievement has been determined after the third fiscal year of an average assessment period.
Development of the Preference Share Price (Phantom Stock Plan) Executive Board members receive virtual shares, so-called phantom stock units, as a second individual component of long-term variable remuneration. Through the issue of such shadow shares, Executive Board members are treated as if they were owners of a certain number of preference shares in Sartorius AG, without, however, being entitled to receive dividends. The development of the value of this phantom stock is linked with the development of the Sartorius preference share; both increases and decreases in the share price are taken into account. Later, the value of this phantom stock is assessed based on the share price at the time, and its equivalent is paid out in cash, provided that the associated conditions are met. Phantom stock cannot be traded and does not entail any share subscription rights.
Sartorius Combined Group Management Report Remuneration Report 109
Start
According to the Sartorius phantom stock plan, each Executive Board member is credited at the beginning of every year with phantom stock units valued at an agreed monetary sum. The value of this phantom stock can be paid out only as an entire annual tranche. Payment can be requested at the earliest after a period of four years and no later than after eight years.
An Executive Board member is entitled to receive payment for phantom stock units only if the share price at the time of such payment request has appreciated at least 7.5% per year relative to the time the phantom stock was assigned or if the share price outperformed the TecDAX as a comparative index. In addition, the value of the phantom shares must be at least 50% of the grant value. The phantom stock plan rules out subsequent changes to the parameters used for comparative stock valuation.
The amount to be paid is capped at a maximum of 2.5 times the share price at the time the phan-tom stock was assigned, based in each case on the individual annual tranche.
Assignment of this phantom stock and later payment of its monetary equivalent depend on the mean value calculated from the average prices of the Sartorius AG preference share, with said prices quoted in the closing auction of Xetra trading on the Frankfurt Stock Exchange over the last 20 days of trading of the previous year or over the last 20 days of trading prior to submission of a payment request. This serves to compensate for any short-term fluctuations in the share prices.
Payment for phantom stock is blocked for the four weeks preceding the scheduled publication date of quarterly results and for the 30 calendar days before the scheduled publication of the half-year results and preliminary year-end results, as well as for 20 days of trading on the stock ex-change following the actual publication of quarterly and preliminary year-end results. These black-out periods are intended to ensure that payments are only made during periods in which the most recent business results have already been processed in the capital market and the regular publication of further business results is still sufficiently far in the future.
Share-Based Payment In December 2019, the Executive Board Chairman Dr. Kreuzburg was additionally granted share-based payment in connection with the fourth extension of his appointment as a member and Chairman of the Executive Board as well as CEO. This was in the form of company shares with a grant date fair value totaling €5.0 million (based on the share price as of December 5, 2019, as the grant date); this corresponds to a proportional grant date fair value of €1.0 million for each year of his new five-year term of appointment. For this purpose, a corresponding number of treasury shares (27,570 own shares in total), consisting of equal parts of own preference shares and own ordinary shares, were transferred to Dr. Kreuzburg at the beginning of his new term in November 2020. The shares granted shall be subject to a holding period that will end on November 10, 2024. Should Dr. Kreuzburg leave the company prior to November 11, 2022, at his own request, his entitlements to be granted said shares by transfer shall lapse in their entirety. If Dr. Kreuzburg leaves the company after November 10, 2022, and before November 11, 2024, at his own request, half of his entitlements to be granted said shares shall lapse. For the purpose of the target total remuneration, the shares granted for Dr. Kreuzburg's current five-year term of appointment are recognized at their pro-rated grant date fair value for each year of his term of appointment.
4. Pension Commitments The members of the Executive Board generally receive pension commitments as defined-benefit plans for their first reappointment. At the request of the Executive Board member concerned, the company will take out an insurance policy for the term of his employment contract and pay the particular benefit contributions into this insurance. Each benefit contribution consists of a basic amount between 10% and 14% (as of 2022 the same rate of 14% for all Executive Board members) of the particular member’s annual fixed remuneration. On request, the particular Executive Board member concerned can additionally pay in, as a personal benefit contribution by way of deferred compensation, a partial sum of between 5% and 7% maximum (as of 2022 the
Sartorius Combined Group Management Report Remuneration Report 110
Start
same rate of 7% for all Executive Board members) out of the gross amount paid to this Executive Board member in the respective fiscal year as short-term variable compensation and as long-term variable compensation based on net profit. If a member of the Executive Board exercises this right, the company on its part will make an additional contribution in the same amount (matching benefit contribution). In divergence from this arrangement, Executive Board member John Gerard Mac-kay receives a basic amount of 9.5% of the sum of his annual fixed remuneration1 and the target amount of his annual variable remuneration; accordingly, the option for deferred compensation and matching benefit contribution does not apply to him. For the purpose of deter-mining the target total compensation and the relative share of the pension commitments in a member’s target total remuneration, only the basic amount to be paid by the company and the matching benefit contribution were taken into account (based on 100% target achievement of the relevant variable remuneration components).
Pursuant to the insurance terms and conditions, the pension benefit can be granted in the form of a retirement pension or a lump-sum payment for reaching the regular retirement age or needing to retire due to disability, as well as in the form of surviving dependents' benefits for widows and orphans, according to which particular option an Executive Board member elects. The company does not guarantee the paid-in capital or an annual interest rate.
Furthermore, an earlier pension agreement granted to Dr. Kreuzburg provides that he will receive a monthly pension dependent on the basic salary of a German federal civil servant classified as grade 10 of salary class B for ministry officials according to the Federal Civil Service Remuneration Act (“Bundesbesoldungsgesetz”) in the respective version applicable. With each full year of service on the Executive Board, 5% of his full pension will be vested until his fully vested pension will have been reached after 20 years. In this case, these retirement benefits will be fully vested, taking his years of service on the Executive Board into account, at the end of December 31, 2021. His retirement benefits will be granted in the form of a pension in the cases where he reaches the regular retirement age or needs to retire due to disability, as well as in the form of a pension for widows and orphans and shall correspond to 70% of the monthly pension benefits of a German federal civil servant classified as grade 10 of salary class B for ministry officials according to the Federal Civil Service Remuneration Act (“Bundesbesoldungsgesetz”). These additional pension commitments are considered in the determination of Dr. Kreuzburg's target total remuneration and of the relative proportion of his pension commitments in his target total remuneration along with the respective employee benefit expense attributable thereto.
The regular retirement age for all pension commitments is 65. There are no early retirement regulations, except in the case of disability.
5. Other Remuneration Components The remuneration policy provides that the Supervisory Board may grant special compensation at its reasonable discretion for extraordinary performance by a member of the Executive Board.
II. Target Total Remuneration; Relative Percentages of Fixed and Variable Remuneration Components The Supervisory Board determines a specific target total remuneration for each Executive Board member. The target total remuneration is the sum of all remuneration components relevant for total remuneration. For the variable components, the target amount is taken as a basis in each case of 100% target achievement, provided that a target is measured. In the case of share-based compensation, which is granted as an additional variable remuneration component only to the Executive Board Chairman, the pro-rated grant date fair value (= €1.0 million annually) is recognized for each year of the Chairman's associated contract term to ensure transparent and traceable reporting for the purposes of target total remuneration. Regarding pension
1 Reduced by a supplementary amount for fixed remuneration, which was originally agreed as an allowance for a company car (so-called car allowance)
Sartorius Combined Group Management Report Remuneration Report 111
Start
commitments, it is further assumed that the Executive Board members will exercise their right to receive deferred compensation of their variable remuneration components (based on 100% achievement of targets) to the maximum extent permitted and that the company will therefore also pay each member a corresponding additional amount as a matching contribution.
For the Executive Board Chairman, the relative percentage of fixed remuneration components (fixed annual salary and fringe benefits) is around 29% and the percentage of the variable remuneration components on the whole around 64% of his target total remuneration. The percentage of the short-term (target) compensation of his target total remuneration is around 17%; that of the long-term compensation of his target total remuneration, around 47%. The percentage of pension commitments for the Executive Board Chairman is currently around 7% of his target total remuneration.
For the other Executive Board members, the relative percentage of the fixed remuneration components (fixed annual salary and fringe benefits) is between 45% and 51% of their respective total target remuneration and the percentage of all variable remuneration components between around 43% and 49% of their corresponding target total remuneration. The percentage of the short-term (target) compensation of their respective target total remuneration is between around 21% and 25%; that of the long-term compensation of their corresponding target total remuneration, be-tween around 21% and 28%. The percentage of their pension commitments is currently between 0% and around 8% of their respective target total remuneration.
III. Reclaiming or Reducing Variable Remuneration (Clawback) After the German Corporate Governance Code had entered into force in the version of December 16, 2019 (GCGC 2019), as amended, provisions were included in all newly executed or amended Executive Board employment contracts, each with a future effective date and specify that the company is entitled to reclaim from Executive Board members variable remuneration components already paid out to them in the following cases described:
1. Performance Clawback If the entitlement to payment of annual short-term variable remuneration and of remuneration with a multi-year assessment basis in relation to the individual component of consolidated net profit is based on audited and approved consolidated financial statements that were objectively incorrect and therefore had to be subsequently corrected in accordance with the relevant accounting standards, and if no or a lower entitlement to payment of variable remuneration components would have arisen based on the corrected audited consolidated financial statements, the company may reclaim the corresponding amount of overpayment from the respective Executive Board member.
2. Compliance Clawback If an Executive Board member commits, either through gross negligence or willful intent, any dereliction of the duty to exercise the skill and care of a prudent manager faithfully complying with his duties in accordance with Section 93, Subsection 1, of the German Joint Stock Corporation Law “AktG,” the company shall be entitled to reclaim from the respective Executive Board member the full or partial repayment of the annual short-term variable remuneration paid out to him for the respective assessment period in which the breach of duty occurred, the remuneration with a multi-year assessment basis related to the individual component of the consolidated net profit, and of the liquidated phantom stock units and/or to declare that member’s forfeiture with respect to tranches of phantom stock units yet to be granted.
The Executive Board member shall not be obligated to reimburse the company if more than three years have elapsed as counted from the payment of the respective variable remuneration components up to the time a claim against said member for reimbursement is asserted. The objection of disenrichment in accordance with Section 818, Subsection 3, of the German Civil Code “BGB” is excluded under the remuneration policy. The right to claim damages pursuant to Section 93 of the German Joint Stock Corporation Law “AktG” shall remain unaffected.
Sartorius Combined Group Management Report Remuneration Report 112
Start
IV. Remuneration-Related Legal Transactions 1. Terms and Prerequisites for Termination of Remuneration-Related Legal Transactions The employment contracts of Executive Board members are concluded for the term of their respective appointments. Initial appointments are each for a maximum of three years; extensions of an appointment term are for up to five years.
The current terms of the employment contracts of the incumbent members of the Executive Board are as follows:
Dr. Joachim Kreuzburg: November 10, 2025
Dr. René Fáber: December 31, 2021
Rainer Lehmann: February 28, 2025
John Gerard Mackay: December 31, 2021
Termination of their employment contracts by giving due and proper notice is excluded. For this reason, an employment contract of an Executive Board member can only be terminated by mutual agreement based on a termination agreement or by termination for cause with immediate effect. The company may terminate an Executive Board member’s employment contract for cause de-fined by the German Stock Corporation Law “AktG” as “grave cause,” particularly in the event that the Supervisory Board revokes this member’s appointment for said grave cause pursuant to Section 84, Subsection 3, of AktG. In this case, the statutory periods of notice pursuant to Section 622 of the German Civil Code “BGB” shall apply, unless there is also a compelling reason (“cause”) for termination without notice pursuant to Section 626 of BGB.
2. Severance Payments The employment contracts for Executive Board members provide that a member will receive a severance payment in the event the company terminates the employment contract of said member with immediate effect, provided that said member is not responsible for any grave cause or compelling reason warranting said termination ahead of the regular contract expiration date. The amount of the severance payment shall be two years’ salary maximum, but shall not exceed the amount of remuneration that would be payable until the end of the contract term.
3. Non-Competition Clause The Executive Board employment contracts provide for a post-contractual non-competition clause for a duration of up to two years upon termination of employment with the company. In the event that this non-competition clause is not waived or is nullified, half of the remuneration last paid by the company shall be granted to the respective Executive Board member as compensation for non-competition throughout the non-competition period. Any severance to be paid in connection with the termination of an employment contract to an Executive Board member shall be deducted in full from said compensation for non-competition in accordance with Recommendation G.13 of GCGC 2019 in the future – upon commencement of the respective new contract term – provided that the employment contracts concerned have been extended after GCGC 2019 had entered into force. A different arrangement applies to the Executive Board contract of Rainer Lehmann whose contract term had already been extended earlier and whose contract does not contain any deduction clause.
V. Procedure for Establishing and Implementing as well as Reviewing the Remuneration Policy The Supervisory Board establishes and regularly reviews the remuneration policy for the Executive Board. The Executive Task Committee of the Supervisory Board prepares the remuneration policy for approval by the full Supervisory Board and makes the respective suggestions.
Sartorius Combined Group Management Report Remuneration Report 113
Start
In the process, the Supervisory Board also reviews the appropriateness of such remuneration in comparison to the remuneration of the Executive Board within the peer group of the company (horizontal appropriateness). The peer group is defined by the Supervisory Board and/or its Executive Task Committee and is adapted as necessary. In defining the composition of the current peer group, the Executive Task Committee first reviewed domestic and foreign companies (from Germany, Europe and the USA) that are each comparable with Sartorius in terms of sector, size and sales. However, further analysis showed that the compensation levels at the relevant foreign companies differ significantly upwards from the compensation levels of the companies based in Germany and that the compensation levels differ considerably in terms of the weighting of their components. Against this background, it was decided to include only companies based in Germany in the peer group, yet to make a deliberately broad selection and to reference a group of companies of different sizes, sectors and capital market indices. The peer group currently comprises the following companies: Bechtle, Carl Zeiss Meditec, Compugroup Medical, DMG, Mori Seiki, Drägerwerk, Drillisch, ElringKlinger, Evotec, Freenet, Fresenius Medical Care, Gerresheimer, Grenke, KWS Saat, Pfeiffer Vacuum Technology, Qiagen, Siltronic, Software AG, Symrise, and United Internet.
In establishing the remuneration for the Executive Board members, the Supervisory Board further considers both the compensation of senior management and that of the remaining workforce in relation to the German Group companies (vertical appropriateness). For these purposes, the Supervisory Board defines senior management as the group of executives of the first two management levels below the Executive Board. The Supervisory Board looks not only at the current compensation ratio, but also at how it has developed over time.
If necessary, the Supervisory Board will engage an independent compensation consultant to re-view vertical and horizontal appropriateness; this was last done in 2018. Furthermore, the Supervisory Board also takes into account the requirements of the German Corporate Governance Code when determining and reviewing the remuneration of the Executive Board.
Any conflict of interest in the establishment, implementation and review of the remuneration policy shall be treated by the Supervisory Board in the same way as other conflicts of interest in the person of a Supervisory Board member. The Supervisory Board member concerned is therefore required to disclose any conflict of interest to the Chairman of the Supervisory Board and will not participate in the adoption of resolutions or in the deliberations concerned. Disclosure of any conflicts of interest at an early stage ensures that the decisions of the Supervisory Board are not influenced by inappropriate considerations.
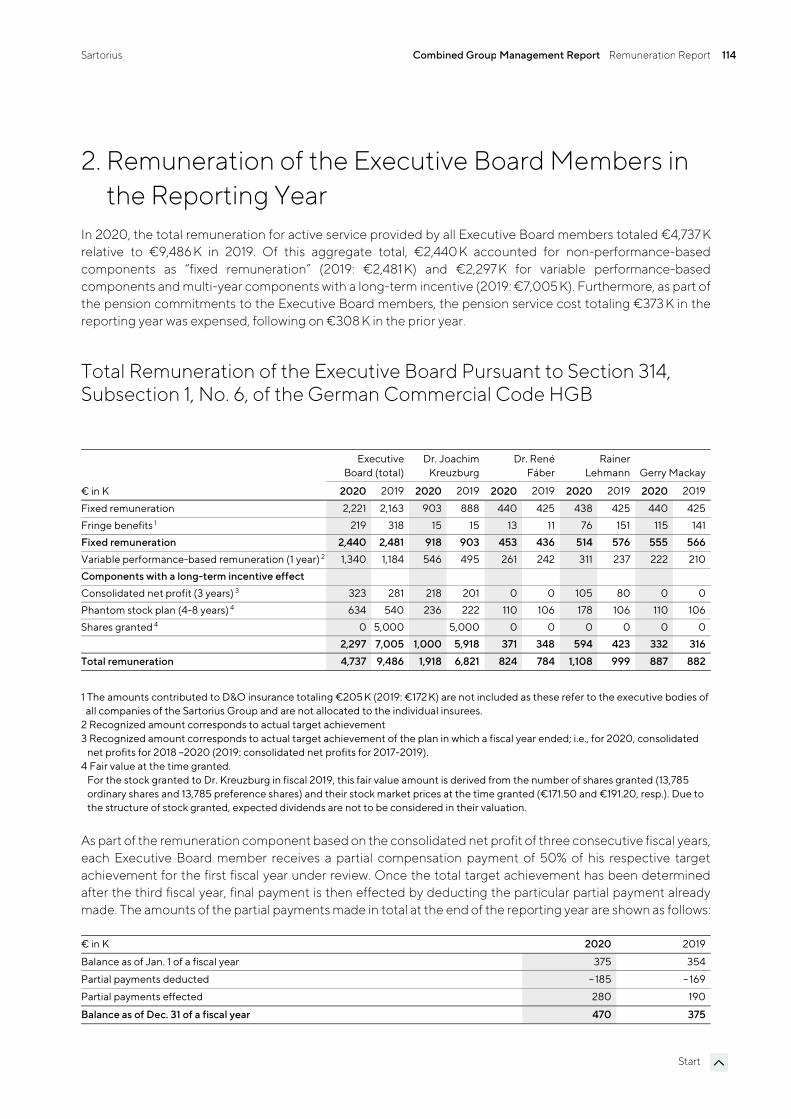
Sartorius Combined Group Management Report Remuneration Report 114
Start
2. Remuneration of the Executive Board Members in the Reporting Year
In 2020, the total remuneration for active service provided by all Executive Board members totaled €4,737 K relative to €9,486 K in 2019. Of this aggregate total, €2,440 K accounted for non-performance-based components as “fixed remuneration” (2019: €2,481 K) and €2,297K for variable performance-based components and multi-year components with a long-term incentive (2019: €7,005 K). Furthermore, as part of the pension commitments to the Executive Board members, the pension service cost totaling €373 K in the reporting year was expensed, following on €308 K in the prior year.
Total Remuneration of the Executive Board Pursuant to Section 314, Subsection 1, No. 6, of the German Commercial Code HGB
Executive Board (total)
Dr. Joachim Kreuzburg
Dr. René Fáber
Rainer Lehmann Gerry Mackay
€ in K 2020 2019 2020 2019 2020 2019 2020 2019 2020 2019
Fixed remuneration 2,221 2,163 903 888 440 425 438 425 440 425Fringe benefits 1 219 318 15 15 13 11 76 151 115 141Fixed remuneration 2,440 2,481 918 903 453 436 514 576 555 566Variable performance-based remuneration (1 year) 2 1,340 1,184 546 495 261 242 311 237 222 210Components with a long-term incentive effect Consolidated net profit (3 years) 3 323 281 218 201 0 0 105 80 0 0Phantom stock plan (4-8 years) 4 634 540 236 222 110 106 178 106 110 106Shares granted 4 0 5,000 5,000 0 0 0 0 0 0
2,297 7,005 1,000 5,918 371 348 594 423 332 316
Total remuneration 4,737 9,486 1,918 6,821 824 784 1,108 999 887 882
1 The amounts contributed to D&O insurance totaling €205 K (2019: €172 K) are not included as these refer to the executive bodies of all companies of the Sartorius Group and are not allocated to the individual insurees.
2 Recognized amount corresponds to actual target achievement 3 Recognized amount corresponds to actual target achievement of the plan in which a fiscal year ended; i.e., for 2020, consolidated
net profits for 2018 –2020 (2019: consolidated net profits for 2017-2019). 4 Fair value at the time granted.
For the stock granted to Dr. Kreuzburg in fiscal 2019, this fair value amount is derived from the number of shares granted (13,785 ordinary shares and 13,785 preference shares) and their stock market prices at the time granted (€171.50 and €191.20, resp.). Due to the structure of stock granted, expected dividends are not to be considered in their valuation.
As part of the remuneration component based on the consolidated net profit of three consecutive fiscal years, each Executive Board member receives a partial compensation payment of 50% of his respective target achievement for the first fiscal year under review. Once the total target achievement has been determined after the third fiscal year, final payment is then effected by deducting the particular partial payment already made. The amounts of the partial payments made in total at the end of the reporting year are shown as follows:
€ in K 2020 2019
Balance as of Jan. 1 of a fiscal year 375 354
Partial payments deducted – 185 – 169
Partial payments effected 280 190
Balance as of Dec. 31 of a fiscal year 470 375
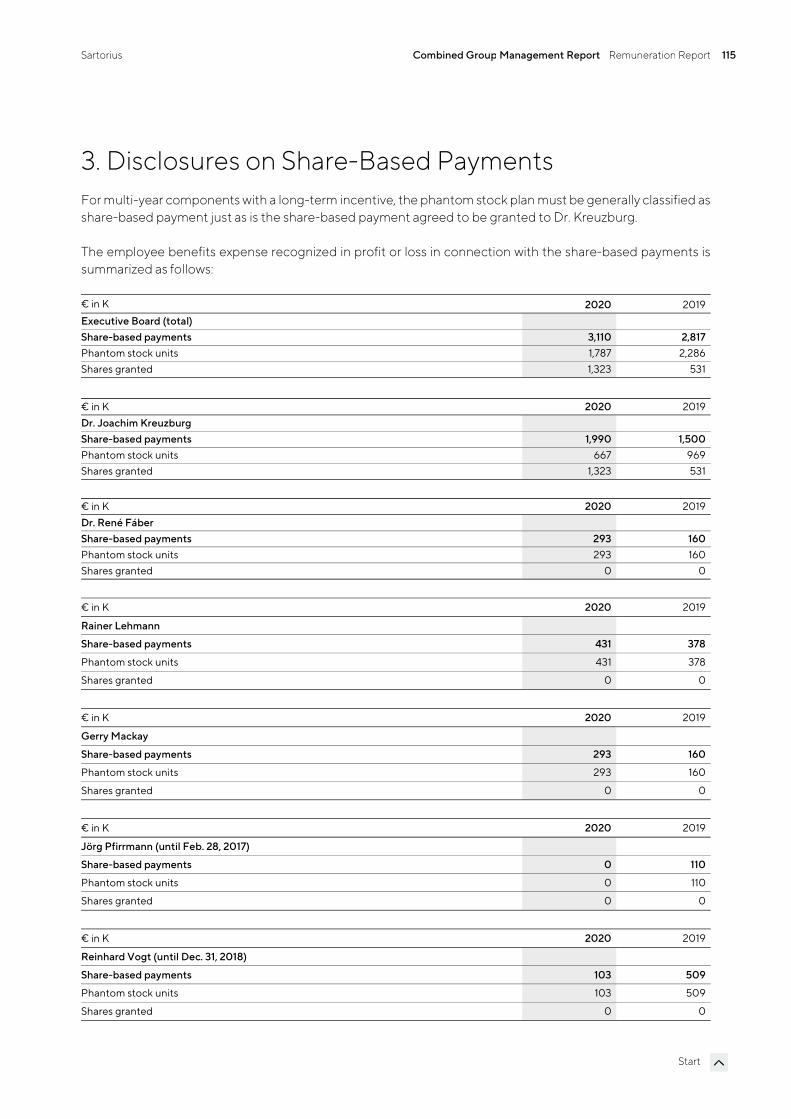
Sartorius Combined Group Management Report Remuneration Report 115
Start
3. Disclosures on Share-Based Payments For multi-year components with a long-term incentive, the phantom stock plan must be generally classified as share-based payment just as is the share-based payment agreed to be granted to Dr. Kreuzburg.
The employee benefits expense recognized in profit or loss in connection with the share-based payments is summarized as follows:
€ in K 2020 2019Executive Board (total) Share-based payments 3,110 2,817Phantom stock units 1,787 2,286Shares granted 1,323 531
€ in K 2020 2019Dr. Joachim Kreuzburg Share-based payments 1,990 1,500Phantom stock units 667 969Shares granted 1,323 531
€ in K 2020 2019Dr. René Fáber Share-based payments 293 160Phantom stock units 293 160Shares granted 0 0
€ in K 2020 2019
Rainer Lehmann
Share-based payments 431 378
Phantom stock units 431 378
Shares granted 0 0
€ in K 2020 2019
Gerry Mackay
Share-based payments 293 160
Phantom stock units 293 160
Shares granted 0 0
€ in K 2020 2019
Jörg Pfirrmann (until Feb. 28, 2017)
Share-based payments 0 110
Phantom stock units 0 110
Shares granted 0 0
€ in K 2020 2019
Reinhard Vogt (until Dec. 31, 2018)
Share-based payments 103 509
Phantom stock units 103 509
Shares granted 0 0
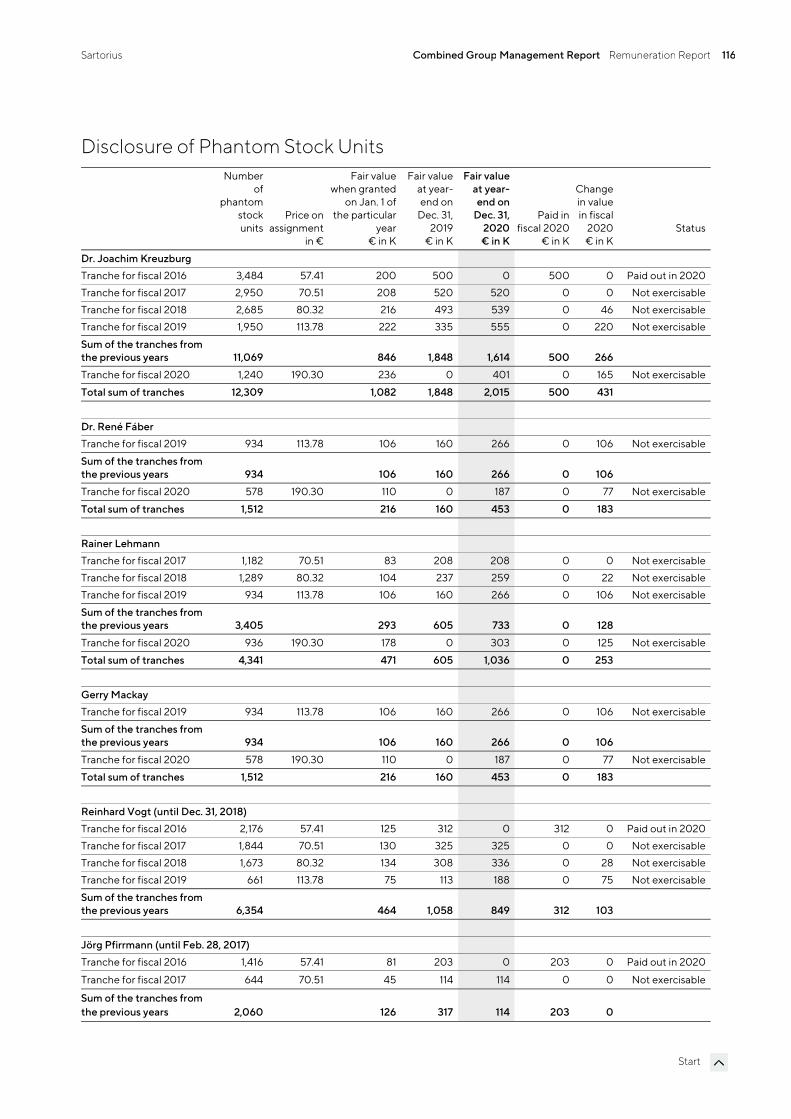
Sartorius Combined Group Management Report Remuneration Report 116
Start
Disclosure of Phantom Stock Units Number
of phantom
stock units
Price on assignment
in €
Fair value when granted
on Jan. 1 of the particular
year€ in K
Fair value at year- end on
Dec. 31, 2019
€ in K
Fair value at year-end on
Dec. 31, 2020€ in K
Paid in fiscal 2020
€ in K
Change in value in fiscal
2020€ in K
Status
Dr. Joachim Kreuzburg Tranche for fiscal 2016 3,484 57.41 200 500 0 500 0 Paid out in 2020Tranche for fiscal 2017 2,950 70.51 208 520 520 0 0 Not exercisableTranche for fiscal 2018 2,685 80.32 216 493 539 0 46 Not exercisableTranche for fiscal 2019 1,950 113.78 222 335 555 0 220 Not exercisable
Sum of the tranches from the previous years 11,069 846 1,848 1,614 500 266
Tranche for fiscal 2020 1,240 190.30 236 0 401 0 165 Not exercisable
Total sum of tranches 12,309 1,082 1,848 2,015 500 431
Dr. René Fáber Tranche for fiscal 2019 934 113.78 106 160 266 0 106 Not exercisable
Sum of the tranches from the previous years 934 106 160 266 0 106
Tranche for fiscal 2020 578 190.30 110 0 187 0 77 Not exercisable
Total sum of tranches 1,512 216 160 453 0 183
Rainer Lehmann Tranche for fiscal 2017 1,182 70.51 83 208 208 0 0 Not exercisableTranche for fiscal 2018 1,289 80.32 104 237 259 0 22 Not exercisableTranche for fiscal 2019 934 113.78 106 160 266 0 106 Not exercisable
Sum of the tranches from the previous years 3,405 293 605 733 0 128
Tranche for fiscal 2020 936 190.30 178 0 303 0 125 Not exercisable
Total sum of tranches 4,341 471 605 1,036 0 253
Gerry Mackay Tranche for fiscal 2019 934 113.78 106 160 266 0 106 Not exercisable
Sum of the tranches from the previous years 934 106 160 266 0 106
Tranche for fiscal 2020 578 190.30 110 0 187 0 77 Not exercisable
Total sum of tranches 1,512 216 160 453 0 183
Reinhard Vogt (until Dec. 31, 2018) Tranche for fiscal 2016 2,176 57.41 125 312 0 312 0 Paid out in 2020Tranche for fiscal 2017 1,844 70.51 130 325 325 0 0 Not exercisableTranche for fiscal 2018 1,673 80.32 134 308 336 0 28 Not exercisableTranche for fiscal 2019 661 113.78 75 113 188 0 75 Not exercisable
Sum of the tranches from the previous years 6,354 464 1,058 849 312 103
Jörg Pfirrmann (until Feb. 28, 2017) Tranche for fiscal 2016 1,416 57.41 81 203 0 203 0 Paid out in 2020
Tranche for fiscal 2017 644 70.51 45 114 114 0 0 Not exercisable
Sum of the tranches from the previous years 2,060 126 317 114 203 0
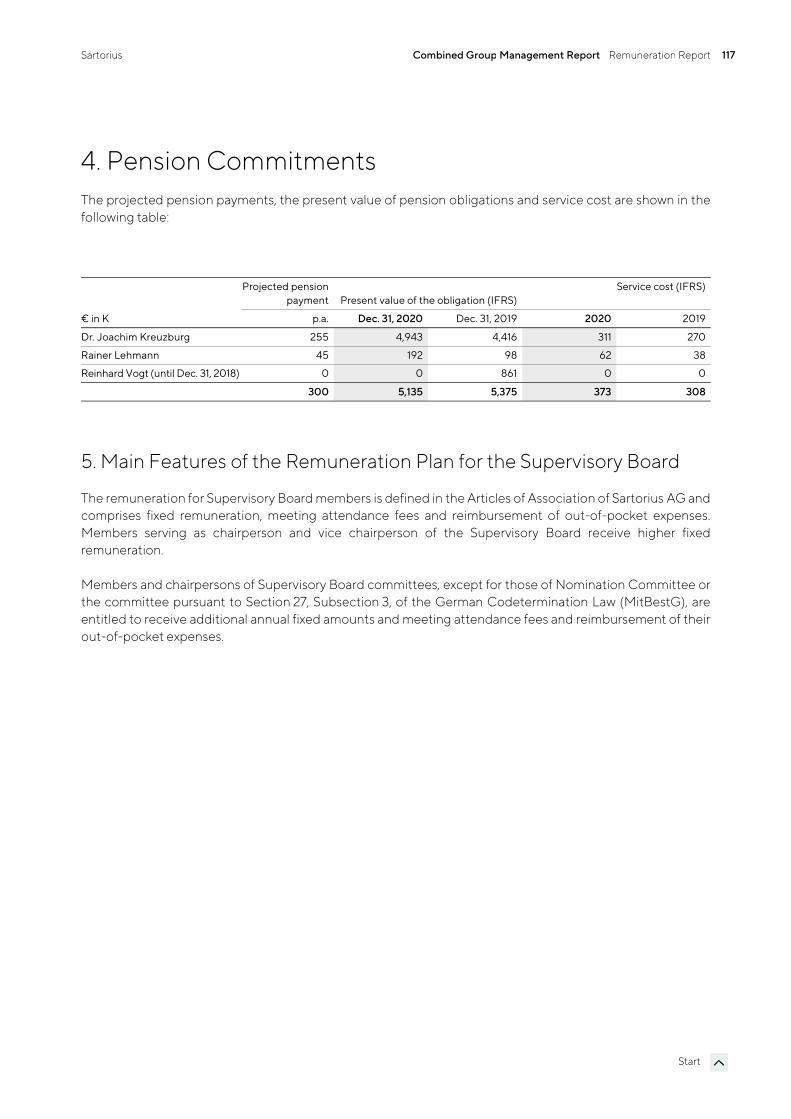
Sartorius Combined Group Management Report Remuneration Report 117
Start
4. Pension Commitments The projected pension payments, the present value of pension obligations and service cost are shown in the following table:
Projected pension payment Present value of the obligation (IFRS)
Service cost (IFRS)
€ in K p.a. Dec. 31, 2020 Dec. 31, 2019 2020 2019
Dr. Joachim Kreuzburg 255 4,943 4,416 311 270
Rainer Lehmann 45 192 98 62 38
Reinhard Vogt (until Dec. 31, 2018) 0 0 861 0 0
300 5,135 5,375 373 308
5. Main Features of the Remuneration Plan for the Supervisory Board
The remuneration for Supervisory Board members is defined in the Articles of Association of Sartorius AG and comprises fixed remuneration, meeting attendance fees and reimbursement of out-of-pocket expenses. Members serving as chairperson and vice chairperson of the Supervisory Board receive higher fixed remuneration.
Members and chairpersons of Supervisory Board committees, except for those of Nomination Committee or the committee pursuant to Section 27, Subsection 3, of the German Codetermination Law (MitBestG), are entitled to receive additional annual fixed amounts and meeting attendance fees and reimbursement of their out-of-pocket expenses.
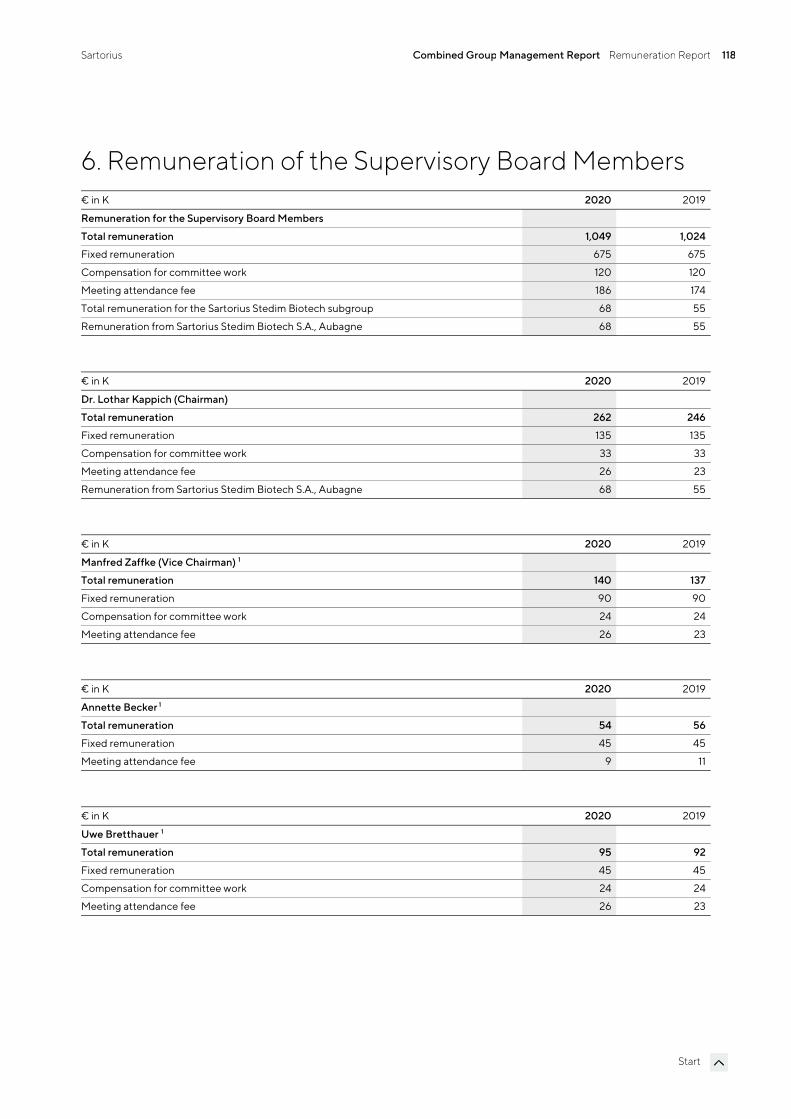
Sartorius Combined Group Management Report Remuneration Report 118
Start
6. Remuneration of the Supervisory Board Members € in K 2020 2019
Remuneration for the Supervisory Board Members
Total remuneration 1,049 1,024
Fixed remuneration 675 675
Compensation for committee work 120 120
Meeting attendance fee 186 174
Total remuneration for the Sartorius Stedim Biotech subgroup 68 55
Remuneration from Sartorius Stedim Biotech S.A., Aubagne 68 55
€ in K 2020 2019
Dr. Lothar Kappich (Chairman)
Total remuneration 262 246
Fixed remuneration 135 135
Compensation for committee work 33 33
Meeting attendance fee 26 23
Remuneration from Sartorius Stedim Biotech S.A., Aubagne 68 55
€ in K 2020 2019
Manfred Zaffke (Vice Chairman) 1
Total remuneration 140 137
Fixed remuneration 90 90
Compensation for committee work 24 24
Meeting attendance fee 26 23
€ in K 2020 2019
Annette Becker 1
Total remuneration 54 56
Fixed remuneration 45 45
Meeting attendance fee 9 11
€ in K 2020 2019
Uwe Bretthauer 1
Total remuneration 95 92
Fixed remuneration 45 45
Compensation for committee work 24 24
Meeting attendance fee 26 23
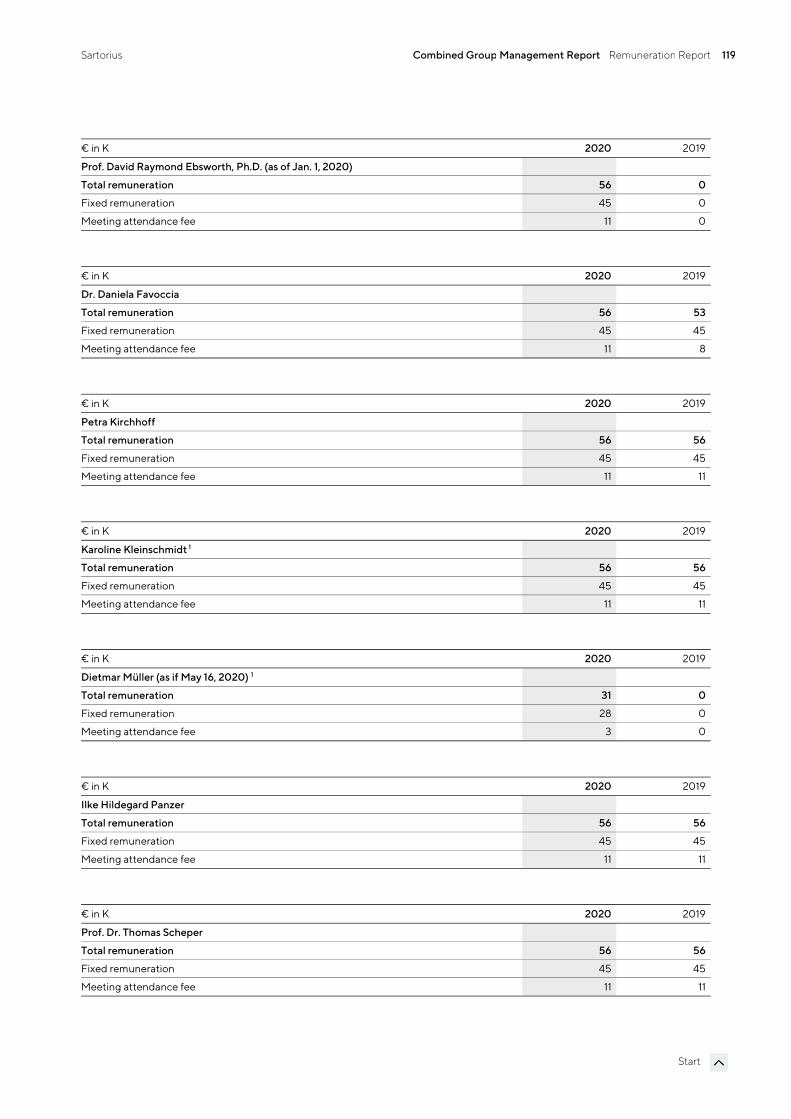
Sartorius Combined Group Management Report Remuneration Report 119
Start
€ in K 2020 2019
Prof. David Raymond Ebsworth, Ph.D. (as of Jan. 1, 2020)
Total remuneration 56 0
Fixed remuneration 45 0
Meeting attendance fee 11 0
€ in K 2020 2019
Dr. Daniela Favoccia
Total remuneration 56 53
Fixed remuneration 45 45
Meeting attendance fee 11 8
€ in K 2020 2019
Petra Kirchhoff
Total remuneration 56 56
Fixed remuneration 45 45
Meeting attendance fee 11 11
€ in K 2020 2019
Karoline Kleinschmidt 1
Total remuneration 56 56
Fixed remuneration 45 45
Meeting attendance fee 11 11
€ in K 2020 2019
Dietmar Müller (as if May 16, 2020) 1
Total remuneration 31 0
Fixed remuneration 28 0
Meeting attendance fee 3 0
€ in K 2020 2019
Ilke Hildegard Panzer
Total remuneration 56 56
Fixed remuneration 45 45
Meeting attendance fee 11 11
€ in K 2020 2019
Prof. Dr. Thomas Scheper
Total remuneration 56 56
Fixed remuneration 45 45
Meeting attendance fee 11 11
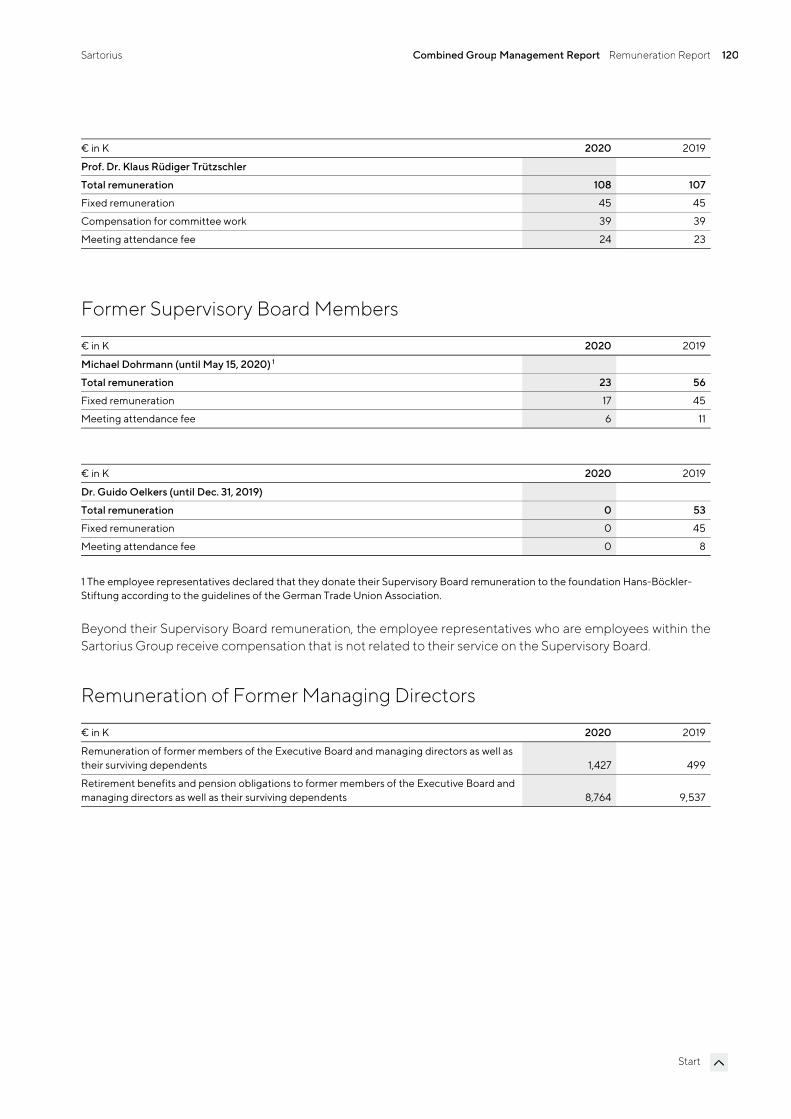
Sartorius Combined Group Management Report Remuneration Report 120
Start
€ in K 2020 2019
Prof. Dr. Klaus Rüdiger Trützschler
Total remuneration 108 107
Fixed remuneration 45 45
Compensation for committee work 39 39
Meeting attendance fee 24 23
Former Supervisory Board Members
€ in K 2020 2019
Michael Dohrmann (until May 15, 2020) 1
Total remuneration 23 56
Fixed remuneration 17 45
Meeting attendance fee 6 11
€ in K 2020 2019
Dr. Guido Oelkers (until Dec. 31, 2019)
Total remuneration 0 53
Fixed remuneration 0 45
Meeting attendance fee 0 8
1 The employee representatives declared that they donate their Supervisory Board remuneration to the foundation Hans-Böckler-Stiftung according to the guidelines of the German Trade Union Association.
Beyond their Supervisory Board remuneration, the employee representatives who are employees within the Sartorius Group receive compensation that is not related to their service on the Supervisory Board.
Remuneration of Former Managing Directors
€ in K 2020 2019
Remuneration of former members of the Executive Board and managing directors as well as their surviving dependents 1,427 499
Retirement benefits and pension obligations to former members of the Executive Board and managing directors as well as their surviving dependents 8,764 9,537
Sartorius Combined Group Management Report Non-financial Group statement 121
Start
Non-financial Group statement
Responsibility at Sartorius Sustainability Management
Stakeholder Involvement
About the Non-Financial Group Statement
Organizational Profile
Materiality Analysis
Risk Management
Sustainable Development Goals
Innovation & Social Contribution
Employees Finding and Retaining Talented Staff
Occupational Health and Safety
Responsible Business Practices Compliance
Supply Chain
Human Rights
Environment Energy Consumption and Emissions
Product Stewardship
Sartorius Combined Group Management Report Responsibility at Sartorius 122
Start
Responsibility at Sartorius Sustainability Management Sartorius is an internationally leading partner to the biopharmaceutical industry. With our technologies, we help researchers and engineers achieve faster, easier progress in the life sciences and bioprocess technology, thus enabling the development of new and better treatments and vaccines and affordable medical care.
Many people in industrialized countries suffer from diseases for which there is as yet no effective treatment. These include cancer, dementia and autoimmune diseases as well as congenital metabolic disorders and infectious diseases. At the same time, many diseases that would have proved fatal just a few generations ago can now be cured or treated effectively. Combined with declining birth rates, this has led to an aging society in industrialized countries where people are expected to remain fit and healthy for as long as possible.
In developing and emerging countries, the availability and affordability of healthcare is well below the standards in industrialized nations: more than half the world’s population has either no or inadequate access to medical care. For every second child, initial immunization is an unachievable goal, and it is estimated that 1.5 million children under the age of five die from diseases from which they could be protected with vaccinations.
The purpose of our business is to help our customers develop and manufacture biotechnology-based drugs and vaccines and, in doing so, enable the development and safe production of vaccines and biopharmaceutical medicines to treat serious and, in some cases, rare diseases. The United Nations’ sustainability goal ‘Good Health and Well-Being’ is thus an integral part of our core business.
As a 150 -year old company, sustainability is firmly embedded at many levels in our business. To us, it means operating responsibly over the long term – with respect to customers, employees, investors, business partners and society as a whole. Likewise, it entails handling natural resources responsibly. Sustainable action also means remaining agile and constantly asking ourselves how we can respond to the changing world and make a positive contribution. This concerns the continued development of our core business just as much as living up to our corporate responsibilities.
Because of the Covid-19 pandemic, 2020 was characterized by changes that posed serious challenges for society as a whole. At the same time, the crisis showed how Sartorius’ core business makes a direct contribution towards the goal of “healthy lives and well-being for all at all ages”: with its products and process knowledge, Sartorius is involved in many of the worldwide vaccine projects to combat the coronavirus.
Optimization of processes and methods throughout the entire supply chain can also make a contribution towards sustainability – this mainly includes the consideration of sustainability in procurement, product development and production. Our product portfolio includes consumables such as filters, pipette tips, cell culture media and bags. These sterile products for use in biopharmaceutical research and development have significant benefits compared to reusable products. Nevertheless, we see potential to reduce our use of natural resources in this area.
In this connection, Sartorius signed the European Plastics Pact in 2020 as the first company in its industry. The aim of this public-private initiative is to improve the use and recycling of plastics and, as a consequence, use less virgin plastic. With cross-border cooperation agreements on a European level, the signatories want to develop new technologies, share their findings, harmonize guidelines and standards and dismantle existing barriers.
Sartorius Combined Group Management Report Responsibility at Sartorius 123
Start
Sartorius’ CO2 emissions are relatively low, since the company is not a high energy user nor does it purchase energy-intensive raw materials. However, we do believe it is important that we play our part in helping to reduce global warming. To reduce our Scope 1 and 2 CO2 emissions, we set ourselves science-based targets in the reporting year, which are based on the science-based targets and the 1.5°C goal.
This year, our Corporate Responsibility Steering Committee, which meets at least once per year and is chaired by the CEO, mainly discussed implementation of the defined climate and plastic targets in the activities of the two divisions and, hence, focused on the Sustainable Development Goals of the United Nations “Climate Action” and “Responsible Consumption and Production”.
Stakeholder Involvement Sartorius engages in a very close, ongoing dialog with its stakeholders, using this exchange to regularly discuss aspects of sustainability.
We define stakeholders as those persons, companies, institutions and interest groups that are able to influence the success of the Sartorius Group or are affected by the actions of our company. In particular, such stakeholders are our customers, employees, investors, suppliers and business partners, as well as neighboring companies and local residents.
In the reporting year, we had intensive discussions about the subject of sustainability with our customers. During many meetings, we discussed the expectations of our customers and started cooperation projects. To get a comprehensive overview in this regard, in collaboration with a market research institute we wrote to more than 70 customers, asking them how they perceived Sartorius’ contributions towards sustainability and also to tell us about their expectations.
In the reporting year, Sartorius strengthened its dialog with its own staff with two major surveys involving employees. We set up a section on the Intranet specifically dealing with the topic of sustainability.
In November, Sartorius once again took part in the ESG-SRI Conference of Société Générale. In March, the German Stock Exchange presented the new sustainability index DAX 50 ESG. The index tracks the performance of the fifty largest and most liquid German stocks that have particularly sustainable business practices based on the Environmental, Social and Governance criteria. Sartorius is included in the DAX 50 ESG.
The results of the stakeholder dialog were discussed in the Corporate Responsibility Steering Committee and, in this way, are taken into account in Sartorius’ strategy process.
Sartorius participates in sustainability analyses and ratings to gauge its performance with respect to its environmental, social and governance-related business practices. In the EcoVadis Rating, Sartorius achieved silver level and, with this score, positioned itself among the best 19 percent of the companies assessed. Sartorius was given an A in the MSCI Sustainability Rating.

Sartorius Combined Group Management Report Responsibility at Sartorius 124
Start
About the Non-Financial Group Statement Sartorius defined non-financial indicators that enable assessment of the impact of its business activities on stakeholders, the environment and society.
This non-financial Group statement was prepared in accordance with the disclosures set out in Sections 315b and 315c in conjunction with Sections 289c to 289e of the German Commercial Code (HGB). Pursuant to Section 315b, Subsection 1, Sentence 3 HGB, reference is also made to individual non-financial aspects contained elsewhere in the Group Management Report.
Orientation for the non-financial Group statement is provided by the reporting framework developed by the Global Reporting Initiative (GRI) – the Sustainability Reporting Standards so that we can ensure transparency and comparability.
The reporting period for the non-financial Group statement is the fiscal year, the reporting cycle is annual. Unless otherwise indicated, the employee-related data covers all Sartorius companies. Unless otherwise specified, the environmental indicators encompass all our production companies, representing 76% of the total headcount.
This non-financial Group statement was audited by KPMG AG in the form of an audit with limited assurance. The submission of this non-financial Group statement releases our subgroup Sartorius Stedim Biotech S.A. from the obligation of creating its own non-financial statement.
Organizational Profile We refer to the Group Management Report, pages 27 ff, sections “Structure and Management of the Group” and “Business Model, Strategy and Goals”.
Materiality Analysis Our considerations with regard to materiality are based on the term used in the European CSR Directive Implementation Act (CSR-RUG). We also take our stakeholders’ considerations into account.
We conducted a comprehensive materiality analysis in 2017 to determine the material topics for the business activities of the Sartorius Group.
For reporting in the year under review, we assessed discussions with customers and investors, taking into account the views of managers in Sales, Product Marketing, Purchasing, Quality Management, Legal & Compliance, Corporate Communications as well as Research and Development and Production. The Executive Board confirmed the results of this process.
There were no changes to the material topics compared with last year. They were confirmed as follows:
1. Advance innovation and, as a result, contribute to improved medical care and promote employment and good working conditions through growth.
2. Find and retain employees, protect their health and safety and promote their continuous development.
Sartorius Combined Group Management Report Responsibility at Sartorius 125
Start
3. Responsible corporate governance and compliance and respect for human rights throughout the supply chain.
4. Protect the environment by reducing emissions and assuming responsibility for our products throughout their life cycles.
Risk Management Sartorius is responsible towards its employees, the environment, and society. This responsibility must be perceived throughout the entire supply chain. In particular, the company’s actions with regard to environmental matters, employee and social aspects, anti-corruption and bribery issues and respect for human rights can lead to non-financial risks. This is why Sartorius strives to consider risks that have an impact on the company, but what is more, to examine the risks Sartorius poses for its environment with its business operations as well.
Risks can occur especially in connection with the manufacture of sterile products used in bioprocesses, since this can require the use of plastics, energy and solvents. Non-financial risks can also occur through the procurement of materials. This is why, when Sartorius is choosing partners and suppliers, it pays particular attention that statutory and ethical rules are complied with.
In the reporting year, no non-financial risks were identified that would have to be reported according to CSR-RUG.
The requirements defined in the German CSR Directive Implementation Act (CSR-RUG) are the basis of the ESG risk analysis. Sartorius aims for the greatest possible integration of risk management processes in the company.
Sustainable Development Goals Sartorius is a signatory to the United Nations Global Compact and supports the 2030 agenda for a sustainable global economy.
The United Nations developed 17 Sustainable Development Goals (SDGs). The governments of all member states have adopted the SDGs; however, their success is largely dependent on the actions and cooperation of everyone involved – especially on the commitment of the private sector. Sartorius accepts this responsibility.
To determine which SDGs are related to Sartorius’ business activities, we also conducted a comprehensive materiality analysis in 2018. Sartorius regards nine SDGs as important in connection with its business operations.
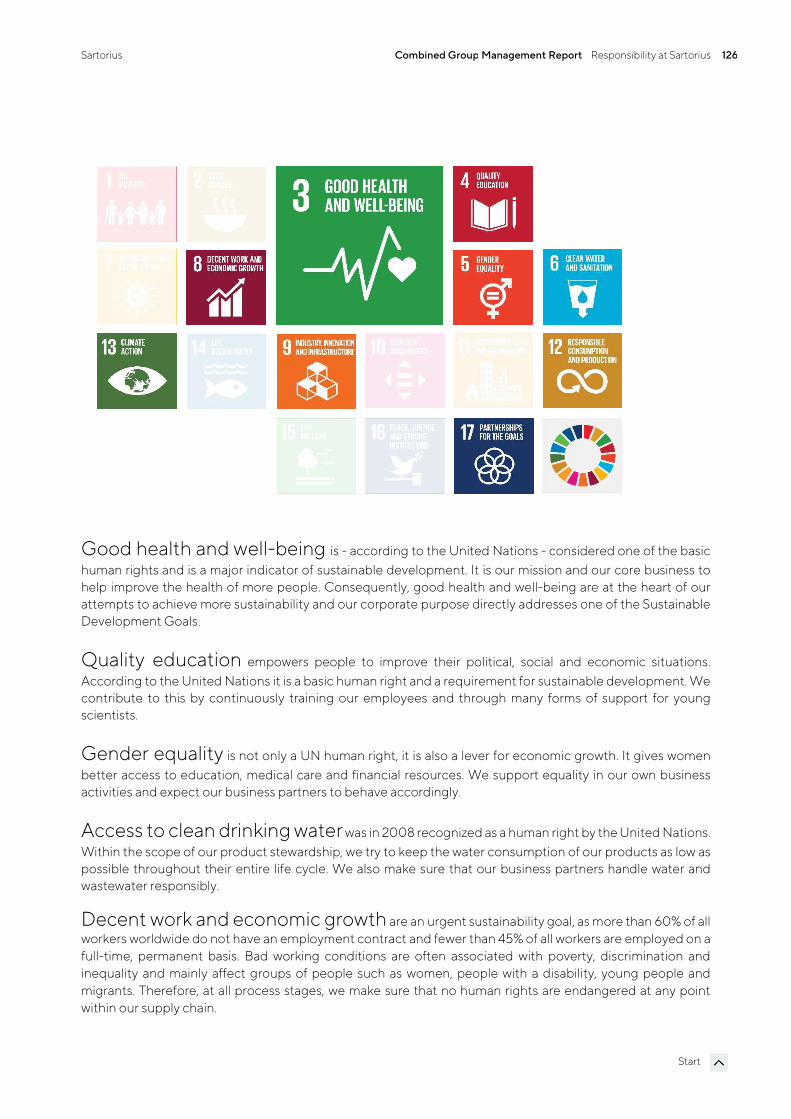
Sartorius Combined Group Management Report Responsibility at Sartorius 126
Start
Good health and well-being is - according to the United Nations - considered one of the basic human rights and is a major indicator of sustainable development. It is our mission and our core business to help improve the health of more people. Consequently, good health and well-being are at the heart of our attempts to achieve more sustainability and our corporate purpose directly addresses one of the Sustainable Development Goals.
Quality education empowers people to improve their political, social and economic situations. According to the United Nations it is a basic human right and a requirement for sustainable development. We contribute to this by continuously training our employees and through many forms of support for young scientists.
Gender equality is not only a UN human right, it is also a lever for economic growth. It gives women better access to education, medical care and financial resources. We support equality in our own business activities and expect our business partners to behave accordingly.
Access to clean drinking water was in 2008 recognized as a human right by the United Nations. Within the scope of our product stewardship, we try to keep the water consumption of our products as low as possible throughout their entire life cycle. We also make sure that our business partners handle water and wastewater responsibly.
Decent work and economic growth are an urgent sustainability goal, as more than 60% of all workers worldwide do not have an employment contract and fewer than 45% of all workers are employed on a full-time, permanent basis. Bad working conditions are often associated with poverty, discrimination and inequality and mainly affect groups of people such as women, people with a disability, young people and migrants. Therefore, at all process stages, we make sure that no human rights are endangered at any point within our supply chain.
Sartorius Combined Group Management Report Responsibility at Sartorius 127
Start
Industry, innovation and infrastructure: this SDG aims to expand scientific research in all countries throughout the world. While Sartorius does not have a direct influence on the areas of infrastructure or sustainable industrialization, it does contribute in a wide variety of ways to achieve this innovation goal. By having our production sites serve as centers of competence, we develop scientific expertise at many sites across the globe. Our promotion of young people helps us spread and network the scientific basis worldwide and, as a result, strengthen future innovation activities.
Responsible consumption and production means, among other things, the transition to a circular economy. Sterile plastic products are a key component of Sartorius’ product portfolio – for a good reason: the properties of these products are beneficial for the patients at the end of the supply chain, for the environment and for the basic availability and development of innovative medical care. At the same time, single-use products inevitably raise the question of the product’s end of life. We are addressing this issue and considering the end of life of our products as well as their overall ecological footprint.
Action to combat climate change is taken within the company and also in our supply chain. Human-induced climate change is one of the greatest challenges of our time. It requires action from everyone concerned, especially the private sector. A key issue is to reduce emissions of CO2 and other greenhouse gases. We accept this responsibility within the scope of our climate strategy.
Partnerships to achieve aims are a standard approach for Sartorius. We especially strengthen our innovation activities through partnerships and cooperation agreements. Achieving sustainability targets requires a cooperation approach because they concern the entire supply chain and success can be achieved only through cooperation with customers, suppliers, contractual partners and science.
Sartorius Combined Group Management Report Innovation & Social Contribution 128
Start
Innovation & Social Contribution
Why it’s important
Our corporate mission is to promote scientific progress in the life sciences, which in turn supports the development of new vaccines, more effective therapies and affordable medical care. In the year under review, the importance of this mission for society as a whole was underlined by the biotechnology sector's contribution towards fighting the Covid-19 pandemic.
The biopharmaceutical market is rapidly developing – it is an area in which scientific breakthroughs leading to new therapies occur at a high rate. At the same time, it still takes about ten years to develop a new pharmaceutical drug and this remains cost-intensive. Our aim is to help our biopharmaceutical customers develop and produce biopharmaceuticals more efficiently.
From day one of its incorporation, Sartorius has worked to maintain an open exchange with the scientific community and, in this way, has driven forward scientific insights and precisely tailored product development. Our goal is to promote scientific thinking and working in society, creating a broader basis for future research and development.
Our approach
In collaboration with expert scientific groups worldwide, the company’s research and development activities are aimed at making a contribution so that new active pharmaceutical ingredients are discovered faster and drugs can be produced efficiently. In this way, we want to bring about benefits for society, support sustainable development and, at the same time, strengthen the company’s growth.
The innovation activities of the Sartorius Group are based on three pillars: first, specialized in-house product development, second, research cooperation agreements with partners such as scientific institutions and, third, integration of complementary technologies through acquisitions. While product development is assigned to the respective board members, Corporate Research works across the different divisions under the control of the CEO.
Sartorius is involved in many research partnerships covering a wide range of subjects. Forms of collaboration vary from single cooperation agreements to partnerships with institutes and scientific facilities. Both of these make up about 40 percent of the cooperation agreements. Sartorius also carries out research work in consortia, to which Sartorius contributes its own latest scientific findings.
Often, new approaches arise from the interdisciplinary collaboration of various experts. Because of this, our approach is to bring experts from science startups and industry together and encourage networking and the sharing of ideas. This is conducive to the generation of new and creative ideas and thus supports scientific progress.
Supporting young scientists is important to us, as this creates the basis for scientific progress in the future.
Sartorius Combined Group Management Report Innovation & Social Contribution 129
Start
Our performance
In past years, technologies from Sartorius have been used in the development and production of vaccines to combat various diseases, such as Ebola, Zika and H1N1. In the reporting year, the company’s products and process knowledge made a significant contribution towards fighting the Covid-19 pandemic: Sartorius is involved in most vaccine projects throughout the world.
In accordance with its innovation concept, Sartorius strengthened its position with acquisitions during the year under review. Details about the acquisitions and corresponding expansion of the product portfolio and service spectrum can be found on pages 28 ff of the Group Management Report. Pages 49 ff of the Group Management Report contain information about our research and development activities.
By expanding its research cooperation agreements, Sartorius supports the development and production of biopharmaceuticals worldwide and, hence, improves the availability of innovative medical care in the long term. In the reporting year, the number of research cooperation agreements doubled. We also seek to improve the sustainability of our products through cooperation agreements. More information about product stewardship can be found in the Environment section from page 141.
Another important aspect is our work with and support for young scientists. For the past three years, Sartorius has had a cooperation agreement with the East China University of Science and Technology (ECUST) in Shanghai. The university has a good reputation for its research in the fields of biosciences, biotechnology and bioengineering. Within the scope of the Young Eagle trainee program, during the reporting year, 110 students from the Bioscience and Biotechnology department visited the Sartorius site in Shanghai. Since 2017, 25 students have completed an internship at Sartorius as part of the Young Eagle cooperation.
The “Sartorius & Science Prize for Regenerative Medicine & Cell Therapy”, awarded by Sartorius' Research Xchange Forum in collaboration with the American Association for the Advancement of Science (AAAS) was presented for the last time in the reporting year. The award, which comes with $35,000 in prize money, is geared toward outstanding scientists who focus on basic or translational research in these fields.
Sartorius Combined Group Management Report Employees 130
Start
Employees
Finding and Retaining Talented Staff
Why it’s important
Sartorius is growing strongly. We continually gain talented and well-qualified employees and build their loyalty to ensure the success of the company in the future as well. In the process, one particular challenge all over the world is to recruit experienced specialists for the company. Currently, 10,637 employees contribute to Sartorius’ success. Continuing professional development, assumption of responsibility and opportunities to advance within the company are important for our employees' satisfaction. These competences safeguard their employability and open up new professional prospects for them.
As a globally operating company, we do business in many different regions and markets. Sartorius employees from 96 countries work together. The interplay of a variety of perspectives and experiences helps us understand our customers better, develop tailored solutions and remain competitive in a global economy. We believe that a working environment of mutual trust, appreciation and respect brings the best work results and increases our employees’ motivation and creativity as well as their loyalty.
Our approach
To acquire personnel, our approach is to focus on the things that are important for existing and potential employees1 and make them known throughout the world. According to our analysis, they are all factors that are likely to create trust in the future: the company's brand leadership, its sales growth and margin development, its internationality and innovation activities and – last but not least – the individual's opportunities for development within the company. A meaningful mission and the perceptible assumption of social responsibility are also important for many job applicants.
We strive to offer our employees good working conditions to encourage them to apply their skills in the best possible manner. The approaches that we pursue throughout the Group are defined in our policy on work practices and social standards. To improve the accuracy of its measures to create good working conditions, Sartorius conducted two global employee surveys in the year under review. The first survey in July 2020 was aimed at evaluating the work situation during the general lockdown phase in spring. During this time, many administrative employees partly worked from home and the survey was intended to draw conclusions about future job design.
A second survey in November 2020 addressed a larger range of topics, such as employees’ perception of the corporate and leadership culture, of their own workplace and work satisfaction in general. Employees were asked to suggest improvements. This survey will be carried out every six months in future. Annual performance reviews between employees and their managers also provide a forum for discussing performance, targets and
1 The following employee figures include all staff members of the Sartorius Group, except for vocational trainees, interns, employees on extended leaves of absence and those participating in an early retirement plan. Numbers are reported as head counts.
Sartorius Combined Group Management Report Employees 131
Start
individual development opportunities. In 2020, Sartorius implemented a new system-supported process to conduct performance reviews digitally based on uniform criteria from 2021 onwards.
Our employees should be able to develop personally and professionally throughout their professional lives. For this purpose, Sartorius offers a wide range of management and communication training opportunities as well as practical training at all its sites. Sartorius also encourages its employees to network within the company and to transfer temporarily to its other departments or sites. The Global Mobility Department coordinates and looks after employees on temporary assignment to other countries. The basic conditions for temporary assignments in foreign countries are transparently defined for all staff members.
Sartorius pursues a goal of filling most management positions from within its own ranks. We use Sartorius’ leadership guidelines as the basis for a management development program in which all first-time managers participate with the goal of developing a common leadership culture throughout the Group. The program is already available at our companies in Germany, the U.K., France, Belgium, Italy, Spain, India and China. A development program for production managers has been established in Germany.
To create the same opportunities for people regardless of their life situations, we have installed a flexible work scheduling model at many of our companies. Employees are often able to take advantage of flextime, part-time and teleworking options.
In addition to flexible work schedules, our response to the need for work-life balance includes child care opportunities. In Göttingen, for example, there are offers for children during school vacations, and a day care center is available close to the company on the Sartorius Campus. As an inclusive day care center, it is also open to children with disabilities. It’s part of our corporate culture that fathers also take family leave at Sartorius.
Measures that promote equal opportunity in our company include the creation of transparency on salary structures. The majority of salaries at the German companies are linked to the rates agreed with the IG Metall trade union, with some paid in accordance with rates established for IG Bergbau, Chemie, Energie. The remuneration paid to employees in France and Austria is also based on trade union rates. Using the union rates makes our remuneration more transparent.
The Group Employees’ Council represents the interests of our staff in Germany. All operating companies in Germany also have a local employees’ council. In addition to the employee council members, various representatives are available to Sartorius employees.
Our performance
To us, education is a valuable asset, and we consider it part of our corporate responsibility to support it and make it accessible within our sphere of influence.
During the reporting year, 92,180 hours were invested in training measures – on average 8.9 training hours per employee.1
1 Companies acquired during the year are not counted and, in line with the reporting guideline, will be included in the report next year. Companies that were consolidated last year report fully this year.
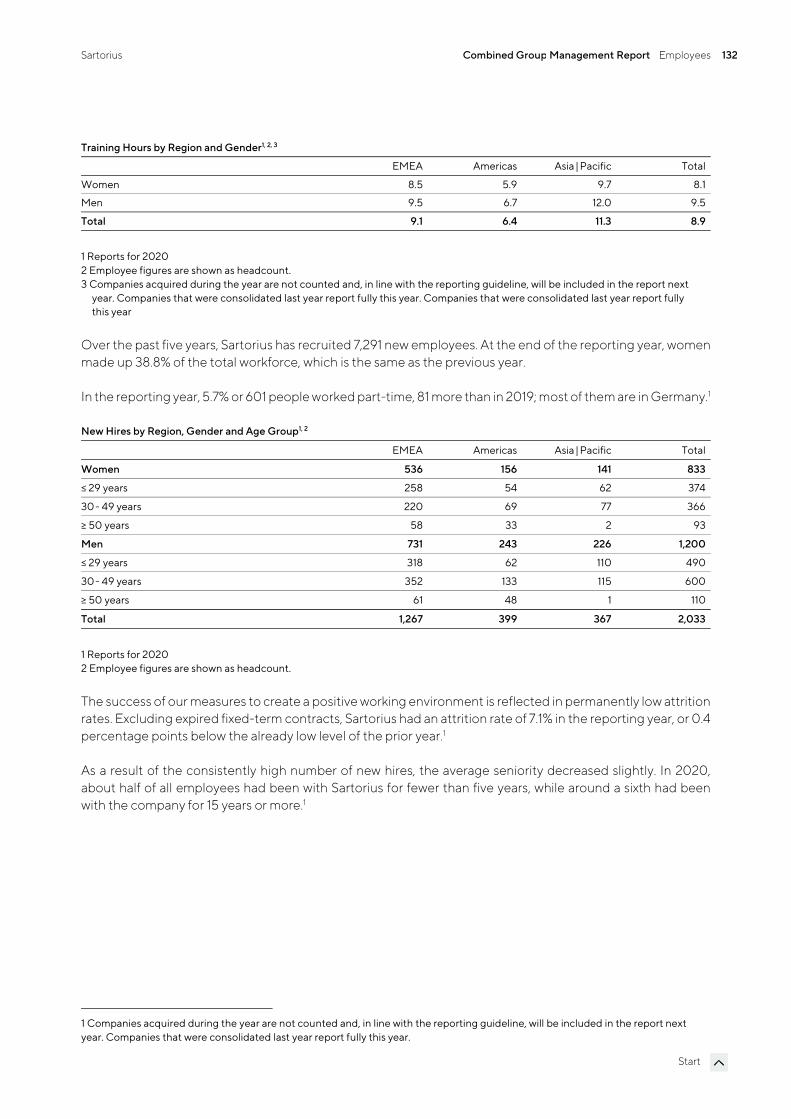
Sartorius Combined Group Management Report Employees 132
Start
Training Hours by Region and Gender1, 2, 3
EMEA Americas Asia | Pacific Total
Women 8.5 5.9 9.7 8.1
Men 9.5 6.7 12.0 9.5
Total 9.1 6.4 11.3 8.9
1 Reports for 2020 2 Employee figures are shown as headcount. 3 Companies acquired during the year are not counted and, in line with the reporting guideline, will be included in the report next
year. Companies that were consolidated last year report fully this year. Companies that were consolidated last year report fully this year
Over the past five years, Sartorius has recruited 7,291 new employees. At the end of the reporting year, women made up 38.8% of the total workforce, which is the same as the previous year.
In the reporting year, 5.7% or 601 people worked part-time, 81 more than in 2019; most of them are in Germany.1
New Hires by Region, Gender and Age Group1, 2
EMEA Americas Asia | Pacific Total
Women 536 156 141 833
≤ 29 years 258 54 62 374
30- 49 years 220 69 77 366
≥ 50 years 58 33 2 93
Men 731 243 226 1,200
≤ 29 years 318 62 110 490
30- 49 years 352 133 115 600
≥ 50 years 61 48 1 110
Total 1,267 399 367 2,033
1 Reports for 2020 2 Employee figures are shown as headcount.
The success of our measures to create a positive working environment is reflected in permanently low attrition rates. Excluding expired fixed-term contracts, Sartorius had an attrition rate of 7.1% in the reporting year, or 0.4 percentage points below the already low level of the prior year.1
As a result of the consistently high number of new hires, the average seniority decreased slightly. In 2020, about half of all employees had been with Sartorius for fewer than five years, while around a sixth had been with the company for 15 years or more.1
1 Companies acquired during the year are not counted and, in line with the reporting guideline, will be included in the report next year. Companies that were consolidated last year report fully this year.
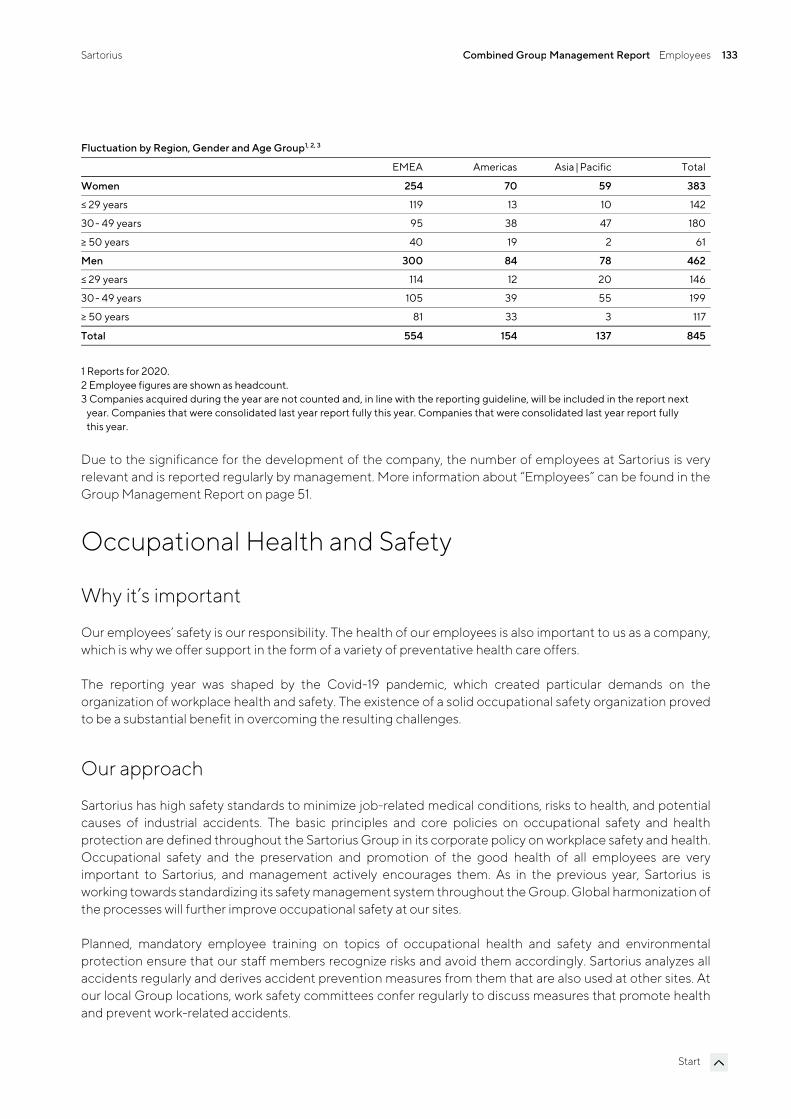
Sartorius Combined Group Management Report Employees 133
Start
Fluctuation by Region, Gender and Age Group1, 2, 3
EMEA Americas Asia | Pacific Total
Women 254 70 59 383
≤ 29 years 119 13 10 142
30- 49 years 95 38 47 180
≥ 50 years 40 19 2 61
Men 300 84 78 462
≤ 29 years 114 12 20 146
30- 49 years 105 39 55 199
≥ 50 years 81 33 3 117
Total 554 154 137 845
1 Reports for 2020. 2 Employee figures are shown as headcount. 3 Companies acquired during the year are not counted and, in line with the reporting guideline, will be included in the report next
year. Companies that were consolidated last year report fully this year. Companies that were consolidated last year report fully this year.
Due to the significance for the development of the company, the number of employees at Sartorius is very relevant and is reported regularly by management. More information about “Employees” can be found in the Group Management Report on page 51.
Occupational Health and Safety
Why it’s important
Our employees’ safety is our responsibility. The health of our employees is also important to us as a company, which is why we offer support in the form of a variety of preventative health care offers.
The reporting year was shaped by the Covid-19 pandemic, which created particular demands on the organization of workplace health and safety. The existence of a solid occupational safety organization proved to be a substantial benefit in overcoming the resulting challenges.
Our approach
Sartorius has high safety standards to minimize job-related medical conditions, risks to health, and potential causes of industrial accidents. The basic principles and core policies on occupational safety and health protection are defined throughout the Sartorius Group in its corporate policy on workplace safety and health. Occupational safety and the preservation and promotion of the good health of all employees are very important to Sartorius, and management actively encourages them. As in the previous year, Sartorius is working towards standardizing its safety management system throughout the Group. Global harmonization of the processes will further improve occupational safety at our sites.
Planned, mandatory employee training on topics of occupational health and safety and environmental protection ensure that our staff members recognize risks and avoid them accordingly. Sartorius analyzes all accidents regularly and derives accident prevention measures from them that are also used at other sites. At our local Group locations, work safety committees confer regularly to discuss measures that promote health and prevent work-related accidents.
Sartorius Combined Group Management Report Employees 134
Start
In the reporting year, at the Aubagne site, a cross-unit team started an initiative to improve occupational safety and reduce work-related accidents. Since employee behavior plays a key role in many of the work-related accidents, in addition to making technical improvements the team plans to raise awareness with regard to safety among employees. More than 600 employees – most of them from areas with a higher risk potential – have already taken part in the new workshops to raise safety awareness. In addition, 110 first aiders took part in a full day training course to minimize risks. Workshops were offered especially to managers to prepare them so that they can improve safety management in their teams.
The Group's corporate health management policy addresses both the physical and psycho-social elements of health to enhance employee performance and motivation, ensure their employability and reduce illness-related costs. Most sites have an in-house medical service. In addition, an external provider is on hand to offer psychological help on any work-related and indeed personal matter. Staff can reach the service via a hotline.
One of our two companies in Beijing and one of our companies in Shanghai are certified in accordance with OHSAS 18001 and one of our two companies in Bangalore is certified according to ISO 450001.
Employees from external companies also work for Sartorius, for example, cleaning staff and construction companies. Their safety is also important to us. This is why contractors’ employees receive occupational safety instructions before they begin their work. These instructions specifically mention how incidents and accidents can be reported.
During the Covid-19 pandemic, two considerations especially shaped our actions: first, protecting the health of our more than 10,000 employees. Second, maintaining our business operations, on the one hand, to be able to support our customers and, on the other, to ensure our own financial stability. In view of the fact that many of our customers are involved in the development and production of vaccines against the coronavirus, Sartorius has a special social responsibility. It was therefore not an option to reduce personnel in production in order to improve infection protection or to shut down parts of our operations. On the contrary, production was actually expanded.
Our well-established occupational safety processes put us in a position where we could respond quickly and extensively to these special challenges during the Covid-19 pandemic. A crisis team comprising members from different units and the Executive Board was established on a corporate level to monitor and assess the situation constantly and introduce appropriate measures if necessary. Several teams also work on a local level.
To protect employees, social distancing rules were put in place at a very early stage and business trips were almost completely stopped. Face masks and visors were provided at the sites.
Within the scope of a Mobile Corona Analysis (MCA) Response Study by Leibniz University Hannover, employees at the Göttingen and Guxhagen sites were able to have themselves tested voluntarily for Covid-19 via PCR analysis over several months. They were able to have a swab taken every two weeks. Since the end of the study phase, Sartorius now offers employees a regular antigen test. This test strategy to prevent the formation of infection clusters will be introduced successively at other sites.
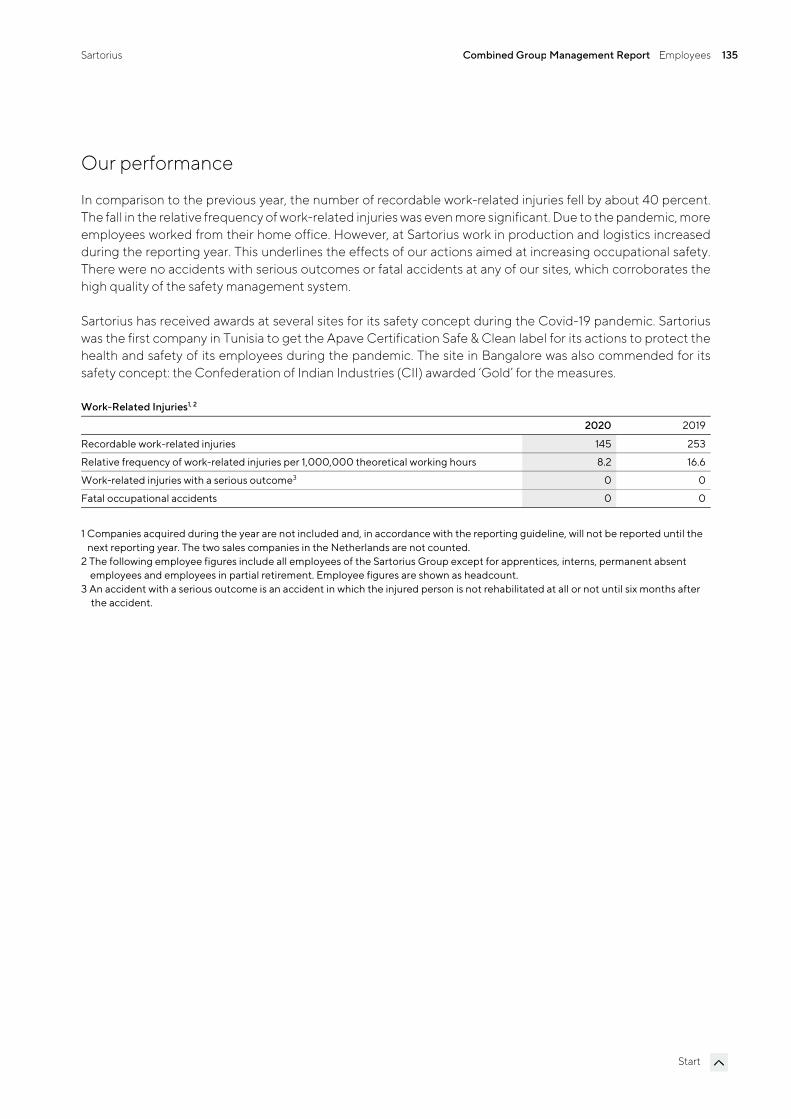
Sartorius Combined Group Management Report Employees 135
Start
Our performance
In comparison to the previous year, the number of recordable work-related injuries fell by about 40 percent. The fall in the relative frequency of work-related injuries was even more significant. Due to the pandemic, more employees worked from their home office. However, at Sartorius work in production and logistics increased during the reporting year. This underlines the effects of our actions aimed at increasing occupational safety. There were no accidents with serious outcomes or fatal accidents at any of our sites, which corroborates the high quality of the safety management system.
Sartorius has received awards at several sites for its safety concept during the Covid-19 pandemic. Sartorius was the first company in Tunisia to get the Apave Certification Safe & Clean label for its actions to protect the health and safety of its employees during the pandemic. The site in Bangalore was also commended for its safety concept: the Confederation of Indian Industries (CII) awarded ‘Gold’ for the measures.
Work-Related Injuries1, 2
2020 2019
Recordable work-related injuries 145 253
Relative frequency of work-related injuries per 1,000,000 theoretical working hours 8.2 16.6
Work-related injuries with a serious outcome3 0 0
Fatal occupational accidents 0 0
1 Companies acquired during the year are not included and, in accordance with the reporting guideline, will not be reported until the next reporting year. The two sales companies in the Netherlands are not counted.
2 The following employee figures include all employees of the Sartorius Group except for apprentices, interns, permanent absent employees and employees in partial retirement. Employee figures are shown as headcount.
3 An accident with a serious outcome is an accident in which the injured person is not rehabilitated at all or not until six months after the accident.
Sartorius Combined Group Management Report Responsible Business Practices 136
Start
Responsible Business Practices
Compliance
Why it’s important
We regard compliance with applicable laws as self-evident. Beyond this, we have set ourselves the standard of managing our company with integrity.
We are committed to upholding internationally recognized human and labor rights as a basis of our worldwide business operations. A significant task in this regard is to create a common understanding of fair working conditions – at all our sites and in the supply chain.
Our approach
Sartorius conducts its business in compliance with globally accepted ethical standards and applicable national legal requirements. The German Corporate Governance Code defines requirements for management boards and supervisory boards including their interaction with regard to transparency, accounting and auditing and the conduct of annual general meetings. Legal & Compliance reports to the CEO and informs the Supervisory Board in the Audit Committee. Sartorius follows the rules and recommendations of the German Corporate Governance Code in its current version of Monday, December 16, 2019.
Our globally applicable compliance management system is intended to ensure that our Supervisory and Executive Board members, management and employees comply with all legal regulations and codes, and act according to our internal guidelines. The Legal Affairs & Compliance department is responsible for legal consulting, internal auditing, corporate security, data protection, anti-corruption, customs and export control.
A dedicated team has the task of the implementing and enforcing all Group compliance topics. The Sartorius Code of Conduct defines the requirements we place on our employees with respect to responsible conduct. The code helps employees act ethically and in accordance with the law in their daily work. In everything they do, employees are required to ask themselves the following questions: Are my actions legal? Does my conduct correspond to our values and guidelines? Is it free of personal interests (that are not covered by labor-law regulations)? Will it stand up to public scrutiny? The Code of Conduct covers compliance with international social and environmental standards, general rules of conduct and dealing with conflicts of interest.
The Anti-Corruption Code forms the basis for raising employee awareness about corruption risks. It is also a guideline, instruction manual and aid in taking the necessary action to both prevent and fight corruption at specific companies or in specific sectors. An anti-corruption officer has been appointed by Group management as a contact person for corruption prevention. This officer pursues his or her duties independently.
We ensure that our employees are familiar with the Anti-Corruption Code and the Code of Conduct by asking all employees worldwide every year to take part in an online training course and complete a test at the end of it. The course teaches employees how to deal with ethically or legally problematic situations.
Sartorius Combined Group Management Report Responsible Business Practices 137
Start
A complaint system ensures that employees and external third parties can report cases of damaging conduct, such as corruption, discrimination or sexual harassment. The compliance team can be contacted face-to-face, via a telephone hotline, the department’s electronic mailbox or – in the case of anonymous reports – the whistleblower system. The relevant contact options are listed on the intranet and are thus available company-wide. They are also available on the company’s website and can thus be accessed by external persons concerned.
During the reporting year, a Global Regulatory Affairs Committee was established, with members from Compliance, Regulatory Affairs, Quality, Product Development, Procurement, EHS and Corporate Responsibility. The committee meets regularly to monitor new legal initiatives in the various units and to create the corresponding structures in the company.
Our performance
During the period under review, 3,530 employees from 33 countries completed training for the Anti-Corruption Code and 3,592 employees from 32 countries completed training for the Code of Conduct. The hours spent on training amounted to 2,155 for the Code of Conduct and 2,118 for the Anti-Corruption Code. Compliance training course are currently available in German, English, French and Chinese.
No significant fines or non-monetary penalties resulting from violations of laws or regulations were imposed in the reporting year. Three suspected corruption cases were reported, two of which are currently under investigation, while the third proved to be unsubstantiated.
Three suspected cases of discrimination were reported during the period under review. No cases of discrimination were determined during the reporting period.
Supply Chain
Why it’s important
Respect for human rights, the maintenance of high environmental standards and good, safe and fair working conditions for the production of our products is important to us, and apply to sites outside our own production as well. With more than 8,000 suppliers in more than 40 countries and a purchasing volume that corresponds to about 40 percent of our sales revenue1, it is obvious that our upstream supply chain is important for us to implement these goals. In addition, a growing number of laws and requirements regulate the assumption of responsibility in global supply chains.
Moreover, the value chains for pharmaceuticals are very sensitive and are the focus of many stakeholders. In particular, patients at the end of the supply chain are dependent on their medications being available and safe at all times.
1 Sales and purchasing volume in 2019.
Sartorius Combined Group Management Report Responsible Business Practices 138
Start
Our approach
We take a close look at our suppliers. Since January 2020, we have been examining the compliance with our requirements regarding sustainability in the production process.
In the process, our Code of Conduct for business partners is the basis for collaboration with our business partners throughout the Group. Our requirements with regard to the environment, social matters and governance are defined in the Code. Since December 2019, acknowledgment of the Code of Conduct is part of the acceptance process for new suppliers. In 2020, we began systematically reviewing whether our existing suppliers have acknowledged the Code and, if not, asking them to do so. In some cases, a supplier's similar Code of Conduct can replace our Code of Conduct. The review process will be completed during 2021.
Sartorius will review whether and to what extent suppliers actually breach the required ESG standards, using an approach comprising various components. A guideline to document the process is being developed at present.
For suppliers who are very relevant for our business processes and/or a high purchasing volume, we work together with the external sustainability assessment platform EcoVadis. The external ESG assessment is based on a self-assessment, a review of the associated documents and information from external sources. EcoVadis reviews 21 indicators in the areas of environment, labor and human rights, ethics and sustainable procurement.
Beginning in 2021, Sartorius quality auditors will systematically conduct ESG quick checks within the scope of all planned quality audits in the suppliers’ production plants. For this purpose, Sartorius put its sustainability requirements into a questionnaire. This will be provided to suppliers before the audit. During on-site auditing of suppliers’ production plants, compliance with the requirements of our Code of Conduct for Business Partners is reviewed on the basis of the questionnaire. The first ESG quick checks were already carried out during the year under review.
The objective of all measures is to initiate actual improvements in the working, social and environmental standards of our suppliers. Sartorius Management is involved in shaping the process via the Corporate Responsibility Steering Committee and is informed about the progress being made.
We do not establish business relationships with suppliers where we see a considerable risk of child, forced or mandatory labor, other breaches of human rights or negative impacts on society, and will end any existing relationships with such suppliers. This procedure is also defined in our new process for sustainability in the supply chain.
During the Covid-19 pandemic, we are focusing on securing our delivery capabilities. This is very important considering the validated production processes of our customers. This is why we manage stocks of raw materials and finished products actively and maintain high levels of safety stock.
Sartorius Combined Group Management Report Responsible Business Practices 139
Start
Our performance
In 2020, we asked 168 suppliers to agree to an external sustainability assessment by EcoVadis. In the reporting year, we had 81 assessments, covering about 30 percent of the purchasing volume1. In 2021, we will be talking with suppliers who refused an EcoVadis assessment or whose assessment has expired.
In the reporting year, due to the pandemic, the number of ESG quick checks carried out by Sartorius itself within the scope of quality audits was very limited; the same applies to processes still being designed. Four ESG quick checks were carried out; however, due to the Covid-19 -related travel restrictions, all audited suppliers are based in Germany. Further ESG quick checks planned for 2020 will be conducted in 2021.
We will use the results of the EcoVadis assessments and the ESG quick checks to develop our internal process in 2021.
Human Rights
Why it’s important
The United Nations Guiding Principles on Business and Human Rights clarify the responsibility of states and businesses to protect and respect human rights. The focus is therefore not only on preventing infringements of human rights, but also the positive contribution that a business can make through its activities that promote the protection of human rights.
Sartorius pursues the goal of taking the highest possible level of care to prevent breaches of human rights within its sphere of influence.
Our approach
In line with the UN Guiding Principles on Business and Human Rights, we respect and support the implementation of the values of the International Bill of Human Rights, the OECD Guidelines for Multinational Enterprises and the International Labour Organization (ILO) Declaration on Fundamental Principles and Rights at Work, by committing ourselves to regard these internationally recognized human rights as relevant for our operations. We respect the laws of the countries in which we operate.
A Policy Statement on Human Rights has been communicated to employees via the intranet since February 2019 and is also available to all stakeholders on the Internet.
Sartorius’ Policy Statement on Human Rights is binding on the entire Group and applies worldwide. It requires all employees to observe appropriate, fair, and lawful conduct towards other employees, business partners, and the local community. We expect our business partners, suppliers, customers and cooperation partners to operate their business in line with correspondingly high ethical standards.
Sartorius’ Code of Conduct and the Code of Conduct for business partners address the content of Sartorius’ Policy Statement on Human Rights and puts it into concrete terms for everyday work. In annual online training
1 Purchasing volume in 2019.
Sartorius Combined Group Management Report Responsible Business Practices 140
Start
courses about Sartorius’ Code of Conduct, Sartorius employees strengthen their knowledge of the content and check it in the subsequent online test.
The complaint system described on page 137 ensures that topics with human rights relevance can be reported – even anonymously if the person so wishes.
During the period under review, an interdisciplinary working group was established to review the processes and adapt them where necessary in order to fulfill the requirements of the new Duty of Care Act to ensure that human rights are observed in the global supply chains.
The Executive Board becomes involved in handling reported incidents on a case-by-case basis.
Our performance
If the company's performance and the success of the concepts in relation to human rights are to be made measurable, it is necessary to define specific quantitative indicators. In this process it is important to consider the influence of factors outside the company’s sphere on the indicators. For example, actions by local government heads could be outside Sartorius’ sphere of influence.
Sartorius has started defining which indicators could be relevant and reports on these in the respective sections. For our approach, we looked at the entire spectrum of human rights, how they are defined in the International Bill of Human Rights and the International Labour Organization (ILO) Declaration on Fundamental Principles and Rights at Work and then considered which of these human rights could be influenced relevantly in the context of our business operations. In the next step, we reviewed our existing reporting system for indicators that would be suitable for making this influence visible. We will complete the analysis in the coming year and then consider including more indicators.
In the reporting year, we report on the right to work in the section on “Finding and Retaining Talented Young Staff” and via the indicator “New Hires by Region, Gender and Age Group”. We report on the right to education in the same section via the indicator “Training Hours by Region and Gender”. We report on the right to an achievable maximum level of physical and mental health in the sections “Innovation & Social Contribution” and “Occupational Health and Safety” and via the indicator “Work-Related Injuries”.
A comprehensive report can also be found in the separately published GRI Report. This is more detailed information that is not required within the scope of the non-financial Group statement.
Sartorius Combined Group Management Report Environment 141
Start
Environment
Energy Consumption and Emissions
Why it’s important
Advancing climate change is a challenge that concerns everyone. We see it as our duty to make a contribution towards the decarbonization of the economy.
Sartorius produces in 28 production companies and consumes the corresponding energy and causes emissions in these companies. Overall, we classify the environmental impact of our activities as comparatively low. However, we are also aware of our responsibility for the environment and set high standards for environmental protection.
Our approach
In our Environmental Position, we define the basic principles and core topics of our environmental management system. Sartorius’ Environmental Position is binding on all the companies and sites of the Sartorius Group. It has been communicated to all our employees via the intranet and the company website, and supports us in anchoring efficiency and environmental awareness in our daily business. In constructing new facilities, we follow recognized standards for sustainable building.
An ISO 14001 -certified environmental management system has been established in the two largest companies in Göttingen (Germany) and Aubagne (France), Bangalore (India), Cergy (France), Guxhagen (Germany), Helsinki and Kajaani (Finland), Mohamdia (Tunisia), Beijing (China), Shanghai (China) and Yauco (Puerto Rico). Consequently, 39% of the production companies fulfill the requirements of the international standard ISO 14001 and 70% of the employees in production companies work according to this standard.
Nineteen of our production companies are also certified according to the quality standard ISO 9001. This means that 88% of the employees of our production companies work according to this standard. These standards ensure that we comply with quality requirements in the manufacture of our products, exercise care with the resources we use, and prevent environmental risks. We also operate an energy management system in accordance with ISO 50001 at four German facilities. In relation to the number of employees at these plants, this represents 38% of all our production sites.
In the reporting year, Sartorius prepared a balance of its CO2 emissions and set science-based targets for the Scope 1 and 2 emissions, which are based on the 1.5°C target and the Science Based Targets (SBT). For Scope 3 emissions, we have set a qualitative target to reduce the emissions. A reduction target is deemed to be science-based if, according to current scientific findings, it is suitable for limiting global warming to 1.5°C according to the Paris Agreement. By 2030, Sartorius will reduce its direct emissions and emissions from bought-in energy by around 45 percent in comparison to 2019. Next year, a decision will be made on whether to report the targets to the Science Based Targets initiative (SBTi).
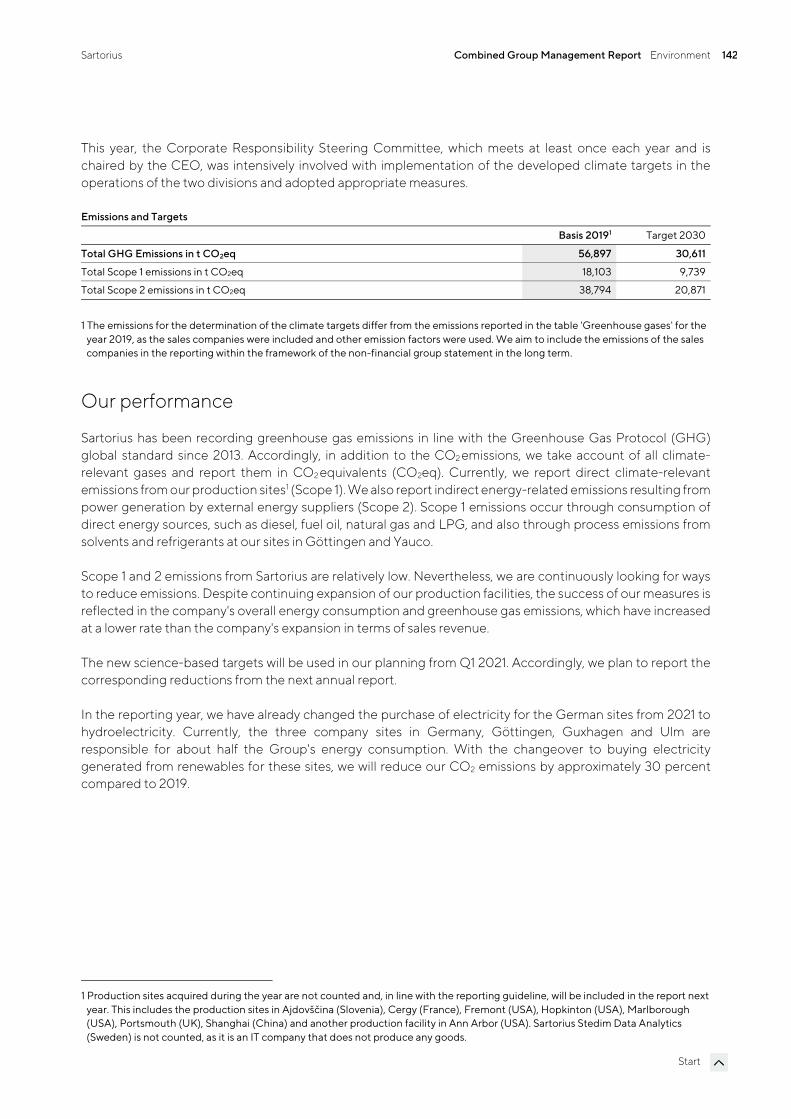
Sartorius Combined Group Management Report Environment 142
Start
This year, the Corporate Responsibility Steering Committee, which meets at least once each year and is chaired by the CEO, was intensively involved with implementation of the developed climate targets in the operations of the two divisions and adopted appropriate measures.
Emissions and Targets
Basis 20191 Target 2030
Total GHG Emissions in t CO2eq 56,897 30,611
Total Scope 1 emissions in t CO2eq 18,103 9,739
Total Scope 2 emissions in t CO2eq 38,794 20,871
1 The emissions for the determination of the climate targets differ from the emissions reported in the table 'Greenhouse gases' for the year 2019, as the sales companies were included and other emission factors were used. We aim to include the emissions of the sales companies in the reporting within the framework of the non-financial group statement in the long term.
Our performance
Sartorius has been recording greenhouse gas emissions in line with the Greenhouse Gas Protocol (GHG) global standard since 2013. Accordingly, in addition to the CO2 emissions, we take account of all climate-relevant gases and report them in CO2 equivalents (CO2eq). Currently, we report direct climate-relevant emissions from our production sites1 (Scope 1). We also report indirect energy-related emissions resulting from power generation by external energy suppliers (Scope 2). Scope 1 emissions occur through consumption of direct energy sources, such as diesel, fuel oil, natural gas and LPG, and also through process emissions from solvents and refrigerants at our sites in Göttingen and Yauco.
Scope 1 and 2 emissions from Sartorius are relatively low. Nevertheless, we are continuously looking for ways to reduce emissions. Despite continuing expansion of our production facilities, the success of our measures is reflected in the company's overall energy consumption and greenhouse gas emissions, which have increased at a lower rate than the company's expansion in terms of sales revenue.
The new science-based targets will be used in our planning from Q1 2021. Accordingly, we plan to report the corresponding reductions from the next annual report.
In the reporting year, we have already changed the purchase of electricity for the German sites from 2021 to hydroelectricity. Currently, the three company sites in Germany, Göttingen, Guxhagen and Ulm are responsible for about half the Group's energy consumption. With the changeover to buying electricity generated from renewables for these sites, we will reduce our CO2 emissions by approximately 30 percent compared to 2019.
1 Production sites acquired during the year are not counted and, in line with the reporting guideline, will be included in the report next year. This includes the production sites in Ajdovščina (Slovenia), Cergy (France), Fremont (USA), Hopkinton (USA), Marlborough (USA), Portsmouth (UK), Shanghai (China) and another production facility in Ann Arbor (USA). Sartorius Stedim Data Analytics (Sweden) is not counted, as it is an IT company that does not produce any goods.
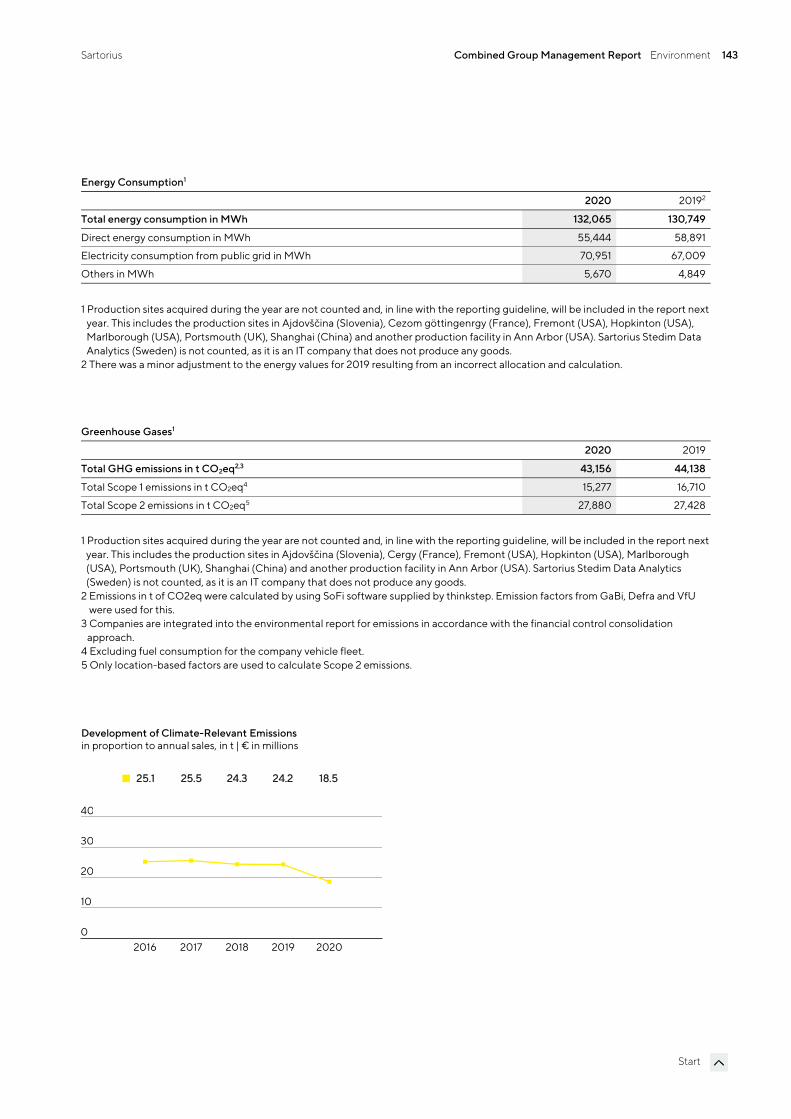
Sartorius Combined Group Management Report Environment 143
Start
Energy Consumption1
2020 20192
Total energy consumption in MWh 132,065 130,749
Direct energy consumption in MWh 55,444 58,891
Electricity consumption from public grid in MWh 70,951 67,009
Others in MWh 5,670 4,849
1 Production sites acquired during the year are not counted and, in line with the reporting guideline, will be included in the report next year. This includes the production sites in Ajdovščina (Slovenia), Cezom göttingenrgy (France), Fremont (USA), Hopkinton (USA), Marlborough (USA), Portsmouth (UK), Shanghai (China) and another production facility in Ann Arbor (USA). Sartorius Stedim Data Analytics (Sweden) is not counted, as it is an IT company that does not produce any goods.
2 There was a minor adjustment to the energy values for 2019 resulting from an incorrect allocation and calculation.
Greenhouse Gases1
2020 2019
Total GHG emissions in t CO2eq2,3 43,156 44,138
Total Scope 1 emissions in t CO2eq4 15,277 16,710
Total Scope 2 emissions in t CO2eq5 27,880 27,428
1 Production sites acquired during the year are not counted and, in line with the reporting guideline, will be included in the report next year. This includes the production sites in Ajdovščina (Slovenia), Cergy (France), Fremont (USA), Hopkinton (USA), Marlborough (USA), Portsmouth (UK), Shanghai (China) and another production facility in Ann Arbor (USA). Sartorius Stedim Data Analytics (Sweden) is not counted, as it is an IT company that does not produce any goods.
2 Emissions in t of CO2eq were calculated by using SoFi software supplied by thinkstep. Emission factors from GaBi, Defra and VfU were used for this.
3 Companies are integrated into the environmental report for emissions in accordance with the financial control consolidation approach.
4 Excluding fuel consumption for the company vehicle fleet. 5 Only location-based factors are used to calculate Scope 2 emissions.
2016 2017 2018 2019 20200
10
20
30
40
Development of Climate-Relevant Emissions
25.1 25.5 24.3 24.2 18.5
in proportion to annual sales, in t | € in millions
Sartorius Combined Group Management Report Environment 144
Start
Product Stewardship
Why it’s important
Environmental responsibility concerns not just our value creation; it has an impact on our products, too.
Sartorius generates almost two thirds of its sales revenue with sterile products that are used in biopharmaceutical research where they ensure the safety, efficiency and ecological compatibility of the processes. While filters are cellulose-based, filter housings, bags and pipette tips are made from polymers. Although biopharmaceutical disposable technology makes up just 0.01 percent of the annual volume of plastic waste, the continuous market growth increasingly raises the issue of responsible handling of materials in this industry too.
Basically, the production and sale of consumables prompts questions about the product end of life. Increasing customer demands and stricter statutory regulations have also resulted in aspects of the circular economy becoming more important.
Our approach
In 2019, management decided to develop a comprehensive Sartorius plastic strategy, as, in addition to the numerous advantages of the sterile products, we also see potential to reduce our impact on natural resources in this area. Materials that are designed to be recycled and material flows will play an important role in this regard.
With our strategy we are addressing three dimensions: end of product life, plastic waste in our own business operations and packaging. During the reporting year, our Corporate Responsibility Steering Committee was involved in implementing the developed targets in the two operational divisions. Among other things, this includes reducing waste in production, designing packaging so that it can be recycled better, developing appropriate methods for recycling after the usage phase of contaminated and non-contaminated products and improved data management to control and measure the success of the activities.
In the period under review, Sartorius was the first company in its industry to sign the European Plastics Pact. The aim of this public-private initiative is to improve the use and recycling of plastics and, as a consequence, use less virgin plastic. With cross-border cooperation agreements on a European level, the signatories want to develop new technologies, share their findings, harmonize guidelines and standards and dismantle existing barriers. As a cooperation on an international level, the European Plastics Pact fits well with our proactive sustainability approach.
Since October 2020, Sartorius also has a seat on the board of the Bio-Process Systems Alliance (BPSA). The BPSA is and industry-led non-profit company established to promote the use of reliable, safe and sustainable technologies in bioprocesses – for instance, by developing standards and guidelines throughout the entire supply chain. In this way, Sartorius pursues the goal of introducing more sustainability considerations in the industry.
However, sustainability in biotechnological production is not just concerned with the use and recycling of plastics, but also takes into account the efficiency and productivity of processes. For example, technological innovations enable process optimizations in the production of larger volumes of active pharmaceutical ingredients. Sartorius continuously develops its products with this in mind and helps its customers design their production processes in a more sustainable manner. Sartorius deals intensively with the issue of how its
Sartorius Combined Group Management Report Environment 145
Start
customers can produce more sustainably by modifying the process parameters. For this purpose, Sartorius is involved in the National Institute for Innovation in Manufacturing Biopharmaceuticals (NIMBL).
Our performance
Development of the Sartorius plastics strategy was completed at the end of October 2020 and a start was made on integrating the targets into the operational divisions. We will be reporting on the results that we have achieved in the next non-financial Group statement.
We started various projects during the year under review, such as reducing packaging waste, recycling production waste and strategies for product end of life:
Filters are a key product in the Bioprocess Solution Division. With the packaging redesign in the reporting year, Sartorius pursued its plastics and climate strategy and minimized the ecological impact of the packaging. Compared to the previous model, a significant amount of material was saved and the weight was reduced considerably. The result is 55 to 60 percent less waste. In addition, unavoidable waste is completely recyclable. Packaging dimensioning was also adapted and optimized for logistics.
Sartorius uses ultra-pure plastic film to produce disposable bags for use in bioprocesses. Two of our three film families are suitable for mechanical recycling. At the Aubagne site, waste material produced during bag production is collected, shredded and used in other applications, such as packaging.
Sartorius Combined Group Management Report Report of the Independent Auditor 146
Start
Report of the Independent Auditor
Limited Assurance Report of the Independent Auditor regarding the Non-financial Group Statement1
To the Supervisory Board of Sartorius AG, Göttingen
We have performed an independent limited assurance engagement on the Non-financial Group Statement of Sartorius AG, Göttingen (further „Sartorius AG“) and the group as well as the by reference qualified parts “Structure and Management of the Group” as well as “Business Model, Strategy and Goals” (further: „Report“) according to § 315b German Commercial Code (HGB) for the period from January 1 to December 31, 2020.
As disclosed in the report on page 138 -139, 81 ESG assessments of suppliers were conducted by EcoVadis as well as four ESG quick checks of suppliers production sites were conducted within quality audits by Sartorius to ensure compliance with the environmental, social and health standards. The appropriateness and accuracy of the conclusions from the audit and assessment work performed was not part of our limited assurance procedures.
Management’s Responsibility
The legal representatives of Sartorius AG are responsible for the preparation of the Report in accordance with §§ 315b, 315c in conjunction with 289c to 289e HGB.
This responsibility of the legal representatives includes the selection and application of appropriate methods to prepare the Report and the use of assumptions and estimates for individual disclosures which are reasonable under the given circumstances. Furthermore, the legal representatives are responsible for the internal controls they deem necessary for the preparation of the Report that is free of – intended or unintended – material misstatements.
Practitioner’s Responsibility
It is our responsibility to express a conclusion on the Report based on our work performed within our limited assurance engagement.
We conducted our work in the form of a limited assurance engagement in accordance with the International Standard on Assurance Engagements (ISAE) 3000 (Revised): “Assurance Engagements other than Audits or Reviews of Historical Financial Information” published by IAASB. Accordingly, we have to plan and perform the assurance engagement in such a way that we obtain limited assurance as to whether any matters have come to our attention that cause us to believe that the Report of the Company for the period from January 1 to December 31, 2020 has not been prepared, in all material respects, in accordance with §§ 315b, 315c in conjunction with 289c to 289e HGB. We do not, however, issue a separate conclusion for each disclosure. In a limited assurance engagement the evidence gathering procedures are more limited than in a reasonable
1 Our Engagement applied to the German version of the Statement 2020. This text is a translation of the Independent Assurance Report issued in German language, whereas the German text is authorative.
Sartorius Combined Group Management Report Report of the Independent Auditor 147
Start
assurance engagement and therefore significantly less assurance is obtained than in a reasonable assurance engagement. The choice of audit procedures is subject to the auditor’s own judgement.
Within the scope of our engagement, we performed amongst others the following assurance procedures:
Inquiries of personnel on group level, who are responsible for the materiality analysis, in order to gain an understanding of the processes for determining material topics and respective reporting boundaries for Sartorius AG
A risk analysis, including a media search, to identify relevant information on Sartorius AG’s sustainability performance in the reporting period
Reviewing the suitability of internally developed Reporting Criteria
Evaluation of the design and the implementation of systems and processes for the collection, processing and monitoring of disclosures, including data consolidation, on environmental, employee and social matters, respect for human rights, and anti-corruption and bribery matters
Inquiries of personnel on group level who are responsible for determining disclosures on concepts, due diligence processes, results and risks, performing internal controls functions and consolidating disclosures
Inspection of selected internal and external documents
Analytical procedures for the evaluation of data and of the trends of quantitative disclosures as reported at group level by all sites
Evaluation of local data collection, validation and reporting processes as well as the reliability of reported data based on a sample of the sites in Göttingen (Germany) and Yauco (Puerto Rico)
Assessment of the overall presentation of the disclosures
In our opinion, we obtained sufficient and appropriate evidence for reaching a conclusion for the assurance engagement.
Independence and Quality Assurance on the Part of the Auditing Firm
In performing this engagement, we applied the legal provisions and professional pronouncements regarding independence and quality assurance, in particular the Professional Code for German Public Auditors and Chartered Accountants (in Germany) and the quality assurance standard of the German Institute of Public Auditors (Institut der Wirtschaftsprüfer, IDW) regarding quality assurance requirements in audit practice (IDW QS 1).
Conclusion
Based on the procedures performed and the evidence obtained, nothing has come to our attention that causes us to believe that the Report of Sartorius AG for the period from January 1 to December 31, 2020 has not prepared, in all material respects, in accordance with §§ 315b, 315c in conjunction with 289c to 289e HGB.

Sartorius Combined Group Management Report Report of the Independent Auditor 148
Start
Restriction of Use / Clause on General Engagement Terms
This assurance report is issued for purposes of the Supervisory Board of Sartorius AG, Göttingen registered office only. We assume no responsibility with regard to any third parties.
Our assignment for the Supervisory Board of Sartorius AG, Göttingen and professional liability as described above was governed by the General Engagement Terms for Wirtschaftsprüfer and Wirtschafts-prüfungsgesellschaften (Allgemeine Auftragsbedingungen für Wirtschaftsprüfer und Wirtschafts-prüfungsgesellschaften) in the version dated January 1, 2017 (https://www.kpmg.de/bescheinigungen /lib/aab_english.pdf). By reading and using the information contained in this assurance report, each recipient confirms notice of the provisions contained therein including the limitation of our liability as stipulated in No. 9 and accepts the validity of the General Engagement Terms with respect to us.
Munich, February 5, 2021
KPMG AG Wirtschaftsprüfungsgesellschaft
Hell ppa. Dollhofer

Consolidated Financial Statements and Notes
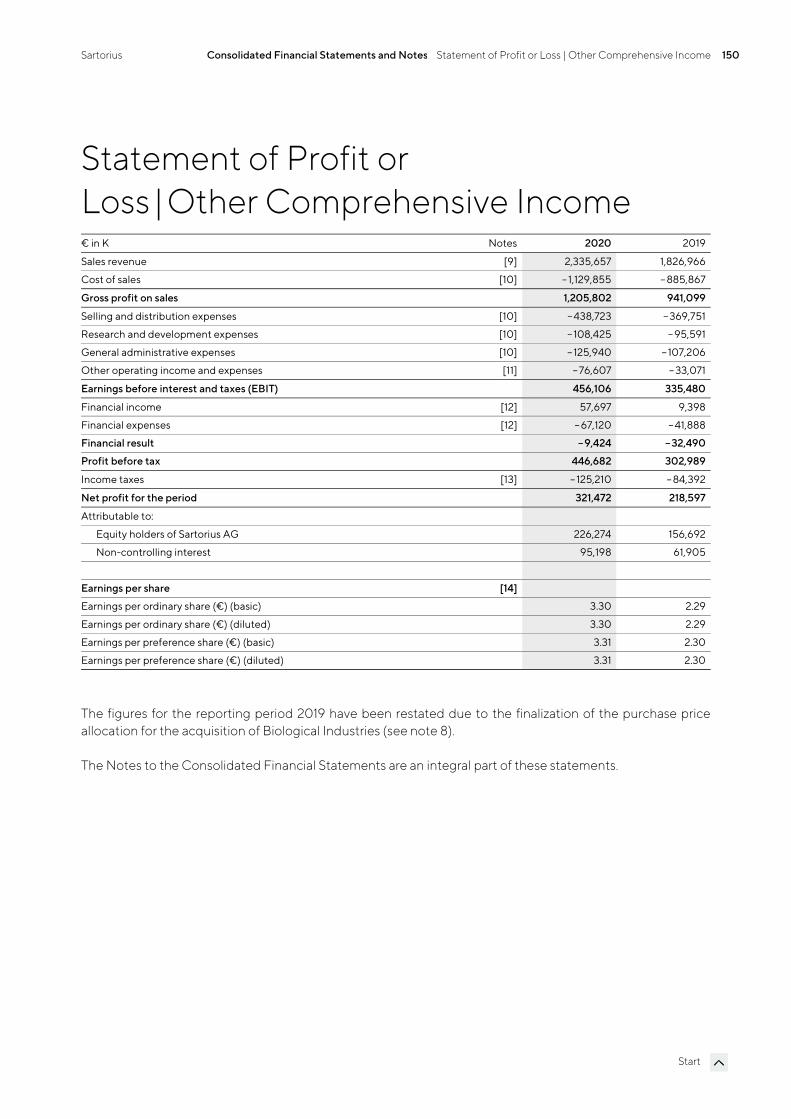
Sartorius Consolidated Financial Statements and Notes Statement of Profit or Loss | Other Comprehensive Income 150
Start
Statement of Profit or Loss |Other Comprehensive Income € in K Notes 2020 2019
Sales revenue [9] 2,335,657 1,826,966
Cost of sales [10] – 1,129,855 – 885,867
Gross profit on sales 1,205,802 941,099
Selling and distribution expenses [10] –438,723 – 369,751
Research and development expenses [10] – 108,425 – 95,591
General administrative expenses [10] – 125,940 – 107,206
Other operating income and expenses [11] – 76,607 – 33,071
Earnings before interest and taxes (EBIT) 456,106 335,480
Financial income [12] 57,697 9,398
Financial expenses [12] – 67,120 – 41,888
Financial result –9,424 –32,490
Profit before tax 446,682 302,989
Income taxes [13] – 125,210 – 84,392
Net profit for the period 321,472 218,597
Attributable to:
Equity holders of Sartorius AG 226,274 156,692
Non-controlling interest 95,198 61,905
Earnings per share [14]
Earnings per ordinary share (€) (basic) 3.30 2.29
Earnings per ordinary share (€) (diluted) 3.30 2.29
Earnings per preference share (€) (basic) 3.31 2.30
Earnings per preference share (€) (diluted) 3.31 2.30
The figures for the reporting period 2019 have been restated due to the finalization of the purchase price allocation for the acquisition of Biological Industries (see note 8).
The Notes to the Consolidated Financial Statements are an integral part of these statements.
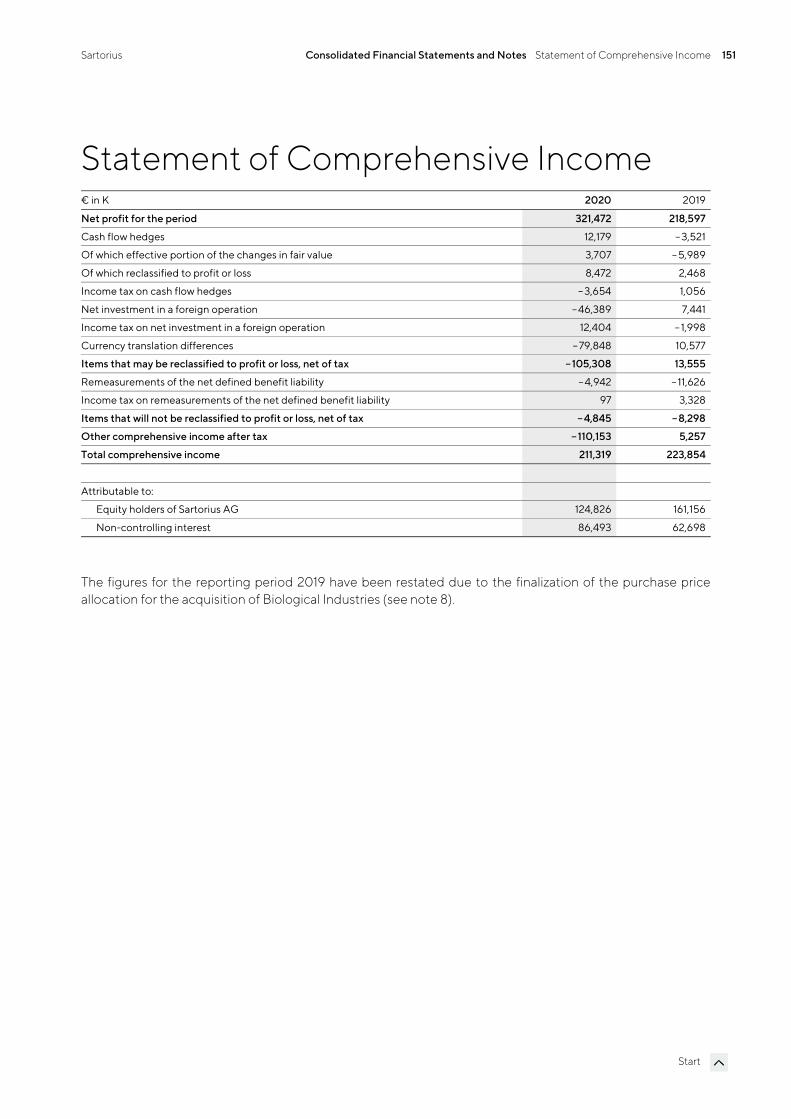
Sartorius Consolidated Financial Statements and Notes Statement of Comprehensive Income 151
Start
Statement of Comprehensive Income € in K 2020 2019
Net profit for the period 321,472 218,597
Cash flow hedges 12,179 – 3,521
Of which effective portion of the changes in fair value 3,707 – 5,989
Of which reclassified to profit or loss 8,472 2,468
Income tax on cash flow hedges – 3,654 1,056
Net investment in a foreign operation –46,389 7,441
Income tax on net investment in a foreign operation 12,404 – 1,998
Currency translation differences – 79,848 10,577
Items that may be reclassified to profit or loss, net of tax –105,308 13,555
Remeasurements of the net defined benefit liability – 4,942 – 11,626
Income tax on remeasurements of the net defined benefit liability 97 3,328
Items that will not be reclassified to profit or loss, net of tax – 4,845 –8,298
Other comprehensive income after tax –110,153 5,257
Total comprehensive income 211,319 223,854
Attributable to:
Equity holders of Sartorius AG 124,826 161,156
Non-controlling interest 86,493 62,698
The figures for the reporting period 2019 have been restated due to the finalization of the purchase price allocation for the acquisition of Biological Industries (see note 8).
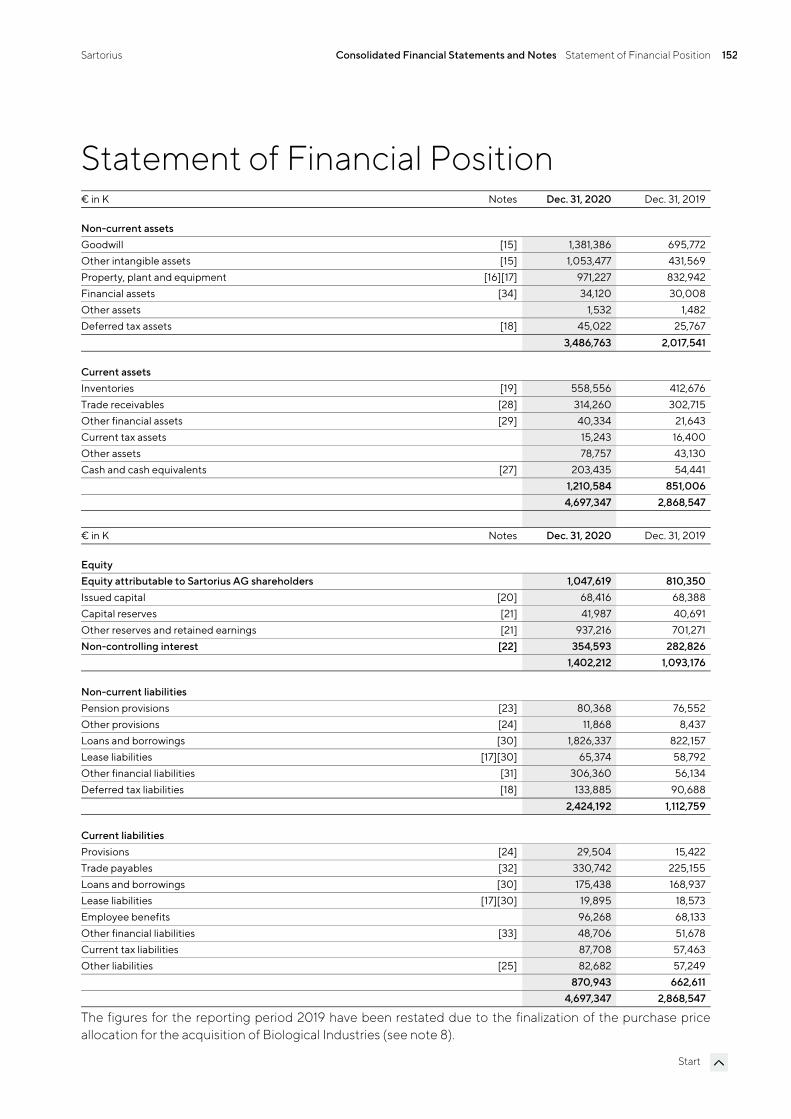
Sartorius Consolidated Financial Statements and Notes Statement of Financial Position 152
Start
Statement of Financial Position € in K Notes Dec. 31, 2020 Dec. 31, 2019
Non-current assets Goodwill [15] 1,381,386 695,772Other intangible assets [15] 1,053,477 431,569Property, plant and equipment [16][17] 971,227 832,942Financial assets [34] 34,120 30,008Other assets 1,532 1,482Deferred tax assets [18] 45,022 25,767
3,486,763 2,017,541
Current assets Inventories [19] 558,556 412,676Trade receivables [28] 314,260 302,715Other financial assets [29] 40,334 21,643Current tax assets 15,243 16,400Other assets 78,757 43,130Cash and cash equivalents [27] 203,435 54,441
1,210,584 851,0064,697,347 2,868,547
€ in K Notes Dec. 31, 2020 Dec. 31, 2019
Equity Equity attributable to Sartorius AG shareholders 1,047,619 810,350Issued capital [20] 68,416 68,388Capital reserves [21] 41,987 40,691Other reserves and retained earnings [21] 937,216 701,271Non-controlling interest [22] 354,593 282,826
1,402,212 1,093,176
Non-current liabilities Pension provisions [23] 80,368 76,552Other provisions [24] 11,868 8,437Loans and borrowings [30] 1,826,337 822,157Lease liabilities [17][30] 65,374 58,792Other financial liabilities [31] 306,360 56,134Deferred tax liabilities [18] 133,885 90,688
2,424,192 1,112,759
Current liabilities Provisions [24] 29,504 15,422Trade payables [32] 330,742 225,155Loans and borrowings [30] 175,438 168,937Lease liabilities [17][30] 19,895 18,573Employee benefits 96,268 68,133Other financial liabilities [33] 48,706 51,678Current tax liabilities 87,708 57,463Other liabilities [25] 82,682 57,249
870,943 662,6114,697,347 2,868,547
The figures for the reporting period 2019 have been restated due to the finalization of the purchase price allocation for the acquisition of Biological Industries (see note 8).
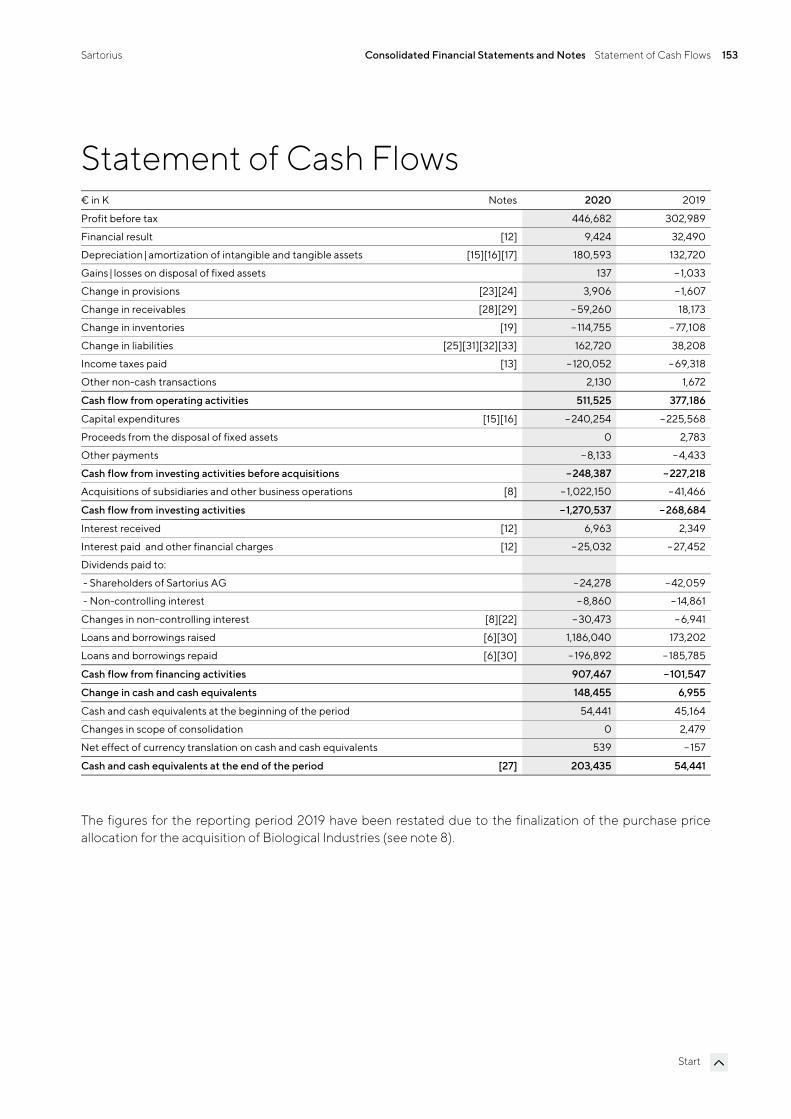
Sartorius Consolidated Financial Statements and Notes Statement of Cash Flows 153
Start
Statement of Cash Flows € in K Notes 2020 2019
Profit before tax 446,682 302,989
Financial result [12] 9,424 32,490
Depreciation| amortization of intangible and tangible assets [15][16][17] 180,593 132,720
Gains | losses on disposal of fixed assets 137 – 1,033
Change in provisions [23][24] 3,906 – 1,607
Change in receivables [28][29] – 59,260 18,173
Change in inventories [19] – 114,755 – 77,108
Change in liabilities [25][31][32][33] 162,720 38,208
Income taxes paid [13] – 120,052 – 69,318
Other non-cash transactions 2,130 1,672
Cash flow from operating activities 511,525 377,186
Capital expenditures [15][16] – 240,254 – 225,568
Proceeds from the disposal of fixed assets 0 2,783
Other payments –8,133 – 4,433
Cash flow from investing activities before acquisitions –248,387 –227,218
Acquisitions of subsidiaries and other business operations [8] –1,022,150 – 41,466
Cash flow from investing activities –1,270,537 –268,684
Interest received [12] 6,963 2,349
Interest paid and other financial charges [12] – 25,032 – 27,452
Dividends paid to:
- Shareholders of Sartorius AG – 24,278 – 42,059
- Non-controlling interest – 8,860 – 14,861
Changes in non-controlling interest [8][22] – 30,473 – 6,941
Loans and borrowings raised [6][30] 1,186,040 173,202
Loans and borrowings repaid [6][30] – 196,892 – 185,785
Cash flow from financing activities 907,467 –101,547
Change in cash and cash equivalents 148,455 6,955
Cash and cash equivalents at the beginning of the period 54,441 45,164
Changes in scope of consolidation 0 2,479
Net effect of currency translation on cash and cash equivalents 539 – 157
Cash and cash equivalents at the end of the period [27] 203,435 54,441
The figures for the reporting period 2019 have been restated due to the finalization of the purchase price allocation for the acquisition of Biological Industries (see note 8).
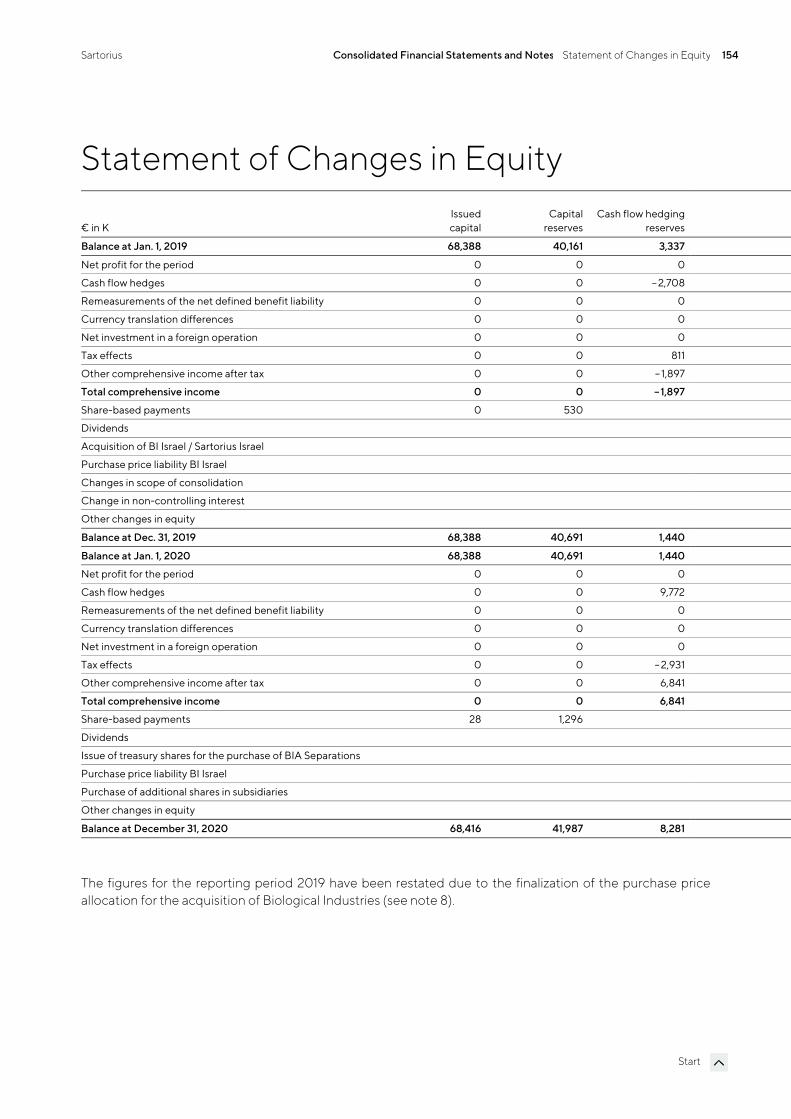
Sartorius Consolidated Financial Statements and Notes Statement of Changes in Equity 154
Start
Statement of Changes in Equity
€ in K Issuedcapital
Capitalreserves
Cash flow hedgingreserves
Balance at Jan. 1, 2019 68,388 40,161 3,337
Net profit for the period 0 0 0
Cash flow hedges 0 0 – 2,708
Remeasurements of the net defined benefit liability 0 0 0
Currency translation differences 0 0 0
Net investment in a foreign operation 0 0 0
Tax effects 0 0 811
Other comprehensive income after tax 0 0 – 1,897
Total comprehensive income 0 0 –1,897
Share-based payments 0 530
Dividends
Acquisition of BI Israel / Sartorius Israel
Purchase price liability BI Israel
Changes in scope of consolidation
Change in non-controlling interest
Other changes in equity
Balance at Dec. 31, 2019 68,388 40,691 1,440
Balance at Jan. 1, 2020 68,388 40,691 1,440
Net profit for the period 0 0 0
Cash flow hedges 0 0 9,772
Remeasurements of the net defined benefit liability 0 0 0
Currency translation differences 0 0 0
Net investment in a foreign operation 0 0 0
Tax effects 0 0 – 2,931
Other comprehensive income after tax 0 0 6,841
Total comprehensive income 0 0 6,841
Share-based payments 28 1,296
Dividends
Issue of treasury shares for the purchase of BIA Separations
Purchase price liability BI Israel
Purchase of additional shares in subsidiaries
Other changes in equity
Balance at December 31, 2020 68,416 41,987 8,281
The figures for the reporting period 2019 have been restated due to the finalization of the purchase price allocation for the acquisition of Biological Industries (see note 8).
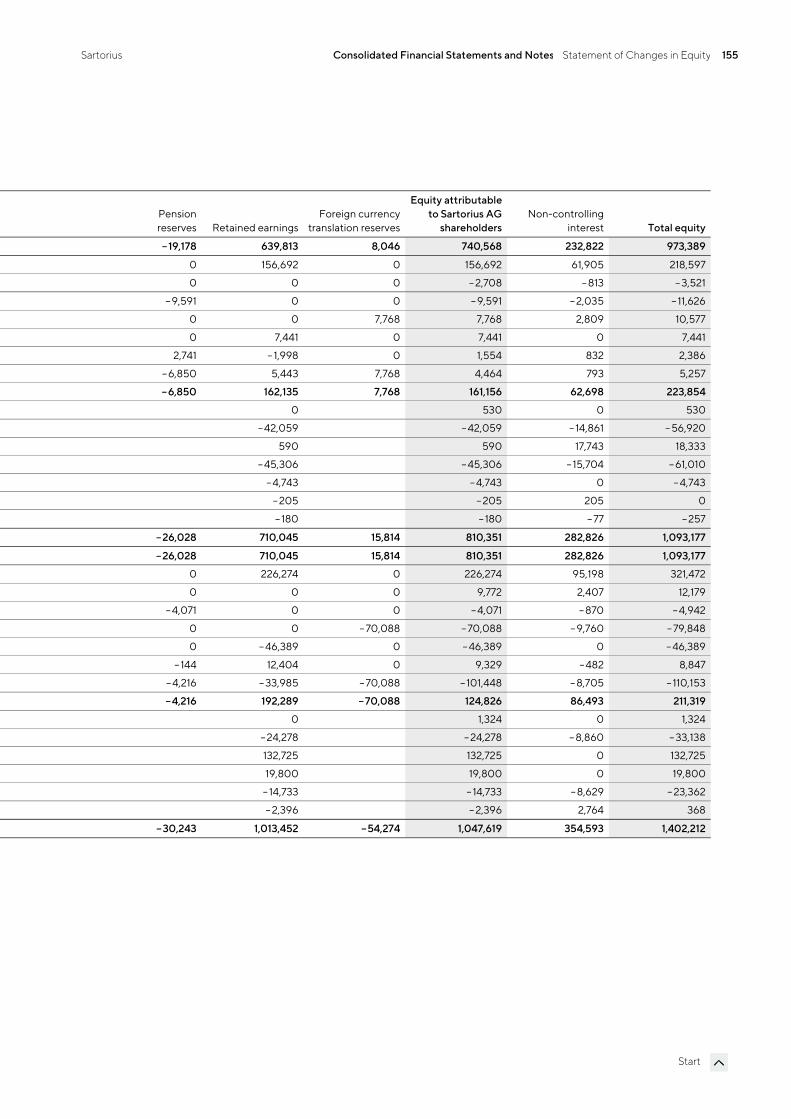
Sartorius Consolidated Financial Statements and Notes Statement of Changes in Equity 155
Start
Pensionreserves Retained earnings
Foreign currency translation reserves
Equity attributable to Sartorius AG
shareholdersNon-controlling
interest Total equity
– 19,178 639,813 8,046 740,568 232,822 973,389
0 156,692 0 156,692 61,905 218,597
0 0 0 – 2,708 – 813 – 3,521
– 9,591 0 0 – 9,591 – 2,035 – 11,626
0 0 7,768 7,768 2,809 10,577
0 7,441 0 7,441 0 7,441
2,741 – 1,998 0 1,554 832 2,386
– 6,850 5,443 7,768 4,464 793 5,257
–6,850 162,135 7,768 161,156 62,698 223,854
0 530 0 530
–42,059 – 42,059 – 14,861 – 56,920
590 590 17,743 18,333
– 45,306 – 45,306 –15,704 – 61,010
– 4,743 – 4,743 0 – 4,743
– 205 – 205 205 0
– 180 – 180 – 77 – 257
–26,028 710,045 15,814 810,351 282,826 1,093,177
–26,028 710,045 15,814 810,351 282,826 1,093,177
0 226,274 0 226,274 95,198 321,472
0 0 0 9,772 2,407 12,179
– 4,071 0 0 – 4,071 – 870 – 4,942
0 0 – 70,088 – 70,088 – 9,760 – 79,848
0 – 46,389 0 – 46,389 0 – 46,389
– 144 12,404 0 9,329 –482 8,847
– 4,216 – 33,985 – 70,088 – 101,448 – 8,705 – 110,153
–4,216 192,289 –70,088 124,826 86,493 211,319
0 1,324 0 1,324
–24,278 – 24,278 – 8,860 – 33,138
132,725 132,725 0 132,725
19,800 19,800 0 19,800
– 14,733 – 14,733 – 8,629 – 23,362
– 2,396 – 2,396 2,764 368
–30,243 1,013,452 –54,274 1,047,619 354,593 1,402,212
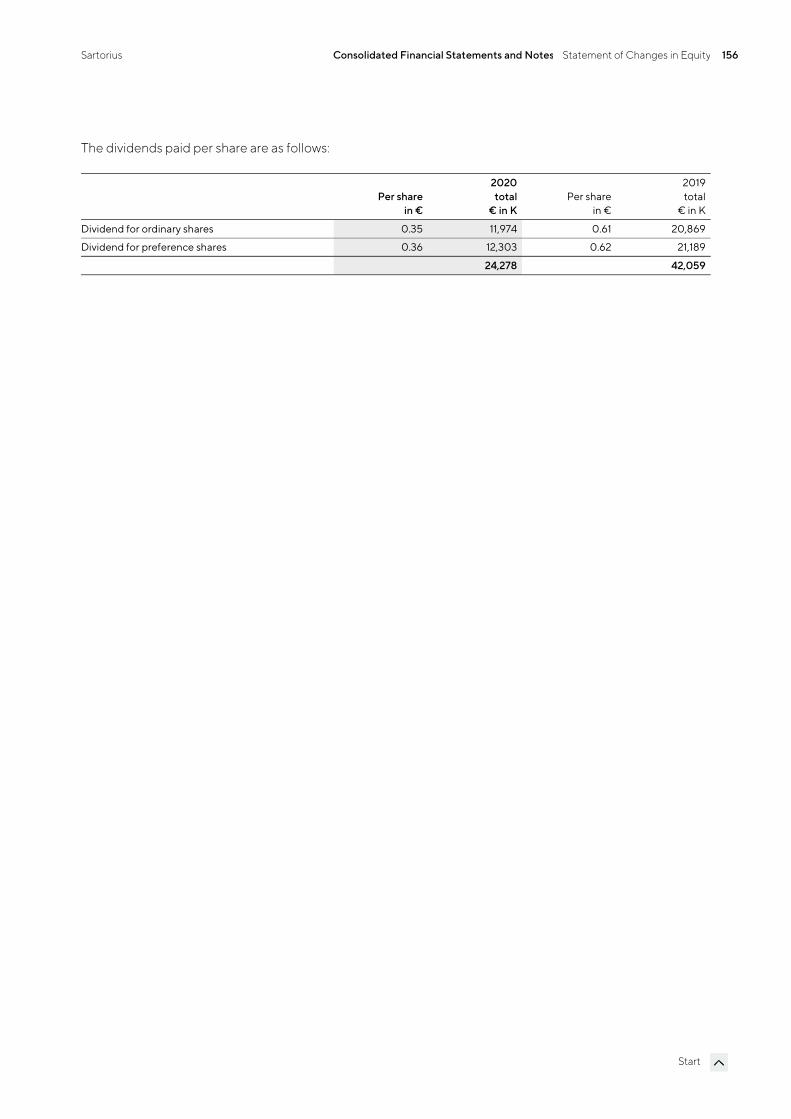
Sartorius Consolidated Financial Statements and Notes Statement of Changes in Equity 156
Start
The dividends paid per share are as follows:
Per sharein €
2020total
€ in KPer share
in €
2019total
€ in K
Dividend for ordinary shares 0.35 11,974 0.61 20,869
Dividend for preference shares 0.36 12,303 0.62 21,189
24,278 42,059
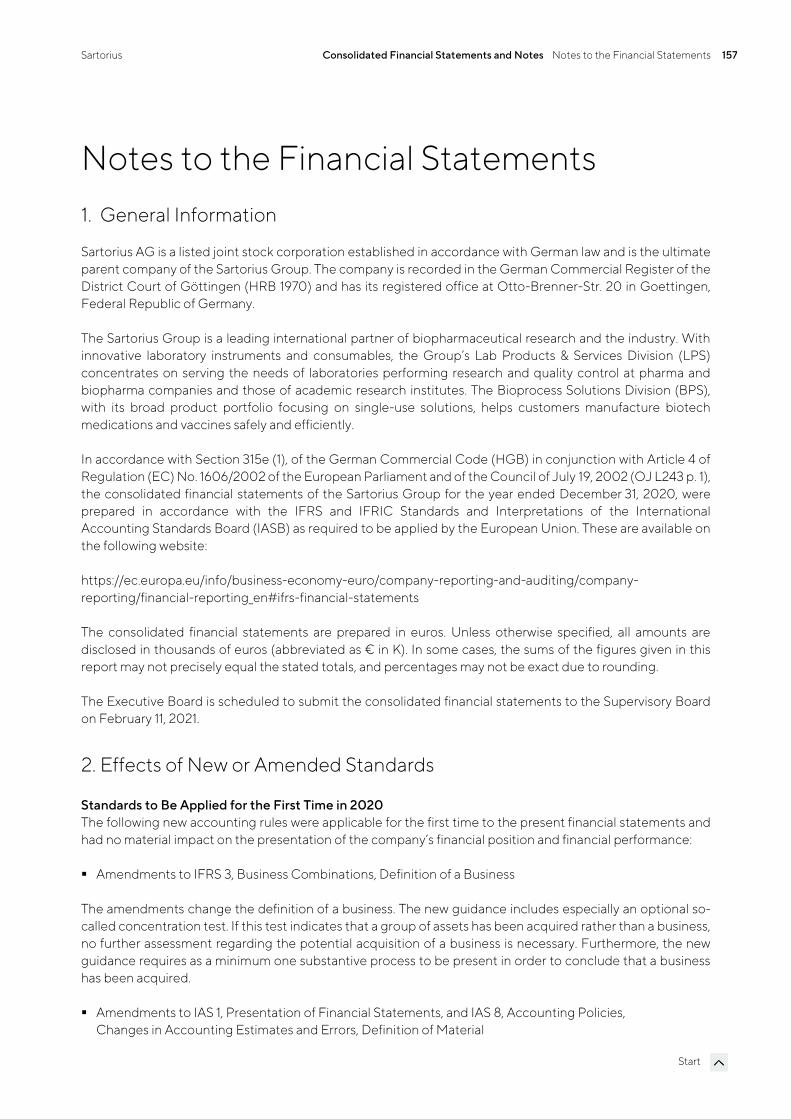
Sartorius Consolidated Financial Statements and Notes Notes to the Financial Statements 157
Start
Notes to the Financial Statements 1. General Information
Sartorius AG is a listed joint stock corporation established in accordance with German law and is the ultimate parent company of the Sartorius Group. The company is recorded in the German Commercial Register of the District Court of Göttingen (HRB 1970) and has its registered office at Otto-Brenner-Str. 20 in Goettingen, Federal Republic of Germany.
The Sartorius Group is a leading international partner of biopharmaceutical research and the industry. With innovative laboratory instruments and consumables, the Group’s Lab Products & Services Division (LPS) concentrates on serving the needs of laboratories performing research and quality control at pharma and biopharma companies and those of academic research institutes. The Bioprocess Solutions Division (BPS), with its broad product portfolio focusing on single-use solutions, helps customers manufacture biotech medications and vaccines safely and efficiently.
In accordance with Section 315e (1), of the German Commercial Code (HGB) in conjunction with Article 4 of Regulation (EC) No. 1606/2002 of the European Parliament and of the Council of July 19, 2002 (OJ L243 p. 1), the consolidated financial statements of the Sartorius Group for the year ended December 31, 2020, were prepared in accordance with the IFRS and IFRIC Standards and Interpretations of the International Accounting Standards Board (IASB) as required to be applied by the European Union. These are available on the following website:
https://ec.europa.eu/info/business-economy-euro/company-reporting-and-auditing/company-reporting/financial-reporting_en#ifrs-financial-statements
The consolidated financial statements are prepared in euros. Unless otherwise specified, all amounts are disclosed in thousands of euros (abbreviated as € in K). In some cases, the sums of the figures given in this report may not precisely equal the stated totals, and percentages may not be exact due to rounding.
The Executive Board is scheduled to submit the consolidated financial statements to the Supervisory Board on February 11, 2021.
2. Effects of New or Amended Standards
Standards to Be Applied for the First Time in 2020 The following new accounting rules were applicable for the first time to the present financial statements and had no material impact on the presentation of the company’s financial position and financial performance:
Amendments to IFRS 3, Business Combinations, Definition of a Business
The amendments change the definition of a business. The new guidance includes especially an optional so-called concentration test. If this test indicates that a group of assets has been acquired rather than a business, no further assessment regarding the potential acquisition of a business is necessary. Furthermore, the new guidance requires as a minimum one substantive process to be present in order to conclude that a business has been acquired.
Amendments to IAS 1, Presentation of Financial Statements, and IAS 8, Accounting Policies, Changes in Accounting Estimates and Errors, Definition of Material
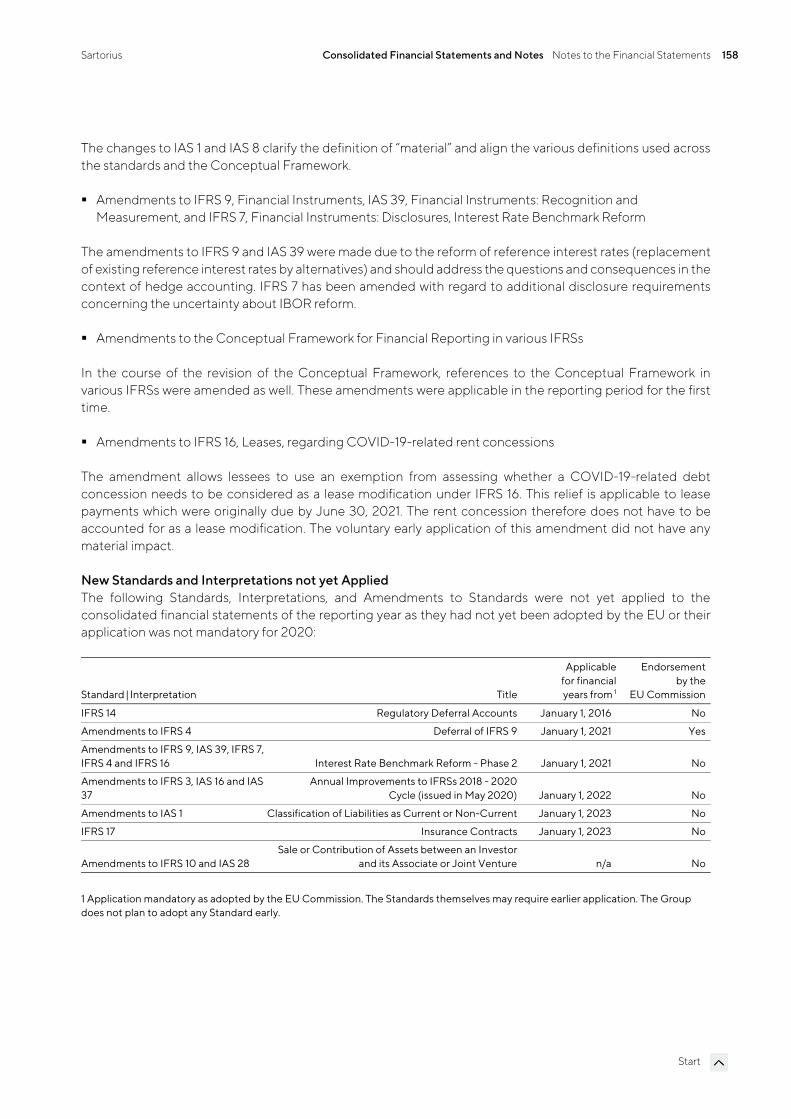
Sartorius Consolidated Financial Statements and Notes Notes to the Financial Statements 158
Start
The changes to IAS 1 and IAS 8 clarify the definition of “material” and align the various definitions used across the standards and the Conceptual Framework.
Amendments to IFRS 9, Financial Instruments, IAS 39, Financial Instruments: Recognition and Measurement, and IFRS 7, Financial Instruments: Disclosures, Interest Rate Benchmark Reform
The amendments to IFRS 9 and IAS 39 were made due to the reform of reference interest rates (replacement of existing reference interest rates by alternatives) and should address the questions and consequences in the context of hedge accounting. IFRS 7 has been amended with regard to additional disclosure requirements concerning the uncertainty about IBOR reform.
Amendments to the Conceptual Framework for Financial Reporting in various IFRSs
In the course of the revision of the Conceptual Framework, references to the Conceptual Framework in various IFRSs were amended as well. These amendments were applicable in the reporting period for the first time.
Amendments to IFRS 16, Leases, regarding COVID-19-related rent concessions
The amendment allows lessees to use an exemption from assessing whether a COVID-19-related debt concession needs to be considered as a lease modification under IFRS 16. This relief is applicable to lease payments which were originally due by June 30, 2021. The rent concession therefore does not have to be accounted for as a lease modification. The voluntary early application of this amendment did not have any material impact.
New Standards and Interpretations not yet Applied The following Standards, Interpretations, and Amendments to Standards were not yet applied to the consolidated financial statements of the reporting year as they had not yet been adopted by the EU or their application was not mandatory for 2020:
Standard | Interpretation Title
Applicable for financial years from 1
Endorsement by the
EU Commission
IFRS 14 Regulatory Deferral Accounts January 1, 2016 No
Amendments to IFRS 4 Deferral of IFRS 9 January 1, 2021 Yes
Amendments to IFRS 9, IAS 39, IFRS 7, IFRS 4 and IFRS 16 Interest Rate Benchmark Reform - Phase 2 January 1, 2021 No
Amendments to IFRS 3, IAS 16 and IAS 37
Annual Improvements to IFRSs 2018 - 2020 Cycle (issued in May 2020) January 1, 2022 No
Amendments to IAS 1 Classification of Liabilities as Current or Non-Current January 1, 2023 No
IFRS 17 Insurance Contracts January 1, 2023 No
Amendments to IFRS 10 and IAS 28 Sale or Contribution of Assets between an Investor
and its Associate or Joint Venture n/a No
1 Application mandatory as adopted by the EU Commission. The Standards themselves may require earlier application. The Group does not plan to adopt any Standard early.
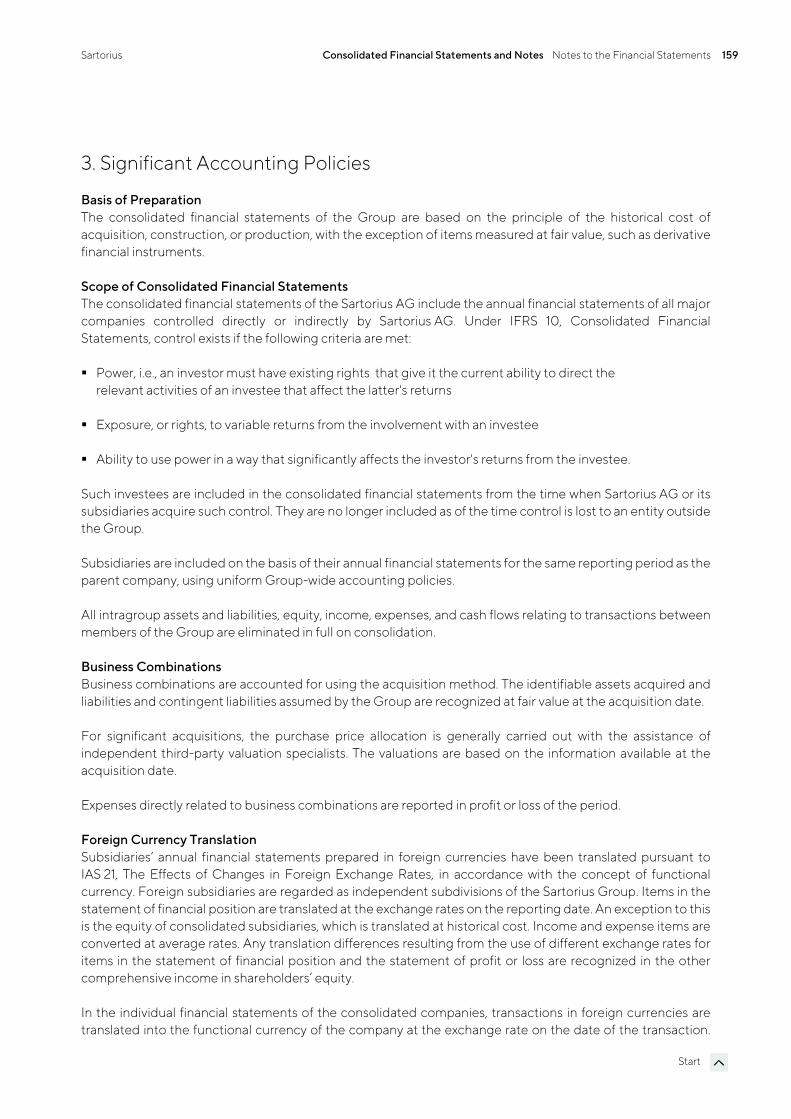
Sartorius Consolidated Financial Statements and Notes Notes to the Financial Statements 159
Start
3. Significant Accounting Policies
Basis of Preparation The consolidated financial statements of the Group are based on the principle of the historical cost of acquisition, construction, or production, with the exception of items measured at fair value, such as derivative financial instruments.
Scope of Consolidated Financial Statements The consolidated financial statements of the Sartorius AG include the annual financial statements of all major companies controlled directly or indirectly by Sartorius AG. Under IFRS 10, Consolidated Financial Statements, control exists if the following criteria are met:
Power, i.e., an investor must have existing rights that give it the current ability to direct the relevant activities of an investee that affect the latter's returns
Exposure, or rights, to variable returns from the involvement with an investee
Ability to use power in a way that significantly affects the investor's returns from the investee.
Such investees are included in the consolidated financial statements from the time when Sartorius AG or its subsidiaries acquire such control. They are no longer included as of the time control is lost to an entity outside the Group.
Subsidiaries are included on the basis of their annual financial statements for the same reporting period as the parent company, using uniform Group-wide accounting policies.
All intragroup assets and liabilities, equity, income, expenses, and cash flows relating to transactions between members of the Group are eliminated in full on consolidation.
Business Combinations Business combinations are accounted for using the acquisition method. The identifiable assets acquired and liabilities and contingent liabilities assumed by the Group are recognized at fair value at the acquisition date.
For significant acquisitions, the purchase price allocation is generally carried out with the assistance of independent third-party valuation specialists. The valuations are based on the information available at the acquisition date.
Expenses directly related to business combinations are reported in profit or loss of the period.
Foreign Currency Translation Subsidiaries’ annual financial statements prepared in foreign currencies have been translated pursuant to IAS 21, The Effects of Changes in Foreign Exchange Rates, in accordance with the concept of functional currency. Foreign subsidiaries are regarded as independent subdivisions of the Sartorius Group. Items in the statement of financial position are translated at the exchange rates on the reporting date. An exception to this is the equity of consolidated subsidiaries, which is translated at historical cost. Income and expense items are converted at average rates. Any translation differences resulting from the use of different exchange rates for items in the statement of financial position and the statement of profit or loss are recognized in the other comprehensive income in shareholders’ equity.
In the individual financial statements of the consolidated companies, transactions in foreign currencies are translated into the functional currency of the company at the exchange rate on the date of the transaction.
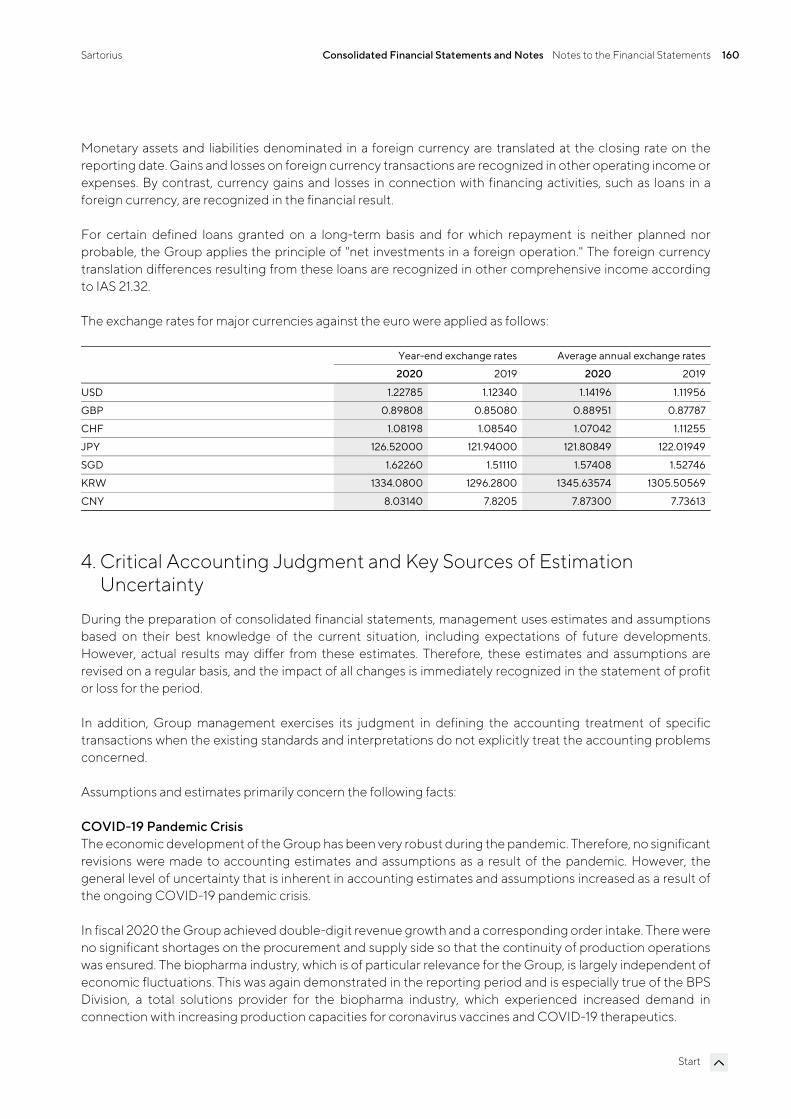
Sartorius Consolidated Financial Statements and Notes Notes to the Financial Statements 160
Start
Monetary assets and liabilities denominated in a foreign currency are translated at the closing rate on the reporting date. Gains and losses on foreign currency transactions are recognized in other operating income or expenses. By contrast, currency gains and losses in connection with financing activities, such as loans in a foreign currency, are recognized in the financial result.
For certain defined loans granted on a long-term basis and for which repayment is neither planned nor probable, the Group applies the principle of "net investments in a foreign operation." The foreign currency translation differences resulting from these loans are recognized in other comprehensive income according to IAS 21.32.
The exchange rates for major currencies against the euro were applied as follows:
Year-end exchange rates Average annual exchange rates
2020 2019 2020 2019
USD 1.22785 1.12340 1.14196 1.11956
GBP 0.89808 0.85080 0.88951 0.87787
CHF 1.08198 1.08540 1.07042 1.11255
JPY 126.52000 121.94000 121.80849 122.01949
SGD 1.62260 1.51110 1.57408 1.52746
KRW 1334.0800 1296.2800 1345.63574 1305.50569
CNY 8.03140 7.8205 7.87300 7.73613
4. Critical Accounting Judgment and Key Sources of Estimation Uncertainty
During the preparation of consolidated financial statements, management uses estimates and assumptions based on their best knowledge of the current situation, including expectations of future developments. However, actual results may differ from these estimates. Therefore, these estimates and assumptions are revised on a regular basis, and the impact of all changes is immediately recognized in the statement of profit or loss for the period.
In addition, Group management exercises its judgment in defining the accounting treatment of specific transactions when the existing standards and interpretations do not explicitly treat the accounting problems concerned.
Assumptions and estimates primarily concern the following facts:
COVID-19 Pandemic Crisis The economic development of the Group has been very robust during the pandemic. Therefore, no significant revisions were made to accounting estimates and assumptions as a result of the pandemic. However, the general level of uncertainty that is inherent in accounting estimates and assumptions increased as a result of the ongoing COVID-19 pandemic crisis.
In fiscal 2020 the Group achieved double-digit revenue growth and a corresponding order intake. There were no significant shortages on the procurement and supply side so that the continuity of production operations was ensured. The biopharma industry, which is of particular relevance for the Group, is largely independent of economic fluctuations. This was again demonstrated in the reporting period and is especially true of the BPS Division, a total solutions provider for the biopharma industry, which experienced increased demand in connection with increasing production capacities for coronavirus vaccines and COVID-19 therapeutics.

Sartorius Consolidated Financial Statements and Notes Notes to the Financial Statements 161
Start
For the LPS Division, which also serves customer segments outside the biopharma industry, a more differentiated picture emerged regarding its products. Based on qualitative assessments during the reporting period for the LPS Division, there were no indications of impairment. This assessment was confirmed by the goodwill impairment tests conducted (see note 15).
Business Combinations Accounting for acquisitions requires certain estimates and assumptions to be made, especially about the fair value of the consideration transferred as well as the fair values of intangible assets and the property, plant, and equipment acquired, liabilities assumed at the acquisition date, as well as the useful lives of intangible assets and property, plant, and equipment acquired.
Their measurement is largely based on projected cash flows. Differences between the expected and actual cash flows may have a material impact on future Group results.
Impairment of Assets The carrying amounts of property, plant, and equipment and intangible assets are examined to determine whether there is any indication that an asset might be impaired, pursuant to IAS 36, Impairment of Assets. If there is any indication that an asset is impaired, the recoverable amount of the asset is estimated. The recoverable amount of an asset or cash-generating unit is the higher of its fair value – less costs of disposal – and its value in use. If the individual asset’s recoverable amount cannot be estimated, the recoverable amount of the asset’s cash-generating unit (CGU) is estimated.
If the estimated recoverable amount of an asset (or a CGU) goes below its book value (carrying amount), this carrying amount must be reduced to the recoverable amount.
If the causes of the asset impairment no longer apply, the carrying amount of the asset (or the CGU) is increased to the new estimate (except for goodwill). However, the increase is limited to the value that the asset (or CGU) would have had if no impairment loss had been recognized in previous fiscal years.
The calculation of the value in use is generally based on discounted cash flow methods which use cash flow projections of up to five years. These projections take into account past experience and represent management's best estimate about future sales revenue and cost developments. Cash flows after the planning period are extrapolated using individual growth rates. Key assumptions on which management has based its determination of the value in use include estimated growth rates, weighted average cost of capital and tax rates. These estimates can have a material impact on the respective values and ultimately on the amount of any impairment.
Intangible Assets The capitalization of internally-generated intangible assets includes a certain level of estimates and assumptions, e.g., the assessment of the technical feasibility of a development project, its expected market prospects, and the determination of useful lives.
Employee Benefits – Provisions for Pension Obligations Obligations for pensions and other post-employment benefits are determined in accordance with actuarial valuations. These valuations rely on key assumptions including discount rates, expected salary increases and mortality rates. The discount rate assumptions are determined by reference to market yields on high-quality, fixed-interest corporate bonds of appropriate duration and currency at the end of the reporting period.
Due to changing market and economic conditions, the underlying key assumptions may differ from actual developments and may lead to significant changes in pension and other post-employment benefit obligations.
Sartorius Consolidated Financial Statements and Notes Notes to the Financial Statements 162
Start
Such differences are recognized in full directly in equity in the period in which they occur without affecting profit or loss. For a sensitivity analysis, see note 23 "Pension and Employee Benefits Provisions."
Provisions, Contingent Liabilities, and Contingent Assets Provisions are recognized for legal or constructive obligations that exist with respect to third parties at the end of the reporting date. To determine the amount of the obligations, certain estimates and assumptions need to be applied, including an evaluation of the probability that such an obligation could occur, and the amount of costs incurred. Typically, significant uncertainties are involved in the determination of provisions related to onerous contracts, warranty costs, closure of business locations, asset retirement obligations and legal proceedings.
Income Taxes The Group operates in various tax jurisdictions and therefore has to determine tax positions under respective local tax laws and tax authorities’ views, which can be complex and subject to different interpretations by taxpayers and local tax authorities. The amount of uncertain tax positions is determined on the basis of the best estimate of expected tax payments (most likely value of the tax uncertainty).
Deferred tax assets have to be recognized for all deductible temporary differences and unused tax losses to the extent that it is probable that future taxable profit will be available against which the deductible temporary differences and unused tax losses can be utilized. As future developments are uncertain and partly beyond management’s control, assumptions are necessary to estimate future taxable profits as well as the period in which deferred tax assets will be recovered.
Estimates are revised in the period in which there is sufficient evidence to revise the assumption. If management considers it probable that all or a portion of a deferred tax asset cannot be realized, a corresponding valuation allowance is taken into account.
Fair Value Measurement A number of the Group’s accounting policies and disclosures require the measurement of fair values, for both financial and non-financial assets and liabilities, including Level 3 fair values (unobservable inputs).
If third-party information, such as broker quotes or pricing services, is used to measure fair values, then management assesses the evidence obtained from the third parties to support the conclusion that these valuations meet the requirements of IFRSs, including the level in the fair value hierarchy at which the valuations should be classified.
When measuring the fair value of an asset or a liability, the Group uses observable market data as far as possible.
If the inputs used to measure the fair value of an asset or a liability fall into different levels of the fair value hierarchy, then the fair value measurement is categorized in its entirety at the same level of the fair value hierarchy as the lowest-level input that is significant to the entire measurement.
Sartorius Consolidated Financial Statements and Notes Notes to the Financial Statements 163
Start
5. Operating Segments
According to IFRS 8, Operating Segments, the identification of reportable operating segments is based on the "management approach"; i.e., the segments are defined analogously to the internal control and reporting structure of an entity. Therefore, an area of activity is to be considered an operating segment if its business activities may result in revenues and expenses, its operating results are regularly reviewed by the entity's chief operating decision maker (= the Executive Board of Sartorius AG), and discrete financial information is available in its internal reporting. Consequently, the divisions called Bioprocess Solutions and Lab Products & Services are considered operating segments. Essential criteria for their definition are the products sold in the divisions.
“Underlying EBITDA” is the key performance indicator of the operating segments of the Group, as management uses this performance measure to control the Group and segments. EBITDA corresponds to earnings before interest (financial result), taxes, depreciation, and amortization. “Underlying EBITDA” means EBITDA adjusted for extraordinary items. Extraordinary items are expenses and income in connection with acquisitions, restructuring activities, large Group projects and gains or losses from the disposal of fixed assets and investments which distort the sustainable profitability of a segment.
“Underlying EBITDA” is not a defined performance measure in IFRSs. The Group’s definition of underlying EBITDA may not be comparable with similarly titled performance measures and disclosures by other entities.
Apart from that, the recognition and measurement methods for the reportable segments conform to the general Group accounting principles.
For intersegment receivables and payables, internal transfer prices are set at prices corresponding to those that would have been agreed with external third parties in the particular situation and under the given framework conditions. Essentially, these prices are calculated by applying the cost-plus method and the resale price method or a combination of the two methods. The methods for determining the internal transfer prices are documented promptly and updated continuously. The volume of such intersegment receivables and payables is immaterial.
Segment assets and segment liabilities are not reported to the chief operating decision maker on a regular basis and are therefore not part of the segment report.
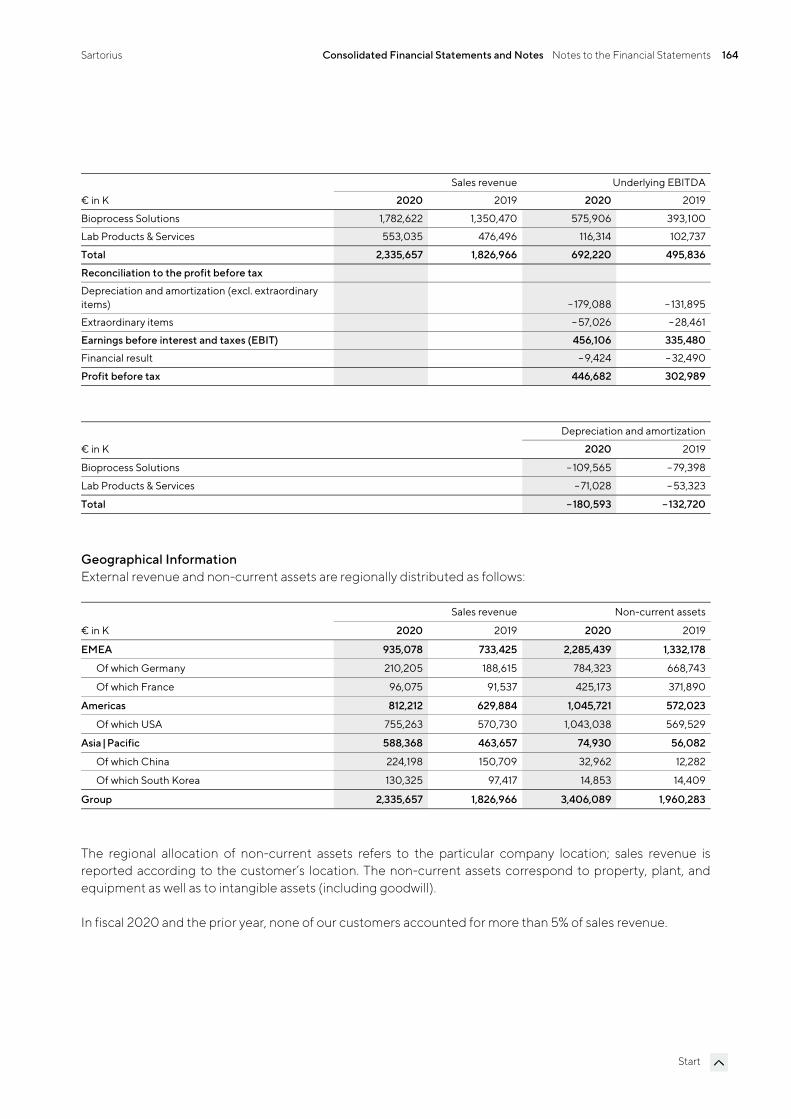
Sartorius Consolidated Financial Statements and Notes Notes to the Financial Statements 164
Start
Sales revenue Underlying EBITDA
€ in K 2020 2019 2020 2019
Bioprocess Solutions 1,782,622 1,350,470 575,906 393,100
Lab Products & Services 553,035 476,496 116,314 102,737
Total 2,335,657 1,826,966 692,220 495,836
Reconciliation to the profit before tax
Depreciation and amortization (excl. extraordinary items) – 179,088 – 131,895
Extraordinary items – 57,026 – 28,461
Earnings before interest and taxes (EBIT) 456,106 335,480
Financial result – 9,424 – 32,490
Profit before tax 446,682 302,989
Depreciation and amortization
€ in K 2020 2019
Bioprocess Solutions – 109,565 – 79,398
Lab Products & Services – 71,028 – 53,323
Total –180,593 –132,720
Geographical Information External revenue and non-current assets are regionally distributed as follows:
Sales revenue Non-current assets
€ in K 2020 2019 2020 2019
EMEA 935,078 733,425 2,285,439 1,332,178
Of which Germany 210,205 188,615 784,323 668,743
Of which France 96,075 91,537 425,173 371,890
Americas 812,212 629,884 1,045,721 572,023
Of which USA 755,263 570,730 1,043,038 569,529
Asia|Pacific 588,368 463,657 74,930 56,082
Of which China 224,198 150,709 32,962 12,282
Of which South Korea 130,325 97,417 14,853 14,409
Group 2,335,657 1,826,966 3,406,089 1,960,283
The regional allocation of non-current assets refers to the particular company location; sales revenue is reported according to the customer’s location. The non-current assets correspond to property, plant, and equipment as well as to intangible assets (including goodwill).
In fiscal 2020 and the prior year, none of our customers accounted for more than 5% of sales revenue.
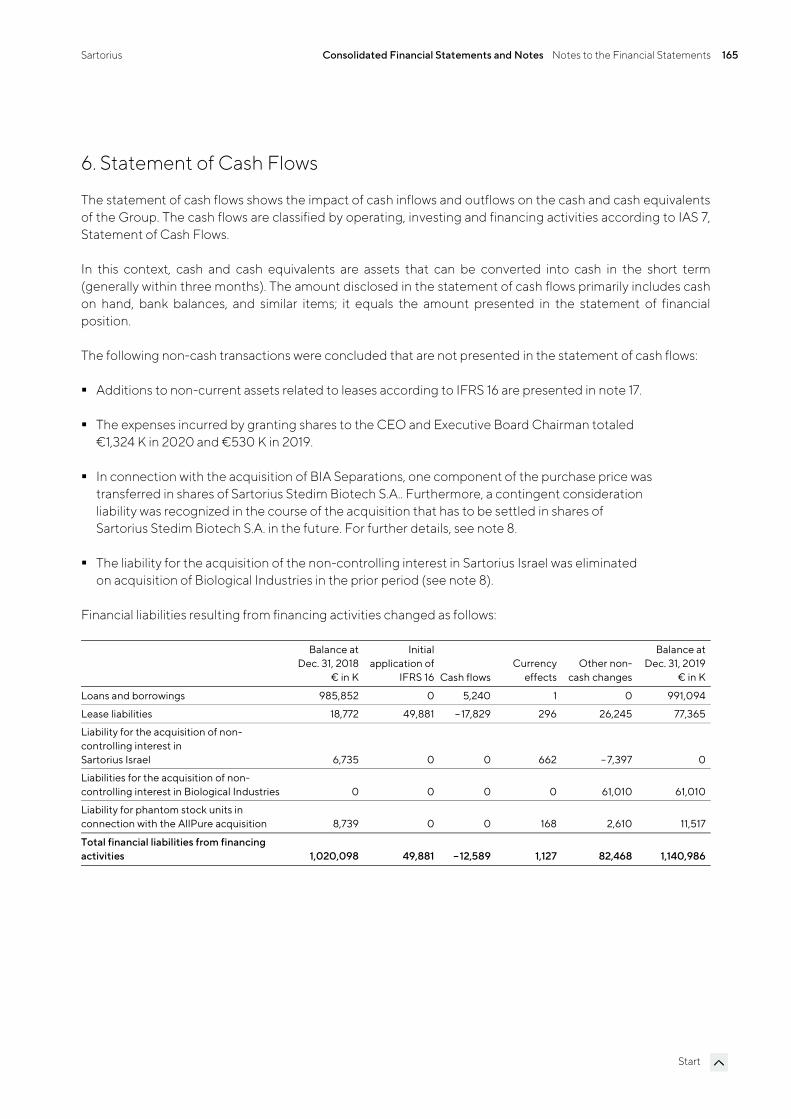
Sartorius Consolidated Financial Statements and Notes Notes to the Financial Statements 165
Start
6. Statement of Cash Flows
The statement of cash flows shows the impact of cash inflows and outflows on the cash and cash equivalents of the Group. The cash flows are classified by operating, investing and financing activities according to IAS 7, Statement of Cash Flows.
In this context, cash and cash equivalents are assets that can be converted into cash in the short term (generally within three months). The amount disclosed in the statement of cash flows primarily includes cash on hand, bank balances, and similar items; it equals the amount presented in the statement of financial position.
The following non-cash transactions were concluded that are not presented in the statement of cash flows:
Additions to non-current assets related to leases according to IFRS 16 are presented in note 17.
The expenses incurred by granting shares to the CEO and Executive Board Chairman totaled €1,324 K in 2020 and €530 K in 2019.
In connection with the acquisition of BIA Separations, one component of the purchase price was transferred in shares of Sartorius Stedim Biotech S.A.. Furthermore, a contingent consideration liability was recognized in the course of the acquisition that has to be settled in shares of Sartorius Stedim Biotech S.A. in the future. For further details, see note 8.
The liability for the acquisition of the non-controlling interest in Sartorius Israel was eliminated on acquisition of Biological Industries in the prior period (see note 8).
Financial liabilities resulting from financing activities changed as follows:
Balance atDec. 31, 2018
€ in K
Initial application of
IFRS 16 Cash flowsCurrency
effectsOther non-
cash changes
Balance atDec. 31, 2019
€ in K
Loans and borrowings 985,852 0 5,240 1 0 991,094
Lease liabilities 18,772 49,881 – 17,829 296 26,245 77,365
Liability for the acquisition of non-controlling interest in Sartorius Israel 6,735 0 0 662 –7,397 0
Liabilities for the acquisition of non-controlling interest in Biological Industries 0 0 0 0 61,010 61,010
Liability for phantom stock units in connection with the AllPure acquisition 8,739 0 0 168 2,610 11,517
Total financial liabilities from financing activities 1,020,098 49,881 –12,589 1,127 82,468 1,140,986
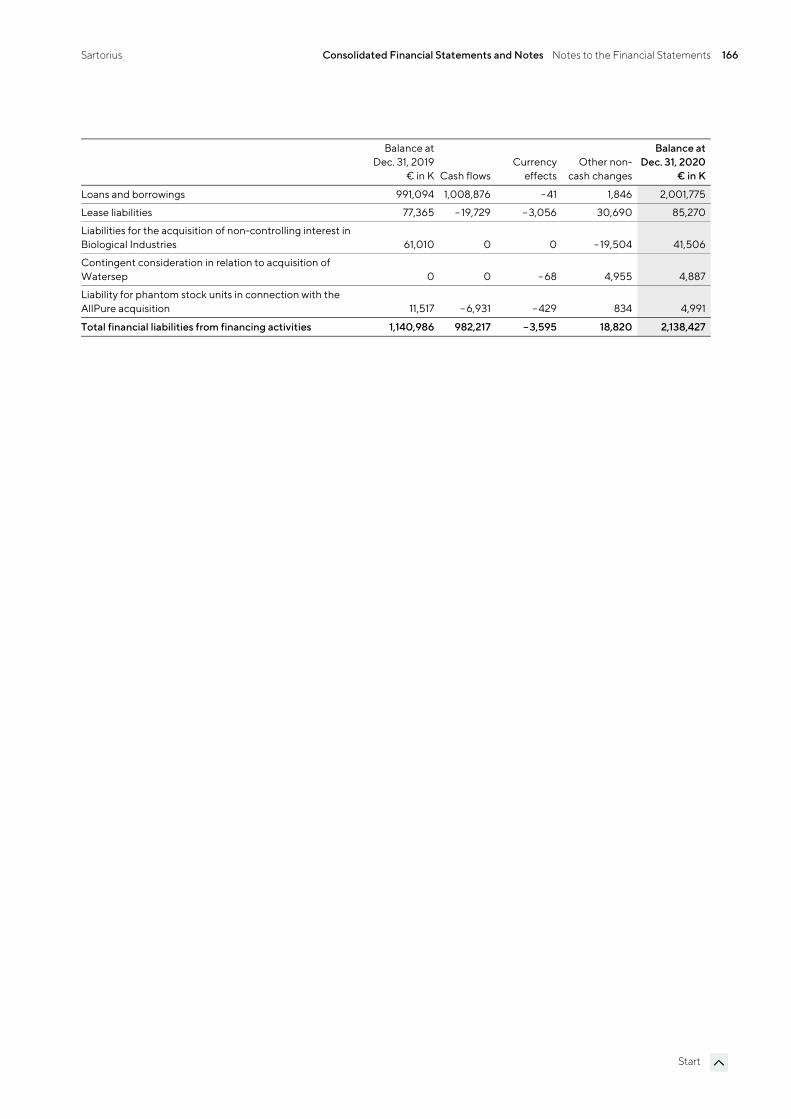
Sartorius Consolidated Financial Statements and Notes Notes to the Financial Statements 166
Start
Balance atDec. 31, 2019
€ in K Cash flowsCurrency
effectsOther non-
cash changes
Balance atDec. 31, 2020
€ in K
Loans and borrowings 991,094 1,008,876 – 41 1,846 2,001,775
Lease liabilities 77,365 – 19,729 – 3,056 30,690 85,270
Liabilities for the acquisition of non-controlling interest in Biological Industries 61,010 0 0 –19,504 41,506
Contingent consideration in relation to acquisition of Watersep 0 0 – 68 4,955 4,887
Liability for phantom stock units in connection with the AllPure acquisition 11,517 – 6,931 – 429 834 4,991
Total financial liabilities from financing activities 1,140,986 982,217 –3,595 18,820 2,138,427
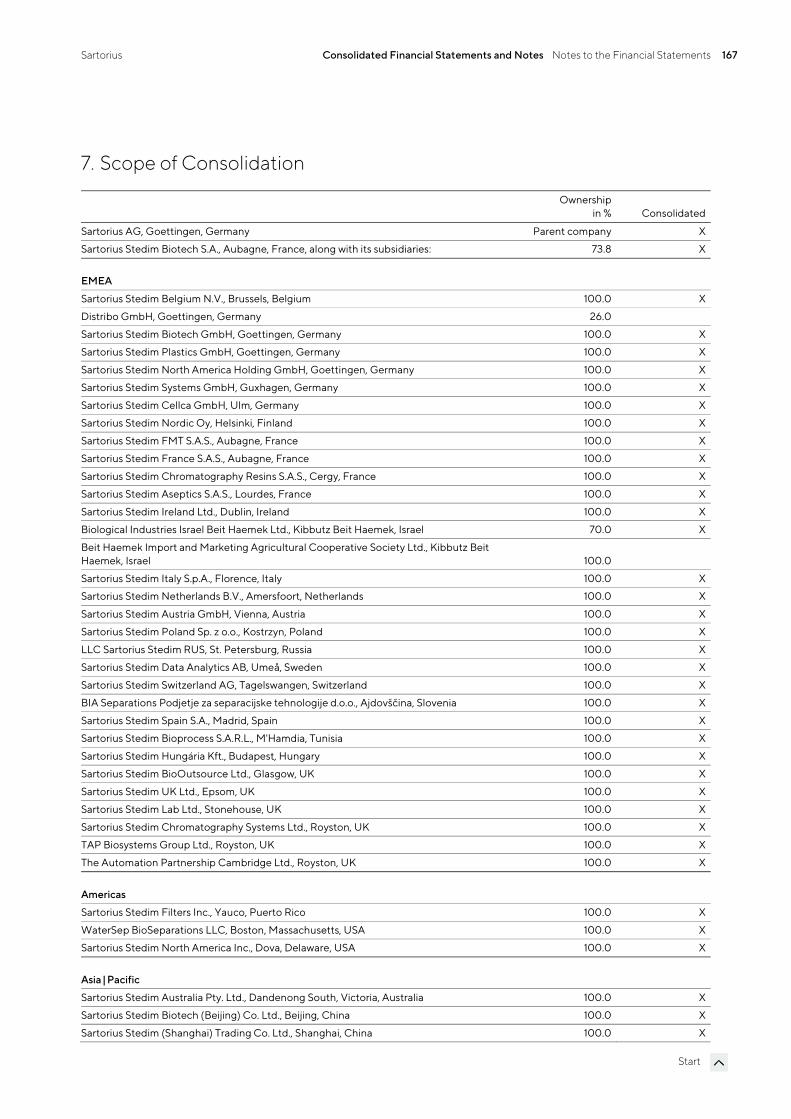
Sartorius Consolidated Financial Statements and Notes Notes to the Financial Statements 167
Start
7. Scope of Consolidation
Ownershipin % Consolidated
Sartorius AG, Goettingen, Germany Parent company X
Sartorius Stedim Biotech S.A., Aubagne, France, along with its subsidiaries: 73.8 X
EMEA
Sartorius Stedim Belgium N.V., Brussels, Belgium 100.0 X
Distribo GmbH, Goettingen, Germany 26.0
Sartorius Stedim Biotech GmbH, Goettingen, Germany 100.0 X
Sartorius Stedim Plastics GmbH, Goettingen, Germany 100.0 X
Sartorius Stedim North America Holding GmbH, Goettingen, Germany 100.0 X
Sartorius Stedim Systems GmbH, Guxhagen, Germany 100.0 X
Sartorius Stedim Cellca GmbH, Ulm, Germany 100.0 X
Sartorius Stedim Nordic Oy, Helsinki, Finland 100.0 X
Sartorius Stedim FMT S.A.S., Aubagne, France 100.0 X
Sartorius Stedim France S.A.S., Aubagne, France 100.0 X
Sartorius Stedim Chromatography Resins S.A.S., Cergy, France 100.0 X
Sartorius Stedim Aseptics S.A.S., Lourdes, France 100.0 X
Sartorius Stedim Ireland Ltd., Dublin, Ireland 100.0 X
Biological Industries Israel Beit Haemek Ltd., Kibbutz Beit Haemek, Israel 70.0 X
Beit Haemek Import and Marketing Agricultural Cooperative Society Ltd., Kibbutz Beit Haemek, Israel 100.0
Sartorius Stedim Italy S.p.A., Florence, Italy 100.0 X
Sartorius Stedim Netherlands B.V., Amersfoort, Netherlands 100.0 X
Sartorius Stedim Austria GmbH, Vienna, Austria 100.0 X
Sartorius Stedim Poland Sp. z o.o., Kostrzyn, Poland 100.0 X
LLC Sartorius Stedim RUS, St. Petersburg, Russia 100.0 X
Sartorius Stedim Data Analytics AB, Umeå, Sweden 100.0 X
Sartorius Stedim Switzerland AG, Tagelswangen, Switzerland 100.0 X
BIA Separations Podjetje za separacijske tehnologije d.o.o., Ajdovščina, Slovenia 100.0 X
Sartorius Stedim Spain S.A., Madrid, Spain 100.0 X
Sartorius Stedim Bioprocess S.A.R.L., M'Hamdia, Tunisia 100.0 X
Sartorius Stedim Hungária Kft., Budapest, Hungary 100.0 X
Sartorius Stedim BioOutsource Ltd., Glasgow, UK 100.0 X
Sartorius Stedim UK Ltd., Epsom, UK 100.0 X
Sartorius Stedim Lab Ltd., Stonehouse, UK 100.0 X
Sartorius Stedim Chromatography Systems Ltd., Royston, UK 100.0 X
TAP Biosystems Group Ltd., Royston, UK 100.0 X
The Automation Partnership Cambridge Ltd., Royston, UK 100.0 X
Americas
Sartorius Stedim Filters Inc., Yauco, Puerto Rico 100.0 X
WaterSep BioSeparations LLC, Boston, Massachusetts, USA 100.0 X
Sartorius Stedim North America Inc., Dova, Delaware, USA 100.0 X
Asia|Pacific
Sartorius Stedim Australia Pty. Ltd., Dandenong South, Victoria, Australia 100.0 X
Sartorius Stedim Biotech (Beijing) Co. Ltd., Beijing, China 100.0 X
Sartorius Stedim (Shanghai) Trading Co. Ltd., Shanghai, China 100.0 X
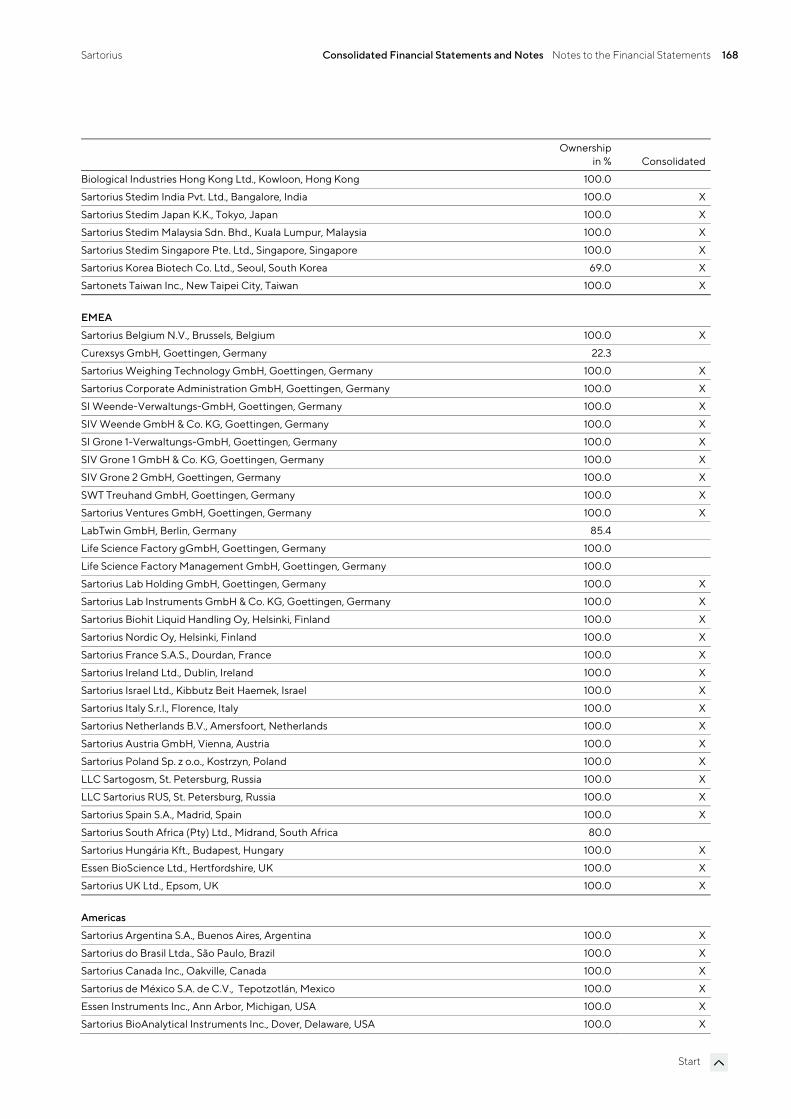
Sartorius Consolidated Financial Statements and Notes Notes to the Financial Statements 168
Start
Ownershipin % Consolidated
Biological Industries Hong Kong Ltd., Kowloon, Hong Kong 100.0
Sartorius Stedim India Pvt. Ltd., Bangalore, India 100.0 X
Sartorius Stedim Japan K.K., Tokyo, Japan 100.0 X
Sartorius Stedim Malaysia Sdn. Bhd., Kuala Lumpur, Malaysia 100.0 X
Sartorius Stedim Singapore Pte. Ltd., Singapore, Singapore 100.0 X
Sartorius Korea Biotech Co. Ltd., Seoul, South Korea 69.0 X
Sartonets Taiwan Inc., New Taipei City, Taiwan 100.0 X
EMEA
Sartorius Belgium N.V., Brussels, Belgium 100.0 X
Curexsys GmbH, Goettingen, Germany 22.3
Sartorius Weighing Technology GmbH, Goettingen, Germany 100.0 X
Sartorius Corporate Administration GmbH, Goettingen, Germany 100.0 X
SI Weende-Verwaltungs-GmbH, Goettingen, Germany 100.0 X
SIV Weende GmbH & Co. KG, Goettingen, Germany 100.0 X
SI Grone 1-Verwaltungs-GmbH, Goettingen, Germany 100.0 X
SIV Grone 1 GmbH & Co. KG, Goettingen, Germany 100.0 X
SIV Grone 2 GmbH, Goettingen, Germany 100.0 X
SWT Treuhand GmbH, Goettingen, Germany 100.0 X
Sartorius Ventures GmbH, Goettingen, Germany 100.0 X
LabTwin GmbH, Berlin, Germany 85.4
Life Science Factory gGmbH, Goettingen, Germany 100.0
Life Science Factory Management GmbH, Goettingen, Germany 100.0
Sartorius Lab Holding GmbH, Goettingen, Germany 100.0 X
Sartorius Lab Instruments GmbH & Co. KG, Goettingen, Germany 100.0 X
Sartorius Biohit Liquid Handling Oy, Helsinki, Finland 100.0 X
Sartorius Nordic Oy, Helsinki, Finland 100.0 X
Sartorius France S.A.S., Dourdan, France 100.0 X
Sartorius Ireland Ltd., Dublin, Ireland 100.0 X
Sartorius Israel Ltd., Kibbutz Beit Haemek, Israel 100.0 X
Sartorius Italy S.r.l., Florence, Italy 100.0 X
Sartorius Netherlands B.V., Amersfoort, Netherlands 100.0 X
Sartorius Austria GmbH, Vienna, Austria 100.0 X
Sartorius Poland Sp. z o.o., Kostrzyn, Poland 100.0 X
LLC Sartogosm, St. Petersburg, Russia 100.0 X
LLC Sartorius RUS, St. Petersburg, Russia 100.0 X
Sartorius Spain S.A., Madrid, Spain 100.0 X
Sartorius South Africa (Pty) Ltd., Midrand, South Africa 80.0
Sartorius Hungária Kft., Budapest, Hungary 100.0 X
Essen BioScience Ltd., Hertfordshire, UK 100.0 X
Sartorius UK Ltd., Epsom, UK 100.0 X
Americas
Sartorius Argentina S.A., Buenos Aires, Argentina 100.0 X
Sartorius do Brasil Ltda., São Paulo, Brazil 100.0 X
Sartorius Canada Inc., Oakville, Canada 100.0 X
Sartorius de México S.A. de C.V., Tepotzotlán, Mexico 100.0 X
Essen Instruments Inc., Ann Arbor, Michigan, USA 100.0 X
Sartorius BioAnalytical Instruments Inc., Dover, Delaware, USA 100.0 X
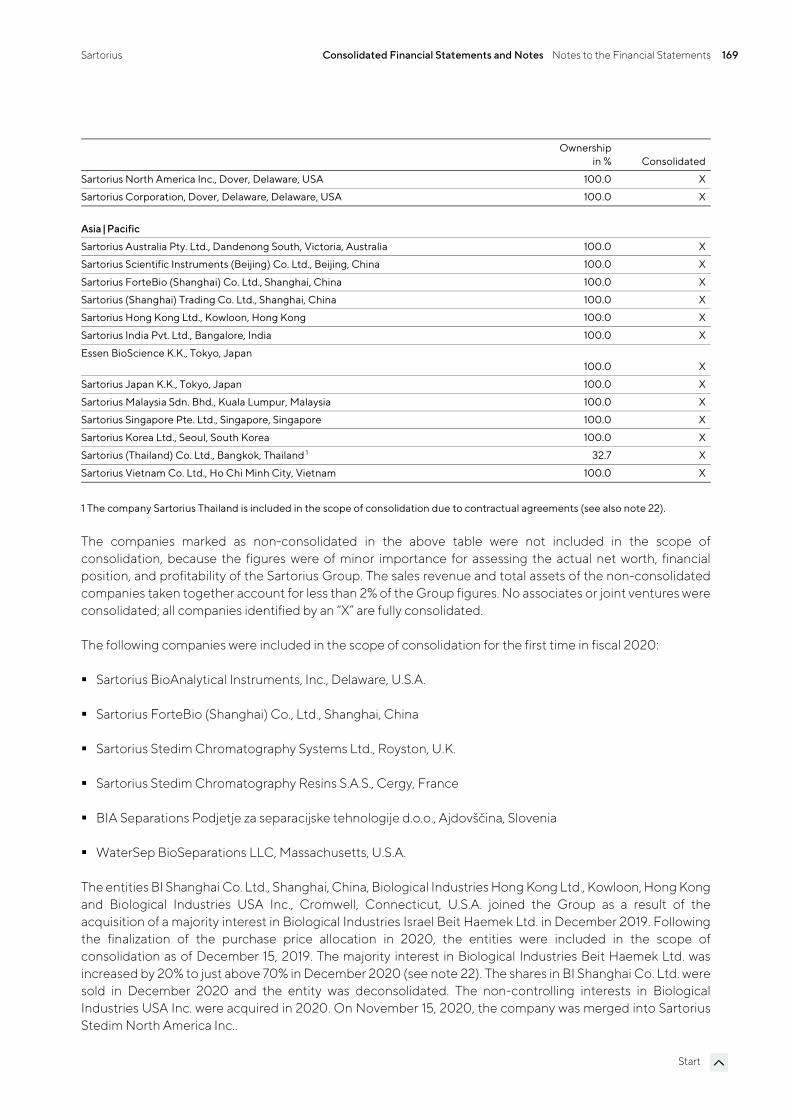
Sartorius Consolidated Financial Statements and Notes Notes to the Financial Statements 169
Start
Ownershipin % Consolidated
Sartorius North America Inc., Dover, Delaware, USA 100.0 X
Sartorius Corporation, Dover, Delaware, Delaware, USA 100.0 X
Asia|Pacific
Sartorius Australia Pty. Ltd., Dandenong South, Victoria, Australia 100.0 X
Sartorius Scientific Instruments (Beijing) Co. Ltd., Beijing, China 100.0 X
Sartorius ForteBio (Shanghai) Co. Ltd., Shanghai, China 100.0 X
Sartorius (Shanghai) Trading Co. Ltd., Shanghai, China 100.0 X
Sartorius Hong Kong Ltd., Kowloon, Hong Kong 100.0 X
Sartorius India Pvt. Ltd., Bangalore, India 100.0 X
Essen BioScience K.K., Tokyo, Japan 100.0 X
Sartorius Japan K.K., Tokyo, Japan 100.0 X
Sartorius Malaysia Sdn. Bhd., Kuala Lumpur, Malaysia 100.0 X
Sartorius Singapore Pte. Ltd., Singapore, Singapore 100.0 X
Sartorius Korea Ltd., Seoul, South Korea 100.0 X
Sartorius (Thailand) Co. Ltd., Bangkok, Thailand 1 32.7 X
Sartorius Vietnam Co. Ltd., Ho Chi Minh City, Vietnam 100.0 X
1 The company Sartorius Thailand is included in the scope of consolidation due to contractual agreements (see also note 22).
The companies marked as non-consolidated in the above table were not included in the scope of consolidation, because the figures were of minor importance for assessing the actual net worth, financial position, and profitability of the Sartorius Group. The sales revenue and total assets of the non-consolidated companies taken together account for less than 2% of the Group figures. No associates or joint ventures were consolidated; all companies identified by an “X” are fully consolidated.
The following companies were included in the scope of consolidation for the first time in fiscal 2020:
Sartorius BioAnalytical Instruments, Inc., Delaware, U.S.A.
Sartorius ForteBio (Shanghai) Co., Ltd., Shanghai, China
Sartorius Stedim Chromatography Systems Ltd., Royston, U.K.
Sartorius Stedim Chromatography Resins S.A.S., Cergy, France
BIA Separations Podjetje za separacijske tehnologije d.o.o., Ajdovščina, Slovenia
WaterSep BioSeparations LLC, Massachusetts, U.S.A.
The entities BI Shanghai Co. Ltd., Shanghai, China, Biological Industries Hong Kong Ltd., Kowloon, Hong Kong and Biological Industries USA Inc., Cromwell, Connecticut, U.S.A. joined the Group as a result of the acquisition of a majority interest in Biological Industries Israel Beit Haemek Ltd. in December 2019. Following the finalization of the purchase price allocation in 2020, the entities were included in the scope of consolidation as of December 15, 2019. The majority interest in Biological Industries Beit Haemek Ltd. was increased by 20% to just above 70% in December 2020 (see note 22). The shares in BI Shanghai Co. Ltd. were sold in December 2020 and the entity was deconsolidated. The non-controlling interests in Biological Industries USA Inc. were acquired in 2020. On November 15, 2020, the company was merged into Sartorius Stedim North America Inc..
Sartorius Consolidated Financial Statements and Notes Notes to the Financial Statements 170
Start
Sartorius BioAnalytical Instruments, Inc., Sartorius Stedim Chromatography Systems Ltd., and Sartorius Stedim Chromatography Resins S.A.S. were established for the acquisition of selected life science assets from Danaher. The assets were purchased on April 30, 2020. In the course of this acquisition, Sartorius ForteBio (Shanghai) Co., Ltd. was acquired on the basis of a share deal. The shares in BIA Separations were acquired on November 2, 2020. The shares in WaterSep BioSeparations LLC were acquired on December 9, 2020. See note 8 for details on the acquisition of the assets from Danaher and on the acquisitions of Biological Industries, BIA Separations and WaterSep BioSeparations LLC.
The investment in Curexsys GmbH, Goettingen, Germany was acquired in December 2020 and is classified as an associate pursuant to IAS 28. The cost of acquisition amounted to around €4.1 million.
The immaterial entities TAP ESOP Management Ltd., Royston, U.K., TAP Biosystems (PHC) Ltd., Royston, U.K., TAP Biosystems Ltd., Royston, U.K., Sartorius Peru S.A.C., Lima, Peru, and Denver Instruments (Beijing) Co. Ltd., Beijing, China were liquidated in fiscal 2020.
8. Business Combinations
Acquisition of Biological Industries in 2019 On December 15, 2019, the Group acquired just over 50% of the shares in the Israeli cell culture media developer and manufacturer Biological Industries. In the course of the transaction, the Group obtained control based on contractual arrangements.
Biological Industries focuses on cell culture media, particularly for cell and gene therapy, regenerative medicine and other advanced therapies. Founded in 1981, the company employed approximately 130 people at the acquisition date, mainly at its headquarters, R&D, and manufacturing site near Haifa, Israel, and at sales locations in the U.S.A., Europe, and China.
The determination of the acquisition-date fair values of the consideration transferred as well as of the assets acquired and liabilities assumed was completed in 2020. Non-controlling interests are measured at their proportionate share of the net assets.
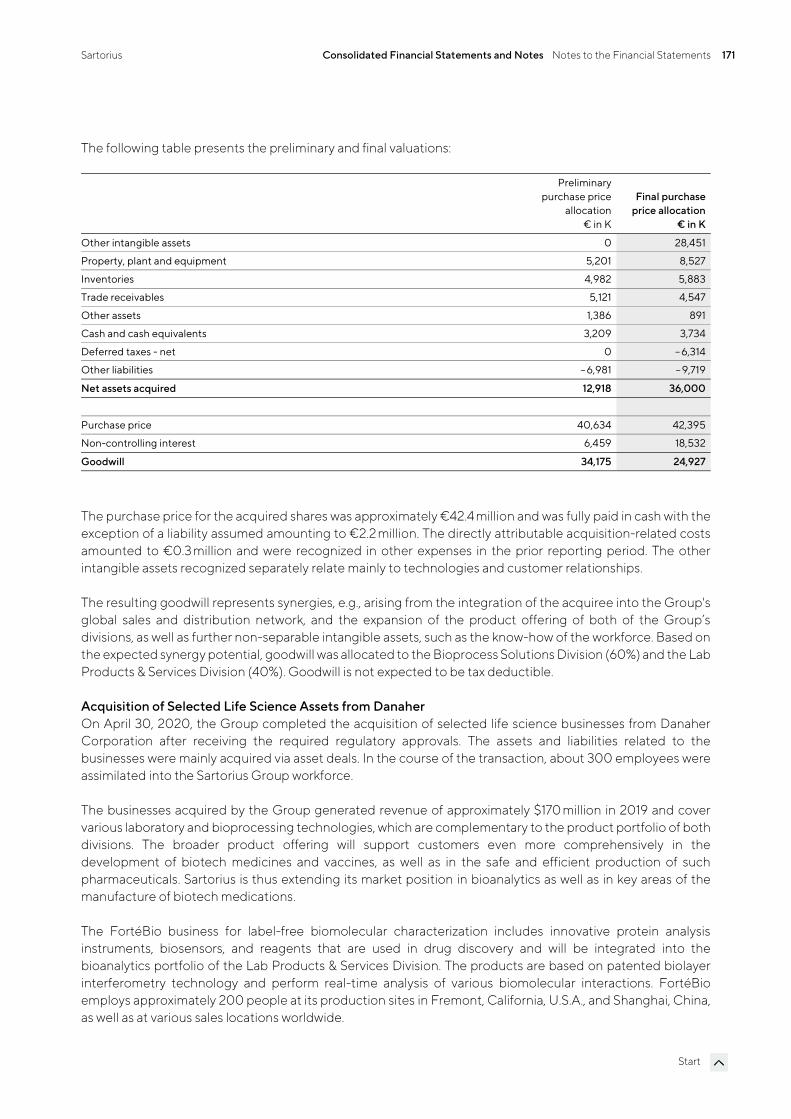
Sartorius Consolidated Financial Statements and Notes Notes to the Financial Statements 171
Start
The following table presents the preliminary and final valuations:
Preliminary purchase price
allocation€ in K
Final purchase price allocation
€ in K
Other intangible assets 0 28,451
Property, plant and equipment 5,201 8,527
Inventories 4,982 5,883
Trade receivables 5,121 4,547
Other assets 1,386 891
Cash and cash equivalents 3,209 3,734
Deferred taxes - net 0 – 6,314
Other liabilities – 6,981 – 9,719
Net assets acquired 12,918 36,000
Purchase price 40,634 42,395
Non-controlling interest 6,459 18,532
Goodwill 34,175 24,927
The purchase price for the acquired shares was approximately €42.4 million and was fully paid in cash with the exception of a liability assumed amounting to €2.2 million. The directly attributable acquisition-related costs amounted to €0.3 million and were recognized in other expenses in the prior reporting period. The other intangible assets recognized separately relate mainly to technologies and customer relationships.
The resulting goodwill represents synergies, e.g., arising from the integration of the acquiree into the Group's global sales and distribution network, and the expansion of the product offering of both of the Group’s divisions, as well as further non-separable intangible assets, such as the know-how of the workforce. Based on the expected synergy potential, goodwill was allocated to the Bioprocess Solutions Division (60%) and the Lab Products & Services Division (40%). Goodwill is not expected to be tax deductible.
Acquisition of Selected Life Science Assets from Danaher On April 30, 2020, the Group completed the acquisition of selected life science businesses from Danaher Corporation after receiving the required regulatory approvals. The assets and liabilities related to the businesses were mainly acquired via asset deals. In the course of the transaction, about 300 employees were assimilated into the Sartorius Group workforce.
The businesses acquired by the Group generated revenue of approximately $170 million in 2019 and cover various laboratory and bioprocessing technologies, which are complementary to the product portfolio of both divisions. The broader product offering will support customers even more comprehensively in the development of biotech medicines and vaccines, as well as in the safe and efficient production of such pharmaceuticals. Sartorius is thus extending its market position in bioanalytics as well as in key areas of the manufacture of biotech medications.
The FortéBio business for label-free biomolecular characterization includes innovative protein analysis instruments, biosensors, and reagents that are used in drug discovery and will be integrated into the bioanalytics portfolio of the Lab Products & Services Division. The products are based on patented biolayer interferometry technology and perform real-time analysis of various biomolecular interactions. FortéBio employs approximately 200 people at its production sites in Fremont, California, U.S.A., and Shanghai, China, as well as at various sales locations worldwide.
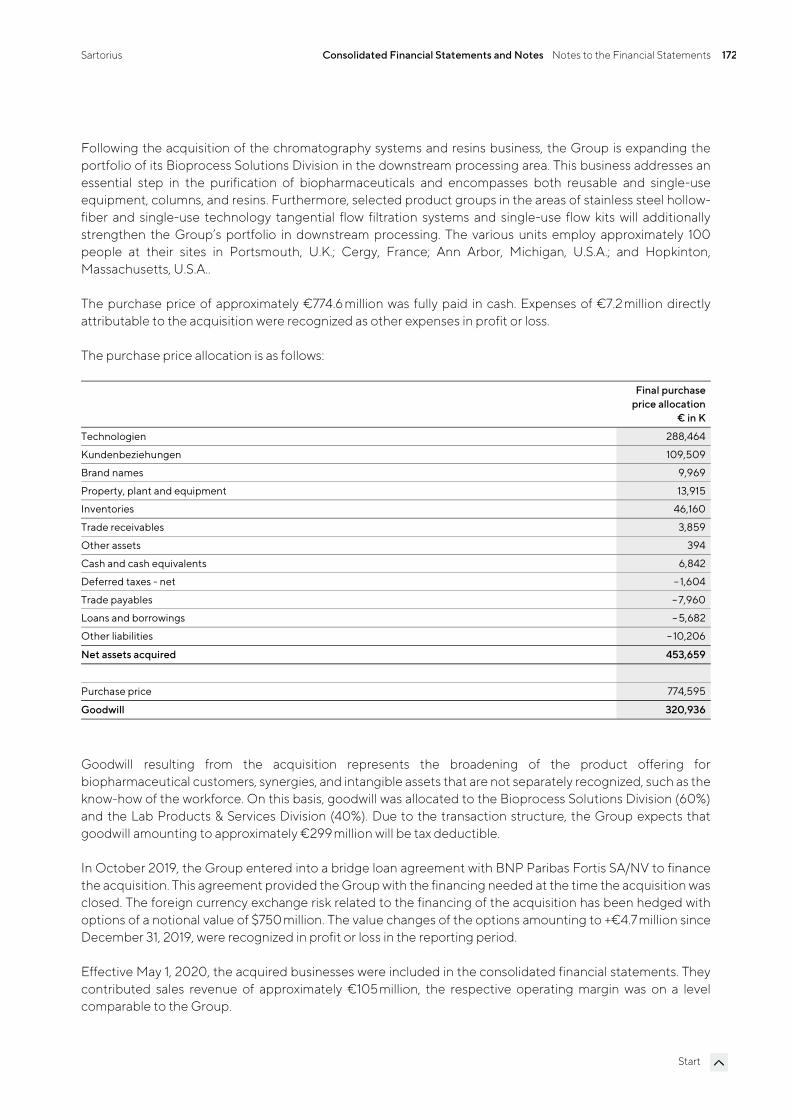
Sartorius Consolidated Financial Statements and Notes Notes to the Financial Statements 172
Start
Following the acquisition of the chromatography systems and resins business, the Group is expanding the portfolio of its Bioprocess Solutions Division in the downstream processing area. This business addresses an essential step in the purification of biopharmaceuticals and encompasses both reusable and single-use equipment, columns, and resins. Furthermore, selected product groups in the areas of stainless steel hollow-fiber and single-use technology tangential flow filtration systems and single-use flow kits will additionally strengthen the Group’s portfolio in downstream processing. The various units employ approximately 100 people at their sites in Portsmouth, U.K.; Cergy, France; Ann Arbor, Michigan, U.S.A.; and Hopkinton, Massachusetts, U.S.A..
The purchase price of approximately €774.6 million was fully paid in cash. Expenses of €7.2 million directly attributable to the acquisition were recognized as other expenses in profit or loss.
The purchase price allocation is as follows:
Final purchase price allocation
€ in K
Technologien 288,464
Kundenbeziehungen 109,509
Brand names 9,969
Property, plant and equipment 13,915
Inventories 46,160
Trade receivables 3,859
Other assets 394
Cash and cash equivalents 6,842
Deferred taxes - net – 1,604
Trade payables – 7,960
Loans and borrowings – 5,682
Other liabilities – 10,206
Net assets acquired 453,659
Purchase price 774,595
Goodwill 320,936
Goodwill resulting from the acquisition represents the broadening of the product offering for biopharmaceutical customers, synergies, and intangible assets that are not separately recognized, such as the know-how of the workforce. On this basis, goodwill was allocated to the Bioprocess Solutions Division (60%) and the Lab Products & Services Division (40%). Due to the transaction structure, the Group expects that goodwill amounting to approximately €299 million will be tax deductible.
In October 2019, the Group entered into a bridge loan agreement with BNP Paribas Fortis SA/NV to finance the acquisition. This agreement provided the Group with the financing needed at the time the acquisition was closed. The foreign currency exchange risk related to the financing of the acquisition has been hedged with options of a notional value of $750 million. The value changes of the options amounting to +€4.7 million since December 31, 2019, were recognized in profit or loss in the reporting period.
Effective May 1, 2020, the acquired businesses were included in the consolidated financial statements. They contributed sales revenue of approximately €105 million, the respective operating margin was on a level comparable to the Group.
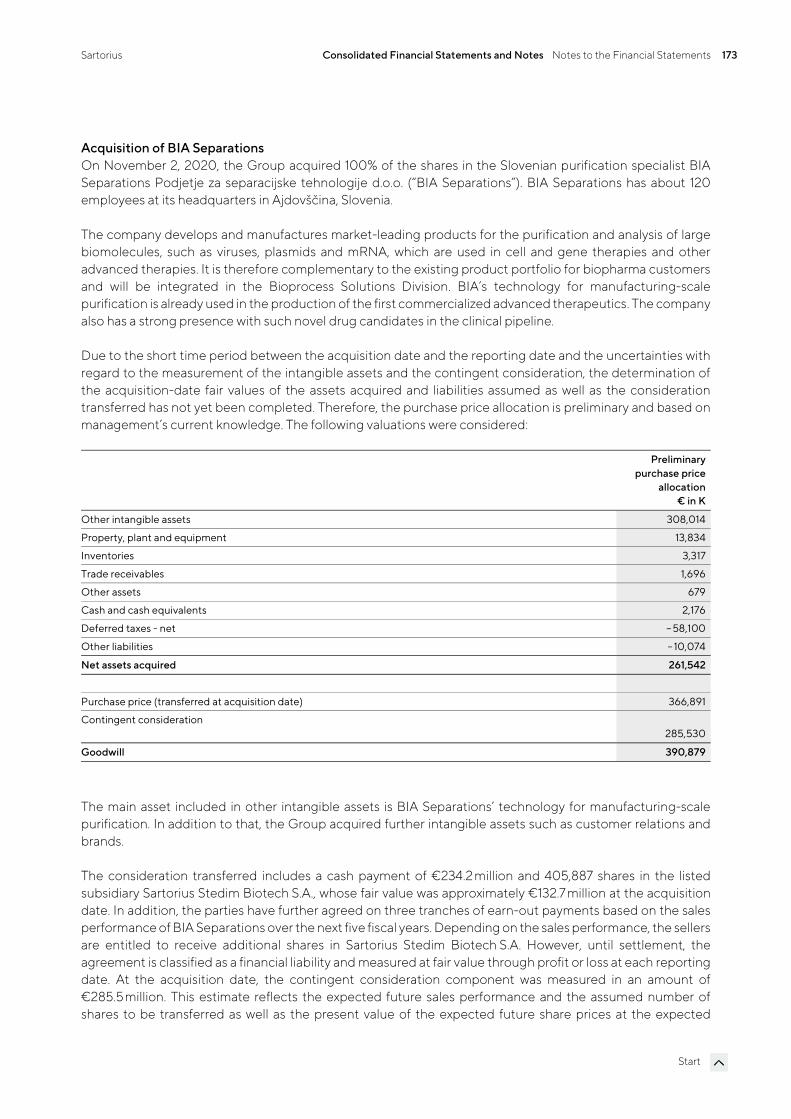
Sartorius Consolidated Financial Statements and Notes Notes to the Financial Statements 173
Start
Acquisition of BIA Separations On November 2, 2020, the Group acquired 100% of the shares in the Slovenian purification specialist BIA Separations Podjetje za separacijske tehnologije d.o.o. (“BIA Separations”). BIA Separations has about 120 employees at its headquarters in Ajdovščina, Slovenia.
The company develops and manufactures market-leading products for the purification and analysis of large biomolecules, such as viruses, plasmids and mRNA, which are used in cell and gene therapies and other advanced therapies. It is therefore complementary to the existing product portfolio for biopharma customers and will be integrated in the Bioprocess Solutions Division. BIA’s technology for manufacturing-scale purification is already used in the production of the first commercialized advanced therapeutics. The company also has a strong presence with such novel drug candidates in the clinical pipeline.
Due to the short time period between the acquisition date and the reporting date and the uncertainties with regard to the measurement of the intangible assets and the contingent consideration, the determination of the acquisition-date fair values of the assets acquired and liabilities assumed as well as the consideration transferred has not yet been completed. Therefore, the purchase price allocation is preliminary and based on management’s current knowledge. The following valuations were considered:
Preliminary purchase price
allocation€ in K
Other intangible assets 308,014
Property, plant and equipment 13,834
Inventories 3,317
Trade receivables 1,696
Other assets 679
Cash and cash equivalents 2,176
Deferred taxes - net – 58,100
Other liabilities – 10,074
Net assets acquired 261,542
Purchase price (transferred at acquisition date) 366,891
Contingent consideration 285,530
Goodwill 390,879
The main asset included in other intangible assets is BIA Separations’ technology for manufacturing-scale purification. In addition to that, the Group acquired further intangible assets such as customer relations and brands.
The consideration transferred includes a cash payment of €234.2 million and 405,887 shares in the listed subsidiary Sartorius Stedim Biotech S.A., whose fair value was approximately €132.7 million at the acquisition date. In addition, the parties have further agreed on three tranches of earn-out payments based on the sales performance of BIA Separations over the next five fiscal years. Depending on the sales performance, the sellers are entitled to receive additional shares in Sartorius Stedim Biotech S.A. However, until settlement, the agreement is classified as a financial liability and measured at fair value through profit or loss at each reporting date. At the acquisition date, the contingent consideration component was measured in an amount of €285.5 million. This estimate reflects the expected future sales performance and the assumed number of shares to be transferred as well as the present value of the expected future share prices at the expected
Sartorius Consolidated Financial Statements and Notes Notes to the Financial Statements 174
Start
settlement dates. The lower end of the bandwidth of possible outcomes of the contingent consideration is zero, while the upper limit cannot be quantified due to the settlement in shares.
At the reporting date of December 31, 2020, the fair value of the contingent consideration liability was measured at €253.9 million. This change reflects mainly the decrease in the share price of Sartorius Stedim Biotech S.A. during the time from the acquisition date to December 31, 2020 as starting point of the estimation of the future share price at the settlement dates of the obligations. Furthermore, the discount rates applied to calculate the present value of the future obligation were adjusted to reflect the market rates at December 31, 2020. The difference between the valuation as of the acquisition date and the reporting date amounting to about €31.6 million has been recognized in the financial result. The range of possible outcomes of the contingent consideration did not change since the acquisition date.
The key input parameters for the valuation are the sales revenue expectations for the planning period as well as the share price of Sartorius Stedim Biotech S.A. at the respective valuation date. The valuation results are less sensitive to realistic changes of other valuation parameters, e.g. the discount rates applied. Assuming 10% higher (lower) sales revenues in each of the five years of the plan period would result in an increase of the liability to be reported at the reporting date of approximately €29 million (decrease of approximately €24million). If the share price had been 10% higher (lower) at the reporting date, the liability would have been €25 million higher (€25 million lower). The actual future outcomes may differ from these sensitivities that have been considered in isolation.
Expenses of €3.6 million directly attributable to the acquisition were recognized as other expenses in profit or loss. The resulting goodwill represents synergies such as those arising from BIA Separations’ access to the Group’s worldwide sales and distribution network, the completion of the Bioprocess Solutions Division’s product portfolio, and intangible assets which are not recognized separately, e.g. the know-how of the workforce. Goodwill is not expected to be tax deductible.
Due to the short time period since initial consolidation, BIA Separations did not contribute materially to the Group’s sales revenue and earnings of the reporting period 2020 with the exception of the measurement gain on the contingent consideration described above.
Acquisition of WaterSep BioSeparations LLC On December 9, 2020, the Group acquired 100% of the shares in the U.S.-based entity WaterSep BioSe-parations LLC. The company has about 15 employees in Marlborough, Massachusetts, U.S.A. WaterSep BioSeparations develops, manufactures and markets hollow fiber membrane devices and pre-sterilized assemblies for upstream and downstream biopharmaceutical applications. This acquisition complements the Group’s portfolio for cell and gene therapy applications, cell harvesting and various solutions for intensified bioprocessing and will be integrated into the Bioprocess Solutions Division.
Due to the short time period between the acquisition date and the approval of the consolidated financial statements, the full difference between the consideration transferred and the net assets acquired before their fair value measurement is provisionally presented as goodwill.
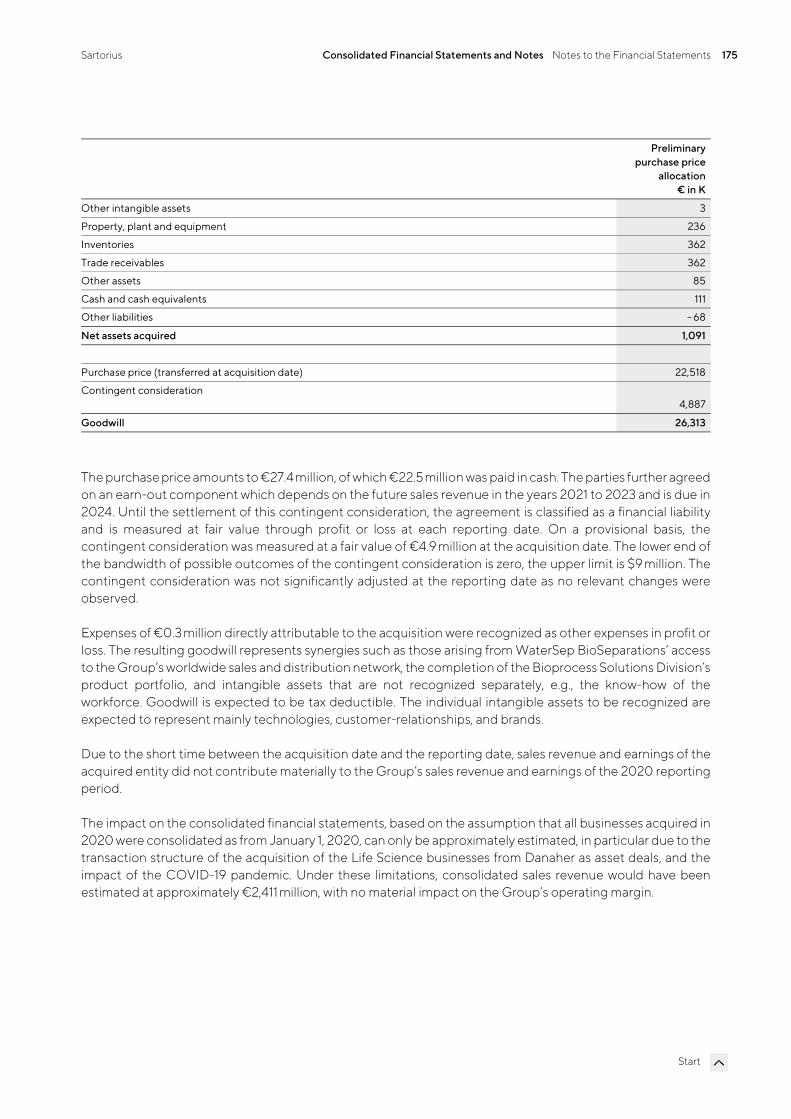
Sartorius Consolidated Financial Statements and Notes Notes to the Financial Statements 175
Start
Preliminary purchase price
allocation€ in K
Other intangible assets 3
Property, plant and equipment 236
Inventories 362
Trade receivables 362
Other assets 85
Cash and cash equivalents 111
Other liabilities – 68
Net assets acquired 1,091
Purchase price (transferred at acquisition date) 22,518
Contingent consideration 4,887
Goodwill 26,313
The purchase price amounts to €27.4 million, of which €22.5 million was paid in cash. The parties further agreed on an earn-out component which depends on the future sales revenue in the years 2021 to 2023 and is due in 2024. Until the settlement of this contingent consideration, the agreement is classified as a financial liability and is measured at fair value through profit or loss at each reporting date. On a provisional basis, the contingent consideration was measured at a fair value of €4.9 million at the acquisition date. The lower end of the bandwidth of possible outcomes of the contingent consideration is zero, the upper limit is $9 million. The contingent consideration was not significantly adjusted at the reporting date as no relevant changes were observed.
Expenses of €0.3 million directly attributable to the acquisition were recognized as other expenses in profit or loss. The resulting goodwill represents synergies such as those arising from WaterSep BioSeparations’ access to the Group’s worldwide sales and distribution network, the completion of the Bioprocess Solutions Division’s product portfolio, and intangible assets that are not recognized separately, e.g., the know-how of the workforce. Goodwill is expected to be tax deductible. The individual intangible assets to be recognized are expected to represent mainly technologies, customer-relationships, and brands.
Due to the short time between the acquisition date and the reporting date, sales revenue and earnings of the acquired entity did not contribute materially to the Group’s sales revenue and earnings of the 2020 reporting period.
The impact on the consolidated financial statements, based on the assumption that all businesses acquired in 2020 were consolidated as from January 1, 2020, can only be approximately estimated, in particular due to the transaction structure of the acquisition of the Life Science businesses from Danaher as asset deals, and the impact of the COVID-19 pandemic. Under these limitations, consolidated sales revenue would have been estimated at approximately €2,411 million, with no material impact on the Group’s operating margin.
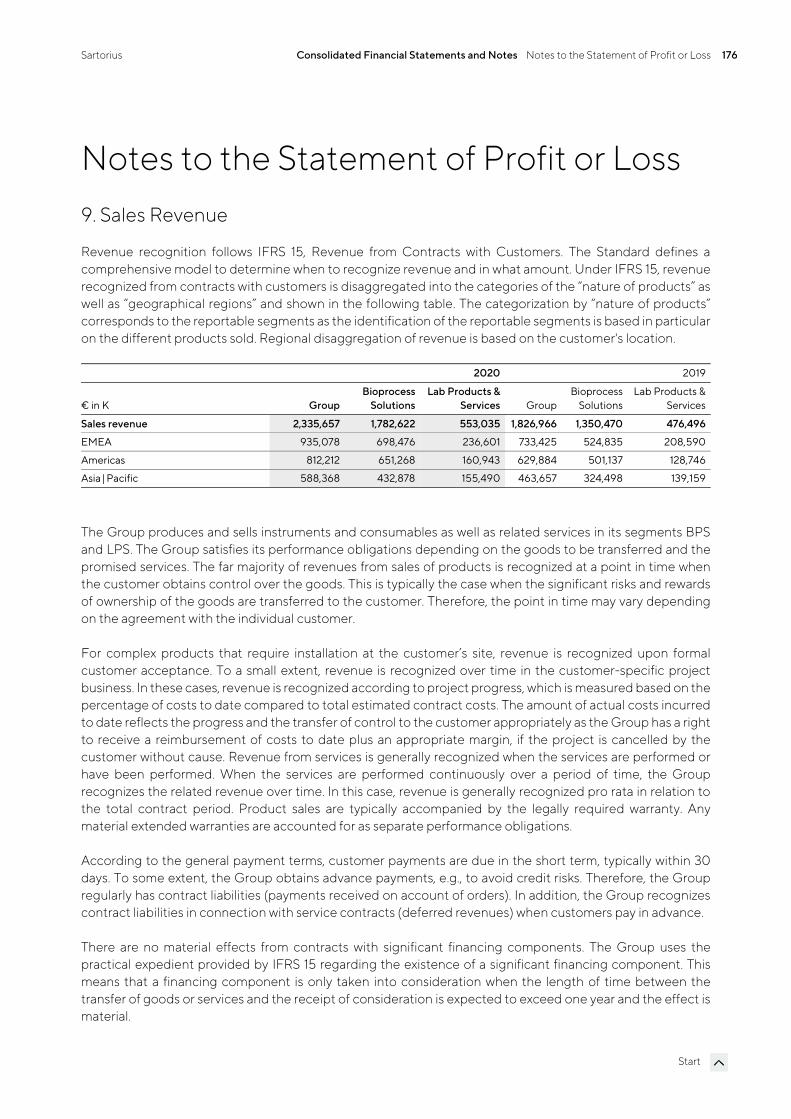
Sartorius Consolidated Financial Statements and Notes Notes to the Statement of Profit or Loss 176
Start
Notes to the Statement of Profit or Loss 9. Sales Revenue
Revenue recognition follows IFRS 15, Revenue from Contracts with Customers. The Standard defines a comprehensive model to determine when to recognize revenue and in what amount. Under IFRS 15, revenue recognized from contracts with customers is disaggregated into the categories of the “nature of products” as well as “geographical regions” and shown in the following table. The categorization by “nature of products” corresponds to the reportable segments as the identification of the reportable segments is based in particular on the different products sold. Regional disaggregation of revenue is based on the customer's location.
2020 2019
€ in K GroupBioprocess
SolutionsLab Products &
Services GroupBioprocess
SolutionsLab Products &
Services
Sales revenue 2,335,657 1,782,622 553,035 1,826,966 1,350,470 476,496
EMEA 935,078 698,476 236,601 733,425 524,835 208,590
Americas 812,212 651,268 160,943 629,884 501,137 128,746
Asia | Pacific 588,368 432,878 155,490 463,657 324,498 139,159
The Group produces and sells instruments and consumables as well as related services in its segments BPS and LPS. The Group satisfies its performance obligations depending on the goods to be transferred and the promised services. The far majority of revenues from sales of products is recognized at a point in time when the customer obtains control over the goods. This is typically the case when the significant risks and rewards of ownership of the goods are transferred to the customer. Therefore, the point in time may vary depending on the agreement with the individual customer.
For complex products that require installation at the customer’s site, revenue is recognized upon formal customer acceptance. To a small extent, revenue is recognized over time in the customer-specific project business. In these cases, revenue is recognized according to project progress, which is measured based on the percentage of costs to date compared to total estimated contract costs. The amount of actual costs incurred to date reflects the progress and the transfer of control to the customer appropriately as the Group has a right to receive a reimbursement of costs to date plus an appropriate margin, if the project is cancelled by the customer without cause. Revenue from services is generally recognized when the services are performed or have been performed. When the services are performed continuously over a period of time, the Group recognizes the related revenue over time. In this case, revenue is generally recognized pro rata in relation to the total contract period. Product sales are typically accompanied by the legally required warranty. Any material extended warranties are accounted for as separate performance obligations.
According to the general payment terms, customer payments are due in the short term, typically within 30 days. To some extent, the Group obtains advance payments, e.g., to avoid credit risks. Therefore, the Group regularly has contract liabilities (payments received on account of orders). In addition, the Group recognizes contract liabilities in connection with service contracts (deferred revenues) when customers pay in advance.
There are no material effects from contracts with significant financing components. The Group uses the practical expedient provided by IFRS 15 regarding the existence of a significant financing component. This means that a financing component is only taken into consideration when the length of time between the transfer of goods or services and the receipt of consideration is expected to exceed one year and the effect is material.
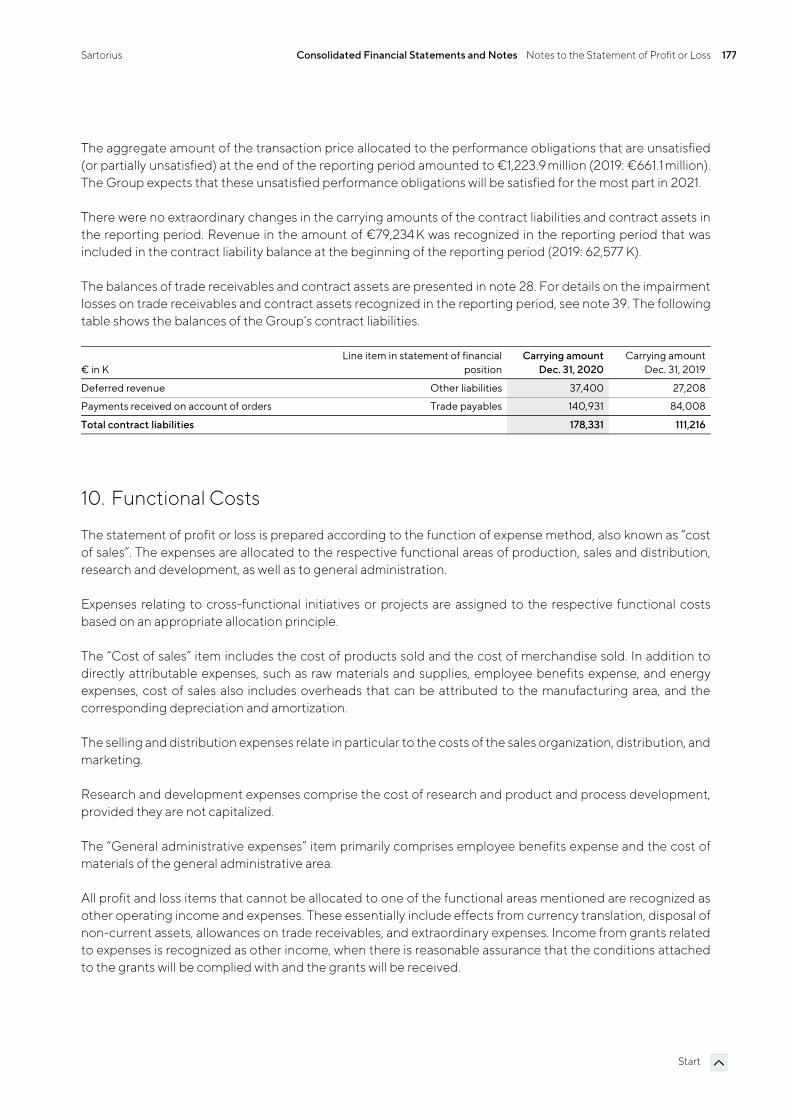
Sartorius Consolidated Financial Statements and Notes Notes to the Statement of Profit or Loss 177
Start
The aggregate amount of the transaction price allocated to the performance obligations that are unsatisfied (or partially unsatisfied) at the end of the reporting period amounted to €1,223.9 million (2019: €661.1 million). The Group expects that these unsatisfied performance obligations will be satisfied for the most part in 2021.
There were no extraordinary changes in the carrying amounts of the contract liabilities and contract assets in the reporting period. Revenue in the amount of €79,234 K was recognized in the reporting period that was included in the contract liability balance at the beginning of the reporting period (2019: 62,577 K).
The balances of trade receivables and contract assets are presented in note 28. For details on the impairment losses on trade receivables and contract assets recognized in the reporting period, see note 39. The following table shows the balances of the Group’s contract liabilities.
€ in K Line item in statement of financial
positionCarrying amount
Dec. 31, 2020Carrying amount
Dec. 31, 2019
Deferred revenue Other liabilities 37,400 27,208
Payments received on account of orders Trade payables 140,931 84,008
Total contract liabilities 178,331 111,216
10. Functional Costs
The statement of profit or loss is prepared according to the function of expense method, also known as “cost of sales”. The expenses are allocated to the respective functional areas of production, sales and distribution, research and development, as well as to general administration.
Expenses relating to cross-functional initiatives or projects are assigned to the respective functional costs based on an appropriate allocation principle.
The “Cost of sales” item includes the cost of products sold and the cost of merchandise sold. In addition to directly attributable expenses, such as raw materials and supplies, employee benefits expense, and energy expenses, cost of sales also includes overheads that can be attributed to the manufacturing area, and the corresponding depreciation and amortization.
The selling and distribution expenses relate in particular to the costs of the sales organization, distribution, and marketing.
Research and development expenses comprise the cost of research and product and process development, provided they are not capitalized.
The “General administrative expenses” item primarily comprises employee benefits expense and the cost of materials of the general administrative area.
All profit and loss items that cannot be allocated to one of the functional areas mentioned are recognized as other operating income and expenses. These essentially include effects from currency translation, disposal of non-current assets, allowances on trade receivables, and extraordinary expenses. Income from grants related to expenses is recognized as other income, when there is reasonable assurance that the conditions attached to the grants will be complied with and the grants will be received.
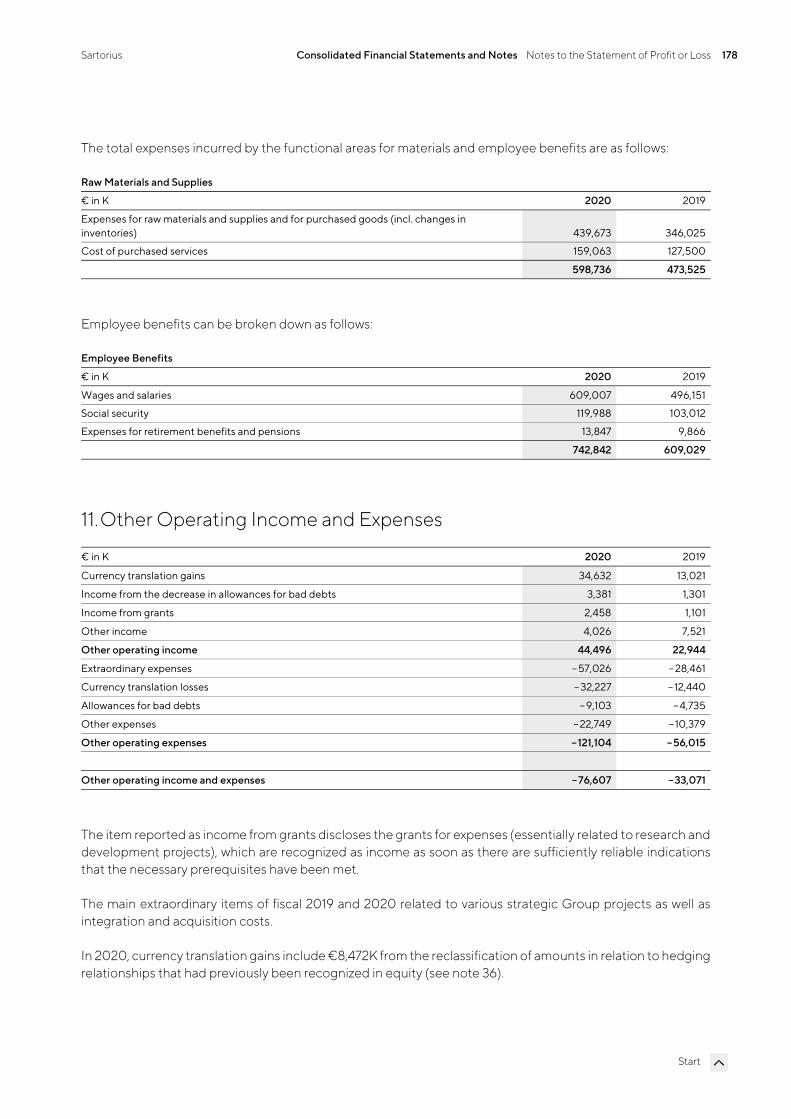
Sartorius Consolidated Financial Statements and Notes Notes to the Statement of Profit or Loss 178
Start
The total expenses incurred by the functional areas for materials and employee benefits are as follows:
Raw Materials and Supplies
€ in K 2020 2019
Expenses for raw materials and supplies and for purchased goods (incl. changes in inventories) 439,673 346,025
Cost of purchased services 159,063 127,500
598,736 473,525
Employee benefits can be broken down as follows:
Employee Benefits
€ in K 2020 2019
Wages and salaries 609,007 496,151
Social security 119,988 103,012
Expenses for retirement benefits and pensions 13,847 9,866
742,842 609,029
11.Other Operating Income and Expenses
€ in K 2020 2019
Currency translation gains 34,632 13,021
Income from the decrease in allowances for bad debts 3,381 1,301
Income from grants 2,458 1,101
Other income 4,026 7,521
Other operating income 44,496 22,944
Extraordinary expenses – 57,026 – 28,461
Currency translation losses – 32,227 – 12,440
Allowances for bad debts – 9,103 – 4,735
Other expenses – 22,749 – 10,379
Other operating expenses –121,104 –56,015
Other operating income and expenses –76,607 –33,071
The item reported as income from grants discloses the grants for expenses (essentially related to research and development projects), which are recognized as income as soon as there are sufficiently reliable indications that the necessary prerequisites have been met.
The main extraordinary items of fiscal 2019 and 2020 related to various strategic Group projects as well as integration and acquisition costs.
In 2020, currency translation gains include €8,472K from the reclassification of amounts in relation to hedging relationships that had previously been recognized in equity (see note 36).
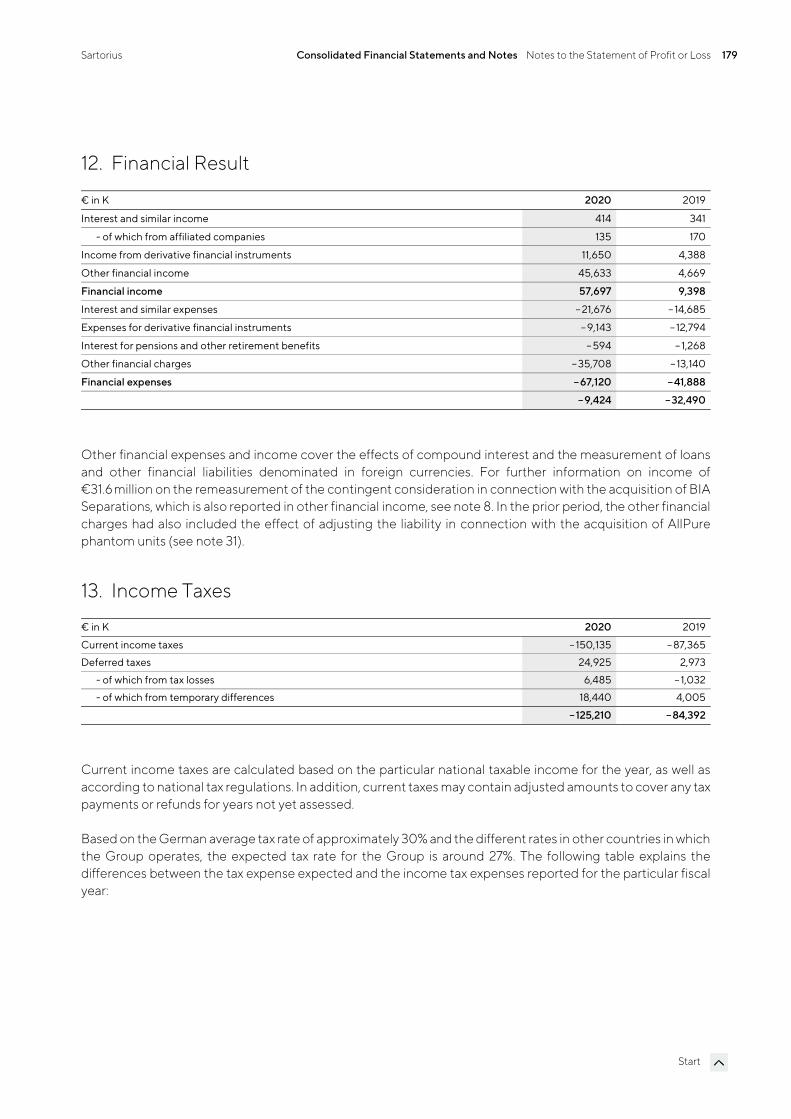
Sartorius Consolidated Financial Statements and Notes Notes to the Statement of Profit or Loss 179
Start
12. Financial Result
€ in K 2020 2019
Interest and similar income 414 341
- of which from affiliated companies 135 170
Income from derivative financial instruments 11,650 4,388
Other financial income 45,633 4,669
Financial income 57,697 9,398
Interest and similar expenses – 21,676 – 14,685
Expenses for derivative financial instruments – 9,143 – 12,794
Interest for pensions and other retirement benefits – 594 – 1,268
Other financial charges – 35,708 – 13,140
Financial expenses –67,120 –41,888
–9,424 –32,490
Other financial expenses and income cover the effects of compound interest and the measurement of loans and other financial liabilities denominated in foreign currencies. For further information on income of €31.6 million on the remeasurement of the contingent consideration in connection with the acquisition of BIA Separations, which is also reported in other financial income, see note 8. In the prior period, the other financial charges had also included the effect of adjusting the liability in connection with the acquisition of AllPure phantom units (see note 31).
13. Income Taxes
€ in K 2020 2019
Current income taxes – 150,135 – 87,365
Deferred taxes 24,925 2,973
- of which from tax losses 6,485 – 1,032
- of which from temporary differences 18,440 4,005
–125,210 –84,392
Current income taxes are calculated based on the particular national taxable income for the year, as well as according to national tax regulations. In addition, current taxes may contain adjusted amounts to cover any tax payments or refunds for years not yet assessed.
Based on the German average tax rate of approximately 30% and the different rates in other countries in which the Group operates, the expected tax rate for the Group is around 27%. The following table explains the differences between the tax expense expected and the income tax expenses reported for the particular fiscal year:

Sartorius Consolidated Financial Statements and Notes Notes to the Statement of Profit or Loss 180
Start
€ in K 2020 2019
Expected tax rate 27% 27%
Expected tax expense – 120,604 – 81,807
Difference from the Group average income tax rate 14,858 13,233
Effects from intragroup dividends and other non-deductible expenses – 13,411 – 9,449
Steuerfreie Erträge und Steuergutschriften 13,253 4,111
Deductible temporary differences and tax losses not capitalized –7,426 – 5,451
Taxes from previous years and adjustments from the revised evaluation of the recoverability of deferred tax assets – 9,973 – 2,731
Withholding and similar taxes – 2,351 – 1,364
Changes in tax rates 244 – 741
Other 200 – 193
–125,210 –84,392
Effective tax rate 28.0% 27.9%
14. Earnings per Share
IAS 33, Earnings per Share, requires earnings per share to be calculated separately for each class of share. The undiluted earnings per share (basic EPS) are calculated based on the weighted average number of ordinary shares outstanding during the period. Treasury shares are not included in the calculation of the average number of shares outstanding.
2020 2019
Ordinary shares
Basis for calculating basic earnings per ordinary share (net profit after non-controlling interest), € in K 113,026 78,216
Weighted average number of shares outstanding 34,212,224 34,212,224
Basic earnings per ordinary share in € 3.30 2.29
Weighted average number of shares outstanding for calculating the diluted earnings per share 34,212,224 34,212,224
Diluted earnings per ordinary share, in € 3.30 2.29
Preference shares
Basis for calculating basic earnings per preference share (net profit after minority interest), € in K 113,248 78,476
Weighted average number of shares outstanding 34,176,068 34,176,068
Basic earnings per preference share in € 3.31 2.30
Weighted average number of shares outstanding for calculating the diluted earnings per share 34,176,068 34,176,068
Diluted earnings per preference share, in € 3.31 2.30
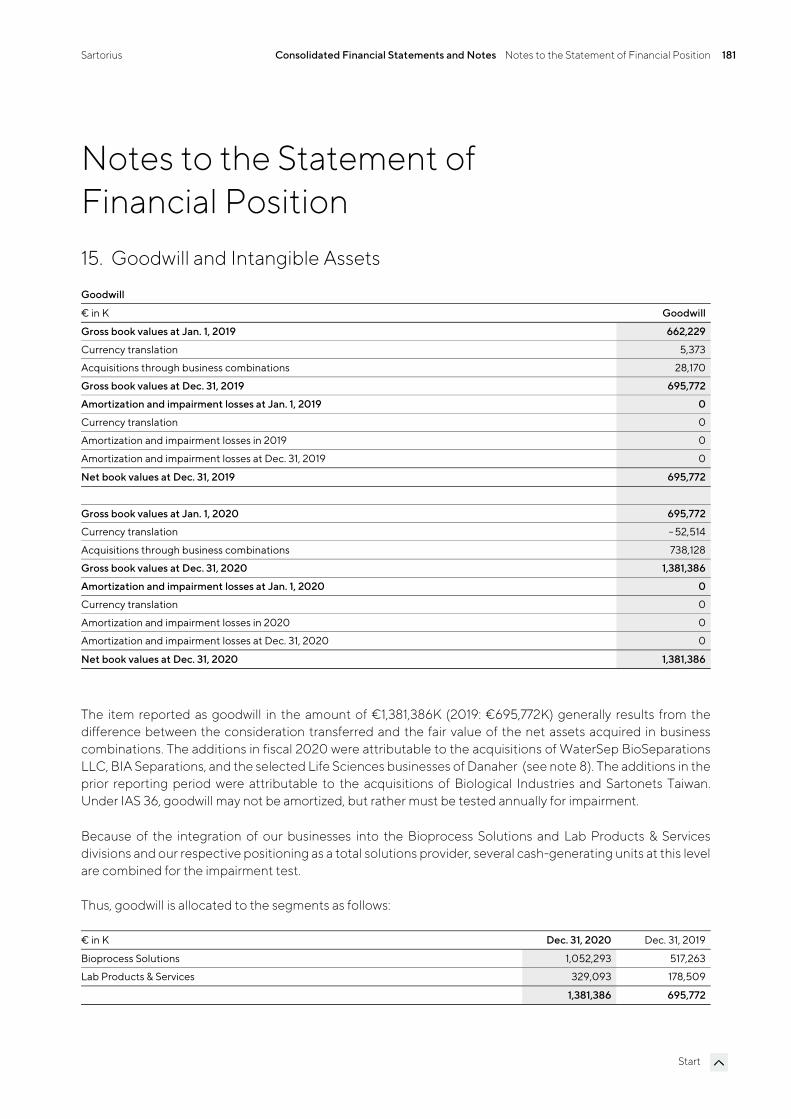
Sartorius Consolidated Financial Statements and Notes Notes to the Statement of Financial Position 181
Start
Notes to the Statement of Financial Position 15. Goodwill and Intangible Assets
Goodwill
€ in K Goodwill
Gross book values at Jan. 1, 2019 662,229
Currency translation 5,373
Acquisitions through business combinations 28,170
Gross book values at Dec. 31, 2019 695,772
Amortization and impairment losses at Jan. 1, 2019 0
Currency translation 0
Amortization and impairment losses in 2019 0
Amortization and impairment losses at Dec. 31, 2019 0
Net book values at Dec. 31, 2019 695,772
Gross book values at Jan. 1, 2020 695,772
Currency translation – 52,514
Acquisitions through business combinations 738,128
Gross book values at Dec. 31, 2020 1,381,386
Amortization and impairment losses at Jan. 1, 2020 0
Currency translation 0
Amortization and impairment losses in 2020 0
Amortization and impairment losses at Dec. 31, 2020 0
Net book values at Dec. 31, 2020 1,381,386
The item reported as goodwill in the amount of €1,381,386K (2019: €695,772K) generally results from the difference between the consideration transferred and the fair value of the net assets acquired in business combinations. The additions in fiscal 2020 were attributable to the acquisitions of WaterSep BioSeparations LLC, BIA Separations, and the selected Life Sciences businesses of Danaher (see note 8). The additions in the prior reporting period were attributable to the acquisitions of Biological Industries and Sartonets Taiwan. Under IAS 36, goodwill may not be amortized, but rather must be tested annually for impairment.
Because of the integration of our businesses into the Bioprocess Solutions and Lab Products & Services divisions and our respective positioning as a total solutions provider, several cash-generating units at this level are combined for the impairment test.
Thus, goodwill is allocated to the segments as follows:
€ in K Dec. 31, 2020 Dec. 31, 2019
Bioprocess Solutions 1,052,293 517,263
Lab Products & Services 329,093 178,509
1,381,386 695,772
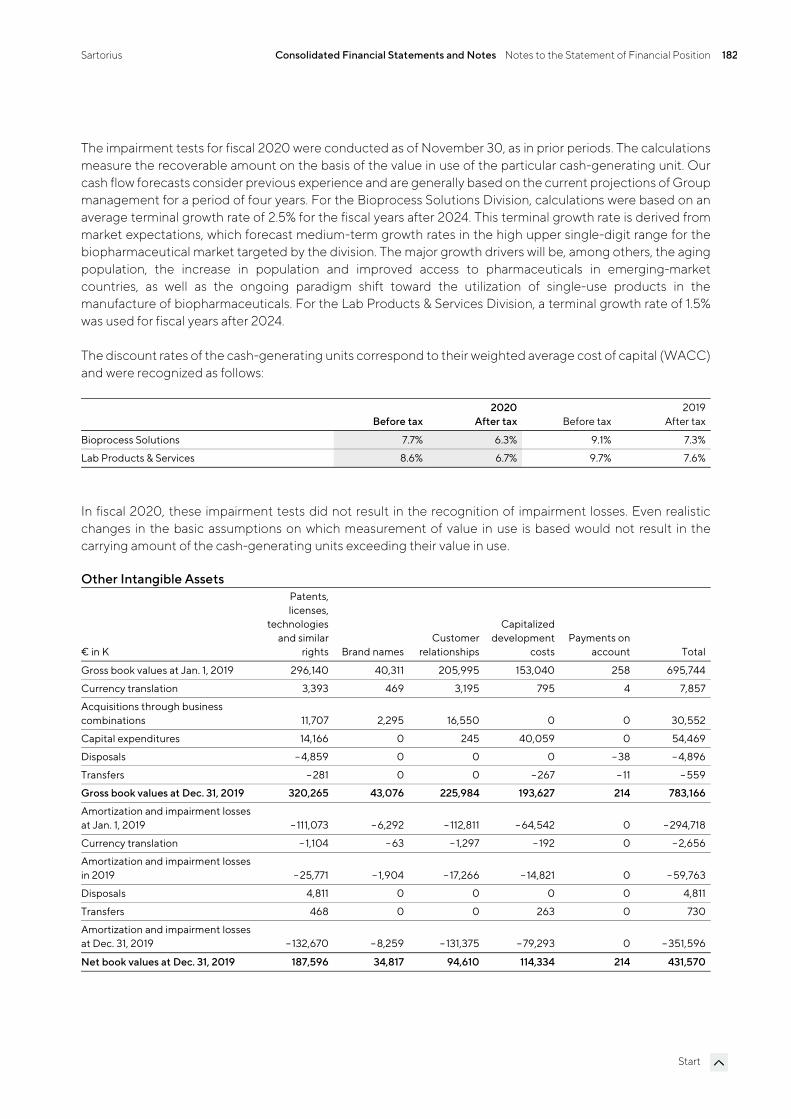
Sartorius Consolidated Financial Statements and Notes Notes to the Statement of Financial Position 182
Start
The impairment tests for fiscal 2020 were conducted as of November 30, as in prior periods. The calculations measure the recoverable amount on the basis of the value in use of the particular cash-generating unit. Our cash flow forecasts consider previous experience and are generally based on the current projections of Group management for a period of four years. For the Bioprocess Solutions Division, calculations were based on an average terminal growth rate of 2.5% for the fiscal years after 2024. This terminal growth rate is derived from market expectations, which forecast medium-term growth rates in the high upper single-digit range for the biopharmaceutical market targeted by the division. The major growth drivers will be, among others, the aging population, the increase in population and improved access to pharmaceuticals in emerging-market countries, as well as the ongoing paradigm shift toward the utilization of single-use products in the manufacture of biopharmaceuticals. For the Lab Products & Services Division, a terminal growth rate of 1.5% was used for fiscal years after 2024.
The discount rates of the cash-generating units correspond to their weighted average cost of capital (WACC) and were recognized as follows:
Before tax2020
After tax Before tax2019
After tax
Bioprocess Solutions 7.7% 6.3% 9.1% 7.3%
Lab Products & Services 8.6% 6.7% 9.7% 7.6%
In fiscal 2020, these impairment tests did not result in the recognition of impairment losses. Even realistic changes in the basic assumptions on which measurement of value in use is based would not result in the carrying amount of the cash-generating units exceeding their value in use.
Other Intangible Assets
€ in K
Patents, licenses,
technologies and similar
rights Brand namesCustomer
relationships
Capitalizeddevelopment
costsPayments on
account Total
Gross book values at Jan. 1, 2019 296,140 40,311 205,995 153,040 258 695,744
Currency translation 3,393 469 3,195 795 4 7,857
Acquisitions through business combinations 11,707 2,295 16,550 0 0 30,552
Capital expenditures 14,166 0 245 40,059 0 54,469
Disposals – 4,859 0 0 0 – 38 – 4,896
Transfers – 281 0 0 – 267 – 11 – 559
Gross book values at Dec. 31, 2019 320,265 43,076 225,984 193,627 214 783,166
Amortization and impairment losses at Jan. 1, 2019 – 111,073 – 6,292 – 112,811 – 64,542 0 – 294,718
Currency translation – 1,104 – 63 – 1,297 – 192 0 – 2,656
Amortization and impairment losses in 2019 – 25,771 – 1,904 – 17,266 – 14,821 0 – 59,763
Disposals 4,811 0 0 0 0 4,811
Transfers 468 0 0 263 0 730
Amortization and impairment losses at Dec. 31, 2019 –132,670 – 8,259 – 131,375 – 79,293 0 – 351,596
Net book values at Dec. 31, 2019 187,596 34,817 94,610 114,334 214 431,570
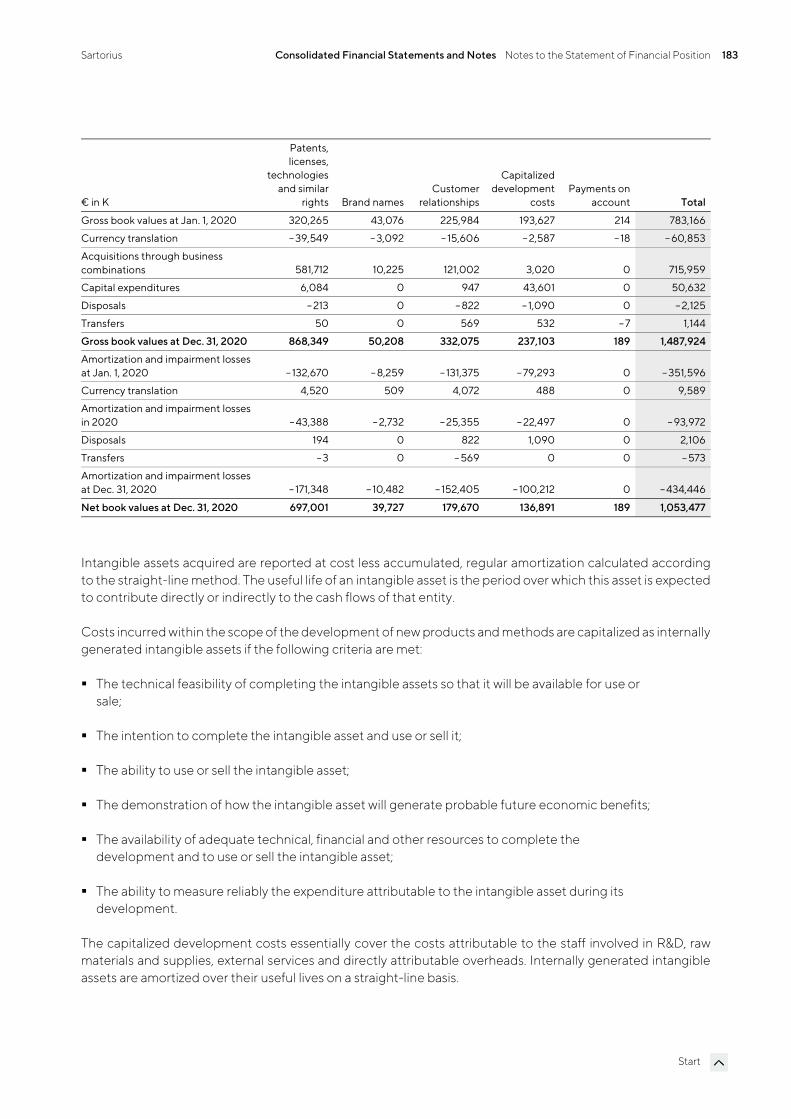
Sartorius Consolidated Financial Statements and Notes Notes to the Statement of Financial Position 183
Start
€ in K
Patents, licenses,
technologies and similar
rights Brand namesCustomer
relationships
Capitalizeddevelopment
costsPayments on
account Total
Gross book values at Jan. 1, 2020 320,265 43,076 225,984 193,627 214 783,166
Currency translation – 39,549 – 3,092 – 15,606 – 2,587 – 18 – 60,853
Acquisitions through business combinations 581,712 10,225 121,002 3,020 0 715,959
Capital expenditures 6,084 0 947 43,601 0 50,632
Disposals – 213 0 – 822 – 1,090 0 – 2,125
Transfers 50 0 569 532 – 7 1,144
Gross book values at Dec. 31, 2020 868,349 50,208 332,075 237,103 189 1,487,924
Amortization and impairment losses at Jan. 1, 2020 –132,670 – 8,259 – 131,375 – 79,293 0 – 351,596
Currency translation 4,520 509 4,072 488 0 9,589
Amortization and impairment losses in 2020 – 43,388 – 2,732 – 25,355 – 22,497 0 – 93,972
Disposals 194 0 822 1,090 0 2,106
Transfers –3 0 – 569 0 0 – 573
Amortization and impairment losses at Dec. 31, 2020 – 171,348 – 10,482 – 152,405 – 100,212 0 – 434,446
Net book values at Dec. 31, 2020 697,001 39,727 179,670 136,891 189 1,053,477
Intangible assets acquired are reported at cost less accumulated, regular amortization calculated according to the straight-line method. The useful life of an intangible asset is the period over which this asset is expected to contribute directly or indirectly to the cash flows of that entity.
Costs incurred within the scope of the development of new products and methods are capitalized as internally generated intangible assets if the following criteria are met:
The technical feasibility of completing the intangible assets so that it will be available for use or sale;
The intention to complete the intangible asset and use or sell it;
The ability to use or sell the intangible asset;
The demonstration of how the intangible asset will generate probable future economic benefits;
The availability of adequate technical, financial and other resources to complete the development and to use or sell the intangible asset;
The ability to measure reliably the expenditure attributable to the intangible asset during its development.
The capitalized development costs essentially cover the costs attributable to the staff involved in R&D, raw materials and supplies, external services and directly attributable overheads. Internally generated intangible assets are amortized over their useful lives on a straight-line basis.
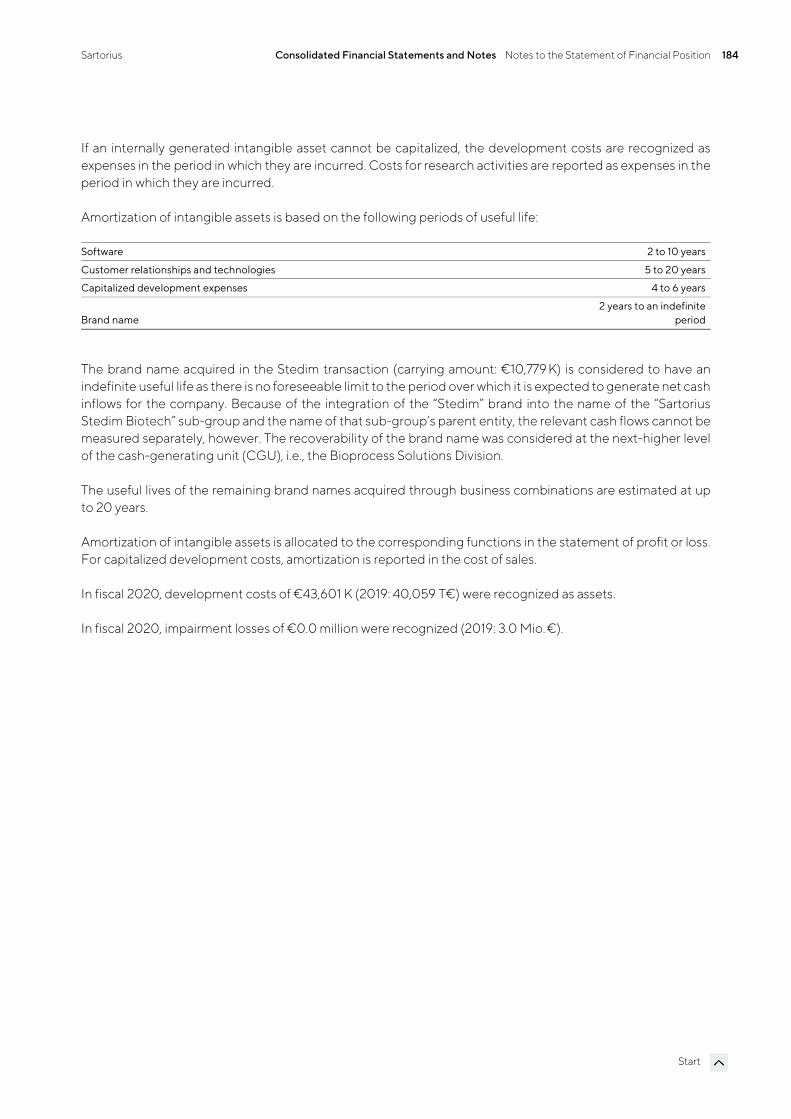
Sartorius Consolidated Financial Statements and Notes Notes to the Statement of Financial Position 184
Start
If an internally generated intangible asset cannot be capitalized, the development costs are recognized as expenses in the period in which they are incurred. Costs for research activities are reported as expenses in the period in which they are incurred.
Amortization of intangible assets is based on the following periods of useful life:
Software 2 to 10 years
Customer relationships and technologies 5 to 20 years
Capitalized development expenses 4 to 6 years
Brand name 2 years to an indefinite
period
The brand name acquired in the Stedim transaction (carrying amount: €10,779 K) is considered to have an indefinite useful life as there is no foreseeable limit to the period over which it is expected to generate net cash inflows for the company. Because of the integration of the “Stedim” brand into the name of the “Sartorius Stedim Biotech” sub-group and the name of that sub-group’s parent entity, the relevant cash flows cannot be measured separately, however. The recoverability of the brand name was considered at the next-higher level of the cash-generating unit (CGU), i.e., the Bioprocess Solutions Division.
The useful lives of the remaining brand names acquired through business combinations are estimated at up to 20 years.
Amortization of intangible assets is allocated to the corresponding functions in the statement of profit or loss. For capitalized development costs, amortization is reported in the cost of sales.
In fiscal 2020, development costs of €43,601 K (2019: 40,059 T€) were recognized as assets.
In fiscal 2020, impairment losses of €0.0 million were recognized (2019: 3.0 Mio. €).
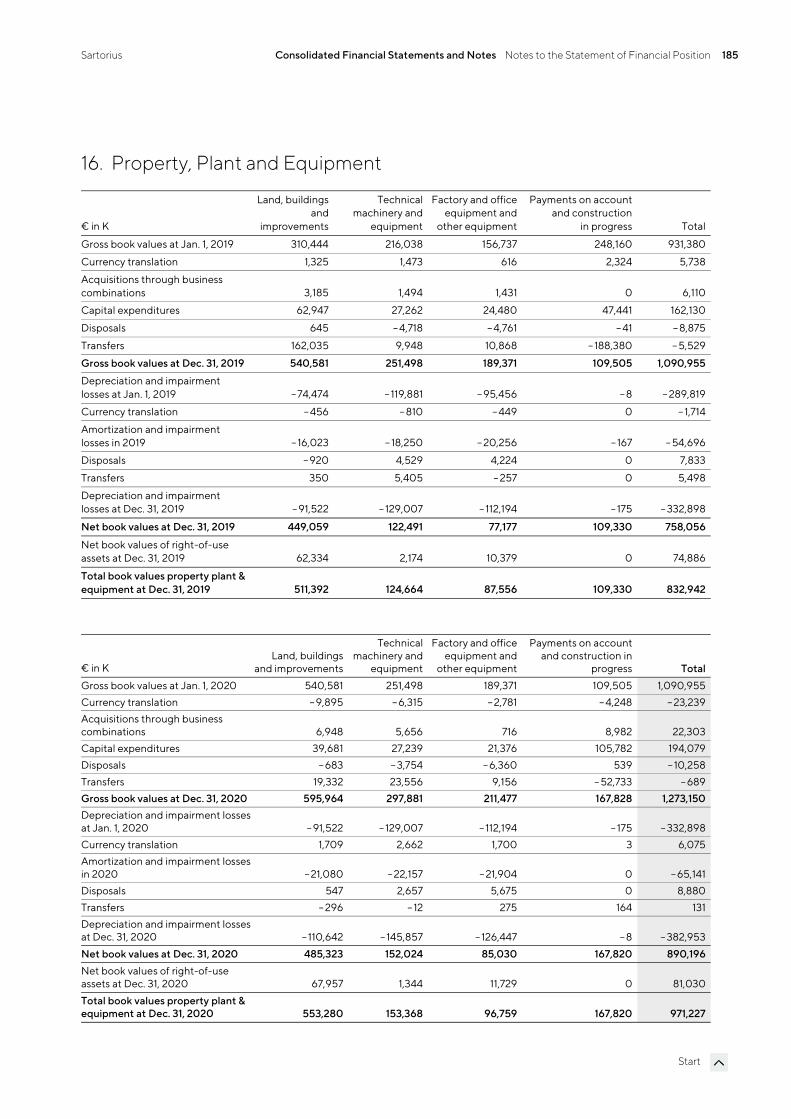
Sartorius Consolidated Financial Statements and Notes Notes to the Statement of Financial Position 185
Start
16. Property, Plant and Equipment
€ in K
Land, buildings and
improvements
Technical machinery and
equipment
Factory and office equipment and
other equipment
Payments on account and construction
in progress Total
Gross book values at Jan. 1, 2019 310,444 216,038 156,737 248,160 931,380
Currency translation 1,325 1,473 616 2,324 5,738
Acquisitions through business combinations 3,185 1,494 1,431 0 6,110
Capital expenditures 62,947 27,262 24,480 47,441 162,130
Disposals 645 – 4,718 – 4,761 – 41 – 8,875
Transfers 162,035 9,948 10,868 – 188,380 – 5,529
Gross book values at Dec. 31, 2019 540,581 251,498 189,371 109,505 1,090,955
Depreciation and impairment losses at Jan. 1, 2019 –74,474 – 119,881 – 95,456 –8 – 289,819
Currency translation – 456 – 810 – 449 0 – 1,714
Amortization and impairment losses in 2019 – 16,023 – 18,250 – 20,256 – 167 – 54,696
Disposals – 920 4,529 4,224 0 7,833
Transfers 350 5,405 – 257 0 5,498
Depreciation and impairment losses at Dec. 31, 2019 – 91,522 – 129,007 – 112,194 – 175 – 332,898
Net book values at Dec. 31, 2019 449,059 122,491 77,177 109,330 758,056
Net book values of right-of-use assets at Dec. 31, 2019 62,334 2,174 10,379 0 74,886
Total book values property plant & equipment at Dec. 31, 2019 511,392 124,664 87,556 109,330 832,942
€ in K Land, buildings
and improvements
Technical machinery and
equipment
Factory and office equipment and
other equipment
Payments on account and construction in
progress TotalGross book values at Jan. 1, 2020 540,581 251,498 189,371 109,505 1,090,955Currency translation – 9,895 – 6,315 – 2,781 – 4,248 – 23,239Acquisitions through business combinations 6,948 5,656 716 8,982 22,303Capital expenditures 39,681 27,239 21,376 105,782 194,079Disposals – 683 – 3,754 – 6,360 539 – 10,258Transfers 19,332 23,556 9,156 – 52,733 – 689Gross book values at Dec. 31, 2020 595,964 297,881 211,477 167,828 1,273,150Depreciation and impairment losses at Jan. 1, 2020 – 91,522 – 129,007 – 112,194 – 175 – 332,898Currency translation 1,709 2,662 1,700 3 6,075Amortization and impairment losses in 2020 –21,080 – 22,157 – 21,904 0 – 65,141Disposals 547 2,657 5,675 0 8,880Transfers – 296 – 12 275 164 131Depreciation and impairment losses at Dec. 31, 2020 –110,642 – 145,857 – 126,447 –8 – 382,953Net book values at Dec. 31, 2020 485,323 152,024 85,030 167,820 890,196Net book values of right-of-use assets at Dec. 31, 2020 67,957 1,344 11,729 0 81,030Total book values property plant & equipment at Dec. 31, 2020 553,280 153,368 96,759 167,820 971,227
Sartorius Consolidated Financial Statements and Notes Notes to the Statement of Financial Position 186
Start
The “Property, plant and equipment” item is reported at cost and, if subject to depreciation, reduced by regular depreciation. Impairment tests are conducted when impairment indicators are identified. The straight-line method is applied to depreciation reported in the consolidated financial statements.
Depreciation of non-current assets is based on the following periods of useful life:
Buildings 15 to 50 years
Machinery 5 to 15 years
Factory and office equipment 3 to 13 years
Depreciation is presented in the statement of profit or loss according to how the assets are used, in the cost of sales, selling and distribution expenses, research and development expenses, administrative expenses, and other operating expenses.
Borrowing costs are expensed as incurred unless they are directly attributable to the acquisition, construction, or production of a qualifying asset and are therefore part of the cost of that asset. An asset is deemed to be a qualifying asset if a substantial period of time (6 or 12 months) is required to ensure that it will be in the intended state ready for use or sale.
Grants related to assets are generally deducted from the cost of assets.
17. Leases
Since 2019, lease accounting follows IFRS 16, Leases. A lease is a contract, or part of a contract, that conveys the right to use an asset for a period of time in exchange for consideration. For the financing structure of the Sartorius Group, leases are not of high relevance. In the past, the Group made large own investments in its sites. The main considerations for leases are therefore generally of a practical nature, for example, with regard to the company's management of IT hardware or its fleet management. Accordingly, leases of IT hardware and cars represent the majority of the Group’s lease contracts. The lease term of such leases is generally fixed and typically covers three to five years.
Furthermore, at some sites, the Group has long-term leases of buildings, which are negotiated and managed locally. These contracts may contain extension options, which are included in the lease term according to IFRS 16 when the Group is reasonably certain that the option will be exercised. The Group does not act as a lessor to a material extent.
The Standard formulates a standardized accounting model according to which leases are generally to be recognized in the lessee's statement of financial position. A lessee recognizes a right-of-use asset as well as a lease liability, which represents its obligation to make lease payments.
The Group makes use of the exemptions for short-term leases and leases of low-value assets and recognizes the corresponding lease payments as an expense generally on a straight-line basis over the particular lease term. Accordingly, no right-of-use assets and no lease liabilities are recognized for these leases. Furthermore, no right-of-use assets and no liabilities are recognized for leases between Group entities. The Group does not apply this Standard to leases of intangible assets.
In the statement of financial position, the Group presents right-of-use assets according to the nature of the underlying lease assets under “Property, plant, and equipment.” Right-of-use assets are recognized at cost less accumulated depreciation and any impairment losses. The cost of the right-of-use assets comprises the present value of the future lease payments, any payments paid upon or before commencement of the lease,
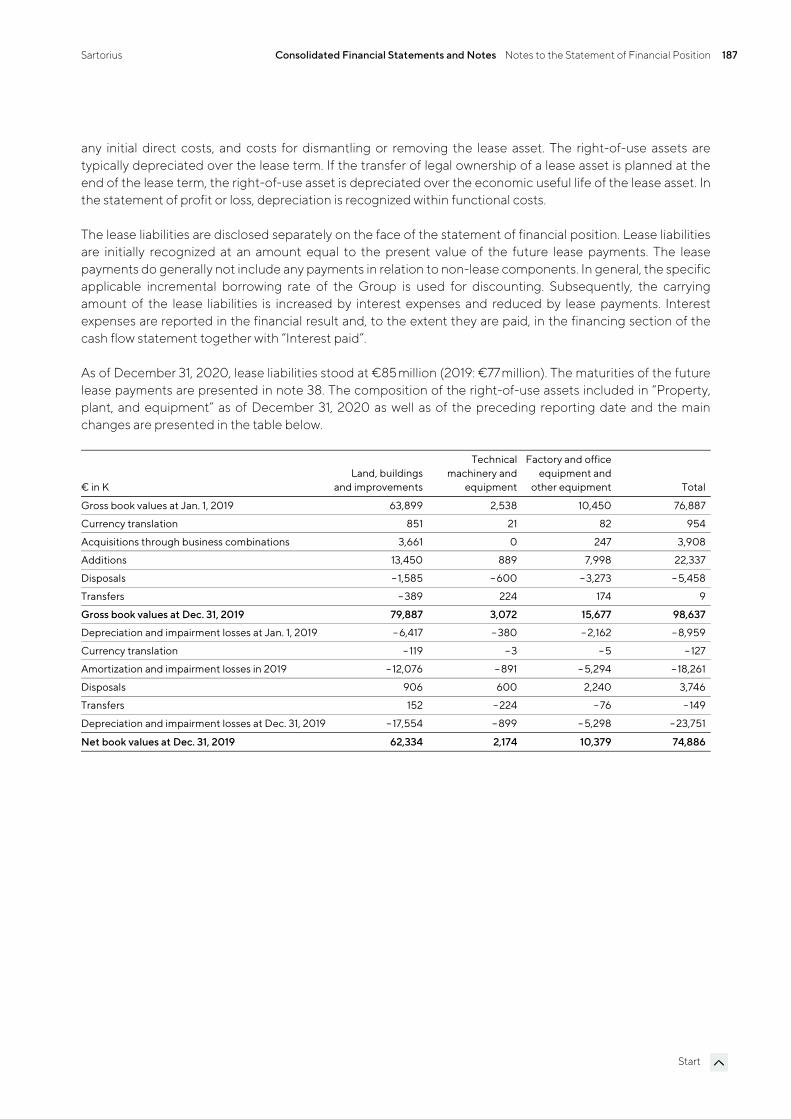
Sartorius Consolidated Financial Statements and Notes Notes to the Statement of Financial Position 187
Start
any initial direct costs, and costs for dismantling or removing the lease asset. The right-of-use assets are typically depreciated over the lease term. If the transfer of legal ownership of a lease asset is planned at the end of the lease term, the right-of-use asset is depreciated over the economic useful life of the lease asset. In the statement of profit or loss, depreciation is recognized within functional costs.
The lease liabilities are disclosed separately on the face of the statement of financial position. Lease liabilities are initially recognized at an amount equal to the present value of the future lease payments. The lease payments do generally not include any payments in relation to non-lease components. In general, the specific applicable incremental borrowing rate of the Group is used for discounting. Subsequently, the carrying amount of the lease liabilities is increased by interest expenses and reduced by lease payments. Interest expenses are reported in the financial result and, to the extent they are paid, in the financing section of the cash flow statement together with “Interest paid”.
As of December 31, 2020, lease liabilities stood at €85 million (2019: €77 million). The maturities of the future lease payments are presented in note 38. The composition of the right-of-use assets included in “Property, plant, and equipment” as of December 31, 2020 as well as of the preceding reporting date and the main changes are presented in the table below.
€ in K Land, buildings
and improvements
Technical machinery and
equipment
Factory and office equipment and
other equipment Total
Gross book values at Jan. 1, 2019 63,899 2,538 10,450 76,887
Currency translation 851 21 82 954
Acquisitions through business combinations 3,661 0 247 3,908
Additions 13,450 889 7,998 22,337
Disposals – 1,585 – 600 –3,273 – 5,458
Transfers – 389 224 174 9
Gross book values at Dec. 31, 2019 79,887 3,072 15,677 98,637
Depreciation and impairment losses at Jan. 1, 2019 – 6,417 – 380 – 2,162 – 8,959
Currency translation – 119 – 3 – 5 – 127
Amortization and impairment losses in 2019 – 12,076 – 891 – 5,294 – 18,261
Disposals 906 600 2,240 3,746
Transfers 152 – 224 – 76 – 149
Depreciation and impairment losses at Dec. 31, 2019 – 17,554 – 899 – 5,298 – 23,751
Net book values at Dec. 31, 2019 62,334 2,174 10,379 74,886
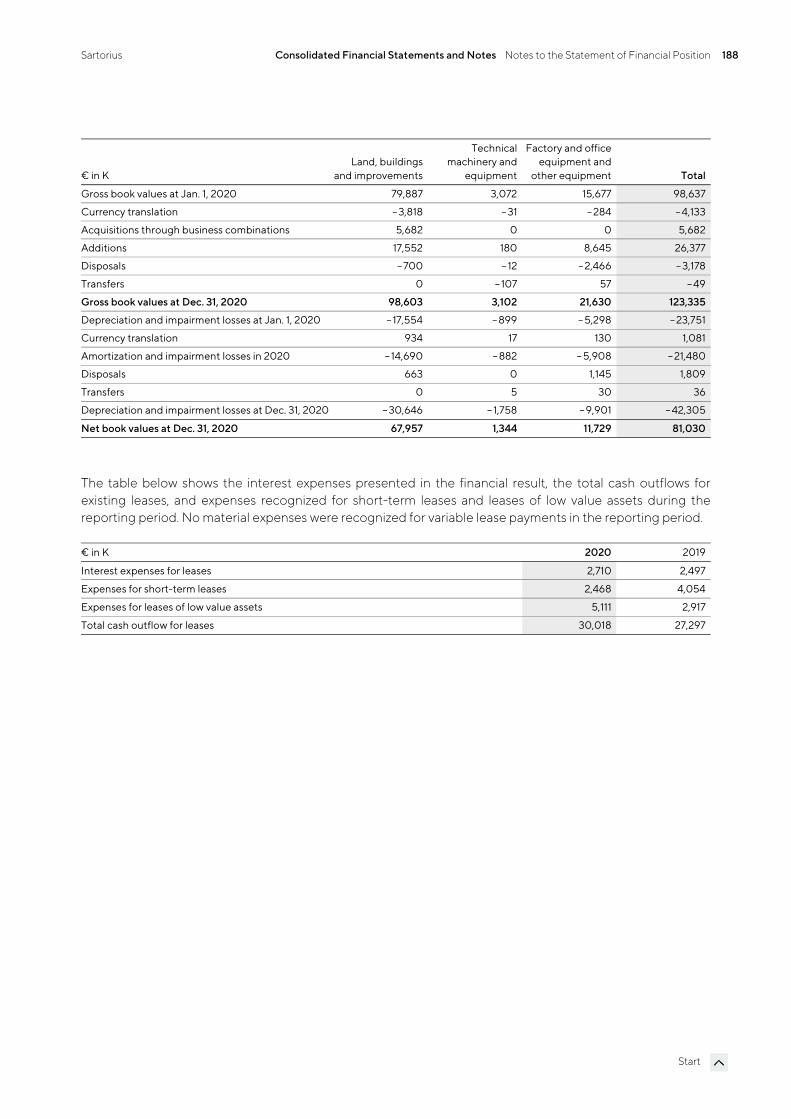
Sartorius Consolidated Financial Statements and Notes Notes to the Statement of Financial Position 188
Start
€ in K Land, buildings
and improvements
Technical machinery and
equipment
Factory and office equipment and
other equipment Total
Gross book values at Jan. 1, 2020 79,887 3,072 15,677 98,637
Currency translation – 3,818 – 31 – 284 – 4,133
Acquisitions through business combinations 5,682 0 0 5,682
Additions 17,552 180 8,645 26,377
Disposals – 700 – 12 – 2,466 – 3,178
Transfers 0 – 107 57 – 49
Gross book values at Dec. 31, 2020 98,603 3,102 21,630 123,335
Depreciation and impairment losses at Jan. 1, 2020 – 17,554 – 899 – 5,298 – 23,751
Currency translation 934 17 130 1,081
Amortization and impairment losses in 2020 – 14,690 – 882 – 5,908 – 21,480
Disposals 663 0 1,145 1,809
Transfers 0 5 30 36
Depreciation and impairment losses at Dec. 31, 2020 – 30,646 – 1,758 – 9,901 – 42,305
Net book values at Dec. 31, 2020 67,957 1,344 11,729 81,030
The table below shows the interest expenses presented in the financial result, the total cash outflows for existing leases, and expenses recognized for short-term leases and leases of low value assets during the reporting period. No material expenses were recognized for variable lease payments in the reporting period.
€ in K 2020 2019
Interest expenses for leases 2,710 2,497
Expenses for short-term leases 2,468 4,054
Expenses for leases of low value assets 5,111 2,917
Total cash outflow for leases 30,018 27,297
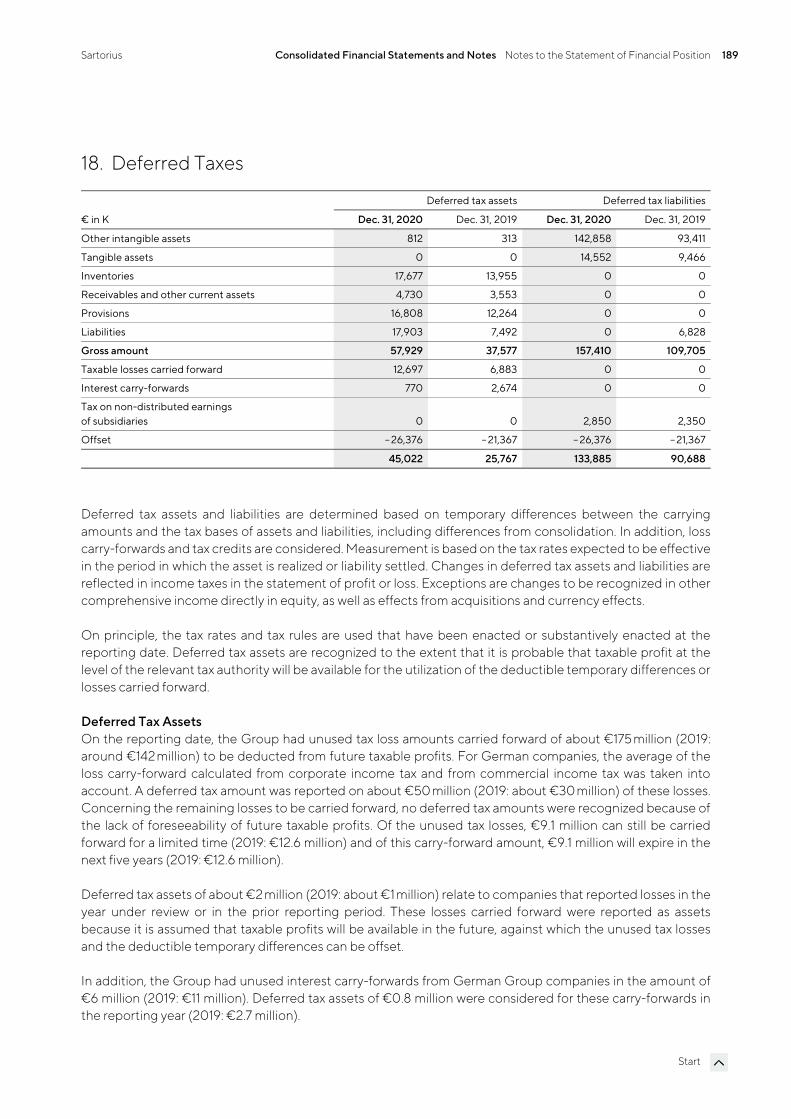
Sartorius Consolidated Financial Statements and Notes Notes to the Statement of Financial Position 189
Start
18. Deferred Taxes
Deferred tax assets Deferred tax liabilities
€ in K Dec. 31, 2020 Dec. 31, 2019 Dec. 31, 2020 Dec. 31, 2019
Other intangible assets 812 313 142,858 93,411
Tangible assets 0 0 14,552 9,466
Inventories 17,677 13,955 0 0
Receivables and other current assets 4,730 3,553 0 0
Provisions 16,808 12,264 0 0
Liabilities 17,903 7,492 0 6,828
Gross amount 57,929 37,577 157,410 109,705
Taxable losses carried forward 12,697 6,883 0 0
Interest carry-forwards 770 2,674 0 0
Tax on non-distributed earnings of subsidiaries 0 0 2,850 2,350
Offset – 26,376 – 21,367 – 26,376 – 21,367
45,022 25,767 133,885 90,688
Deferred tax assets and liabilities are determined based on temporary differences between the carrying amounts and the tax bases of assets and liabilities, including differences from consolidation. In addition, loss carry-forwards and tax credits are considered. Measurement is based on the tax rates expected to be effective in the period in which the asset is realized or liability settled. Changes in deferred tax assets and liabilities are reflected in income taxes in the statement of profit or loss. Exceptions are changes to be recognized in other comprehensive income directly in equity, as well as effects from acquisitions and currency effects.
On principle, the tax rates and tax rules are used that have been enacted or substantively enacted at the reporting date. Deferred tax assets are recognized to the extent that it is probable that taxable profit at the level of the relevant tax authority will be available for the utilization of the deductible temporary differences or losses carried forward.
Deferred Tax Assets On the reporting date, the Group had unused tax loss amounts carried forward of about €175 million (2019: around €142 million) to be deducted from future taxable profits. For German companies, the average of the loss carry-forward calculated from corporate income tax and from commercial income tax was taken into account. A deferred tax amount was reported on about €50 million (2019: about €30 million) of these losses. Concerning the remaining losses to be carried forward, no deferred tax amounts were recognized because of the lack of foreseeability of future taxable profits. Of the unused tax losses, €9.1 million can still be carried forward for a limited time (2019: €12.6 million) and of this carry-forward amount, €9.1 million will expire in the next five years (2019: €12.6 million).
Deferred tax assets of about €2 million (2019: about €1 million) relate to companies that reported losses in the year under review or in the prior reporting period. These losses carried forward were reported as assets because it is assumed that taxable profits will be available in the future, against which the unused tax losses and the deductible temporary differences can be offset.
In addition, the Group had unused interest carry-forwards from German Group companies in the amount of €6 million (2019: €11 million). Deferred tax assets of €0.8 million were considered for these carry-forwards in the reporting year (2019: €2.7 million).
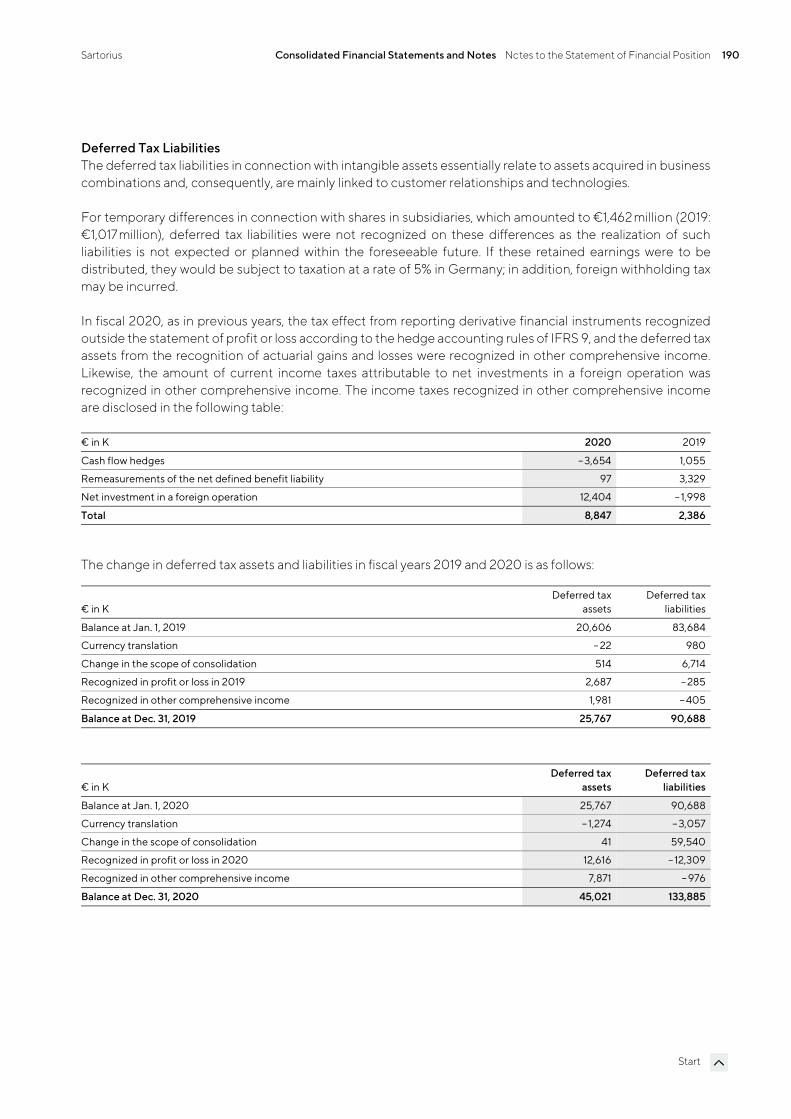
Sartorius Consolidated Financial Statements and Notes Notes to the Statement of Financial Position 190
Start
Deferred Tax Liabilities The deferred tax liabilities in connection with intangible assets essentially relate to assets acquired in business combinations and, consequently, are mainly linked to customer relationships and technologies.
For temporary differences in connection with shares in subsidiaries, which amounted to €1,462 million (2019: €1,017 million), deferred tax liabilities were not recognized on these differences as the realization of such liabilities is not expected or planned within the foreseeable future. If these retained earnings were to be distributed, they would be subject to taxation at a rate of 5% in Germany; in addition, foreign withholding tax may be incurred.
In fiscal 2020, as in previous years, the tax effect from reporting derivative financial instruments recognized outside the statement of profit or loss according to the hedge accounting rules of IFRS 9, and the deferred tax assets from the recognition of actuarial gains and losses were recognized in other comprehensive income. Likewise, the amount of current income taxes attributable to net investments in a foreign operation was recognized in other comprehensive income. The income taxes recognized in other comprehensive income are disclosed in the following table:
€ in K 2020 2019
Cash flow hedges – 3,654 1,055
Remeasurements of the net defined benefit liability 97 3,329
Net investment in a foreign operation 12,404 – 1,998
Total 8,847 2,386
The change in deferred tax assets and liabilities in fiscal years 2019 and 2020 is as follows:
€ in K Deferred tax
assetsDeferred tax
liabilities
Balance at Jan. 1, 2019 20,606 83,684
Currency translation – 22 980
Change in the scope of consolidation 514 6,714
Recognized in profit or loss in 2019 2,687 – 285
Recognized in other comprehensive income 1,981 – 405
Balance at Dec. 31, 2019 25,767 90,688
€ in K Deferred tax
assetsDeferred tax
liabilities
Balance at Jan. 1, 2020 25,767 90,688
Currency translation –1,274 – 3,057
Change in the scope of consolidation 41 59,540
Recognized in profit or loss in 2020 12,616 – 12,309
Recognized in other comprehensive income 7,871 – 976
Balance at Dec. 31, 2020 45,021 133,885
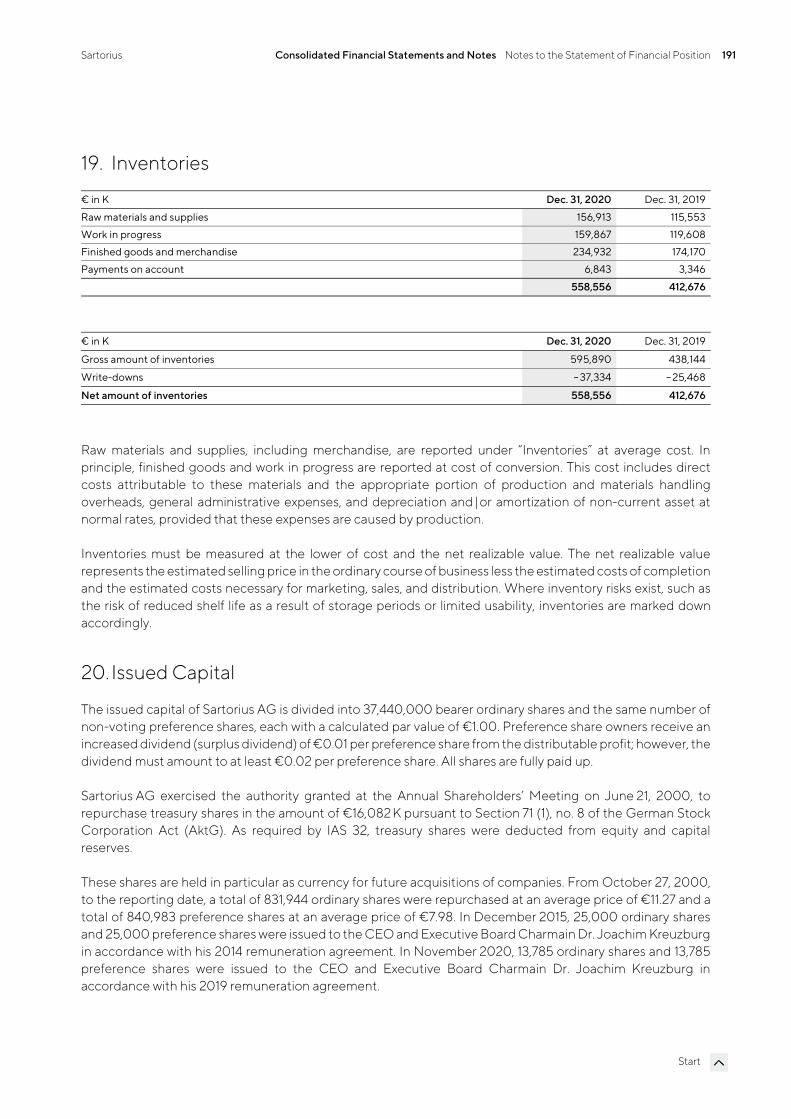
Sartorius Consolidated Financial Statements and Notes Notes to the Statement of Financial Position 191
Start
19. Inventories
€ in K Dec. 31, 2020 Dec. 31, 2019
Raw materials and supplies 156,913 115,553
Work in progress 159,867 119,608
Finished goods and merchandise 234,932 174,170
Payments on account 6,843 3,346
558,556 412,676
€ in K Dec. 31, 2020 Dec. 31, 2019
Gross amount of inventories 595,890 438,144
Write-downs – 37,334 – 25,468
Net amount of inventories 558,556 412,676
Raw materials and supplies, including merchandise, are reported under “Inventories” at average cost. In principle, finished goods and work in progress are reported at cost of conversion. This cost includes direct costs attributable to these materials and the appropriate portion of production and materials handling overheads, general administrative expenses, and depreciation and | or amortization of non-current asset at normal rates, provided that these expenses are caused by production.
Inventories must be measured at the lower of cost and the net realizable value. The net realizable value represents the estimated selling price in the ordinary course of business less the estimated costs of completion and the estimated costs necessary for marketing, sales, and distribution. Where inventory risks exist, such as the risk of reduced shelf life as a result of storage periods or limited usability, inventories are marked down accordingly.
20. Issued Capital
The issued capital of Sartorius AG is divided into 37,440,000 bearer ordinary shares and the same number of non-voting preference shares, each with a calculated par value of €1.00. Preference share owners receive an increased dividend (surplus dividend) of €0.01 per preference share from the distributable profit; however, the dividend must amount to at least €0.02 per preference share. All shares are fully paid up.
Sartorius AG exercised the authority granted at the Annual Shareholders’ Meeting on June 21, 2000, to repurchase treasury shares in the amount of €16,082 K pursuant to Section 71 (1), no. 8 of the German Stock Corporation Act (AktG). As required by IAS 32, treasury shares were deducted from equity and capital reserves.
These shares are held in particular as currency for future acquisitions of companies. From October 27, 2000, to the reporting date, a total of 831,944 ordinary shares were repurchased at an average price of €11.27 and a total of 840,983 preference shares at an average price of €7.98. In December 2015, 25,000 ordinary shares and 25,000 preference shares were issued to the CEO and Executive Board Charmain Dr. Joachim Kreuzburg in accordance with his 2014 remuneration agreement. In November 2020, 13,785 ordinary shares and 13,785 preference shares were issued to the CEO and Executive Board Charmain Dr. Joachim Kreuzburg in accordance with his 2019 remuneration agreement.
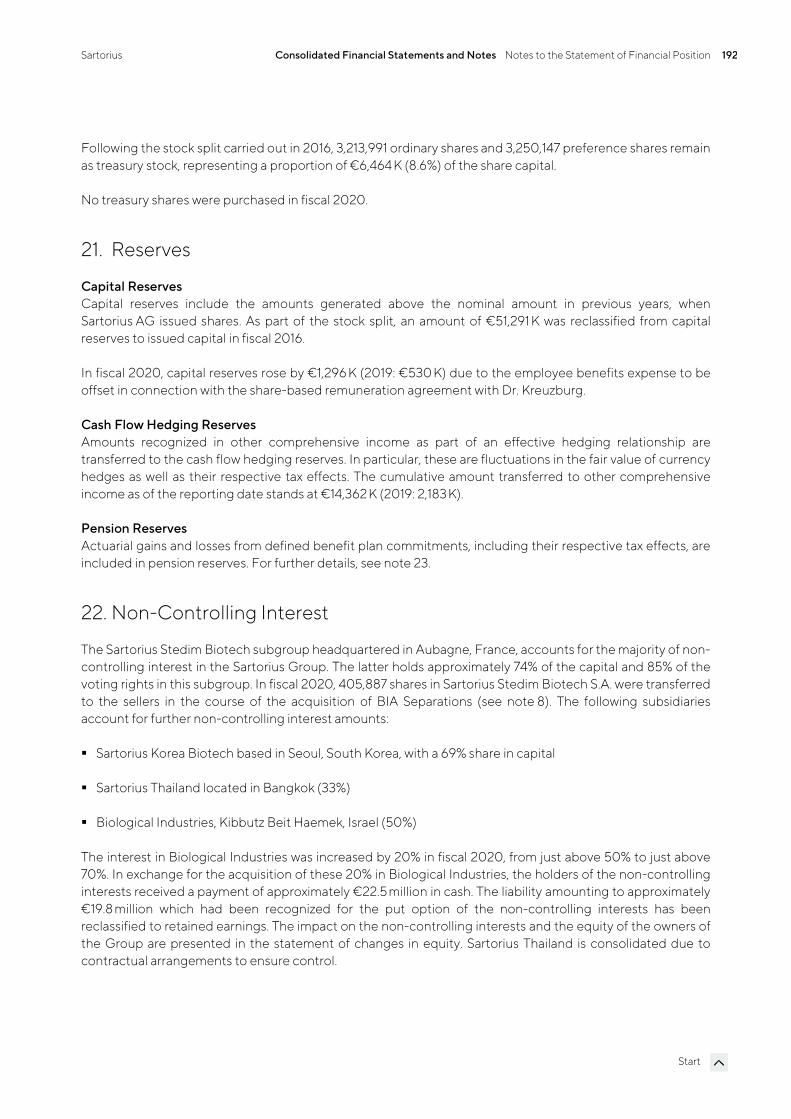
Sartorius Consolidated Financial Statements and Notes Notes to the Statement of Financial Position 192
Start
Following the stock split carried out in 2016, 3,213,991 ordinary shares and 3,250,147 preference shares remain as treasury stock, representing a proportion of €6,464 K (8.6%) of the share capital.
No treasury shares were purchased in fiscal 2020.
21. Reserves
Capital Reserves Capital reserves include the amounts generated above the nominal amount in previous years, when Sartorius AG issued shares. As part of the stock split, an amount of €51,291 K was reclassified from capital reserves to issued capital in fiscal 2016.
In fiscal 2020, capital reserves rose by €1,296 K (2019: €530 K) due to the employee benefits expense to be offset in connection with the share-based remuneration agreement with Dr. Kreuzburg.
Cash Flow Hedging Reserves Amounts recognized in other comprehensive income as part of an effective hedging relationship are transferred to the cash flow hedging reserves. In particular, these are fluctuations in the fair value of currency hedges as well as their respective tax effects. The cumulative amount transferred to other comprehensive income as of the reporting date stands at €14,362 K (2019: 2,183K).
Pension Reserves Actuarial gains and losses from defined benefit plan commitments, including their respective tax effects, are included in pension reserves. For further details, see note 23.
22. Non-Controlling Interest
The Sartorius Stedim Biotech subgroup headquartered in Aubagne, France, accounts for the majority of non-controlling interest in the Sartorius Group. The latter holds approximately 74% of the capital and 85% of the voting rights in this subgroup. In fiscal 2020, 405,887 shares in Sartorius Stedim Biotech S.A. were transferred to the sellers in the course of the acquisition of BIA Separations (see note 8). The following subsidiaries account for further non-controlling interest amounts:
Sartorius Korea Biotech based in Seoul, South Korea, with a 69% share in capital
Sartorius Thailand located in Bangkok (33%)
Biological Industries, Kibbutz Beit Haemek, Israel (50%)
The interest in Biological Industries was increased by 20% in fiscal 2020, from just above 50% to just above 70%. In exchange for the acquisition of these 20% in Biological Industries, the holders of the non-controlling interests received a payment of approximately €22.5 million in cash. The liability amounting to approximately €19.8 million which had been recognized for the put option of the non-controlling interests has been reclassified to retained earnings. The impact on the non-controlling interests and the equity of the owners of the Group are presented in the statement of changes in equity. Sartorius Thailand is consolidated due to contractual arrangements to ensure control.
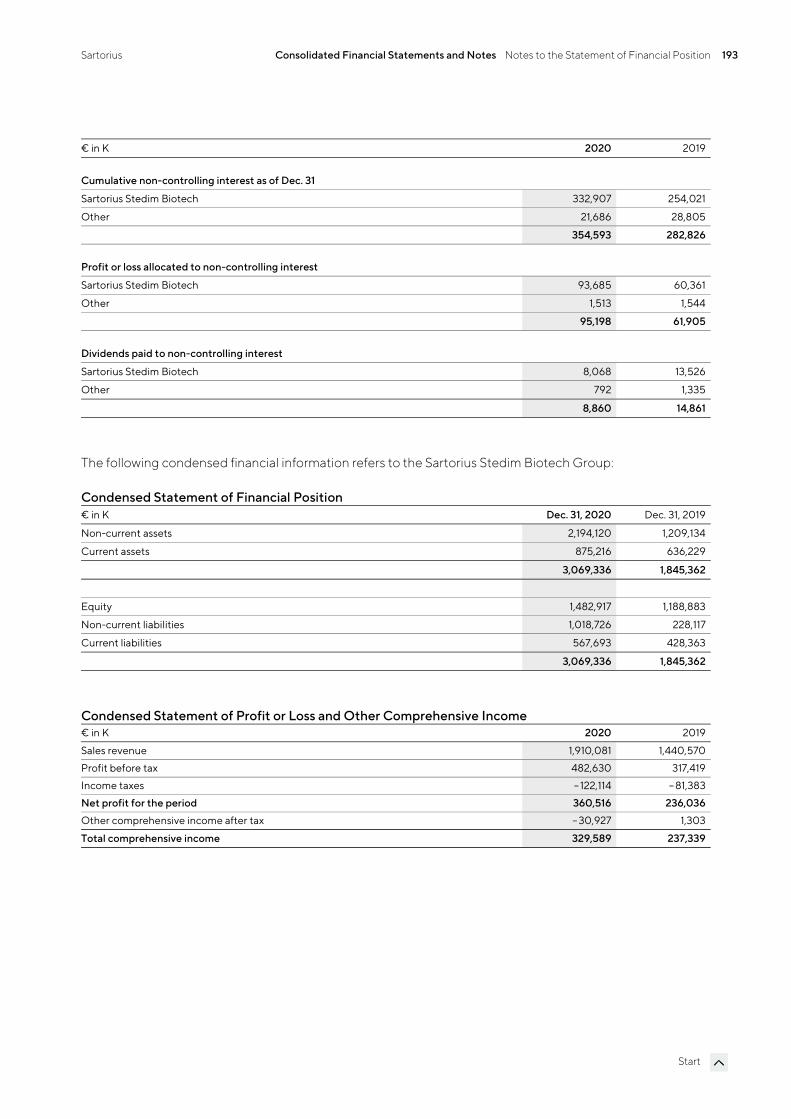
Sartorius Consolidated Financial Statements and Notes Notes to the Statement of Financial Position 193
Start
€ in K 2020 2019
Cumulative non-controlling interest as of Dec. 31
Sartorius Stedim Biotech 332,907 254,021
Other 21,686 28,805
354,593 282,826
Profit or loss allocated to non-controlling interest
Sartorius Stedim Biotech 93,685 60,361
Other 1,513 1,544
95,198 61,905
Dividends paid to non-controlling interest
Sartorius Stedim Biotech 8,068 13,526
Other 792 1,335
8,860 14,861
The following condensed financial information refers to the Sartorius Stedim Biotech Group:
Condensed Statement of Financial Position € in K Dec. 31, 2020 Dec. 31, 2019
Non-current assets 2,194,120 1,209,134
Current assets 875,216 636,229
3,069,336 1,845,362
Equity 1,482,917 1,188,883
Non-current liabilities 1,018,726 228,117
Current liabilities 567,693 428,363
3,069,336 1,845,362
Condensed Statement of Profit or Loss and Other Comprehensive Income € in K 2020 2019
Sales revenue 1,910,081 1,440,570
Profit before tax 482,630 317,419
Income taxes – 122,114 – 81,383
Net profit for the period 360,516 236,036
Other comprehensive income after tax – 30,927 1,303
Total comprehensive income 329,589 237,339
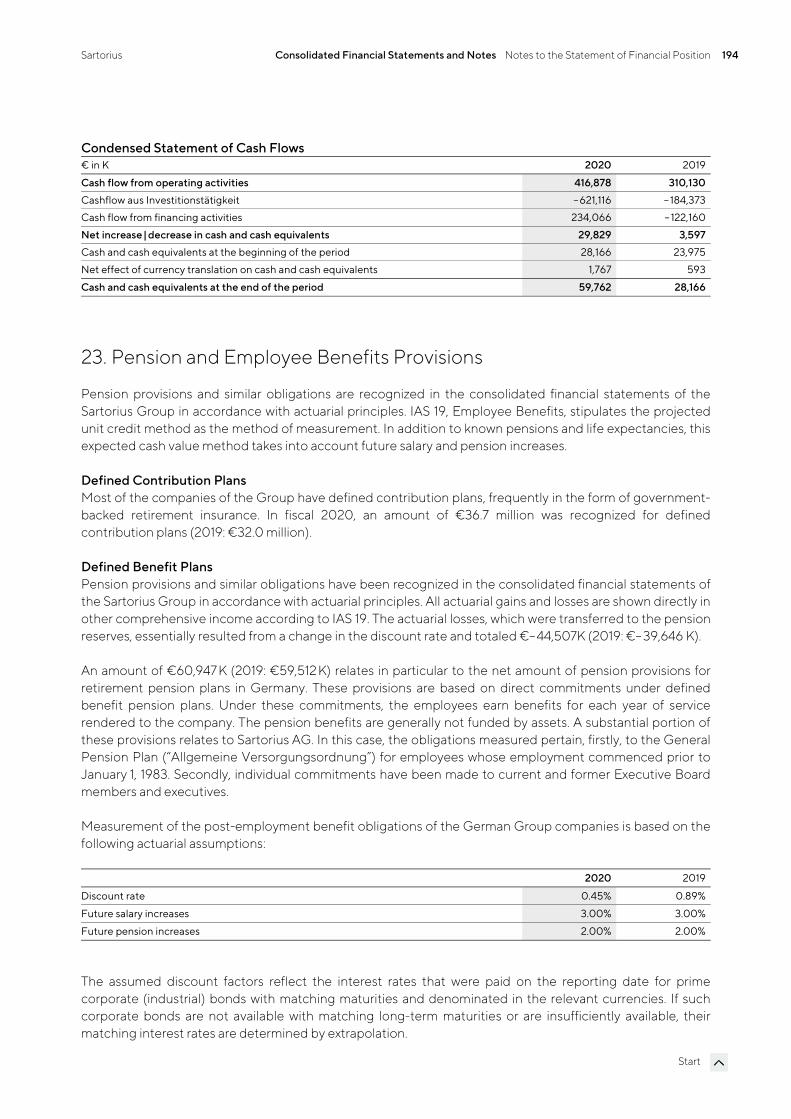
Sartorius Consolidated Financial Statements and Notes Notes to the Statement of Financial Position 194
Start
Condensed Statement of Cash Flows € in K 2020 2019
Cash flow from operating activities 416,878 310,130
Cashflow aus Investitionstätigkeit –621,116 – 184,373
Cash flow from financing activities 234,066 – 122,160
Net increase|decrease in cash and cash equivalents 29,829 3,597
Cash and cash equivalents at the beginning of the period 28,166 23,975
Net effect of currency translation on cash and cash equivalents 1,767 593
Cash and cash equivalents at the end of the period 59,762 28,166
23. Pension and Employee Benefits Provisions
Pension provisions and similar obligations are recognized in the consolidated financial statements of the Sartorius Group in accordance with actuarial principles. IAS 19, Employee Benefits, stipulates the projected unit credit method as the method of measurement. In addition to known pensions and life expectancies, this expected cash value method takes into account future salary and pension increases.
Defined Contribution Plans Most of the companies of the Group have defined contribution plans, frequently in the form of government-backed retirement insurance. In fiscal 2020, an amount of €36.7 million was recognized for defined contribution plans (2019: €32.0 million).
Defined Benefit Plans Pension provisions and similar obligations have been recognized in the consolidated financial statements of the Sartorius Group in accordance with actuarial principles. All actuarial gains and losses are shown directly in other comprehensive income according to IAS 19. The actuarial losses, which were transferred to the pension reserves, essentially resulted from a change in the discount rate and totaled €–44,507K (2019: €– 39,646 K).
An amount of €60,947 K (2019: €59,512 K) relates in particular to the net amount of pension provisions for retirement pension plans in Germany. These provisions are based on direct commitments under defined benefit pension plans. Under these commitments, the employees earn benefits for each year of service rendered to the company. The pension benefits are generally not funded by assets. A substantial portion of these provisions relates to Sartorius AG. In this case, the obligations measured pertain, firstly, to the General Pension Plan (“Allgemeine Versorgungsordnung”) for employees whose employment commenced prior to January 1, 1983. Secondly, individual commitments have been made to current and former Executive Board members and executives.
Measurement of the post-employment benefit obligations of the German Group companies is based on the following actuarial assumptions:
2020 2019
Discount rate 0.45% 0.89%
Future salary increases 3.00% 3.00%
Future pension increases 2.00% 2.00%
The assumed discount factors reflect the interest rates that were paid on the reporting date for prime corporate (industrial) bonds with matching maturities and denominated in the relevant currencies. If such corporate bonds are not available with matching long-term maturities or are insufficiently available, their matching interest rates are determined by extrapolation.
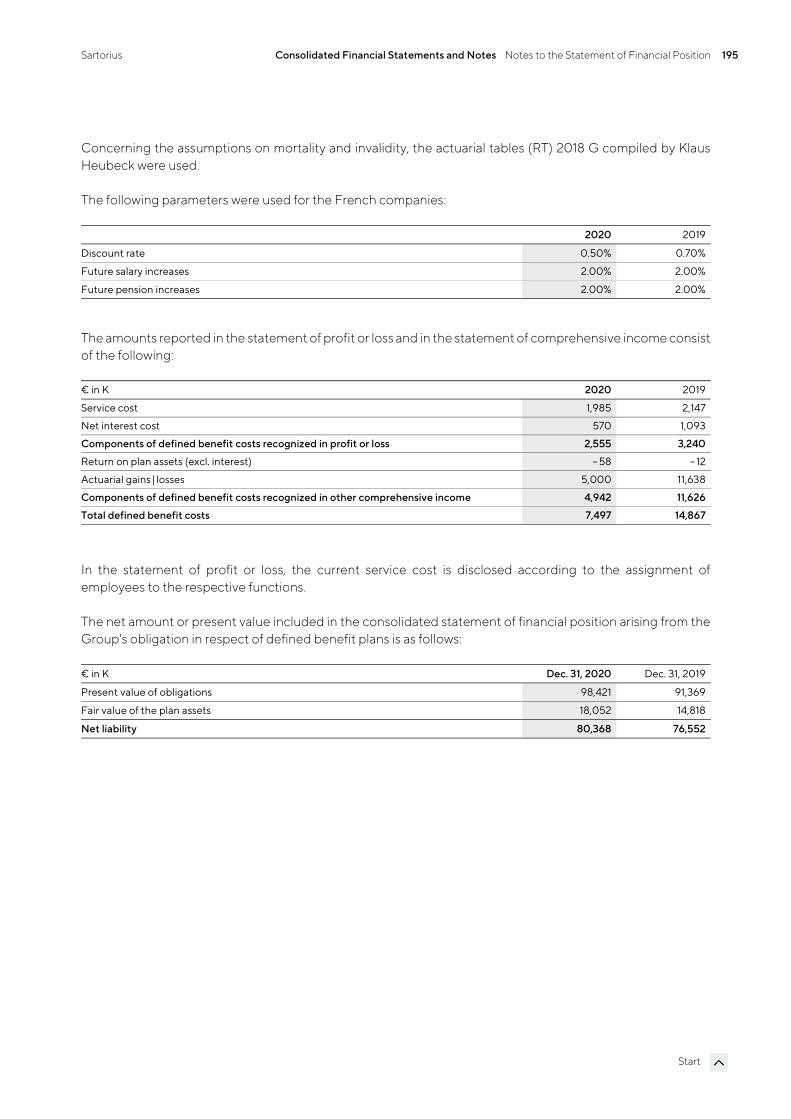
Sartorius Consolidated Financial Statements and Notes Notes to the Statement of Financial Position 195
Start
Concerning the assumptions on mortality and invalidity, the actuarial tables (RT) 2018 G compiled by Klaus Heubeck were used.
The following parameters were used for the French companies:
2020 2019
Discount rate 0.50% 0.70%
Future salary increases 2.00% 2.00%
Future pension increases 2.00% 2.00%
The amounts reported in the statement of profit or loss and in the statement of comprehensive income consist of the following:
€ in K 2020 2019
Service cost 1,985 2,147
Net interest cost 570 1,093
Components of defined benefit costs recognized in profit or loss 2,555 3,240
Return on plan assets (excl. interest) – 58 – 12
Actuarial gains| losses 5,000 11,638
Components of defined benefit costs recognized in other comprehensive income 4,942 11,626
Total defined benefit costs 7,497 14,867
In the statement of profit or loss, the current service cost is disclosed according to the assignment of employees to the respective functions.
The net amount or present value included in the consolidated statement of financial position arising from the Group's obligation in respect of defined benefit plans is as follows:
€ in K Dec. 31, 2020 Dec. 31, 2019
Present value of obligations 98,421 91,369
Fair value of the plan assets 18,052 14,818
Net liability 80,368 76,552
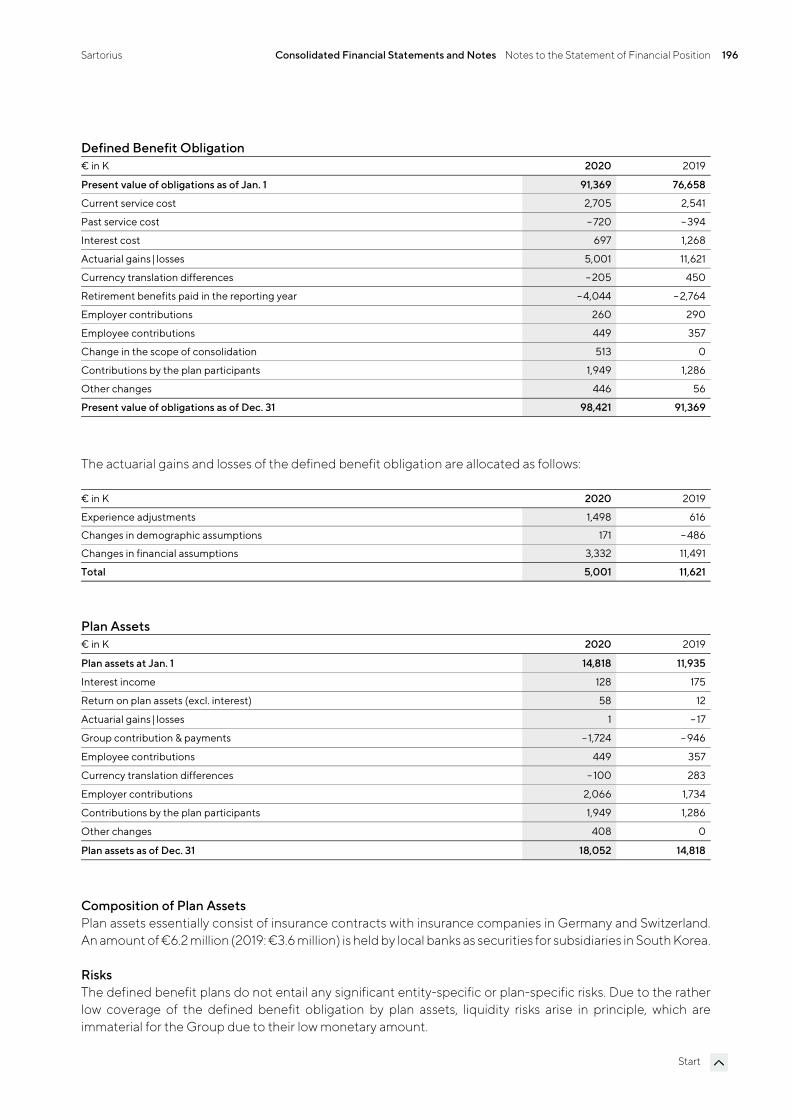
Sartorius Consolidated Financial Statements and Notes Notes to the Statement of Financial Position 196
Start
Defined Benefit Obligation € in K 2020 2019
Present value of obligations as of Jan. 1 91,369 76,658
Current service cost 2,705 2,541
Past service cost – 720 – 394
Interest cost 697 1,268
Actuarial gains| losses 5,001 11,621
Currency translation differences – 205 450
Retirement benefits paid in the reporting year –4,044 – 2,764
Employer contributions 260 290
Employee contributions 449 357
Change in the scope of consolidation 513 0
Contributions by the plan participants 1,949 1,286
Other changes 446 56
Present value of obligations as of Dec. 31 98,421 91,369
The actuarial gains and losses of the defined benefit obligation are allocated as follows:
€ in K 2020 2019
Experience adjustments 1,498 616
Changes in demographic assumptions 171 – 486
Changes in financial assumptions 3,332 11,491
Total 5,001 11,621
Plan Assets € in K 2020 2019
Plan assets at Jan. 1 14,818 11,935
Interest income 128 175
Return on plan assets (excl. interest) 58 12
Actuarial gains| losses 1 – 17
Group contribution & payments –1,724 – 946
Employee contributions 449 357
Currency translation differences – 100 283
Employer contributions 2,066 1,734
Contributions by the plan participants 1,949 1,286
Other changes 408 0
Plan assets as of Dec. 31 18,052 14,818
Composition of Plan Assets Plan assets essentially consist of insurance contracts with insurance companies in Germany and Switzerland. An amount of €6.2 million (2019: €3.6 million) is held by local banks as securities for subsidiaries in South Korea.
Risks The defined benefit plans do not entail any significant entity-specific or plan-specific risks. Due to the rather low coverage of the defined benefit obligation by plan assets, liquidity risks arise in principle, which are immaterial for the Group due to their low monetary amount.
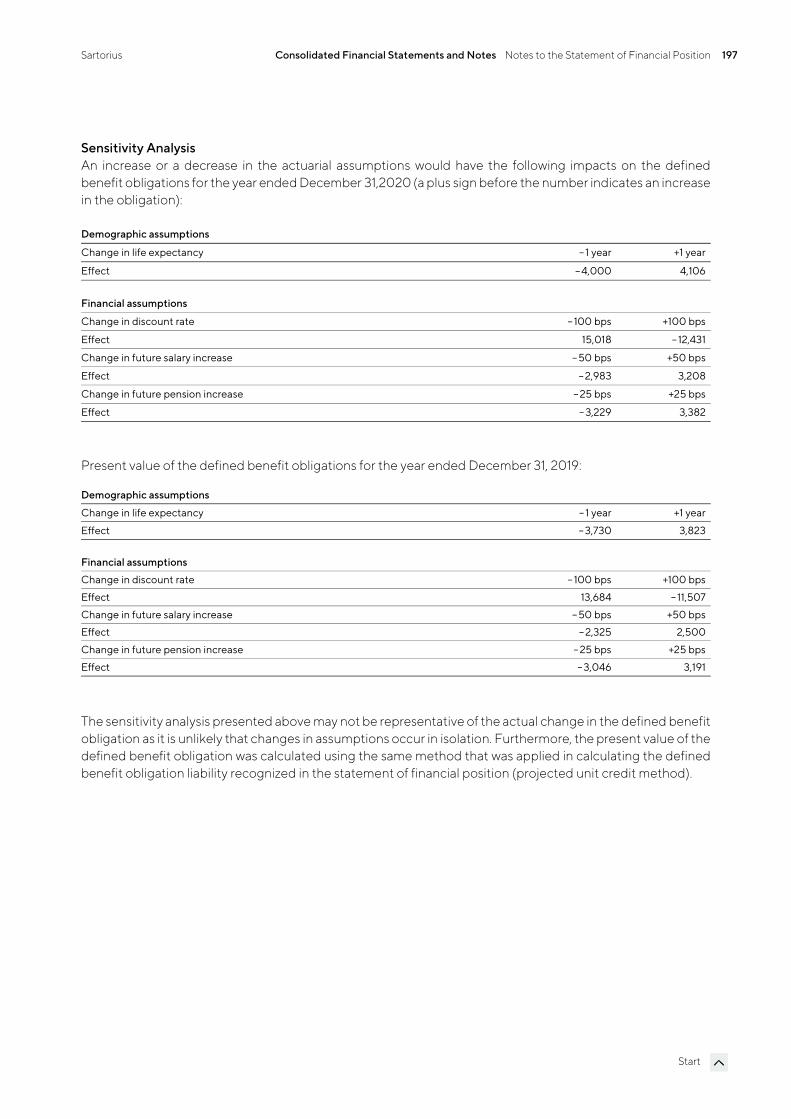
Sartorius Consolidated Financial Statements and Notes Notes to the Statement of Financial Position 197
Start
Sensitivity Analysis An increase or a decrease in the actuarial assumptions would have the following impacts on the defined benefit obligations for the year ended December 31,2020 (a plus sign before the number indicates an increase in the obligation):
Demographic assumptions
Change in life expectancy –1 year +1 year
Effect – 4,000 4,106
Financial assumptions
Change in discount rate – 100 bps +100 bps
Effect 15,018 – 12,431
Change in future salary increase – 50 bps +50 bps
Effect – 2,983 3,208
Change in future pension increase – 25 bps +25 bps
Effect – 3,229 3,382
Present value of the defined benefit obligations for the year ended December 31, 2019:
Demographic assumptions
Change in life expectancy –1 year +1 year
Effect – 3,730 3,823
Financial assumptions
Change in discount rate – 100 bps +100 bps
Effect 13,684 – 11,507
Change in future salary increase – 50 bps +50 bps
Effect – 2,325 2,500
Change in future pension increase – 25 bps +25 bps
Effect –3,046 3,191
The sensitivity analysis presented above may not be representative of the actual change in the defined benefit obligation as it is unlikely that changes in assumptions occur in isolation. Furthermore, the present value of the defined benefit obligation was calculated using the same method that was applied in calculating the defined benefit obligation liability recognized in the statement of financial position (projected unit credit method).
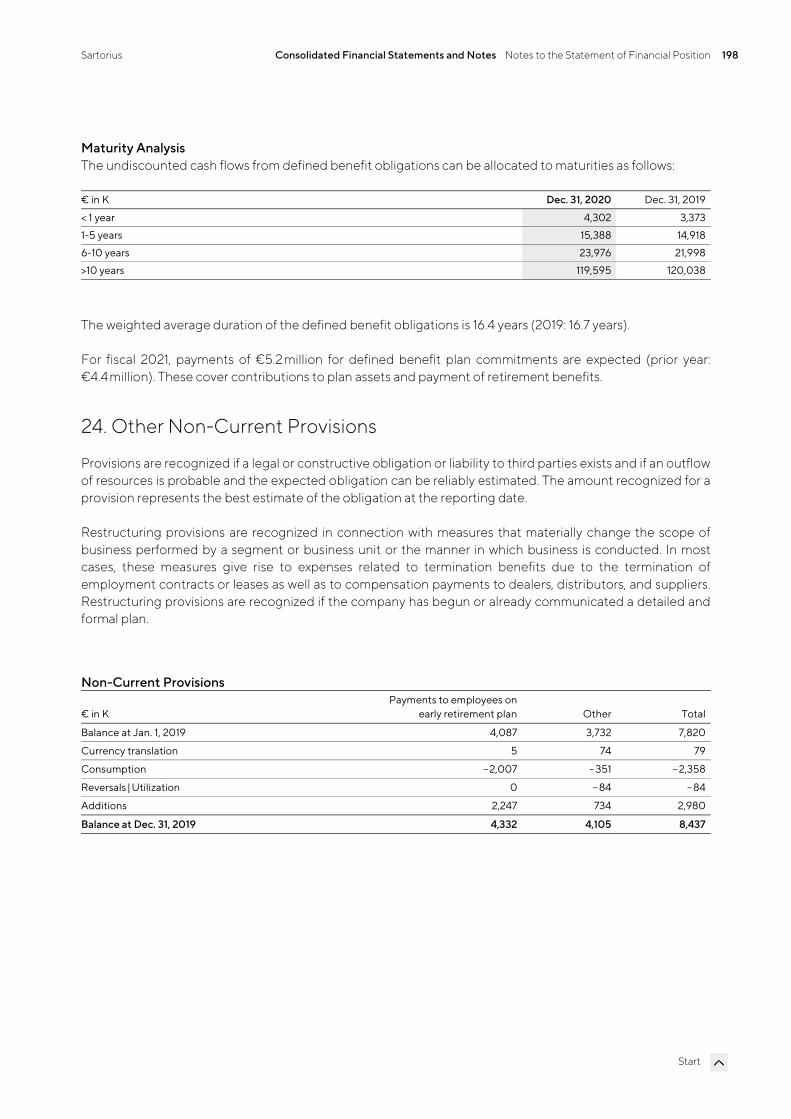
Sartorius Consolidated Financial Statements and Notes Notes to the Statement of Financial Position 198
Start
Maturity Analysis The undiscounted cash flows from defined benefit obligations can be allocated to maturities as follows:
€ in K Dec. 31, 2020 Dec. 31, 2019
< 1 year 4,302 3,373
1-5 years 15,388 14,918
6-10 years 23,976 21,998
>10 years 119,595 120,038
The weighted average duration of the defined benefit obligations is 16.4 years (2019: 16.7 years).
For fiscal 2021, payments of €5.2 million for defined benefit plan commitments are expected (prior year: €4.4million). These cover contributions to plan assets and payment of retirement benefits.
24. Other Non-Current Provisions
Provisions are recognized if a legal or constructive obligation or liability to third parties exists and if an outflow of resources is probable and the expected obligation can be reliably estimated. The amount recognized for a provision represents the best estimate of the obligation at the reporting date.
Restructuring provisions are recognized in connection with measures that materially change the scope of business performed by a segment or business unit or the manner in which business is conducted. In most cases, these measures give rise to expenses related to termination benefits due to the termination of employment contracts or leases as well as to compensation payments to dealers, distributors, and suppliers. Restructuring provisions are recognized if the company has begun or already communicated a detailed and formal plan.
Non-Current Provisions
€ in K Payments to employees on
early retirement plan Other Total
Balance at Jan. 1, 2019 4,087 3,732 7,820
Currency translation 5 74 79
Consumption – 2,007 – 351 – 2,358
Reversals | Utilization 0 – 84 – 84
Additions 2,247 734 2,980
Balance at Dec. 31, 2019 4,332 4,105 8,437
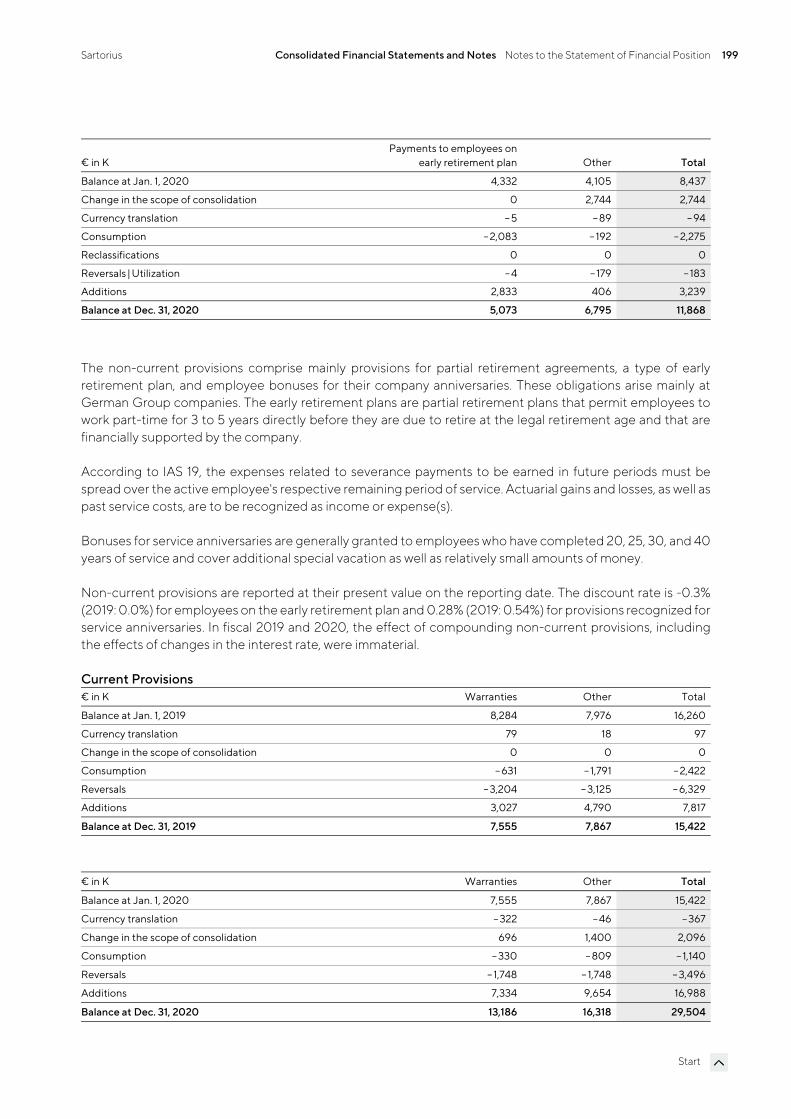
Sartorius Consolidated Financial Statements and Notes Notes to the Statement of Financial Position 199
Start
€ in K Payments to employees on
early retirement plan Other Total
Balance at Jan. 1, 2020 4,332 4,105 8,437
Change in the scope of consolidation 0 2,744 2,744
Currency translation –5 – 89 – 94
Consumption – 2,083 – 192 – 2,275
Reclassifications 0 0 0
Reversals | Utilization – 4 – 179 – 183
Additions 2,833 406 3,239
Balance at Dec. 31, 2020 5,073 6,795 11,868
The non-current provisions comprise mainly provisions for partial retirement agreements, a type of early retirement plan, and employee bonuses for their company anniversaries. These obligations arise mainly at German Group companies. The early retirement plans are partial retirement plans that permit employees to work part-time for 3 to 5 years directly before they are due to retire at the legal retirement age and that are financially supported by the company.
According to IAS 19, the expenses related to severance payments to be earned in future periods must be spread over the active employee's respective remaining period of service. Actuarial gains and losses, as well as past service costs, are to be recognized as income or expense(s).
Bonuses for service anniversaries are generally granted to employees who have completed 20, 25, 30, and 40 years of service and cover additional special vacation as well as relatively small amounts of money.
Non-current provisions are reported at their present value on the reporting date. The discount rate is -0.3% (2019: 0.0%) for employees on the early retirement plan and 0.28% (2019: 0.54%) for provisions recognized for service anniversaries. In fiscal 2019 and 2020, the effect of compounding non-current provisions, including the effects of changes in the interest rate, were immaterial.
Current Provisions € in K Warranties Other Total
Balance at Jan. 1, 2019 8,284 7,976 16,260
Currency translation 79 18 97
Change in the scope of consolidation 0 0 0
Consumption – 631 – 1,791 – 2,422
Reversals – 3,204 – 3,125 – 6,329
Additions 3,027 4,790 7,817
Balance at Dec. 31, 2019 7,555 7,867 15,422
€ in K Warranties Other Total
Balance at Jan. 1, 2020 7,555 7,867 15,422
Currency translation – 322 – 46 – 367
Change in the scope of consolidation 696 1,400 2,096
Consumption – 330 – 809 – 1,140
Reversals – 1,748 – 1,748 – 3,496
Additions 7,334 9,654 16,988
Balance at Dec. 31, 2020 13,186 16,318 29,504
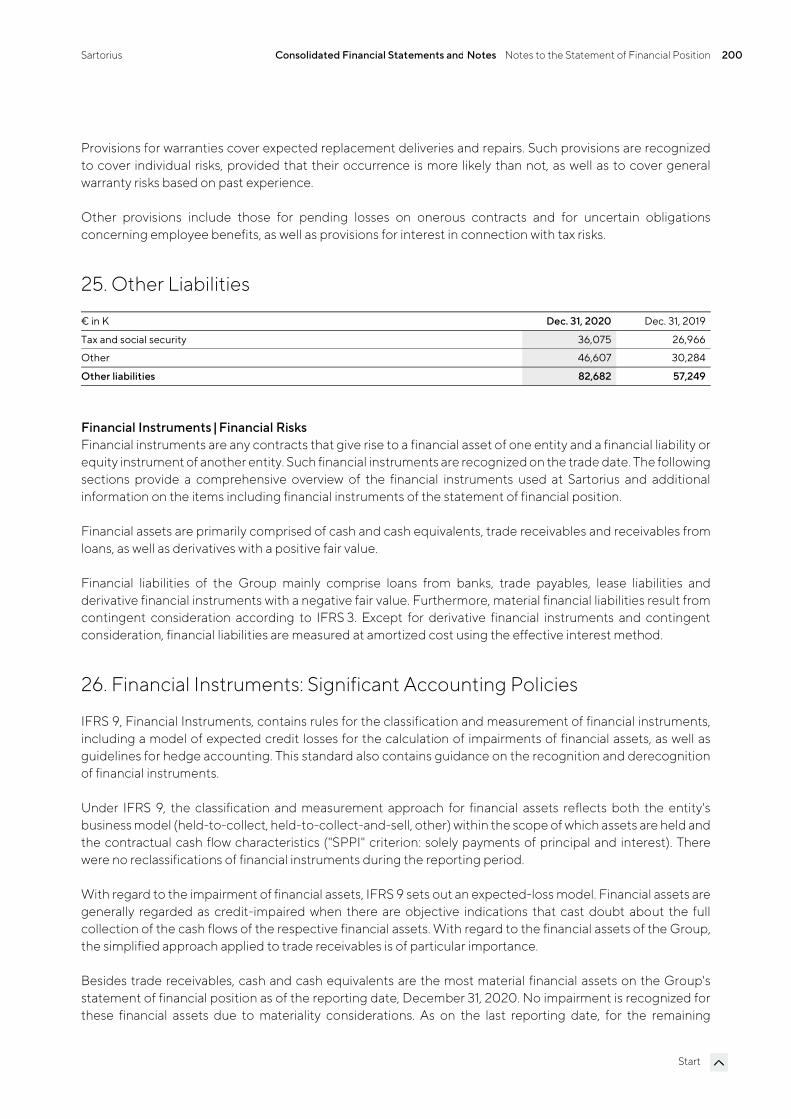
Sartorius Consolidated Financial Statements and Notes Notes to the Statement of Financial Position 200
Start
Provisions for warranties cover expected replacement deliveries and repairs. Such provisions are recognized to cover individual risks, provided that their occurrence is more likely than not, as well as to cover general warranty risks based on past experience.
Other provisions include those for pending losses on onerous contracts and for uncertain obligations concerning employee benefits, as well as provisions for interest in connection with tax risks.
25. Other Liabilities
€ in K Dec. 31, 2020 Dec. 31, 2019
Tax and social security 36,075 26,966
Other 46,607 30,284
Other liabilities 82,682 57,249
Financial Instruments |Financial Risks Financial instruments are any contracts that give rise to a financial asset of one entity and a financial liability or equity instrument of another entity. Such financial instruments are recognized on the trade date. The following sections provide a comprehensive overview of the financial instruments used at Sartorius and additional information on the items including financial instruments of the statement of financial position.
Financial assets are primarily comprised of cash and cash equivalents, trade receivables and receivables from loans, as well as derivatives with a positive fair value.
Financial liabilities of the Group mainly comprise loans from banks, trade payables, lease liabilities and derivative financial instruments with a negative fair value. Furthermore, material financial liabilities result from contingent consideration according to IFRS 3. Except for derivative financial instruments and contingent consideration, financial liabilities are measured at amortized cost using the effective interest method.
26. Financial Instruments: Significant Accounting Policies
IFRS 9, Financial Instruments, contains rules for the classification and measurement of financial instruments, including a model of expected credit losses for the calculation of impairments of financial assets, as well as guidelines for hedge accounting. This standard also contains guidance on the recognition and derecognition of financial instruments.
Under IFRS 9, the classification and measurement approach for financial assets reflects both the entity's business model (held-to-collect, held-to-collect-and-sell, other) within the scope of which assets are held and the contractual cash flow characteristics ("SPPI" criterion: solely payments of principal and interest). There were no reclassifications of financial instruments during the reporting period.
With regard to the impairment of financial assets, IFRS 9 sets out an expected-loss model. Financial assets are generally regarded as credit-impaired when there are objective indications that cast doubt about the full collection of the cash flows of the respective financial assets. With regard to the financial assets of the Group, the simplified approach applied to trade receivables is of particular importance.
Besides trade receivables, cash and cash equivalents are the most material financial assets on the Group's statement of financial position as of the reporting date, December 31, 2020. No impairment is recognized for these financial assets due to materiality considerations. As on the last reporting date, for the remaining
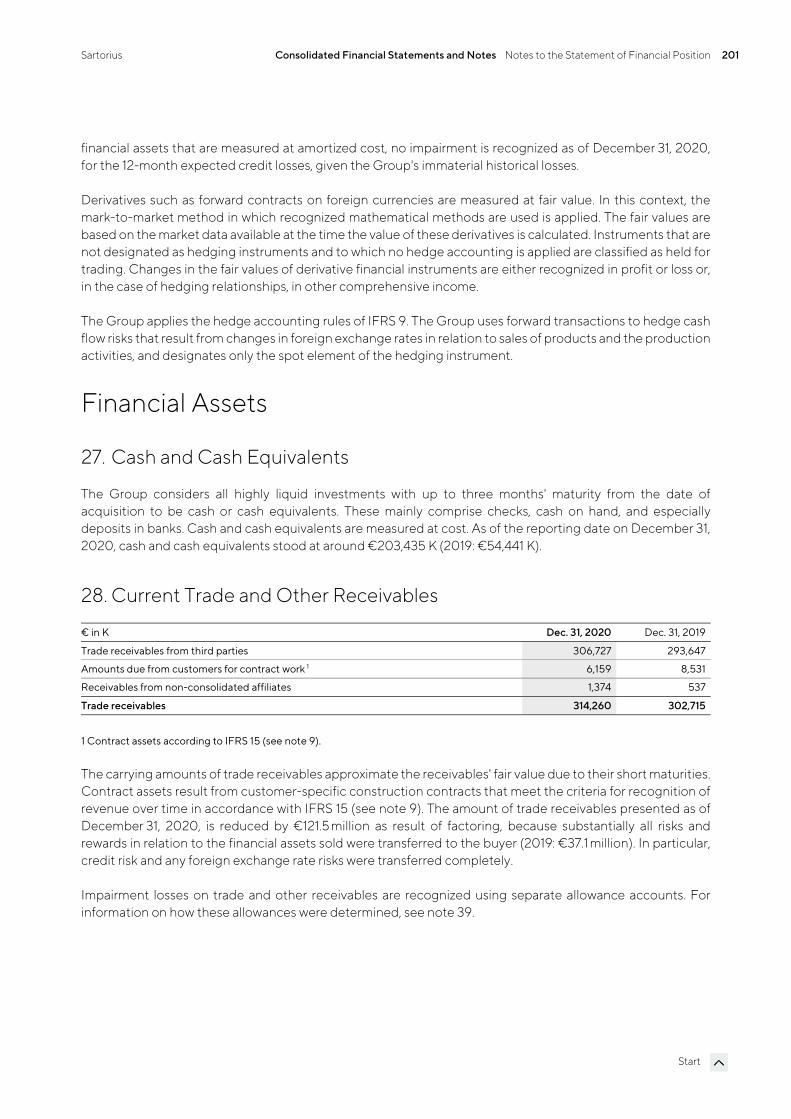
Sartorius Consolidated Financial Statements and Notes Notes to the Statement of Financial Position 201
Start
financial assets that are measured at amortized cost, no impairment is recognized as of December 31, 2020, for the 12-month expected credit losses, given the Group's immaterial historical losses.
Derivatives such as forward contracts on foreign currencies are measured at fair value. In this context, the mark-to-market method in which recognized mathematical methods are used is applied. The fair values are based on the market data available at the time the value of these derivatives is calculated. Instruments that are not designated as hedging instruments and to which no hedge accounting is applied are classified as held for trading. Changes in the fair values of derivative financial instruments are either recognized in profit or loss or, in the case of hedging relationships, in other comprehensive income.
The Group applies the hedge accounting rules of IFRS 9. The Group uses forward transactions to hedge cash flow risks that result from changes in foreign exchange rates in relation to sales of products and the production activities, and designates only the spot element of the hedging instrument.
Financial Assets
27. Cash and Cash Equivalents
The Group considers all highly liquid investments with up to three months' maturity from the date of acquisition to be cash or cash equivalents. These mainly comprise checks, cash on hand, and especially deposits in banks. Cash and cash equivalents are measured at cost. As of the reporting date on December 31, 2020, cash and cash equivalents stood at around €203,435 K (2019: €54,441 K).
28. Current Trade and Other Receivables
€ in K Dec. 31, 2020 Dec. 31, 2019
Trade receivables from third parties 306,727 293,647
Amounts due from customers for contract work 1 6,159 8,531
Receivables from non-consolidated affiliates 1,374 537
Trade receivables 314,260 302,715
1 Contract assets according to IFRS 15 (see note 9).
The carrying amounts of trade receivables approximate the receivables' fair value due to their short maturities. Contract assets result from customer-specific construction contracts that meet the criteria for recognition of revenue over time in accordance with IFRS 15 (see note 9). The amount of trade receivables presented as of December 31, 2020, is reduced by €121.5 million as result of factoring, because substantially all risks and rewards in relation to the financial assets sold were transferred to the buyer (2019: €37.1 million). In particular, credit risk and any foreign exchange rate risks were transferred completely.
Impairment losses on trade and other receivables are recognized using separate allowance accounts. For information on how these allowances were determined, see note 39.
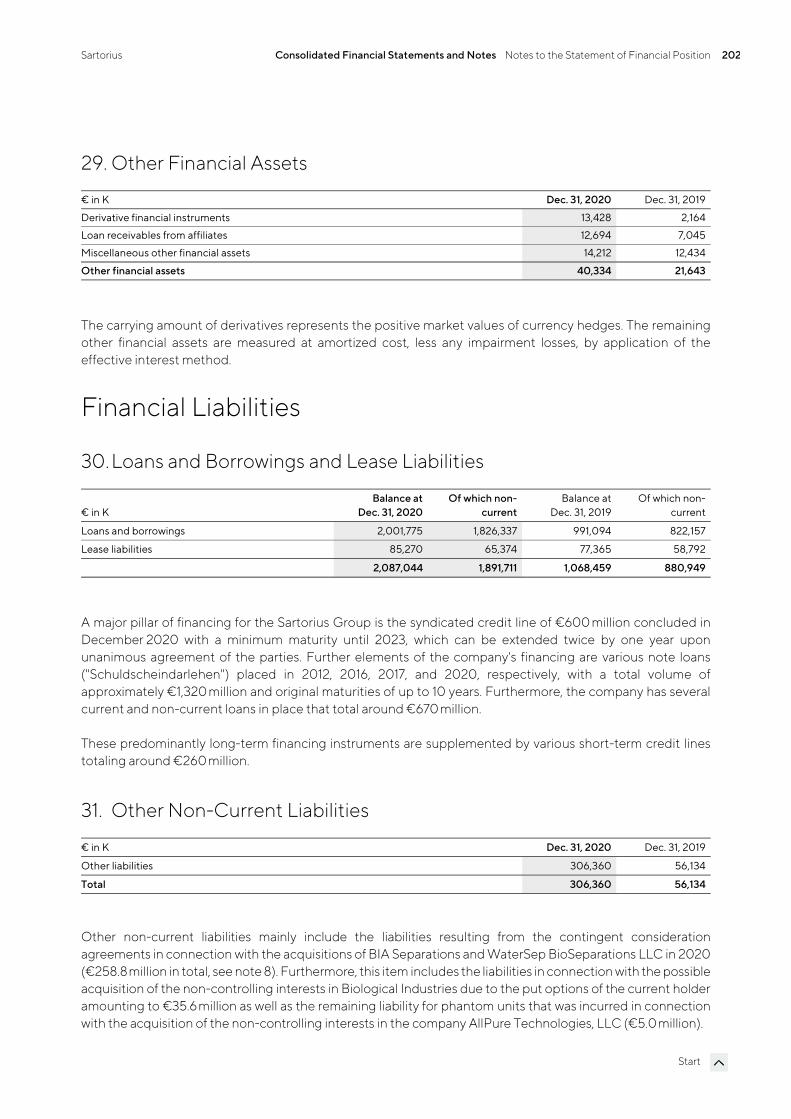
Sartorius Consolidated Financial Statements and Notes Notes to the Statement of Financial Position 202
Start
29. Other Financial Assets
€ in K Dec. 31, 2020 Dec. 31, 2019
Derivative financial instruments 13,428 2,164
Loan receivables from affiliates 12,694 7,045
Miscellaneous other financial assets 14,212 12,434
Other financial assets 40,334 21,643
The carrying amount of derivatives represents the positive market values of currency hedges. The remaining other financial assets are measured at amortized cost, less any impairment losses, by application of the effective interest method.
Financial Liabilities
30.Loans and Borrowings and Lease Liabilities
€ in K Balance at
Dec. 31, 2020Of which non-
currentBalance at
Dec. 31, 2019Of which non-
current
Loans and borrowings 2,001,775 1,826,337 991,094 822,157
Lease liabilities 85,270 65,374 77,365 58,792
2,087,044 1,891,711 1,068,459 880,949
A major pillar of financing for the Sartorius Group is the syndicated credit line of €600 million concluded in December 2020 with a minimum maturity until 2023, which can be extended twice by one year upon unanimous agreement of the parties. Further elements of the company's financing are various note loans ("Schuldscheindarlehen") placed in 2012, 2016, 2017, and 2020, respectively, with a total volume of approximately €1,320 million and original maturities of up to 10 years. Furthermore, the company has several current and non-current loans in place that total around €670 million.
These predominantly long-term financing instruments are supplemented by various short-term credit lines totaling around €260 million.
31. Other Non-Current Liabilities
€ in K Dec. 31, 2020 Dec. 31, 2019
Other liabilities 306,360 56,134
Total 306,360 56,134
Other non-current liabilities mainly include the liabilities resulting from the contingent consideration agreements in connection with the acquisitions of BIA Separations and WaterSep BioSeparations LLC in 2020 (€258.8million in total, see note 8). Furthermore, this item includes the liabilities in connection with the possible acquisition of the non-controlling interests in Biological Industries due to the put options of the current holder amounting to €35.6million as well as the remaining liability for phantom units that was incurred in connection with the acquisition of the non-controlling interests in the company AllPure Technologies, LLC (€5.0million).
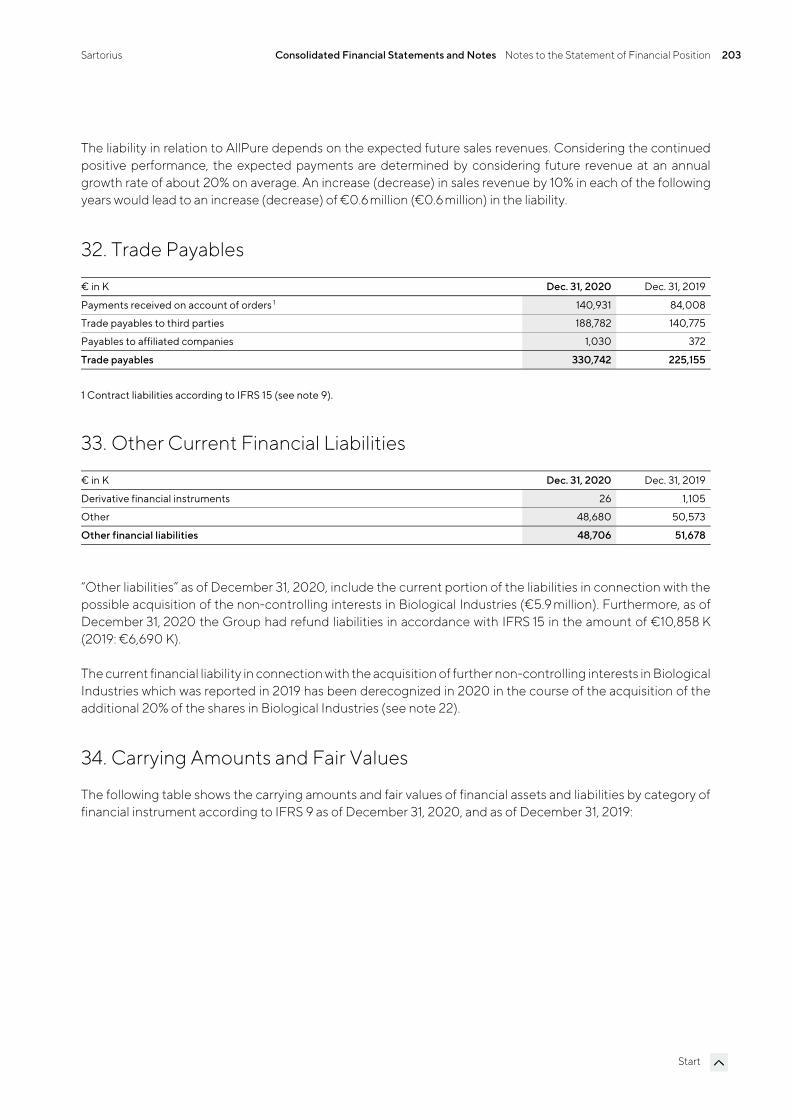
Sartorius Consolidated Financial Statements and Notes Notes to the Statement of Financial Position 203
Start
The liability in relation to AllPure depends on the expected future sales revenues. Considering the continued positive performance, the expected payments are determined by considering future revenue at an annual growth rate of about 20% on average. An increase (decrease) in sales revenue by 10% in each of the following years would lead to an increase (decrease) of €0.6million (€0.6million) in the liability.
32. Trade Payables
€ in K Dec. 31, 2020 Dec. 31, 2019
Payments received on account of orders 1 140,931 84,008
Trade payables to third parties 188,782 140,775
Payables to affiliated companies 1,030 372
Trade payables 330,742 225,155
1 Contract liabilities according to IFRS 15 (see note 9).
33. Other Current Financial Liabilities
€ in K Dec. 31, 2020 Dec. 31, 2019
Derivative financial instruments 26 1,105
Other 48,680 50,573
Other financial liabilities 48,706 51,678
“Other liabilities” as of December 31, 2020, include the current portion of the liabilities in connection with the possible acquisition of the non-controlling interests in Biological Industries (€5.9 million). Furthermore, as of December 31, 2020 the Group had refund liabilities in accordance with IFRS 15 in the amount of €10,858 K (2019: €6,690 K).
The current financial liability in connection with the acquisition of further non-controlling interests in Biological Industries which was reported in 2019 has been derecognized in 2020 in the course of the acquisition of the additional 20% of the shares in Biological Industries (see note 22).
34. Carrying Amounts and Fair Values
The following table shows the carrying amounts and fair values of financial assets and liabilities by category of financial instrument according to IFRS 9 as of December 31, 2020, and as of December 31, 2019:
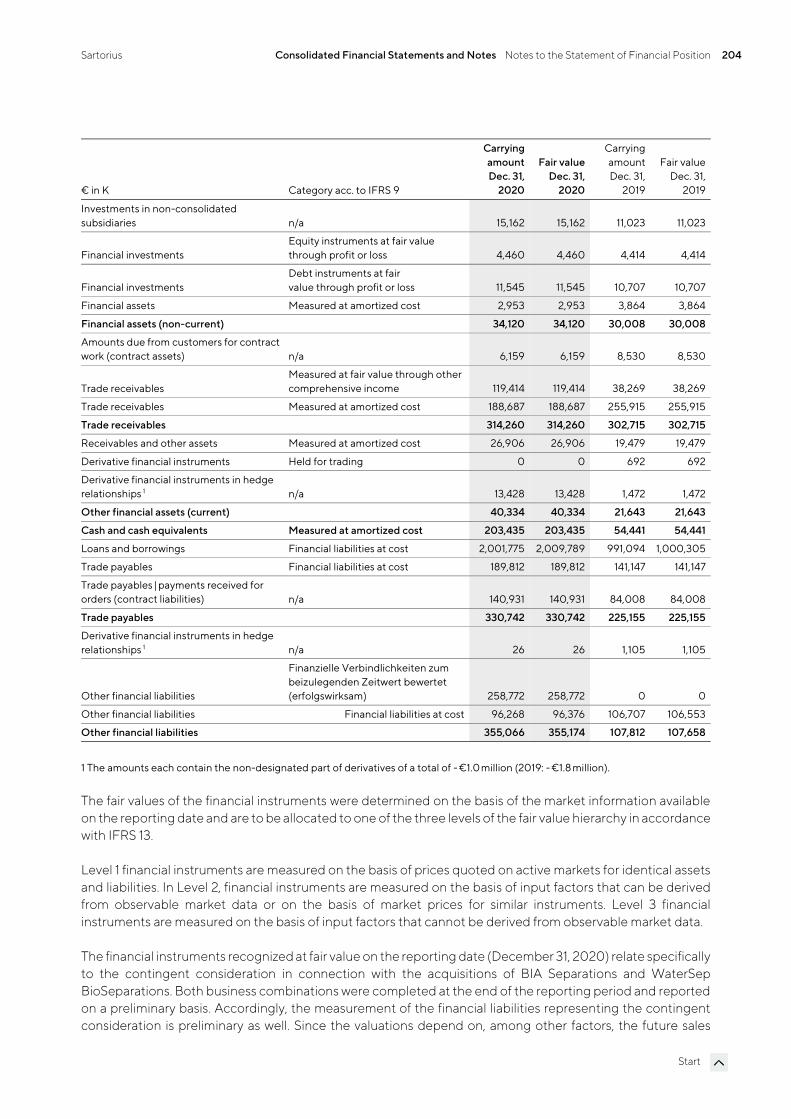
Sartorius Consolidated Financial Statements and Notes Notes to the Statement of Financial Position 204
Start
€ in K Category acc. to IFRS 9
Carrying amountDec. 31,
2020
Fair valueDec. 31,
2020
Carrying amount Dec. 31,
2019
Fair valueDec. 31,
2019
Investments in non-consolidated subsidiaries n/a 15,162 15,162 11,023 11,023
Financial investments Equity instruments at fair value through profit or loss 4,460 4,460 4,414 4,414
Financial investments Debt instruments at fair value through profit or loss 11,545 11,545 10,707 10,707
Financial assets Measured at amortized cost 2,953 2,953 3,864 3,864
Financial assets (non-current) 34,120 34,120 30,008 30,008
Amounts due from customers for contract work (contract assets) n/a 6,159 6,159 8,530 8,530
Trade receivables Measured at fair value through other comprehensive income 119,414 119,414 38,269 38,269
Trade receivables Measured at amortized cost 188,687 188,687 255,915 255,915
Trade receivables 314,260 314,260 302,715 302,715
Receivables and other assets Measured at amortized cost 26,906 26,906 19,479 19,479
Derivative financial instruments Held for trading 0 0 692 692
Derivative financial instruments in hedge relationships 1 n/a 13,428 13,428 1,472 1,472
Other financial assets (current) 40,334 40,334 21,643 21,643
Cash and cash equivalents Measured at amortized cost 203,435 203,435 54,441 54,441
Loans and borrowings Financial liabilities at cost 2,001,775 2,009,789 991,094 1,000,305
Trade payables Financial liabilities at cost 189,812 189,812 141,147 141,147
Trade payables | payments received for orders (contract liabilities) n/a 140,931 140,931 84,008 84,008
Trade payables 330,742 330,742 225,155 225,155
Derivative financial instruments in hedge relationships 1 n/a 26 26 1,105 1,105
Other financial liabilities
Finanzielle Verbindlichkeiten zum beizulegenden Zeitwert bewertet (erfolgswirksam) 258,772 258,772 0 0
Other financial liabilities Financial liabilities at cost 96,268 96,376 106,707 106,553
Other financial liabilities 355,066 355,174 107,812 107,658
1 The amounts each contain the non-designated part of derivatives of a total of - €1.0million (2019: - €1.8 million).
The fair values of the financial instruments were determined on the basis of the market information available on the reporting date and are to be allocated to one of the three levels of the fair value hierarchy in accordance with IFRS 13.
Level 1 financial instruments are measured on the basis of prices quoted on active markets for identical assets and liabilities. In Level 2, financial instruments are measured on the basis of input factors that can be derived from observable market data or on the basis of market prices for similar instruments. Level 3 financial instruments are measured on the basis of input factors that cannot be derived from observable market data.
The financial instruments recognized at fair value on the reporting date (December 31, 2020) relate specifically to the contingent consideration in connection with the acquisitions of BIA Separations and WaterSep BioSeparations. Both business combinations were completed at the end of the reporting period and reported on a preliminary basis. Accordingly, the measurement of the financial liabilities representing the contingent consideration is preliminary as well. Since the valuations depend on, among other factors, the future sales
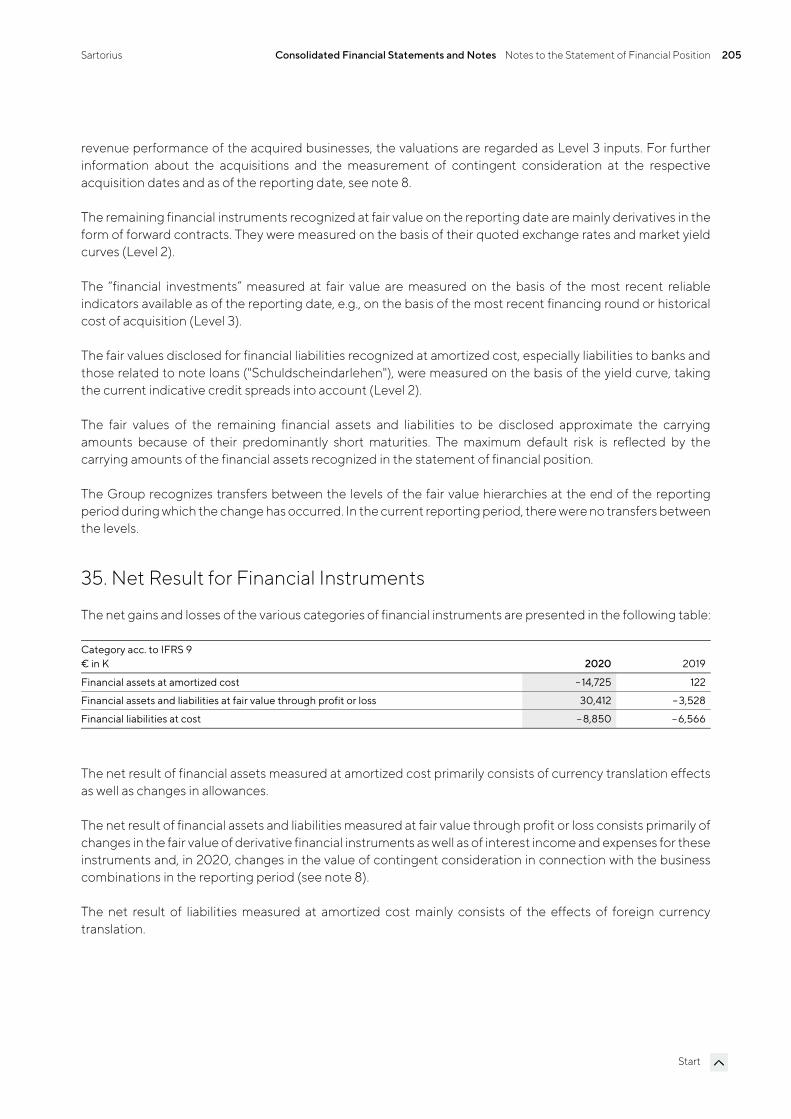
Sartorius Consolidated Financial Statements and Notes Notes to the Statement of Financial Position 205
Start
revenue performance of the acquired businesses, the valuations are regarded as Level 3 inputs. For further information about the acquisitions and the measurement of contingent consideration at the respective acquisition dates and as of the reporting date, see note 8.
The remaining financial instruments recognized at fair value on the reporting date are mainly derivatives in the form of forward contracts. They were measured on the basis of their quoted exchange rates and market yield curves (Level 2).
The “financial investments” measured at fair value are measured on the basis of the most recent reliable indicators available as of the reporting date, e.g., on the basis of the most recent financing round or historical cost of acquisition (Level 3).
The fair values disclosed for financial liabilities recognized at amortized cost, especially liabilities to banks and those related to note loans ("Schuldscheindarlehen"), were measured on the basis of the yield curve, taking the current indicative credit spreads into account (Level 2).
The fair values of the remaining financial assets and liabilities to be disclosed approximate the carrying amounts because of their predominantly short maturities. The maximum default risk is reflected by the carrying amounts of the financial assets recognized in the statement of financial position.
The Group recognizes transfers between the levels of the fair value hierarchies at the end of the reporting period during which the change has occurred. In the current reporting period, there were no transfers between the levels.
35. Net Result for Financial Instruments
The net gains and losses of the various categories of financial instruments are presented in the following table:
Category acc. to IFRS 9 € in K 2020 2019
Financial assets at amortized cost – 14,725 122
Financial assets and liabilities at fair value through profit or loss 30,412 – 3,528
Financial liabilities at cost – 8,850 – 6,566
The net result of financial assets measured at amortized cost primarily consists of currency translation effects as well as changes in allowances.
The net result of financial assets and liabilities measured at fair value through profit or loss consists primarily of changes in the fair value of derivative financial instruments as well as of interest income and expenses for these instruments and, in 2020, changes in the value of contingent consideration in connection with the business combinations in the reporting period (see note 8).
The net result of liabilities measured at amortized cost mainly consists of the effects of foreign currency translation.
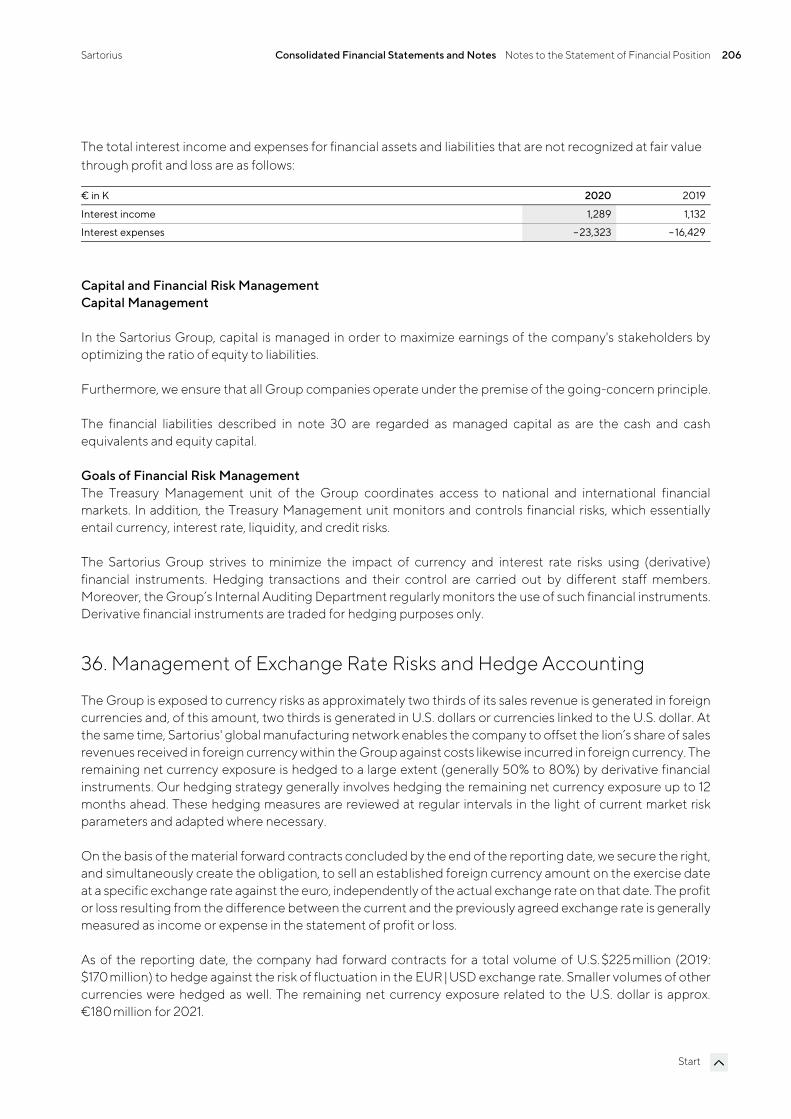
Sartorius Consolidated Financial Statements and Notes Notes to the Statement of Financial Position 206
Start
The total interest income and expenses for financial assets and liabilities that are not recognized at fair value through profit and loss are as follows:
€ in K 2020 2019
Interest income 1,289 1,132
Interest expenses –23,323 – 16,429
Capital and Financial Risk Management Capital Management
In the Sartorius Group, capital is managed in order to maximize earnings of the company's stakeholders by optimizing the ratio of equity to liabilities.
Furthermore, we ensure that all Group companies operate under the premise of the going-concern principle.
The financial liabilities described in note 30 are regarded as managed capital as are the cash and cash equivalents and equity capital.
Goals of Financial Risk Management The Treasury Management unit of the Group coordinates access to national and international financial markets. In addition, the Treasury Management unit monitors and controls financial risks, which essentially entail currency, interest rate, liquidity, and credit risks.
The Sartorius Group strives to minimize the impact of currency and interest rate risks using (derivative) financial instruments. Hedging transactions and their control are carried out by different staff members. Moreover, the Group’s Internal Auditing Department regularly monitors the use of such financial instruments. Derivative financial instruments are traded for hedging purposes only.
36. Management of Exchange Rate Risks and Hedge Accounting
The Group is exposed to currency risks as approximately two thirds of its sales revenue is generated in foreign currencies and, of this amount, two thirds is generated in U.S. dollars or currencies linked to the U.S. dollar. At the same time, Sartorius' global manufacturing network enables the company to offset the lion’s share of sales revenues received in foreign currency within the Group against costs likewise incurred in foreign currency. The remaining net currency exposure is hedged to a large extent (generally 50% to 80%) by derivative financial instruments. Our hedging strategy generally involves hedging the remaining net currency exposure up to 12 months ahead. These hedging measures are reviewed at regular intervals in the light of current market risk parameters and adapted where necessary.
On the basis of the material forward contracts concluded by the end of the reporting date, we secure the right, and simultaneously create the obligation, to sell an established foreign currency amount on the exercise date at a specific exchange rate against the euro, independently of the actual exchange rate on that date. The profit or loss resulting from the difference between the current and the previously agreed exchange rate is generally measured as income or expense in the statement of profit or loss.
As of the reporting date, the company had forward contracts for a total volume of U.S. $225million (2019: $170 million) to hedge against the risk of fluctuation in the EUR | USD exchange rate. Smaller volumes of other currencies were hedged as well. The remaining net currency exposure related to the U.S. dollar is approx. €180million for 2021.
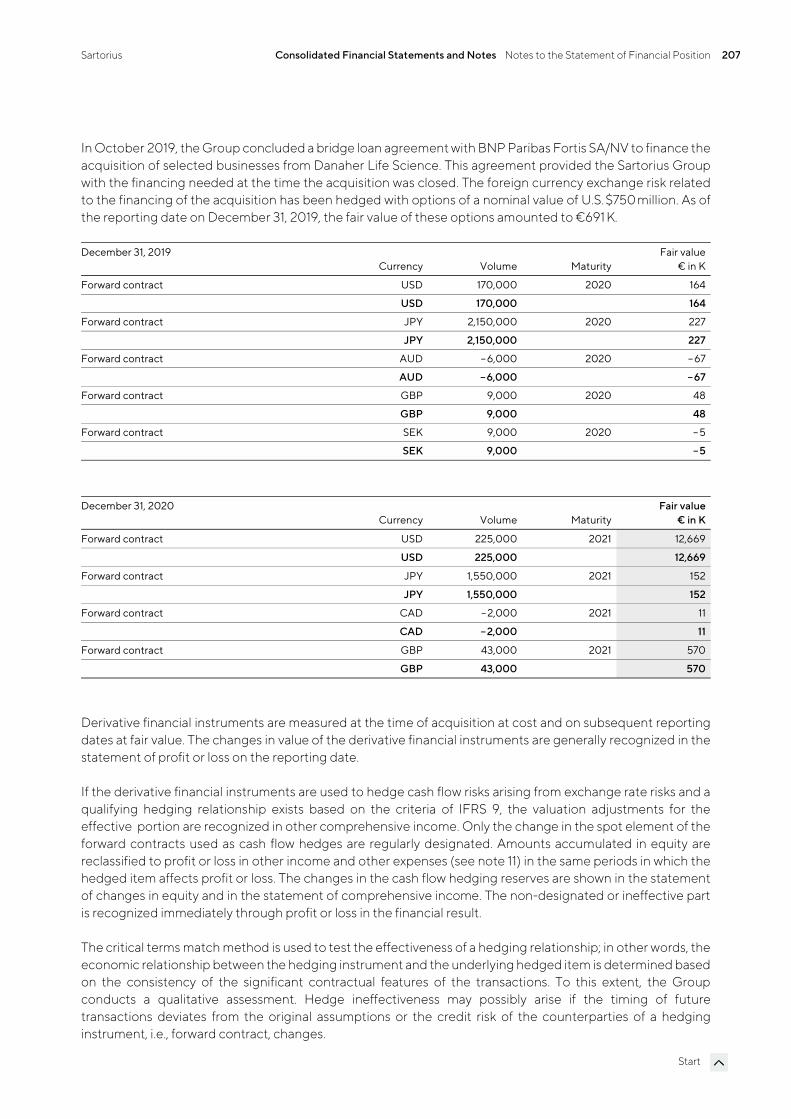
Sartorius Consolidated Financial Statements and Notes Notes to the Statement of Financial Position 207
Start
In October 2019, the Group concluded a bridge loan agreement with BNP Paribas Fortis SA/NV to finance the acquisition of selected businesses from Danaher Life Science. This agreement provided the Sartorius Group with the financing needed at the time the acquisition was closed. The foreign currency exchange risk related to the financing of the acquisition has been hedged with options of a nominal value of U.S. $750 million. As of the reporting date on December 31, 2019, the fair value of these options amounted to €691 K.
December 31, 2019 Currency Volume Maturity
Fair value€ in K
Forward contract USD 170,000 2020 164
USD 170,000 164
Forward contract JPY 2,150,000 2020 227
JPY 2,150,000 227
Forward contract AUD – 6,000 2020 – 67
AUD –6,000 –67
Forward contract GBP 9,000 2020 48
GBP 9,000 48
Forward contract SEK 9,000 2020 – 5
SEK 9,000 –5
December 31, 2020 Currency Volume Maturity
Fair value€ in K
Forward contract USD 225,000 2021 12,669
USD 225,000 12,669
Forward contract JPY 1,550,000 2021 152
JPY 1,550,000 152
Forward contract CAD – 2,000 2021 11
CAD –2,000 11
Forward contract GBP 43,000 2021 570
GBP 43,000 570
Derivative financial instruments are measured at the time of acquisition at cost and on subsequent reporting dates at fair value. The changes in value of the derivative financial instruments are generally recognized in the statement of profit or loss on the reporting date.
If the derivative financial instruments are used to hedge cash flow risks arising from exchange rate risks and a qualifying hedging relationship exists based on the criteria of IFRS 9, the valuation adjustments for the effective portion are recognized in other comprehensive income. Only the change in the spot element of the forward contracts used as cash flow hedges are regularly designated. Amounts accumulated in equity are reclassified to profit or loss in other income and other expenses (see note 11) in the same periods in which the hedged item affects profit or loss. The changes in the cash flow hedging reserves are shown in the statement of changes in equity and in the statement of comprehensive income. The non-designated or ineffective part is recognized immediately through profit or loss in the financial result.
The critical terms match method is used to test the effectiveness of a hedging relationship; in other words, the economic relationship between the hedging instrument and the underlying hedged item is determined based on the consistency of the significant contractual features of the transactions. To this extent, the Group conducts a qualitative assessment. Hedge ineffectiveness may possibly arise if the timing of future transactions deviates from the original assumptions or the credit risk of the counterparties of a hedging instrument, i.e., forward contract, changes.
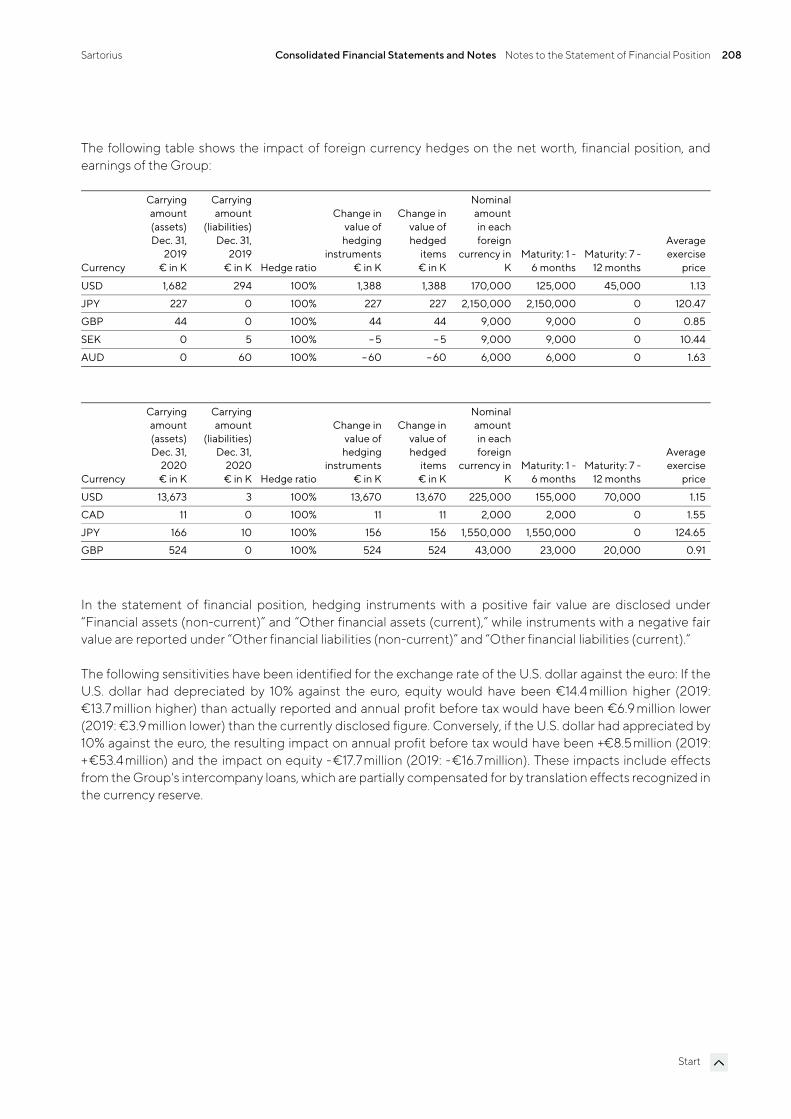
Sartorius Consolidated Financial Statements and Notes Notes to the Statement of Financial Position 208
Start
The following table shows the impact of foreign currency hedges on the net worth, financial position, and earnings of the Group:
Currency
Carrying amount (assets)Dec. 31,
2019€ in K
Carrying amount
(liabilities)Dec. 31,
2019€ in K Hedge ratio
Change in value of
hedging instruments
€ in K
Change in value of hedged
items€ in K
Nominal amountin each foreign
currency in K
Maturity: 1 - 6 months
Maturity: 7 - 12 months
Average exercise
price
USD 1,682 294 100% 1,388 1,388 170,000 125,000 45,000 1.13
JPY 227 0 100% 227 227 2,150,000 2,150,000 0 120.47
GBP 44 0 100% 44 44 9,000 9,000 0 0.85
SEK 0 5 100% – 5 – 5 9,000 9,000 0 10.44
AUD 0 60 100% – 60 – 60 6,000 6,000 0 1.63
Currency
Carrying amount (assets)Dec. 31,
2020€ in K
Carrying amount
(liabilities)Dec. 31,
2020€ in K Hedge ratio
Change in value of
hedging instruments
€ in K
Change in value of hedged
items€ in K
Nominal amountin each foreign
currency in K
Maturity: 1 - 6 months
Maturity: 7 - 12 months
Average exercise
price
USD 13,673 3 100% 13,670 13,670 225,000 155,000 70,000 1.15
CAD 11 0 100% 11 11 2,000 2,000 0 1.55
JPY 166 10 100% 156 156 1,550,000 1,550,000 0 124.65
GBP 524 0 100% 524 524 43,000 23,000 20,000 0.91
In the statement of financial position, hedging instruments with a positive fair value are disclosed under “Financial assets (non-current)” and “Other financial assets (current),” while instruments with a negative fair value are reported under “Other financial liabilities (non-current)” and “Other financial liabilities (current).”
The following sensitivities have been identified for the exchange rate of the U.S. dollar against the euro: If the U.S. dollar had depreciated by 10% against the euro, equity would have been €14.4 million higher (2019: €13.7 million higher) than actually reported and annual profit before tax would have been €6.9 million lower (2019: €3.9 million lower) than the currently disclosed figure. Conversely, if the U.S. dollar had appreciated by 10% against the euro, the resulting impact on annual profit before tax would have been +€8.5 million (2019: +€53.4 million) and the impact on equity - €17.7 million (2019: -€16.7million). These impacts include effects from the Group's intercompany loans, which are partially compensated for by translation effects recognized in the currency reserve.
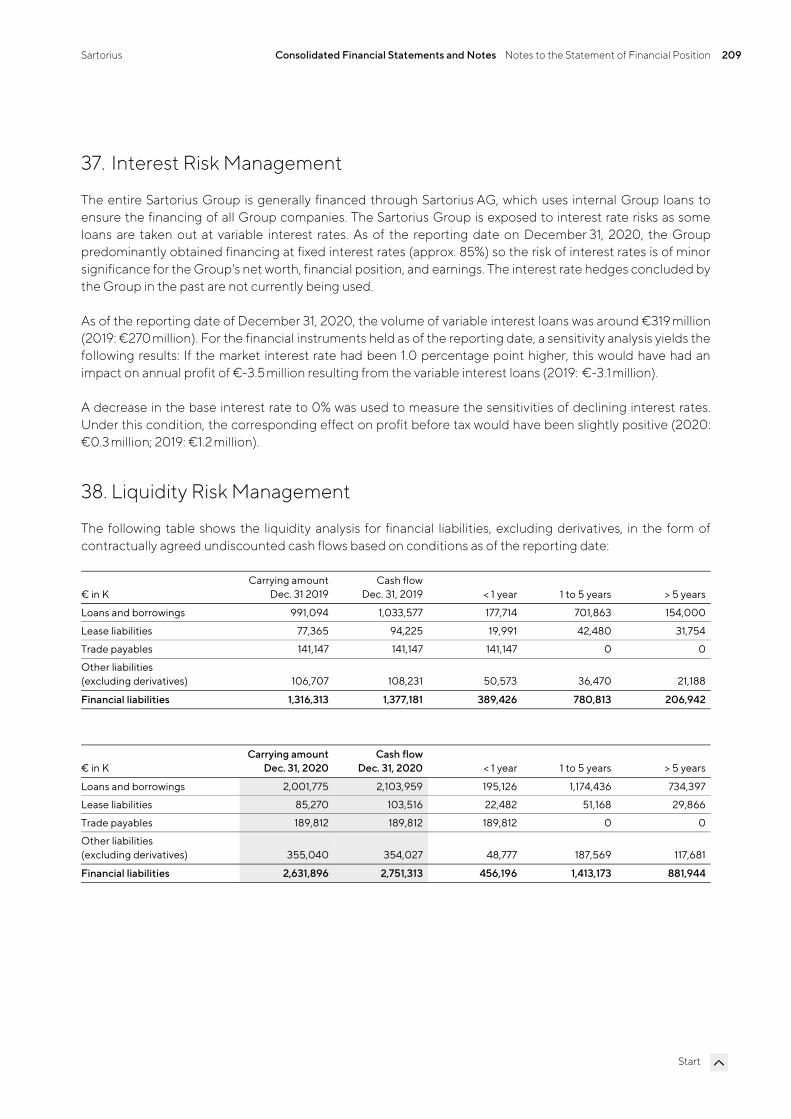
Sartorius Consolidated Financial Statements and Notes Notes to the Statement of Financial Position 209
Start
37. Interest Risk Management
The entire Sartorius Group is generally financed through Sartorius AG, which uses internal Group loans to ensure the financing of all Group companies. The Sartorius Group is exposed to interest rate risks as some loans are taken out at variable interest rates. As of the reporting date on December 31, 2020, the Group predominantly obtained financing at fixed interest rates (approx. 85%) so the risk of interest rates is of minor significance for the Group's net worth, financial position, and earnings. The interest rate hedges concluded by the Group in the past are not currently being used.
As of the reporting date of December 31, 2020, the volume of variable interest loans was around €319 million (2019: €270 million). For the financial instruments held as of the reporting date, a sensitivity analysis yields the following results: If the market interest rate had been 1.0 percentage point higher, this would have had an impact on annual profit of €-3.5 million resulting from the variable interest loans (2019: €-3.1 million).
A decrease in the base interest rate to 0% was used to measure the sensitivities of declining interest rates. Under this condition, the corresponding effect on profit before tax would have been slightly positive (2020: €0.3 million; 2019: €1.2 million).
38. Liquidity Risk Management
The following table shows the liquidity analysis for financial liabilities, excluding derivatives, in the form of contractually agreed undiscounted cash flows based on conditions as of the reporting date:
€ in K Carrying amount
Dec. 31 2019Cash flow
Dec. 31, 2019 < 1 year 1 to 5 years > 5 years
Loans and borrowings 991,094 1,033,577 177,714 701,863 154,000
Lease liabilities 77,365 94,225 19,991 42,480 31,754
Trade payables 141,147 141,147 141,147 0 0
Other liabilities (excluding derivatives) 106,707 108,231 50,573 36,470 21,188
Financial liabilities 1,316,313 1,377,181 389,426 780,813 206,942
€ in K Carrying amount
Dec. 31, 2020Cash flow
Dec. 31, 2020 < 1 year 1 to 5 years > 5 years
Loans and borrowings 2,001,775 2,103,959 195,126 1,174,436 734,397
Lease liabilities 85,270 103,516 22,482 51,168 29,866
Trade payables 189,812 189,812 189,812 0 0
Other liabilities (excluding derivatives) 355,040 354,027 48,777 187,569 117,681
Financial liabilities 2,631,896 2,751,313 456,196 1,413,173 881,944
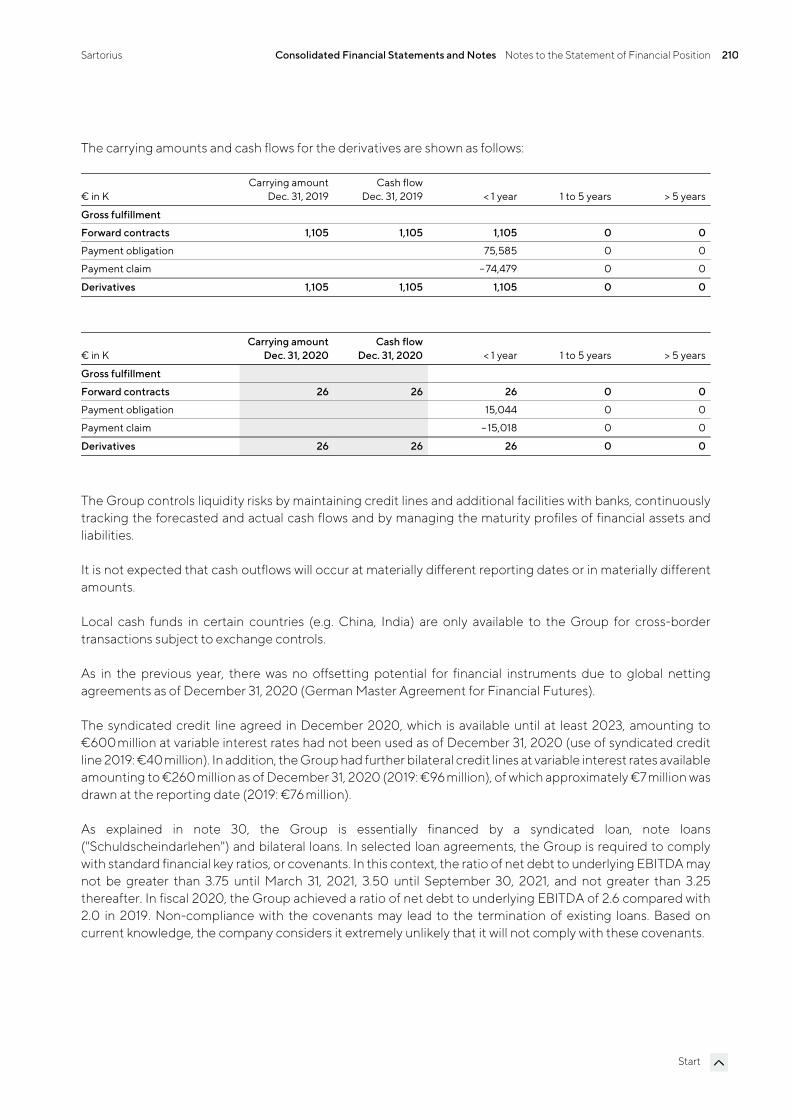
Sartorius Consolidated Financial Statements and Notes Notes to the Statement of Financial Position 210
Start
The carrying amounts and cash flows for the derivatives are shown as follows:
€ in K Carrying amount
Dec. 31, 2019Cash flow
Dec. 31, 2019 < 1 year 1 to 5 years > 5 years
Gross fulfillment
Forward contracts 1,105 1,105 1,105 0 0
Payment obligation 75,585 0 0
Payment claim – 74,479 0 0
Derivatives 1,105 1,105 1,105 0 0
€ in K Carrying amount
Dec. 31, 2020Cash flow
Dec. 31, 2020 < 1 year 1 to 5 years > 5 years
Gross fulfillment
Forward contracts 26 26 26 0 0
Payment obligation 15,044 0 0
Payment claim – 15,018 0 0
Derivatives 26 26 26 0 0
The Group controls liquidity risks by maintaining credit lines and additional facilities with banks, continuously tracking the forecasted and actual cash flows and by managing the maturity profiles of financial assets and liabilities.
It is not expected that cash outflows will occur at materially different reporting dates or in materially different amounts.
Local cash funds in certain countries (e.g. China, India) are only available to the Group for cross-border transactions subject to exchange controls.
As in the previous year, there was no offsetting potential for financial instruments due to global netting agreements as of December 31, 2020 (German Master Agreement for Financial Futures).
The syndicated credit line agreed in December 2020, which is available until at least 2023, amounting to €600million at variable interest rates had not been used as of December 31, 2020 (use of syndicated credit line 2019: €40 million). In addition, the Group had further bilateral credit lines at variable interest rates available amounting to €260 million as of December 31, 2020 (2019: €96 million), of which approximately €7 million was drawn at the reporting date (2019: €76 million).
As explained in note 30, the Group is essentially financed by a syndicated loan, note loans ("Schuldscheindarlehen") and bilateral loans. In selected loan agreements, the Group is required to comply with standard financial key ratios, or covenants. In this context, the ratio of net debt to underlying EBITDA may not be greater than 3.75 until March 31, 2021, 3.50 until September 30, 2021, and not greater than 3.25 thereafter. In fiscal 2020, the Group achieved a ratio of net debt to underlying EBITDA of 2.6 compared with 2.0 in 2019. Non-compliance with the covenants may lead to the termination of existing loans. Based on current knowledge, the company considers it extremely unlikely that it will not comply with these covenants.
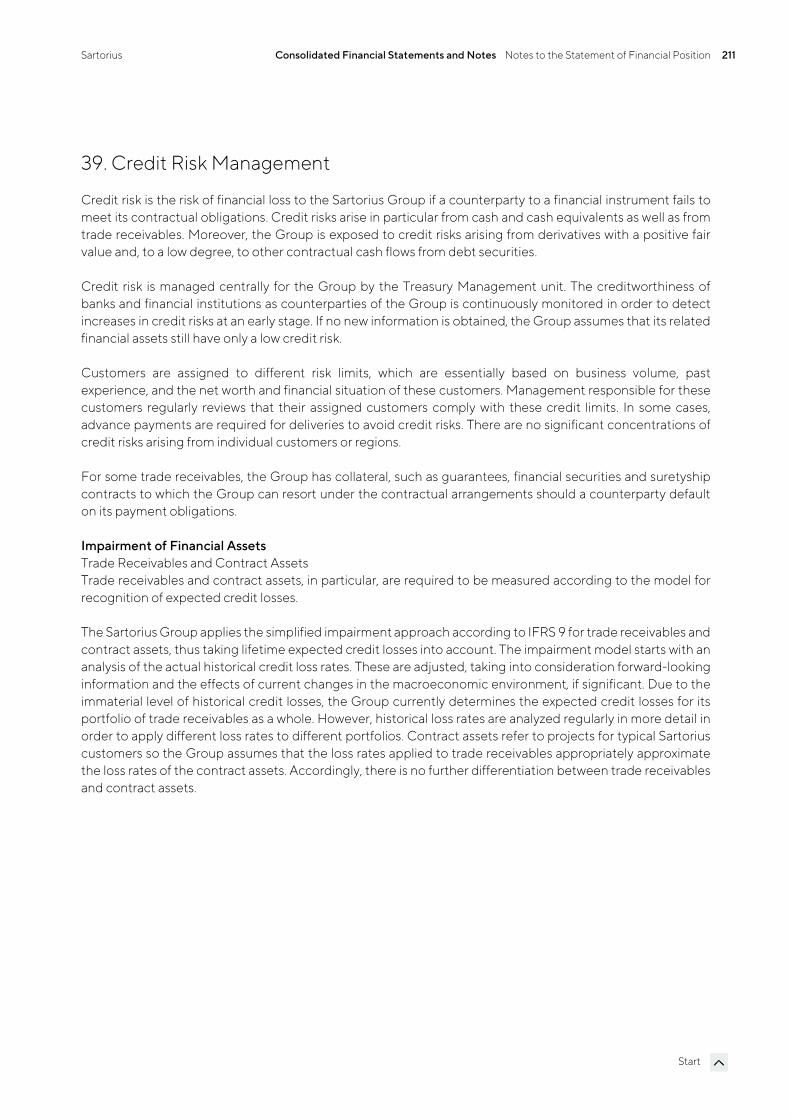
Sartorius Consolidated Financial Statements and Notes Notes to the Statement of Financial Position 211
Start
39. Credit Risk Management
Credit risk is the risk of financial loss to the Sartorius Group if a counterparty to a financial instrument fails to meet its contractual obligations. Credit risks arise in particular from cash and cash equivalents as well as from trade receivables. Moreover, the Group is exposed to credit risks arising from derivatives with a positive fair value and, to a low degree, to other contractual cash flows from debt securities.
Credit risk is managed centrally for the Group by the Treasury Management unit. The creditworthiness of banks and financial institutions as counterparties of the Group is continuously monitored in order to detect increases in credit risks at an early stage. If no new information is obtained, the Group assumes that its related financial assets still have only a low credit risk.
Customers are assigned to different risk limits, which are essentially based on business volume, past experience, and the net worth and financial situation of these customers. Management responsible for these customers regularly reviews that their assigned customers comply with these credit limits. In some cases, advance payments are required for deliveries to avoid credit risks. There are no significant concentrations of credit risks arising from individual customers or regions.
For some trade receivables, the Group has collateral, such as guarantees, financial securities and suretyship contracts to which the Group can resort under the contractual arrangements should a counterparty default on its payment obligations.
Impairment of Financial Assets Trade Receivables and Contract Assets Trade receivables and contract assets, in particular, are required to be measured according to the model for recognition of expected credit losses.
The Sartorius Group applies the simplified impairment approach according to IFRS 9 for trade receivables and contract assets, thus taking lifetime expected credit losses into account. The impairment model starts with an analysis of the actual historical credit loss rates. These are adjusted, taking into consideration forward-looking information and the effects of current changes in the macroeconomic environment, if significant. Due to the immaterial level of historical credit losses, the Group currently determines the expected credit losses for its portfolio of trade receivables as a whole. However, historical loss rates are analyzed regularly in more detail in order to apply different loss rates to different portfolios. Contract assets refer to projects for typical Sartorius customers so the Group assumes that the loss rates applied to trade receivables appropriately approximate the loss rates of the contract assets. Accordingly, there is no further differentiation between trade receivables and contract assets.
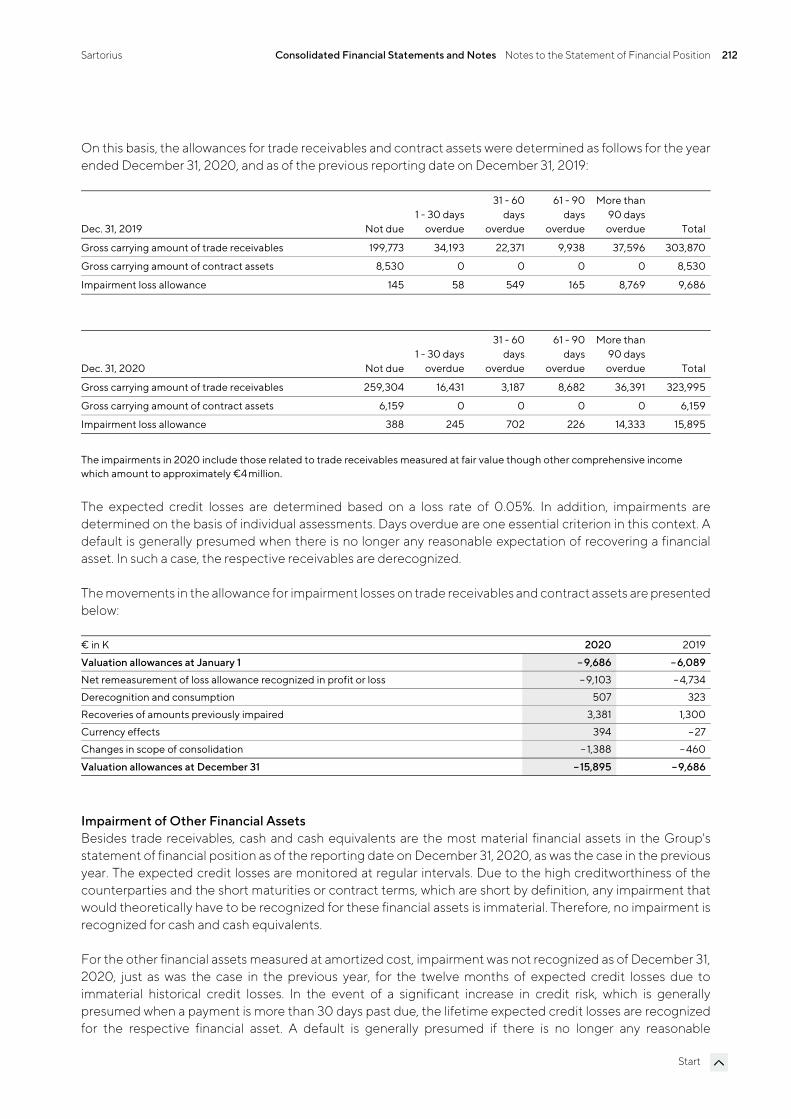
Sartorius Consolidated Financial Statements and Notes Notes to the Statement of Financial Position 212
Start
On this basis, the allowances for trade receivables and contract assets were determined as follows for the year ended December 31, 2020, and as of the previous reporting date on December 31, 2019:
Dec. 31, 2019 Not due1 - 30 days
overdue
31 - 60 days
overdue
61 - 90 days
overdue
More than 90 days overdue Total
Gross carrying amount of trade receivables 199,773 34,193 22,371 9,938 37,596 303,870
Gross carrying amount of contract assets 8,530 0 0 0 0 8,530
Impairment loss allowance 145 58 549 165 8,769 9,686
Dec. 31, 2020 Not due1 - 30 days
overdue
31 - 60 days
overdue
61 - 90 days
overdue
More than 90 days overdue Total
Gross carrying amount of trade receivables 259,304 16,431 3,187 8,682 36,391 323,995
Gross carrying amount of contract assets 6,159 0 0 0 0 6,159
Impairment loss allowance 388 245 702 226 14,333 15,895
The impairments in 2020 include those related to trade receivables measured at fair value though other comprehensive income which amount to approximately €4 million.
The expected credit losses are determined based on a loss rate of 0.05%. In addition, impairments are determined on the basis of individual assessments. Days overdue are one essential criterion in this context. A default is generally presumed when there is no longer any reasonable expectation of recovering a financial asset. In such a case, the respective receivables are derecognized.
The movements in the allowance for impairment losses on trade receivables and contract assets are presented below:
€ in K 2020 2019
Valuation allowances at January 1 – 9,686 –6,089
Net remeasurement of loss allowance recognized in profit or loss – 9,103 – 4,734
Derecognition and consumption 507 323
Recoveries of amounts previously impaired 3,381 1,300
Currency effects 394 – 27
Changes in scope of consolidation – 1,388 – 460
Valuation allowances at December 31 –15,895 –9,686
Impairment of Other Financial Assets Besides trade receivables, cash and cash equivalents are the most material financial assets in the Group's statement of financial position as of the reporting date on December 31, 2020, as was the case in the previous year. The expected credit losses are monitored at regular intervals. Due to the high creditworthiness of the counterparties and the short maturities or contract terms, which are short by definition, any impairment that would theoretically have to be recognized for these financial assets is immaterial. Therefore, no impairment is recognized for cash and cash equivalents.
For the other financial assets measured at amortized cost, impairment was not recognized as of December 31, 2020, just as was the case in the previous year, for the twelve months of expected credit losses due to immaterial historical credit losses. In the event of a significant increase in credit risk, which is generally presumed when a payment is more than 30 days past due, the lifetime expected credit losses are recognized for the respective financial asset. A default is generally presumed if there is no longer any reasonable
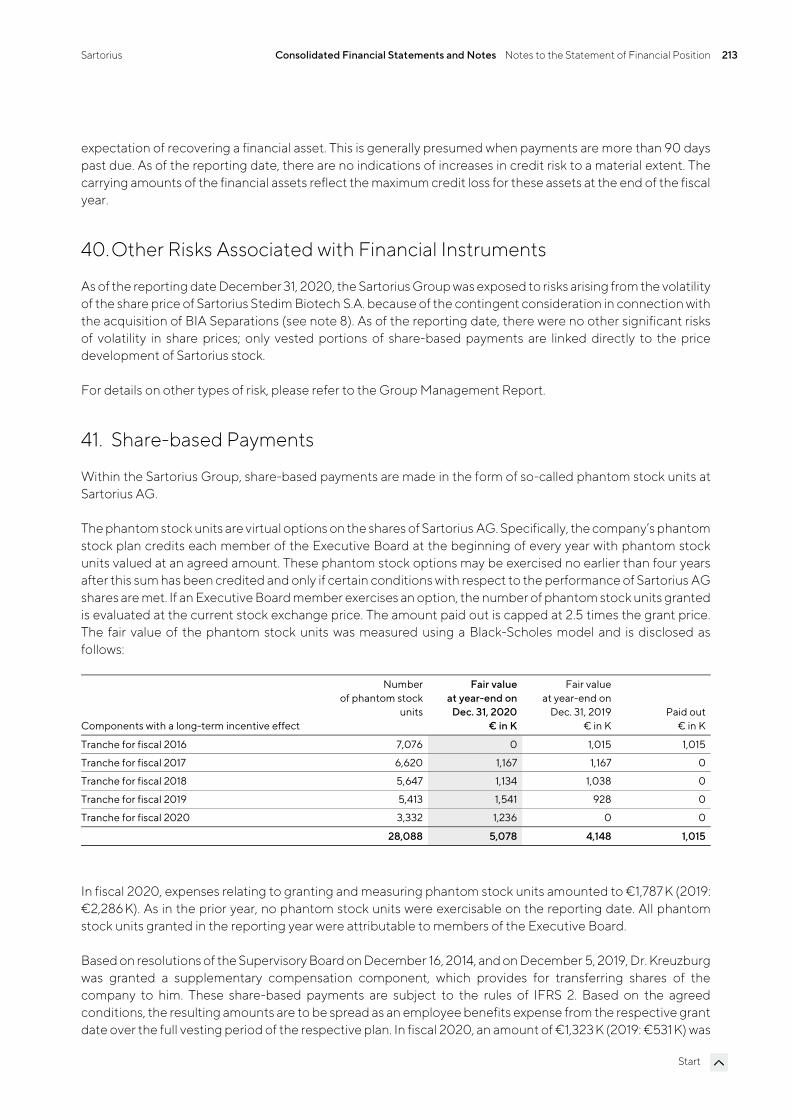
Sartorius Consolidated Financial Statements and Notes Notes to the Statement of Financial Position 213
Start
expectation of recovering a financial asset. This is generally presumed when payments are more than 90 days past due. As of the reporting date, there are no indications of increases in credit risk to a material extent. The carrying amounts of the financial assets reflect the maximum credit loss for these assets at the end of the fiscal year.
40.Other Risks Associated with Financial Instruments
As of the reporting date December 31, 2020, the Sartorius Group was exposed to risks arising from the volatility of the share price of Sartorius Stedim Biotech S.A. because of the contingent consideration in connection with the acquisition of BIA Separations (see note 8). As of the reporting date, there were no other significant risks of volatility in share prices; only vested portions of share-based payments are linked directly to the price development of Sartorius stock.
For details on other types of risk, please refer to the Group Management Report.
41. Share-based Payments
Within the Sartorius Group, share-based payments are made in the form of so-called phantom stock units at Sartorius AG.
The phantom stock units are virtual options on the shares of Sartorius AG. Specifically, the company’s phantom stock plan credits each member of the Executive Board at the beginning of every year with phantom stock units valued at an agreed amount. These phantom stock options may be exercised no earlier than four years after this sum has been credited and only if certain conditions with respect to the performance of Sartorius AG shares are met. If an Executive Board member exercises an option, the number of phantom stock units granted is evaluated at the current stock exchange price. The amount paid out is capped at 2.5 times the grant price. The fair value of the phantom stock units was measured using a Black-Scholes model and is disclosed as follows:
Components with a long-term incentive effect
Numberof phantom stock
units
Fair valueat year-end on
Dec. 31, 2020€ in K
Fair valueat year-end on
Dec. 31, 2019€ in K
Paid out€ in K
Tranche for fiscal 2016 7,076 0 1,015 1,015
Tranche for fiscal 2017 6,620 1,167 1,167 0
Tranche for fiscal 2018 5,647 1,134 1,038 0
Tranche for fiscal 2019 5,413 1,541 928 0
Tranche for fiscal 2020 3,332 1,236 0 0
28,088 5,078 4,148 1,015
In fiscal 2020, expenses relating to granting and measuring phantom stock units amounted to €1,787 K (2019: €2,286 K). As in the prior year, no phantom stock units were exercisable on the reporting date. All phantom stock units granted in the reporting year were attributable to members of the Executive Board.
Based on resolutions of the Supervisory Board on December 16, 2014, and on December 5, 2019, Dr. Kreuzburg was granted a supplementary compensation component, which provides for transferring shares of the company to him. These share-based payments are subject to the rules of IFRS 2. Based on the agreed conditions, the resulting amounts are to be spread as an employee benefits expense from the respective grant date over the full vesting period of the respective plan. In fiscal 2020, an amount of €1,323 K (2019: €531 K) was

Sartorius Consolidated Financial Statements and Notes Notes to the Statement of Financial Position 214
Start
therefore recognized as an employee benefits expense resulting from the grant of shares. For further details on the phantom stocks and the share-based remuneration of Dr. Kreuzburg, please refer to the Remuneration Report.
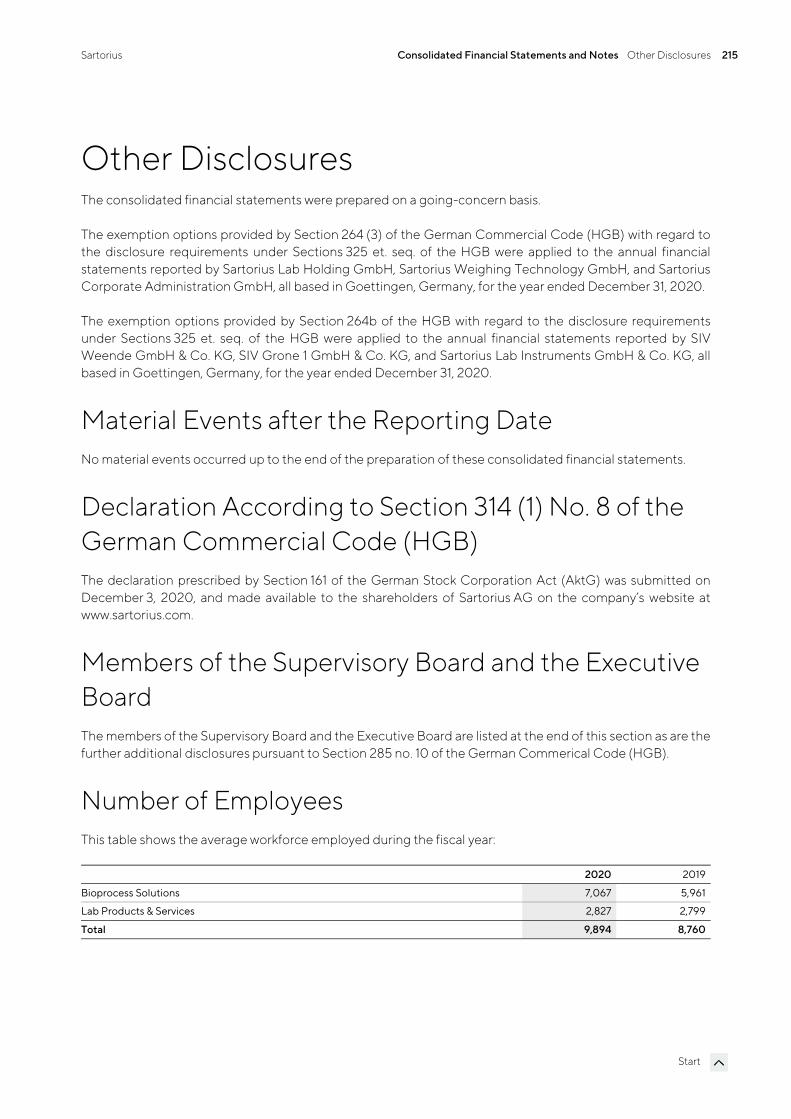
Sartorius Consolidated Financial Statements and Notes Other Disclosures 215
Start
Other Disclosures The consolidated financial statements were prepared on a going-concern basis.
The exemption options provided by Section 264 (3) of the German Commercial Code (HGB) with regard to the disclosure requirements under Sections 325 et. seq. of the HGB were applied to the annual financial statements reported by Sartorius Lab Holding GmbH, Sartorius Weighing Technology GmbH, and Sartorius Corporate Administration GmbH, all based in Goettingen, Germany, for the year ended December 31, 2020.
The exemption options provided by Section 264b of the HGB with regard to the disclosure requirements under Sections 325 et. seq. of the HGB were applied to the annual financial statements reported by SIV Weende GmbH & Co. KG, SIV Grone 1 GmbH & Co. KG, and Sartorius Lab Instruments GmbH & Co. KG, all based in Goettingen, Germany, for the year ended December 31, 2020.
Material Events after the Reporting Date No material events occurred up to the end of the preparation of these consolidated financial statements.
Declaration According to Section 314 (1) No. 8 of the German Commercial Code (HGB) The declaration prescribed by Section 161 of the German Stock Corporation Act (AktG) was submitted on December 3, 2020, and made available to the shareholders of Sartorius AG on the company’s website at www.sartorius.com.
Members of the Supervisory Board and the Executive Board The members of the Supervisory Board and the Executive Board are listed at the end of this section as are the further additional disclosures pursuant to Section 285 no. 10 of the German Commerical Code (HGB).
Number of Employees This table shows the average workforce employed during the fiscal year:
2020 2019
Bioprocess Solutions 7,067 5,961
Lab Products & Services 2,827 2,799
Total 9,894 8,760
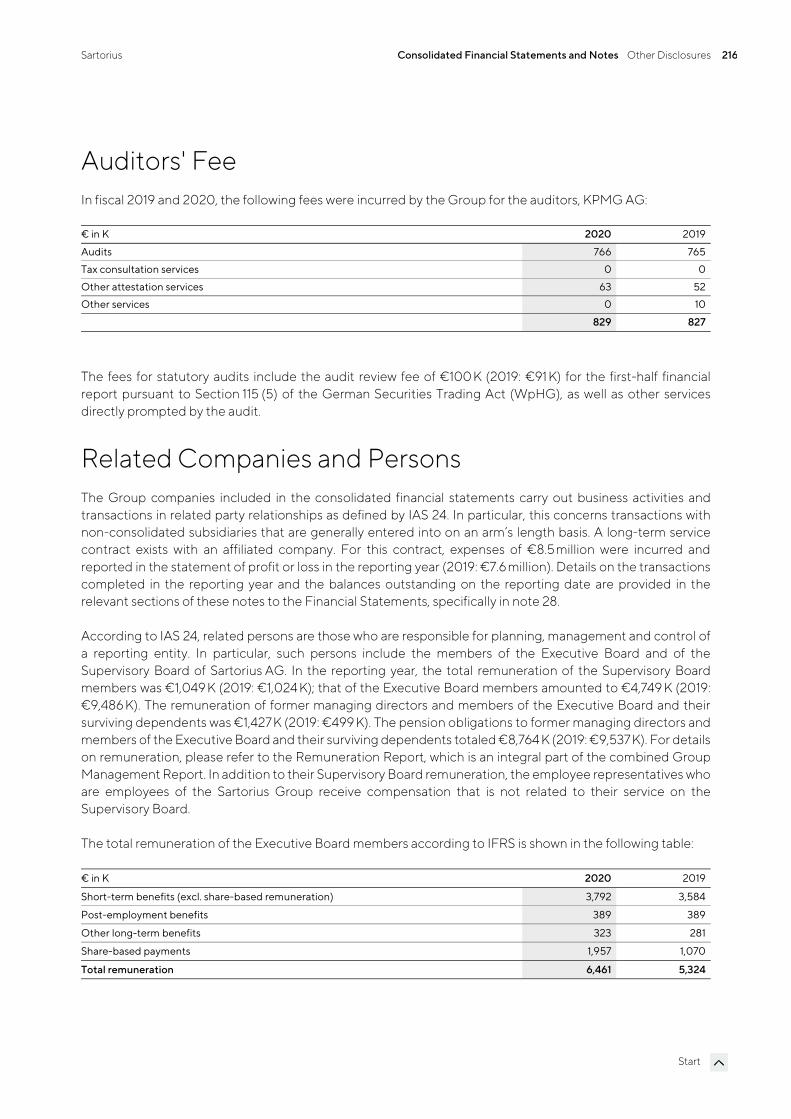
Sartorius Consolidated Financial Statements and Notes Other Disclosures 216
Start
Auditors' Fee In fiscal 2019 and 2020, the following fees were incurred by the Group for the auditors, KPMG AG:
€ in K 2020 2019
Audits 766 765
Tax consultation services 0 0
Other attestation services 63 52
Other services 0 10
829 827
The fees for statutory audits include the audit review fee of €100 K (2019: €91 K) for the first-half financial report pursuant to Section 115 (5) of the German Securities Trading Act (WpHG), as well as other services directly prompted by the audit.
Related Companies and Persons The Group companies included in the consolidated financial statements carry out business activities and transactions in related party relationships as defined by IAS 24. In particular, this concerns transactions with non-consolidated subsidiaries that are generally entered into on an arm’s length basis. A long-term service contract exists with an affiliated company. For this contract, expenses of €8.5 million were incurred and reported in the statement of profit or loss in the reporting year (2019: €7.6 million). Details on the transactions completed in the reporting year and the balances outstanding on the reporting date are provided in the relevant sections of these notes to the Financial Statements, specifically in note 28.
According to IAS 24, related persons are those who are responsible for planning, management and control of a reporting entity. In particular, such persons include the members of the Executive Board and of the Supervisory Board of Sartorius AG. In the reporting year, the total remuneration of the Supervisory Board members was €1,049 K (2019: €1,024 K); that of the Executive Board members amounted to €4,749 K (2019: €9,486 K). The remuneration of former managing directors and members of the Executive Board and their surviving dependents was €1,427K (2019: €499 K). The pension obligations to former managing directors and members of the Executive Board and their surviving dependents totaled €8,764 K (2019: €9,537 K). For details on remuneration, please refer to the Remuneration Report, which is an integral part of the combined Group Management Report. In addition to their Supervisory Board remuneration, the employee representatives who are employees of the Sartorius Group receive compensation that is not related to their service on the Supervisory Board.
The total remuneration of the Executive Board members according to IFRS is shown in the following table:
€ in K 2020 2019
Short-term benefits (excl. share-based remuneration) 3,792 3,584
Post-employment benefits 389 389
Other long-term benefits 323 281
Share-based payments 1,957 1,070
Total remuneration 6,461 5,324
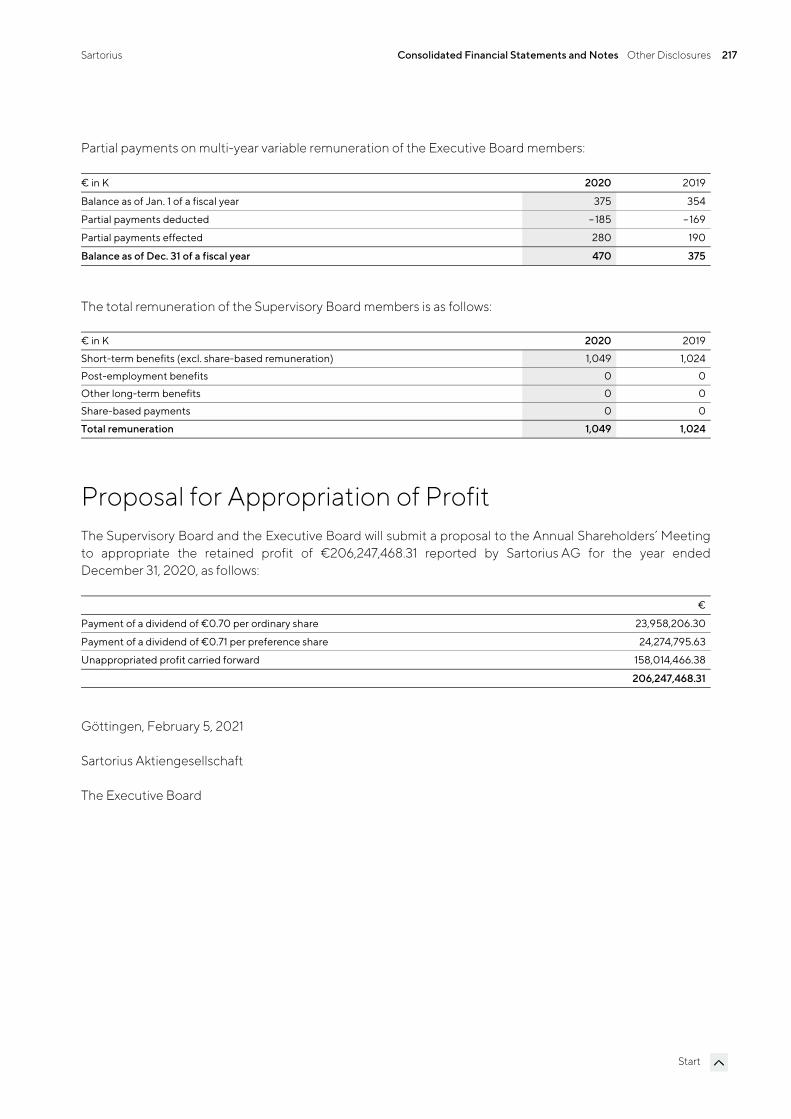
Sartorius Consolidated Financial Statements and Notes Other Disclosures 217
Start
Partial payments on multi-year variable remuneration of the Executive Board members:
€ in K 2020 2019
Balance as of Jan. 1 of a fiscal year 375 354
Partial payments deducted – 185 – 169
Partial payments effected 280 190
Balance as of Dec. 31 of a fiscal year 470 375
The total remuneration of the Supervisory Board members is as follows:
€ in K 2020 2019
Short-term benefits (excl. share-based remuneration) 1,049 1,024
Post-employment benefits 0 0
Other long-term benefits 0 0
Share-based payments 0 0
Total remuneration 1,049 1,024
Proposal for Appropriation of Profit The Supervisory Board and the Executive Board will submit a proposal to the Annual Shareholders’ Meeting to appropriate the retained profit of €206,247,468.31 reported by Sartorius AG for the year ended December 31, 2020, as follows:
€
Payment of a dividend of €0.70 per ordinary share 23,958,206.30
Payment of a dividend of €0.71 per preference share 24,274,795.63
Unappropriated profit carried forward 158,014,466.38
206,247,468.31
Göttingen, February 5, 2021
Sartorius Aktiengesellschaft
The Executive Board
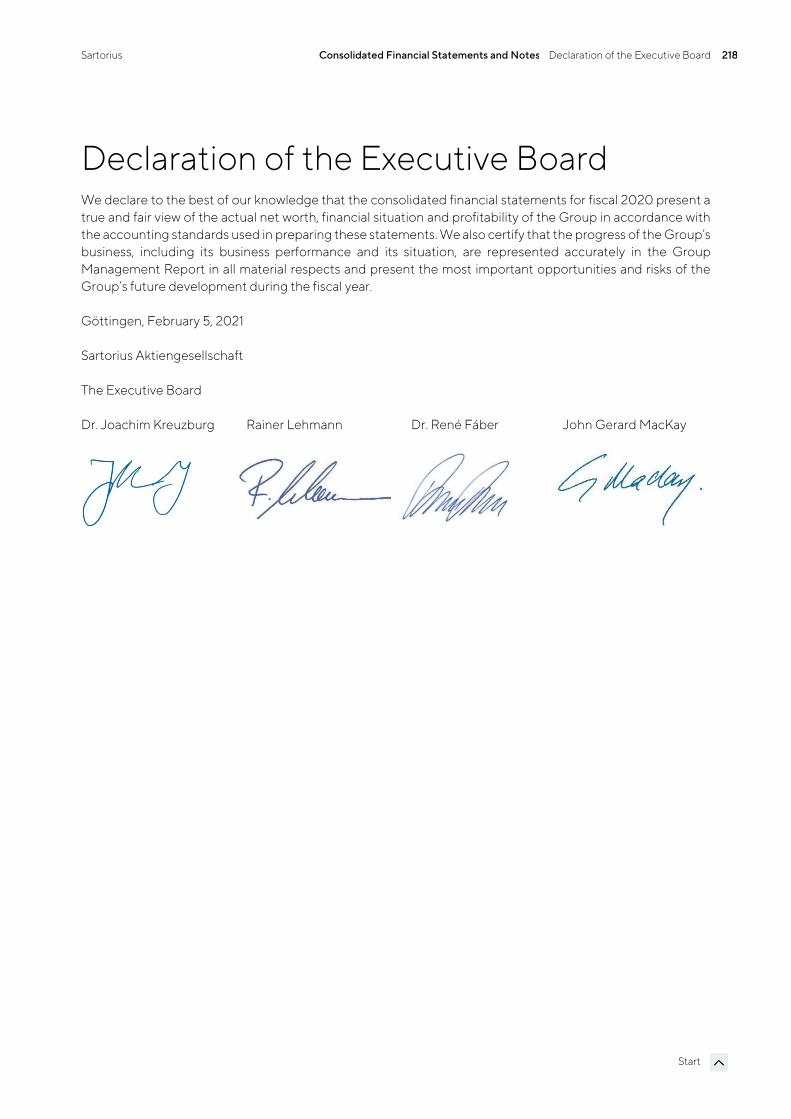
Sartorius Consolidated Financial Statements and Notes Declaration of the Executive Board 218
Start
Declaration of the Executive Board We declare to the best of our knowledge that the consolidated financial statements for fiscal 2020 present a true and fair view of the actual net worth, financial situation and profitability of the Group in accordance with the accounting standards used in preparing these statements. We also certify that the progress of the Group’s business, including its business performance and its situation, are represented accurately in the Group Management Report in all material respects and present the most important opportunities and risks of the Group’s future development during the fiscal year.
Göttingen, February 5, 2021
Sartorius Aktiengesellschaft
The Executive Board
Dr. Joachim Kreuzburg Rainer Lehmann Dr. René Fáber John Gerard MacKay
Sartorius Consolidated Financial Statements and Notes Independent Auditors’ Report 219
Start
Independent Auditors’ Report Report on the Audit of the Consolidated Financial Statements and of the Group Management Report
Opinions
We have audited the consolidated financial statements of Sartorius Aktiengesellschaft, Göttingen, and its subsidiaries (the Group) – which comprise the consolidated statement of financial position as at December 31st, 2020, and the consolidated statement of comprehensive income, consolidated statement of changes in equity and consolidated statement of cash flows for the financial year from 1 January 2020 to 31 December 2020, and notes to the consolidated financial statements, including a summary of significant accounting policies. In addition, we have audited the group management report of Sartorius Aktiengesellschaft for the financial year from 1 January 2020 to 31 December 2020. In accordance with the German legal requirements we have not audited the content of the parts of the management report mentioned in the section on “Other Information” of our Independent Audit Report.
In our opinion, on the basis of the knowledge obtained in the audit,
the accompanying consolidated financial statements comply, in all material respects, with the IFRSs as adopted by the EU, and the additional requirements of German commercial law pursuant to Section 315e (1) HGB [Handelsgesetzbuch: German Commercial Code] and, in compliance with these requirements, give a true and fair view of the assets, liabilities, and financial position of the Group as at 31 December 2020, and of its financial performance for the financial year from 1 January 2020 to 31 December 2020, and
the accompanying group management report as a whole provides an appropriate view of the Group’s position. In all material respects, this group management report is consistent with the consolidated financial statements, complies with German legal requirements and appropriately presents the opportunities and risks of future development. Our opinion on the group management report does not cover the content of the non-financial statement and the corporate governance statement mentioned above.
Pursuant to Section 322 (3) sentence 1 HGB, we declare that our audit has not led to any reservations relating to the legal compliance of the consolidated financial statements and of the group management report.
Basis for the Opinions
We conducted our audit of the consolidated financial statements and of the group management report in accordance with Section 317 HGB and the EU Audit Regulation No. 537/2014 (referred to subsequently as “EU Audit Regulation”) and in compliance with German Generally Accepted Standards for Financial Statement Audits promulgated by the Institut der Wirtschaftsprüfer [Institute of Public Auditors in Germany] (IDW). Our responsibilities under those requirements and principles are further described in the “Auditor’s Responsibilities for the Audit of the Consolidated Financial Statements and of the Group Management Report” section of our auditor’s report. We are independent of the group entities in accordance with the requirements of European law and German commercial and professional law, and we have fulfilled our other German professional responsibilities in accordance with these requirements. In addition, in accordance with
Sartorius Consolidated Financial Statements and Notes Independent Auditors’ Report 220
Start
Article 10 (2) point (f) of the EU Audit Regulation, we declare that we have not provided non-audit services prohibited under Article 5 (1) of the EU Audit Regulation. We believe that the evidence we have obtained is sufficient and appropriate to provide a basis for our opinions on the consolidated financial statements and on the group management report.
Key Audit Matters in the Audit of the Consolidated Financial Statements
Key audit matters are those matters that, in our professional judgment, were of most significance in our audit of the consolidated financial statements for the financial year from 1 January 2020 to 31 December 2020. These matters were addressed in the context of our audit of the consolidated financial statements as a whole, and in forming our opinion thereon, we do not provide a separate opinion on these matters.
Recoverability of the Carrying Amount of Goodwill The accounting policies as well as the assumptions made are disclosed in the notes to the consolidated financial statements in note 15. Disclosure of the amount of goodwill is provided in the notes to the consolidated financial statements in note 15.
THE FINANCIAL STATEMENT RISK
As at 31 December 2020, goodwill totalled EUR 1.381 million, thereby comprising 29% of the balance sheet total and a substantial portion of the assets.
Goodwill is tested for impairment annually at the level of the operating segment Bioprocess Solutions (Goodwill EUR 1.052 million) and Lab Products & Services (Goodwill EUR 329 million ) and The carrying amount is thereby compared with the recoverable amount of the respective operating segments. If the carrying amount exceeds the recoverable amount of the respective operating segment, an impairment is recorded. The recoverable amount is the higher of the fair value less the costs to sell and value in use of the operating segment. The impairment test was carried out as at 30 November 2020.
The goodwill impairment test is complex and is based on a number of judgemental assumptions. These include, among others, the expected business and earnings development of the operating segments for the upcoming 5 years, the assumed long-term growth rates and the discount rate used.
There is the risk for the financial statements that the required impairments were not sufficiently recorded. In addition, there is the risk that the disclosures in the notes associated herewith are not appropriate.
OUR AUDIT APPROACH
With the support of our valuation specialists, we assessed, among other things, the appropriateness of the significant assumptions as well as the Company’s valuation model. This included a discussion of the expected development of the business and results as well as of the assumed underlying long-term growth rates with those responsible for the planning process. In addition, reconciliations were made with the budget 2021 prepared by the Executive Board and which were approved by the Supervisory Board and as well with the planning for the next 4 years. Furthermore, we assessed the consistency of the assumptions with external market assessments.
We also assessed the Company’s planning accuracy by comparing projections for previous financial years with the actual results realised and analysed deviations. As small changes in the discount rate can have a substantial impact on the results of the impairment test, we have compared the assumptions and parameters underlying the discount rate – in particular the risk-free rate, the market risk premium and the beta factor – with own assumptions and publicly available information.
Sartorius Consolidated Financial Statements and Notes Independent Auditors’ Report 221
Start
To provide for the mathematical accuracy of the valuation model utilised, we recalculated the Company’s calculations on the basis of elements selected in a risk-orientated manner.
To reflect the existing uncertainty with respect to forecasts as well as the earlier valuation date for the impairment test, we have assessed reasonably possible changes of the discount rate, the expected earnings respectively the long-term growth rate on the recoverable amount (sensitivity analysis) by calculating alternative scenarios and comparing these with the Company’s valuation results.
Finally, we assessed whether the disclosures in the notes with respect to the recoverability of the carrying amount of the goodwill are appropriate.
OUR OBSERVATIONS
The underlying valuation model used in the impairment test of goodwill is appropriate and consistent with the applicable accounting principles.
The Company’s assumptions and parameters underlying the valuation are within an acceptable bandwidth and are, on the whole, balanced.
The disclosures in the notes associated herewith are appropriate.
The acquisition of selected Life Science Businesses from Danaher and BIA Separations d.o.o. The accounting policies as well as the assumptions made are disclosed in the notes to the consolidated financial statements.
THE FINANCIAL STATEMENT RISK
On 30 April 2020 the Group acquired selected life science businesses from Danaher Corporation. The purchase price amounted to EUR 775 million. Giving consideration to the net assets acquired in the amount of EUR 454 million, goodwill totalling EUR 321 million resulted.
In addition, on 2 November the Group acquired BIA Separations d.o.o. The acquisition costs amounted to EUR 652 million. Giving consideration to the net assets acquired in the amount of EUR 262 million, goodwill totalling EUR 391 million resulted.
Pursuant to IFRS 3, the identifiable assets acquired and the liabilities assumed are, as a rule , recorded at their fair value on the acquisition date. The group engaged an external expert to determine and measure the identifiable assets acquired and the liabilities assumed.
The identification and measurement of the assets acquired and the liabilities assumed is complex and based on the Executive Board’s judgemental assumptions. The significant assumptions comprise the projections of the acquired business‘ sales and margins, the license fees utilised as well as the cost of capital.
There is the financial statement risk that the assets acquired and the liabilities assumed are insufficiently identified or incorrectly measured. In addition, there is the risk that the disclosures in the notes to the consolidated financial statements are not complete and appropriate.
OUR AUDIT APPROACH
With the support of our valuation specialists we assessed, among other things, the appropriateness of the significant assumptions as well as the identification and valuation approaches. We initially obtained an understanding of the acquisition based on inquires and by assessing the relevant contracts.
Sartorius Consolidated Financial Statements and Notes Independent Auditors’ Report 222
Start
We agreed the total purchase price with the underlying purchase agreement and evidence of payment, insofar as these were settled in cash.
We assessed the competency, skills and objectivity of the independent expert engaged by Sartorius AG. Furthermore, we assessed the process of the identification of the assets acquired and liabilities assumed in terms of conformity with the requirements of IFRS 3 using our knowledge of Sartorius AG`s business model. We considered the consistency of the measurement methods used and the measurement principles applicable.
We discussed the expected development of sales and margins with those responsible for planning. Furthermore, we reconciled these with the budgets prepared by the Executive Board which were approved by the Supervisory Board and assessed the consistency of the assumptions with external market views The license rates utilised to measure the intangible assets were compared with reference amounts from relevant data bases. The assumptions and parameters underlying the cost of capital – in particular the risk-free interest rate, the market risk premium and the beta factor – were compared with own assumptions and publicly available data.
To assess the mathematical accuracy we recalculated amounts selected using a risk-oriented approach. Finally, we assessed whether the disclosures in the notes to the consolidated financial statements are complete and appropriate.
OUR OBSERVATIONS
The approaches underlying the identification and valuation of the assets acquired and the liabilities assumed are appropriate and consistent with the applicable accounting policies. The significant assumptions and parameters are appropriate and the disclosures in the notes to the consolidated financial statements are complete and appropriate.
Other Information
Management and the Supervisory Board are responsible for the other information. The other information comprises the following parts of the management report, the content of which has not been audited:
the non-financial statement, contained in the section on the non-financial statement of the management report,
the corporate governance statement, contained in the section on the corporate governance statement of the management report.
The other information additionally covers the remaining parts of the annual report. The other information does not comprise the audited consolidated financial statements and group management report and our respective auditor’s report.
Our opinions on the consolidated financial statements and on the group management report do not cover the other information, and consequently we do not express an opinion or any other form of assurance conclusion thereon.
In connection with our audit, our responsibility is to read the other information and, in so doing, to consider whether the other information
is materially inconsistent with the consolidated financial statements, with the group management report or our knowledge obtained in the audit, or
Sartorius Consolidated Financial Statements and Notes Independent Auditors’ Report 223
Start
otherwise appears to be materially misstated.
Responsibilities of Management and the Supervisory Board for the Consolidated Financial Statements and the Group Management Report Management is responsible for the preparation of the consolidated financial statements that comply, in all material respects, with IFRSs as adopted by the EU and the additional requirements of German commercial law pursuant to Section 315e (1) HGB and that the consolidated financial statements, in compliance with these requirements, give a true and fair view of the assets, liabilities, financial position, and financial performance of the Group. In addition, management is responsible for such internal control as they have determined necessary to enable the preparation of consolidated financial statements that are free from material misstatement, whether due to fraud or error.
In preparing the consolidated financial statements, management is responsible for assessing the Group’s ability to continue as a going concern. They also have the responsibility for disclosing, as applicable, matters related to going concern. In addition, they are responsible for financial reporting based on the going concern basis of accounting unless there is an intention to liquidate the Group or to cease operations, or there is no realistic alternative but to do so.
Furthermore, management is responsible for the preparation of the group management report that, as a whole, provides an appropriate view of the Group’s position and is, in all material respects, consistent with the consolidated financial statements, complies with German legal requirements, and appropriately presents the opportunities and risks of future development. In addition, management is responsible for such arrangements and measures (systems) as they have considered necessary to enable the preparation of a group management report that is in accordance with the applicable German legal requirements, and to be able to provide sufficient appropriate evidence for the assertions in the group management report.
The supervisory board is responsible for overseeing the Group’s financial reporting process for the preparation of the consolidated financial statements and of the group management report
Auditor’s Responsibilities for the Audit of the Consolidated Financial Statements and of the Group Management Report Our objectives are to obtain reasonable assurance about whether the consolidated financial statements as a whole are free from material misstatement, whether due to fraud or error, and whether the group management report as a whole provides an appropriate view of the Group’s position and, in all material respects, is consistent with the consolidated financial statements and the knowledge obtained in the audit, complies with the German legal requirements and appropriately presents the opportunities and risks of future development, as well as to issue an auditor’s report that includes our opinions on the consolidated financial statements and on the group management report.
Reasonable assurance is a high level of assurance, but is not a guarantee that an audit conducted in accordance with Section 317 HGB and the EU Audit Regulation and in compliance with German Generally Accepted Standards for Financial Statement Audits promulgated by the Institut der Wirtschaftsprüfer (IDW)
Sartorius Consolidated Financial Statements and Notes Independent Auditors’ Report 224
Start
will always detect a material misstatement. Misstatements can arise from fraud or error and are considered material if, individually or in the aggregate, they could reasonably be expected to influence the economic decisions of users taken on the basis of these consolidated financial statements and this group management report.
We exercise professional judgment and maintain professional skepticism throughout the audit. We also:
Identify and assess the risks of material misstatement of the consolidated financial statements and of the group management report, whether due to fraud or error, design and perform audit procedures responsive to those risks, and obtain audit evidence that is sufficient and appropriate to provide a basis for our opinions. The risk of not detecting a material misstatement resulting from fraud is higher than for one resulting from error, as fraud may involve collusion, forgery, intentional omissions, misrepresentations, or the override of internal control.
Obtain an understanding of internal control relevant to the audit of the consolidated financial statements and of arrangements and measures (systems) relevant to the audit of the group management report in order to design audit procedures that are appropriate in the circumstances, but not for the purpose of expressing an opinion on the effectiveness of these systems.
Evaluate the appropriateness of accounting policies used by management and the reasonableness of estimates made by management and related disclosures.
Conclude on the appropriateness of management’s use of the going concern basis of accounting and, based on the audit evidence obtained, whether a material uncertainty exists related to events or conditions that may cast significant doubt on the Group’s ability to continue as a going concern. If we conclude that a material uncertainty exists, we are required to draw attention in the auditor’s report to the related disclosures in the consolidated financial statements and in the group management report or, if such disclosures are inadequate, to modify our respective opinions. Our conclusions are based on the audit evidence obtained up to the date of our auditor’s report. However, future events or conditions may cause the Group to cease to be able to continue as a going concern.
Evaluate the overall presentation, structure and content of the consolidated financial statements, including the disclosures, and whether the consolidated financial statements present the underlying transactions and events in a manner that the consolidated financial statements give a true and fair view of the assets, liabilities, financial position and financial performance of the Group in compliance with IFRSs as adopted by the EU and the additional requirements of German commercial law pursuant to Section 315e (1) HGB.
Obtain sufficient appropriate audit evidence regarding the financial information of the entities or business activities within the Group to express opinions on the consolidated financial statements and on the group management report. We are responsible for the direction, supervision and performance of the group audit. We remain solely responsible for our opinions.
Evaluate the consistency of the group management report with the consolidated financial statements, its conformity with German law, and the view of the Group’s position it provides.
Perform audit procedures on the prospective information presented by management in the group management report. On the basis of sufficient appropriate audit evidence we evaluate, in particular, the significant assumptions used by management as a basis for the prospective information, and evaluate the proper derivation of the prospective information from these
Sartorius Consolidated Financial Statements and Notes Independent Auditors’ Report 225
Start
assumptions. We do not express a separate opinion on the prospective information and on the assumptions used as a basis. There is a substantial unavoidable risk that future events will differ materially from the prospective information.
We communicate with those charged with governance regarding, among other matters, the planned scope and timing of the audit and significant audit findings, including any significant deficiencies in internal control that we identify during our audit.
We also provide those charged with governance with a statement that we have complied with the relevant independence requirements, and communicate with them all relationships and other matters that may reasonably be thought to bear on our independence, and where applicable, the related safeguards.
From the matters communicated with those charged with governance, we determine those matters that were of most significance in the audit of the consolidated financial statements of the current period and are therefore the key audit matters. We describe these matters in our auditor’s report unless law or regulation precludes public disclosure about the matter.
Other Legal and Regulatory Requirements Report on the Assurance in accordance with Section 317 (3b) HGB on the Electronic Reproduction of the Consolidated Financial Statements and the Group Management Report Prepared for Publication Purposes We have performed an assurance engagement in accordance with Section 317 (3b) HGB to obtain reasonable assurance about whether the electronic reproduction of the consolidated financial statements and the group management report (hereinafter the “ESEF documents”) contained in the file that can be downloaded by the issuer from the electronic client portal with access protection, (sartoriusag.zip; SHA256-algorithm, 2f3e62534f4898c951688de56871ac6d2f8848828078153132b62110da20abc5 hash value) and prepared for publication purposes complies in all material respects with the requirements of Section 328 (1) HGB for the electronic reporting format (“ESEF format”). In accordance with German legal requirements, this assurance engagement only extends to the conversion of the information contained in the consolidated financial statements and the group management report into the ESEF format and therefore relates neither to the information contained in this reproduction nor any other information contained in the above-mentioned electronic file.
In our opinion, the reproduction of the consolidated financial statements and the group management report contained in the above-mentioned electronic file and prepared for publication purposes complies in all material respects with the requirements of Section 328 (1) HGB for the electronic reporting format. We do not express any opinion on the information contained in this reproduction nor on any other information contained in the above-mentioned file beyond this reasonable assurance conclusion and our audit opinion on the accompanying consolidated financial statements and the accompanying group management report for the financial year from 1. January 2020 to 31. December 2020 contained in the “Report on the Audit of the Consolidated Financial Statements and the Group Management Report” above.
We conducted our assessment of the reproduction of the consolidated financial statements and the group management report contained in the above-mentioned electronic file in accordance with Section 317 (3b) HGB and the Exposure Draft of the IDW Assurance Standard: Assurance in accordance with Section 317 (3b) HGB on the Electronic Reproduction of Financial Statements and Management Reports Prepared for Publication Purposes (ED IDW AsS 410) and the International Standard on Assurance Engagements 3000 (Revised). Accordingly, our responsibilities are further described below. Our audit firm has applied the IDW Standard on Quality Management 1: Requirements for Quality Management in Audit Firms (IDW QS 1).
Sartorius Consolidated Financial Statements and Notes Independent Auditors’ Report 226
Start
The company’s management is responsible for the preparation of the ESEF documents including the electronic reproduction of the consolidated financial statements and the group management report in accordance with Section 328 (1) sentence 4 item 1 HGB and for the tagging of the consolidated financial statements in accordance with Section 328 (1) sentence 4 item 2 HGB.
In addition, the company’s management is responsible for the internal controls they consider necessary to enable the preparation of ESEF documents that are free from material non-compliance with the requirements of Section 328 (1) HGB for the electronic reporting format, whether due to fraud or error.
The company’s management is also responsible for the submission of the ESEF documents together with the auditor’s report and the attached audited consolidated financial statements and audited group management report as well as other documents to be published to the operator of the German Federal Gazette [Bundesanzeiger].
The supervisory board is responsible for overseeing the preparation of the ESEF documents as part of the financial reporting process.
Our objective is to obtain reasonable assurance about whether the ESEF documents are free from material non-compliance with the requirements of Section 328 (1) HGB, whether due to fraud or error. We exercise professional judgement and maintain professional scepticism throughout the assurance engagement. We also:
Identify and assess the risks of material non-compliance with the requirements of Section 328 (1) HGB, whether due to fraud or error, design and perform assurance procedures responsive to those risks, and obtain assurance evidence that is sufficient and appropriate to provide a basis for our assurance conclusion.
Obtain an understanding of internal control relevant to the assessment of the ESEF documents in order to design assurance procedures that are appropriate in the circumstances, but not for the purpose of expressing a conclusion on the effectiveness of these controls.
Evaluate the technical validity of the ESEF documents, i.e. whether the electronic file containing the ESEF documents meets the requirements of Commission Delegated Regulation (EU) 2019/815 on the technical specification for this electronic file.
Evaluate whether the ESEF documents enable an XHTML reproduction with content equivalent to the audited consolidated financial statements and the audited group management report.
Evaluate whether tagging the ESEF documents with Inline XBRL technology (iXBRL) provides an appropriate and complete machine-readable XBRL copy of the XHTML reproduction.
Further Information pursuant to Article 10 of the EU Audit Regulation We were elected as group auditor by the annual general meeting on 28 March 2019. We were engaged by the supervisory board on 28 March 2019. We have been the group auditor of the Sartorius Aktiengesellschaft without interruption since the financial year 2015.
We declare that the opinions expressed in this auditor’s report are consistent with the additional report to the audit committee pursuant to Article 11 of the EU Audit Regulation (long-form audit report).
In addition to the consolidated financial statements, we audited the annual financial statements of Sartorius Aktiengesellschaft and carried out various audits of annual financial statements of subsidiaries. Auditing-integrated reviews of interim financial statements and project-accompanying audits of IT-based accounting-
Sartorius Consolidated Financial Statements and Notes Independent Auditors’ Report 227
Start
related systems were performed. In addition, other statutory or contractual audits have been carried out, such as the confirmation of compliance with contractual conditions, the review of the non-financial consolidated statement and the investigation of possible non-compliance with internal regulations. In addition, other statutory or contractual audits have been carried out, such as the confirmation of compliance with contractual conditions, the review of the non-financial consolidated statement and the review of the risk management manual to ensure its quality.
German Public Auditor Responsible for the Engagement
The German Public Auditor responsible for the engagement is Frank Thiele.
Hanover, Germany, February 5, 2021
KPMG AG Wirtschaftsprüfungsgesellschaft
Original German version signed by:
Tonne Thiele
Wirtschaftsprüfer Wirtschaftsprüfer
(German Public Auditor) (German Public Auditor)

Sartorius Consolidated Financial Statements and Notes Independent Auditors’ Report 228
Start
Sartorius Consolidated Financial Statements and Notes Executive Board and Supervisory Board 229
Start
Executive Board and Supervisory Board During Fiscal 2020
Executive Board
Dr. Joachim Kreuzburg Dipl.-Ingenieur (Graduate Engineer) CEO and Chairman Executive for Labor Relations Corporate Strategy, Human Resources, Corporate Research, Legal Affairs & Compliance and Corporate Communications Born April 22, 1965 Resident of Göttingen, Germany Member since November 11, 2002 “Sprecher” (Spokesman) from May 1, 2003 to November 10, 2005 Chairman since November 11, 2005 Appointed until November 10, 2025
Rainer Lehmann Dipl.-Kaufmann (Graduate in Business Administration) Finance, IT and Business Processes Born March 2, 1975 Resident of Brightwaters, New York, USA Member since March 1, 2017 Appointed until February 28, 2025
Dr. René Fáber Dipl.-Chemiker (Graduate Chemical Engineer) Bioprocess Solutions Division Born July 18, 1975 Resident of Göttingen, Germany Member since January 1, 2019 Appointed until December 31, 2021
John Gerard Mackay BSc Honors degree in biochemistry Master of Education Lab Products & Services Division Born May 11, 1962 Resident of Glasgow, Scotland, UK Member since January 1, 2019 Appointed until December 31, 2021
Sartorius Consolidated Financial Statements and Notes Executive Board and Supervisory Board 230
Start
Supervisory Board
Dr. Lothar Kappich Dipl.-Ökonom (Graduate Economist) Chairman Freelance Consultant, formerly Managing Director of ECE Projektmanagement GmbH & Co. KG in Hamburg, Germany Resident of Hamburg, Germany
Manfred Zaffke Dipl.-Volkswirt (Graduate Political Economist) Vice Chairman First Authorized Representative of the German Metalworkers’ Union (IG Metall) in the southern Lower Saxony/Harz region in Northeim, Germany Resident of Osterode am Harz, Germany
Annette Becker Personalfachkauffrau (HR Specialist) Chairwoman of the Employees' Council of Sartorius Corporate Administration GmbH in Göttingen, Germany Chairwoman of the Group Employees' Council of Sartorius AG in Göttingen, Germany Resident of Göttingen, Germany
Uwe Bretthauer Dipl.-Ingenieur (Graduate Engineer) Member of the Employees' Council of Sartorius Lab Instruments GmbH & Co. KG in Göttingen, Germany Resident of Göttingen, Germany
Dietmar Müller Betriebswirt (Business Economist) Chairman of the Employees’ Council of Sartorius Stedim Biotech GmbH in Göttingen, Germany Member since May 16, 2020 Resident of Gleichen, Germany
Dr. Daniela Favoccia Attorney and Partner of the Hengeler Mueller partnership of lawyers in Frankfurt am Main, Germany Resident of Frankfurt am Main, Germany
Petra Kirchhoff Dipl.-Volkswirtin (Graduate Political Economist) Head of Corporate Communications and Investor Relations Sartorius Corporate Administration GmbH in Göttingen, Germany Resident of Göttingen, Germany
Sartorius Consolidated Financial Statements and Notes Executive Board and Supervisory Board 231
Start
Karoline Kleinschmidt Dipl.-Sozialwirtin (Graduate Social Economist) Secretary and First Authorized Representative of the German Metalworkers’ Union (IG Metall) in the Alfeld-Hameln-Hildesheim region in Hamelin, Germany Resident of Hanover, Germany
Professor David Raymond Ebsworth, Ph.D. B.Sc in Chemistry and German; Ph.D. in Comparative Industrial Relations Consultant, especially in the Healthcare and Financial Investment Industry, Member since January 1, 2020 Resident of Overath, Germany
Ilke Hildegard Panzer M.Sc. in Engineering, Computer and Systems Engineering Chief Executive Officer of Assurance Laboratories LLC in Milwaukee, Wisconsin, USA Resident of Fredonia, Wisconsin, USA
Prof. Dr. Thomas Scheper Dipl.-Chemiker (Graduate Chemical Engineer) University professor and head of the Institute of Technical Chemistry, Gottfried Wilhelm Leibnitz University in Hanover, Germany Resident of Hanover, Germany
Prof. Dr. Klaus Rüdiger Trützschler Dipl.-Wirtschaftsmathematiker (Graduate Business Mathematician) and Dipl.-Mathematiker (Graduate Mathematician) Resident of Essen, Germany
Michael Dohrmann Feinmechaniker (Precision Engineer) Technical Employee Sartorius Stedim Biotech GmbH in Göttingen, Germany Member until May 15, 2020 Resident of Reinhausen, Germany
Sartorius Consolidated Financial Statements and Notes Executive Board and Supervisory Board 232
Start
Committees of the Supervisory Board
Executive Task Committee Dr. Lothar Kappich (Chairman) Manfred Zaffke Uwe Bretthauer Prof. Dr. Klaus Rüdiger Trützschler
Audit Committee Prof. Dr. Klaus Rüdiger Trützschler (Chairman) Manfred Zaffke Uwe Bretthauer Dr. Lothar Kappich
Conciliation Committee Dr. Lothar Kappich (Chairman) Manfred Zaffke Uwe Bretthauer Prof. Dr. Klaus Rüdiger Trützschler
Nomination Committee Dr. Lothar Kappich Dr. Daniela Favoccia Prof. Dr. Klaus Rüdiger Trützschler
Sartorius Consolidated Financial Statements and Notes Executive Board and Supervisory Board 233
Start
Positions Held by the Members of the Executive Board as of December 31, 2020 Dr. Joachim Kreuzburg Positions held within the Group: Président-Directeur Général (CEO) of:
Sartorius Stedim Biotech S.A., France
On the Supervisory Board of:
Sartorius Stedim Biotech GmbH, Germany, Chairman
On the Advisory Board of:
LabTwin GmbH, Germany, Chairman
On the Board of Directors of:
Sartorius North America, Inc., USA, Chairman
External positions: On the Supervisory Board of:
Carl Zeiss AG, Germany Ottobock SE & Co. KGaA, Germany, Vice Chairman
On the Verwaltungsrat (Administrative Board) of:
Ottobock Management SE, Germany
On the Wirtschaftsbeirat (Economic Advisory Board) of:
Norddeutsche Landesbank, Germany
Rainer Lehmann Positions held within the Group:
On the Board of Directors of:
Sartorius Corporation, USA Sartorius North America, Inc., USA Sartorius Stedim North America, Inc., USA Essen Instruments, Inc., USA Sartorius BioAnalytical Instruments, Inc., USA Sartorius Stedim Filters, Inc., Puerto Rico
External positions: On the Unternehmerbeirat (Employers’ Advisory Board) of:
Gothaer Versicherungsbank VVaG, Germany
On the Regionalbeirat (Regional Advisory Board) of:
Sartorius Consolidated Financial Statements and Notes Executive Board and Supervisory Board 234
Start
Commerzbank AG, Germany
Dr. René Fáber Positions held within the Group: On the Conseil d’Administration (Board of Directors) of:
Sartorius Stedim Biotech S.A., France
On the Supervisory Board of:
Sartorius Stedim Biotech GmbH, Germany,
Vice Chairman
On the Board of Directors of:
Sartorius Stedim (Shanghai) Trading Co., Ltd., China Sartorius Stedim Japan K.K, Japan Sartorius Korea Biotech Co., Ltd., South Korea
On the Comité Exécutif (Executive Committee) of:
Sartorius Stedim FMT S.A.S., France, Chairman
On the Advisory Board of:
BIA SEPARATIONS d.o.o., Slovenia
External positions: On the Advisory Board of:
Curexsys GmbH, Germany
John Gerard Mackay Positions held within the Group:
On the Board of Directors of:
Essen Instruments, Inc., USA Sartorius BioAnalytical Instruments, Inc., USA Sartorius Biohit Liquid Handling Oy, Finland Sartorius Stedim BioOutsource Ltd., Scotland, UK Sartorius Scientific Instruments (Beijing) Co., Ltd., China, Vice Chairman Sartorius Hong Kong Ltd., China Sartorius ForteBio (Shanghai) Co., Ltd., China Sartorius (Shanghai) Trading Co., Ltd., China Sartorius Japan K.K, Japan Sartorius Korea Ltd., South Korea Sartorius Australia Pty. Ltd., Australia
External positions: None
Sartorius Consolidated Financial Statements and Notes Executive Board and Supervisory Board 235
Start
Positions Held by the Members of the Supervisory Board as of December 31, 2020 Dr. Lothar Kappich Positions held within the Group: On the Conseil d’Administration (Board of Directors) of:
Sartorius Stedim Biotech S.A., France
External positions: None
Manfred Zaffke Positions held within the Group: None
External positions: On the Supervisory Board of:
GMH GUSS GmbH, Germany,
Vice Chairman
Demag Cranes & Components GmbH, Germany Konecranes Holding GmbH, Germany
Annette Becker None
Uwe Bretthauer None
Dietmar Müller Positions held within the Group: On the Supervisory Board of:
Sartorius Stedim Biotech GmbH, Germany
External positions: In the General Assembly of:
Gesellschaft für Gemeindeentwicklung und Wirtschaftsförderung Gleichen mbH (company for community and business development), Germany
Dr. Daniela Favoccia None
Petra Kirchhoff Positions held within the Group: None
External positions:
Sartorius Consolidated Financial Statements and Notes Executive Board and Supervisory Board 236
Start
On the Stock Exchange Council (Börsenrat) of:
The Hanover Stock Exchange of Lower Saxony
(Niedersächsiche Börse zu Hannover), Germany
Karoline Kleinschmidt None
Professor David Raymond Ebsworth, Ph.D. Positions held within the Group: None
External positions: On the Board of Directors of:
Verona Pharma plc, UK, Chairman
Actimed Therapeutics Ltd., UK, Chairman
Kyowa Kirin International plc, UK
Interpharma Investments Ltd., British Virgin Islands
On the Verwaltungsrat (Administrative Board) of:
Opterion Health AG, Switzerland, Chairman
Ilke Hildegard Panzer None
Prof. Dr. Thomas Scheper None
Prof. Dr. Klaus Rüdiger Trützschler Positions held within the Group: None
External positions: On the Supervisory Board of:
Wuppermann AG, Germany, Chairman
Zwiesel Kristallglas AG, Germany, Chairman
On the Advisory Board of:
Odenwald Faserplatten GmbH, Germany

StartSupplementary Information

Sartorius Supplementary Information Glossary 238
Start
Glossary Industrial |Product-specific Terms Antibody drug conjugates (ADC) New class of highly potent biological drugs built by attaching a small molecule anticancer drug or another therapeutic agent to an antibody, with either a permanent or a labile linker
Bags, single-use Plastic disposable bag used in bioreactors and for storing liquids, such as culture media, intermediate products and biopharmaceuticals
Bioanalytics, also bioanalysis Covers analytical methods for investigating biological macromolecules and their changes. In pharmaceutical research, bioanalytical methods are used particularly for identification, quantification and characterization of biomolecules
Biopharmaceuticals, also biologics or biological medical drugs Any pharmaceutical drug products manufactured using biotech means and genetically modified organisms
Bioprocessing technology Covers the process engineering aspects of biotech manufacturing operations. Such aspects include general planning and implementation of a production process, its monitoring and control, and all technologies required for these purposes
Bioreactor In English-speaking countries, a bioreactor is a vessel used for cultivating animal or human cells in a culture medium. In non-English-speaking countries, the term bioreactor is also used synonymously with the term fermenter to denote a system used to multiply microorganisms. In either case, the vessel is used to obtain cells, parts of these or one of their metabolites
CAR T cells New class of highly effective biopharmaceuticals used in cell and gene therapy in which the patient’s own T cells are collected from the blood and genetically modified so that they can identify and destroy cancer cells
Cell analysis Covers powerful methods for the analysis of cells and permits deeper insights into cell biological processes for medical and biotechnological applications
Cell clone A population of genetically identical cells obtained by cellular division of one specific cell
Cell culture media Growth media that provide cells and organisms the nutrients needed to support their propagation in cultures
Cell line technology Covers various technologies used within the scope of analytical and process steps to develop stable and productive cell lines
Sartorius Supplementary Information Glossary 239
Start
Chromatography A key process step for downstream processing of active pharmaceutical ingredients of biopharmaceuticals; this step isolates the product from fermentation or cell culture broth (known as “capture“) and covers subsequent purification steps (referred to as “polishing”)
Downstream processing Collective term for the various steps that follow fermentation or cell cultivation (upstream processing) in the production of biopharmaceuticals; for example, separation, purification and concentration
EMA – European Medicines Agency Agency of the European Union for evaluating and monitoring pharmaceuticals
FDA - Food and Drug Administration U.S. regulatory agency responsible for ensuring the safety and efficacy of human and veterinary pharmaceuticals, biological products, medical devices and foods
Fermentation Technical process used to produce or transform intra- or extra-cellular substances with the help of microorganisms
Life sciences Collective term for all natural sciences dealing with the study of processes or structures of living organisms or in which such organisms are involved. This term is often commonly used in relation with application-oriented fields of science that focus on manufacturing pharmaceuticals using biotechnology.
Membrane chromatography Selective separation of mixtures of substances by adsorption to specifically modified membranes (membrane adsorbers) in a flowing system
Membrane (filter) Thin film or foil made of polymers; because of the porous structure, this film is suitable for filtration applications.
Monoclonal antibodies Synthetic antibodies used, in particular, in the treatment of cancer, HIV and autoimmune diseases
Purification In downstream processing, a step covering all process technologies used after cell harvesting to further separate an active pharmaceutical compound from other components present in fermentation or cell culture broth in order to obtain a pure and concentrated final product
Single-use | Reusable product In biopharmaceutical production, the term “single-use” defines an item intended to be used only one time. Such an item consists of plastic and is disposed of after use. By contrast, reusable products are made of stainless steel or glass and entail time and effort to clean them afterwards for repeated use.
Upstream processing In the manufacture of biopharmaceuticals, designates the various steps that take place for seeding and propagating cells that produce an active pharmaceutical ingredient
Validation Documented verification that systems, devices and processes reproducibly deliver the desired result
Sartorius Supplementary Information Glossary 240
Start
Business|Economic Terms Amortization Amortization relates exclusively to potential reductions in the value of goodwill and the allocation of the purchase price to intangible assets acquired as carried out according to IFRS 3
CAPEX ratio Investment payments in relation to sales revenue for the same period
Cash flow The amount of cash earned after paying all expenses and taxes; i.e., the cash balance of inflows and outflows of funds
Cash pooling agreements The term “cash pooling” or “liquidity bundling” refers to intra-group liquidity balancing by a central financial management system, usually assumed by the parent company of a group, which withdraws excess liquidity from the group companies or offsets liquidity shortfalls by loans. It is an element of cash management.
Compliance Observance of applicable laws, codes and other relevant rules and regulations
Constant currencies; currency-adjusted In the presentation of figures, identical exchange rates are used for each of the comparative periods.
Covenants Collective term for additional contractual clauses or collateral contracts in loan agreements or bond agreements with companies. Such agreements on covenants impose certain obligations on borrowing parties or debtors
D&O insurance Directors’ and Officers’ liability insurance that covers Supervisory and Executive Board members and managerial employees
EBITDA Earnings before interest, taxes, depreciation and amortization; in this context, amortization refers exclusively to the purchase price allocation (PPA) to intangible assets acquired according to IFRS 3
EBITDA margin The ratio of EBITDA (earnings before interest, taxes, depreciation and amortization) to sales
Equity ratio The ratio of equity to the balance sheet total
Extraordinary items Exceptional or one-time expenses and income, such as acquisition costs, restructuring costs and other non-operating expenses
Factoring program Sale of trade receivables to a bank or a financial service institute
Sartorius Supplementary Information Glossary 241
Start
Fixed assets The sum of intangible assets, property, plant and equipment and financial assets
Goodwill The difference between the price paid for a company or business and its net assets; a form of intangible asset
Holding company A parent company that exists for the purpose of owning a controlling interest or shares in several legally independent subsidiaries that are subordinate within the organizational hierarchy; this holding company conducts its business exclusively through these subsidiaries
Market capitalization The total number of shares outstanding of both classes issued by the company, multiplied by the corresponding share price
Net debt Liabilities to banks, including note loans (“Schuldscheindarlehen”), as well as lease liabilities less cash and cash equivalents
Normalized financial result Financial result excluding fair value adjustments of hedging instruments, as well as excluding non-periodic expenses and income
Normalized income tax Underlying income tax, based on underlying profit before tax and on non-cash amortization.
Order intake All customer orders contractually concluded and booked during the respective reporting period
Prime Standard Market segment of the Frankfurt Stock Exchange with high, internationally accepted transparency requirements to meet the needs of companies seeking to attract international investors
Ratio of net debt to underlying EBITDA Quotient of net debt and underlying EBITDA over the past 12 months, including the pro forma amount contributed by acquisitions for this period
Supply chain management Setup and coordination of integrated flows of materials, information and finances (supply chains) over the entire value-added process
Treasury Short- and medium-term liquidity management
Underlying Adjusted to eliminate extraordinary items (see definition extraordinary item)
Working capital Inventories, including trade receivables, minus trade payables
Sartorius Supplementary Information Glossary 242
Start
Other Terms CSR (Corporate responsibility) CSR refers to the social responsibility of companies. Their operations can affect economic, social and environmental conditions all over the world
CSR Directive Implementation Act (German abbreviation CSR-RUG) A German law that became effective in April 2017 to change the German Commercial Code with the aim of strengthening non-financial reporting by certain major capital market companies in their (group) management report in order to comply with the European Corporate Social Responsibility Directive
Designated sponsor Banks, brokerage firms, security trading organizations or other financial service providers who furnish binding quotes in electronic trading for the purchase or sale of stocks to increase their liquidity
EcoVadis A provider of business sustainability ratings, EcoVadis analyzes companies with regard to the fulfillment of their corporate social responsibility (CSR) and makes these results available to other companies. The EcoVadis Rating covers a broad range of non-financial management systems including environmental, labor and human rights, ethics and sustainable procurement impacts.
EMEA The region comprising Europe, the Middle East and Africa; one of the three reporting regions in the geographical allocation of the Sartorius Group besides the Americas and Asia | Pacific
ERP Stands for "Enterprise Resource Planning"; IT-based resource planning system
ESG Abbreviation for “Environment, Social and Governance”; refers to the three major factors of sustainable corporate management
GHG The Greenhouse Gas Protocol, used by many companies in different sectors as well as non-governmental organizations (NGOs) and governments, is a globally recognized standard to quantify and manage greenhouse gas emissions. The reporting standards and recommendations for implementing projects to reduce emissions are jointly developed by companies, NGOs and governments under the guidance of the World Resources Institute and the World Business Council for Sustainable Development
GRI (Global Reporting Initiative) The GRI has defined guidelines for sustainability reporting. Companies as well as governments and non-governmental organizations worldwide report on their economic, environmental and social strategy based on these data and indicators
ISIN (International Securities Identification Number) This is a code consisting of a 12 character combination of letters and numbers and uniquely identifies a security traded on the stock exchange
ISO International Organization for Standardization
Sartorius Supplementary Information Glossary 243
Start
IFRS (International Financial Reporting Standards) These are the accounting standards issued by the International Accounting Standards Board (IASB)
Materiality analysis A materiality analysis is used to identify and assess sustainability topics. This takes into account the expectations and demands of external stakeholders, as well as the expertise of members of management and the assessments of employees. An analysis of various data sources expands on and verifies these findings
OHSAS (Occupational Health and Safety Assessment Series 18001) The OHSAS includes the standard OHSAS 18001, which contains a framework for an occupational safety management system. This system can be integrated into an existing quality and environmental protection management system and certified accordingly.
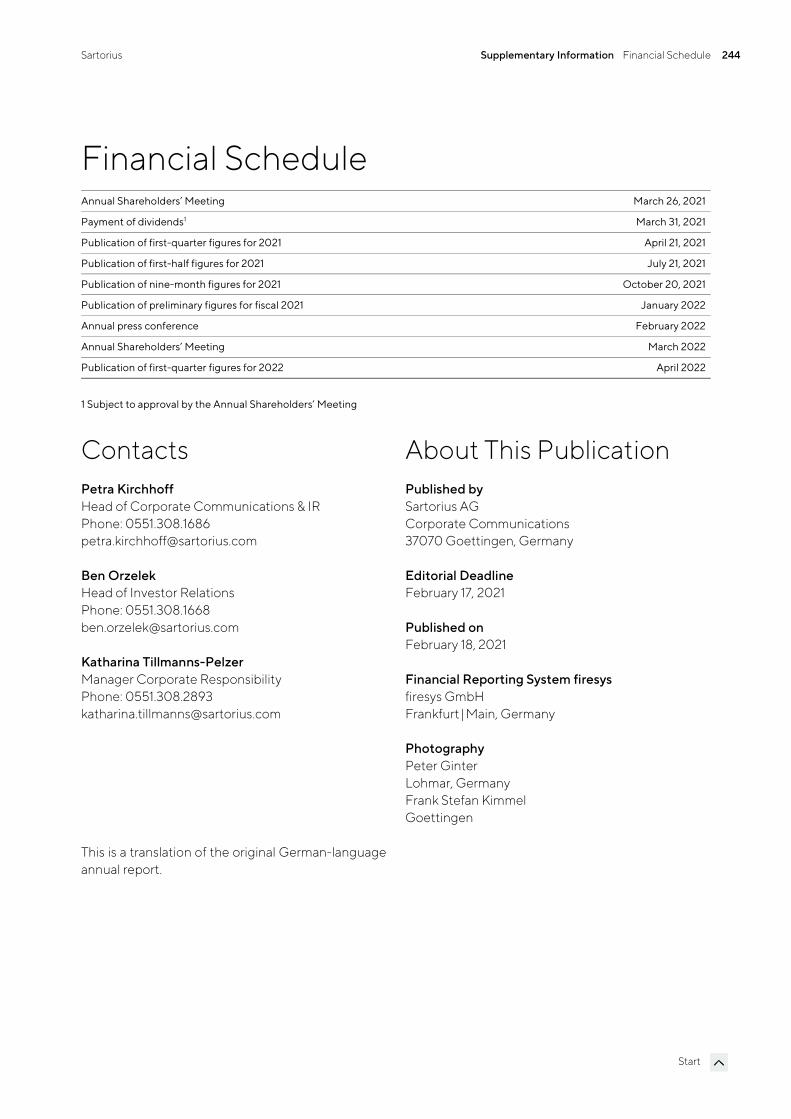
Sartorius Supplementary Information Financial Schedule 244
Start
Financial Schedule Annual Shareholders’ Meeting March 26, 2021
Payment of dividends1 March 31, 2021
Publication of first-quarter figures for 2021 April 21, 2021
Publication of first-half figures for 2021 July 21, 2021
Publication of nine-month figures for 2021 October 20, 2021
Publication of preliminary figures for fiscal 2021 January 2022
Annual press conference February 2022
Annual Shareholders’ Meeting March 2022
Publication of first-quarter figures for 2022 April 2022
1 Subject to approval by the Annual Shareholders‘ Meeting
Contacts Petra Kirchhoff Head of Corporate Communications & IR Phone: 0551.308.1686 [email protected]
Ben Orzelek Head of Investor Relations Phone: 0551.308.1668 [email protected]
Katharina Tillmanns-Pelzer Manager Corporate Responsibility Phone: 0551.308.2893 [email protected]
About This Publication Published by Sartorius AG Corporate Communications 37070 Goettingen, Germany
Editorial Deadline February 17, 2021
Published on February 18, 2021
Financial Reporting System firesys firesys GmbH Frankfurt|Main, Germany
Photography Peter Ginter Lohmar, Germany Frank Stefan Kimmel Goettingen
This is a translation of the original German-language annual report.

Sartorius AGOtto-Brenner-Strasse 20 37079 Göttingen Germany
Phone: +49.551.308.0 Fax: +49.551.308.3289
[email protected] www.sartorius.com