RESEARCH Open Access Mutational pressure dictates
16
RESEARCH Open Access Mutational pressure dictates synonymous codon usage in freshwater unicellular α - cyanobacterial descendant Paulinella chromatophora and β - cyanobacterium Synechococcus elongatus PCC6301 Rahul Raveendran Nair 1 , Manivasagam Bharatha Nandhini 2 , Thilaga Sethuraman 2 and Ganesh Doss 2* Abstract Background: Comparative study of synonymous codon usage variations and factors influencing its diversification in α - cyanobacterial descendant Paulinella chromatophora and β - cyanobacterium Synechococcus elongatus PCC6301 has not been reported so far. In the present study, we investigated various factors associated with synonymous codon usage in the genomes of P. chromatophora and S. elongatus PCC6301 and findings were discussed. Results: Mutational pressure was identified as the major force behind codon usage variation in both genomes. However, correspondence analysis revealed that intensity of mutational pressure was higher in S. elongatus than in P. chromatophora. Living habitats were also found to determine synonymous codon usage variations across the genomes of P. chromatophora and S. elongatus. Conclusions: Whole genome sequencing of α-cyanobacteria in the cyanobium clade would certainly facilitate the understanding of synonymous codon usage patterns and factors contributing its diversification in presumed ancestors of photosynthetic endosymbionts of P. chromatophora. Keywords: Paulinella chromatophora; Synechococcus elongatus; Synonymous codon usage; Mutational pressure; Chromatophore Background Nucleotide triplet codons, differing only at the third site or rarely at second site but encoding same amino acid are termed as synonymous codons (Ermolaeva 2001). Syn- onymous mutations do not alter amino acid sequences, but usage of synonymous codons is not at uniform fre- quencies both within and between organisms, resulting in species specific codon usage bias (Grantham et al. 1980; Sharp et al. 1995). Synonymous codon usage (SCU) bias favours the usage of specific subset of certain codons (pre- ferred codons) within each amino acid family (Agashe et al. 2013). Weak selection of preferred codons has been recognized as an important evolutionary force (Carlini et al. 2001) as SCU bias affects overall fitness of a cell by influencing the level of gene expression and vari- ous cellular processes such as RNA processing, trans- lation of protein and protein folding (Parmley and Hurst 2007; Hershberg and Petrov 2008; Plotkin and Kudla 2011). Functional integrity of the genetic code is maintained by synonymous codons (Biro 2008). Population genetic studies reveal that evolution of biased codon usage is mainly either due to genome wide AT/GC biased mutational pressure or due to weak selection acting on specific subset of codons (preferred codons) (Bulmer 1991; Yang and Nielson 2008; Agashe et al. 2013). Other major factors include interaction between codons and anticodons (Kurland 1993), site- specific codon biases (Smith and Smith 1996), efficacy of replication (Deschavanne and Filipski 1995), usage of codon * Correspondence: [email protected] 2 Department of Plant Biotechnology, School of Biotechnology, Madurai Kamaraj University, Palkalai Nagar, 625 021, Madurai, Tamil Nadu, India Full list of author information is available at the end of the article a SpringerOpen Journal © 2013 Nair et al.; licensee Springer. This is an Open Access article distributed under the terms of the Creative Commons Attribution License (http://creativecommons.org/licenses/by/2.0), which permits unrestricted use, distribution, and reproduction in any medium, provided the original work is properly cited. Nair et al. SpringerPlus 2013, 2:492 http://www.springerplus.com/content/2/1/492
Transcript of RESEARCH Open Access Mutational pressure dictates
a SpringerOpen Journal
Nair et al. SpringerPlus 2013, 2:492http://www.springerplus.com/content/2/1/492
RESEARCH Open Access
Mutational pressure dictates synonymous codonusage in freshwater unicellular α - cyanobacterialdescendant Paulinella chromatophora andβ - cyanobacterium Synechococcus elongatusPCC6301Rahul Raveendran Nair1, Manivasagam Bharatha Nandhini2, Thilaga Sethuraman2 and Ganesh Doss2*
Abstract
Background: Comparative study of synonymous codon usage variations and factors influencing its diversification inα - cyanobacterial descendant Paulinella chromatophora and β - cyanobacterium Synechococcus elongatus PCC6301has not been reported so far. In the present study, we investigated various factors associated with synonymouscodon usage in the genomes of P. chromatophora and S. elongatus PCC6301 and findings were discussed.
Results: Mutational pressure was identified as the major force behind codon usage variation in both genomes.However, correspondence analysis revealed that intensity of mutational pressure was higher in S. elongatus than inP. chromatophora. Living habitats were also found to determine synonymous codon usage variations across thegenomes of P. chromatophora and S. elongatus.
Conclusions: Whole genome sequencing of α-cyanobacteria in the cyanobium clade would certainly facilitate theunderstanding of synonymous codon usage patterns and factors contributing its diversification in presumedancestors of photosynthetic endosymbionts of P. chromatophora.
Keywords: Paulinella chromatophora; Synechococcus elongatus; Synonymous codon usage; Mutational pressure;Chromatophore
BackgroundNucleotide triplet codons, differing only at the third siteor rarely at second site but encoding same amino acid aretermed as synonymous codons (Ermolaeva 2001). Syn-onymous mutations do not alter amino acid sequences,but usage of synonymous codons is not at uniform fre-quencies both within and between organisms, resulting inspecies specific codon usage bias (Grantham et al. 1980;Sharp et al. 1995). Synonymous codon usage (SCU) biasfavours the usage of specific subset of certain codons (pre-ferred codons) within each amino acid family (Agasheet al. 2013). Weak selection of preferred codons has been
* Correspondence: [email protected] of Plant Biotechnology, School of Biotechnology, MaduraiKamaraj University, Palkalai Nagar, 625 021, Madurai, Tamil Nadu, IndiaFull list of author information is available at the end of the article
© 2013 Nair et al.; licensee Springer. This is anAttribution License (http://creativecommons.orin any medium, provided the original work is p
recognized as an important evolutionary force (Carliniet al. 2001) as SCU bias affects overall fitness of a cellby influencing the level of gene expression and vari-ous cellular processes such as RNA processing, trans-lation of protein and protein folding (Parmley and Hurst2007; Hershberg and Petrov 2008; Plotkin and Kudla 2011).Functional integrity of the genetic code is maintained bysynonymous codons (Biro 2008). Population genetic studiesreveal that evolution of biased codon usage is mainly eitherdue to genome wide AT/GC biased mutational pressure ordue to weak selection acting on specific subset of codons(preferred codons) (Bulmer 1991; Yang and Nielson 2008;Agashe et al. 2013). Other major factors include interactionbetween codons and anticodons (Kurland 1993), site-specific codon biases (Smith and Smith 1996), efficacy ofreplication (Deschavanne and Filipski 1995), usage of codon
Open Access article distributed under the terms of the Creative Commonsg/licenses/by/2.0), which permits unrestricted use, distribution, and reproductionroperly cited.
Nair et al. SpringerPlus 2013, 2:492 Page 2 of 16http://www.springerplus.com/content/2/1/492
pairs (Irwin et al. 1995) and evolutionary time scale (Karlinet al. 1998).Forces that influence evolution of SCU bias in various
taxa has been extensively analyzed in various organisms(Ikemura 1982; Moriyama and Powell 1997; Nair et al.2012; Seva et al. 2012; Sharp and Cowe 1991) as SCUbias has high significance in estimating evolutionaryrates and phylogenetic reconstruction (Sarmer andSullivan 1989; Wall and Herback 2003). Previous studiesrevealed that biased codon usage is stronger in highlyexpressed genes as selection pressure may be acting onthose genes (Ikemura 1985). However, strength of selec-tion appears to be varying among evolutionarily conservedamino acid residues that exhibit stronger bias. In contrast,evolutionarily variable residues often exhibit less orweaker bias (Akashi 1995; Drummond and Wilke 2008).Mutational pressure is another important factor, shapingSCU variations (Plotkin and Kudla 2011; Akashi 2001).Life style of prokaryotic organisms also play importantrole in SCU variations (Botzman and Margalit 2011).However, role of physiological processes in framingevolution of biased codon usage is yet to be unravelled(Agashe et al. 2013).Endosymbiotic associations have significant impacts
on cellular evolution and diversity (Bodyl et al. 2007).Extensive research on plastid genomes unravelled that asingle primary endosymbiotic event in which a cyano-bacteria was acquired by a unicellular eukaryote led tothe evolution of plastids (Nowack et al. 2008). In endo-symbiosis research, Paulinella chromatophora, a filosethecamoeba has been regarded as an outstanding modelfor primary plastid origin as P. chromatophora is the onlyknown case of independent primary cyanobacterial acqui-sition (Chan et al. 2011; Marin et al. 2005; Yoon et al.2006). Sequencing of chromatophore genome revealed theacquisition of photosynthesis by eukaryotes (Nowack et al.2008). Chromatophores of P. chromatophora are mono-phyletic with α - cyanobacteria (Cyanobium clade) (Marinet al. 2007) unlike plastids that were evolved from β -cyanobacterial ancestor (Nowack et al. 2008).SCU bias in various primary endosymbionts and plas-
tid genomes were extensively studied (Nair et al. 2012;Morton 1993, 1997, 1998; Sablok et al. 2011). Variousfactors that frame SCU variations in phylogeneticallyclose marine Prochlorococcus and Synechococcus cladesin the PS clade (Prochlorococcus/Synechococcus) (Marinet al. 2007) were studied and found that SCU pattern ofProclorococcus was shaped by mutational pressure andnucleotide compositional constraints whereas in marineSynechococcus, translational selection determine the SCUpattern (Yu et al. 2012). However, no complete cyanobac-terial genome has been reported from the Cyanobium clade(third major lineage of PS clade) so far (Figure 1). Hence,comparison of factors that frame SCU in chromatophore
genome and its presumed ancestor could not be done.Since habitat of microorganisms play crucial role in SCUvariation across genes (Botzman and Margalit 2011), uni-cellular freshwater β - cyanobacterium Synechococcuselongatus PCC6301 (SELONG clade) (Marin et al. 2007)was selected for comparing the SCU patterns and also toelicit the factors determining the SCU variations in evolu-tionarily young (P. chromarophora) and evolutionarily old(S. elongatus) genomes.
ResultsI. Compositional propertiesa) Chromatophore genome of P. chromatophoraComparison of total A, T, G, C contents in the genomeof P. Chromatophora revealed higher content of A andT than G and C. Analysis of A3, T3, G3, C3 contents re-vealed that T3 content was highest and C3, the lowest ofall with mean and S.D of 39.14% and 4.06% for T3 and12.94% and 3.67% for C3. GC3 ranged from 16.15% to54.38% with a mean and S.D of 27.40% and 4.69% re-spectively. Correlation analysis between total nucleotidecontents and silent base contents revealed the strongernegative correlations between A3 and GC (Table 1).Similarly, high negative correlation was found betweenA and GC3 (Table 1). This suggests that A and GC con-tents play important role in SCU bias in the chromato-phore genome. High positive correlation between C andG3 also might have profound effect in framing SCU pat-terns. However, no correlations were found between Gand T3, and also for T and G3, suggesting no influence ofindividual T and G contents in codon usage bias. SinceA3 content was in strong negative correlation with alltotal nucleotide contents (Table 1), it can be inferredthat A3 content play an important role in shaping SCUpatterns across 786 PCG in the chromatophore genome.
b) Genome of S. elongatusContrary to the observations with P. chromatophora, Gand C contents were higher than A and T contents inthe genome of S. elongatus. G3 and C3 contents weresignificantly higher than A3 and T3 contents. Among thesilent base contents, C3 was highest and A3, the lowestof all with mean and S.D of 31.12% and 6.02% for C3,and 16.43% and 4.12% for A3. GC3 varied from 26. 12%to 76.90% with a mean and S.D of 60.19% and 7.45% re-spectively. Correlation analysis between total A, T, G, Ccontents and A3, T3, G3, C3 contents revealed that A3
was negatively correlated to G, C and GC. Similarly, T3
was in high negative correlation with G, C, GC3. GCcomposition at silent site was found negatively corre-lated with both A and T contents (Table 2). Hence, all si-lent base contents viz., A3, T3, G3 and C3 might beinfluencing SCU variations of protein coding genes(PCG) of S. elongatus.
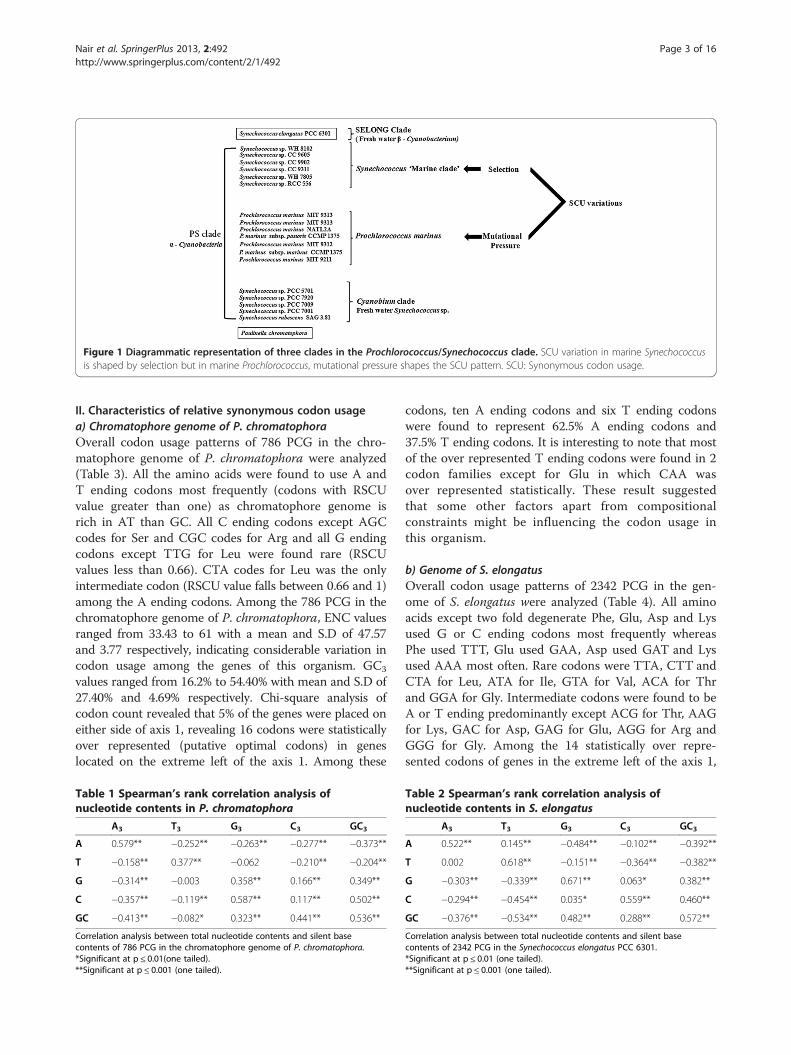
Figure 1 Diagrammatic representation of three clades in the Prochlorococcus/Synechococcus clade. SCU variation in marine Synechococcusis shaped by selection but in marine Prochlorococcus, mutational pressure shapes the SCU pattern. SCU: Synonymous codon usage.
Nair et al. SpringerPlus 2013, 2:492 Page 3 of 16http://www.springerplus.com/content/2/1/492
II. Characteristics of relative synonymous codon usagea) Chromatophore genome of P. chromatophoraOverall codon usage patterns of 786 PCG in the chro-matophore genome of P. chromatophora were analyzed(Table 3). All the amino acids were found to use A andT ending codons most frequently (codons with RSCUvalue greater than one) as chromatophore genome isrich in AT than GC. All C ending codons except AGCcodes for Ser and CGC codes for Arg and all G endingcodons except TTG for Leu were found rare (RSCUvalues less than 0.66). CTA codes for Leu was the onlyintermediate codon (RSCU value falls between 0.66 and 1)among the A ending codons. Among the 786 PCG in thechromatophore genome of P. chromatophora, ENC valuesranged from 33.43 to 61 with a mean and S.D of 47.57and 3.77 respectively, indicating considerable variation incodon usage among the genes of this organism. GC3
values ranged from 16.2% to 54.40% with mean and S.D of27.40% and 4.69% respectively. Chi-square analysis ofcodon count revealed that 5% of the genes were placed oneither side of axis 1, revealing 16 codons were statisticallyover represented (putative optimal codons) in geneslocated on the extreme left of the axis 1. Among these
Table 1 Spearman’s rank correlation analysis ofnucleotide contents in P. chromatophora
A3 T3 G3 C3 GC3
A 0.579** −0.252** −0.263** −0.277** −0.373**
T −0.158** 0.377** −0.062 −0.210** −0.204**
G −0.314** −0.003 0.358** 0.166** 0.349**
C −0.357** −0.119** 0.587** 0.117** 0.502**
GC −0.413** −0.082* 0.323** 0.441** 0.536**
Correlation analysis between total nucleotide contents and silent basecontents of 786 PCG in the chromatophore genome of P. chromatophora.*Significant at p ≤ 0.01(one tailed).**Significant at p ≤ 0.001 (one tailed).
codons, ten A ending codons and six T ending codonswere found to represent 62.5% A ending codons and37.5% T ending codons. It is interesting to note that mostof the over represented T ending codons were found in 2codon families except for Glu in which CAA wasover represented statistically. These result suggestedthat some other factors apart from compositionalconstraints might be influencing the codon usage inthis organism.
b) Genome of S. elongatusOverall codon usage patterns of 2342 PCG in the gen-ome of S. elongatus were analyzed (Table 4). All aminoacids except two fold degenerate Phe, Glu, Asp and Lysused G or C ending codons most frequently whereasPhe used TTT, Glu used GAA, Asp used GAT and Lysused AAA most often. Rare codons were TTA, CTT andCTA for Leu, ATA for Ile, GTA for Val, ACA for Thrand GGA for Gly. Intermediate codons were found to beA or T ending predominantly except ACG for Thr, AAGfor Lys, GAC for Asp, GAG for Glu, AGG for Arg andGGG for Gly. Among the 14 statistically over repre-sented codons of genes in the extreme left of the axis 1,
Table 2 Spearman’s rank correlation analysis ofnucleotide contents in S. elongatus
A3 T3 G3 C3 GC3
A 0.522** 0.145** −0.484** −0.102** −0.392**
T 0.002 0.618** −0.151** −0.364** −0.382**
G −0.303** −0.339** 0.671** 0.063* 0.382**
C −0.294** −0.454** 0.035* 0.559** 0.460**
GC −0.376** −0.534** 0.482** 0.288** 0.572**
Correlation analysis between total nucleotide contents and silent basecontents of 2342 PCG in the Synechococcus elongatus PCC 6301.*Significant at p ≤ 0.01 (one tailed).**Significant at p ≤ 0.001 (one tailed).
Table 3 Overall codon usage in P. chromatophora
AA Codon N (RSCU) AA Codon N (RSCU)
Phe TTT 6873(1.44) Tyr TAT 4818(1.45)
TTC 2665(0.56) TAC 1810(0.54)
Leu TTA 10679(2.06) TER TAA 439(1.67)
TTG B4586(0.88) TAG 144(0.55)
CTT 6933(1.33) His CAT 4076(1.54)
CTC 2001(0.39) CAC 1209(0.45)
CTA 5010(0.96) Gln CAA 7465(1.42)
CTG 1961(0.38) CAG 2993(0.57)
Ile ATC 3060(0.46) Asn AAT 8988(1.56)
ATT 9871(1.48) AAC 2507(0.43)
ATA 6960(1.05) Lys AAA 8697(1.42)
Met ATG 5377(1.00) AAG 3498(0.57)
Val GTT 5473(1.33) Asp GAT 9705(1.60)
GTC 2078(0.50) GAC 2379(0.39)
GTA 6876(1.68) Glu GAA 11405(1.46)
GTG 1941(0.47) GAG 4189(0.53)
Ser TCT 4800(1.55) Cys TGT 2292(1.42)
TCC 1460(0.47) TGC 922(0.57)
TCA 3346(1.08) TER TGA 203(0.77)
TCG 912(0.34) Trp TGG 3689(1.00)
Pro CCT 5240(1.80) Arg CGT 5325(2.08)
CCC 1350(0.46) CGC 1765(0.69)
CCA 4110(1.41) CGA 2696(1.01)
CCG 916(0.31) CGG 892(0.35)
Thr ACT 5928(1.79) Ser AGT 5768(1.87)
ACC 1789(0.54) AGC 2262(0.73)
ACA 4202(1.27) Arg AGA 3524(1.38)
ACG 1300(0.39) AGG 1169(0.46)
Ala GCT 9187(1.85) Gly GGT 7794(1.64)
GCC 2787(0.56) GGC 2836(0.59)
GCA 6221(1.25) GGA 6200(1.30)
GCG 1670(0.33) GGG 2129(0.44)
Overall codon usage of 768 PCG in the chromatophore genome ofP. chromatophora.Data represented with bold letters are preferred codons.
Table 4 Overall codon usage in S. elongatus
AA Codon N (RSCU) AA Codon N (RSCU)
Phe TTT 14909(1.11) Tyr TAT 8278(0.87)
TTC 11811(0.88) TAC 10678(1.12)
Leu TTA 6634(0.50) TER TAA 776(0.96)
TTG 19535(1.49) TAG 922(1.15)
CTT 7121(0.41) His CAT 6464(0.96)
CTC 20585(1.19) CAC 6949(1.03)
CTA 8678(0.50) Gln CAA 23338(0.98)
CTG 32548(1.88) CAG 24092(1.01)
Ile ATC 21038(1.50) Asn AAT 10381(0.97)
ATT 20131(1.44) AAC 10858(1.02)
ATA 692 (0.05) Lys AAA 10248(1.04)
Met ATG 11456(1.00) AAG 9370(0.95)
Val GTT 12236(0.94) Asp GAT 25896(1.30)
GTC 17788(1.37) GAC 13769(0.69)
GTA 3535(0.27) Glu GAA 24927(1.13)
GTG 18179(1.40) GAG 18827(0.86)
Ser TCT 4946(0.81) Cys TGT 3451(0.82)
TCC 5912(0.97) TGC 4905(1.17)
TCA 4257(0.70) TER TGA 707(0.882)
TCG 9207(1.51) Trp TGG 13533(1.00)
Pro CCT 7920(0.74) Arg CGT 7985(0.62)
CCC 14372(1.35) CGC 23748(1.87)
CCA 7251(0.68) CGA 7940(0.62)
CCG 13017(1.22) CGG 11080(0.87)
Thr ACT 7789(0.77) Ser AGT 9128(0.82)
ACC 15479(1.54) AGC 13096(1.17)
ACA 5513(0.55) Arg AGA 1135(1.17)
ACG 11432(0.77) AGG 791(0.82)
Ala GCT 19671(0.96) Gly GGT 14414(1.02)
GCC 25932(1.27) GGC 24840(1.77)
GCA 14455(0.70) GGA 6797(0.48)
GCG 21572(1.05) GGG 9975(0.71)
Overall codon usage of 2342 PCG in the cyanobacterial genome ofS. elongatus.Date represented in bold letters are preferred codons.
Nair et al. SpringerPlus 2013, 2:492 Page 4 of 16http://www.springerplus.com/content/2/1/492
eight C (56.8 %) ending codons and six G (44.2 %) end-ing codons were present (Table 5). For 2342 PCG inS. elongatus genome, ENC values varied from 39.80 to56.65 with a mean and S.D of 51.29 and 2.14 respect-ively indicating marked variation in the codon usage ofgenes in the genome of S. elongatus. GC3 varied from26.12% to 76.90% with a mean and S.D of 60.19% and7.45% respectively, suggesting the major influence of GCcompositional constraints in framing codon usage acrossgenes in this genome.
II. Influence of GC composition on SCUOa) Chromatophore genome of P. chromatophoraOverall GC content and local GC compositions (GC1,
GC2, and GC3) of 786 PCG were estimated and plottedagainst corresponding SCUO (Figure 2). GC3 showedtwo horns (Figure 2d) whereas overall GC and other localGC compositions (GC1 and GC2) did not show any horns.The relationship between GC3 and SCUO was found tobe linear (SCUO= −0.004 (GC3) + 0.324, r = −0.325, p <0.001). It was also observed that GC2 content was signifi-cantly correlated with SCUO values (r = − 0.114, p <
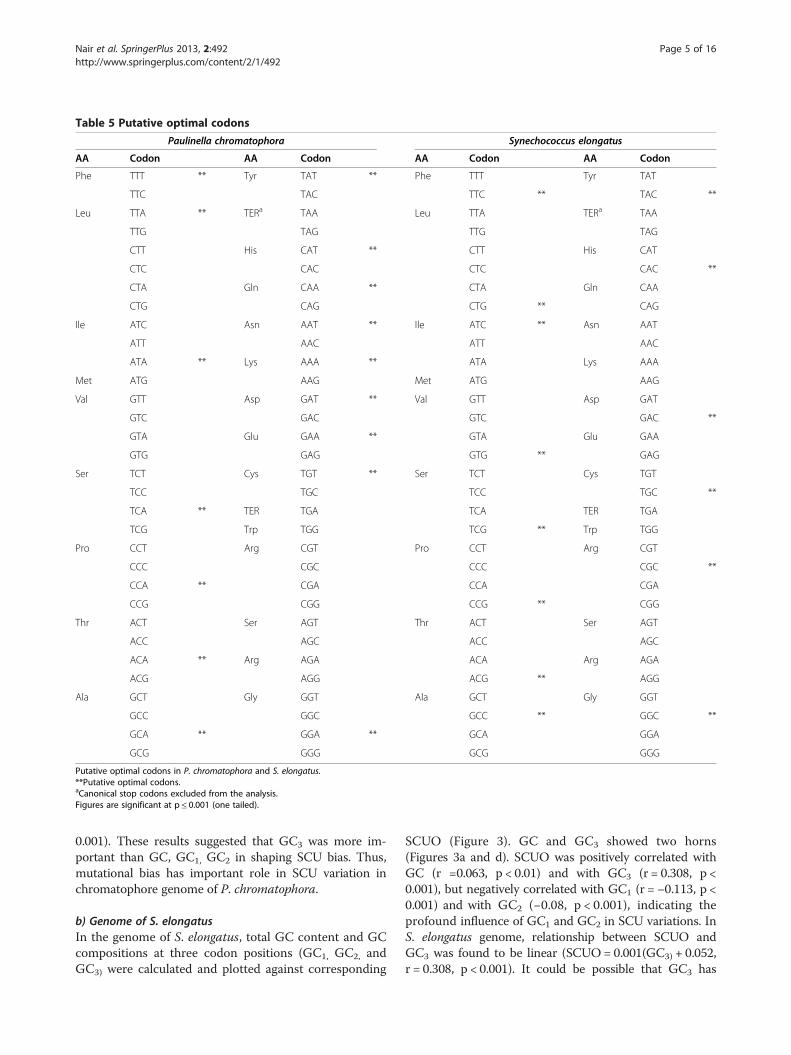
Table 5 Putative optimal codons
Paulinella chromatophora Synechococcus elongatus
AA Codon AA Codon AA Codon AA Codon
Phe TTT ** Tyr TAT ** Phe TTT Tyr TAT
TTC TAC TTC ** TAC **
Leu TTA ** TERa TAA Leu TTA TERa TAA
TTG TAG TTG TAG
CTT His CAT ** CTT His CAT
CTC CAC CTC CAC **
CTA Gln CAA ** CTA Gln CAA
CTG CAG CTG ** CAG
Ile ATC Asn AAT ** Ile ATC ** Asn AAT
ATT AAC ATT AAC
ATA ** Lys AAA ** ATA Lys AAA
Met ATG AAG Met ATG AAG
Val GTT Asp GAT ** Val GTT Asp GAT
GTC GAC GTC GAC **
GTA Glu GAA ** GTA Glu GAA
GTG GAG GTG ** GAG
Ser TCT Cys TGT ** Ser TCT Cys TGT
TCC TGC TCC TGC **
TCA ** TER TGA TCA TER TGA
TCG Trp TGG TCG ** Trp TGG
Pro CCT Arg CGT Pro CCT Arg CGT
CCC CGC CCC CGC **
CCA ** CGA CCA CGA
CCG CGG CCG ** CGG
Thr ACT Ser AGT Thr ACT Ser AGT
ACC AGC ACC AGC
ACA ** Arg AGA ACA Arg AGA
ACG AGG ACG ** AGG
Ala GCT Gly GGT Ala GCT Gly GGT
GCC GGC GCC ** GGC **
GCA ** GGA ** GCA GGA
GCG GGG GCG GGG
Putative optimal codons in P. chromatophora and S. elongatus.**Putative optimal codons.aCanonical stop codons excluded from the analysis.Figures are significant at p ≤ 0.001 (one tailed).
Nair et al. SpringerPlus 2013, 2:492 Page 5 of 16http://www.springerplus.com/content/2/1/492
0.001). These results suggested that GC3 was more im-portant than GC, GC1, GC2 in shaping SCU bias. Thus,mutational bias has important role in SCU variation inchromatophore genome of P. chromatophora.
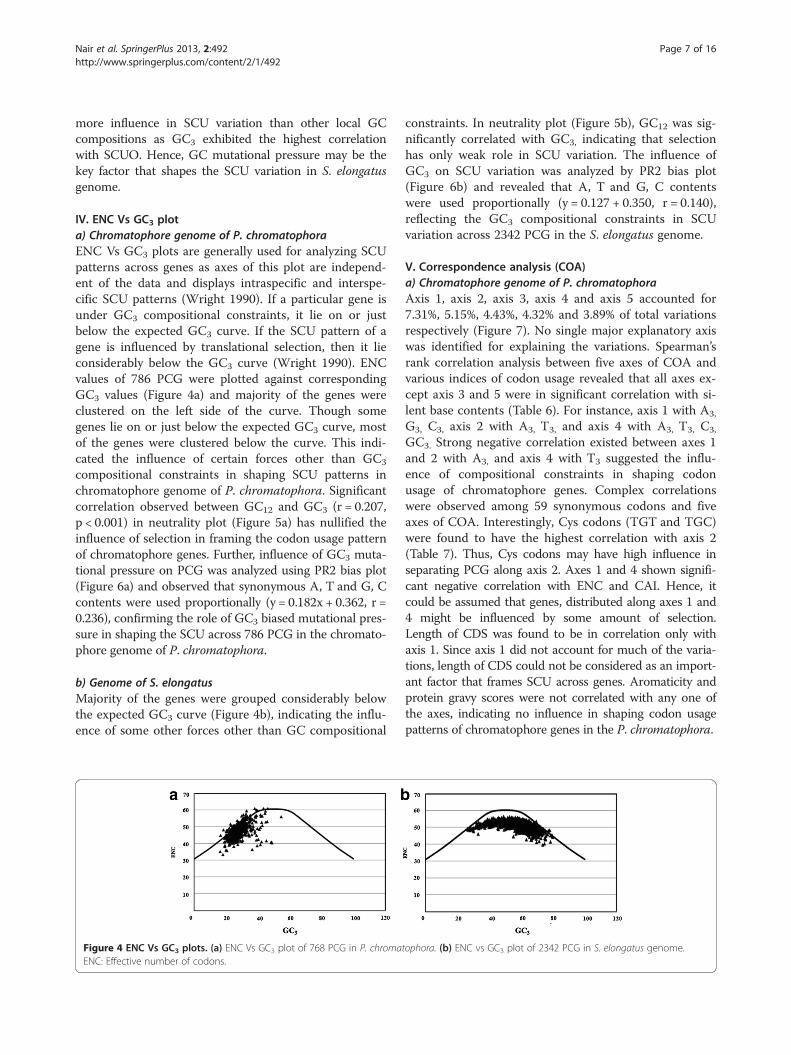
b) Genome of S. elongatusIn the genome of S. elongatus, total GC content and GCcompositions at three codon positions (GC1, GC2, andGC3) were calculated and plotted against corresponding
SCUO (Figure 3). GC and GC3 showed two horns(Figures 3a and d). SCUO was positively correlated withGC (r =0.063, p < 0.01) and with GC3 (r = 0.308, p <0.001), but negatively correlated with GC1 (r = −0.113, p <0.001) and with GC2 (−0.08, p < 0.001), indicating theprofound influence of GC1 and GC2 in SCU variations. InS. elongatus genome, relationship between SCUO andGC3 was found to be linear (SCUO= 0.001(GC3) + 0.052,r = 0.308, p < 0.001). It could be possible that GC3 has
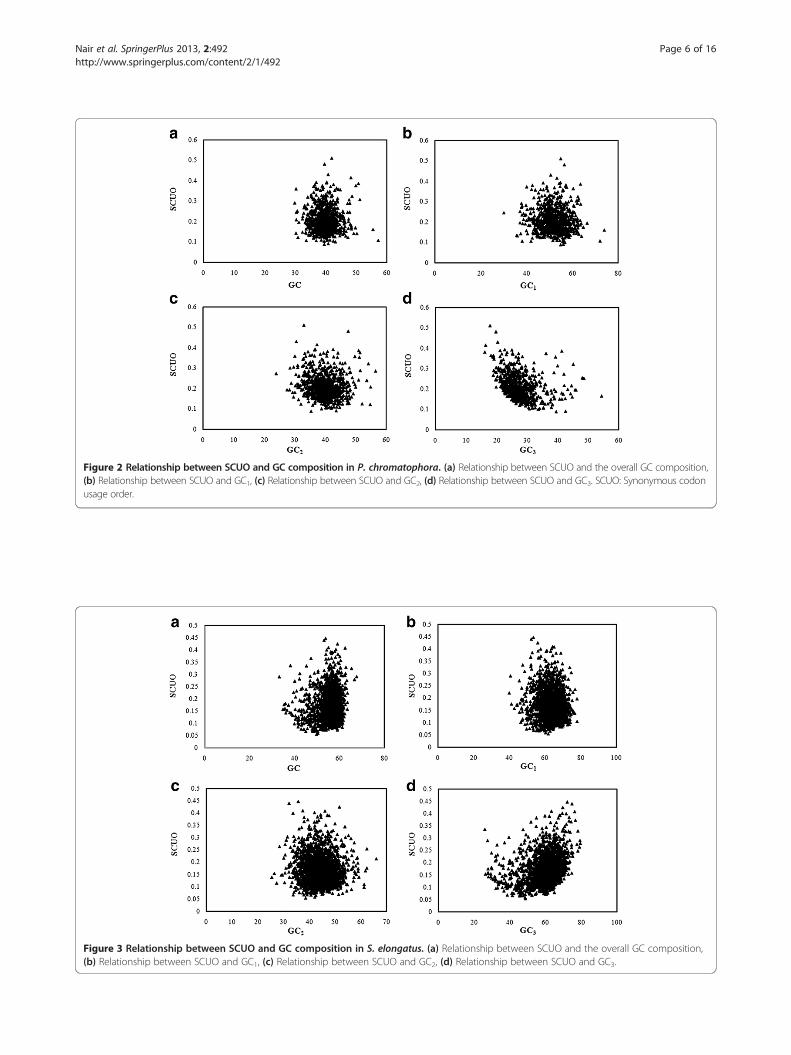
Figure 2 Relationship between SCUO and GC composition in P. chromatophora. (a) Relationship between SCUO and the overall GC composition,(b) Relationship between SCUO and GC1, (c) Relationship between SCUO and GC2, (d) Relationship between SCUO and GC3. SCUO: Synonymous codonusage order.
Figure 3 Relationship between SCUO and GC composition in S. elongatus. (a) Relationship between SCUO and the overall GC composition,(b) Relationship between SCUO and GC1, (c) Relationship between SCUO and GC2, (d) Relationship between SCUO and GC3.
Nair et al. SpringerPlus 2013, 2:492 Page 6 of 16http://www.springerplus.com/content/2/1/492
Nair et al. SpringerPlus 2013, 2:492 Page 7 of 16http://www.springerplus.com/content/2/1/492
more influence in SCU variation than other local GCcompositions as GC3 exhibited the highest correlationwith SCUO. Hence, GC mutational pressure may be thekey factor that shapes the SCU variation in S. elongatusgenome.
IV. ENC Vs GC3 plota) Chromatophore genome of P. chromatophoraENC Vs GC3 plots are generally used for analyzing SCUpatterns across genes as axes of this plot are independ-ent of the data and displays intraspecific and interspe-cific SCU patterns (Wright 1990). If a particular gene isunder GC3 compositional constraints, it lie on or justbelow the expected GC3 curve. If the SCU pattern of agene is influenced by translational selection, then it lieconsiderably below the GC3 curve (Wright 1990). ENCvalues of 786 PCG were plotted against correspondingGC3 values (Figure 4a) and majority of the genes wereclustered on the left side of the curve. Though somegenes lie on or just below the expected GC3 curve, mostof the genes were clustered below the curve. This indi-cated the influence of certain forces other than GC3
compositional constraints in shaping SCU patterns inchromatophore genome of P. chromatophora. Significantcorrelation observed between GC12 and GC3 (r = 0.207,p < 0.001) in neutrality plot (Figure 5a) has nullified theinfluence of selection in framing the codon usage patternof chromatophore genes. Further, influence of GC3 muta-tional pressure on PCG was analyzed using PR2 bias plot(Figure 6a) and observed that synonymous A, T and G, Ccontents were used proportionally (y = 0.182x + 0.362, r =0.236), confirming the role of GC3 biased mutational pres-sure in shaping the SCU across 786 PCG in the chromato-phore genome of P. chromatophora.
b) Genome of S. elongatusMajority of the genes were grouped considerably belowthe expected GC3 curve (Figure 4b), indicating the influ-ence of some other forces other than GC compositional
Figure 4 ENC Vs GC3 plots. (a) ENC Vs GC3 plot of 768 PCG in P. chromaENC: Effective number of codons.
constraints. In neutrality plot (Figure 5b), GC12 was sig-nificantly correlated with GC3, indicating that selectionhas only weak role in SCU variation. The influence ofGC3 on SCU variation was analyzed by PR2 bias plot(Figure 6b) and revealed that A, T and G, C contentswere used proportionally (y = 0.127 + 0.350, r = 0.140),reflecting the GC3 compositional constraints in SCUvariation across 2342 PCG in the S. elongatus genome.
V. Correspondence analysis (COA)a) Chromatophore genome of P. chromatophoraAxis 1, axis 2, axis 3, axis 4 and axis 5 accounted for7.31%, 5.15%, 4.43%, 4.32% and 3.89% of total variationsrespectively (Figure 7). No single major explanatory axiswas identified for explaining the variations. Spearman’srank correlation analysis between five axes of COA andvarious indices of codon usage revealed that all axes ex-cept axis 3 and 5 were in significant correlation with si-lent base contents (Table 6). For instance, axis 1 with A3,
G3, C3, axis 2 with A3, T3, and axis 4 with A3, T3, C3,
GC3. Strong negative correlation existed between axes 1and 2 with A3, and axis 4 with T3 suggested the influ-ence of compositional constraints in shaping codonusage of chromatophore genes. Complex correlationswere observed among 59 synonymous codons and fiveaxes of COA. Interestingly, Cys codons (TGT and TGC)were found to have the highest correlation with axis 2(Table 7). Thus, Cys codons may have high influence inseparating PCG along axis 2. Axes 1 and 4 shown signifi-cant negative correlation with ENC and CAI. Hence, itcould be assumed that genes, distributed along axes 1 and4 might be influenced by some amount of selection.Length of CDS was found to be in correlation only withaxis 1. Since axis 1 did not account for much of the varia-tions, length of CDS could not be considered as an import-ant factor that frames SCU across genes. Aromaticity andprotein gravy scores were not correlated with any one ofthe axes, indicating no influence in shaping codon usagepatterns of chromatophore genes in the P. chromatophora.
tophora. (b) ENC vs GC3 plot of 2342 PCG in S. elongatus genome.
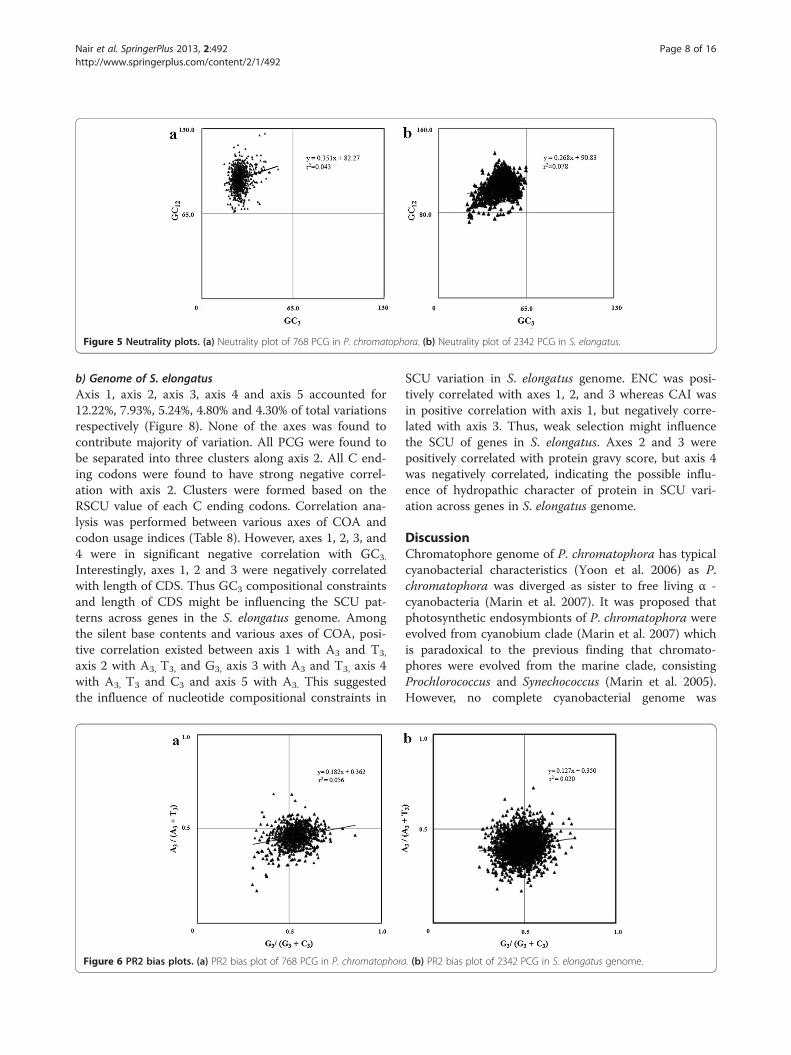
Figure 5 Neutrality plots. (a) Neutrality plot of 768 PCG in P. chromatophora. (b) Neutrality plot of 2342 PCG in S. elongatus.
Nair et al. SpringerPlus 2013, 2:492 Page 8 of 16http://www.springerplus.com/content/2/1/492
b) Genome of S. elongatusAxis 1, axis 2, axis 3, axis 4 and axis 5 accounted for12.22%, 7.93%, 5.24%, 4.80% and 4.30% of total variationsrespectively (Figure 8). None of the axes was found tocontribute majority of variation. All PCG were found tobe separated into three clusters along axis 2. All C end-ing codons were found to have strong negative correl-ation with axis 2. Clusters were formed based on theRSCU value of each C ending codons. Correlation ana-lysis was performed between various axes of COA andcodon usage indices (Table 8). However, axes 1, 2, 3, and4 were in significant negative correlation with GC3.
Interestingly, axes 1, 2 and 3 were negatively correlatedwith length of CDS. Thus GC3 compositional constraintsand length of CDS might be influencing the SCU pat-terns across genes in the S. elongatus genome. Amongthe silent base contents and various axes of COA, posi-tive correlation existed between axis 1 with A3 and T3,
axis 2 with A3, T3, and G3, axis 3 with A3 and T3, axis 4with A3, T3 and C3 and axis 5 with A3. This suggestedthe influence of nucleotide compositional constraints in
Figure 6 PR2 bias plots. (a) PR2 bias plot of 768 PCG in P. chromatophora
SCU variation in S. elongatus genome. ENC was posi-tively correlated with axes 1, 2, and 3 whereas CAI wasin positive correlation with axis 1, but negatively corre-lated with axis 3. Thus, weak selection might influencethe SCU of genes in S. elongatus. Axes 2 and 3 werepositively correlated with protein gravy score, but axis 4was negatively correlated, indicating the possible influ-ence of hydropathic character of protein in SCU vari-ation across genes in S. elongatus genome.
DiscussionChromatophore genome of P. chromatophora has typicalcyanobacterial characteristics (Yoon et al. 2006) as P.chromatophora was diverged as sister to free living α -cyanobacteria (Marin et al. 2007). It was proposed thatphotosynthetic endosymbionts of P. chromatophora wereevolved from cyanobium clade (Marin et al. 2007) whichis paradoxical to the previous finding that chromato-phores were evolved from the marine clade, consistingProchlorococcus and Synechococcus (Marin et al. 2005).However, no complete cyanobacterial genome was
. (b) PR2 bias plot of 2342 PCG in S. elongatus genome.
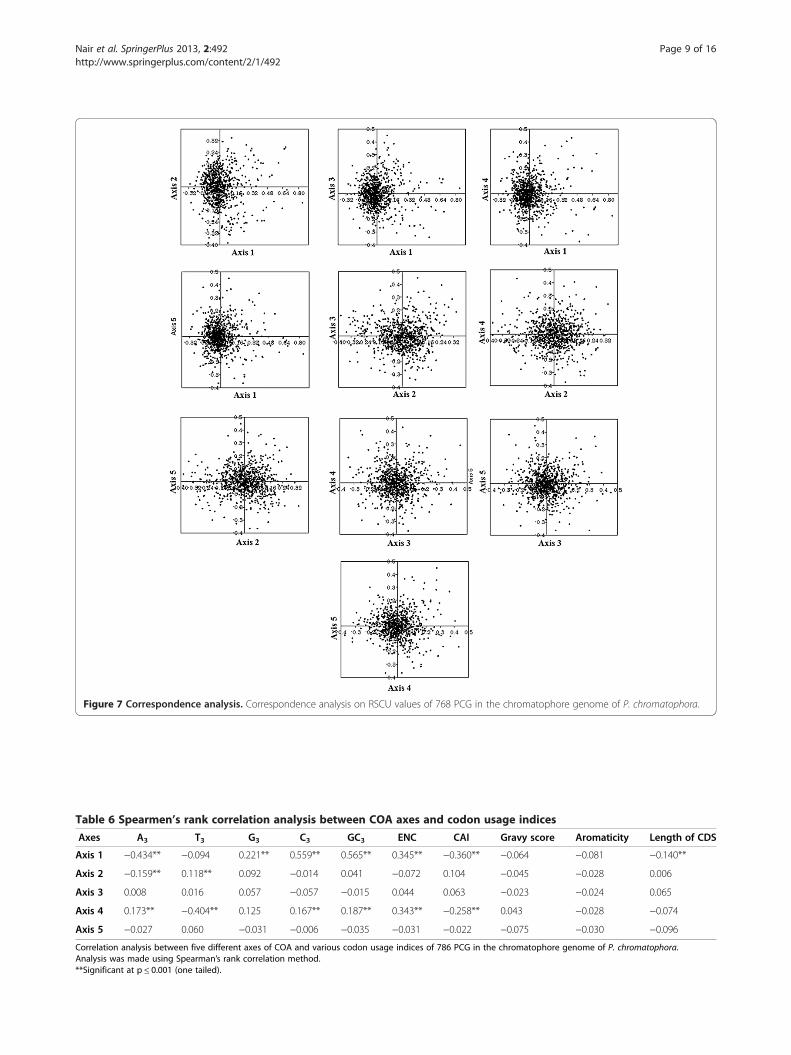
Figure 7 Correspondence analysis. Correspondence analysis on RSCU values of 768 PCG in the chromatophore genome of P. chromatophora.
Table 6 Spearmen’s rank correlation analysis between COA axes and codon usage indices
Axes A3 T3 G3 C3 GC3 ENC CAI Gravy score Aromaticity Length of CDS
Axis 1 −0.434** −0.094 0.221** 0.559** 0.565** 0.345** −0.360** −0.064 −0.081 −0.140**
Axis 2 −0.159** 0.118** 0.092 −0.014 0.041 −0.072 0.104 −0.045 −0.028 0.006
Axis 3 0.008 0.016 0.057 −0.057 −0.015 0.044 0.063 −0.023 −0.024 0.065
Axis 4 0.173** −0.404** 0.125 0.167** 0.187** 0.343** −0.258** 0.043 −0.028 −0.074
Axis 5 −0.027 0.060 −0.031 −0.006 −0.035 −0.031 −0.022 −0.075 −0.030 −0.096
Correlation analysis between five different axes of COA and various codon usage indices of 786 PCG in the chromatophore genome of P. chromatophora.Analysis was made using Spearman’s rank correlation method.**Significant at p ≤ 0.001 (one tailed).
Nair et al. SpringerPlus 2013, 2:492 Page 9 of 16http://www.springerplus.com/content/2/1/492
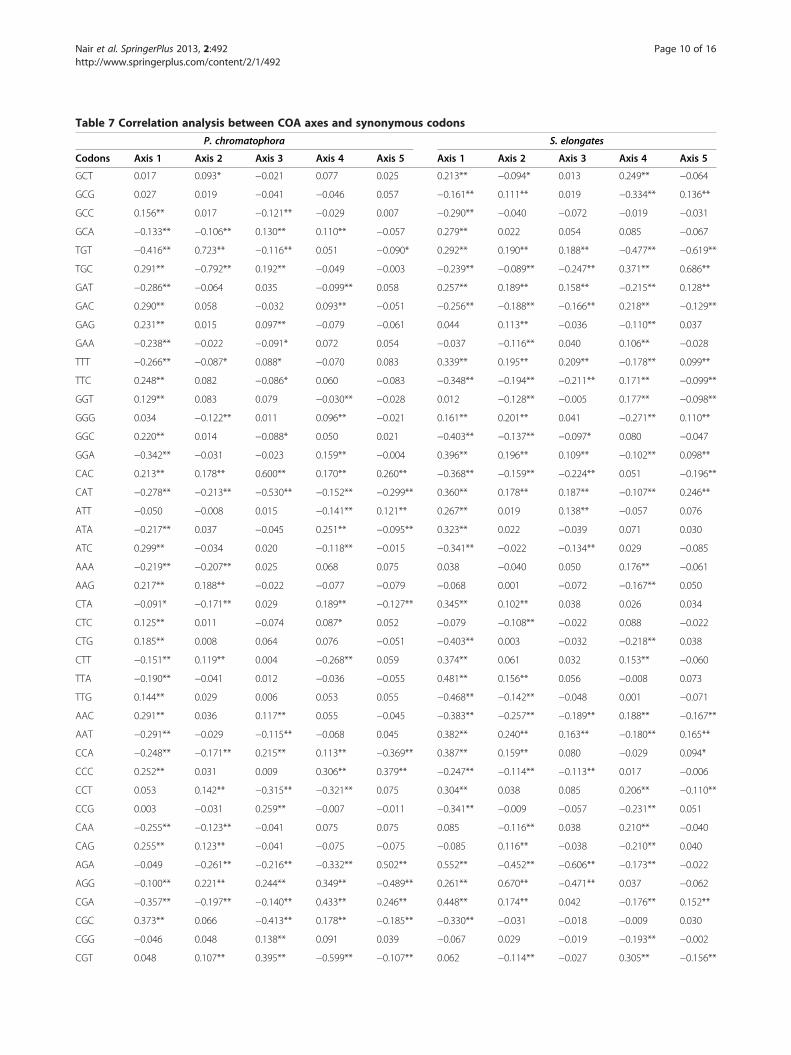
Table 7 Correlation analysis between COA axes and synonymous codons
P. chromatophora S. elongates
Codons Axis 1 Axis 2 Axis 3 Axis 4 Axis 5 Axis 1 Axis 2 Axis 3 Axis 4 Axis 5
GCT 0.017 0.093* −0.021 0.077 0.025 0.213** −0.094* 0.013 0.249** −0.064
GCG 0.027 0.019 −0.041 −0.046 0.057 −0.161** 0.111** 0.019 −0.334** 0.136**
GCC 0.156** 0.017 −0.121** −0.029 0.007 −0.290** −0.040 −0.072 −0.019 −0.031
GCA −0.133** −0.106** 0.130** 0.110** −0.057 0.279** 0.022 0.054 0.085 −0.067
TGT −0.416** 0.723** −0.116** 0.051 −0.090* 0.292** 0.190** 0.188** −0.477** −0.619**
TGC 0.291** −0.792** 0.192** −0.049 −0.003 −0.239** −0.089** −0.247** 0.371** 0.686**
GAT −0.286** −0.064 0.035 −0.099** 0.058 0.257** 0.189** 0.158** −0.215** 0.128**
GAC 0.290** 0.058 −0.032 0.093** −0.051 −0.256** −0.188** −0.166** 0.218** −0.129**
GAG 0.231** 0.015 0.097** −0.079 −0.061 0.044 0.113** −0.036 −0.110** 0.037
GAA −0.238** −0.022 −0.091* 0.072 0.054 −0.037 −0.116** 0.040 0.106** −0.028
TTT −0.266** −0.087* 0.088* −0.070 0.083 0.339** 0.195** 0.209** −0.178** 0.099**
TTC 0.248** 0.082 −0.086* 0.060 −0.083 −0.348** −0.194** −0.211** 0.171** −0.099**
GGT 0.129** 0.083 0.079 −0.030** −0.028 0.012 −0.128** −0.005 0.177** −0.098**
GGG 0.034 −0.122** 0.011 0.096** −0.021 0.161** 0.201** 0.041 −0.271** 0.110**
GGC 0.220** 0.014 −0.088* 0.050 0.021 −0.403** −0.137** −0.097* 0.080 −0.047
GGA −0.342** −0.031 −0.023 0.159** −0.004 0.396** 0.196** 0.109** −0.102** 0.098**
CAC 0.213** 0.178** 0.600** 0.170** 0.260** −0.368** −0.159** −0.224** 0.051 −0.196**
CAT −0.278** −0.213** −0.530** −0.152** −0.299** 0.360** 0.178** 0.187** −0.107** 0.246**
ATT −0.050 −0.008 0.015 −0.141** 0.121** 0.267** 0.019 0.138** −0.057 0.076
ATA −0.217** 0.037 −0.045 0.251** −0.095** 0.323** 0.022 −0.039 0.071 0.030
ATC 0.299** −0.034 0.020 −0.118** −0.015 −0.341** −0.022 −0.134** 0.029 −0.085
AAA −0.219** −0.207** 0.025 0.068 0.075 0.038 −0.040 0.050 0.176** −0.061
AAG 0.217** 0.188** −0.022 −0.077 −0.079 −0.068 0.001 −0.072 −0.167** 0.050
CTA −0.091* −0.171** 0.029 0.189** −0.127** 0.345** 0.102** 0.038 0.026 0.034
CTC 0.125** 0.011 −0.074 0.087* 0.052 −0.079 −0.108** −0.022 0.088 −0.022
CTG 0.185** 0.008 0.064 0.076 −0.051 −0.403** 0.003 −0.032 −0.218** 0.038
CTT −0.151** 0.119** 0.004 −0.268** 0.059 0.374** 0.061 0.032 0.153** −0.060
TTA −0.190** −0.041 0.012 −0.036 −0.055 0.481** 0.156** 0.056 −0.008 0.073
TTG 0.144** 0.029 0.006 0.053 0.055 −0.468** −0.142** −0.048 0.001 −0.071
AAC 0.291** 0.036 0.117** 0.055 −0.045 −0.383** −0.257** −0.189** 0.188** −0.167**
AAT −0.291** −0.029 −0.115** −0.068 0.045 0.382** 0.240** 0.163** −0.180** 0.165**
CCA −0.248** −0.171** 0.215** 0.113** −0.369** 0.387** 0.159** 0.080 −0.029 0.094*
CCC 0.252** 0.031 0.009 0.306** 0.379** −0.247** −0.114** −0.113** 0.017 −0.006
CCT 0.053 0.142** −0.315** −0.321** 0.075 0.304** 0.038 0.085 0.206** −0.110**
CCG 0.003 −0.031 0.259** −0.007 −0.011 −0.341** −0.009 −0.057 −0.231** 0.051
CAA −0.255** −0.123** −0.041 0.075 0.075 0.085 −0.116** 0.038 0.210** −0.040
CAG 0.255** 0.123** −0.041 −0.075 −0.075 −0.085 0.116** −0.038 −0.210** 0.040
AGA −0.049 −0.261** −0.216** −0.332** 0.502** 0.552** −0.452** −0.606** −0.173** −0.022
AGG −0.100** 0.221** 0.244** 0.349** −0.489** 0.261** 0.670** −0.471** 0.037 −0.062
CGA −0.357** −0.197** −0.140** 0.433** 0.246** 0.448** 0.174** 0.042 −0.176** 0.152**
CGC 0.373** 0.066 −0.413** 0.178** −0.185** −0.330** −0.031 −0.018 −0.009 0.030
CGG −0.046 0.048 0.138** 0.091 0.039 −0.067 0.029 −0.019 −0.193** −0.002
CGT 0.048 0.107** 0.395** −0.599** −0.107** 0.062 −0.114** −0.027 0.305** −0.156**
Nair et al. SpringerPlus 2013, 2:492 Page 10 of 16http://www.springerplus.com/content/2/1/492
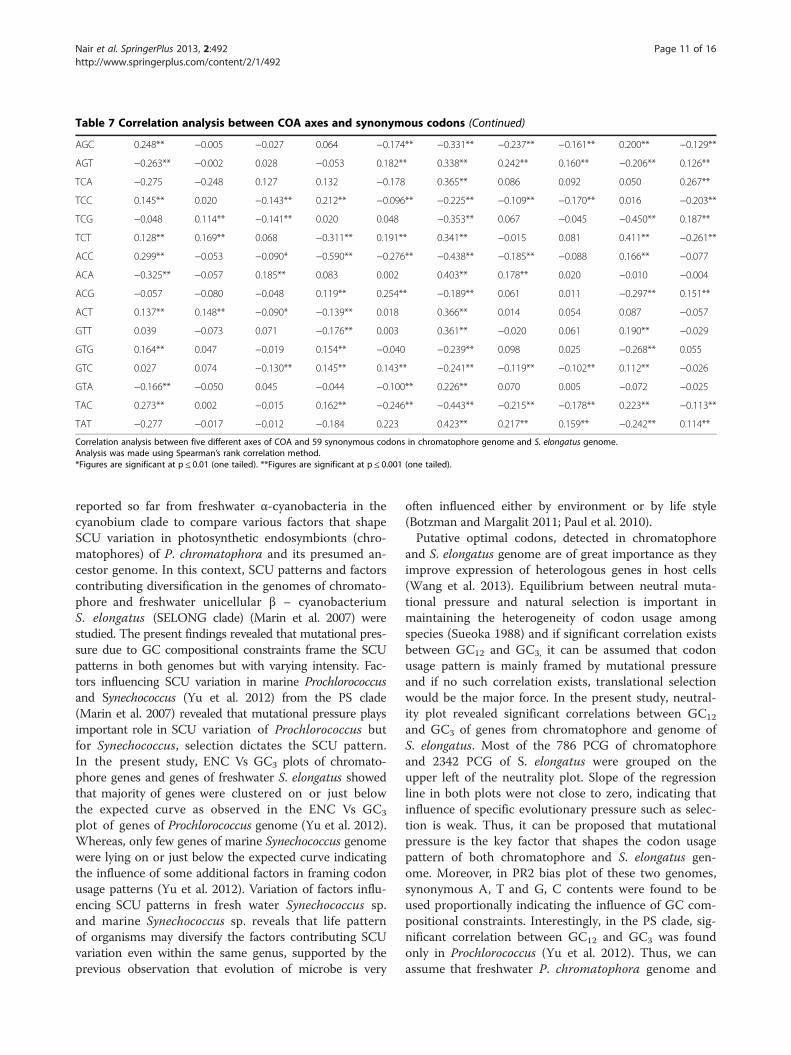
Table 7 Correlation analysis between COA axes and synonymous codons (Continued)
AGC 0.248** −0.005 −0.027 0.064 −0.174** −0.331** −0.237** −0.161** 0.200** −0.129**
AGT −0.263** −0.002 0.028 −0.053 0.182** 0.338** 0.242** 0.160** −0.206** 0.126**
TCA −0.275 −0.248 0.127 0.132 −0.178 0.365** 0.086 0.092 0.050 0.267**
TCC 0.145** 0.020 −0.143** 0.212** −0.096** −0.225** −0.109** −0.170** 0.016 −0.203**
TCG −0.048 0.114** −0.141** 0.020 0.048 −0.353** 0.067 −0.045 −0.450** 0.187**
TCT 0.128** 0.169** 0.068 −0.311** 0.191** 0.341** −0.015 0.081 0.411** −0.261**
ACC 0.299** −0.053 −0.090* −0.590** −0.276** −0.438** −0.185** −0.088 0.166** −0.077
ACA −0.325** −0.057 0.185** 0.083 0.002 0.403** 0.178** 0.020 −0.010 −0.004
ACG −0.057 −0.080 −0.048 0.119** 0.254** −0.189** 0.061 0.011 −0.297** 0.151**
ACT 0.137** 0.148** −0.090* −0.139** 0.018 0.366** 0.014 0.054 0.087 −0.057
GTT 0.039 −0.073 0.071 −0.176** 0.003 0.361** −0.020 0.061 0.190** −0.029
GTG 0.164** 0.047 −0.019 0.154** −0.040 −0.239** 0.098 0.025 −0.268** 0.055
GTC 0.027 0.074 −0.130** 0.145** 0.143** −0.241** −0.119** −0.102** 0.112** −0.026
GTA −0.166** −0.050 0.045 −0.044 −0.100** 0.226** 0.070 0.005 −0.072 −0.025
TAC 0.273** 0.002 −0.015 0.162** −0.246** −0.443** −0.215** −0.178** 0.223** −0.113**
TAT −0.277 −0.017 −0.012 −0.184 0.223 0.423** 0.217** 0.159** −0.242** 0.114**
Correlation analysis between five different axes of COA and 59 synonymous codons in chromatophore genome and S. elongatus genome.Analysis was made using Spearman’s rank correlation method.*Figures are significant at p ≤ 0.01 (one tailed). **Figures are significant at p ≤ 0.001 (one tailed).
Nair et al. SpringerPlus 2013, 2:492 Page 11 of 16http://www.springerplus.com/content/2/1/492
reported so far from freshwater α-cyanobacteria in thecyanobium clade to compare various factors that shapeSCU variation in photosynthetic endosymbionts (chro-matophores) of P. chromatophora and its presumed an-cestor genome. In this context, SCU patterns and factorscontributing diversification in the genomes of chromato-phore and freshwater unicellular β – cyanobacteriumS. elongatus (SELONG clade) (Marin et al. 2007) werestudied. The present findings revealed that mutational pres-sure due to GC compositional constraints frame the SCUpatterns in both genomes but with varying intensity. Fac-tors influencing SCU variation in marine Prochlorococcusand Synechococcus (Yu et al. 2012) from the PS clade(Marin et al. 2007) revealed that mutational pressure playsimportant role in SCU variation of Prochlorococcus butfor Synechococcus, selection dictates the SCU pattern.In the present study, ENC Vs GC3 plots of chromato-phore genes and genes of freshwater S. elongatus showedthat majority of genes were clustered on or just belowthe expected curve as observed in the ENC Vs GC3
plot of genes of Prochlorococcus genome (Yu et al. 2012).Whereas, only few genes of marine Synechococcus genomewere lying on or just below the expected curve indicatingthe influence of some additional factors in framing codonusage patterns (Yu et al. 2012). Variation of factors influ-encing SCU patterns in fresh water Synechococcus sp.and marine Synechococcus sp. reveals that life patternof organisms may diversify the factors contributing SCUvariation even within the same genus, supported by theprevious observation that evolution of microbe is very
often influenced either by environment or by life style(Botzman and Margalit 2011; Paul et al. 2010).Putative optimal codons, detected in chromatophore
and S. elongatus genome are of great importance as theyimprove expression of heterologous genes in host cells(Wang et al. 2013). Equilibrium between neutral muta-tional pressure and natural selection is important inmaintaining the heterogeneity of codon usage amongspecies (Sueoka 1988) and if significant correlation existsbetween GC12 and GC3, it can be assumed that codonusage pattern is mainly framed by mutational pressureand if no such correlation exists, translational selectionwould be the major force. In the present study, neutral-ity plot revealed significant correlations between GC12
and GC3 of genes from chromatophore and genome ofS. elongatus. Most of the 786 PCG of chromatophoreand 2342 PCG of S. elongatus were grouped on theupper left of the neutrality plot. Slope of the regressionline in both plots were not close to zero, indicating thatinfluence of specific evolutionary pressure such as selec-tion is weak. Thus, it can be proposed that mutationalpressure is the key factor that shapes the codon usagepattern of both chromatophore and S. elongatus gen-ome. Moreover, in PR2 bias plot of these two genomes,synonymous A, T and G, C contents were found to beused proportionally indicating the influence of GC com-positional constraints. Interestingly, in the PS clade, sig-nificant correlation between GC12 and GC3 was foundonly in Prochlorococcus (Yu et al. 2012). Thus, we canassume that freshwater P. chromatophora genome and
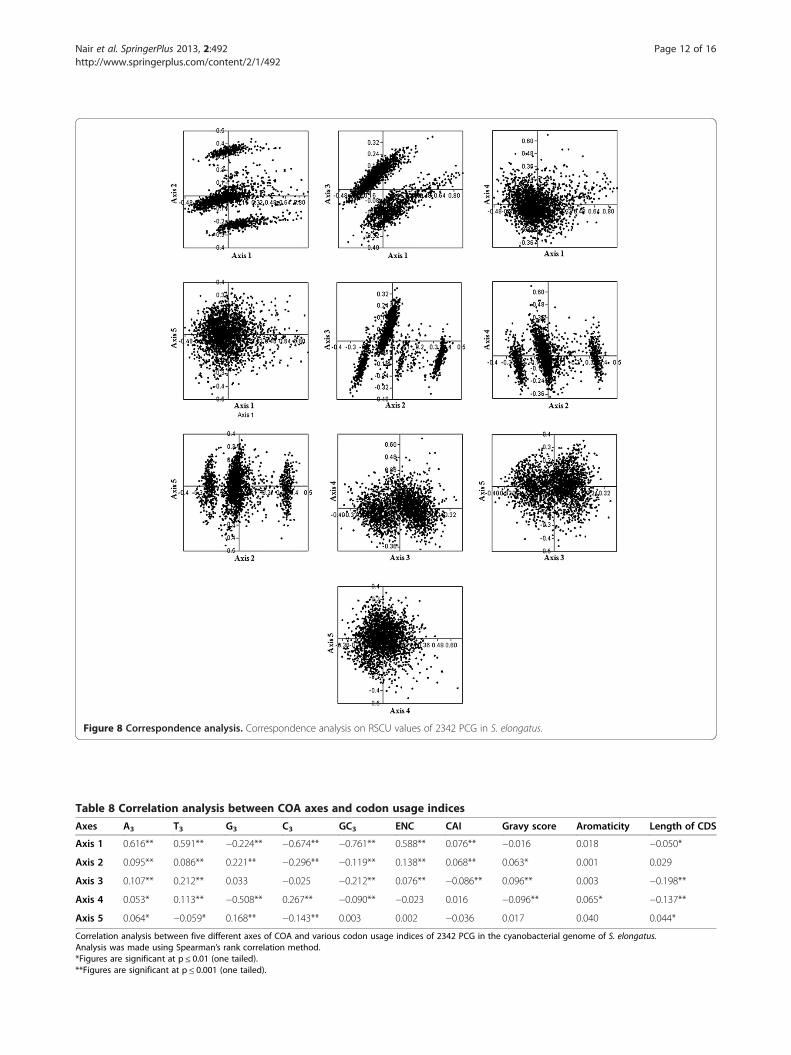
Figure 8 Correspondence analysis. Correspondence analysis on RSCU values of 2342 PCG in S. elongatus.
Table 8 Correlation analysis between COA axes and codon usage indices
Axes A3 T3 G3 C3 GC3 ENC CAI Gravy score Aromaticity Length of CDS
Axis 1 0.616** 0.591** −0.224** −0.674** −0.761** 0.588** 0.076** −0.016 0.018 −0.050*
Axis 2 0.095** 0.086** 0.221** −0.296** −0.119** 0.138** 0.068** 0.063* 0.001 0.029
Axis 3 0.107** 0.212** 0.033 −0.025 −0.212** 0.076** −0.086** 0.096** 0.003 −0.198**
Axis 4 0.053* 0.113** −0.508** 0.267** −0.090** −0.023 0.016 −0.096** 0.065* −0.137**
Axis 5 0.064* −0.059* 0.168** −0.143** 0.003 0.002 −0.036 0.017 0.040 0.044*
Correlation analysis between five different axes of COA and various codon usage indices of 2342 PCG in the cyanobacterial genome of S. elongatus.Analysis was made using Spearman’s rank correlation method.*Figures are significant at p ≤ 0.01 (one tailed).**Figures are significant at p ≤ 0.001 (one tailed).
Nair et al. SpringerPlus 2013, 2:492 Page 12 of 16http://www.springerplus.com/content/2/1/492
Nair et al. SpringerPlus 2013, 2:492 Page 13 of 16http://www.springerplus.com/content/2/1/492
S. elongatus genome are more similar to MarineProchlorococcus than Marine Synechococcus in termsof factors that diversify SCU patterns.Relationship between SCUO and GC3 formed a ‘U’
shape with two horns in both genomes as reported inunicellular microorganisms (Wan et al. 2004) and it re-veals the influence of GC3 over SCU bias. In chromato-phore genome, three axes of COA were found to showhigher correlation with silent base contents, confirmingthe influence of genome wide compositional constraints.However, axes 1 and 4 were highly correlated with codonusage indices that indicate the level of gene expressionsuch as ENC and CAI. Since there were no major explana-tory axes, correlation with these indices cannot be linkedwith the influence of selection. Hydropathic character ofprotein (gravy score) was correlated with axes 2, 3 and 4 inS. elongatus genome, suggesting that silent sites may beaffected by hydropathy levels of protein whereas in chro-matophore genome, gravy score did not show any correl-ation with any of the axes of COA. Correlation betweenlength of CDS and axes 1, 3 and 4 in S. elongatus genomeindicate the influence of length of CDS in SCU variationbut no such correlation was existed in P. chromatophora.In S. elongatus genome, negative correlation existed be-tween GC3 and first four axes of COA confirms the GC3
consequence on SCU pattern. Indices indicating the levelof gene expression such as ENC and CAI were correlatedsignificantly with first three axes of COA reflect the weakselection may take part in SCU variation of S. elongatus.Formation of three clusters of PCG along axis 2 inS. elongatus genome indicating a trend associated withRSCU value of C ending codons, but not observed inchromatophore genome. Whereas in chromatophore gen-ome, TGT and TGC codons (encoding Cys) influence sep-aration of PCG along axis 2. Influence of Cys codons inshaping SCU pattern was already reported in Lactococcuslactis (Gupta et al. 2004) and Rhizobium (Wang et al.2013). However, these results suggested that genome widecompositional constraints influence the SCU patterns ofboth chromatophore genome and S. elongatus genome.SCU patterns of chromatophore genome of P.
chromatophora and S. elongatus may be closely associ-ated with living habitats. The adapted habitat of P.chromatophora is a submerged vegetation in freshwater.Mud loving nature of this organism protects it from po-tential extrinsic mutagens like UV-B radiation and whichin turn causes genome wide mutation as reported inProchlorococcus (Partensky et al. 1999). Freshwater β –cyanobacterium S. elongatus PCC6301 is less adaptiveto varying environments as it resides strictly in eu-photic zones, relatively with low nutrient contents atmesophilic temperature (Waterbury et al. 1986) unlikemarine Synechococcus which is more adaptive to growin varying nutrient conditions and temperatures (Moore
et al. 1998). To make marine Synechococcus more adaptiveto environment, translational selection shapes the codonusage patterns (Yu et al. 2012) but mutational pressureframes codon usage in less adaptive fresh water S.elongatus. Closely related species, living in distinct environ-ments may exhibit considerable genomic diversity (Paulet al. 2010) that lead to differences in factors behind diversi-fication of SCU patterns. Mutational pressure was found tobe the major factor, influencing SCU pattern across PCG instrictly thermophilic cyanobacterium Thermosynechococcuselongatus BP-1 (Prabha et al. 2012) which is less adap-tive to other temperature ranges as growth of thermo-philes is restricted to particular environment at specifictemperature (Botzman and Margalit 2011). These reportssupport our finding that SCU pattern of P. chromatophoraand S. elongatus is dictated by mutational pressure due totheir less adaptation to varying environments.
ConclusionsSCU pattern of photosynthetic endosymbiont (chro-matophore) and S. elongatus genome is dictated mainlyby genome wide GC mutational pressure. Living habitatsof P. chromatophora and S. elongatus may also be influ-encing the SCU variations across genes of both genomes.However, complete genome sequencing of α-cyanobacteriafrom cyanobium clade would help further to understandSCU pattern and factors contributing diversification ofSCU in presumed ancestors of photosynthetic endosymbi-onts of P. chromatophora.
MethodsGene sequencesComplete coding sequences (CDS) of chromatophore gen-ome (Genbank: NC_011087.1) of P. chromatophora(Nowack et al. 2008) and genome (Genbank: AP008231) ofS. elongatus (Sugita et al. 2007) were retrieved from NCBIand CYORF (Cyanobacterial gene annotation database) re-spectively. CDS integrity was confirmed by checking thepresence of START codon at the beginning and STOPcodon at the end of each codon without any internal stopcodons. To minimize the sampling errors, CDS with morethan 300 nucleotides were chosen for analysis (Zhou andLi 2009; Sablok et al. 2011). Duplicate sequences wereidentified and excluded from the data set. Thus, the finaldata set of chromatophore genome consists 786 coding se-quences that contain 2, 61,350 codons and 7, 84,050 nucle-otides, whereas final data set of genome of S. elongatescontains 2342 coding sequences that contain 7, 74, 810 co-dons and 23, 24, 430 nucleotides.
Indices of codon usagea) Relative synonymous codon usage (RSCU)To infer the features of SCU variations across PCG inthe chromatophore genome by not taking amino acid
Nair et al. SpringerPlus 2013, 2:492 Page 14 of 16http://www.springerplus.com/content/2/1/492
compositional constraints into account, the RSCU valuesof all PCG were estimated according to Sharp et al.(1986).
b) Effective number of codons (ENC)ENC is an index that is widely used for measuring theextent of synonymous codon usage bias (Wright 1990).It can take values from 20 (only one codon is used foreach of the 20 aminoacids) to 61 (when all synonymouscodons are equally used). If the calculated ENC value isbeyond 61 due to more even distribution of codonusage, it is adjusted to 61 (Wright 1990). Selection ofpreferred codons and mutational pressures may reducethe ENC values. The expected ENC under randomcodon usage is approximated as a function of GC3 andcalculated according to Wright (1990).
c) Codon adaptation index (CAI)Codon adaptation index (CAI) is a measure of bias to-wards preferred codons in a PCG by defining the trans-lationally optimal codons that are mostly represented ina reference set of highly expressed genes (Sharp and Li1987). CAI value ranges from zero to one. Higher valueindicates increased bias towards preferred codons. Forthis study, we used ribosomal protein coding genes asreference for estimating CAI values on the basis of equa-tion, developed by Sharp and Li (1987).
d) Synonymous codon usage order (SCUO)Synonymous codon usage order measurement was usedto analyze the influence of GC composition at variouscodon positions on SCU. SCUO was computed usingthe following equation (Wan et al. 2004),
SCUO ¼ 1þ p2log2
p2
� �þ 1−p
2
� �log2
1−p2
� �
p ¼ GC3
Sequence analysisNucleotide contents of all PCG were calculated usingMEGA version 5.1 (Tamura et al. 2011). ENC values andCAI were calculated for all PCG by using online CodonW(http://codonw.sourceforge.net) and CAI calculator 2(Wu et al. 2005). SCUO was computed using standaloneCodonO (Wan et al. 2004).
Correspondence analysis (COA)COA is a multivariate statistical method used to identifymajor factors, shaping SCU patterns across genes andplot genes according to various influencing factors ofSCU (Perriere and Thioulouse 2002). Multivariate stat-istical analysis method was often employed to plot
PCGs according to RSCU values of the 59 synonymouscodons (excluding 3 stop codons, Trp and Met codons)(RoyChoudhury and Mukherjee 2010). COA develops aseries of orthogonal axes to define the major factors thatframe the SCU patterns in accordance with the variationof data. In this study, complete coding regions of eachPCG were represented as a 59 dimensional vector (exclud-ing Met, Trp and stop codons). Each dimension corre-sponds to RSCU value of one sense codon (Mardia et al.1979).
Statistical analysisAll correlations were made using Spearman’s rank cor-relation method as this measure of correlation does notrequire any distributional assumptions of the underlyingdata (Zhou and Li 2009). A Chi - square test involving2 × 2 table was employed for 5% of genes distributed atextreme left and 5% of genes distributed at extreme rightof axis 1 of COA to find out putative optimal codons. Foreach of 59 sense codons, First row contains the observedfrequency of a codon and the second row contains totalnumber of synonymous alternatives of that particularcodon. The significance was calculated at the 5% levelwith one degree of freedom. All these analyses were doneusing Past version 2.12 (Hammer et al. 2001).
AbbreviationsPCGs: Protein coding genes; RSCU: Relative synonymous codon usage;SCU: Synonymous codon usage; ENC: Effective number of codon usage;CAI: Codon adaptation index; SCUO: Synonymous codon usage order;PR2: Parity rule 2; GC3: GC content at 3rd codon position; GC12: GC contentat first and second position; COA: Correspondence analysis.
Competing interestsAuthors declare that they have no competing interest.
Authors’ contributionsRRN and GD conceptualized the study. RRN, TS and MBN performed dataanalyses. RRN and GD were involved in drafting the manuscript. All authorsread and approved the final manuscript.
AcknowledgementsAll the authors wish to acknowledge Department of Science andTechnology (Promotion of University Research and Scientific Excellence),Government of India, New Delhi, India for financial assistance. Part of thefinancial assistance was provided by University Grants Commission, NewDelhi under the project ‘Establishment of genetic identity for Indian coffeegermplasm using chloroplast genome sequences’ (F.No.41-583/2012 (SR).
Author details1Department of Biotechnology, Vignan University, Vadlamudi, 522 213,Guntur, Andhra Pradesh, India. 2Department of Plant Biotechnology, Schoolof Biotechnology, Madurai Kamaraj University, Palkalai Nagar, 625 021,Madurai, Tamil Nadu, India.
Received: 26 June 2013 Accepted: 27 September 2013Published: 30 September 2013
ReferencesAgashe D, Gomez NCM, Drummond DA, Marx CJ (2013) Good codons, bad
transcript: large reductions in gene expression and fitness arising fromsynonymous mutations in a key enzyme. Mol Biol Evol 30:549–560,10.1093/molbev/mss273
Nair et al. SpringerPlus 2013, 2:492 Page 15 of 16http://www.springerplus.com/content/2/1/492
Akashi H (1995) Inferring weak selection from patterns of polymorphismand divergence at silent sites in Drosophila DNA. Genetics139:1067–1076
Akashi H (2001) Gene expression and molecular evolution. Curr Opin Genet Dev11:660–666
Biro JC (2008) Does codon bias have an evolutionary origin? Theor Biol MedMode 5:1–15
Bodyl A, Mackiewicz P, Stiller JW (2007) The intracellular cyanobacteria ofPaulinella chromatophora: endosymbionts or organelles? Trends Microbiol15:295–296
Botzman M, Margalit H (2011) Variation in global codon usage bias amongprokaryotic organisms is associated with their lifestyles. Genome Biol,10.1186/gb-2011-12-10-r109
Bulmer M (1991) The selection-mutation-drift theory of synonymous codonusage. Genetics 129:897–907
Carlini DB, Chen Y, Stephan W (2001) The relationship between third-codonposition nucleotide content, codon bias, mRNA secondary structure andgene expression in the drosophilid alcohol dehydrogenase genes Adh andAdhr. Genetics 159:623–633
Chan CX, Gross J, Yoon HS, Bhattacharya D (2011) Plastid origin andevolution: new models provide insights into old problems. Plant Physiol155:1552–1560
Deschavanne I, Filipski J (1995) Correlation of GC content with replication timingand repair mechanisms in weakly expressed E. coli genes. Nucleic Acids Res23:1350–1353
Drummond DA, Wilke CO (2008) Mistranslation - induced protein misfoldingas a dominant constraint on coding-sequence evolution. Cell134:341–352
Ermolaeva MD (2001) Synonymous codon usage in bacteria. Curr Issues Mol Biol3:91–97
Grantham R, Gautier C, Gouy M, Mercier R, Pave A (1980) Codon catalog usageand the genome hypothesis. Nucleic Acids Res 8:49–62
Gupta SK, Bhattacharyya TK, Ghosh TC (2004) Synonymous codon usage inLactococcus lactis: mutational bias versus translational selection. J BiomolStruct Dyn 21:527–536
Hammer Q, Harper DAT, Ryan PD (2001) PAST: paleontological statistics softwarepackage for education and data analysis. Palaeontol Electron 4:1–9
Hershberg R, Petrov DA (2008) Selection on codon bias. Annu Rev Genet42:287–299
Ikemura T (1982) Correlation between the abundance of yeast tRNAs and theoccurrence of the respective codons in its protein genes. J Mol Biol158:573–579
Ikemura T (1985) Codon usage and tRNA content in unicellular and multicellularorganisms. Mol Biol Evol 2:13–34
Irwin B, Heck JD, Hatfield GW (1995) Codon pair utilization the biases influencetranslational elongation step times. J Biol Chem 270:22801–22806
Karlin S, Mrazek J, Campbell AM (1998) Codon usages in different gene classes ofthe Escherichia coli genome. Mol Microbiol 29:1341–1355
Kurland CG (1993) Major codon preference theme and variations. Biochem Soc T21:841–846
Mardia KV, Kent JT, Bibby JM (1979) Multivariate analysis. Academic, New YorkMarin B, Nowack ECM, Melkonian M (2005) A plastid in the making: evidence for
a secondary primary endosymbiosis. Protist 156:425–432Marin B, Nowack ECM, Glockner G, Melkonian M (2007) The ancestor of the
Paulinella chromatophore obtained a carboxysomal operon by horizontalgene transfer from a Nitrococcus-like γ-proteobacterium. BMC Evol Biol,10.1186/1471-2148-7-85
Moore LR, Rocap G, Chisholm SW (1998) Physiology and molecular phylogeny ofcoexisting Prochlorococcus ecotypes. Nature 393:464–467
Moriyama EN, Powell JR (1997) Codon usage bias and tRNA abundance inDrosophila. J Mol Evol 45:514–523
Morton BR (1993) Chloroplast DNA codon use: evidence for selection at the psbAlocus based on tRNA availability. J Mol Evol 37:273–280
Morton BR (1997) Rates of synonymous substitution do not indicate selectiveconstraints on the codon use of the plant psbA gene. Mol Biol Evol14:412–419
Morton BR (1998) Selection on the codon bias of chloroplast and cyanelle genesin different plant and algal lineages. J Mol Evol 46:449–459
Nair RR, Nandhini MB, Monalisha E, Murugan K, Sethuraman T, Nagarajan S, RaoNSP, Ganesh D (2012) Synonymous codon usage in chloroplast genome ofCoffea arabica. Bioinformation 8:1096–1104
Nowack ECM, Melkonian M, Glockner G (2008) Chromatophore genomesequence of Paulinella sheds light on acquisition of photosynthesis byeukaryotes. Curr Biol 18:410–418
Parmley JL, Hurst LD (2007) How do synonymous mutations affect fitness?Bioessays 29:515–519
Partensky F, Hess WR, Vaulot D (1999) Prochlorococcus, a marine photosyntheticprokaryote of global significance. Microbiol Mol Biol Rev 63:106–127
Paul S, Dutta A, Bag SK, Das S, Dutta C (2010) Distinct, ecotype-specific genomeand proteome signatures in the marine cyanobacteria Prochlorococcus.BMC Genomics, 10.1186/1471-2164-11-103
Perriere G, Thioulouse J (2002) Use and misuse of correspondence analysis incodon usage studies. Nucleic Acids Res 30:4548–4555
Plotkin JB, Kudla G (2011) Synonymous but not the same: the causes andconsequences of codon bias. Nat Rev Genet 12:32–42
Prabha R, Singh DP, Gupta SK, Farooqi S, Rai A (2012) Synonymous codon usagein Thermosynechococcus elongatus (cyanobacteria) identifies the factorsshaping codon usage variation. Bioinformation 8:622–628
RoyChoudhury S, Mukherjee D (2010) A detailed comparative analysis on theoverall codon usage pattern in herpesviruses. Virus res 148:31–43
Sablok G, Nayak KC, Vazquez F, Tatarinova TV (2011) Synonymous codon usage,GC3, and evolutionary patterns across plastomes of three pooid modelspecies: emerging grass genome models for monocots. Mol Biotechnol49:116–128
Sarmer WT, Sullivan DT (1989) A shift in the third-codon-position nucleotidefrequency in alcohol dehydrogenase genes in the genus Drosophila. Mol BiolEvol 6:546–552
Selva KC, Nair RR, Sivaramakrishnan KG, Ganesh D, Janarthanan S, ArunachalamM, Sivaruban T (2012) Influence of certain forces on evolution ofsynonymous codon usage bias in certain species of three basal orders ofaquatic insects. Mitochondr DNA 23:447–460
Sharp PM, Cowe E (1991) Synonymous codon usage in Saccharomyces cerevisiae.Yeast 7:657–678
Sharp PM, Li WH (1987) The codon adaptation index - a measure of directionalsynonymous codon usage bias, and its potential applications. Nucleic AcidRes 15:1281–1295
Sharp PM, Tuohy TMF, Mosurski KR (1986) Codon usage in yeast: cluster analysisclearly differentiates highly and lowly expressed genes. Nucleic Acids Res14:8207–8211
Sharp PM, Averof M, Lloyd AT, Matassi G, Peden JF (1995) DNA sequenceevolution: the sounds of silence. Phil Trans R Soc B 349:241–247
Smith MJ, Smith NH (1996) Site - specific codon bias in bacteria. Genetics142:1037–1043
Sueoka N (1988) Directional mutation pressure and neutral molecular evolution.Proc Natl Acad Sci USA 85:2653–2657
Sugita C, Ogata K, Shikata M, Jikuya H, Takano J, Furumichi M, Kanehisa M,Omata T, Sugiura M, Sugita M (2007) Complete nucleotide sequence ofthe freshwater unicellular cyanobacterium Synechococcus elongatus PCC6301 chromosome: gene content and organization. Photosynth Res93:55–67
Tamura K, Peterson D, Peterson N, Steker G, Nei M, Kumar S (2011) MEGA5:molecular evolutionary genetics analysis using maximum likelihood,evolutionary distance, and maximum parsimony methods. Mol Biol Evol28:2731–2739
Wall DP, Herback JT (2003) Evolutionary patterns of codon usage in thechloroplast gene rbcL. J Mol Evol 56:673–688
Wan XF, Xu D, Kleinhofs A, Zhou J (2004) Quantitative relationship betweensynonymous codon usage bias and GC composition across unicellulargenomes. BMC Evol Biol, 10.1186/1471-2148-4-19
Wang X, Zhu S, Zhao L, Wu L, An W, Zhou P, Chen Y (2013) Analysis ofsynonymous codon usage patterns in the genus Rhizobium. World J MicrobBiot, 10.1007/s11274-013-1364-7
Waterbury JB, Watson SW, Valois FW, Franks DG (1986) Biological and ecologicalcharacterization of the marine unicellular cyanobacterium Synechococcus.Can B Fish Aquat Sci 214:71–120
Wright F (1990) The “effective number of codons” used in a gene. Gene 87:23–29Wu G, Culley DE, Zhang W (2005) Predicted highly expressed genes in the
genomes of Streptomyces coelicolor and Streptomyces avermitilis and theimplications for their metabolism. Microbiol 151:2175–2187
Yang Z, Nielsen R (2008) Mutation-selection models of codon substitution andtheir use to estimate selective strengths on codon usage. Mol Biol Evol25:568–579
Nair et al. SpringerPlus 2013, 2:492 Page 16 of 16http://www.springerplus.com/content/2/1/492
Yoon HS, Prieto A, Melkonian M, Bhattacharya D (2006) Minimal plastid genomeevolution in the Paulinella endosymbionts. Curr Biol 16:670–672
Yu T, Li J, Yang Y, Qi L, Chen B, Zhao F, Bao Q, Wu J (2012) Codon usagepatterns and adaptive evolution of marine unicellular cyanobacteriaSynechococcus and Prochlorococcus. Mol Phylogenet Evol 62:206–213
Zhou M, Li X (2009) Analysis of synonymous codon usage patterns in differentplant mitochondrial genomes. Mol Biol Rep 36:2039–2046
doi:10.1186/2193-1801-2-492Cite this article as: Nair et al.: Mutational pressure dictates synonymouscodon usage in freshwater unicellular α - cyanobacterial descendantPaulinella chromatophora and β - cyanobacterium Synechococcuselongatus PCC6301. SpringerPlus 2013 2:492.
Submit your manuscript to a journal and benefi t from:
7 Convenient online submission
7 Rigorous peer review
7 Immediate publication on acceptance
7 Open access: articles freely available online
7 High visibility within the fi eld
7 Retaining the copyright to your article
Submit your next manuscript at 7 springeropen.com


![PAPER OPEN ACCESS 3UHSDUDWLRQDQGFKDUDFWHUL ...spec-lab.ecnu.edu.cn/.../514d1fba-e0b4-43fa-95cd-35ba6a83b250.pdf · PAPER OPEN ACCESS 3UHSDUDWLRQDQGFKDUDFWHUL]DWLRQRIQDUURZEDQGJDSIHUURHOHFWULF](https://static.fdocument.org/doc/165x107/5e1b49bb1f7dfa13d250784c/paper-open-access-3uhsdudwlrqdqgfkdudfwhul-spec-labecnueducn514d1fba-e0b4-43fa-95cd-.jpg)