Poster$P516 SIRPα … · Here$we$demonstrate$the$immunomodulatory$effects$of$SIRP α...
1
Here we demonstrate the immunomodulatory effects of SIRPα blockade. In an in vitro assay with tumor cell suspension, SIRPα blockade increases the cellular uptake of tumor cells by matured peritoneal macrophages as a monotherapy and to a greater degree when combined with a tumor targeting antibody. Using a mouse BMDC crosspresentation assay, we also demonstrate that the blockade of SIRPα results in increased T cell expansion, supporting a role for SIRPα blockade in enhancing DC skewing and function. We further demonstrate that DC phenotype is shifted towards the crosspresenting DC1 phenotype in this assay. Additionally, SIRPα blockade functions to modify the myeloid compartment in the TME of solid tumors. In the mouse mammary tumor model 4T1, we demonstrate that SIRPα blockade skews the DC population towards the crosspresenting DC1 phenotype and increases the CD86 expression on DC2s in the spleen and lymph node. Lastly, in the subcutaneous tumor models 4T1 and CT26, SIRPα blockade combined with PD1 blockade reduces tumor burden and increases overall survival. Subcutaneous mouse tumor models and a mouse bone marrowderived dendritic cell (BMDC) crosspresentation assay were used to assess the efficacy of SIRPα blockade in solid tumors. Presented at the 2018 The Society for Immunotherapy of Cancer, November 7 11, 2018, Washington, DC Poster P516 SIRPα Blockade Increases the Activity of Multiple Myeloid Lineage Cells and Aids in Remodeling the Tumor Microenvironment Brian J. Francica, Brandy Chavez, Uyen Vu, Erik Voets, Joost Kreijtz, Hans van Eenennaam, Andrea van Elsas, and Meredith Leong Aduro Biotech, 740 Heinz Ave, Berkeley, CA 94710 Antagonizing the SIRPαCD47 pathway is gaining traction as an effective and novel approach to immune manipulation as design of immunotherapies broadens to include blockade of innate immune checkpoints. Recently, the combination of tumortargeting antibodies with SIRPαCD47 blockade has provided promising clinical results, suggesting that increased phagocytosis of cancer cells is clinically relevant for treatment of hematologic cancers.[1] However, the ability for this combination to enhance phagocytosis in the context of solid tumors may be remarkably diminished for several reasons including reduced expression of “eatme” signals like SLAMF7 [2], increased immune suppression in the tumor microenvironment (TME), and the physical size of tumor cells when adhered in a complex heterogeneous environment. To achieve efficacy in solid tumor indications, it is important that therapies blocking the SIRPαCD47 axis also potentiate adaptive immune mechanisms and not solely phagocytosis. Together, these data suggest that antagonizing SIRPα can have multiple functional consequences in myeloid cells. In suspension tumor cultures, SIRPα blockade results in an increase in uptake of tumor cells by macrophages. In an in vitro cross presentation assay, SIRPα blockade results in more DC1 phenotype DCs in culture and higher expansion of CD8+ T cells. In vivo, SIRPα blockade leads to multiple changes of cell phenotype and cell numbers within the tumor microenvironment. Mice treated with SIRPα blockade experience higher DC infiltration in the tumor as well as higher CD86 expression on DC2 phenotype cells. We hypothesize that these cellular changes are the driving force behind the combinatorial efficacy that we see when SIRPα agents are combined with PD1 blockade. These data continue to aid in the clinical development of ADU1805, a pan allele, anti human SIRPα blockade antibody. References: 1. X. Liu et al. (2017). Is CD47 an innate immune checkpoint for tumor evasion? Journal of Hematology & Oncology , 10, 12. http://doi.org/10.1186/s130450160381z. 2. J. Chen et al. (2017). SLAMF7 is critical for phagocytosis of haematopoietic tumour cells via Mac1 integrin. Nature volume 544, pages 493–497. Figure 1. SIRPα Influences Multiple CellCell Interactions Figure 2. SIRPα Blockade Causes Increased Cellular Uptake of Tumor Cells by Macrophages in vitro Figure 3. SIRPα Blockade Increased T Cell Expansion in vitro Figure 4. SIRPα Blockade Increases DC1 Abundance in vitro Figure 6. SIRPα Induces Changes in the DC Compartment in vivo Figure 7. Combination of SIRPα + αPD1 Reduces Tumor Burden in Syngeneic Tumor Models Figure 5. SIRPα Combination with PD1 Modulates T Cell Responses Blood Macrophage Tumor Phagocytosis Inhibition Increase Cellular Uptake SIRPα CD47 DC Lymph Node Potentiate CrossPriming and T Cell Response Increased presence or activity of DCs could lead to increased T cell priming, activation, and effector function z Modify TME Allows for increased infiltration and activity of adaptive immune subsets A) Peritoneal macrophages were elicited with biogel and matured with MCSF supplemented media for 4 days. After maturation of macrophages, SIRPα blocking antibodies and Trastuzumab were added to the culture where indicated. MC38hHER2 tumor cells were CFSE labelled and incubated with antiCD47 antibodies. Tumor cells were admixed to the macrophage culture for 4 hours, then harvested for flow cytometry. B) Alternatively, after admix of tumor cells, cultures were imaged on a fluorescent microscope at Time 0 (Left) and 180 minutes (Right), using CFSE to image tumor cells (Green) and CD11b fluorescent antibody to label macrophages (Red). Isotype AntiCD47, MIAP301 AntiSIRPα CD8 CFSE No AntiPD1 +AntiPD1 A) In vitro cross presentation assay setup. BMDC were elicited with FLT3l supplemented media for 7 days. On Day 7, MC38Ova tumor cells, along with antibodies blocking SIRPα, CD47, and PD1 were added. On Day 8, OT1 T cells were enriched, CFSE labelled, and added to the culture. Controls for this assay showed that OT1 T cells do not persist in the absence of antigen, nor do they expand without APC presence. B) Representative FACS plots and C) summary graph of T cell expansion after 72 hours co culture with MC38 Ova and matured APC. D) In a similar culture, we analyzed the addition of MC38 WT+ soluble SIINFEKL peptide, rather than MC38OVA to understand if the increase in T cell expansion was due to increased cross presentation. A B C D 7 days after treatment was initiated, immune responses in mice from Figure 7A were measured by examining PBMCs using a p15e specific tetramer (A) or by measuring bulk CD8+ T cells for Tbet (B) or PD1 (C) . Statistics were performed using a Student’s t test. *P<.05. **P<.01. B AB) Mice bearing 4T1 tumors were treated with Isotype, 180µg anti SIRPα +/ 200µg antiPD1, then sacrificed at for immune analysis. A) After 1 treatment, CD86 expression increases in the spleen in the DC2 (SIRPα+ CD103) population. B) After 2 treatments, the % DC1 (SIRPα CD103+) of CD11c+Ly6c cells in the tumor is increased. A A B C B A Trastuzumab 0 5 10 15 % CD45+CD11b+CFSE+ 0 AntiCD47 5 10 15 % CD45+CD11b+CFSE+ SIRPα Partially Blocking Ab 0 5 10 15 % CD45+CD11b+CFSE+ SIRPα Fully Blocking Ab 0 5 10 15 % CD45+CD11b+CFSE+ 0 10 20 30 % >5 Divisions 40 A) To diminish the effects of Fc binding, we altered the antiSIRPα and antiPD1 antibodies to include the D265A mutation, which nullifies Fc binding. C57BL6 mice were implanted with MC38 tumors. Biweekly intratumoral injections of 180µg antiSIRPα +/ weekly injections of 50µg PD1 (RMP114D265A) were initiated 5 days after tumor implantation and sustained for 3 weeks. B) 5e5 4T1 tumor cells were implanted into Balb/c mice on day 1. Biweekly IT injections of 200µg antiSIRPα or weekly injections of 200µg PD1 (RMP114) were initiated 8 days after implantation and sustained for 3 weeks. A B Tumor Volume (mm3) 5 10 0 500 1000 1500 15 20 D265A Isotype AntiSIRPαD265A AntiPD1 D265A AntiSIRPαD265A+ AntiPD1 D265A 8 13 0 500 1000 1500 18 23 Isotype AntiSIRPα AntiPD1 AntiSIRPα +AntiPD1 2000 2500 Days Post Tumor Implantation 0 20 40 60 % CD90+ That Are >3 Divisions CFSE 80 0 5 10 15 % SIRPα CD103+ of Ly6cCD11c+ 20 25 30 35 ** ** ** ** * 0 1 3 % Tetramer+ of CD8+ 2 %P15e + CD8+ T Cells 0 1 3 % of CD8+ That Are Tbet+ 2 Tbet+ CD8+ T Cells 4 0 5 15 % of CD8+ That Are PD1+ 10 CD8+ PD1+ Cells 20 Full Culture No Tumor in Dish (NonSpecific Expansion) No APCs in Dish Direct Tumor Reactogenicity BMDC Tumor T Cells FSCA CFSE FSCA CFSE FSCA CFSE CONCLUSIONS BACKGROUND METHODS RESULTS Direct tumor reduction by macrophages. Most likely effective in homological tumors where tumors are in suspension without complex architecture and anti tumor antibody is present 0 500 CD86 MFI 1000 1500 2000 Isotype AntiSIRPα AntiSIRPα + AntiPD1 CD86 Expression in Spleen DC1 Abundance in Tumor Combination Combination 0 Minutes 180 Minutes % CFSE Dilute % CFSE Dilute L Isotype AntiSIRPα Tumor Volume (mm 3 ) Percentage composition and absolute numbers of cells in the MC38 Ova (A,B) and MC38 WT+ SL8 (C,D) cultures from Figure 3 D. *p<.05 A B C D * * 0 5 10 15 % CD103 + SIRPα of CD11c+ 0 5000 10000 15000 # CD103 + SIRPα 0 2 4 8 % CD103 + SIRPα of CD11c+ 6 0 2000 4000 6000 # CD103 + SIRPα p=.08 p=.085 % DC1 of Total DC # DC1s in Culture % DC1 of Total DC # DC1s in Culture SIRPα CD47
Transcript of Poster$P516 SIRPα … · Here$we$demonstrate$the$immunomodulatory$effects$of$SIRP α...
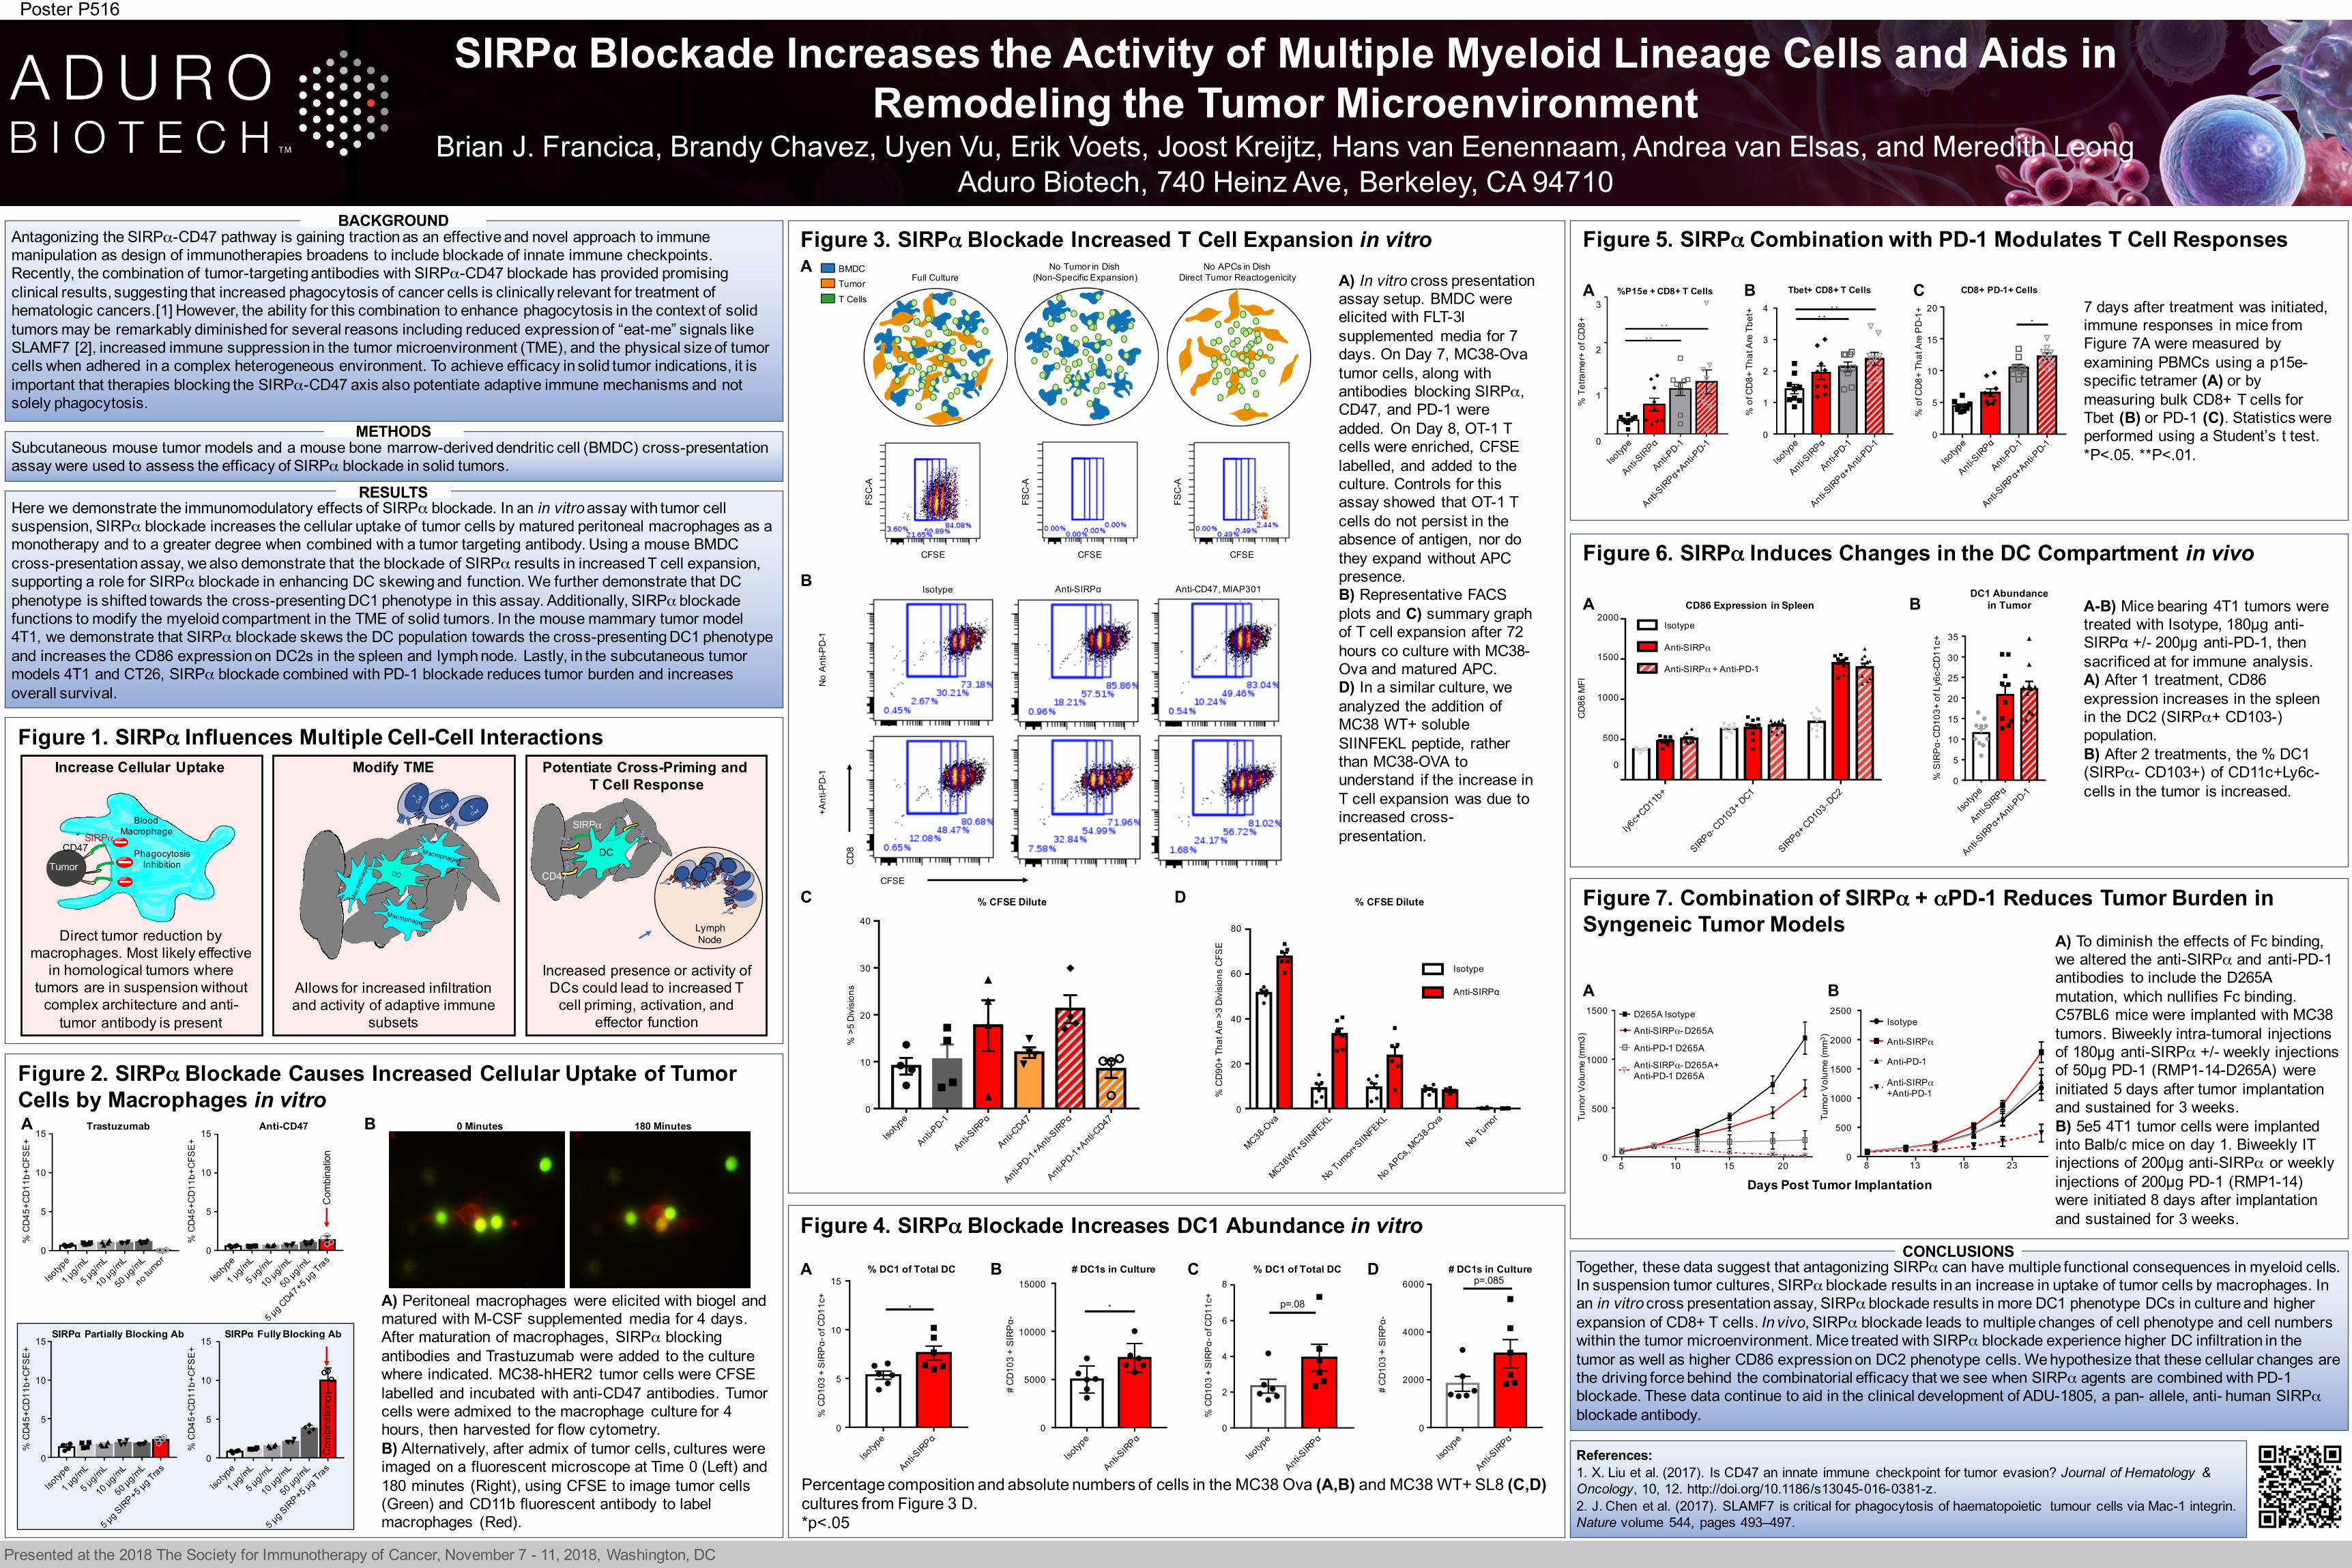
Here we demonstrate the immunomodulatory effects of SIRPα blockade. In an in vitroassay with tumor cell suspension, SIRPα blockade increases the cellular uptake of tumor cells by matured peritoneal macrophages as a monotherapy and to a greater degree when combined with a tumor targeting antibody. Using a mouse BMDC cross-presentation assay, we also demonstrate that the blockade of SIRPα results in increased T cell expansion, supporting a role for SIRPα blockade in enhancing DC skewing and function. We further demonstrate that DC phenotype is shifted towards the cross-presenting DC1 phenotype in this assay. Additionally, SIRPα blockade functions to modify the myeloid compartment in the TME of solid tumors. In the mouse mammary tumor model 4T1, we demonstrate that SIRPα blockade skews the DC population towards the cross-presenting DC1 phenotype and increases the CD86 expression on DC2s in the spleen and lymph node. Lastly, in the subcutaneous tumor models 4T1 and CT26, SIRPα blockade combined with PD-1 blockade reduces tumor burden and increases overall survival.
Subcutaneous mouse tumor models and a mouse bone marrow-derived dendritic cell (BMDC) cross-presentation assay were used to assess the efficacy of SIRPα blockade in solid tumors.
Presented at the 2018 The Society for Immunotherapy of Cancer, November 7 - 11, 2018, Washington, DC
Poster P516
SIRPα Blockade Increases the Activity of Multiple Myeloid Lineage Cells and Aids in Remodeling the Tumor Microenvironment
Brian J. Francica, Brandy Chavez, Uyen Vu, Erik Voets, Joost Kreijtz, Hans van Eenennaam, Andrea van Elsas, and Meredith LeongAduro Biotech, 740 Heinz Ave, Berkeley, CA 94710
Antagonizing the SIRPα-CD47 pathway is gaining traction as an effective and novel approach to immune manipulation as design of immunotherapies broadens to include blockade of innate immune checkpoints. Recently, the combination of tumor-targeting antibodies with SIRPα-CD47 blockade has provided promising clinical results, suggesting that increased phagocytosis of cancer cells is clinically relevant for treatment of hematologic cancers.[1] However, the ability for this combination to enhance phagocytosis in the context of solid tumors may be remarkably diminished for several reasons including reduced expression of “eat-me” signals like SLAMF7 [2], increased immune suppression in the tumor microenvironment (TME), and the physical size of tumor cells when adhered in a complex heterogeneous environment. To achieve efficacy in solid tumor indications, it is important that therapies blocking the SIRPα-CD47 axis also potentiate adaptive immune mechanisms and not solely phagocytosis.
Together, these data suggest that antagonizing SIRPα can have multiple functional consequences in myeloid cells. In suspension tumor cultures, SIRPα blockade results in an increase in uptake of tumor cells by macrophages. In an in vitro cross presentation assay, SIRPα blockade results in more DC1 phenotype DCs in culture and higher expansion of CD8+ T cells. In vivo, SIRPα blockade leads to multiple changes of cell phenotype and cell numbers within the tumor microenvironment. Mice treated with SIRPα blockade experience higher DC infiltration in the tumor as well as higher CD86 expression on DC2 phenotype cells. We hypothesize that these cellular changes are the driving force behind the combinatorial efficacy that we see when SIRPα agents are combined with PD-1 blockade. These data continue to aid in the clinical development of ADU-1805, a pan- allele, anti- human SIRPαblockade antibody.
References:1. X. Liu et al. (2017). Is CD47 an innate immune checkpoint for tumor evasion? Journal of Hematology & Oncology, 10, 12. http://doi.org/10.1186/s13045-016-0381-z. 2. J. Chen et al. (2017). SLAMF7 is critical for phagocytosis of haematopoietic tumour cells via Mac-1 integrin. Nature volume 544, pages 493–497.
Figure 1. SIRPα Influences Multiple Cell-Cell Interactions
Figure 2. SIRPα Blockade Causes Increased Cellular Uptake of Tumor Cells by Macrophages in vitro
Figure 3. SIRPα Blockade Increased T Cell Expansion in vitro
Figure 4. SIRPα Blockade Increases DC1 Abundance in vitro
Figure 6. SIRPα Induces Changes in the DC Compartment in vivo
Figure 7. Combination of SIRPα + αPD-1 Reduces Tumor Burden in Syngeneic Tumor Models
Figure 5. SIRPα Combination with PD-1 Modulates T Cell Responses
BloodMacrophage
TumorPhagocytosisInhibition
Increase Cellular Uptake
SIRPα
CD47
DC
Lymph Node
Potentiate Cross-Priming and T Cell Response
Increased presence or activity of DCs could lead to increased T cell priming, activation, and
effector function
z
Modify TME
Allows for increased infiltration and activity of adaptive immune
subsets
A) Peritoneal macrophages were elicited with biogel and matured with M-CSF supplemented media for 4 days. After maturation of macrophages, SIRPα blocking antibodies and Trastuzumab were added to the culture where indicated. MC38-hHER2 tumor cells were CFSE labelled and incubated with anti-CD47 antibodies. Tumor cells were admixed to the macrophage culture for 4 hours, then harvested for flow cytometry.B) Alternatively, after admix of tumor cells, cultures were imaged on a fluorescent microscope at Time 0 (Left) and 180 minutes (Right), using CFSE to image tumor cells (Green) and CD11b fluorescent antibody to label macrophages (Red).
Isotype Anti-CD47, MIAP301Anti-SIRPα
CD8
CFSE
No Anti-PD-1
+Anti-PD-1
A) In vitro cross presentation assay setup. BMDC were elicited with FLT-3l supplemented media for 7 days. On Day 7, MC38-Ova tumor cells, along with antibodies blocking SIRPα, CD47, and PD-1 were added. On Day 8, OT-1 T cells were enriched, CFSE labelled, and added to the culture. Controls for this assay showed that OT-1 T cells do not persist in the absence of antigen, nor do they expand without APC presence.B) Representative FACS plots and C) summary graph of T cell expansion after 72 hours co culture with MC38-Ova and matured APC.D) In a similar culture, we analyzed the addition of MC38 WT+ soluble SIINFEKL peptide, rather than MC38-OVA to understand if the increase in T cell expansion was due to increased cross-presentation.
A
B
C D
7 days after treatment was initiated, immune responses in mice from Figure 7A were measured by examining PBMCs using a p15e-specific tetramer (A) or by measuring bulk CD8+ T cells for Tbet (B) or PD-1 (C). Statistics were performed using a Student’s t test. *P<.05. **P<.01.
B
A-B) Mice bearing 4T1 tumors were treated with Isotype, 180µg anti-SIRPα +/- 200µg anti-PD-1, then sacrificed at for immune analysis. A) After 1 treatment, CD86 expression increases in the spleen in the DC2 (SIRPα+ CD103-) population.B) After 2 treatments, the % DC1 (SIRPα- CD103+) of CD11c+Ly6c-cells in the tumor is increased.
A
A
B C
B
A Trastuzumab
0
5
10
15
% CD45+CD11b+CFSE+
I so ty pe
1 ug /ml
5 ug /ml
1 0u g/ml
5 0u g/ml
n o t umo r
0
5
1 0
1 5
T r a s t u z u m a b
%CD45+CD11b+CFSE+
0
I so ty pe
1 ug /ml
5 ug /ml
1 0u g/ml
5 0u g/ml
5 ug CD4 7+ 5u g Tr as
0
5
1 0
1 5
A n t i - C D 4 7
%CD45+CD11b+CFSE+
Anti-CD47
5
10
15
% CD45+CD11b+CFSE+
I so ty pe
1 ug /ml
5 ug /ml
1 0u g/ml
5 0u g/ml
5 ug S
I RP+ 5u g Tr as
0
5
1 0
1 5
S I R P a P a r t i a l l y B l o c k i n g A b
%CD45+CD11b+CFSE+
I so ty pe
1 ug /ml
5 ug /ml
1 0u g/ml
5 0u g/ml
5 ug S
I RP+ 5u g Tr as
0
5
1 0
1 5
S I R P a F u l l y B l o c k i n g A b
%CD45+CD11b+CFSE+
SIRPα Partially Blocking Ab
0
5
10
15
% CD45+CD11b+CFSE+
SIRPα Fully Blocking Ab
0
5
10
15
% CD45+CD11b+CFSE+
0
10
20
30
% >5 Divisions
40
A) To diminish the effects of Fc binding, we altered the anti-SIRPα and anti-PD-1 antibodies to include the D265A mutation, which nullifies Fc binding. C57BL6 mice were implanted with MC38 tumors. Biweekly intra-tumoral injections of 180µg anti-SIRPα +/- weekly injections of 50µg PD-1 (RMP1-14-D265A) were initiated 5 days after tumor implantation and sustained for 3 weeks.B) 5e5 4T1 tumor cells were implanted into Balb/c mice on day 1. Biweekly IT injections of 200µg anti-SIRPα or weekly injections of 200µg PD-1 (RMP1-14) were initiated 8 days after implantation and sustained for 3 weeks.
A B
Tumor Volume (mm3)
51 0 1 5 2 0
0
5 0 0
1 0 0 0
1 5 0 0
D a y s P o s t T u m o r I m p l a n t a t i o n
Tumor Volume (mm
3)
D 2 6 5 a I s o t y p e
A n t i - S I R P a - D 2 6 5 A
A n t i - P D - 1 D 2 6 5 A
A n t i - S I R P a - D 2 6 5 A +
A n t i - P D - 1 D 2 6 5 A
5 100
500
1000
1500
15 20
D265A Isotype
Anti-SIRPα- D265A
Anti-PD-1 D265A
Anti-SIRPα- D265A+Anti-PD-1 D265A
81 3 1 8 2 3
0
5 0 0
1 0 0 0
1 5 0 0
2 0 0 0
2 5 0 0I s o t y p e
A n t i - S I R P a
A n t i - P D - 1
A n t i - S I R P a
+ A n t i - P D - 1
8 130
500
1000
1500
18 23
Isotype
Anti-SIRPα
Anti-PD-1
Anti-SIRPα+Anti-PD-1
2000
2500
Days Post Tumor Implantation
I sot ype
Ant i- PD- 1
Ant i- SI RPa
Ant i- CD4 7
Ant i- PD- 1+ A
nt i- SI RPa
Ant i- PD- 1+ A
nt i- CD4 7
0
1 0
2 0
3 0
4 0
%>5 Divisions
0
20
40
60
% CD90+ That Are >3 Divisions CFSE
80
I sot ype
Ant i- SI RPa
Ant i- SI RPa +Ant i- PD- 1
0
5
1 0
1 5
2 0
2 5
3 0
3 5
%SIR
Pa-C
D103+
of Ly6c-C
D11c+
0
5
10
15
% SIRPα-CD103+ of Ly6c-CD11c+
20
25
30
35
I sot ype
Ant i- SI RPa
Ant i- PD- 1
Ant i- SI RPa +Ant i- PD- 1
0
1
2
3
P 1 5 e R e s p o n s e s
%Tetramer+
of C
D8+
* *
* *
I sot ype
Ant i- SI RPa
Ant i- PD- 1
Ant i- SI RPa +Ant i- PD- 1
0
1
2
3
4
% C D 8 t h a t a r e T b e t +
% of CD8- th
at are
Tbet+
* ** *
I sot ype
Ant i- SI RPa
Ant i- PD- 1
Ant i- SI RPa +Ant i- PD- 1
0
5
1 0
1 5
2 0
T C e l l A c t i v a t i o n
%of CD8 that are
PD-1+
*
0
1
3
% Tetramer+ of CD8+
2
%P15e + CD8+ T Cells
0
1
3
% of CD8+ That Are Tbet+
2
Tbet+ CD8+ T Cells
4
0
5
15
% of CD8+ That Are PD-1+
10
CD8+ PD-1+ Cells
20
Full CultureNo Tumor in Dish
(Non-Specific Expansion)No APCs in Dish
Direct Tumor ReactogenicityBMDCTumorT Cells
FSC-A
CFSE
FSC-A
CFSE
FSC-A
CFSE
CONCLUSIONS
BACKGROUND
METHODS
RESULTS
Direct tumor reduction by macrophages. Most likely effective in homological tumors where
tumors are in suspension without complex architecture and anti-tumor antibody is present
l y6 c+ C
D1 1b +
DC1
DC2
0
5 0 0
1 0 0 0
1 5 0 0
2 0 0 0
D 1 0 S p l e e n C D 8 6
CD86 MFI
I s o t y p e
A n t i - S I R P a
A n t i - S I R P a + A n t i - P D - 1
0
500
CD86 MFI
1000
1500
2000Isotype
Anti-SIRPα
Anti-SIRPα+ Anti-PD-1
CD86 Expression in SpleenDC1 Abundance
in Tumor
Combination
Combination
0 Minutes 180 Minutes
% CFSE Dilute % CFSE Dilute
MC 38 -Ov a
MC 38WT +S IINF EK L
N o Tumo r+ SIINF EK L
N o AP Cs , MC 38 -Ov a
N o Tumo r
0
20
40
60
80
%CD90+ that are >3 divisions CFSE
Is o ty p e
A n ti-S IR P a
% C FSE D ilu te
Isotype
Anti-SIRPα
Tumor Volume (mm3 )
Percentage composition and absolute numbers of cells in the MC38 Ova (A,B) and MC38 WT+ SL8 (C,D)cultures from Figure 3 D.*p<.05
A B C D
I sot ype s
Ant i- SI RPa
0
5
1 0
1 5
%CD103+SIR
Pa- of CD11c+
*
I sot ype s
Ant i- SI RPa
0
5 0 0 0
1 0 0 0 0
1 5 0 0 0
# C
D103+SIR
Pa- in culture
*
I sot ype s
Ant i- SI RPa
0
2
4
6
8
%CD103+SIR
Pa- of CD11c+
P = . 0 8
I sot ype s
Ant i- SI RPa
0
2 0 0 0
4 0 0 0
6 0 0 0
#CD103+SIR
Pa- in culture
p = . 0 8 5
0
5
10
15
% CD103 + SIRPα-of CD11c+
0
5000
10000
15000
# CD103 + SIRPα-
0
2
4
8
% CD103 + SIRPα-of CD11c+
6
0
2000
4000
6000
# CD103 + SIRPα-
p=.08
p=.085% DC1 of Total DC # DC1s in Culture % DC1 of Total DC # DC1s in Culture
SIRPαCD47
![Targeting macrophage checkpoint inhibitor SIRPα for anticancer … · 2020. 6. 18. · lymphocyte–associated protein 4 [CTLA-4] and programmed death 1 [PD-1]), or their ligands](https://static.fdocument.org/doc/165x107/5fd9a9e449b9f25d9f5898e6/targeting-macrophage-checkpoint-inhibitor-sirp-for-anticancer-2020-6-18-lymphocyteaassociated.jpg)