The immunomodulatory effects of Interferon β in the ApdE9 ...
90
Aus der Klinik für Neurologie Universitätsklinikum des Saarlandes, Homburg/Saar Direktor: Prof. Dr. med. Klaus Faßbender The immunomodulatory effects of Interferon β in the ApdE9 transgenic mouse model - a potential therapeutic strategy against Alzheimer’s disease Dissertation zur Erlangung des Grades eines Doktors der Medizin Der Medizinischen Fakultät Der UNIVERSITÄT DES SAARLANDES 2013 vorgelegt von Jenny Schmidt Geboren am 26. Oktober 1985 in Dresden
Transcript of The immunomodulatory effects of Interferon β in the ApdE9 ...
Aus der Klinik für Neurologie
Universitätsklinikum des Saarlandes, Homburg/Saar
Direktor: Prof. Dr. med. Klaus Faßbender
The immunomodulatory effects of Interferon β in the ApdE9
transgenic mouse model
- a potential therapeutic strategy against Alzheimer’s disease
Dissertation
zur Erlangung des Grades eines Doktors der Medizin
Der Medizinischen Fakultät
Der UNIVERSITÄT DES SAARLANDES
2013
vorgelegt von
Jenny Schmidt
Geboren am 26. Oktober 1985 in Dresden
2
TABLE OF CONTENTS
1. Abbreviations 4
2. Summary 6
3. Zusammenfassung 7
4. Introduction 9 4.1. Alzheimer’s disease (AD) 9
4.1.1. Clinical presentation 9 4.1.2. Genetics 10 4.1.3. Epidemiology and risk factors 10 4.1.4. Impact of Alzheimer’s disease 11 4.1.5. Diagnosis 11 4.1.6. Management 12
4.2. Pathology and hallmarks of Alzheimer’s disease 13 4.2.1. Neurofibrillary tangles 13 4.2.2. Senile plaques 14
4.3. Pathogenesis of Alzheimer’s disease based on the amyloid hypothesis 14
4.4. The interaction between AD pathology and inflammation 18
4.5. Microglia in AD 19
4.5.1. Activation and contribution to neurodegeneration in AD 19 4.5.2. Beneficial role of microglial activation 22 4.5.3. Interaction of activated microglia with adaptive immunity 23 4.5.4. Microglial differentiation 23
4.6. Interferon β 25
5. Aim of the study 27
6. Materials and methods 28
6.1. Reagents and chemicals 28
6.2. Antibodies 30
6.3. Buffers and solutions 30
6.4. Equipment 33
6.5. Experimental assignment 33 6.5.1. Animals 33 6.5.2. Treatment regime 34 6.5.3. Perfusion 35
6.6. Preparation of the material for histological analysis 35 6.6.1. Fixation 35 6.6.2. Embedding 36 6.6.3. Sectioning 37
3
6.7. General principle of immunohistochemistry 37 6.7.1. Antibodies 37 6.7.2. Methods of antigen detection 38 6.7.3. Immunoenzymatic staining 38 6.7.4. Controls 39
6.8. Staining by immunohistochemistry 40
6.8.1. Deparaffinization 40 6.8.2. Antigen retrieval 40 6.8.3. Blocking 41 6.8.4. Antibody incubation 41 6.8.5. Development of the dye 42 6.8.6. Counterstaining 43 6.8.7. Mounting 43
6.9. Immunohistochemistry on paraffin sections 43
6.9.1. IHC staining of amyloid β deposits 44 6.9.2. IHC double staining of IBA-1 positive microglia and amyloid β deposits 44 6.9.3. IHC doublestaining of GFAP positive astrocytes and amyloid β deposits 45
6.10. General histology of paraffin sections 46
6.10.1. Staining by Luxol fast blue / periodic acid Schiff (LFB/PAS) 46 6.10.2. Bielschowsky’s silver staining 46
6.11. Western blot analysis 47
6.12. Analysis by real-time PCR 49
6.12.1 RNA isolation 49 6.12.2 cDNA synthesis 49 6.12.3 real-time PCR 49
7. Results 50
7.1. Amyloid β plaque deposition after IFN-β treatment 50
7.2. IBA-1 positive microglia at plaque site after IFN-β treatment 53
7.3. GFAP positive astrocytes at plaque site after IFN-β treatment 56
7.4. Analysis of demyelination after IFN-β treatment 57
7.5. Analysis of axonal integrity after IFN-β treatment 58
7.6. Semi-quantitative analysis of amyloid β after IFN-β treatment by western blotting 63
7.7. Tanscription levels of inflammatory mediators and components of the immune and CNS repair system after IFN-β treatment 67
8. Discussion 74
9. References 80
10. Acknowledgements 89
11. Curriculum vitae 90
4
1. ABBREVIATIONS
AB antibody
AD Alzheimer’s disease
ADRDA Alzheimer’s Disease and Related Disorders Association
AG Antigen
AICD APP intracellular domain
AP alkaline phosphatase
APC’s antigen presenting cells
APOE Apolipoprotein E
APP Amyloid precursor protein
Aβ Amyloid-β
BACE1 β-site APP cleaving enzyme 1
BBB Blood-brain barrier
BDNF brain derived neurotrophic factor - 5
CD Cluster of Differentitation
CNS Central nervous system
CSF Cerebrospinal fluid
CTF C-terminal fragment
DAB diaminobenzidine
DSM-IV Diagnostic and Statistical Manual of Mental Disorders, Fourth Edition
EOAD Early-onset Alzheimer’s disease
ECF Extra cellular fraction
ECS Extra cellular space
FAD Familial Alzheimer disease
FcR Fc receptor
GDNF glial-derived neurotrophic factor
GFAP Glial fibrillary acidic protein
HIER heat-induced epitope retrieval
HRP horseradish peroxidase
IBA-1 ionized calcium binding adaptor molecule 1
ICF Intra cellular fraction
ICS Intra cellular space
IFN Interferon
5
IFNAR Interferon-α receptor
IHC immunohistochemistry
IL Interleukin
iNOS inducible nitric-oxide synthase
IP intraperitoneal
ISG interferon-stimulated genes
LFB Luxol fast blue
MAC membrane attack complex
MF Membrane fraction
MHC II Major histocompatibility complex type II
MMSE Mental Status Examination
MRI Magnetic resonance imaging
MS Multiple sclerosis
NADPH nicotinamide adenine dinucleotide phosphate-oxidase
NFκB Nuclear factor kappa B
NINCDS National Institute of Neurological and Communicative Disorders and Stroke
NMDA N-methyl-D-aspartate
NO Nitric oxide
PAS Periodic acid Schiff
PET Positron emission tomography
PPARγ Peroxisome proliferator-activated-receptor
PS-1 Presenilin 1
PS-2 Presenilin 2
RAGE receptor for advanced glycation end products
sAPPα soluble ectodomain fragment of APP after cleavage by secretase α
SR scavenger receptor
TLR4 Toll-like receptor 4
TNF tumour-necrosis factor
6
2. SUMMARY
Alzheimer’s disease is the most common form of dementia characterized by a chronic and
progressive deterioration of memory and other cognitive functions. In the inevitable course of the
disease patients ultimately present an almost complete loss of their intellectual functions and they
become dependent on constant nursing care. More than 35 million people have been affected
worldwide in 2010, a number which is associated with a remarkable socio-economic impact
especially in countries of the developed world. Despite intensive investigations the precise
mechanism of the disease pathogenesis is not yet fully understood and a drug that would be able to
cure or alter the progressive course of the disease remains to be discovered.
According to the amyloid hypothesis AD originates from the imbalance of production and clearance
of amyloid β. Activation of a broad inflammatory response is regarded as an important feature of the
disease that might actively contribute to its pathogenesis. Microglia are the main inflammatory cells
of the central nervous system. This study investigated whether immunomodulative interferon β (IFN-
β) treatment could influence the disease pathophysiology by enhancing microglial phagocytotic
activity in vivo. Transgenic ApdE9 mice and respective wild type controls were treated with IFN-β or
phosphate buffered saline. The treatment was initiated prior onset of the disease until its
manifestation. Brains of the sacrificed animals were prepared for immunohistochemical stainings to
study the effect of IFN-β on the amyloid plaque load and the activation of inflammatory cells such as
microglia and astrocytes. Further, data of western blotting samples against Aβ and transcription
levels of inflammatory mediators and glial cell components have been evaluated.
Analyses of stained sections demonstrated a dose dependent effect of IFN-β treatment. High doses
IFN-β was associated with a moderate reduction in the number of stained plaque deposits. Effects on
glial cells included an increase in the number of microglia and astrocytes at sites of plaque deposits.
Western blot analysis and the results of the real time PCR did not provide an explanation for the
underlying mechanism of this finding. The mice did not present evident brain structural alterations
such as axonal damage or demyelination thus a therapeutic effect of IFN-β could not be assessed.
The study provides first data indicating possible immunomodulatory effects of IFN-β on AD pathology
in vivo. The obtained results suggested a dose depended effect on the amyloid plaque load and
colocalised glial cell activity.
7
3. ZUSAMMENFASSUNG
Die Alzheimer Erkrankung stellt die häufigste Form der Demenzen dar und ist durch einen chronisch,
zunehmenden Verlust von Merkfähigkeit sowie anderen kognitiven Fähigkeiten gekennzeichnet. Im
Verlauf der Erkrankung erleiden die Betroffenen einen fast vollständigen Verlust ihrer intellektuellen
Fähigkeiten und sind auf permanente Pflege angewiesen. 2010 waren weltweit mehr als 35 Millionen
Menschen betroffen. Diese Zahl ist vor allem für Industrieländer von erheblicher sozial-ökonomischer
Bedeutung. Trotz intensiver Forschung konnte der zu Grunde liegende pathophysiologische
Zusammenhang bisher nicht vollständig geklärt werden. Auch eine medikamentöse Therapie, welche
die Alzheimer Erkrankung heilen oder ihren progedienten Verlauf beeinflussen könnte, bedarf noch
der Entwicklung.
Gemäß der Amyloid Hypothese entwickelt sich die Alzheimer Erkrankung auf der Basis eines
Ungleichgewichts bezüglich der Produktion und der Beseitigung von Amyloid β. Die Aktivierung einer
umfassenden Entzündungsreaktion wird als ein bedeutendes Merkmal angesehen, welche zur
Manifestation der Erkrankung beitragen könnte. Mikroglia stellen die primären Immunzellen des
Zentralnervensystems dar. Die vorliegende hat Arbeit untersucht, ob eine immunomodulative
Therapie mit Interferon β (IFN-β) die Krankheitsentstehung in vivo beeinflussen könnte. Transgene
ApdE9 Mäuse und entsprechende Kontrolltiere wurden jeweilig mit IFN-β oder Phosphatgepufferter
Salzlösung (PBS) behandelt. Die Versuchstiere wurden vor Beginn der Erkrankung bis zur ihrer
Manifestation behandelt. Die Gehirne der Versuchstiere wurden nach Präparation zur
anschließenden immunhistochemischen Färbungen vorbereitet, mit Hilfe deren untersucht wurde,
ob IFN-β die Amyloid-Plaque-Last und die Aktivierung von Immunzellen wie Mikroglia und Astrozyten
beeinflusst. Zusätzlich wurden Daten von der Westernblotuntersuchungen zu Aβ und den
Transkiptionsniveaus von inflammatorischen Mediatoren und Gliazellbestandteilen bewertet.
Die Analyse der gefärbten Präparate zeigte eine dosisabhängige Wirkung durch IFN-β. Die
Behandlung mit hochdosiertem IFN-β war verbunden mit einer moderaten Reduktion der gefärbten
Plaqueablagerungen. Die Wirkung auf Gliazellen beinhaltete eine Zunahme von Mikroglia und
Astrozyten im Bereich um die Plaqueablagerungen. Die Westernblotanalysen und die Ergebnisse der
real-time PCR konnten keine Erklärung für den zugrundeliegenden Mechanismus beisteuern.
Hirnstrukturelle Veränderungen wie Axonenschädigung oder Demyelinisierung wiesen die
Versuchstiere nicht auf, so dass eine therapeutische Beeinflussung dieser durch IFN-β nicht beurteilt
werden konnte.

8
Die Arbeit liefert erste Erkenntnisse zum Zusammenhang einer möglichen immunmodulativen
Wirkung von IFN-β auf die Alzheimer Pathologie in vivo. Die Ergebnisse legen einen dosisabhängigen
Effekt auf die Plaquezahl sowie assoziierte Gliazellaktivität nahe
9
4. INTRODUCTION
4.1. Alzheimer Disease (AD)
Alzheimer’s disease (AD) is the most common form of dementia (Querfurth HW et al. 2010). The
disease leads to acquired cognitive and behavioural impairment that interferes with the social and
occupational functioning of the individual (Medscape of WebMD Health Professional Network LLC.).
During the inevitable course of the disease affected people become fully dependent on assistance
and nursing care. AD implicates a high burden to patients, caregivers and the society (Citron M 2010).
There are expected 35 million people affected with AD worldwide in 2010 (Querfurth HW et al.
2010). The socio-economic impact of dementia disorders is already nowadays enormous with
approximate world costs of US$ 604billion in 2010 (Wimo A et al. 2010). The number of people
suffering from dementia is thought to almost double with every 20 years leading to estimated 115
million people in 2050 (Prince M et al. 2009). At present, none of the approved medications is able to
cure AD or likely to alter the progressive course (Citron M 2010, Yaari R et al. 2007). Investigation in
more effective treatment alternatives is therefore important to limit the impact of an aging
population which is linked with an increasing number of AD patients (Wimo et al. 2010).
4.1.1. Clinical presentation
AD is a slowly progressive disorder that commonly presents with an insidious onset of gradual and
chronic impairment of memory (Blennow K et al. 2006, Yaari R et al 2007). The memory decline
concerns first the anterograde memory and leads by disease progression to retrograde amnesia
(Rowland LP et al. 2005). Apathy and depression can coexist especially during the early phase of the
disease (Alzheimer’s association 2010). The full picture of AD includes diverse clinical features due to
dysfunction of widespread areas of the cerebral cortex. The cognitive decline can cause language
difficulties, disorientation, visuospatial dysfunction, apraxia, agnoisa and dysfunction of executive
function and affect calculation, judgement and decision-making (Yaari R et al 2007). Aphasie causes
an incoherent speech pattern (Fowler TJ et al. 2003). The loss of the spatial and topographical sense
and the abstract reasoning result in the characteristic disorientation of patients (Rowland LP 2005,
Fowler TJ et al. 2003). Confusion and the impaired concentration and executive skill make
constructional tasks difficult and the patient dependent on support. Besides the cognitive decline, AD
patients show frequently behavioural and psychotic symptoms such as aggression, agitation,
insomnia, delusion, hallucinations and psychotic episodes (Blennow K et al. 2006, Yaari R et al 2007).
These symptoms affect the life quality of patients and care givers and contribute further to the care
burden and economical cost (Blennow K et al. 2006). Many AD patients of terminal state show an
10
almost complete loss of the intellectual functions and are bedridden due to severe motor disabilities,
spasticity and the loss of primitive reflexes (Citron M 2010, Fowler TJ et al. 2003). The course of AD
from diagnosis until death lasts from 3 to 9 years (Querfurth HW et al. 2010). Mortality in AD patients
derives commonly from intercurrent infections as especially pneumonia or sepsis but also from
inanition, stroke, respiratory and cardiovascular diseases (Ropper AH et al. 2009, Dickson DW 2003).
4.1.2. Genetics
There exist two forms of AD. Familial Alzheimer disease (FAD) is a rare autosomal-dominant inherited
condition that accounts for less than 5% of the clinical cases of AD (Yaari R et al. 2007). FAD is also
referred as early-onset AD (EOAD) as it shows an aggressive course of the disease with an onset of
first symptoms possible during the third decade (Medscape of WebMD Health Professional Network
LLC.), mostly between 40-60years (Yaari R et al. 2007). Mutations in three genes have been identified
to be responsible for 90% of EOAD cases: the amyloid precursor protein (APP), presenilin 1 (PS-1) and
presenilin 2 (PS-2) (Citron M 2010, Yaari R et al. 2007). However, the majority of Alzheimer patients
arise from the sporadic form of the disease or late-onset AD. Sporadic AD is characterised by an
onset of symptoms after the age of 65 years (Thal DR et al. 2005, Alzheimer’s association 2010). The
cause for this common form of AD remains unknown but a heterogeneous aetiology, based on aging
in concert with complex interactions of genetic and environmental factors is assumed (Blennow K et
al. 2006).
4.1.3. Epidemiology and risk factors
AD is the most common cause of dementia, accounting for 50-60% of the cases (Blennow K et al.
2006). The single most important risk factor for AD is advance in age (Yaari R et al. 2007). The
prevalence of AD in individuals younger than 65 is less than 1% and often suggested to be caused
genetically in the context of EOAD (Rowland LP 2005, Prince M et al. 2009). From the age of 65 years
the prevalence shows an almost exponential increase with age (Blennow K et al. 2006) as it doubles
with every five years (Prince M et al. 2009). According to a study by the Robert Koch institute there
are about 1 billion individuals amongst the 65years aged and older who are affected by dementia in
Germany and they estimate the incidence will account for about 200.000 new cases every year
(Weyerer S 2005). A positive family history of AD is the second most important risk factor. A first
degree relative affects the individual risk for AD by a 3-4 fold, age corrected increase (Yaari R et al.
2007). An important genetic susceptibility risk factor for sporadic AD has been identified with a
genetic polymorphism of the apolipoprotein E (APOE) gene status (Blennow K et al. 2006, Citron M
2010, Prince M et al. 2009, Yaari R et al. 2007). APOE is a protein involved in the cholesterol transport

11
in the brain. The ε4 allele of the APOE gene increases the risk to develop AD in a dose dependent
manner by three times in heterozygotes and by 15 times in homozygotes (Blennow K et al. 2006,
Yaari R et al. 2007). The gender difference of women comprising for two third of the clinical cases of
AD is thought to derive mainly from longer life expectancy (Weyerer S 2005). Strong evidence
associates AD with cardiovascular and cerebrovascular risk factors such as cigarette smoking, midlife
high blood pressure, obesity, dyslipidemia and diabetes (Fassbender K et al. 2008, Prince M et al.
2009). Epidemiological studies point also towards depression, traumatic head injuries and profuse
alcohol consumption as risk factors for AD. A reduced risk for AD seems to derive from anti-
inflammatory medication and a beneficial role has been observed with some psychosocial factors
such as high education, physical exercise and mental activity (Citron M 2010, Fassbender K 2008).
4.1.4. Impact of AD
The annual economic costs of dementia worldwide are estimated US$ 315 billion (Prince M 2009).
72% of the costs are allotted to high income countries like Europe (Wimo A et al. 2010). The
“informal costs” of AD due to limited capabilities of diseased and care provided by families is
predicted to have an increasing impact on national budgets in future (Prince M 2009). Besides the
consequences on the health and social care systems worldwide and the effects on patients, AD
implicates the health of care givers. Carers of demented people are twice as likely to develop sings of
psychiatric illnesses and a major depression can be diagnosed in about 15 to 30%. Consequences on
physical health of strained carer are likely as they show an impaired immunity and a higher mortality
rate (Wimo A et al. 2010).
4.1.5. Diagnosis
The definite diagnosis of AD relies on a neurohistopathological analysis that remains to be the gold
standard (Bird TD et al. 2010, Blennow K et al. 2006). In this examination a clinical AD diagnosis is
verified post mortem through the detection of typical AD hallmark lesions in exceeding number
compared to age matched controls without dementia (Bird TD et al. 2010). In contrast, the clinical
diagnosis is based on the medical history and findings from clinical, neurological and psychiatric
examinations (Blennow K et al. 2006). Memory loss and disturbance in other cognitive spheres is
assessed by an initial testing of attention, orientation, concentration, the recent and remote
memory, language, calculation, praxis, judgement, executive and visuospatial abilities (Yaari R et al.
2007, Medscape of WebMD Health Professional Network LLC.). Therefore the Mini-Mental Status
Examination (MMSE) constitutes a useful tool for a brief mental state screening. The most commonly
used criteria for diagnosis of AD are provided by the NINCDS-ADRDA (National Institute of
12
Neurological and Communicative Disorders and Stroke and the Alzheimer’s Disease and Related
Disorders Association) and the DSM-IV (Diagnostic and Statistical Manual of Mental Disorders, Fourth
Edition) (Yaari R et al. 2007). Both criteria demand the exclusion of other possible causes for a
demented condition as for instance delirium, neoplasma, infection, metabolic disorders, vitamin
deficiency, toxic metabolits and other intracerebral or internal diseases (Schmidtke K et al. 2008,
Yaari R et al. 2007, Medscape of WebMD Health Professional Network LLC.,). By neuroimaging and
laboratory testing such reason can be ruled out and clinical diagnosis, verified by histological analysis
shows 80-90% accuracy (Bird TD et al. 2010, Schmidtke K et al. 2008). Additional tests including
analysis of the cerebrospinal fluid (CSF), scanning of the cerebral glucose-PET metabolism, genetic
testing or measurement of hippocampal atrophy play a minor role in the clinical routine (Schmidtke K
et al. 2008). The prospect on CSF biomarkers promises value in the detection of incipient stages and
for the discrimination of AD from other forms of dementia (Blennow K et al. 2006).
4.1.6. Management
The management of AD is based on supportive care, assisted living and symptomatic drug treatment
of AD specific cognitive disturbance and coexisting behavioural signs (Bird TD et al. 2010, Blennow K
et al. 2006). Acetylcholine inhibitors and the NMDA (N-methyl-D-aspartate) receptor antagonist
memantine are drugs that address the neurotransmitter disturbance in the AD brain. It is
hypothesized that the degradation of cholinergic neurons results in acetylcholine deficiency in the AD
brain contributing to memory disturbance and cognitive symptoms (Blennow K et al. 2006).
Acetylcholinesterase inhibitors address the enzymatic degradation of the neurotransmitter in the
synaptic cleft and thus enhance cholinergic neurotransmission (Blennow K et al. 2006, Yaari R et al.
2007). The therapy shows a modest positive effect on cognitive, functional and behavioural
symptoms and is currently approved for mild to moderate AD (Blennow K et al. 2006, Fassbender K
et al. 2008). Glutamate is a major excitatory neurotransmitter that binds to the NMDA receptor in
processes of learning and memory (Blennow K et al. 2006). Binding of glutamate to the NMDA
receptor of neurons causes the opening of calcium channels. In diseased neurons an increased influx
of calcium ions can occur resulting in neuronal damage by excitotoxicity (Fassbender K et al. 2008).
Memantin is a non-competitive NMDA-receptor antagonist that binds to the receptor during
activation, modulates the ionic influx and thereby protects neurons from glutamate mediated
neurotoxicity. Memantine is approved for the therapy of moderate to severe AD where it shows
modest benefits on cognitive and behavioural symptoms (Blennow K et al. 2006, Fassbender K et al.
2008). Aggressive behaviour, psychomotoric agitation and psychosis occur frequently, especially in
the late stage of AD. Atypical antipsychotic drugs are preferably used for their management whereas
anticonvulsants comprise treatment alternatives (Blennow K et al. 2006).
13
4.2. Pathology and hallmarks of AD
AD pathology is characterized macroscopically by progressive cerebral atrophy with subsequent
enlargement of cortical sulci and the ventricle system (Bernreuther C et al. 2006). Atrophy results
from synaptic and neuronal loss on the cellular level. The neurodegenerative changes show a specific
pattern of distribution by disease progression. Initial changes occur in the medial temporal structures
of the hippocampus, the entorhinal cortex and amygdala and they expand to the neocortical
association region (neural.net. Measuring brain atrophy in Alzheimer’s disease 2003). Degeneration
of cholinergic basal forebrain neurons within the medial septum and the nucleus basalis of Meynert
leads to cholinergic hypofunction and hence to cognitive decline and profound dementia (Sastre M et
al. 2006). The degree of atrophy has been shown to correlate with the severity of pathological
changes within the brain tissue (neural.net. Measuring brain atrophy in Alzheimer’s disease 2003).
The AD typical histological findings include the two hallmark lesions of extracellular deposits of
amyloid-β, forming senile plaques and neurofibrilllary tangles which are composed by intraneuronal
accumulations of abnormal filaments of tau in the context of degeneration of neurons and synapses
(Blennow K et al. 2006, Querfurth HW et al. 2010). The initiation of a broad inflammatory response
including chronic microglia activation upon AD pathology is an important feature of the disease
(Walter S et al. 2007). Nevertheless the pathological changes in the AD brain are complex including
synaptic dysfunction, neuronal and white matter loss, mitochondrial dysfunction, oxidative damage
and vascular pathology (reviewed by Querfurth HW et al. 2010). Several vascular changes might
contribute to the diminished cerebral blood flow in AD. For instance atherosclerotic vascular disease
is suggested to be significantly more pronounced in AD patients (Roher AE et al. 2004) and cerebral
amyloid angiopathy is present in up to 90% (Greenberg SM et al 2004). Evidence further implies
dysfunction of the blood-brain barrier (Roher AE et al. 2004).
4.2.1. Neurofibrillary tangles
Tau pathology and intraneuronal tangles are a hallmark of AD pathology. Though their presence is
not specific for AD as they occur in multiple disorders, the load of tangles and their localization
within the brain tissue correlate strongly with the severity of cognitive dysfunction (Citron M 2010).
Tau protein is the major component of the intraneuronal alterations seen in AD. In a healthy brain,
soluble tau associates to microtubules and stabilizes their structure. By this it supports the formation
of tracts for axonal transport and the cytoskeleton during axonal growth (Blennow K et al. 2006,
Citron M 2010). The typical intraneuronal inclusions in AD are formed by aggregates of abnormal
hyperphosphorylated, insoluble tau filaments (Citron M 2010). Tau phosphorylation is regulated by
multiple kinases and phosphatases. The impact of tau hyperphosphorisation and tangle formation in
14
the pathogenesis of AD is unknown (Blennow K et al. 2006). Nevertheless, formation of
neurofibrillary tangles impairs cellular and synaptic functioning. They are thought to contribute to
the disease by a direct toxic effect of the aggregates and by a destabilizing effect on microtubules,
affecting the axonal transport within the neuron and thus contribute to early neuronal death and
dementia (Blennow K et al. 2006, Citron M 2010, Thal DR et al. 2005).
4.2.2. Senile plaques
Senile plaques are spherical structures in the extracellular space which are mainly composed of
amyloid-β (Aβ) peptides (Hjorth E et al. 2010, Yaari R et al. 2007). Aβ deposits are commonly
surrounded by activated microglia and recruited astrocytes (Sastre M et al. 2008). In AD, senile
plaques exhibit three morphological types: diffuse, neuritic and cored plaques (Giulian D et al. 1995).
Diffuse plaques contain homogeneous deposits of Aβ (Thal DR et al. 2005). They are the only type of
senile plaques which is not associated with activated microglia and they occur also in the brains of
non-demented elderly (Giulian D et al. 1995). Classic neuritic plaques contain a central amyloid core
formed by Aβ peptides which is surrounded by dystrophic nerve endings (neurites) (Blennow K et al.
2006, Yaari R et al. 2007). Plaques that consist merely of an isolated, dense core of amyloid are
designated cored or “burnt-out” plaques (Thal DR et al. 2005). In addition to senile plaques further
depositions of Aβ can be distinguished within the AD brain. They differ in their morphology, by the
density of amyloid, the presence of dystrophic neuritis, the degree of glial cell reaction in the tissue
and their pattern of distribution (Thal DR et al. 2005, Yaari R et al. 2007).
4.3. Pathogenesis of AD based on the amyloid hypothesis
Aβ plaques and Aβ peptides are thought to represent the culprits for the neurodegenerative
processes in AD (Hjorth E et al. 2010). Aβ peptides constitute the major components of plaques and
they derive from catalytic cleavage of APP (Sastre M et al. 2008). APP is a ubiquitously present type I
transmembrane protein (Selkoe DJ 2001). The APP ectodomain serves as cell surface receptor, is
involved in cell adhesion and plays a major role in neurite outgrowth and synaptogenesis during
neuronal development and presumably after traumatic head injury. The APP intracellular domain
regulates APP function and is involved in axonal transport and signalling processes (Zheng H et al.
2006). APP is processed by a group of enzymes, designated secretases. In an amyloidogenic pathway
sequential proteolytic cleavage of APP liberates soluble Aβ peptides from the ectodomain. The
peptides contain mainly 40 (Aβ-40) and 42 (Aβ-42) amino acids of which Aβ-42 is highly fibrillogenic
and regarded as the most toxic isoform (Gandy S, 2005, reviewed by Citron M 2010). Aβ peptides are
prone to self-aggregate, resulting in various coexisting physical structures and finally deposit into
15
insoluble plaques (Hjorth E et al. 2010). Amongst other roles, Aβ oligomers for example can suppress
hippocampal long-term potentiation which is an important process for memory (Walsh DM, 2004).
Further, Aβ oligomers exert direct neurotoxicity and seem to contribute to synaptic dysfunction by a
multitude of mechanisms including NMDA receptor endocytosis, impairment of nicotinic
acetylcholine receptor signalling (Snyder EM, 2005) and by exacerbating the lack of trophic actions by
binding to the receptor of the brain derived neurotrophic factor (BDNF), (Garzon DJ 2007). Other Aβ
peptides assemble to fibrils and arrange themselves into β-pleated sheets which build insoluble
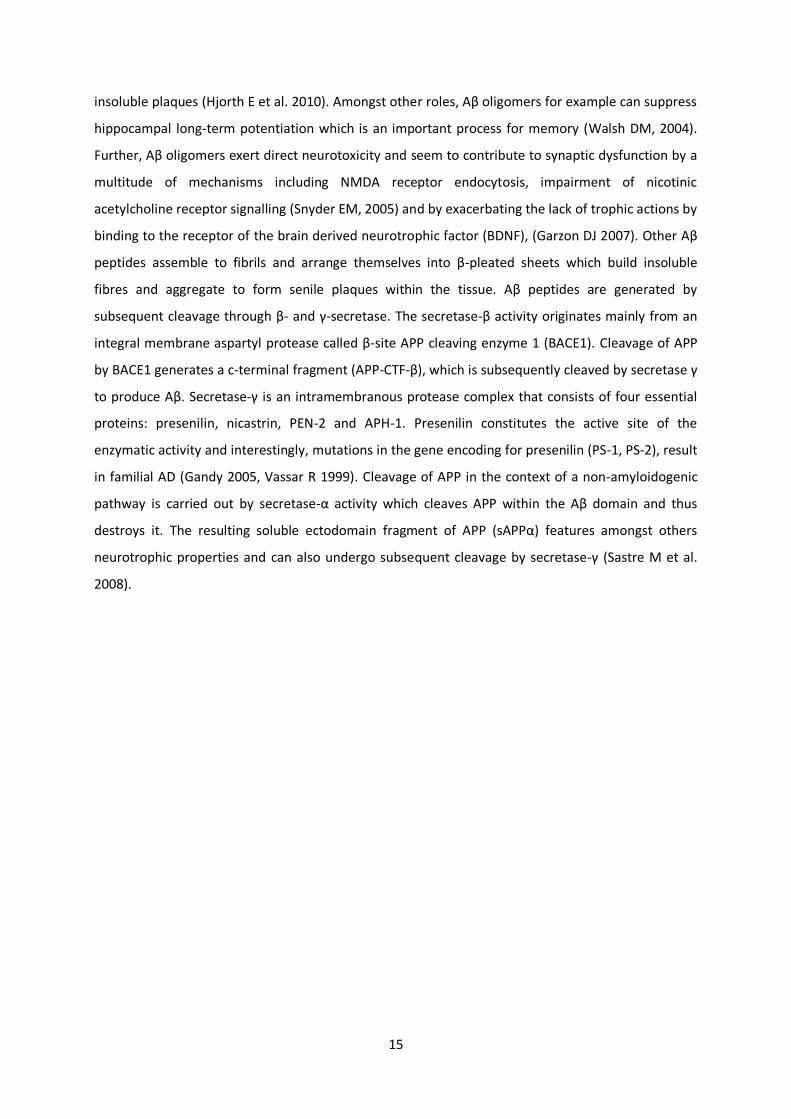
fibres and aggregate to form senile plaques within the tissue. Aβ peptides are generated by
subsequent cleavage through β- and γ-secretase. The secretase-β activity originates mainly from an
integral membrane aspartyl protease called β-site APP cleaving enzyme 1 (BACE1). Cleavage of APP
by BACE1 generates a c-terminal fragment (APP-CTF-β), which is subsequently cleaved by secretase γ
to produce Aβ. Secretase-γ is an intramembranous protease complex that consists of four essential
proteins: presenilin, nicastrin, PEN-2 and APH-1. Presenilin constitutes the active site of the
enzymatic activity and interestingly, mutations in the gene encoding for presenilin (PS-1, PS-2), result
in familial AD (Gandy 2005, Vassar R 1999). Cleavage of APP in the context of a non-amyloidogenic
pathway is carried out by secretase-α activity which cleaves APP within the Aβ domain and thus
destroys it. The resulting soluble ectodomain fragment of APP (sAPPα) features amongst others
neurotrophic properties and can also undergo subsequent cleavage by secretase-γ (Sastre M et al.
2008).
16
APP
sAPPβ
sAPPα
AICD
AICD
P3
APP-CTF-α
APP-CTF-β
amyloidogenic pathway
non-amyloidogenic pathway
α-secretase
β-secretase
= BACE-1
γ-secretase
γ-secretase
Aβ
Figure 4.1 Schematic diagram of APP sequential processing. APP is a transmembrane protein. The Aβ domain within the APP
is partly embedded in the plasma membrane. In the amyloidogenic pathway cleavage of APP by secretases β- (BACE-1) and
γ- results in release of Aβ peptides in the extracellular space (ECS). Cleavage by secretase-α takes place within the Aβ-
sequence and therefore precludes Aβ generation. This is referred as the non-amyloidogenic pathway resulting in the large
soluble APP fragment (sAPPα) and the remaining C-terminal fragment (CTF). CTF’s resulting from α or β- secretase activity
are subsequently cleaved by γ-secretase and the by this remaining APP intracellular domain (AICD) is metabolised in the
cytoplasm. Cleavage of APP-CTF-α by γ-secretase releases a short peptide named p3. ICS = intracellular space.
Aβ is generated constitutively during normal cell metabolism though its function is unknown
(Blennow K et al. 2006, Stromer T et al. 2005). Aβ peptides are usually cleared from the brain by
several mechanisms: Firstly, Aβ peptides are phagocytosed by activated microglia (Sastre M et al.
2008). Aβ peptides are further degraded by enzymes such as the insulin-degrading enzyme,
neprilysin and the endothelin converting enzyme. Moreover cerebral Aβ load is balanced by a regular
transport across the blood-brain barrier (BBB) and Aβ efflux is mediated via a protein related to the
low density lipoprotein receptor (Tanzi RE et al. 2004). The imbalance of Aβ production and clearance
resulting in their aggregation and accumulations to amyloid deposits is understood to be the
initiating factor of a cascade which leads ultimately to degeneration of neurons and AD pathology
(Hardy J, Selkoe DJ 2002). This theory is referred as the “amyloid hypothesis” which is broadly
supported by the genetics of FAD. All mutations associated with FAD (APP, PS-1, PS-2) affect either
ECS
ICS
17
the substrate or the key enzymes of the Aβ metabolism. They enhance the amyloidogenic processing
of APP and even increase the secretion of the aggregation prone Aβ-42 isoform compared to Aβ-40.
Further patients of Down’s disease develop Aβ plaque pathology early in life. These individuals carry
an extra copy of chromosome 21 which harbours the APP gene (Rovelet-Lecrux A et al. 2006). The
finding that the plaque load in AD brains correlates with the severity of dementia provides further
support for the crucial role of Aβ metabolism in the pathogenesis of AD (Blennow K et al. 2006).
Amongst other effects, Aβ peptides and plaques are suggested to cause the neurodegenerative
changes in AD by initiation and maintenance of a broad inflammatory response (Citron M 2010,
Hjorth E et al. 2010). The following chapter highlights the connection of inflammation and AD
pathology, the impacts of an uncontrolled pro-inflammatory milieu and on the other site the
therapeutic potential of a directed immune response.
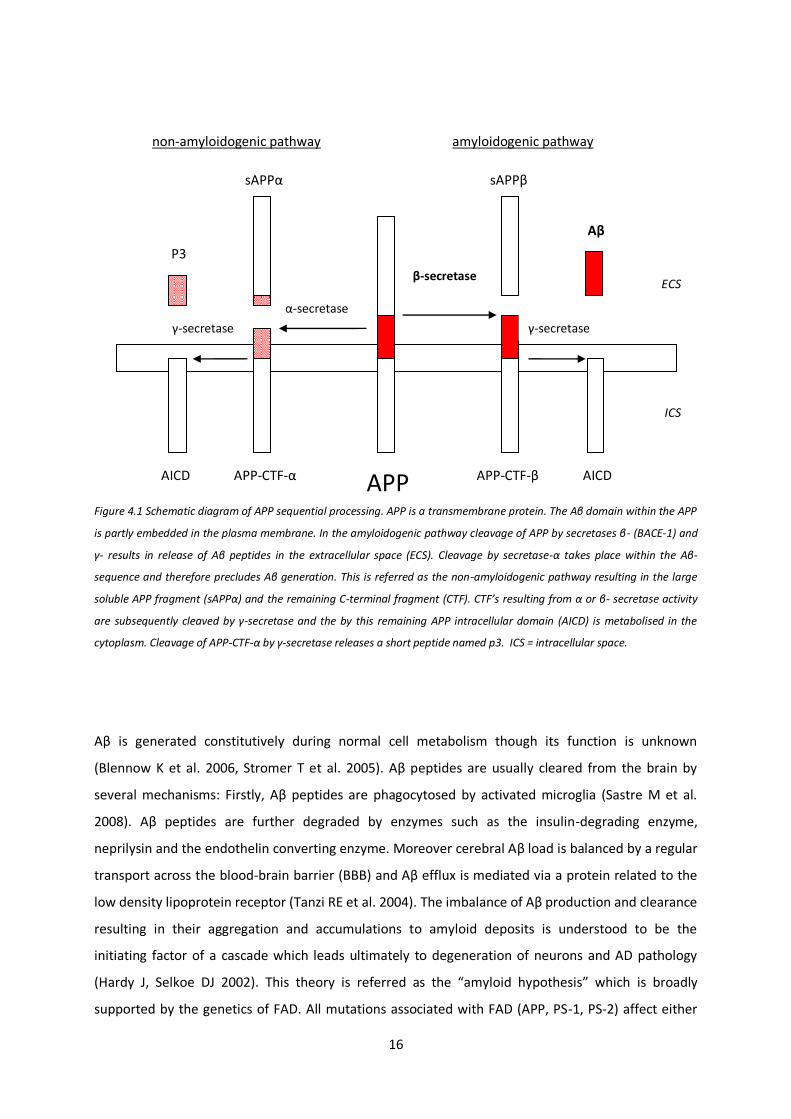
Figure 4.2 Amyloid cascade hypothesis. The imbalance of Aβ production and clearance results in an increased load of Aβ. Aβ oligomers exert direct neurotoxicity. Deposits of Aβ initiate inflammatory and oxidative stress. Impairment of neuronal and synaptic function causes neurotransmitter deficits and cognitive symptoms. Tau pathology and tangle formation is suggested to occur as a downstream event which could contribute neuronal dysfunction and cognitive symptoms (Blennow K et al. 2006).
18
4.4. The interaction between AD pathology and inflammation
Accumulation of abnormal proteins like Aβ and neurofibrillary tangles and stimuli from
neurodegeneration represent initiators of a broad inflammatory process which is thought to lead to
synaptic dysfunction and neuronal cell death by oxidative and inflammatory damage (reviewed by
Akiyama H et al. 2000, reviewed by Querfurth HW et al. 2010). A chronic local inflammatory response
is clearly present in pathologically vulnerable areas of the AD brain. In contrast, brains of non-
demented elderly which contain a sufficient expression of hallmark lesion that would otherwise
justify a diagnosis of AD show drastically less inflammatory markers compared to brains from AD
patients (reviewed by Akiyama H et al. 2000). Astrocytes and microglia are glial cells and important
for maintaining the integrity and homeostasis in the brain (Farfara D et al. 2008). They represent the
main component of inflammation within the central nervous system (CNS) (Hjorth E et al. 2010) and
upon stress they can further mediate the permeability of the BBB to recruit immune cells from the
periphery (Farfara D et al. 2008). Activated microglia and recruited astrocytes cluster commonly at
sites of AD hallmark lesions. Together with neurons they are connected in highly interactive
processes with each other as well as with numerous subsystems of neuroinflammatory mediators
including the complement, cytokines and chemokines, acute phase proteins, excitotoxins, and
inflammatory enzymes, ultimately creating a self-propagating cascade of inflammation (Wyss-Coray
T. et al. 2002, reviewed by Sastre M 2006). Glial cell activation seems to constitute an early event in
the AD, starting even in the absence of focal Aβ deposition. In a transgenic mouse model of AD, focal
glial activation preceded amyloid plaque deposits (Nunomura A et al. 2001) and a clinical PET study
detected microglia activation at a very early stage of AD (Cagnin A et al. 2001).
Inflammation occurs not only secondary to AD pathology but rather interacts with APP metabolism
and Aβ generation. Some cytokines, including Interleukin (IL) -1 and IL-6 which are both up-regulated
in the AD brain, are suggested to increase APP synthesis (Akiyama H et al. 2000, Hjorth E et al. 2010).
Levels and activity of the APP processing enzyme BACE1 are also up-regulated in the AD brain. Also
cultured neurons exposed to pro-inflammatory cytokines and oxidative stress as well as chronic
reactive astroglia express high levels of BACE1 (reviewed by Sastre M et al. 2008). Interestingly,
expression of BACE1 seems to be regulated by transcriptional factors, known to regulate
inflammation. The BACE1 promotor harbours binding sites for NFκB (nuclear factor kappa B) (Bourne
KZ et al. 2007) and for PPARγ (Peroxisome proliferator-activated-receptor) (Sastre M et al. 2003).
NFκB is a prime inflammatory transcription factor. It is indicated to activate BACE1 transcription
(Sastre M et al. 2008) and a further binding site of NFκB exists in the APP gene (Grilli M et al. 1995).
19
PPARγ is suggested to act as a repressor of BACE1. Decreased levels of PPARγ augment BACE1
promotor activity. Inflammatory conditions are suggested to down-regulate PPARγ and indeed,
PPARγlevels are decreased in AD, presenting a condition that could contribute to increased
generation of Aβ (reviewed by Sastre M et al. 2008).
4.5. Microglia in AD
Microglia represent macrophage-derived cells (Farfara D et al. 2008). They are believed to derive
from myeloid precursor cells, which enter the CNS during embryogenesis (reviewed by Solito et al.
2012). Microglia constitute the first line defence against pathogens and tissue damage within the
nervous system (Conde JR et al. 2006). Extensive evidence suggests that activated microglia have
central role in the innate immune response and that they contribute to cell loss and cognitive decline
in AD (Combs CK et al. 2001, Weiner HL et al. 2006). In response to chemotactic signalling and
activation microglia cluster at sites of Aβ deposits and deeply interdigitate neuritic plaques (Akiyama
H et al. 2000). Microglial activation induces a change in their morphology from resting cells with a
small soma and ramified processes into a motile “amoeboid-like” phenotype with enlarged soma and
shortened cellular processes. Further it stimulates the production of a variety of pro-inflammatory
mediators and the up-regulation of cell surface proteins such as the major histocompatibility
complex type II (MHC II), CD11b and scavenger receptors (SR’s) (Akiyama H et al. 2000, Heneka MT et
al. 2007, Weiner HL et al. 2006). In response to aggregated Aβ, microglia cells differentiate into cells
with diverse properties. Phagocytic properties could be beneficial in AD by increasing clearance of
Aβ. On the contrary, the chronic microglia activation in AD is thought to contribute to progressive
neurodegeneration because of their neurotoxic properties through generation and secretion of
cytotoxic molecules (Weiner HL et al. 2006)
4.5.1. Activation and contribution to neurodegeneration in AD
Once stimulated, microglia can produce a variety of neurotoxic mediators including cytokines,
chemokines, complement factors, inflammatory enzymes, reactive oxygen and nitrogen species, and
neurotoxic secretory products (Walter S et al. 2007). All of them can contribute to neuronal
dysfunction and cell death and create a vicious circle in a perpetuating cascade (Heneka MT et al.
2007).
AD alterations in general, but especially Aβ initiate microglia activation. Activation follows binding of
Aβ to microglial surface receptors, such as scavenger receptors (Paresce DM et al. 1996) and the
receptor for advanced glycation end products (RAGE) (Yan SD et al. 1998). Fibrillar Aβ is further
20
suggested to bind to the Toll-like receptor 4 (TLR4) (Walter S et al. 2007). Total RAGE levels are
significantly increased in AD and correlate with disease severity. Similarly to other ligands, Aβ
binding to RAGE initiates a NFκB dependent production of inflammatory mediators (Lue LF et al.
2009).
Activation of RAGE conveys for instance the potent pro-oxidant effects of Aβ by generation of
reactive oxygen and nitrogen species (Querfurth HW et al. 2010). Increased expression of NADPH
oxidase (nicotinamide adenine dinucleotide phosphate-oxidase) and the inducible nitric-oxide
synthase (iNOS) follow microglia stimulation by fibrillar Aβ in vitro (reviewed by Weiner HL et al.
2006). Oxidative damage by NO and free radicals concern multiple molecular targets of cells and
leads subsequently to the impairment of mitochondrial function, cellular energy discrepancy through
impaired glucose transport and ionic imbalance by affecting membrane permeability (reviewed by
Querfurth HW et al. 2010).
Aβ can stimulate a NFκB-dependent pathway that is required for cytokine production (Combs CK et
al. 2001). Compared to samples from non-demented brains, microglia from AD patients show
increased expression of pro-inflammatory cytokines including several interleukins (IL-1β, IL-6, IL-8, IL-
12) and TNF-α (tumour-necrosis factor α) (Weiner HL et al. 2006). The cytokines TNF-α, IL-1β and IL-6
directly impair neuronal function and suppress hippocampal long-term potentiation (Tancredi V et al.
1992, Murray CA et al. 1998). These cytokines are are highly interwoven in AD processes: The
cytokine IL-1 occurs early in the course of the disease and augments its pathogenesis. IL-1 is
suggested to stimulate the Aβ generation as it increases synthesis of APP in human astrocytes by up
to 6-fold (Sastre M et al. 2006). It enhances neuronal acetylcholinesterase activity, microglial
activation and stimulation of its own production (Heneka MT et al. 2007). In astrocytes, it induces
amongst other effects the expression of acute phase proteins, the generation of NO following iNOS
activation (Rossi F et al. 1996) and most importantly the secretion of cytokine S100β. At normal
levels S100β promotes neurite growth. Elevated levels of S100β are associated with senile plaques
and are suggested to be responsible for the dystrophic neurite growth at sites of Aβ deposits
(reviewed by Akiyama H et al. 2000, Mrak RE et al. 2001). Further S100β represents an additional
ligand for RAGE and their interaction causes increased RAGE expression and amplification of
inflammation and oxidative stress (Lue LF et al. 2009). The cytokine IL-6 is generally understood as a
destructive, pro-inflammatory cytokine. It promotes astrogliosis (Selmaj KW et al. 1990), amplifies
microglia activation (Heyser CJ et al. 1997) and is associated with increased APP synthesis (Altstiel LD
et al. 1991). Also TNF-α is commonly regarded as a powerful pro-inflammatory cytokine. It is a potent
stimulator of the transcriptional factor NFκB which further amplifies the immune response in
21
particular by increasing the expression of pro-inflammatory mediators (Cardinaux JR et al. 2000).
TNF-α accounts for most of the neurotoxic activities of microglial and monocyte secretory products
(Combs CK et al. 2001). Microglial TNF-α stimulates iNOS expression in neurons and the following
production of NO contributes to neuronal cell apoptosis (Weiner HL et al. 2006). However the full
impact of TNF-α on AD is not yet fully understood as it seems to convey also contradictory
neuroprotective properties in specific experimental settings (reviewed by Akiyama H et al. 2000).
Microglia secrete further excitotoxins such as glutamate (Piani D et al. 1992) and quinolinic acid
(Espey MG et al. 1997). They directly affect synapses and dendrites and contribute to synaptic
dysfunction and subsequent neuronal loss in AD (Akiyama H et al. 2000). Moreover an amine has
been identified within the cortical gray matter and hippocampus of AD brains that evokes fulminant
excitotoxicity. This AD neurotoxin is secreted by microglia after stimulation by senile plaques (Giulian
D et al. 1995). In vivo the compounds have been capable of destroying hippocampal neurons in a
concentration of as few as picomolars. However, their action was blocked by NMDA-receptor
antagonists (Giulian D 1999), which are an approved therapy in AD.
Chemokines are secreted proteins, which are important in mediating the innate immune response in
the CNS and are able to recruit immune cells from the blood to the brain (Farfara D et al. 2008).
Upon activation microglia have been shown to express certain chemokine receptors, including CCR3
and CCR5 (Xia MQ et al. 1998). Further, they produce chemokines such as CXCL8 (CXC ligand 8) and
CCL3 (CC ligand 3) and in vitro studies have demonstrated, that the secretion of chemokines CCL2
and CCL3 by plaque associated microglial promotes astroglial chemotaxis (Kitazawa M et al 2004).
The complement system plays an important role in the initial recruitment and activation of glial cells
and in turn activated microglia enhance the complement cascade. In vitro studies demonstrated that
microglia isolated from AD brains constitutively secrete two-fold more complement component 1q
(C1q) than microglia from non-demented individuals (Akiyama H et al. 2000). C1q is co-localised with
most of the amyloid deposits in the AD brain (Rogers J et al. 1992) and it initiates the classical
pathway of the complement. The amplifying cascade produces multiple molecules with cytopathic
relevance including anaphylatoxins (C3a, C5a), Aβ binding opsonins (C4b, c3b) and ultimately leads to
the formation of the pro-inflammatory membrane attack complex (MAC). In AD, Aβ fibrils, NFTs and
fragments from neurodegeneration are competent initiators of the complement cascade by the
classical and alternative pathway which both result in the formation of MAC’s (reviewed by Akiyama
H et al. 2000). Numerous MAC’s are found in vicinity to Aβ deposits and tangle formation. In a
process called “bystander lysis” MAC’s attack also neighbouring healthy tissue and ultrastructural
22
analysis confirmed that MAC’s are present on the surface of adjacent neurites in AD samples (Itagaki
S et al. 1994, Webster S et al. 1997). In addition, C1q could facilitate the formation of Aβ fibrils as it
appears to stabilize Aβ oligomers and it is able to bind multiple Aβ molecules (McGreal E et al. 2002,
Webster S et al. 1996). On the contrary, activation of the complement system can enhance microglial
phagocytosis of Aβ in AD (Farfara D et al. 2008). Microglia express the C1q receptor which enhances
phagocytosis, particularly upon interaction of C1q with particles that are opsonised by antibodies
(Webster SD et al. 2001).
4.5.2. Beneficial role of microglial activation
Microglia cells do not constitute a single uniform cell population. Activation results in development
of a broad range of functional phenotypes of which some can exert beneficial and other destructive
effects (Garden GA et al. 2006, Schwartz M et al. 2006, Weiner HL et al. 2006). Whereas the above
described neurotoxic phenotype of microglia can contribute to the detrimental course, the activation
of phagocytic or even antigen presenting microglia phenotype could be beneficial in AD (Weiner HL
et al. 2006). According to the amyloid hypothesis, the imbalance of Aβ production and clearance,
leading to accumulation of Aβ initiates AD pathogenesis (Heneka MT et al. 2007, Querfurth HW et al.
2010). Therefore removal of the disease-causing agent could constitute an effective treatment
approach (Hjorth E et al. 2010). Microglia activation could be useful through contribution to Aβ
clearance by phagocytosis and degradation (Heneka MT et al. 2007). Microglia can phagocytose Aβ
fibrils and oligomers by various scavenger receptors expressed on surface of activated cells, including
integrin-αβ (Coraci IS et al. 2002), CD36 (El Khoury J et al. 1996, Bamberger ME et al. 2003), CD47
(Porter JC et al. 1998), formyl peptide receptor 2 (Iribarren P et al. 2005a, 2005b) SR-A and SR-BI
(Paresce DM et al 1996). Fibrillar Aβ, opsonised by complement component C3b stimulates
engulfment following interaction with the complement receptors on activated microglia (Akiyama H
et al. 2000). Solube Aβ can also be directly incorporated via heparin sulphate proteoglycans (Giulian
D et al. 1998), insulin receptors (Xie L et al. 2002) and proteinase inhibitors (serpin)-enzyme complex
receptor (Boland K et al. 1996).
Moreover microglia account to Aβ clearance by release of Aβ degrading enzymes such as the
metalloproteases neprilysin and insulin degrading enzyme (Qiu WQ et al. 1997) as well as enzyme
gelatinase A (Yamada T et al. 1995).
Microglial activation can further mediate neuroprotective properties by release of several trophic
factors, including the glial-derived neurotrophic factor (GDNF) (Liu B et al. 2003).
23
The microglial phenotype is suggested to be determined by the nature of stimuli, their sequence and
duration. Induction of microglia through aggregated Aβ seems to induce a response similar to
activation by invading microorganism, promoting a phenotype that produces cytotoxic molecules,
such as TNF-α. In contrary, IL-4 and IFN-γ have been shown to induce a neuroprotective phenotype
of microglia in vitro (Butovsky O et al. 2005) as they improve microglia function as APC’s by
expression of e.g. MHC-II. Hence capable of presenting antigens, microglia can engage a dialog with
T-cells resulting in increased Aβ clearance (Schwartz M et al. 2006). Moreover, a classical mechanism
to enhance microglial phagocytosis is through the Fc receptor (FcR). Engagement of FcR by antibody
(AB) bound pathogens initiates their phagocytosis (Farfara D et al. 2008) and FcR-mediated
phagocytosis of AB bound Aβ has been speculated upon findings of an immunisation trial in animals
(Webster SD et al. 2001).
4.5.3. Interaction of activated microglia with adaptive immunity
In general, the role and involvement of peripheral T-cell function in AD is still unclear (Schindowski K
et al. 2007). Perturbations in the stability of the BBB have been reported in AD which would enable T-
cell infiltration (Nguyen MD et al. 2002). However, the brains from AD patients contain only very low
levels of infiltrating T cells in close vicinity of Aβ plaques (Town T et al. 2005). Interestingly, microglia
from AD brains show increased expression of MHC II compared to control brains (Akiyama H et al.
2000). MHC class II molecules are commonly found on antigen presenting cells (APC’s) where they
communicate with the adaptive immune system via interaction with T-cell receptors (Weiner HL et
al. 2006). In a mouse model of AD, active immunisation with Aβ and passive administration of
amyloid-specific antibodies induced microglial cell activation, reduced amyloid levels markedly and
was associated with reverse of behavioural impairment (Farfara D et al. 2008). Aβ clearance
following Aβ-immunisation was associated with enhanced microglial-cell activity around remaining
amyloid plaques (Schenk D et al. 1999). Also a human trial using Aβ-42 immunization achieved
significant clearance of Aβ plaque. The trial had to be discontinued due to pronounced activation of T
cells leading to menigoencephalitis (Orgogozo JM et al. 2003) but modified trials of passive
immunisation are currently on the way (Hjorth E et al. 2010).
4.5.4. Microglial differentiation
Specific activation of microglial Aβ phagocytosis while reducing their pro-inflammatory response is
an important immunotherapeutic avenue. As mentioned above, it has been suggested that
differentiation of microglia in the presence of IL-4 and IFN-γ could promote the beneficial microglia
phenotype. IL-4 promotes microglial production of insulin-like growth factor 1 which is linked with

24
cell renewal. Microglial activation by IFN-γ or IL-4 is associated with neurogenesis,
oligodendrogenesis and protection of neurons (Schwartz M et al. 2006). Hjorth et al. investigated the
response of human microglia to Aβ and the possibilities to increase glial cell uptake of Aβ by
immunomodulatory agents in vitro. Amongst the agents studied, IFN-γ and the combination of IFN-γ
with IL-1β increased the proportion of cells showing uptake of Aβ-42 significantly by 50% and 60%,
respectively. Nevertheless, the effect was also associated with reduced secretion of the neurotrophic
growth factor BDNF by microglia and a simultaneous increase of IL-6 (Hjorth E et al. 2010).
25
4.6. Interferon β
IFN-β belongs to the type I subgroup within the interferon family. Interferons represent a group of
multifunctional cytokines which exert antiviral, antiproliferative and immunomodulatory properties.
The most important members of the interferon family in humans include the type I interferons α
(IFN-α) and β (IFN-β) and the only known member of the type II interferon subclass, interferon γ (IFN-
γ) (De Veer MJ et al. 2001). IFN-α is used for therapy of viral infections as chronic hepatitis B and C
and in some cancer types such as the Kaposi sarcoma (Bekisz J et al. 2004). IFN-β is the most popular
treatment for multiple sclerosis (MS) though its mechanism of action is not fully understood (Axtell
RC et al. 2008). In general interferons mediate their effects by induction of gene transcription of their
target genes. More than 300 interferon-stimulated genes (ISGs) have been identified. ISG products
are the primary effectors of IFN response and they confer their pleiotropic biological functions for
instance in mediation of immunity, inflammation, antigen processing and presentation, cell
signalling, transcription, protein degradation and mediation of apoptosis (De Veer MJ et al. 2001).
IFN-β has been shown to penetrate the BBB and to exert its biological activity in primate brains
(Malik O et al. 1998). The first licensed human IFN-β, interferon β-1b (Betaferon) is used in the
treatment of relapsing- remitting MS where it reduces the frequency of clinical exacerbation (Bekisz J
et al. 2004). Due to the observed beneficial effects of IFN-β in MS, the effects of IFN-β on glial cells
and inflammation have been studied in multiple studies, mainly in vitro. Despite possible differences
in glial cell response between species, the findings outline effects and mechanisms of IFN-β with the
potential to modulate pathological processes within the CNS (Malik O et al. 1998).
All type I interferons bind to a common surface receptor, the human IFN-α receptor (IFNAR) through
which they induce multiple signalling pathways (Bekisz J et al. 2004, Kim MO et al. 2002). In
microglia, IFN-β can activate NFκB, AP-1 and the JAK/STAT signalling pathway, which suggests
complex immunomodulatory effects of IFN-β. Amongst the pleiotropic biological effects of IFN-β in
the CNS, are the inhibition of IFN-γ actions (as the induction of MHC class II expression on glial cells
and the up-regulation of iNOS in astrocytes for instance) (Kim MO et al. 2002). IFN-β can further
promote the integrity of the BBB and reduce infiltration of peripheral immune cells into the CNS
(Benveniste EN et al. 2007). IFN-β has been found to inhibit the amplification of inflammatory
stimulus via epitope spreading that involves the extension of an immune response against multiple
epitopic structures of an antigen (Axtell RC et al. 2008). The data of IFN-β affecting chemokine
expression is controversial. Some in vitro studies suggest that IFN-β induces expression of microglial
chemokines including RANTES, MIP-1α, MIP-1β (Kim MO et al. 2002), whereas the majority of studies
describe a reduced microglial production of chemokines (Axtell RC et al. 2008).
26
Concomitantly, Hall et al. present an antagonizing effect of IFN-β on chemokines. They examined
closely the immunomodulatory effects of IFN-β in neonatal rodent microglia and the interaction of
IFN-β with IFN-γ. The data showed that IFN-β counteracted the proliferative stimulus of certain
chemokines and most importantly inhibited proliferation of microglia by 60%. In contrast, IFN-β up-
regulated the number and density of microglial Fc-receptor expression by almost three fold, which
increased their phagocytotic capability. Furthermore, they depicted that IFN-β significantly reduced
the ability of IFN-γ to promote microglial cytotoxicity through mounting of a respiratory burst. The
effect of IFN-β on peripheral lymphocytes includes modulation of cytokine release. IFN-β decreases
secretion of pro-inflammatory cytokines such as IFN-γ and TNF-α and on the contrary increases anti-
inflammatory cytokines like TGF-β1 and IL-10 from activated T-cells (Hall GL et al. 1997).
These findings are in line with effects of IFN-β on human lymphocytes. IFN-β has been reported to
inhibit proliferation of human lymphocytes, to modify their expression of membrane receptors and
the pattern of cytokine secretion. Secretion of IFN-γ, TNF-α and IL-13 was inhibited, whereas
elevated secretion was shown for IL-2 and as well a nearly four-fold increase of IL-10 (Billiau A 2006).
Malik et al. demonstrated a similar effect of IFN-β as described by Hall et al. Growth factors including
TNF-α, IFN-γ and IL-1β could stimulate astrocyte proliferation. Malik showed furthermore that
mitogenic proliferation by growth factors of astrocytes was inhibited by IFN-β dose-dependently. The
inhibitory effect of IFN-β was limited to mitogen induced proliferation whereas the basal number of
astrocytes was not reduced. Malik suggests that IFN-β reduces astroctytosis and promotes
endogenous repair (Malik O et al. 1998).
Finally, Billiau reviews the role of type I interferon as a key component of innate immunity.
Combined findings from clinical studies in MS, experimental animal models and in vitro studies
suggest IFN-β involvement in regulation of innate and even acquired immunity, by regulating
recruitment and secretory activity of leukocytes during inflammation (Billiau A 2006).
27
5. AIM OF THE STUDY
This study was carried out to investigate the immunomodulatory effects of interferon β (IFN-β) on
the pathogenesis of Alzheimer’s disease in vivo in a transgenic APP mouse model.
The work was based on the preliminary findings from in vitro studies, where mononuclear
phagocytes (monocytes/microglia) showed an increase of bead phagocytosis following treatment
with IFN β. This study aimed to clarify whether similar effects occur in vivo in order to evaluate the
potential of IFN β as a novel therapeutic option for patients with AD.
The study was based on the widely accepted paradigm that AD pathology originates from the
generation of amyloid β peptides and their deposition to plaques in the interplay with a widespread
inflammatory response. As outlined earlier, AD pathogenesis starts years before the first symptoms
occur and the activation of the inflammatory processes might precede the formation of plaque
pathology.
The study aimed to answer following questions:
Does treatment with IFN-β reduce the formation of amyloid plaques in the early stage of the
disease?
Does treatment with IFN-β affect the activation of inflammatory cells and their association
with AD hallmark lesions?
Does treatment with IFN-β reduce structural changes in the context of disease-related
neuronal cell death including axonal injury and the degree of demyelination?
Does IFN-β affect the cytokine milieu?
Does IFN-β treatment alter the amount or distribution of soluble and oligomeric Aβ?
Overall the study should help to investigate a new therapeutic approach for AD.
28
6. MATERIALS AND METHODS
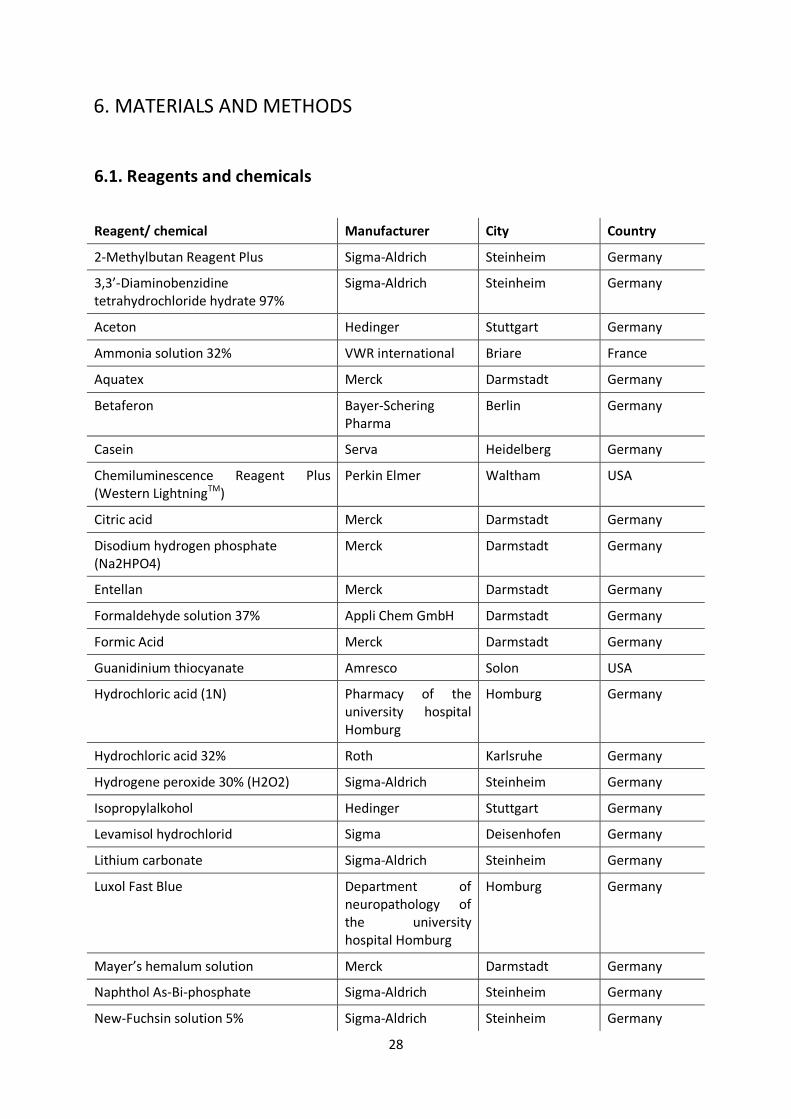
6.1. Reagents and chemicals
Reagent/ chemical Manufacturer City Country
2-Methylbutan Reagent Plus Sigma-Aldrich Steinheim Germany
3,3’-Diaminobenzidine tetrahydrochloride hydrate 97%
Sigma-Aldrich Steinheim Germany
Aceton Hedinger Stuttgart Germany
Ammonia solution 32% VWR international Briare France
Aquatex Merck Darmstadt Germany
Betaferon Bayer-Schering Pharma
Berlin Germany
Casein Serva Heidelberg Germany
Chemiluminescence Reagent Plus (Western LightningTM)
Perkin Elmer Waltham USA
Citric acid Merck Darmstadt Germany
Disodium hydrogen phosphate (Na2HPO4)
Merck Darmstadt Germany
Entellan Merck Darmstadt Germany
Formaldehyde solution 37% Appli Chem GmbH Darmstadt Germany
Formic Acid Merck Darmstadt Germany
Guanidinium thiocyanate Amresco Solon USA
Hydrochloric acid (1N) Pharmacy of the university hospital Homburg
Homburg Germany
Hydrochloric acid 32% Roth Karlsruhe Germany
Hydrogene peroxide 30% (H2O2) Sigma-Aldrich Steinheim Germany
Isopropylalkohol Hedinger Stuttgart Germany
Levamisol hydrochlorid Sigma Deisenhofen Germany
Lithium carbonate Sigma-Aldrich Steinheim Germany
Luxol Fast Blue Department of neuropathology of the university hospital Homburg
Homburg Germany
Mayer’s hemalum solution Merck Darmstadt Germany
Naphthol As-Bi-phosphate Sigma-Aldrich Steinheim Germany
New-Fuchsin solution 5% Sigma-Aldrich Steinheim Germany
29
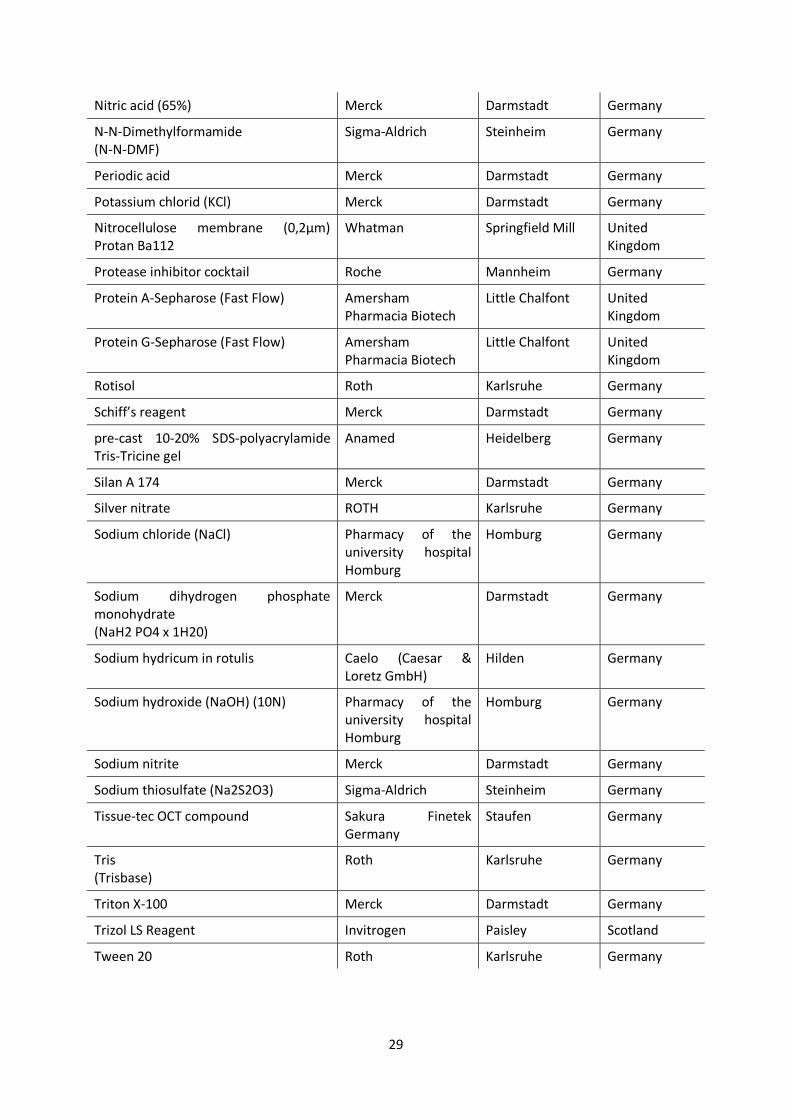
Nitric acid (65%) Merck Darmstadt Germany
N-N-Dimethylformamide (N-N-DMF)
Sigma-Aldrich Steinheim Germany
Periodic acid Merck Darmstadt Germany
Potassium chlorid (KCl) Merck Darmstadt Germany
Nitrocellulose membrane (0,2µm) Protan Ba112
Whatman Springfield Mill United Kingdom
Protease inhibitor cocktail Roche Mannheim Germany
Protein A-Sepharose (Fast Flow) Amersham Pharmacia Biotech
Little Chalfont United Kingdom
Protein G-Sepharose (Fast Flow) Amersham Pharmacia Biotech
Little Chalfont United Kingdom
Rotisol Roth Karlsruhe Germany
Schiff’s reagent Merck Darmstadt Germany
pre-cast 10-20% SDS-polyacrylamide Tris-Tricine gel
Anamed Heidelberg Germany
Silan A 174 Merck Darmstadt Germany
Silver nitrate ROTH Karlsruhe Germany
Sodium chloride (NaCl) Pharmacy of the university hospital Homburg
Homburg Germany
Sodium dihydrogen phosphate monohydrate (NaH2 PO4 x 1H20)
Merck Darmstadt Germany
Sodium hydricum in rotulis Caelo (Caesar & Loretz GmbH)
Hilden Germany
Sodium hydroxide (NaOH) (10N) Pharmacy of the university hospital Homburg
Homburg Germany
Sodium nitrite Merck Darmstadt Germany
Sodium thiosulfate (Na2S2O3) Sigma-Aldrich Steinheim Germany
Tissue-tec OCT compound Sakura Finetek Germany
Staufen Germany
Tris (Trisbase)
Roth Karlsruhe Germany
Triton X-100 Merck Darmstadt Germany
Trizol LS Reagent Invitrogen Paisley Scotland
Tween 20 Roth Karlsruhe Germany
30
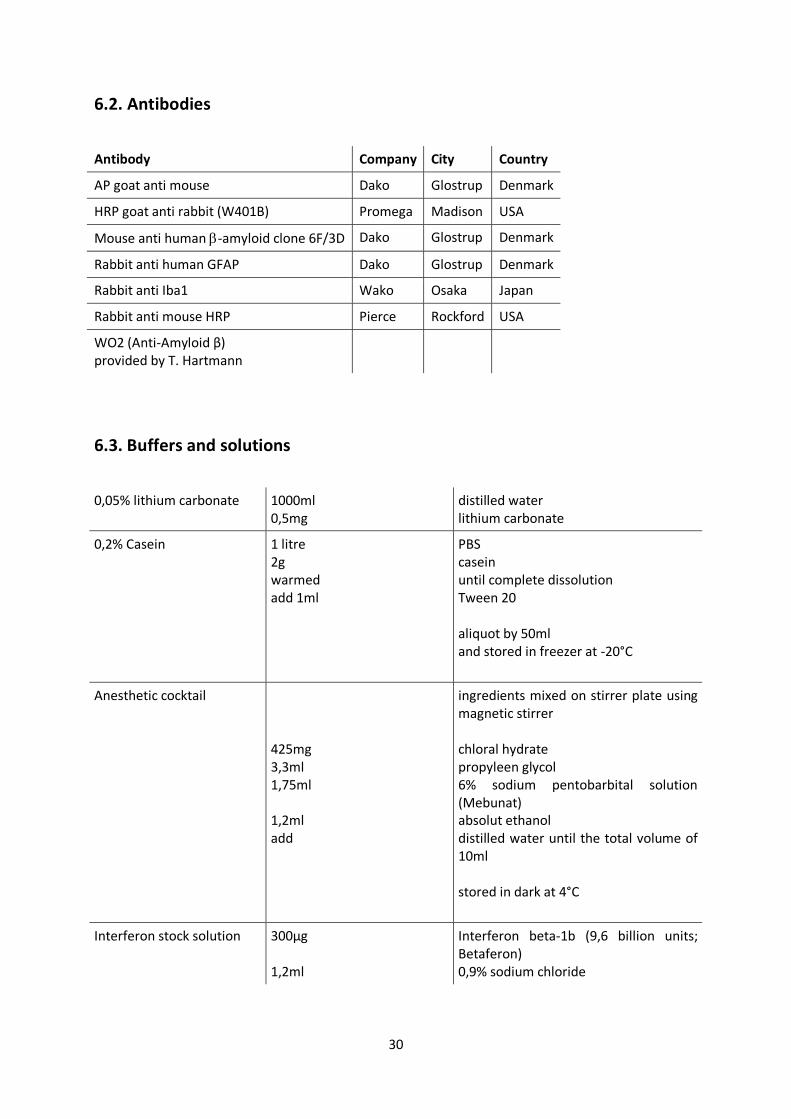
6.2. Antibodies
Antibody Company City Country
AP goat anti mouse Dako Glostrup Denmark
HRP goat anti rabbit (W401B) Promega Madison USA
Mouse anti human -amyloid clone 6F/3D Dako Glostrup Denmark
Rabbit anti human GFAP Dako Glostrup Denmark
Rabbit anti Iba1 Wako Osaka Japan
Rabbit anti mouse HRP Pierce Rockford USA
WO2 (Anti-Amyloid β) provided by T. Hartmann
6.3. Buffers and solutions
0,05% lithium carbonate 1000ml 0,5mg
distilled water lithium carbonate
0,2% Casein 1 litre 2g warmed add 1ml
PBS casein until complete dissolution Tween 20 aliquot by 50ml and stored in freezer at -20°C
Anesthetic cocktail 425mg 3,3ml 1,75ml 1,2ml add
ingredients mixed on stirrer plate using magnetic stirrer chloral hydrate propyleen glycol 6% sodium pentobarbital solution (Mebunat) absolut ethanol distilled water until the total volume of 10ml stored in dark at 4°C
Interferon stock solution 300µg 1,2ml
Interferon beta-1b (9,6 billion units; Betaferon) 0,9% sodium chloride
31
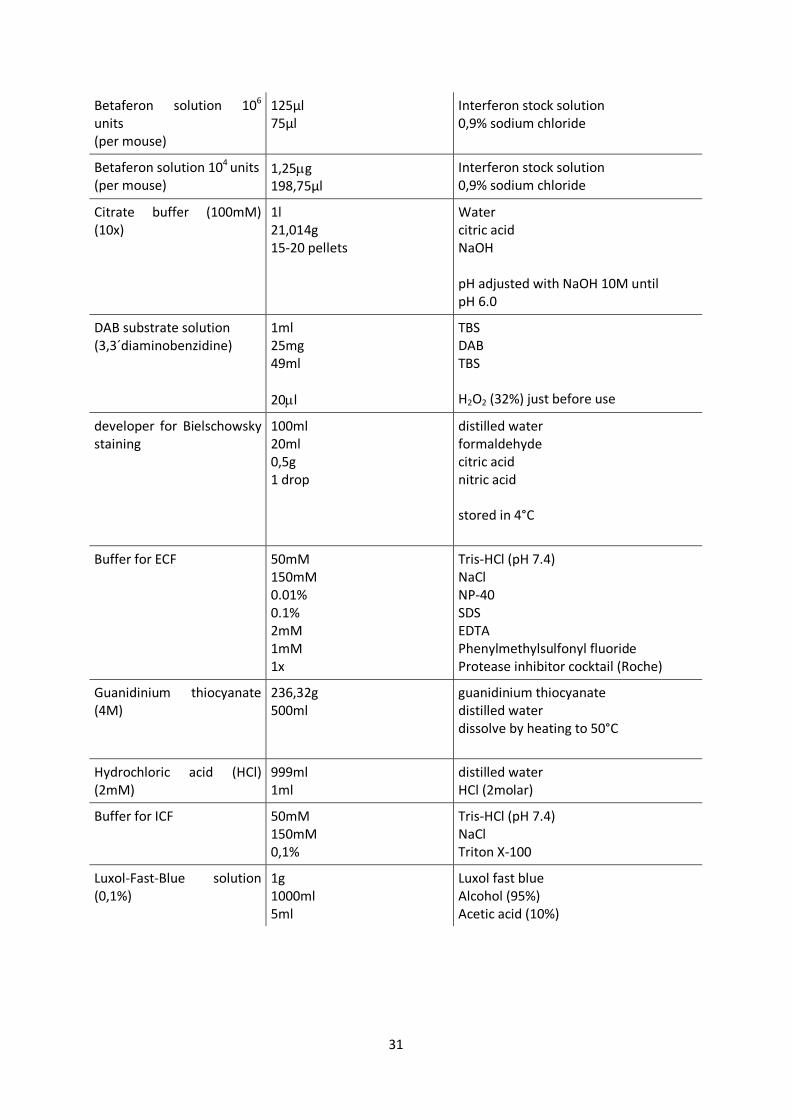
Betaferon solution 106
units
(per mouse)
125µl 75µl
Interferon stock solution 0,9% sodium chloride
Betaferon solution 104 units (per mouse)
1,25g 198,75µl
Interferon stock solution 0,9% sodium chloride
Citrate buffer (100mM) (10x)
1l 21,014g 15-20 pellets
Water citric acid NaOH pH adjusted with NaOH 10M until pH 6.0
DAB substrate solution (3,3´diaminobenzidine)
1ml 25mg 49ml
20l
TBS DAB TBS H2O2 (32%) just before use
developer for Bielschowsky staining
100ml 20ml 0,5g 1 drop
distilled water formaldehyde citric acid nitric acid stored in 4°C
Buffer for ECF 50mM 150mM 0.01% 0.1% 2mM 1mM 1x
Tris-HCl (pH 7.4) NaCl NP-40 SDS EDTA Phenylmethylsulfonyl fluoride Protease inhibitor cocktail (Roche)
Guanidinium thiocyanate (4M)
236,32g 500ml
guanidinium thiocyanate distilled water dissolve by heating to 50°C
Hydrochloric acid (HCl) (2mM)
999ml 1ml
distilled water HCl (2molar)
Buffer for ICF 50mM 150mM 0,1%
Tris-HCl (pH 7.4) NaCl Triton X-100
Luxol-Fast-Blue solution (0,1%)
1g 1000ml 5ml
Luxol fast blue Alcohol (95%) Acetic acid (10%)
32
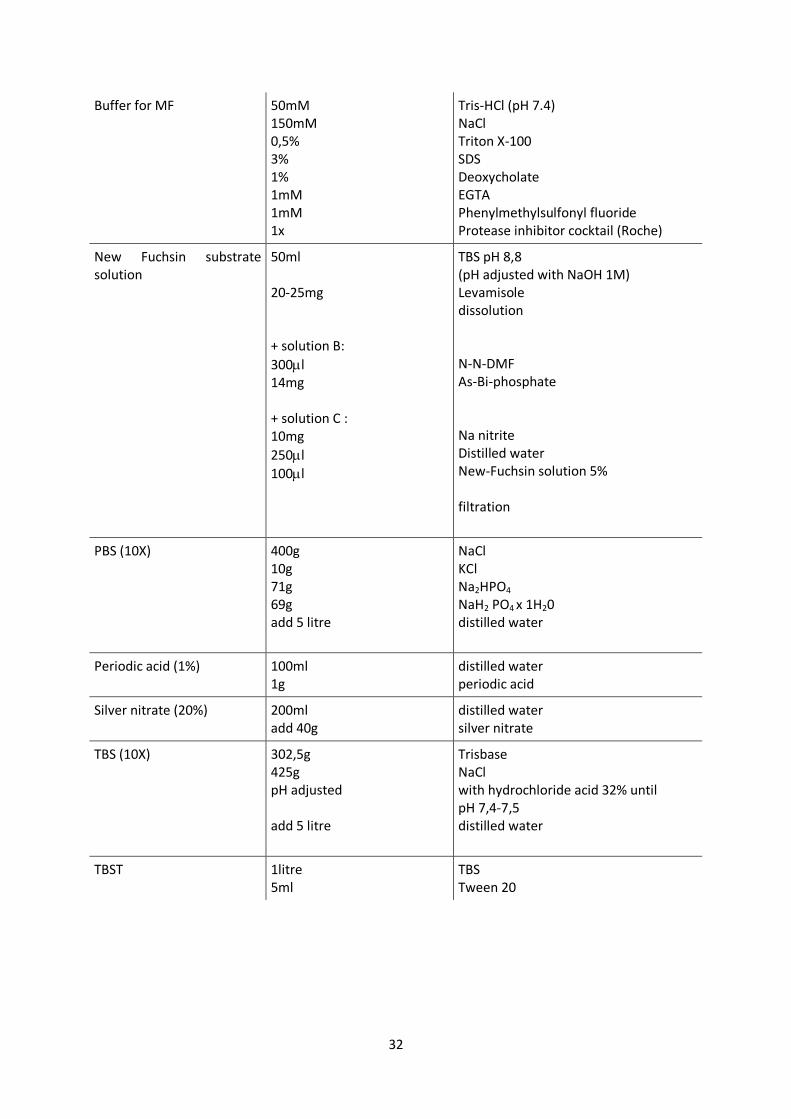
Buffer for MF 50mM 150mM 0,5% 3% 1% 1mM 1mM 1x
Tris-HCl (pH 7.4) NaCl Triton X-100 SDS Deoxycholate EGTA Phenylmethylsulfonyl fluoride Protease inhibitor cocktail (Roche)
New Fuchsin substrate solution
50ml 20-25mg + solution B:
300l 14mg + solution C : 10mg
250l
100l
TBS pH 8,8 (pH adjusted with NaOH 1M) Levamisole dissolution N-N-DMF As-Bi-phosphate Na nitrite Distilled water New-Fuchsin solution 5% filtration
PBS (10X)
400g 10g 71g 69g add 5 litre
NaCl KCl Na2HPO4 NaH2 PO4 x 1H20 distilled water
Periodic acid (1%) 100ml 1g
distilled water periodic acid
Silver nitrate (20%) 200ml add 40g
distilled water silver nitrate
TBS (10X)
302,5g 425g pH adjusted add 5 litre
Trisbase NaCl with hydrochloride acid 32% until pH 7,4-7,5 distilled water
TBST 1litre 5ml
TBS Tween 20
33
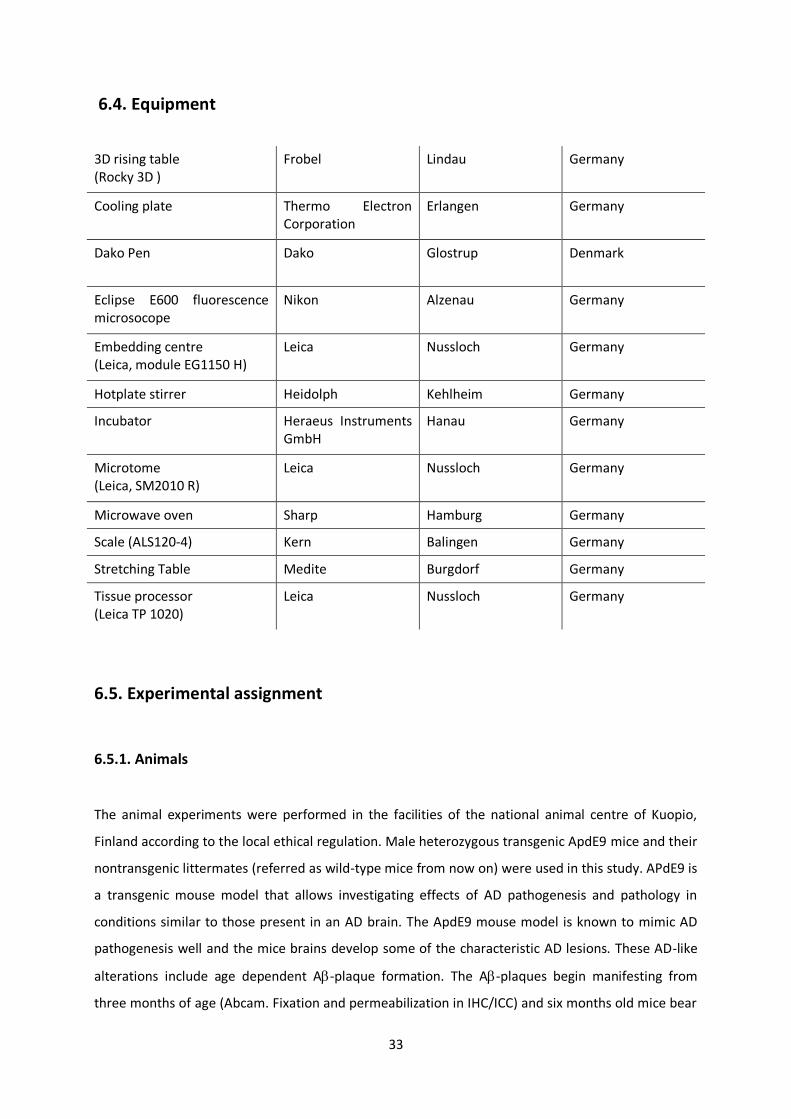
6.4. Equipment
3D rising table (Rocky 3D )
Frobel Lindau Germany
Cooling plate Thermo Electron Corporation
Erlangen Germany
Dako Pen Dako Glostrup Denmark
Eclipse E600 fluorescence microsocope
Nikon Alzenau Germany
Embedding centre (Leica, module EG1150 H)
Leica Nussloch Germany
Hotplate stirrer Heidolph Kehlheim Germany
Incubator Heraeus Instruments GmbH
Hanau Germany
Microtome (Leica, SM2010 R)
Leica Nussloch Germany
Microwave oven Sharp Hamburg Germany
Scale (ALS120-4) Kern Balingen Germany
Stretching Table Medite Burgdorf Germany
Tissue processor (Leica TP 1020)
Leica Nussloch Germany
6.5. Experimental assignment
6.5.1. Animals
The animal experiments were performed in the facilities of the national animal centre of Kuopio,
Finland according to the local ethical regulation. Male heterozygous transgenic ApdE9 mice and their
nontransgenic littermates (referred as wild-type mice from now on) were used in this study. APdE9 is
a transgenic mouse model that allows investigating effects of AD pathogenesis and pathology in
conditions similar to those present in an AD brain. The ApdE9 mouse model is known to mimic AD
pathogenesis well and the mice brains develop some of the characteristic AD lesions. These AD-like
alterations include age dependent A-plaque formation. The A-plaques begin manifesting from
three months of age (Abcam. Fixation and permeabilization in IHC/ICC) and six months old mice bear
34
already a significant A-plaque burden (Jankowsky JL et al. 2004). The mice will develop also neurite
dystrophy and synaptic dysfunction, which are both typical symptoms of AD pathology. Altogether
these pathologies lead to gradual impairment of the cognitive functions of the mice (Minkeviciene R
et al. 2009). The APdE9 mice harbour two separate transgenes that are responsible for the AD
pathogenesis: the APPswe and PS1dE9 transgenes. The swedish mutation (APPswe) leads to
increased levels of the APP. APP furthermore acts as substrate for cleavage by an enzyme complex
that includes -secretase to produce A peptides. The APdE9 mouse strain genome contains further
the PS1dE9 transgene, which is a deleted form of PS-1 gene. PS1 is a component of the -secretase
complex, which results in an altered activity of the -secretase enzyme. The -secretase cleavage of
APP can produce either A-40 peptid or a longer A-42 peptid, the latter being more prone to A
plaque formation. In case of mutated PS1, a condition known also to cause early onset AD, the ratio
of A40:42 is shifted in favour of the more pathogenic A42 (Jankowsky JL et al. 2004). The APPswe
and PS1dE9 transgenes cointegrate and cosegregate as a single locus in the ApdE9 mouse genome
(Minkeviciene R et al. 2009). The mouse strain was originally purchased from the John Hopkins
University Baltimore, MD, USA were the line was maintained in a hybrid background of C3HeJ x
C57BL6/J F1. The strain has been backcrossed to C57BL6/J background for several generations in the
National Animal Centre of Kuopio, Finland (Minkeviciene R et al. 2008). The animals were housed in
single cages and in controlled conditions: temperature 22°C, humidity 50-60 % and an artificial 12
hours day/night cycle. Food and water were provided ad libitum.
6.5.2. Treatment regime
A total amount of 29 mice were involved in the study.
21 ApdE9 transgenic mice were evenly divided into three groups: The first group received human
Interferon (betaferon, Bayer-Schering Pharma, Berlin, Germany) intraperitoneal (IP) injections with
a dose of 104 units. The second group received 106 units of Infereron and the third group was
injected with PBS. Additionally eight wild-type mice were separated into two groups: the first group
received 106 units of IFN- (IP) and the second group PBS injections. Findings from various studies of
multiple sclerosis demonstrate human IFN-β to be effective in different types of rodents (Maier K et
al. 2006, Sättler MB et al. 2008, Axtell RC et al. 2010). These findings, indicating cross reactivity of
IFN-β between species enabled the application of human IFN-β in mice of this study.
The experiment began when the mice reached the age of seven weeks. Injections were carried out
three times per week enabling the animals to recovery for at least one day. The whole treatment
period lasted eight weeks. Betaferon was dissolved into saline. Each mouse received a volume of
35
200µl applied intraperitoneally. As the potential side effects were unknown, mice received only half a
dose during the first week.
Over the whole period of the study the condition of the mice were assessed and monitored by
appearance, behaviour and weight change.
6.5.3. Perfusion
The animals were anesthetized by intraperitoneal injection of a pentobariturate-chloralhydrate
cocktail (see table 3.4). The infusion needle was placed to the left ventricle of the beating heart and
the right atrium was opened. Perfusion pump enabled the constant infusion of saline for 5 minutes
by a speed of 10 ml/min. The harvesting of the brains was proceeded discriminatively accordingly to
the subsequent analyses from this point on. Brain samples of each treatment group were collected
for RNA-analysis, western blotting and immunohistochemistry (IHC) stainings on paraffine and cryo
tissue. The brains for RNA-analyses and western blotting were rapidly removed after perfusion with
saline and divided into the two hemispheres by a cut through the corpus callosum. One hemisphere
of the brain was put into a microcentrifuge tube containing 1 ml of trizol and stored in –80°C until
the real-time PCR analysis was performed. The corresponding hemispheres were preserved for
western blotting analysis by storage in pure microcentrifuge tubes at -80°C.
The brains that were intended to use for IHC analysis on cryo and paraffine sections were perfused
with saline for 5 minutes and subsequently with 4% paraformaldehyde for 9 minutes.
The brains for the analysis on cryo tissue were removed, cut in three blocks, embedded in Tissue-tec
and frozen in an isopentan bath in –80°C.
6.6. Preparation of the material for histological analysis
6.6.1. Fixation
The aim of the fixation is to prevent the process of autolysis and degradation by bacteria. However,
the effect on cellular and subcellular structures is aimed to be minimal in order to permit antibodies
to access the antigene structures which are transformed into an immobilised state upon fixation. As
there is neither a method nor fixating agent available that simultaneously meets both criteria
perfectly, all methods of fixation influence the IHC staining and have an impact on the qualitative and
quantitative evaluation of the staining (ICH WORLD LLC. Immunocytochemistry Methods, Techniques
and Protocols; Abcam. Fixation and permeabilization in IHC/ICC).
36
Fixation agents are classified into two categories: organic solvents and cross-linking reagents. For
example alcohol and acetone belong to a group of organic solvents, which remove lipids, dehydrate
cells and precipitate proteins on the cellular architecture. The fixating agent used in this experiment,
paraformaldehyde, is a so called cross-linking reagent. It forms intermolecular bridges primarily at
the sides of free amino groups and thus causes bonding between the proteins. It is thought to
preserve the cellular structure well but it can reduce the antigenicity as the cross-linking can obstruct
also the AB binding site. Hence it necessitates the employment of antigen retrieval techniques prior
to AB incubation upon IHC staining. This step becomes particularly important if a long fixation time
has been applied.
In this experiment the paraffine embedded brains for IHC analyses were first perfused with saline
and then with 4 % paraformaldehyde. The brains were stored in jars with 4 % paraformaldehyde and
transported to the University of Saarland where the embedding into paraffine was performed.
6.6.2. Embedding
In order to cut the brain samples into thin sections without damaging the microstructure of the
tissue it is necessary first to embed the brains into blocks of paraffine. Hot, liquid paraffine
permeates the tissue and allows cutting of thin slices after hardening. Complete penetration by
paraffine can be achieved thorough dehydration of the tissue beforehand (Sternfeld T 2002).
The brains were put into separate labelled plastic cassettes and placed in a tissue processor (Leica TP
1020). This device passes the cassettes through a series of containers in an automated manner. The
course started with isopropyl alcohol solutions of increasing concentration (50 %, 70 %, 80 %, 80 %,
96 %, 96 %, 100 % and 100 %) lasting 570 minutes. The samples were transferred into two container
of rotisol (2 x 90 minutes) and finally into two container with paraffine (2 x 10⁵ minutes) which
completed the course. The plastic cassettes with the dehydrated brains were first moved into the
paraffine reservoir of the embedding centre (Leica, module EG1150 H). Each brain was divided into
three blocks by coronal slicing through the frontal lobe and at the level of cerebellum and placed, the
cut site downwards in a metal mould. The moulds were filled with hot paraffine and the plastic
cassette, carrying inscription naming the sample, was attached on top. The metal moulds were
removed after paraffine hardening and the paraffine blocks were stored in room temperature until
sectioning.
37
6.6.3. Sectioning
For IHC analysis it is crucial to perform the staining on sections that are as thin as possible but
simultaneously free from creases.
To create even sections of 1 µm and 2 µm thickness a sliding microtome (Leica, SM2010 R) was used.
The paraffine blocks were placed on a cooling plate (Thermo Electron Corporation) at about - 26°C
for hardening for at least 30minutes prior to sectioning. The blocks were clamped on top of the rigid
platform and manually adjusted to the orientation of the blade. The sledge containing the blade was
moved through the tissue by smooth manual drive and using as constant speed as possible. The
resulting section was transferred with a brush tip from the blade into a water filled cup while further
serial sections of the tissue were prepared. Each section was then shortly placed in a hot water bath
for flattening of the paraffin embedded brain tissue, before mounting on labelled object slides. The
sections were ironed carefully with absorbent paper, dried and placed in an incubator at 60°C over
night. The slides were stored in room temperature until the stainings were performed.
6.7. General principle of immunohistochemistry
IHC is a method for identification of cellular structures and tissue components (e.g. proteins) based
on the principle of antigen-antibody recognition. Any biomolecule (most often proteins and
polysaccharides) can act as an antigen (AG), which is bound by an AB via the antigenic determinant,
the epitope (Boenisch T 2001).
6.7.1. Antibodies
Two AB classes can be distinguished in regards of production and their characteristics: polyclonal
and monoclonal AB’s.
Polyclonal AB’s are generated in animals upon an immune response due to the administration of an
AG. The AB, which are subsequently obtained via blood samples have been produced by different
plasma cells and thus are immunochemically dissimilar. They represent a heterogeneous mix of AB’s
reacting with various epitopes on the AG they have been raised against. In contrast, monoclonal AB’s
are products of an individual clone of plasma cells. An immune response is induced in an animal and
its’ B lymphocytes are harvested from spleen or lymph nodes. The fusion of B lymphocytes with non-
secreting myeloma cells results in the generation of hybridoma, which are cultured, tested and
propagated. The AB’s produced by the clones are chemically identical. They possess a high specificity
38
as they bind a particular epitope on the AG they have been raised against. (Boenisch T 2001,
Sternfeld T 2002).
6.7.2. Methods of antigen detection
Several methods for antigen detection are available. The direct method utilises a primary AB that is
conjugated with an indicator molecule which most often consists of an enzyme. The enzyme-labelled
primary AB reacts with the AG in the tissue. The incubation is followed by the removal of unbound
AB’s through a washing step. Application of the substrate, a colourless chromogen, initiates a
catalytic reaction by the enzyme which results in a staining at the site of the AB and thus shows the
locus of the antigenic structure. The results can be attained quickly and nonspecific reactions are
limited. Based on this technique, further methods have been developed in order to increase the
sensitivity for the antigenic structure recognition through signal amplification. The two-step indirect
method uses a secondary AB that is labelled with the enzyme. It is directed against the unlabelled
primary AB that has been generated in a different species. The secondary AB can react with several
diverse epitopes of the primary AB and thus more enzyme molecules are attached to the target site.
The application of the substrate will result now in a more intensive dye. Cross reactions between the
secondary AB and the tissue can cause more non-specific staining than in the direct method. To
reduce unspecific background staining a protein blocking step has to be conducted before AB
incubation. IHC staining protocol can be further modified by applying any number of linking
antibodies between the primary AB and the enzyme-labelled one in order to achieve even higher
sensitivity. The detection of two or more targets on one slide by a multiple staining procedure is
possible and has been carried out in this experiment (Boenisch T 2001, Kumar GL et al. 2009,
Sternfeld T 2002).
6.7.3. Immunoenzymatic staining
The dye at the site of the antigenic structure is a result of the enzymatic reaction in which a
colourless chromogen acts as electron donor and is converted into a coloured end product upon its
oxidation. The enzymatic activity is depending on the concentration of enzyme and substrate and can
be further influenced by various environmental factors, such as salt concentration, pH, buffers,
temperature and light.
AB’s are predominantly linked to alkaline phosphatase (AP) and horseradish peroxidase (HRP), both
of which have been employed in this project.
39
AP is an enzyme that is endogenously present in humans and mammals where it catalyses the
hydrolysis of phosphate groups from naphthol phosphate esters. This reaction liberates phosphates
and phenols. The free phenols couple with diazonium hydroxide and produce an insoluble azo dye
that precipitates at the site of the bound AB (Kumar GL et al. 2009, Loveless A et al. 1949)
In this experiment freshly prepared New Fuchsin substrate solution provided the substrate for the
reaction, giving an insoluble red end product of high staining intensity.
HRP is an enzyme that has been isolated from the horseradish plant. An iron-containing heme group
represents the active site of the enzyme which forms a complex with hydrogen peroxide. The
catalysis of hydrogen peroxide into water and oxygen by HRP demands the presence of an electron
donor as driving force of the reaction. The chromogen provides the electrons and in doing so itself
becomes oxidated, forming an insoluble coloured end product (Boenisch T 2001).
3,3’ Diaminobenzidine (DAB) has been used in this experiment as the chromogen for the reaction
with HRP and its’ oxidation resulted in a brown dye that is highly insoluble in organic solvents.
6.7.4. Controls
Positive and negative controls are essential in every IHC staining for validation and of the results.
Polyclonal AB’s can react with unspecific tissue components as they are directed against different
epitopes. Even though this effect is reduced by the use of monoclonal antibodies they bare the risk of
false positive staining by cross-reactivity due to high similarity between different epitopes (Kumar GL
et al. 2009, Sternfeld T 2002).
The positive control confirms the functionality of the staining protocol, and tests the sensitivity of the
used antibodies for the antigenic structure (ICH WORLD LLC. Introduction to Immunohistochemistry).
In this study one slide per staining was selected from the laboratory storage that was known to
express the target epitope.
A negative control excludes false positive staining due to unspecific binding and cross reactivity of
antibodies (ICH WORLD LLC. Introduction to Immunohistochemistry). In this experiment one slide per
staining was selected that had been processed identically with the actual samples. This negative
control was incubated with plane buffer and serum solution lacking the primary AB whereas the
secondary AB was applied normally.
40
6.8. Staining by immunohistochemistry
A staining by IHC follows a general regime consisting of: deparaffinization, antigen retrieval, blocking,
incubation with the primary and secondary AB’s, development of the dye and counterstaining before
mounting. The slides are washed thoroughly with buffers in between of each step of the course.
In this work the washing step consisted of a repeated rinsing in TBS buffer and a third wash in TBST
buffer.
6.8.1. Deparaffinization
The fixated tissue was dehydrated and embedded into paraffine in order to prepare thin slices on
object plates. For permeation by the water soluble AB’s the tissue has to be deparaffinised and
rehydrated in a descending series of isopropyl alcohol solutions (Sternfeld T 2002).
In this work, the sections were kept in rotisol 2 x 5 minutes, followed by 2 x 5 minutes in 100 %
isopropyl alcohol. The sections were transferred through a series of isopropyl alcohol water solutions
of 96 %, 70 % and finally 50 % concentrations, where they stayed for 2 minutes in each and finally
they were immersed in a water container until the antigen retrieval step.
6.8.2. Antigen retrieval
The changes in the molecular structure of the tissue due to the fixation affect also the antigenic
determinants. Those changes impair the binding between the AG and its’ AB and thus make it
necessary to bring the epitopes into their original conformation in a process referred as antigen
retrieval. Several factors contribute to the changes induced by the fixation, such as pH, temperature,
the used tissue, the fixating agent and the duration of fixation. Thus there exists no universal
technique for antigen retrieval but various methods can be used solitary or in combination. The most
common techniques include enzymatic treatments of the tissue and the heat-induced epitope
retrieval (HIER), the latter one being mainly used in this experiment. Proteolytic enzymes such as
Trypsin, Proteinase K and Pepsin break the intermolecular bonds caused by fixation and thus improve
the sensitivity of the staining. The principle of HIER is based on the effect of energy transmission to
the tissue, which is high enough to break the cross-linking between the proteins. The source of heat
is irrelevant as long as temperatures over 100°C are generated, and microwave oven, water bath,
autoclave and steamer are widely used. Due to the inverse relationship of temperature and exposure
time they have to be chosen carefully in order to avoid damage of the tissue but to achieve full
recovery of the antigenic structures. The results can be optimised in both techniques of antigen
41
retrieval by employment of buffer solution with selected pH which aid to maintain the restored
conformation (Sternfeld T 2002, ICH WORLD LLC. Protocol Database, Antigen Retrieval Protocols).
In this study, the slides were placed either into a plastic container with 2 mM HCl or 10mM citrate
buffer with pH 6, respectively. The heat was induced in repeated sessions of 3 minutes by a
microwave oven of 560 Watt. The buffer was refilled between each step and after the last boiling the
slides were carefully cooled down with water.
6.8.3. Blocking
Non-specific background staining is characterised as a uniform staining throughout the tissue despite
the presence of the antigenic structure. One reason for background is non-immunological bonding
between the specific immune sera with free binding sites within the tissue due to hydrophobic and
electrostatic forces. This effect can be reduced by blocking of free binding sites with normal serum
(Kumar GL et al. 2009, ICH WORLD LLC. Introduction to Immunohistochemistry).
In this experiment, unspecific background staining was blocked using a solution of 0.2 % casein,
which was applied before primary AB incubation. A washing step with TBS and TBST followed the
procedure.
False positive staining can also result from endogenously present enzymes which react with the
chromogen regardless an AB binding. For that reason endogenously present enzymes that could
interfere with the staining have to be blocked (Kumar GL et al. 2009, ICH WORLD LLC. Introduction to
Immunohistochemistry).
The endogenous AP was inhibited during the stainings of this experiment by levamisole which is a
component of the New Fuchsin substrate solution for AP-linked AB development.
Endogenous peroxidase reacts with DAB substrate in HRP-linked AB development. The sections
where HRP-conjugated secondary AB was used were therefore pretreated with hydrogen peroxide
and washed prior to primary AB incubation.
6.8.4. Antibody incubation
The quality of the IHC staining is influenced by a multitude of variables during the AB incubation.
These include the AB dilution, the diluent, the duration of incubation and the temperature. The
optimal dilution of the primary AB is of great importance to achieve a staining which is free of AB
42
precipitation but shows a maximal “signal-to-noise ratio”, that is a peak in the dye intensity while the
background staining is only minimally present. The optimal concentration of the primary AB depends
on the density of AG in the tissue and the affinity of the AB to the AG. AB dilution, incubation time
and temperature are mutually dependent. Long incubation periods allow a high dilution of AB and
also AB’s with lower affinity can bind enough AG to give visible signal and reach equilibrium between
bound and free AG. At high temperatures, such as 37°C the equilibrium is reached quicker allowing
higher AB dilutions whereas long incubation periods should be performed in low temperature and in
a humified chamber to avoid evaporation and to provide a stable milieu. The binding between the AB
and the epitope of the AG derives from hydrogen bonding, van der Waals forces and ionic
interactions in particular, which form the combined strength of the bond described as avidity. The
AG-AB reaction is reversible and depends on the affinity between AG and AB the avidity of the bond
between them. Therefore a stable environment contributes to the stability of the AG-AB complex
whereas the risk for its dissociation during incubation and washing steps is increased by high salt
concentrations and high temperatures as well as very low pH values (Sternfeld T 2002, Boenisch T
2001).
In this work, the optimal dilution of primary AB and its’ relation to the secondary AB was selected
upon an experimental series of dilutions. The slides were dried from buffer and a circle was drawn
around the tissue with a grease pen (DAKO pen) that builds a barrier for the AB solution due to its
hydrophobic nature. The diluted primary AB was pipetted into the centre of the circle and the slides
were stored in a humified chamber and incubated over night at 4°C.
The secondary AB was applied the next day after careful rinsing of the slides in TBS and TBST. The
secondary AB incubation took place for one hour in room temperature and unbound AB was cleared
off in a washing step with TBS and TBST. In all IHC stainings of this work, 90 µl of AB dilution were
pipetted onto the section for incubation.
6.8.5. Development of the dye
AP-linked AB was detected using a freshly prepared New Fuchsin substrate solution. The solution was
filtrated before applying into the tissue slide container. The container was placed on a rising table
apparatus to prevent precipitation during the incubation which lasted about 25 minutes,
immediately followed by thorough rinsing.
The HRP-linked AB was detected using a freshly prepared DAB solution. The slides were cleaned of
DAB after 3 minutes in a washing step by TBST.
43
In double stainings containing AP- and HRP-antibodies, the AP-linked AB was developed first. The
slides were briefly washed in TBS before applying the DAB solution and the final washing step was
carried out in TBST.
6.8.6. Counterstaining
A counterstaining with hematoxylin enhances and visualizes nuclear borders and creates a contrast
to the stained target (Kumar GL et al. 2009).
The slides of this work were counterstained with Mayer’s hematoxylin for 15-20 seconds, washed
with distilled water and finally rinsed under tap water.
6.8.7. Mounting
A cover slip is placed over the stained section to protect the tissue and to increase the clarity for
inspection by microscope. A mounting medium secures the position of the cover slip and preserves
the stained sections (Kumar GL et al. 2009).
The end products of the development with DAB and New Fuchsin substrate solutions are insoluble in
alcohol and other organic solvents. For that reason mounting in either aqueous- or organic based
medium are applicable.
In this work the staining based on New Fuchsin substrate solution was mounted in an aqueous
mounting agent (Aquatex, Merck) directly after counterstaining.
In contrast, double stained sections based on New Fuchsin substrate solution and DAB were
dehydrated in an ascending series of isopropyl alcohol baths of 50 %, 70 % and 90 % concentration,
transferred into 100 % isopropyl alcohol and finally placed in rotisol. An organic based mounting
medium (Entellan, Merck) was used for attachment of the cover slips.
6.9. Immunohistochemistry on paraffin sections
Analysis were performed on brain tissue from six ApdE9 transgenic mice and two wild-type controls.
The group of ApdE9 transgenic mice had two animals per treatment group. The groups were treated
either with high dosage of IFN-β (106 units), low dosage of IFN-β (104 units) or PBS. Wild-type
controls had been treated with high dosage IFN-β or PBS, respectively.
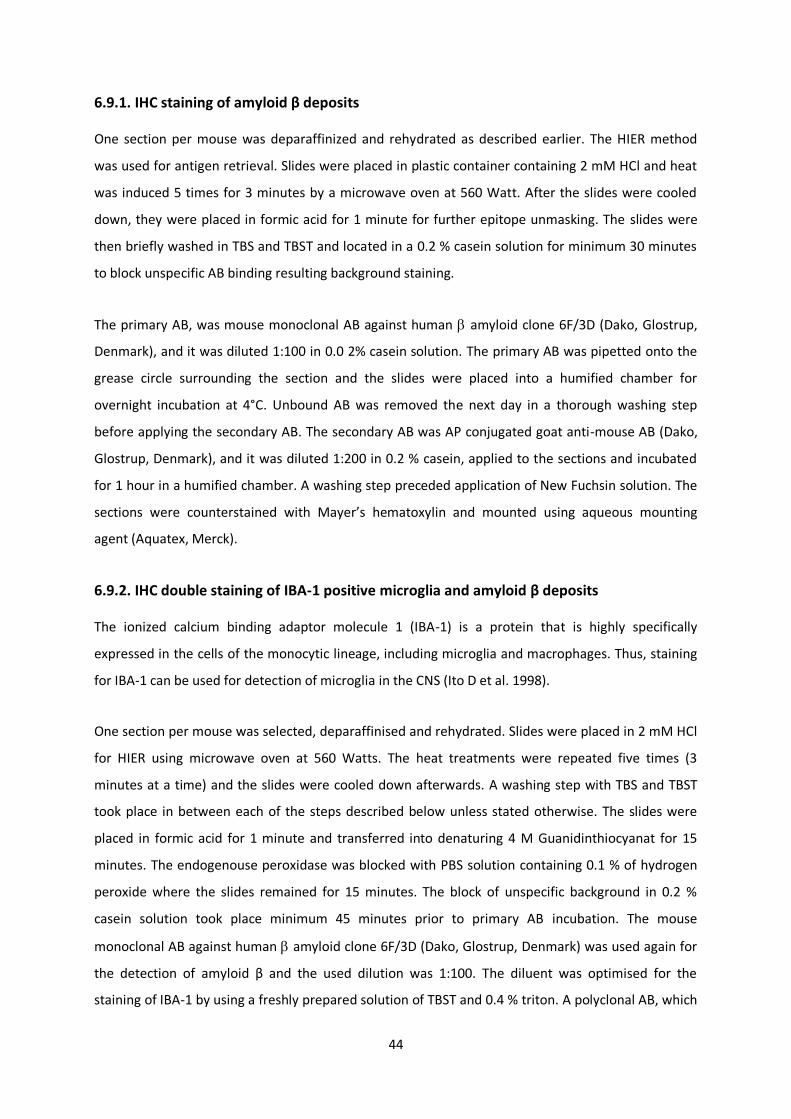
44
6.9.1. IHC staining of amyloid β deposits
One section per mouse was deparaffinized and rehydrated as described earlier. The HIER method
was used for antigen retrieval. Slides were placed in plastic container containing 2 mM HCl and heat
was induced 5 times for 3 minutes by a microwave oven at 560 Watt. After the slides were cooled
down, they were placed in formic acid for 1 minute for further epitope unmasking. The slides were
then briefly washed in TBS and TBST and located in a 0.2 % casein solution for minimum 30 minutes
to block unspecific AB binding resulting background staining.
The primary AB, was mouse monoclonal AB against human amyloid clone 6F/3D (Dako, Glostrup,
Denmark), and it was diluted 1:100 in 0.0 2% casein solution. The primary AB was pipetted onto the
grease circle surrounding the section and the slides were placed into a humified chamber for
overnight incubation at 4°C. Unbound AB was removed the next day in a thorough washing step
before applying the secondary AB. The secondary AB was AP conjugated goat anti-mouse AB (Dako,
Glostrup, Denmark), and it was diluted 1:200 in 0.2 % casein, applied to the sections and incubated
for 1 hour in a humified chamber. A washing step preceded application of New Fuchsin solution. The
sections were counterstained with Mayer’s hematoxylin and mounted using aqueous mounting
agent (Aquatex, Merck).
6.9.2. IHC double staining of IBA-1 positive microglia and amyloid β deposits
The ionized calcium binding adaptor molecule 1 (IBA-1) is a protein that is highly specifically
expressed in the cells of the monocytic lineage, including microglia and macrophages. Thus, staining
for IBA-1 can be used for detection of microglia in the CNS (Ito D et al. 1998).
One section per mouse was selected, deparaffinised and rehydrated. Slides were placed in 2 mM HCl
for HIER using microwave oven at 560 Watts. The heat treatments were repeated five times (3
minutes at a time) and the slides were cooled down afterwards. A washing step with TBS and TBST
took place in between each of the steps described below unless stated otherwise. The slides were
placed in formic acid for 1 minute and transferred into denaturing 4 M Guanidinthiocyanat for 15
minutes. The endogenouse peroxidase was blocked with PBS solution containing 0.1 % of hydrogen
peroxide where the slides remained for 15 minutes. The block of unspecific background in 0.2 %
casein solution took place minimum 45 minutes prior to primary AB incubation. The mouse
monoclonal AB against human amyloid clone 6F/3D (Dako, Glostrup, Denmark) was used again for
the detection of amyloid β and the used dilution was 1:100. The diluent was optimised for the
staining of IBA-1 by using a freshly prepared solution of TBST and 0.4 % triton. A polyclonal AB, which
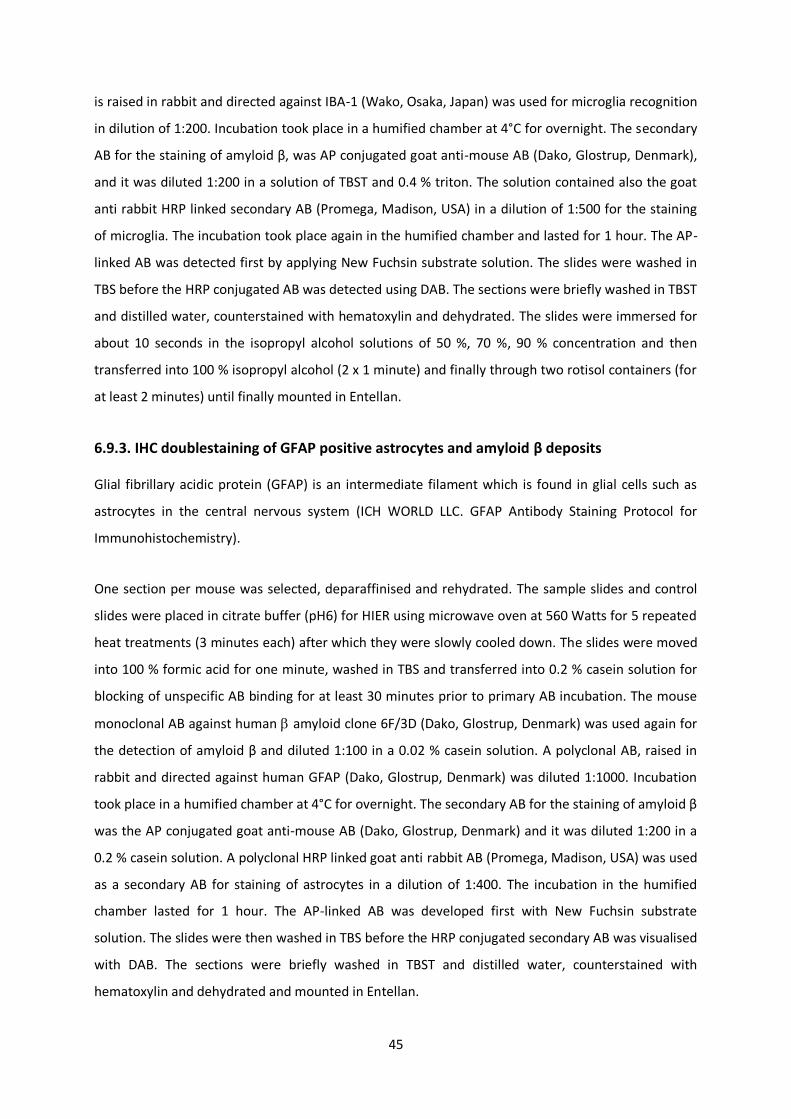
45
is raised in rabbit and directed against IBA-1 (Wako, Osaka, Japan) was used for microglia recognition
in dilution of 1:200. Incubation took place in a humified chamber at 4°C for overnight. The secondary
AB for the staining of amyloid β, was AP conjugated goat anti-mouse AB (Dako, Glostrup, Denmark),
and it was diluted 1:200 in a solution of TBST and 0.4 % triton. The solution contained also the goat
anti rabbit HRP linked secondary AB (Promega, Madison, USA) in a dilution of 1:500 for the staining
of microglia. The incubation took place again in the humified chamber and lasted for 1 hour. The AP-
linked AB was detected first by applying New Fuchsin substrate solution. The slides were washed in
TBS before the HRP conjugated AB was detected using DAB. The sections were briefly washed in TBST
and distilled water, counterstained with hematoxylin and dehydrated. The slides were immersed for
about 10 seconds in the isopropyl alcohol solutions of 50 %, 70 %, 90 % concentration and then
transferred into 100 % isopropyl alcohol (2 x 1 minute) and finally through two rotisol containers (for
at least 2 minutes) until finally mounted in Entellan.
6.9.3. IHC doublestaining of GFAP positive astrocytes and amyloid β deposits
Glial fibrillary acidic protein (GFAP) is an intermediate filament which is found in glial cells such as
astrocytes in the central nervous system (ICH WORLD LLC. GFAP Antibody Staining Protocol for
Immunohistochemistry).
One section per mouse was selected, deparaffinised and rehydrated. The sample slides and control
slides were placed in citrate buffer (pH6) for HIER using microwave oven at 560 Watts for 5 repeated
heat treatments (3 minutes each) after which they were slowly cooled down. The slides were moved
into 100 % formic acid for one minute, washed in TBS and transferred into 0.2 % casein solution for
blocking of unspecific AB binding for at least 30 minutes prior to primary AB incubation. The mouse
monoclonal AB against human amyloid clone 6F/3D (Dako, Glostrup, Denmark) was used again for
the detection of amyloid β and diluted 1:100 in a 0.02 % casein solution. A polyclonal AB, raised in
rabbit and directed against human GFAP (Dako, Glostrup, Denmark) was diluted 1:1000. Incubation
took place in a humified chamber at 4°C for overnight. The secondary AB for the staining of amyloid β
was the AP conjugated goat anti-mouse AB (Dako, Glostrup, Denmark) and it was diluted 1:200 in a
0.2 % casein solution. A polyclonal HRP linked goat anti rabbit AB (Promega, Madison, USA) was used
as a secondary AB for staining of astrocytes in a dilution of 1:400. The incubation in the humified
chamber lasted for 1 hour. The AP-linked AB was developed first with New Fuchsin substrate
solution. The slides were then washed in TBS before the HRP conjugated secondary AB was visualised
with DAB. The sections were briefly washed in TBST and distilled water, counterstained with
hematoxylin and dehydrated and mounted in Entellan.
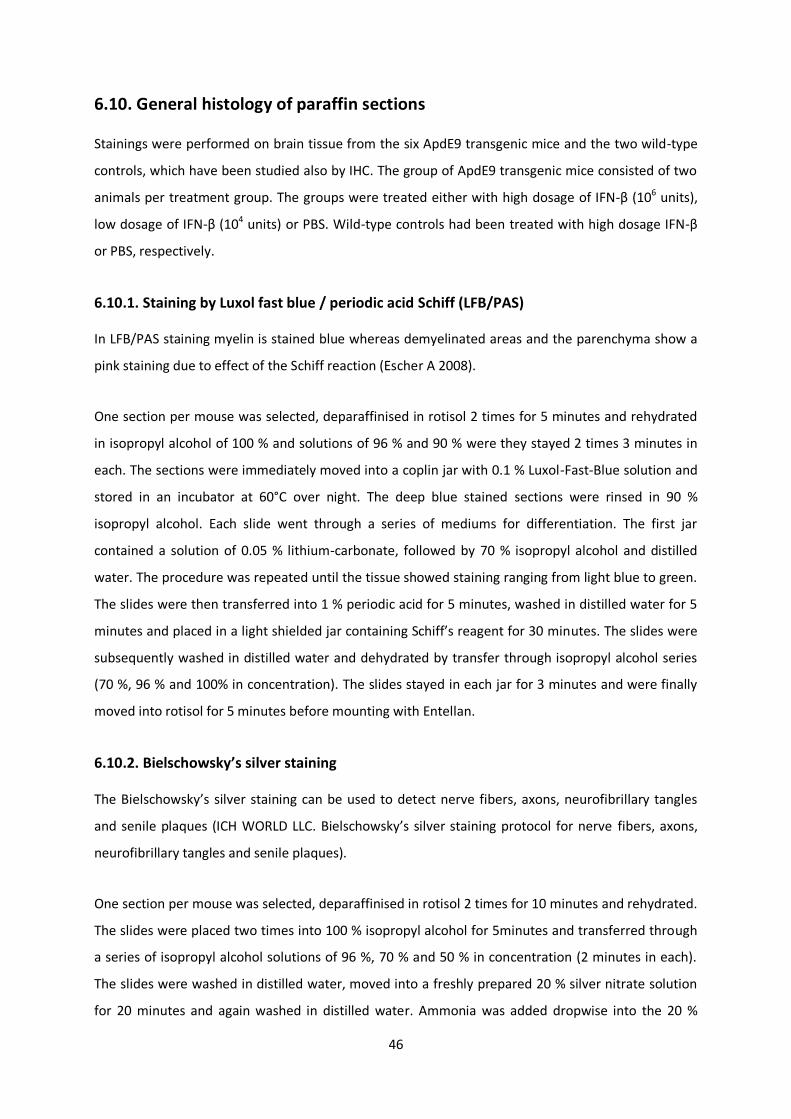
46
6.10. General histology of paraffin sections
Stainings were performed on brain tissue from the six ApdE9 transgenic mice and the two wild-type
controls, which have been studied also by IHC. The group of ApdE9 transgenic mice consisted of two
animals per treatment group. The groups were treated either with high dosage of IFN-β (106 units),
low dosage of IFN-β (104 units) or PBS. Wild-type controls had been treated with high dosage IFN-β
or PBS, respectively.
6.10.1. Staining by Luxol fast blue / periodic acid Schiff (LFB/PAS)
In LFB/PAS staining myelin is stained blue whereas demyelinated areas and the parenchyma show a
pink staining due to effect of the Schiff reaction (Escher A 2008).
One section per mouse was selected, deparaffinised in rotisol 2 times for 5 minutes and rehydrated
in isopropyl alcohol of 100 % and solutions of 96 % and 90 % were they stayed 2 times 3 minutes in
each. The sections were immediately moved into a coplin jar with 0.1 % Luxol-Fast-Blue solution and
stored in an incubator at 60°C over night. The deep blue stained sections were rinsed in 90 %
isopropyl alcohol. Each slide went through a series of mediums for differentiation. The first jar
contained a solution of 0.05 % lithium-carbonate, followed by 70 % isopropyl alcohol and distilled
water. The procedure was repeated until the tissue showed staining ranging from light blue to green.
The slides were then transferred into 1 % periodic acid for 5 minutes, washed in distilled water for 5
minutes and placed in a light shielded jar containing Schiff’s reagent for 30 minutes. The slides were
subsequently washed in distilled water and dehydrated by transfer through isopropyl alcohol series
(70 %, 96 % and 100% in concentration). The slides stayed in each jar for 3 minutes and were finally
moved into rotisol for 5 minutes before mounting with Entellan.
6.10.2. Bielschowsky’s silver staining
The Bielschowsky’s silver staining can be used to detect nerve fibers, axons, neurofibrillary tangles
and senile plaques (ICH WORLD LLC. Bielschowsky’s silver staining protocol for nerve fibers, axons,
neurofibrillary tangles and senile plaques).
One section per mouse was selected, deparaffinised in rotisol 2 times for 10 minutes and rehydrated.
The slides were placed two times into 100 % isopropyl alcohol for 5minutes and transferred through
a series of isopropyl alcohol solutions of 96 %, 70 % and 50 % in concentration (2 minutes in each).
The slides were washed in distilled water, moved into a freshly prepared 20 % silver nitrate solution
for 20 minutes and again washed in distilled water. Ammonia was added dropwise into the 20 %
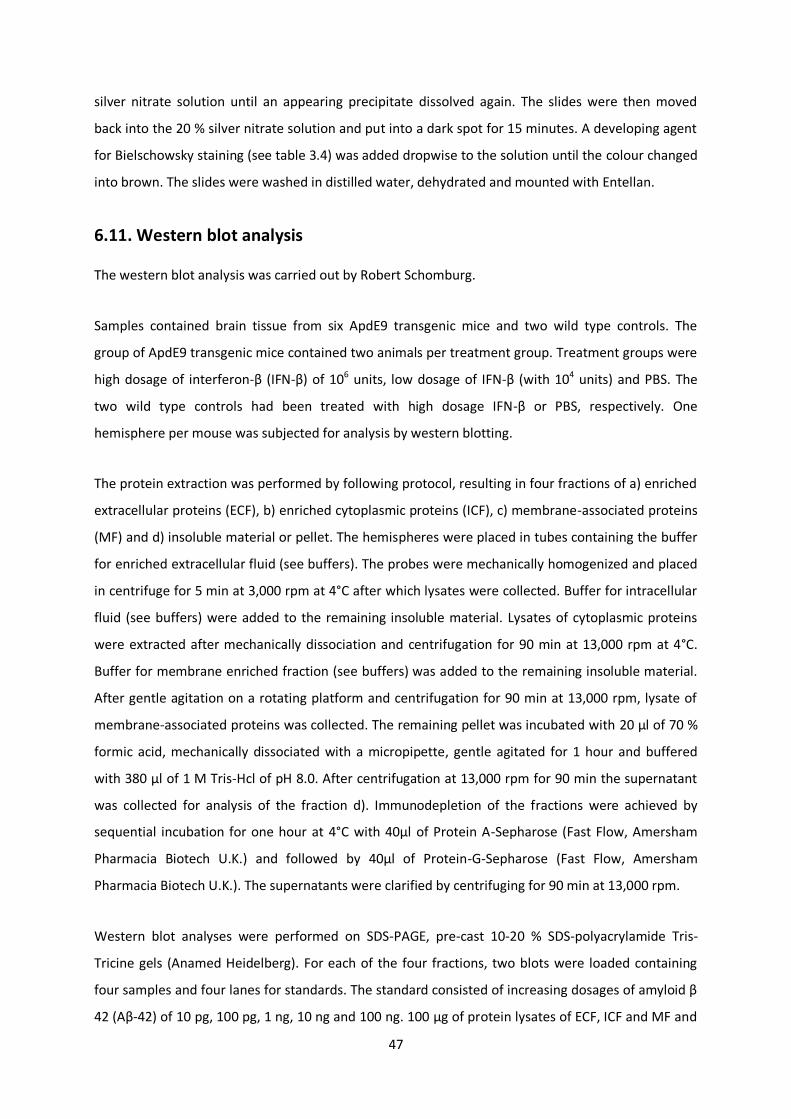
47
silver nitrate solution until an appearing precipitate dissolved again. The slides were then moved
back into the 20 % silver nitrate solution and put into a dark spot for 15 minutes. A developing agent
for Bielschowsky staining (see table 3.4) was added dropwise to the solution until the colour changed
into brown. The slides were washed in distilled water, dehydrated and mounted with Entellan.
6.11. Western blot analysis
The western blot analysis was carried out by Robert Schomburg.
Samples contained brain tissue from six ApdE9 transgenic mice and two wild type controls. The
group of ApdE9 transgenic mice contained two animals per treatment group. Treatment groups were
high dosage of interferon-β (IFN-β) of 106 units, low dosage of IFN-β (with 104 units) and PBS. The
two wild type controls had been treated with high dosage IFN-β or PBS, respectively. One
hemisphere per mouse was subjected for analysis by western blotting.
The protein extraction was performed by following protocol, resulting in four fractions of a) enriched
extracellular proteins (ECF), b) enriched cytoplasmic proteins (ICF), c) membrane-associated proteins
(MF) and d) insoluble material or pellet. The hemispheres were placed in tubes containing the buffer
for enriched extracellular fluid (see buffers). The probes were mechanically homogenized and placed
in centrifuge for 5 min at 3,000 rpm at 4°C after which lysates were collected. Buffer for intracellular
fluid (see buffers) were added to the remaining insoluble material. Lysates of cytoplasmic proteins
were extracted after mechanically dissociation and centrifugation for 90 min at 13,000 rpm at 4°C.
Buffer for membrane enriched fraction (see buffers) was added to the remaining insoluble material.
After gentle agitation on a rotating platform and centrifugation for 90 min at 13,000 rpm, lysate of
membrane-associated proteins was collected. The remaining pellet was incubated with 20 µl of 70 %
formic acid, mechanically dissociated with a micropipette, gentle agitated for 1 hour and buffered
with 380 µl of 1 M Tris-Hcl of pH 8.0. After centrifugation at 13,000 rpm for 90 min the supernatant
was collected for analysis of the fraction d). Immunodepletion of the fractions were achieved by
sequential incubation for one hour at 4°C with 40µl of Protein A-Sepharose (Fast Flow, Amersham
Pharmacia Biotech U.K.) and followed by 40µl of Protein-G-Sepharose (Fast Flow, Amersham
Pharmacia Biotech U.K.). The supernatants were clarified by centrifuging for 90 min at 13,000 rpm.
Western blot analyses were performed on SDS-PAGE, pre-cast 10-20 % SDS-polyacrylamide Tris-
Tricine gels (Anamed Heidelberg). For each of the four fractions, two blots were loaded containing
four samples and four lanes for standards. The standard consisted of increasing dosages of amyloid β
42 (Aβ-42) of 10 pg, 100 pg, 1 ng, 10 ng and 100 ng. 100 µg of protein lysates of ECF, ICF and MF and
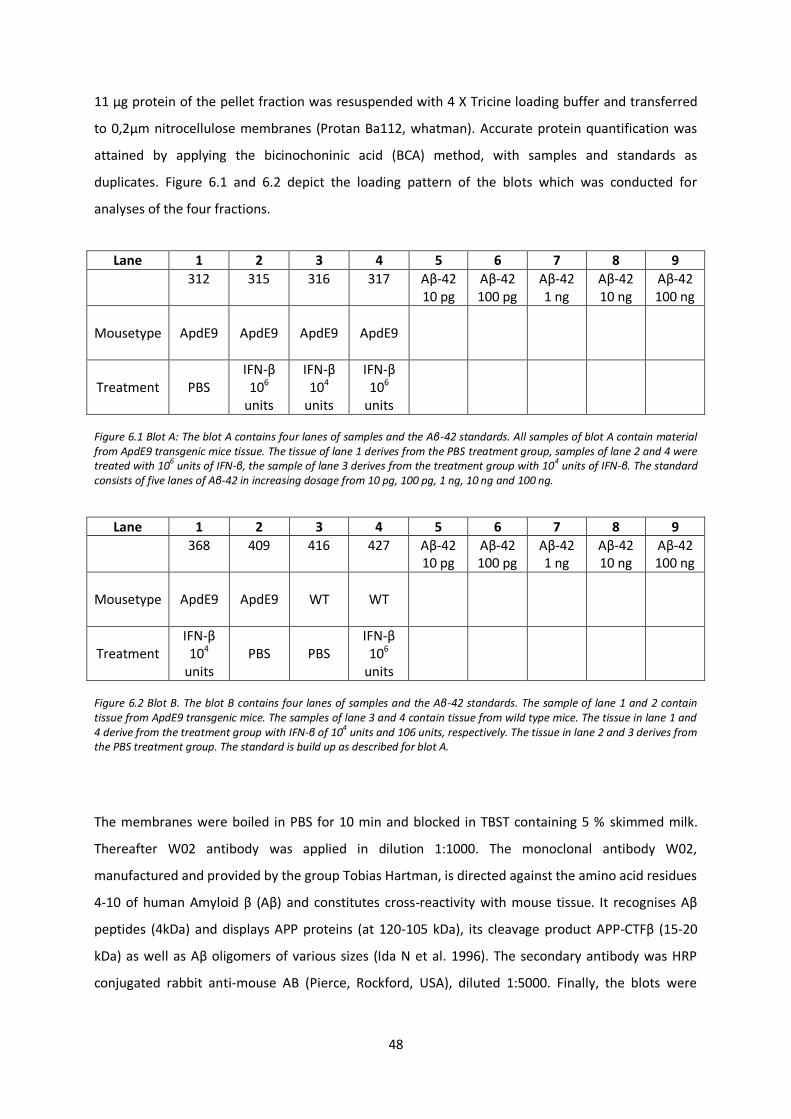
48
11 µg protein of the pellet fraction was resuspended with 4 X Tricine loading buffer and transferred
to 0,2µm nitrocellulose membranes (Protan Ba112, whatman). Accurate protein quantification was
attained by applying the bicinochoninic acid (BCA) method, with samples and standards as
duplicates. Figure 6.1 and 6.2 depict the loading pattern of the blots which was conducted for
analyses of the four fractions.
Lane 1 2 3 4 5 6 7 8 9
312
315 316 317 Aβ-42 10 pg
Aβ-42 100 pg
Aβ-42 1 ng
Aβ-42 10 ng
Aβ-42 100 ng
Mousetype
ApdE9 ApdE9 ApdE9 ApdE9
Treatment PBS IFN-β 106
units
IFN-β 104
units
IFN-β 106
units
Figure 6.1 Blot A: The blot A contains four lanes of samples and the Aβ-42 standards. All samples of blot A contain material from ApdE9 transgenic mice tissue. The tissue of lane 1 derives from the PBS treatment group, samples of lane 2 and 4 were treated with 10
6 units of IFN-β, the sample of lane 3 derives from the treatment group with 10
4 units of IFN-β. The standard
consists of five lanes of Aβ-42 in increasing dosage from 10 pg, 100 pg, 1 ng, 10 ng and 100 ng.
Lane 1 2 3 4 5 6 7 8 9
368 409 416 427 Aβ-42 10 pg
Aβ-42 100 pg
Aβ-42 1 ng
Aβ-42 10 ng
Aβ-42 100 ng
Mousetype
ApdE9 ApdE9 WT WT
Treatment IFN-β 104
units PBS PBS
IFN-β 106
units
Figure 6.2 Blot B. The blot B contains four lanes of samples and the Aβ-42 standards. The sample of lane 1 and 2 contain tissue from ApdE9 transgenic mice. The samples of lane 3 and 4 contain tissue from wild type mice. The tissue in lane 1 and 4 derive from the treatment group with IFN-β of 104 units and 106 units, respectively. The tissue in lane 2 and 3 derives from the PBS treatment group. The standard is build up as described for blot A.
The membranes were boiled in PBS for 10 min and blocked in TBST containing 5 % skimmed milk.
Thereafter W02 antibody was applied in dilution 1:1000. The monoclonal antibody W02,
manufactured and provided by the group Tobias Hartman, is directed against the amino acid residues
4-10 of human Amyloid β (Aβ) and constitutes cross-reactivity with mouse tissue. It recognises Aβ
peptides (4kDa) and displays APP proteins (at 120-105 kDa), its cleavage product APP-CTFβ (15-20
kDa) as well as Aβ oligomers of various sizes (Ida N et al. 1996). The secondary antibody was HRP
conjugated rabbit anti-mouse AB (Pierce, Rockford, USA), diluted 1:5000. Finally, the blots were
49
developed with by an ECL detection system (Western Lightning TM, Chemiluminescence Reagent Plus,
PerkinElmer, Boston, USA).
6.12. Analysis by real-time PCR
The real-time PCR analyses were carried out in collaboration with Maryse Letiembre. Samples
contained brain tissue from six ApdE9 transgenic mice and two wild type controls. The group of
ApdE9 transgenic mice contained two animals per treatment group. Treatment groups were high
dosage of interferon-β (IFN-β) of 106 units, low dosage of IFN-β (with 104 units) and PBS. The two
wild type controls had been treated with high dosage IFN-β or PBS, respectively. One hemisphere per
mouse was subjected for analysis by real-time PCR of one analysis per sample.
6.12.1. RNA isolation
Samples were defrosted, mechanically homogenized and incubated in trizol for five minutes at room
temperature. 0,2 ml chloroform per 1 ml trizol was added to the samples, vigorously shaken for 15
seconds and incubated at room temperature for 2-3min. Samples were centrifuged at 12.000 rpm at
4 °C for 15 minutes and the supernatant containing RNA was collected. RNA was precipitated by
mixing it with 0,5 ml isopropanol per 1 ml of used trizol, vortexed and incubated at room
temperature for 10min. Centrifugation was carried out at 12.000 rpm at 4 °C for 10 minutes. After
removal of the supernatant, the pellet was washed with 75% ethanol, mechanically mixed and
centrifuged at 7.600 rpm at 4 °C for 5 minutes. RNA was air dried for 10 minutes after which 200 µl of
nuclease-free water was added and samples mixed for complete dissolve RNA.
6.12.2. cDNA synthesis
3 µg RNA was mixed with 1 µl of 10 mM dNTPs, 0,5 µl of random primers and water. After incubation
at 65 °C for 5 minutes, samples were chilled on ice for 2 minutes and centrifuged for 30 seconds. The
reaction mixture containing the superscript II reverse transcriptase was added and tubes were stored
at room temperature for 10 minutes, subsequently incubated at 42 °C for 1 hour and finally heat
inactivated at 70° C for 10 minutes.
6.12.3. real-time PCR
Real-time quantitative PCR was carried by using the Applied Biosystems 7500 Sequence Detection
Systems. Primers were used for amplification of the following test cDNAs: tumor necrosis factor α
(TNF-α), interleukin-6 (IL-6), interleukin-10 (IL-10), transforming growth factor-β (TGF-β), glial
fibrillary acidic protein (GFAP), cluster of differentiation-14(CD14), Toll-like-receptore-2 (TLR-2) and -
50
4 (TLR-4), respectively. Treshold cycles (Ct) for each cDNA were detected utilizing fluorescent dye
Mesa green RT-SY2X-03-WOULR. Treshold cycles from each test cDNA and the control
glyceraldehyde-3-phosphate dehydrogenase (GAPDH) was determined from the same cDNA
preparations. Ct values of the test cDNAs were normalized to the Ct values of the GAPDH control
from the same cDNA preparations, given . The rate of
transcription of each test cDNA was determinded by the calculation of 2 ( ).
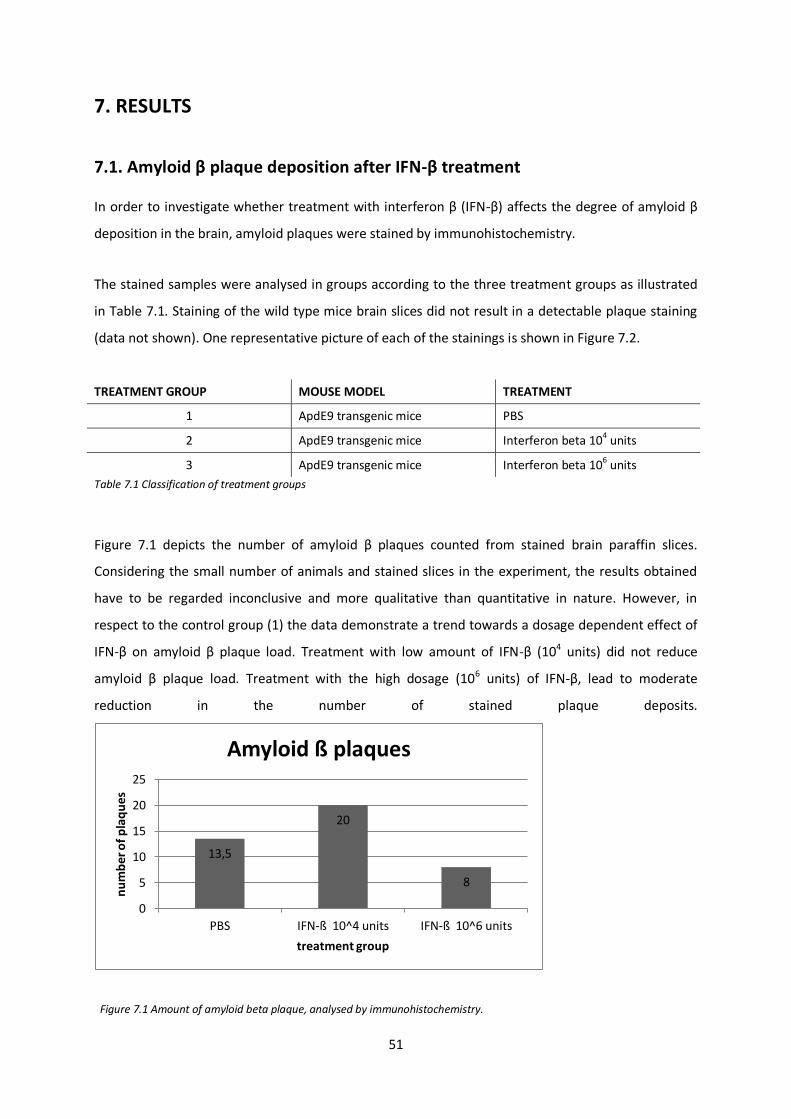
51
7. RESULTS
7.1. Amyloid β plaque deposition after IFN-β treatment
In order to investigate whether treatment with interferon β (IFN-β) affects the degree of amyloid β
deposition in the brain, amyloid plaques were stained by immunohistochemistry.
The stained samples were analysed in groups according to the three treatment groups as illustrated
in Table 7.1. Staining of the wild type mice brain slices did not result in a detectable plaque staining
(data not shown). One representative picture of each of the stainings is shown in Figure 7.2.
TREATMENT GROUP MOUSE MODEL TREATMENT
1 ApdE9 transgenic mice PBS
2 ApdE9 transgenic mice Interferon beta 104 units
3 ApdE9 transgenic mice Interferon beta 106 units
Table 7.1 Classification of treatment groups
Figure 7.1 depicts the number of amyloid β plaques counted from stained brain paraffin slices.
Considering the small number of animals and stained slices in the experiment, the results obtained
have to be regarded inconclusive and more qualitative than quantitative in nature. However, in
respect to the control group (1) the data demonstrate a trend towards a dosage dependent effect of
IFN-β on amyloid β plaque load. Treatment with low amount of IFN-β (104 units) did not reduce
amyloid β plaque load. Treatment with the high dosage (106 units) of IFN-β, lead to moderate
reduction in the number of stained plaque deposits.
Figure 7.1 Amount of amyloid beta plaque, analysed by immunohistochemistry.
13,5
20
8
0
5
10
15
20
25
PBS IFN-ß 10^4 units IFN-ß 10^6 units
nu
mb
er o
f p
laq
ue
s
treatment group
Amyloid ß plaques
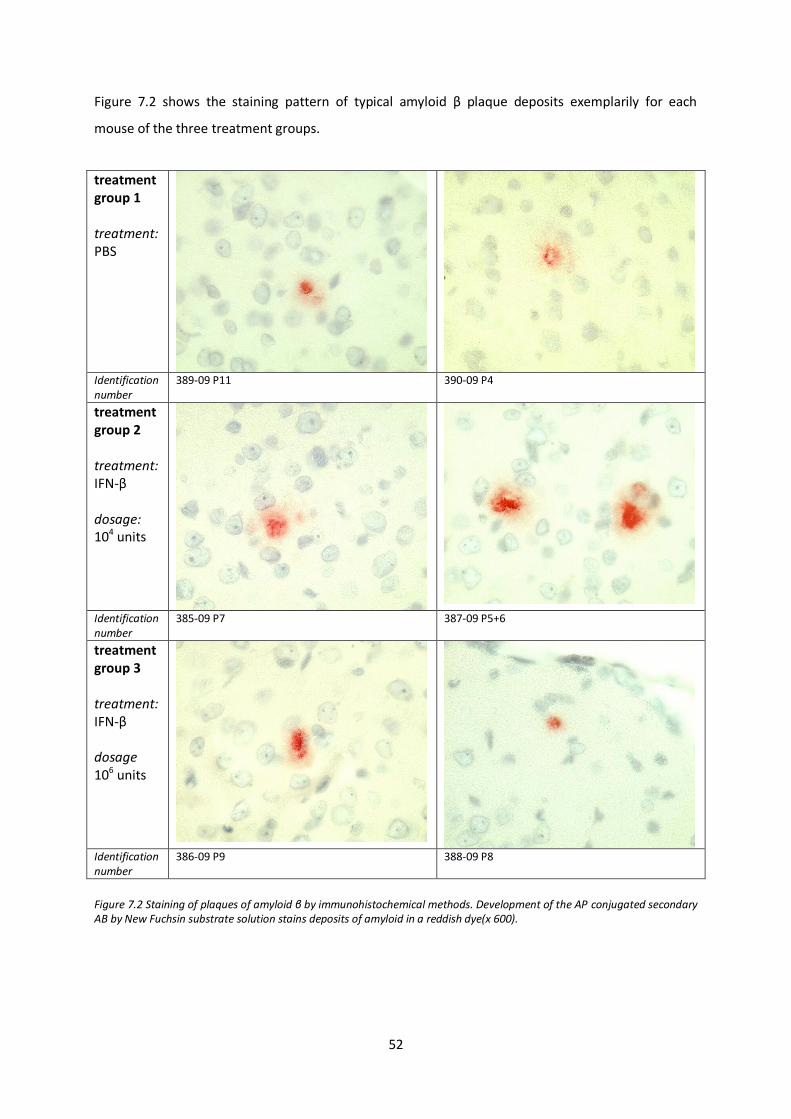
52
Figure 7.2 shows the staining pattern of typical amyloid β plaque deposits exemplarily for each
mouse of the three treatment groups.
treatment group 1 treatment: PBS
Identification number
389-09 P11 390-09 P4
treatment group 2 treatment: IFN-β dosage: 104 units
Identification number
385-09 P7
387-09 P5+6
treatment group 3 treatment: IFN-β dosage 106 units
Identification number
386-09 P9 388-09 P8
Figure 7.2 Staining of plaques of amyloid β by immunohistochemical methods. Development of the AP conjugated secondary AB by New Fuchsin substrate solution stains deposits of amyloid in a reddish dye(x 600).
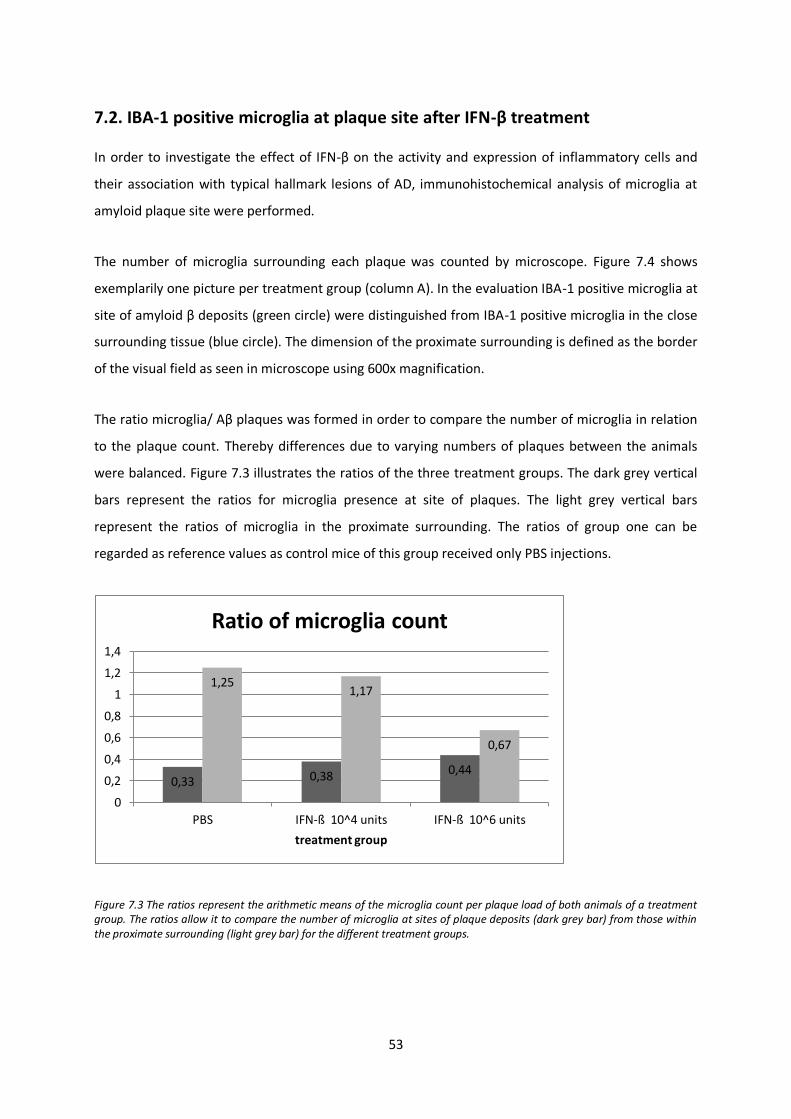
53
7.2. IBA-1 positive microglia at plaque site after IFN-β treatment
In order to investigate the effect of IFN-β on the activity and expression of inflammatory cells and
their association with typical hallmark lesions of AD, immunohistochemical analysis of microglia at
amyloid plaque site were performed.
The number of microglia surrounding each plaque was counted by microscope. Figure 7.4 shows
exemplarily one picture per treatment group (column A). In the evaluation IBA-1 positive microglia at
site of amyloid β deposits (green circle) were distinguished from IBA-1 positive microglia in the close
surrounding tissue (blue circle). The dimension of the proximate surrounding is defined as the border
of the visual field as seen in microscope using 600x magnification.
The ratio microglia/ Aβ plaques was formed in order to compare the number of microglia in relation
to the plaque count. Thereby differences due to varying numbers of plaques between the animals
were balanced. Figure 7.3 illustrates the ratios of the three treatment groups. The dark grey vertical
bars represent the ratios for microglia presence at site of plaques. The light grey vertical bars
represent the ratios of microglia in the proximate surrounding. The ratios of group one can be
regarded as reference values as control mice of this group received only PBS injections.
Figure 7.3 The ratios represent the arithmetic means of the microglia count per plaque load of both animals of a treatment group. The ratios allow it to compare the number of microglia at sites of plaque deposits (dark grey bar) from those within the proximate surrounding (light grey bar) for the different treatment groups.
0,33 0,38 0,44
1,25 1,17
0,67
0
0,2
0,4
0,6
0,8
1
1,2
1,4
PBS IFN-ß 10^4 units IFN-ß 10^6 units
treatment group
Ratio of microglia count

54
The results showed that the ratio of microglia at site of plaques versus total plaque count increases
from 0,33 in the control group to 0,38 in the group of low dose IFN-β treatment and up to 0,44 in the
group that received high dose IFN-β treatment. Respectively, an adverse dosage dependent effect
can be seen regarding the presence of microglia in the surrounding tissue. Taken the ratio of 1,25 of
the control group, the ratio decreases slightly to 1,17 in the group of low dose IFN-β and to 0,67 in
the group of high dose IFN-β treatment. Given the very small numbers of animals and stained slices
statistically significant results cannot be obtained. However, with increasing dosage of IFN-β the
microglia seem to shift from unspecific location in the surrounding tissue towards amyloid β plaque.
(Figure 7.3)
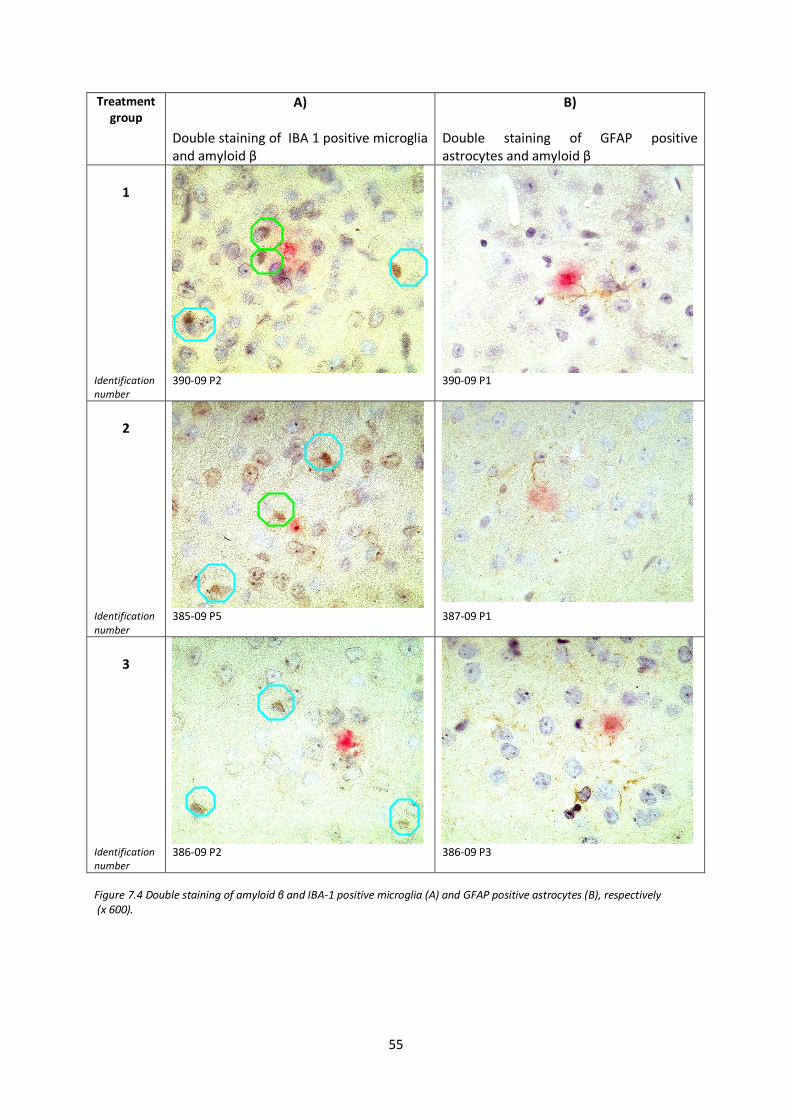
55
Treatment group
A) Double staining of IBA 1 positive microglia and amyloid β
B) Double staining of GFAP positive astrocytes and amyloid β
1
Identification number
390-09 P2 390-09 P1
2
Identification
number 385-09 P5 387-09 P1
3
Identification number
386-09 P2 386-09 P3
Figure 7.4 Double staining of amyloid β and IBA-1 positive microglia (A) and GFAP positive astrocytes (B), respectively (x 600).
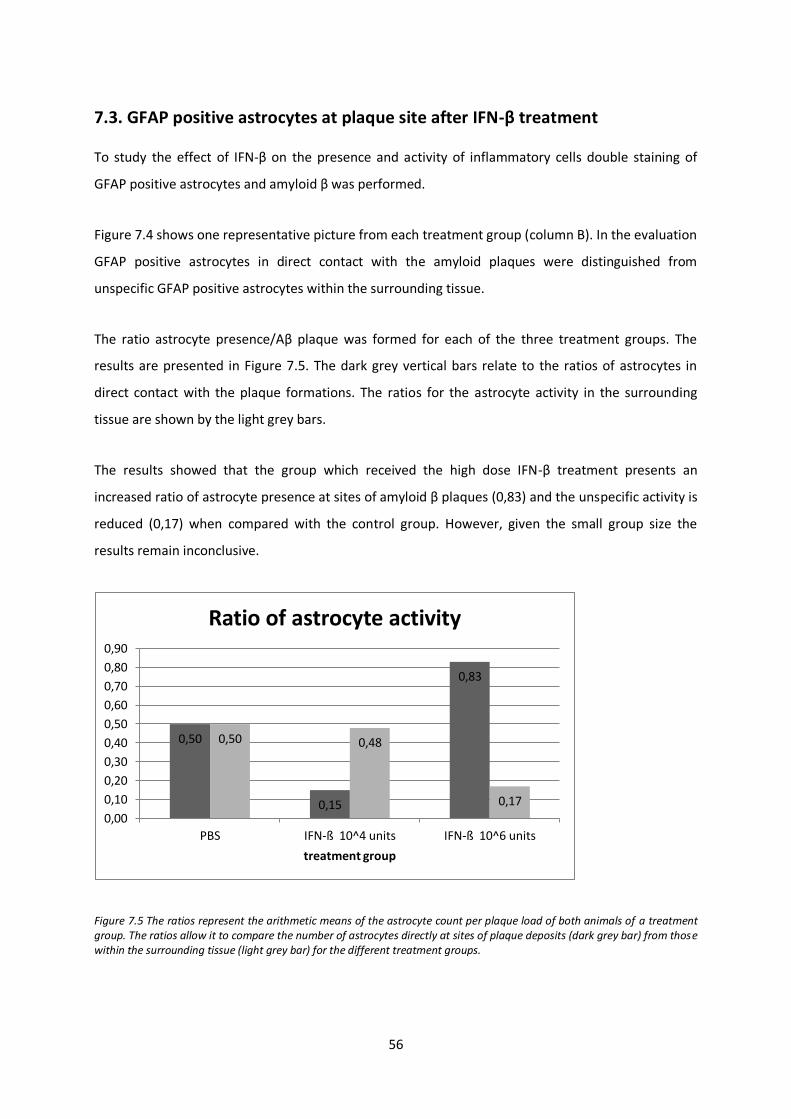
56
7.3. GFAP positive astrocytes at plaque site after IFN-β treatment
To study the effect of IFN-β on the presence and activity of inflammatory cells double staining of
GFAP positive astrocytes and amyloid β was performed.
Figure 7.4 shows one representative picture from each treatment group (column B). In the evaluation
GFAP positive astrocytes in direct contact with the amyloid plaques were distinguished from
unspecific GFAP positive astrocytes within the surrounding tissue.
The ratio astrocyte presence/Aβ plaque was formed for each of the three treatment groups. The
results are presented in Figure 7.5. The dark grey vertical bars relate to the ratios of astrocytes in
direct contact with the plaque formations. The ratios for the astrocyte activity in the surrounding
tissue are shown by the light grey bars.
The results showed that the group which received the high dose IFN-β treatment presents an
increased ratio of astrocyte presence at sites of amyloid β plaques (0,83) and the unspecific activity is
reduced (0,17) when compared with the control group. However, given the small group size the
results remain inconclusive.
Figure 7.5 The ratios represent the arithmetic means of the astrocyte count per plaque load of both animals of a treatment group. The ratios allow it to compare the number of astrocytes directly at sites of plaque deposits (dark grey bar) from those within the surrounding tissue (light grey bar) for the different treatment groups.
0,50
0,15
0,83
0,50 0,48
0,17
0,00
0,10
0,20
0,30
0,40
0,50
0,60
0,70
0,80
0,90
PBS IFN-ß 10^4 units IFN-ß 10^6 units
treatment group
Ratio of astrocyte activity
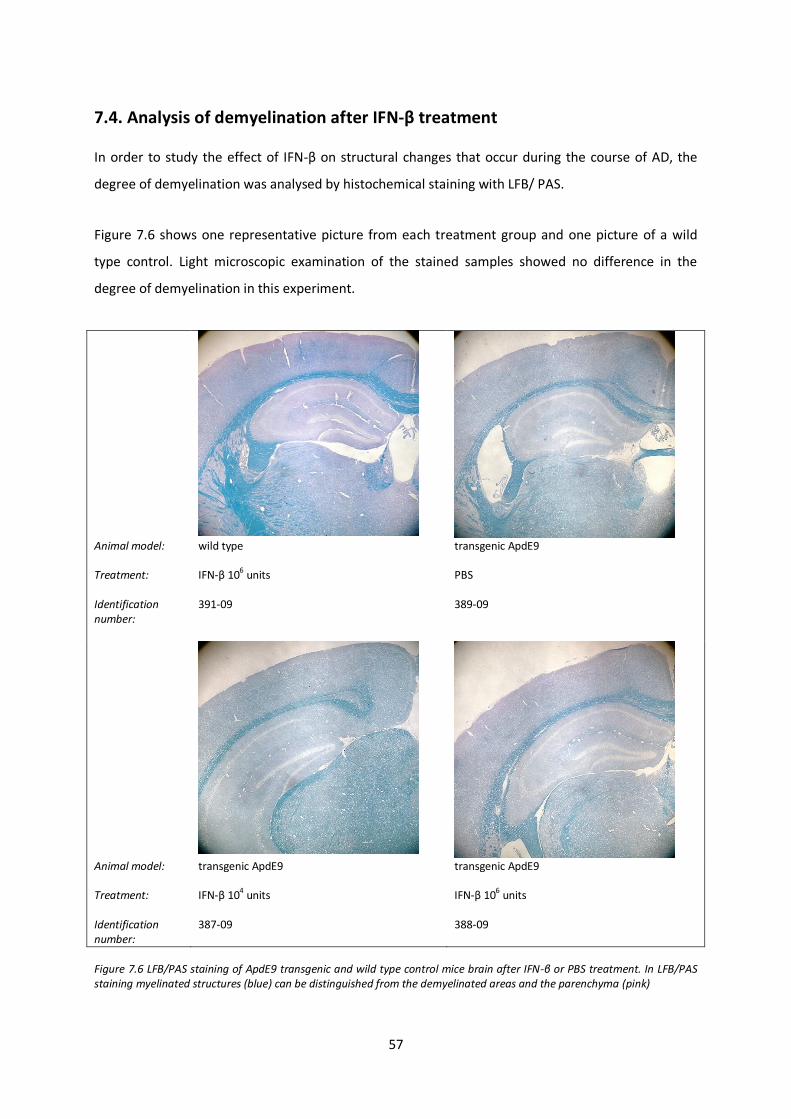
57
7.4. Analysis of demyelination after IFN-β treatment
In order to study the effect of IFN-β on structural changes that occur during the course of AD, the
degree of demyelination was analysed by histochemical staining with LFB/ PAS.
Figure 7.6 shows one representative picture from each treatment group and one picture of a wild
type control. Light microscopic examination of the stained samples showed no difference in the
degree of demyelination in this experiment.
Animal model: Treatment: Identification number:
wild type IFN-β 106 units 391-09
transgenic ApdE9 PBS 389-09
Animal model: Treatment: Identification number:
transgenic ApdE9 IFN-β 104 units 387-09
transgenic ApdE9 IFN-β 106 units 388-09
Figure 7.6 LFB/PAS staining of ApdE9 transgenic and wild type control mice brain after IFN-β or PBS treatment. In LFB/PAS staining myelinated structures (blue) can be distinguished from the demyelinated areas and the parenchyma (pink)
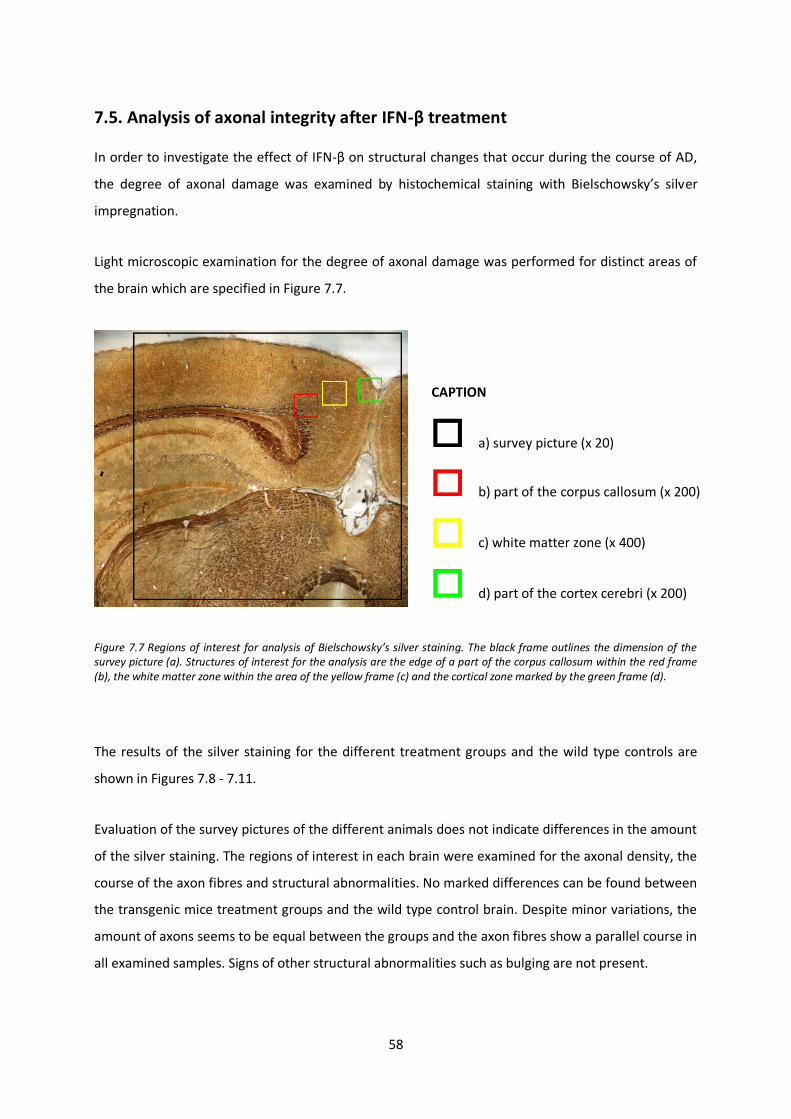
58
7.5. Analysis of axonal integrity after IFN-β treatment
In order to investigate the effect of IFN-β on structural changes that occur during the course of AD,
the degree of axonal damage was examined by histochemical staining with Bielschowsky’s silver
impregnation.
Light microscopic examination for the degree of axonal damage was performed for distinct areas of
the brain which are specified in Figure 7.7.
Figure 7.7 Regions of interest for analysis of Bielschowsky’s silver staining. The black frame outlines the dimension of the survey picture (a). Structures of interest for the analysis are the edge of a part of the corpus callosum within the red frame (b), the white matter zone within the area of the yellow frame (c) and the cortical zone marked by the green frame (d).
The results of the silver staining for the different treatment groups and the wild type controls are
shown in Figures 7.8 - 7.11.
Evaluation of the survey pictures of the different animals does not indicate differences in the amount
of the silver staining. The regions of interest in each brain were examined for the axonal density, the
course of the axon fibres and structural abnormalities. No marked differences can be found between
the transgenic mice treatment groups and the wild type control brain. Despite minor variations, the
amount of axons seems to be equal between the groups and the axon fibres show a parallel course in
all examined samples. Signs of other structural abnormalities such as bulging are not present.
CAPTION
a) survey picture (x 20)
b) part of the corpus callosum (x 200)
c) white matter zone (x 400)
d) part of the cortex cerebri (x 200)
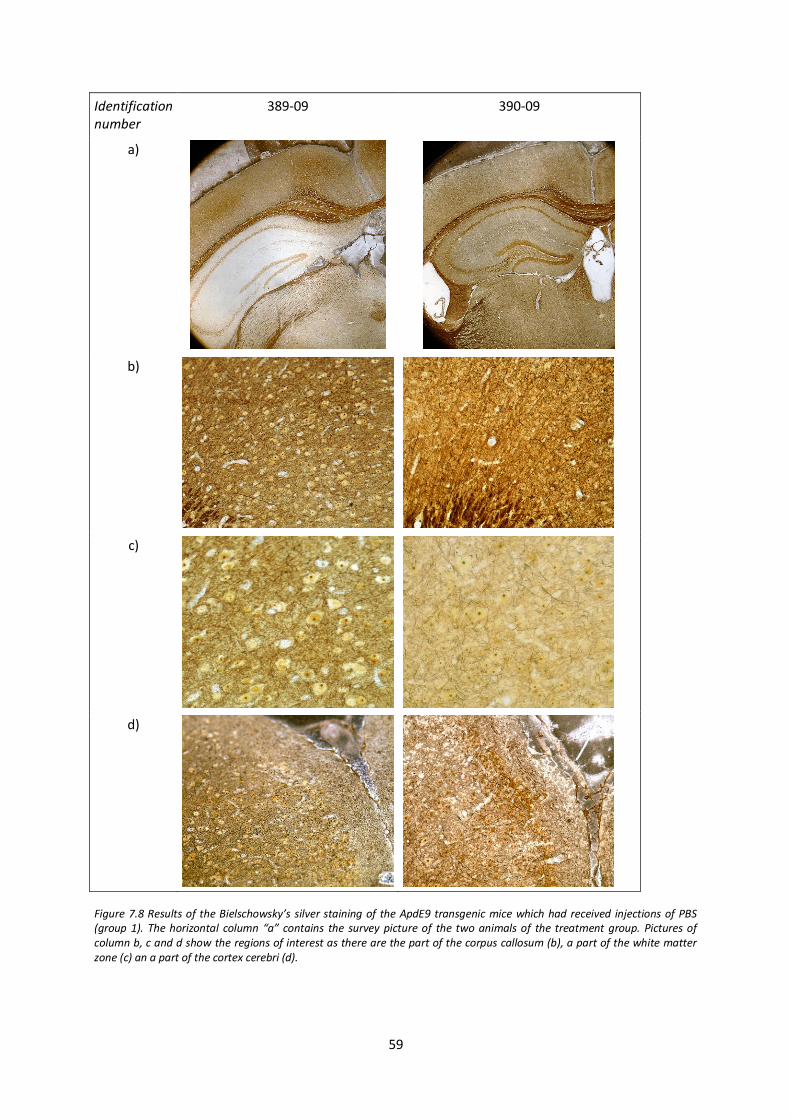
59
Identification number
389-09 390-09
a)
b)
c)
d)
Figure 7.8 Results of the Bielschowsky’s silver staining of the ApdE9 transgenic mice which had received injections of PBS (group 1). The horizontal column “a” contains the survey picture of the two animals of the treatment group. Pictures of column b, c and d show the regions of interest as there are the part of the corpus callosum (b), a part of the white matter zone (c) an a part of the cortex cerebri (d).
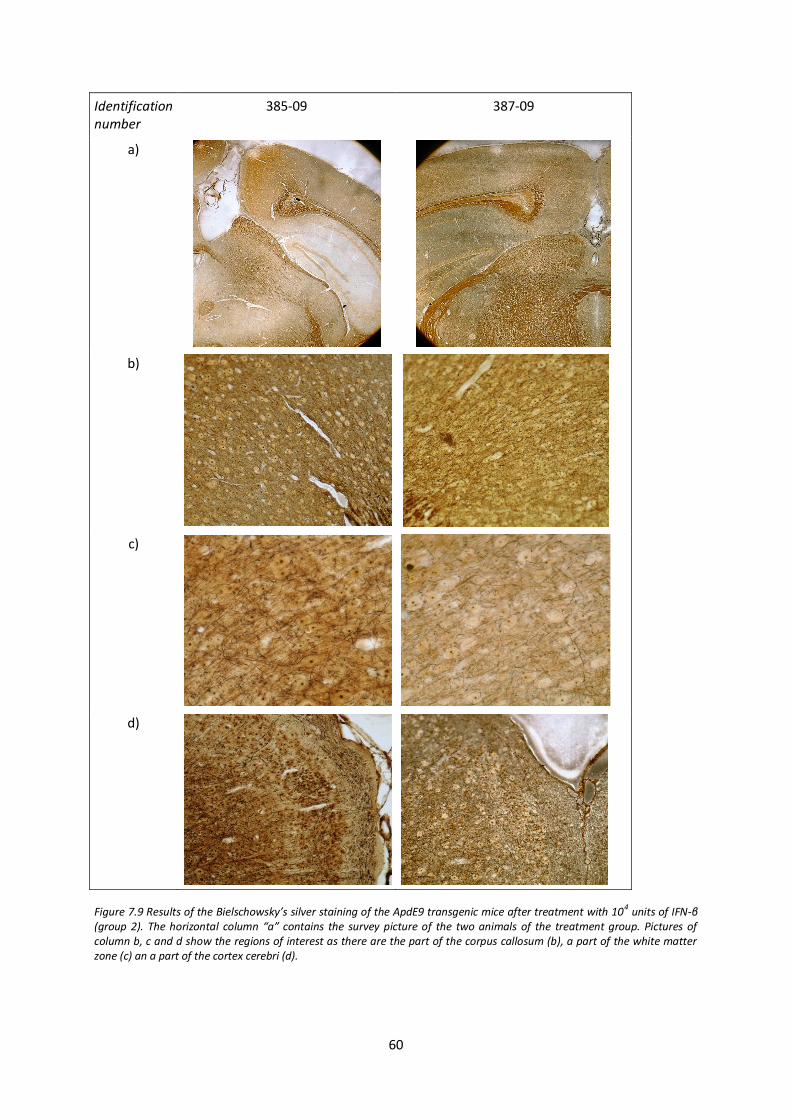
60
Identification number
385-09 387-09
a)
b)
c)
d)
Figure 7.9 Results of the Bielschowsky’s silver staining of the ApdE9 transgenic mice after treatment with 104 units of IFN-β (group 2). The horizontal column “a” contains the survey picture of the two animals of the treatment group. Pictures of column b, c and d show the regions of interest as there are the part of the corpus callosum (b), a part of the white matter zone (c) an a part of the cortex cerebri (d).
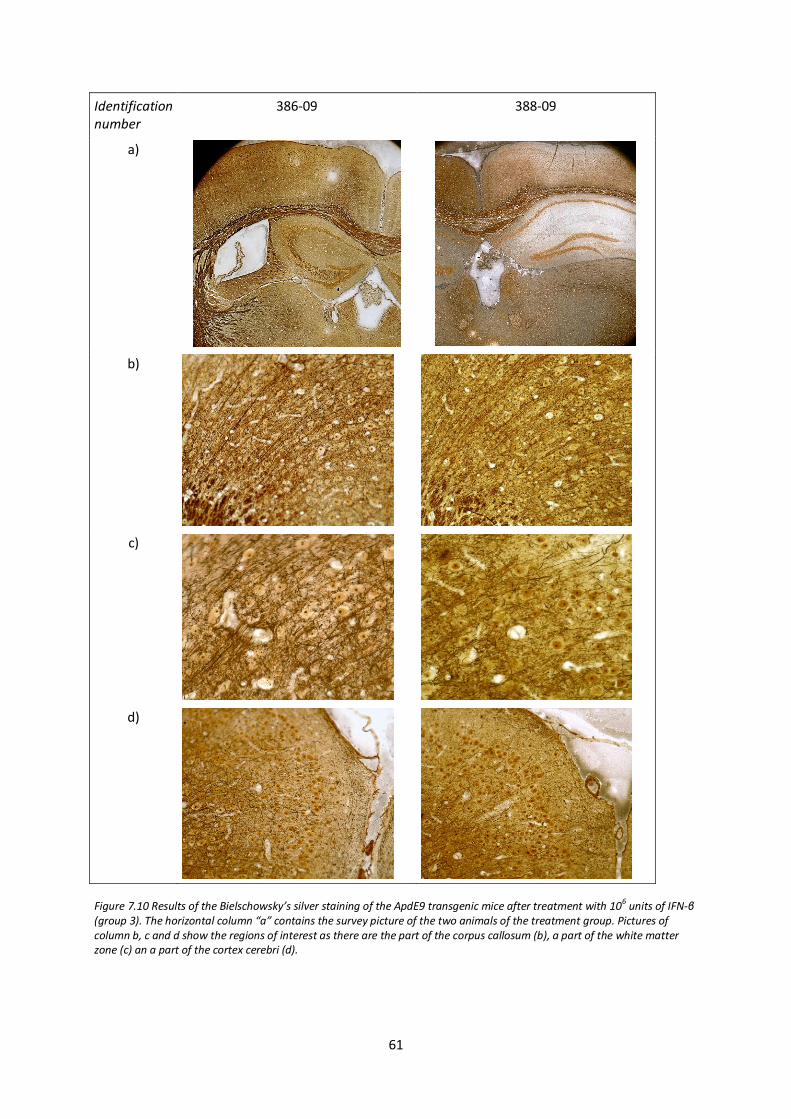
61
Identification number
386-09 388-09
a)
b)
c)
d)
Figure 7.10 Results of the Bielschowsky’s silver staining of the ApdE9 transgenic mice after treatment with 10
6 units of IFN-β
(group 3). The horizontal column “a” contains the survey picture of the two animals of the treatment group. Pictures of column b, c and d show the regions of interest as there are the part of the corpus callosum (b), a part of the white matter zone (c) an a part of the cortex cerebri (d).
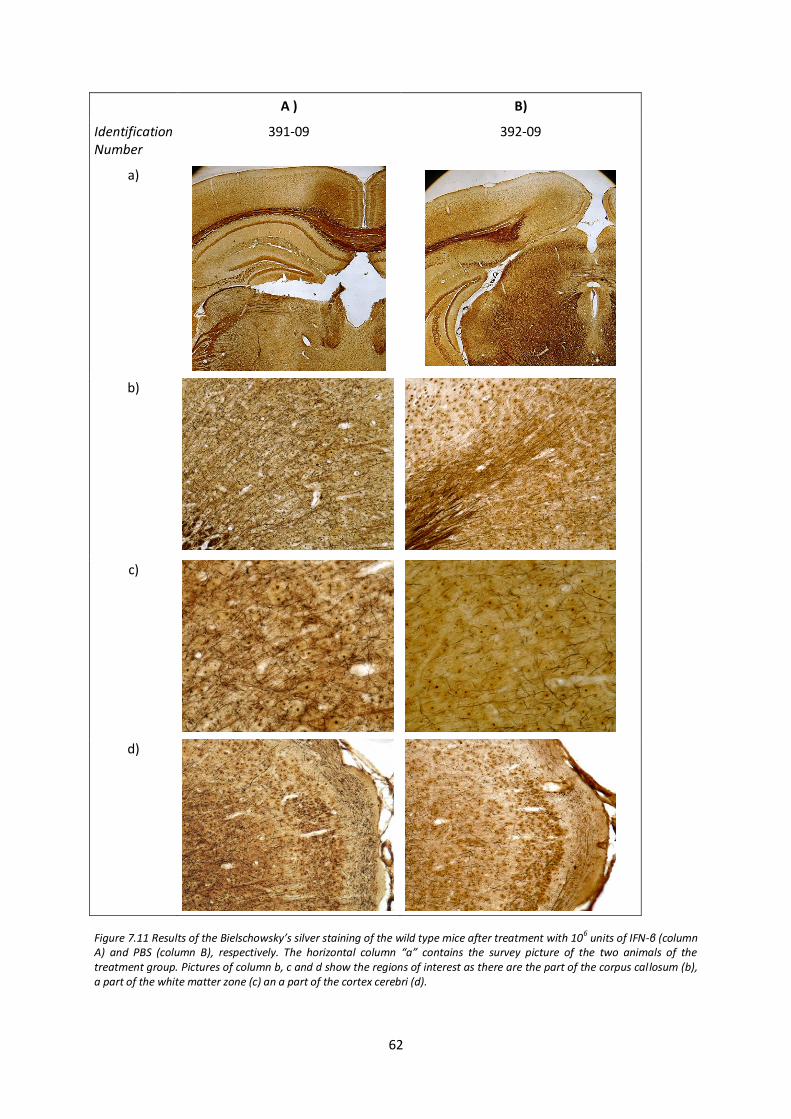
62
A ) B)
Identification Number
391-09 392-09
a)
b)
c)
d)
Figure 7.11 Results of the Bielschowsky’s silver staining of the wild type mice after treatment with 10
6 units of IFN-β (column
A) and PBS (column B), respectively. The horizontal column “a” contains the survey picture of the two animals of the treatment group. Pictures of column b, c and d show the regions of interest as there are the part of the corpus callosum (b), a part of the white matter zone (c) an a part of the cortex cerebri (d).
63
7.6. Semi-quantitative analysis of amyloid β after IFN-β treatment by western
blotting
In order to investigate, whether treatment with interferon β affects the amount and distribution of
amyloid β (Aβ) in vivo, semi-quantitative analysis of brain samples was performed by western
blotting.
The western blots for the four fractions of enriched extracellular protein (ECF), intracellular proteins
(ICF), membrane-associated-proteins (MF) and pellet are demonstrated in figure x1, x2, x3 and x4,
respectively. The results of each fraction are shown by two blots, A and B. Blot A contains only
samples from ApdE9 mice. The samples derive from treatment with PBS (lane 1), 104 units of IFN-β
(lane 3) and 106 units of IFN-β (lane 2 and 4) (see figure 6.1). Blot B contains samples from ApdE9
mice in lane 1 and 2 and the wild-type controls in lane 3 and 4. The samples derive from treatment of
PBS (lane 2 and 3), 104 units of IFN-β (lane 1) and 106 units of IFN-β (lane 4). The lanes 5 -9 in blot A
and B comprise the standard of Aβ-42 in increasing concentration as 10 pg, 100 p g, 1 ng, 10 ng and
100ng (see figure 6.2).
Figure 7.12 contains the western blot analysis for ECF. All four sample lanes of blot A as well as the
lane 1 and 2 of blot B shows a strong staining in the area of 110-130kDa, illustrating the recognition
of the amyloid precursor protein (APP). The area is also represented in lane 3 and 4 of blot B, which
contain samples from wild-type mice, however staining is distinctly less pronounced. A similar
staining pattern can be seen in the area of 15 kDa, where is clear staining in sample lanes of blot A
and the first two lanes of blot B, though considerable differences in the staining intensity cannot be
seen. Staining in lane 3 and 4 of blot B is clearly less intense. Consistent staining in all sample lanes of
blot A and B can be seen in the area of 80-90 kDa, and several bands between 40-70 kDa. The area of
interest at about 4 kDa, representing staining of the soluble amyloid-β peptide (Aβ) is not visually
detectable in the lanes containing the wild-type samples (blot b, lane 3 and 4), whereas all samples
from ApdE9 mice show staining. The staining intensity in those lanes is comparable with the Aβ
standard between 100 pg and 1 ng of Aβ-42. However, distinct differences cannot be stated. The
staining of lane 1 of blot A and blot B appear to be more pronounced, compared to other lanes of
ApdE9 samples.
Figure 7.13 contains the western blot analysis for enriched ICF. The staining pattern is consistent to
the results of the ECR, concerning the staining of APP (110-130 kDa). A concordant staining pattern
can be seen in the area of 15 kDa, with clearly weaker staining for wild-type samples. Staining in the
64
area of 80-90 and between 40-70 kDa seem to be conferrable to the results of ECF, despite a weaker
staining in lane 4 of blot A, deriving from artefacts. The staining of Aβ at 4 kDa can be detected in all
ApdE9 samples, represented by lane 1-4 of blot A and lanes 1 - 2 of blot B with an staining intensity
comparable to the Aβ-42 standard at 10-100 pg. Distinct differences in the staining intensity cannot
be seen.
Figure 7.14 contains the western blot analysis of enriched MF. Samples from ApdE9 tissue (sample
lanes blot A and lanes 1-2 of blot B) express a maximal staining 110-130 kDa (APP) and further at the
area of 15 kDa. At the area of 30 kDa staining in the ApdE9 samples is comparable with Aβ-42
controls at 100 pg – 1 ng, whereas wild-types express a slightly less intensive staining. Staining in
other areas are homogeneously found in all sample lanes. Staining of Aβ cannot be distinguished
from artefacts with certainty.
Figure 7.15 contains the western blot analysis of insoluble material. In contrast to the results of the
other fractions, the blots do not express staining in the area that represents APP. Staining in the area
of 40-70 kDa and 15 kDa is homogeneously present in all sample lanes of blot A and blot B. Staining
for Aβ cannot be detected in the area of 4 kDa.
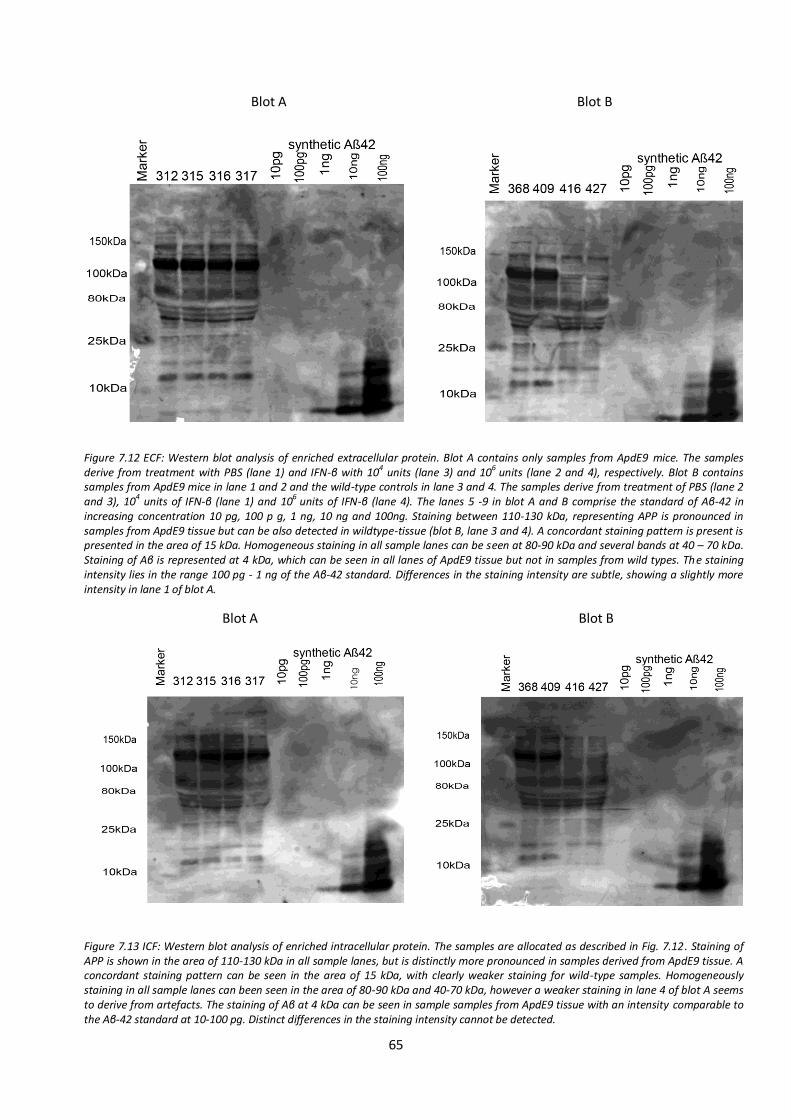
65
Blot A Blot B
Blot A Blot B
Figure 7.12 ECF: Western blot analysis of enriched extracellular protein. Blot A contains only samples from ApdE9 mice. The samples derive from treatment with PBS (lane 1) and IFN-β with 104 units (lane 3) and 106 units (lane 2 and 4), respectively. Blot B contains samples from ApdE9 mice in lane 1 and 2 and the wild-type controls in lane 3 and 4. The samples derive from treatment of PBS (lane 2 and 3), 10
4 units of IFN-β (lane 1) and 10
6 units of IFN-β (lane 4). The lanes 5 -9 in blot A and B comprise the standard of Aβ-42 in
increasing concentration 10 pg, 100 p g, 1 ng, 10 ng and 100ng. Staining between 110-130 kDa, representing APP is pronounced in samples from ApdE9 tissue but can be also detected in wildtype-tissue (blot B, lane 3 and 4). A concordant staining pattern is present is presented in the area of 15 kDa. Homogeneous staining in all sample lanes can be seen at 80-90 kDa and several bands at 40 – 70 kDa. Staining of Aβ is represented at 4 kDa, which can be seen in all lanes of ApdE9 tissue but not in samples from wild types. The staining intensity lies in the range 100 pg - 1 ng of the Aβ-42 standard. Differences in the staining intensity are subtle, showing a slightly more intensity in lane 1 of blot A.
Figure 7.13 ICF: Western blot analysis of enriched intracellular protein. The samples are allocated as described in Fig. 7.12. Staining of APP is shown in the area of 110-130 kDa in all sample lanes, but is distinctly more pronounced in samples derived from ApdE9 tissue. A concordant staining pattern can be seen in the area of 15 kDa, with clearly weaker staining for wild-type samples. Homogeneously staining in all sample lanes can been seen in the area of 80-90 kDa and 40-70 kDa, however a weaker staining in lane 4 of blot A seems to derive from artefacts. The staining of Aβ at 4 kDa can be seen in sample samples from ApdE9 tissue with an intensity comparable to the Aβ-42 standard at 10-100 pg. Distinct differences in the staining intensity cannot be detected.
10n
g
ng
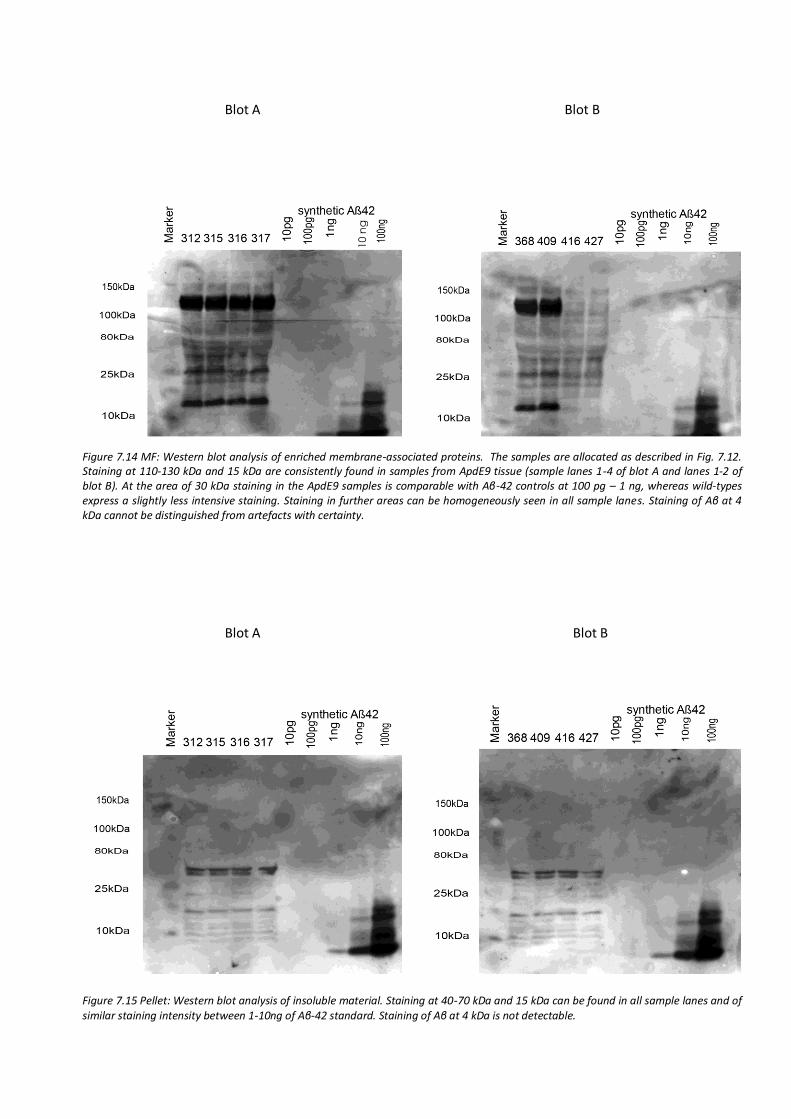
66
Blot A Blot B
Blot A Blot B
Blot A Blot B
Figure 7.14 MF: Western blot analysis of enriched membrane-associated proteins. The samples are allocated as described in Fig. 7.12. Staining at 110-130 kDa and 15 kDa are consistently found in samples from ApdE9 tissue (sample lanes 1-4 of blot A and lanes 1-2 of blot B). At the area of 30 kDa staining in the ApdE9 samples is comparable with Aβ-42 controls at 100 pg – 1 ng, whereas wild-types express a slightly less intensive staining. Staining in further areas can be homogeneously seen in all sample lanes. Staining of Aβ at 4 kDa cannot be distinguished from artefacts with certainty.
Figure 7.15 Pellet: Western blot analysis of insoluble material. Staining at 40-70 kDa and 15 kDa can be found in all sample lanes and of similar staining intensity between 1-10ng of Aβ-42 standard. Staining of Aβ at 4 kDa is not detectable.
10 n
g
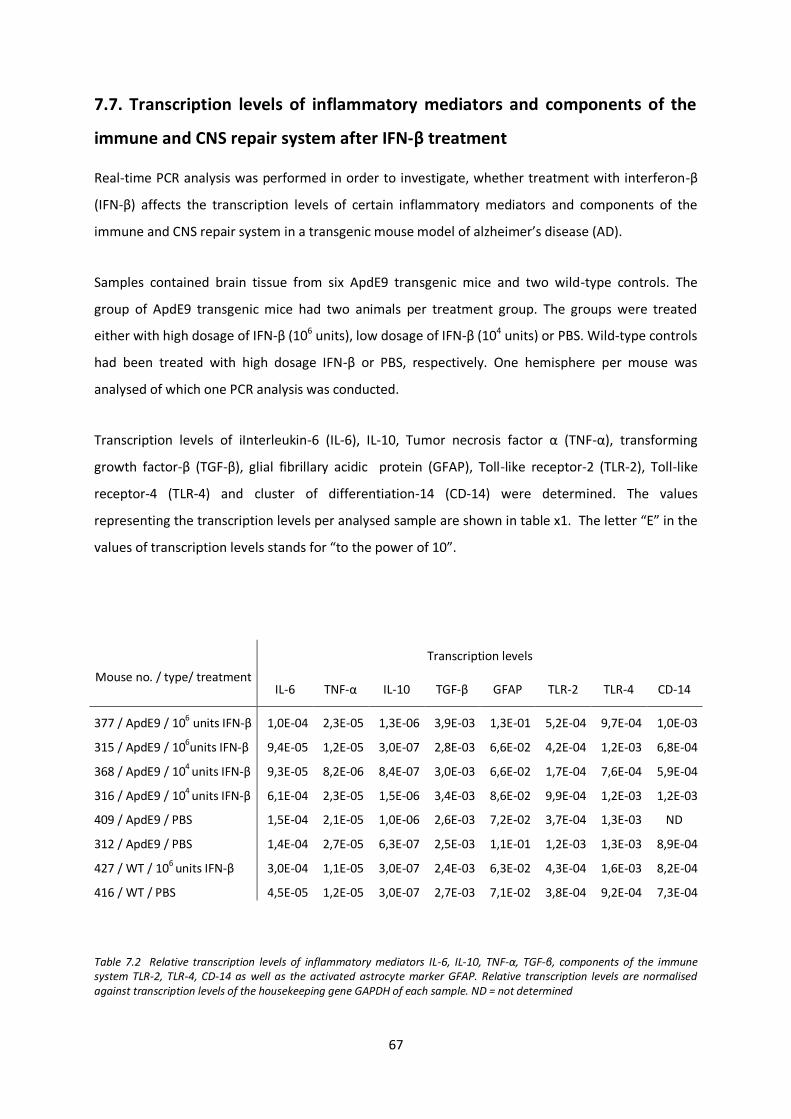
67
7.7. Transcription levels of inflammatory mediators and components of the
immune and CNS repair system after IFN-β treatment
Real-time PCR analysis was performed in order to investigate, whether treatment with interferon-β
(IFN-β) affects the transcription levels of certain inflammatory mediators and components of the
immune and CNS repair system in a transgenic mouse model of alzheimer’s disease (AD).
Samples contained brain tissue from six ApdE9 transgenic mice and two wild-type controls. The
group of ApdE9 transgenic mice had two animals per treatment group. The groups were treated
either with high dosage of IFN-β (106 units), low dosage of IFN-β (104 units) or PBS. Wild-type controls
had been treated with high dosage IFN-β or PBS, respectively. One hemisphere per mouse was
analysed of which one PCR analysis was conducted.
Transcription levels of iInterleukin-6 (IL-6), IL-10, Tumor necrosis factor α (TNF-α), transforming
growth factor-β (TGF-β), glial fibrillary acidic protein (GFAP), Toll-like receptor-2 (TLR-2), Toll-like
receptor-4 (TLR-4) and cluster of differentiation-14 (CD-14) were determined. The values
representing the transcription levels per analysed sample are shown in table x1. The letter “E” in the
values of transcription levels stands for “to the power of 10”.
Mouse no. / type/ treatment
Transcription levels
IL-6 TNF-α IL-10 TGF-β GFAP TLR-2 TLR-4 CD-14
377 / ApdE9 / 106 units IFN-β 1,0E-04 2,3E-05 1,3E-06 3,9E-03 1,3E-01 5,2E-04 9,7E-04 1,0E-03
315 / ApdE9 / 106units IFN-β 9,4E-05 1,2E-05 3,0E-07 2,8E-03 6,6E-02 4,2E-04 1,2E-03 6,8E-04
368 / ApdE9 / 104 units IFN-β 9,3E-05 8,2E-06 8,4E-07 3,0E-03 6,6E-02 1,7E-04 7,6E-04 5,9E-04
316 / ApdE9 / 104 units IFN-β 6,1E-04 2,3E-05 1,5E-06 3,4E-03 8,6E-02 9,9E-04 1,2E-03 1,2E-03
409 / ApdE9 / PBS 1,5E-04 2,1E-05 1,0E-06 2,6E-03 7,2E-02 3,7E-04 1,3E-03 ND
312 / ApdE9 / PBS 1,4E-04 2,7E-05 6,3E-07 2,5E-03 1,1E-01 1,2E-03 1,3E-03 8,9E-04
427 / WT / 106 units IFN-β 3,0E-04 1,1E-05 3,0E-07 2,4E-03 6,3E-02 4,3E-04 1,6E-03 8,2E-04
416 / WT / PBS 4,5E-05 1,2E-05 3,0E-07 2,7E-03 7,1E-02 3,8E-04 9,2E-04 7,3E-04
Table 7.2 Relative transcription levels of inflammatory mediators IL-6, IL-10, TNF-α, TGF-β, components of the immune system TLR-2, TLR-4, CD-14 as well as the activated astrocyte marker GFAP. Relative transcription levels are normalised against transcription levels of the housekeeping gene GAPDH of each sample. ND = not determined
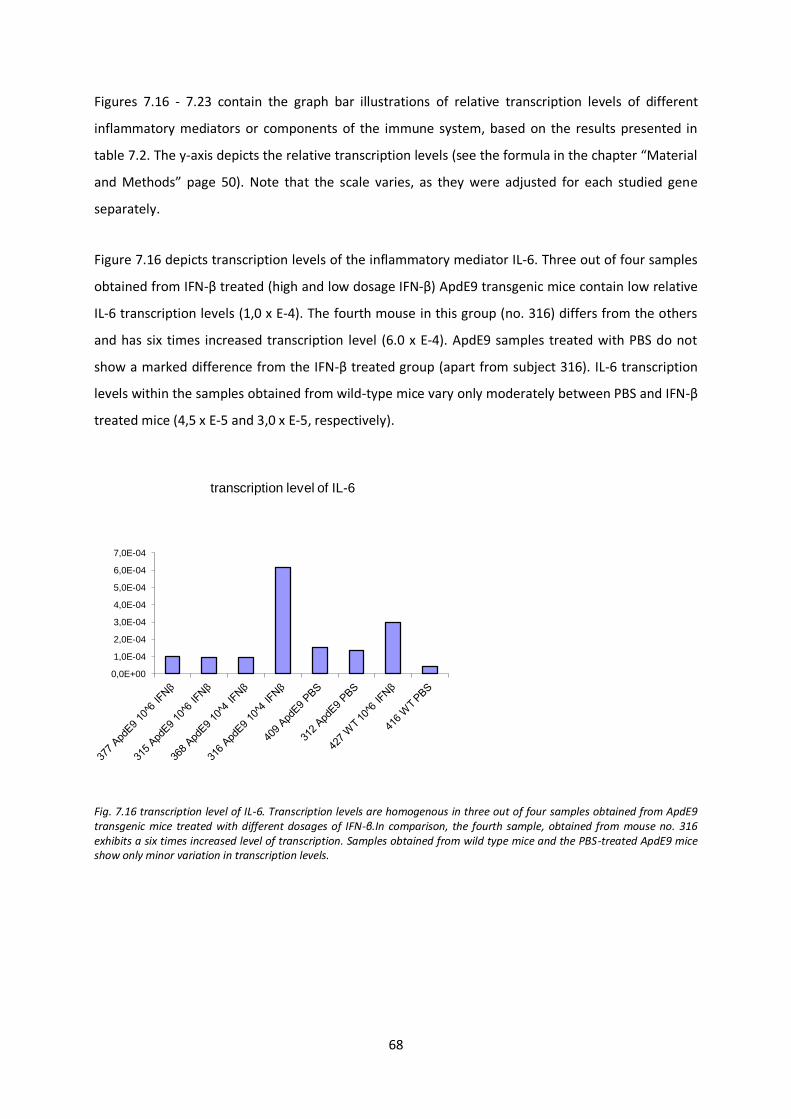
68
Figures 7.16 - 7.23 contain the graph bar illustrations of relative transcription levels of different
inflammatory mediators or components of the immune system, based on the results presented in
table 7.2. The y-axis depicts the relative transcription levels (see the formula in the chapter “Material
and Methods” page 50). Note that the scale varies, as they were adjusted for each studied gene
separately.
Figure 7.16 depicts transcription levels of the inflammatory mediator IL-6. Three out of four samples
obtained from IFN-β treated (high and low dosage IFN-β) ApdE9 transgenic mice contain low relative
IL-6 transcription levels (1,0 x E-4). The fourth mouse in this group (no. 316) differs from the others
and has six times increased transcription level (6.0 x E-4). ApdE9 samples treated with PBS do not
show a marked difference from the IFN-β treated group (apart from subject 316). IL-6 transcription
levels within the samples obtained from wild-type mice vary only moderately between PBS and IFN-β
treated mice (4,5 x E-5 and 3,0 x E-5, respectively).
Fig. 7.16 transcription level of IL-6. Transcription levels are homogenous in three out of four samples obtained from ApdE9 transgenic mice treated with different dosages of IFN-β.In comparison, the fourth sample, obtained from mouse no. 316 exhibits a six times increased level of transcription. Samples obtained from wild type mice and the PBS-treated ApdE9 mice show only minor variation in transcription levels.
0,0E+00
1,0E-04
2,0E-04
3,0E-04
4,0E-04
5,0E-04
6,0E-04
7,0E-04
transcription level of IL-6
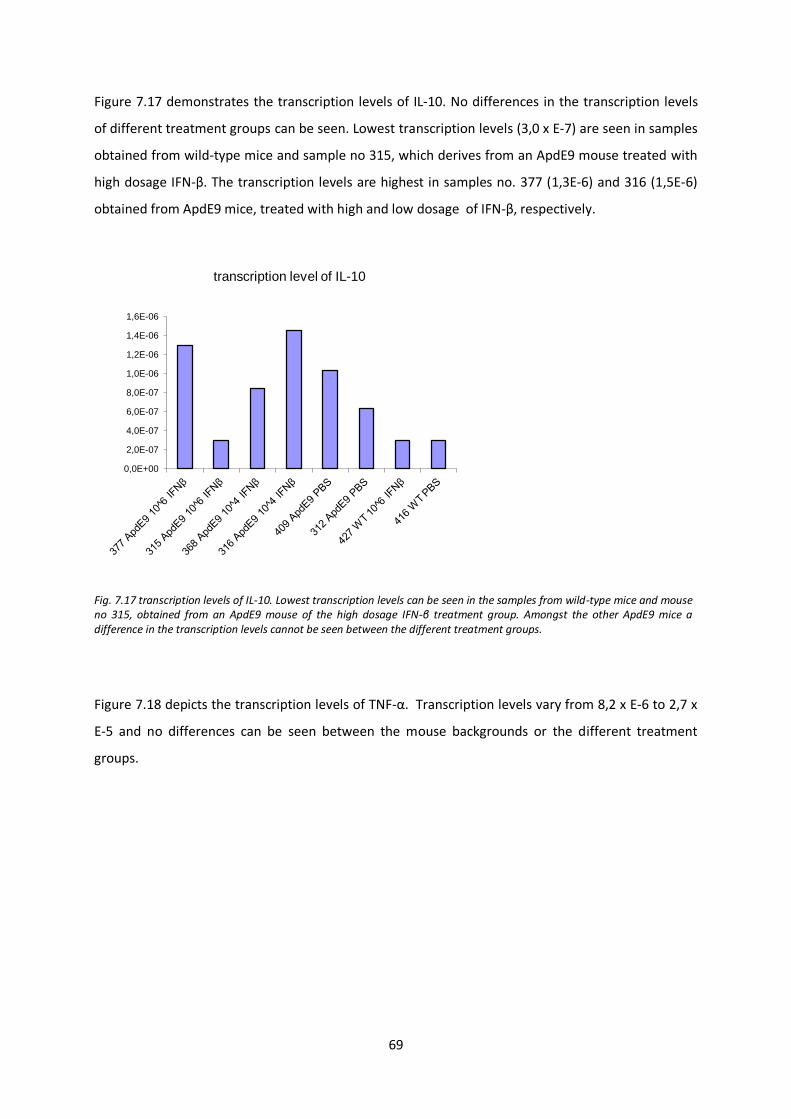
69
Figure 7.17 demonstrates the transcription levels of IL-10. No differences in the transcription levels
of different treatment groups can be seen. Lowest transcription levels (3,0 x E-7) are seen in samples
obtained from wild-type mice and sample no 315, which derives from an ApdE9 mouse treated with
high dosage IFN-β. The transcription levels are highest in samples no. 377 (1,3E-6) and 316 (1,5E-6)
obtained from ApdE9 mice, treated with high and low dosage of IFN-β, respectively.
Fig. 7.17 transcription levels of IL-10. Lowest transcription levels can be seen in the samples from wild-type mice and mouse no 315, obtained from an ApdE9 mouse of the high dosage IFN-β treatment group. Amongst the other ApdE9 mice a difference in the transcription levels cannot be seen between the different treatment groups.
Figure 7.18 depicts the transcription levels of TNF-α. Transcription levels vary from 8,2 x E-6 to 2,7 x
E-5 and no differences can be seen between the mouse backgrounds or the different treatment
groups.
0,0E+00
2,0E-07
4,0E-07
6,0E-07
8,0E-07
1,0E-06
1,2E-06
1,4E-06
1,6E-06
transcription level of IL-10
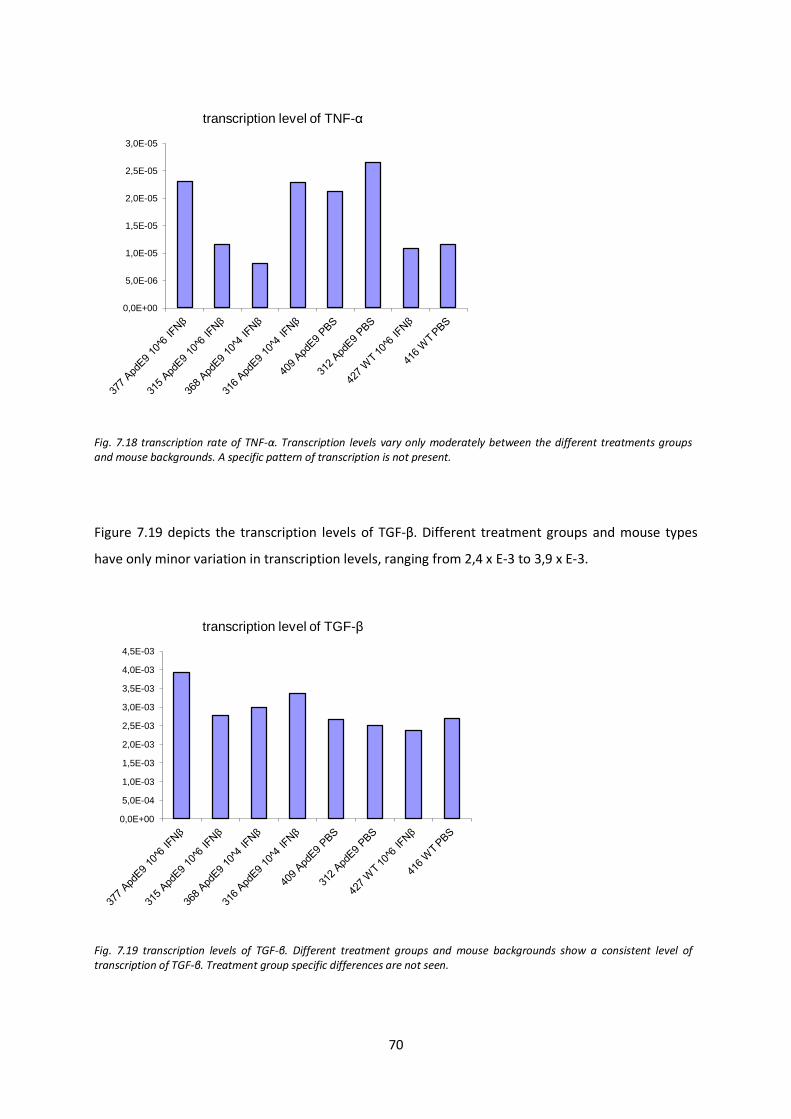
70
Fig. 7.18 transcription rate of TNF-α. Transcription levels vary only moderately between the different treatments groups and mouse backgrounds. A specific pattern of transcription is not present.
Figure 7.19 depicts the transcription levels of TGF-β. Different treatment groups and mouse types
have only minor variation in transcription levels, ranging from 2,4 x E-3 to 3,9 x E-3.
Fig. 7.19 transcription levels of TGF-β. Different treatment groups and mouse backgrounds show a consistent level of transcription of TGF-β. Treatment group specific differences are not seen.
0,0E+00
5,0E-06
1,0E-05
1,5E-05
2,0E-05
2,5E-05
3,0E-05
transcription level of TNF-α
0,0E+00
5,0E-04
1,0E-03
1,5E-03
2,0E-03
2,5E-03
3,0E-03
3,5E-03
4,0E-03
4,5E-03
transcription level of TGF-β
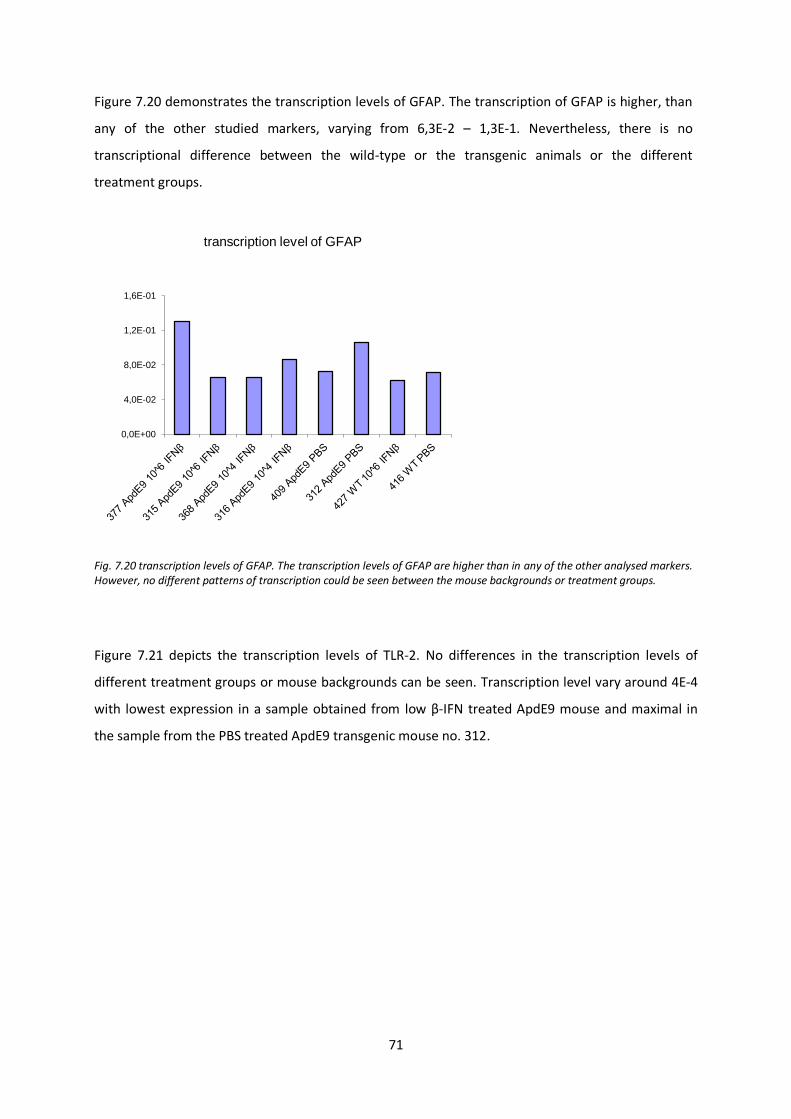
71
Figure 7.20 demonstrates the transcription levels of GFAP. The transcription of GFAP is higher, than
any of the other studied markers, varying from 6,3E-2 – 1,3E-1. Nevertheless, there is no
transcriptional difference between the wild-type or the transgenic animals or the different
treatment groups.
Fig. 7.20 transcription levels of GFAP. The transcription levels of GFAP are higher than in any of the other analysed markers. However, no different patterns of transcription could be seen between the mouse backgrounds or treatment groups.
Figure 7.21 depicts the transcription levels of TLR-2. No differences in the transcription levels of
different treatment groups or mouse backgrounds can be seen. Transcription level vary around 4E-4
with lowest expression in a sample obtained from low β-IFN treated ApdE9 mouse and maximal in
the sample from the PBS treated ApdE9 transgenic mouse no. 312.
0,0E+00
4,0E-02
8,0E-02
1,2E-01
1,6E-01
transcription level of GFAP
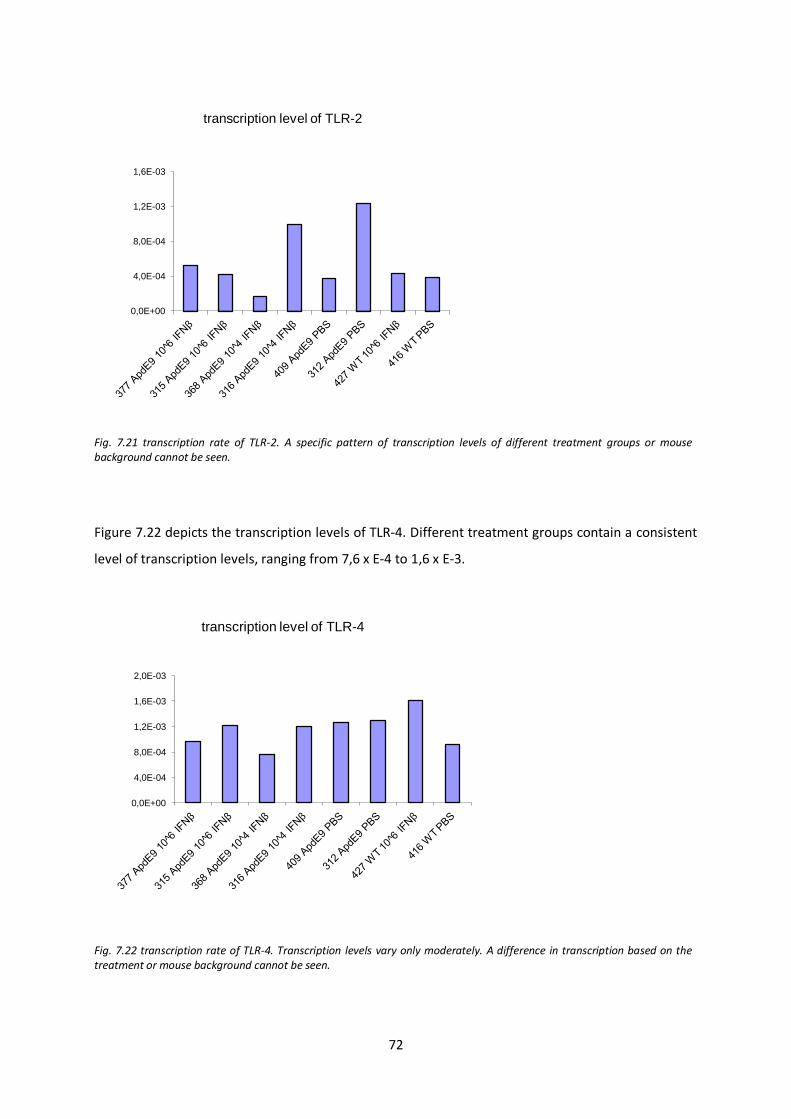
72
Fig. 7.21 transcription rate of TLR-2. A specific pattern of transcription levels of different treatment groups or mouse background cannot be seen.
Figure 7.22 depicts the transcription levels of TLR-4. Different treatment groups contain a consistent
level of transcription levels, ranging from 7,6 x E-4 to 1,6 x E-3.
Fig. 7.22 transcription rate of TLR-4. Transcription levels vary only moderately. A difference in transcription based on the treatment or mouse background cannot be seen.
0,0E+00
4,0E-04
8,0E-04
1,2E-03
1,6E-03
transcription level of TLR-2
0,0E+00
4,0E-04
8,0E-04
1,2E-03
1,6E-03
2,0E-03
transcription level of TLR-4
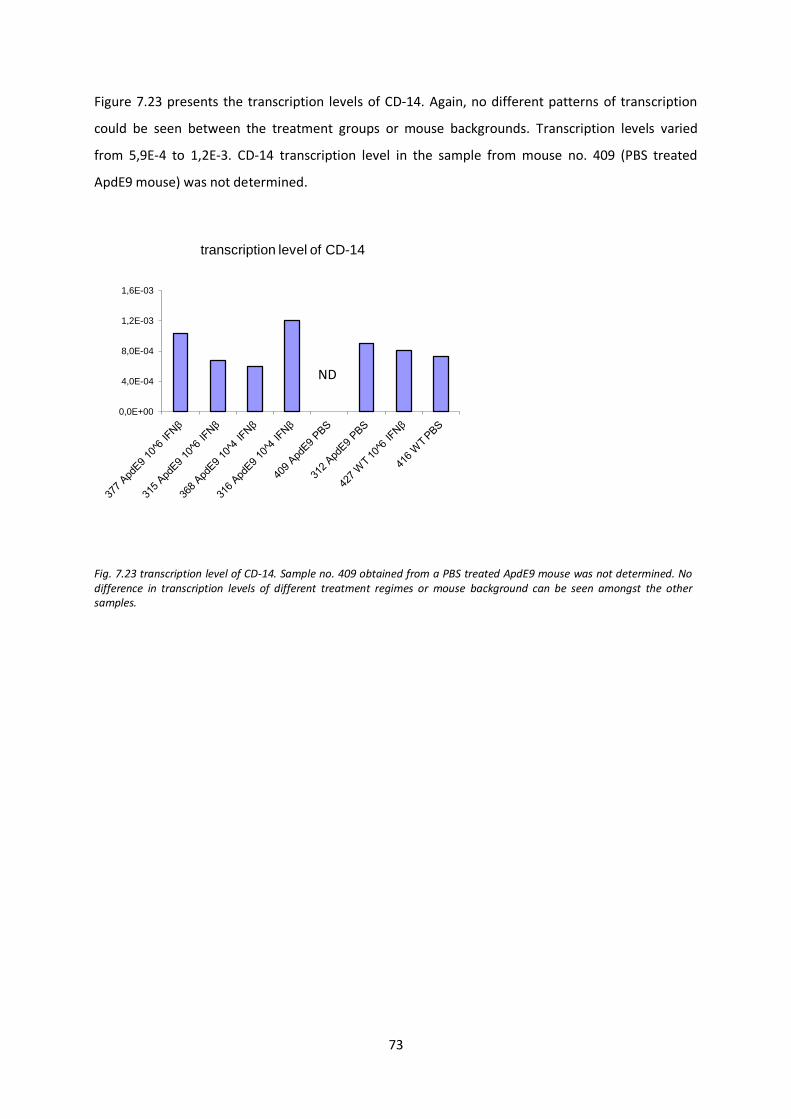
73
Figure 7.23 presents the transcription levels of CD-14. Again, no different patterns of transcription
could be seen between the treatment groups or mouse backgrounds. Transcription levels varied
from 5,9E-4 to 1,2E-3. CD-14 transcription level in the sample from mouse no. 409 (PBS treated
ApdE9 mouse) was not determined.
Fig. 7.23 transcription level of CD-14. Sample no. 409 obtained from a PBS treated ApdE9 mouse was not determined. No difference in transcription levels of different treatment regimes or mouse background can be seen amongst the other samples.
0,0E+00
4,0E-04
8,0E-04
1,2E-03
1,6E-03
transcription level of CD-14
ND
74
8. DISCUSSION
According to a general consensus, development of AD is based on the imbalance of production and
clearance of Aβ. Subsequent aggregation of Aβ and accumulation to amyloid deposits is believed to
initiate a cascade, which ultimately leads to degeneration of neurons and AD pathology (Blennow K
et al. 2006, Querfurth HW et al. 2010). Amongst the complex pathological changes that occur within
the course of the disease (Querfurth HW et al. 2010), increasing evidence suggests that the initiation
of a broad inflammatory response may be one of the most important phenomena contributing to
chronic disease progression (Heneka MT et al. 2010). Reduction of the cerebral Aβ load is associated
with protection (Morgan D et al. 2000, Janus C et al. 2000) and even reverse of behavioural
impairment (Cramer PE et al. 2012). In a recent in vivo study, ApoE-directed therapeutics reduced
more than 50% of the Aβ plaque load and improvement of cognitive and social deficits were
correlated with a reduction in soluble Aβ peptide levels as seen in an AD mouse model (Cramer PE et
al. 2012).
The current work aimed to discover whether IFN-β can influence Aβ load in vivo in order to evaluate
its’ potential as a novel therapeutic approach for AD. The study was carried out as a cooperation
project between the University of Kuopio (Finland) and the Department of Neurology of the
University Hospital, Homburg. Doubly transgenic ApdE9 mice and controls were treated with human
IFN-β. The treatment regime was initiated prior to disease manifestation and continued until early
stages of the disease.
In this study, a moderate reduction in the number of Aβ plaques was observed following treatment
with IFN-β compared to controls. These differences in the plaque load detected by
immunohistochemical analysis can result either from an inhibited production of Aβ and its
accumulation as plaques or from an increased phagocytosis and degradation of the existing Aβ
plaques. So far, any effects of IFN-β on Aβ production and/or plaque formation have not been
reported in the literature. However, results from a few in vitro studies suggest, that IFN-β can
enhance microglial phagocytotic capacity. In a rodent model of experimental autoimmune
encephalomyelitis, IFN-β pretreated microglia demonstrated an increased phagocytosis rate (Chan A
et al. 2003). In another in vitro study human monocytes and murine microglia were treated with IFN-
α, -β and -γ of various concentrations and the quantitative effects on the phagocytotic activity were
analysed. Only treatment with IFN-β provoked a significant increase of phagocytotic activity in
human monocytes following a direct dose-dependent relation. A trend towards enhanced
75
phagocytotic activity could be noted also on murine microglia following treatment with IFN-β though
the effect did not reach quantitative significance (Schall U 2008).
This study investigated the effect of interferon-β treatment on soluble amyloid-β peptides and its
complexes by Western blot analyses utilizing the highly sensitive Wo2 antibody. Nevertheless, the
results remained inconclusive. Aβ staining represented in the area of 4 kDa within the extracellular
fraction (ECF) can be detected in all samples of ApdE9 brain tissue but differences in the staining
intensity are minor. However, the slightly more intense staining in PBS (Blot A, lane 1, Figure 7.12)
and low-dose IFN-β (Blot B, lane 1, Figure 7.12) treated samples might reflect a dose-dependent
effect of IFN-β, resulting in reduced generation of Aβ. The ApdE9 samples within the ECF show more
pronounced staining in the area of about 15 kDa (figure 7.12) than the controls from wild-type mice
samples. The staining in this area represents the c-terminal fragment of the APP cleavage product
(APP-CTFβ) (Nunan J et al. 2001).Within the ApdE9 samples only minor differences in the staining
intensity of APP-CTFβ can be seen between the different treatment groups. Therefore, no clear IFN-β
treatment effect on the β-secretase mediated APP cleavage and APP-CTFβ accumulation can be
seen. Western blot analyses of the ICF show a concomitant staining pattern for Aβ and the APP-CTFβ.
Marked differences in the staining intensity between the different treatment groups cannot be seen.
Semi-quantitative analyses depict a reduced concentration of Aβ in the intracellular fraction (10-100
pg) compared to the extracellular fraction (100 pg-1 ng). This finding is coherent to assumptions
based on the structure of APP as a transmembrane protein with the Aβ sequence predominantly
located in the extracellular domain.
The western blot analyses demonstrate that the antibody WO2 detects the Aβ sequence in various
different complexes. It recognizes soluble Aβ as well the Aβ sequence within APP, the cleavage
product APP-CTFβ and various oligomeric structures. Alternatively, quantitative ELISA analyses could
be performed utilizing an antibody specific for soluble Aβ.
Microglia are the major immune cells of the CNS. Nowadays they are studied as an attractive tool for
immunotherapeutic strategies that aim to reduce the Aβ load in AD brains by activation of a specific
phagocytic phenotype (Weiner HL et al. 2006). The clinical improvement of AD symptoms following
microglia activation and phagocytosis of Aβ has been demonstrated already in a clinical trial.
However, this Aβ-42 vaccination trial had to be discontinued due to severe side-effects in terms of
aseptic meningoencephalitis which occurred in 6% of patients (Orgogozo JM et al. 2003).
76
In the current work, treatment with high dosage of IFN-β was associated with an increased number
of microglia at sites of plaque deposits compared to the surrounding tissue. This observation could
result from induced microglial proliferation or represent the shift of distantly located microglia
towards AD lesions. The effect of IFN-β on microglial proliferation has been investigated earlier in an
in vitro study with rodent neonatal microglia. IFN-β reduced the proliferation of cultured microglia by
approximately 60% (Hall GL et al. 1997). Therefore a direct microglial proliferation effect induced by
IFN-β is an unlikely cause for the effects, observed in this study. Microglia respond to the
chemotactic signaling by Aβ and several inflammatory mediators. These chemotactic agents are
associated with Aβ plaques and include complement factors, chemokines and cytokines, which are
secreted in particular by glial cells (Akiyama H et al. 2000, Heneka MT et al. 2007). IFN-β could
contribute to a shift in microglial distribution by modulating the cytokine milieu at the sites of AD
lesions. IFN-β exerts complex effects on the cytokine secretion pattern of microglia (Hall GL et al.
1997). IFN-β enhances the microglial production of pro-inflammatory mediators such as TNF-α, IL-1β
and IL-6 (Kawanokuchi J et al. 2004) but simultaneously increases levels of the anti-inflammatory
cytokine IL-10 (Jin S et al. 2007, Kawanokuchi J et al. 2004). The proinflammatory cytokines could
contribute to further micrgolial recruitment whereas IL-10 has been found to enhance microglial
degradation of phagocytosed Aβ (Sokolowski JD et al. 2011).
This study investigated the effects of IFN-β on astrocyte presence and distribution around AD lesions.
An increased number of astrocytes were found at sites of plaques after treatment with high dosage
IFN-β compared to controls. This observation could imply an increased astrocyte proliferation at the
site of plaques, an enhanced astrocyte survival or a shift from distantly located astrocytes towards
Aβ plaques. Interestingly, an in vitro study suggested that IFN-β dose-depending may either stimulate
astrocyte proliferation and survival or contribute to astrocyte death (Barca O et al. 2010). If IFN-β
indeed has dose dependent opposing effects on astrocytic proliferation and survival, this could
explain the observed phenomena of increased number of plaque associated astrocytes in the high
dosage and decreased number in the low dosage groups compared to controls. However, due to the
small group size, the results remain inconclusive and the quantitative effect of IFN-β on astrocytes
has to be evaluated in subsequent studies. It is also possible that the increase of astrocytes in the
vicinity to Aβ plaques could derive from induced chemotactic signaling. Microglia and astrocytes,
respond to Aβ deposits and inflammatory mediators and cluster at site of AD lesions (Akiyama H et
al. 2000, Heneka MT et al. 2007). In addition, IFN-β can induce astrocytic production of neurotrophic
factors and prevent the release of neurotoxic factors (Barca O et al. 2010). These phenomena
together could counteract the neurodegenerative course in AD.
77
As already mentioned earlier, numerous glial cell and cytokine interaction have been regularly
observed in AD and are understood to influence the course of the disease. Amongst others,
interleukin-6 (IL-6) and TNF-α are regarded as powerful pro-inflammatory cytokines in this process
(Rubio-Perez JM et al. 2012). IL-6 activates microglia (Heyser CJ et al. 1997) and stimulates iNOS
activity (Rossi F et al. 1996). IL-6 is strongly induced in pathological processes whereas it is barely
detectable in healthy adults CNS. Similarly, TNF-α expression is low in the healthy brain but in
inflammatory or diseased states it is secreted predominantly by activated microglia (Rubio-Perez JM
et al. 2012). TNF-α induces itself glial cell activation in autocrinic and paracrinic manner, resulting in
further cytokine production and subsequently accounting for most of neurotoxicity caused by
activated microglia (Akiyama H et al. 2000, Coombs et al. 2001). However, TNF-α as well as IL-6 have
been reported to have also neuroprotective properties and their pathophysiological role in AD is not
yet fully understood. IL-10 and TGF-β are regarded as mainly anti-inflammatory cytokines. IL-10
contributes to a balance of pro- and anti-inflammatory mediators within the CNS. For instance, it
limits the inflammatory process by reducing the synthesis of TNF-α and other proinflammatory
cytokines. Also TGF-β has been shown to repress TNF-α production and it is implicated further in
astrocytosis and inhibiton of cell death during AD. However, TGF-β itself constitutes a potent
chemoattractant for microglia and thus harbours also proinflammatory properties. Amongst others
the cytokines IL-1, IL-10, TNF-α and TGF-β have been consistently detected at increased levels in the
AD brain (Rubio-Perez JM et al. 2012).
In this study real time PCR analyses were carried out in order to study the effects of IFN-β of
inflammatory CNS repair- and immune system components in ApdE9 transgenic and wild-type mice.
However, the transcription levels of cytokines IL-6, IL-10, TGF-β and TNF-α did not show marked
differences between the mouse backgrounds or treatment groups. It is possible, that despite some
Aβ deposits were found, AD brain pathology was not yet sufficiently developed, when the IFN-β
treatment began. The lack of variability in the cytokine expression levels might be also explained by a
technical reason due to the low n-value in the study protocol. The transcription levels of IL-6 were
found to be increased in the brain of mouse number 316, which was an ApdE9 transgenic mouse
from the low dosage IFN-β treatment group. This could either indicate increased inflammatory
activity in the sample, though a concomitant increase of TNF-α or other changes in the cytokine
milieu could not be seen. Therefore it more likely, that this observation derives from a technical
variation as the analyses lacked replicates. In this study, real-time PCR was conducted one time on a
single sample per mouse. Furthermore, as there were only few animals per treatment group,
statistical analysis of the results could not be carried out. In subsequent studies PCR analyses should
be performed with more samples and the analyses have to be carried out in replicates. Subsequent
78
studies could also include analysis of IL-1 transcription levels as it is an important factor in the onset
of the inflammation process in AD. Nevertheless, one has to remember, that animal experiments
regarding neuroinflammatory changes in AD have produced controversial results even within the
same animal model. This could derive from differences in applied techniques between laboratories
but also indicate the difficulty in studying inflammatory changes in animal models, which are often
subtle and under tight temporal regulation (Heneka MT et al. 2007).
The real time PCR analyses of the microglial pattern recognition receptors TLR-2, TLR-4 and the
lipopolysaccaride (LPS) receptor CD-14 did not show clear differences in the expression levels
between any of the treatment and control groups. CD-14 immunoreactive parenchymal microglia
have earlier been detected in AD lesions of patient samples and as well as TLR-2, the receptor is
suggested to be involved in phagocytosis of Aβ (Liu Y. et al. 2005). TLR-4 on the other hand might
partly mediate amyloid peptide-induced microglial neurotoxicity (Walter S et al. 2007). Surprisingly,
the transcription levels of GFAP did not vary between the different mouse backgrounds and
treatment groups. GFAP is a marker that labels reactive astrocytes (Sofroniew MV et al. 2010). As
Astrogliosis is understood to constitute an early event in AD pathology (Heneke MT et al. 2005), the
results could therefore indicate that AD pathology was not sufficiently developed in the animals
which would be inconsistent with the IHC analysis. However, due to the low n-value, all the PCR
analysis have to be considered inconclusive.
Histological analysis revealed no relevant structural differences between the treatment and control
groups. However, as axonal damage and demyelination, have to be regarded as manifestations of
advanced disease. In order to detect the degree of structural changes and a possible protective effect
induced by IFN-β, older mice with more progressed disease need to be used in subsequent studies.
Some speculation of IFN-β efficiency against axonal damage and subsequent neuronal degeneration
can be made from reported MS study results. MS is a chronic inflammatory, neurodegenerative
disease which leads to neurological disability following an auto-immune attack on myelin covers
causing axonal degeneration (Van der Walt A et al. 2010). IFN-β can attenuate the early inflammatory
damage to myelin and protect axons (Bates D 2011). As there is no indication for a direct
neuroprotection mediated by IFN-β (Kieseier BC et al. 2007, Sättler MB et al. 2006), the increased
cellular survival is thought to result from an IFN-β induced anti-inflammatory milieu (Sättler MB et al.
2006). Glutamate mediated neuronal toxicity is involved in the neurodegenerative course in AD
[Akiyama H et al. 2000, Heneka MT et al. 2007]. IFN-β has been reported to reduce microglial
inflicted neurotoxicity by reducing their glutamate secretion in vitro (Jin S et al. 2007), to induce the
secretion of nerve growth factors by endothelial cells (Kieseier BC et al. 2007) and to stimulate
79
astrocytic production of neurotrophic factors (Bates D 2011). The potential positive effect of IFN-β in
altering the neurodegenerative course of AD remains to be shown using older transgenic AD mice
with profound pathology.
This experiment was carried out as continuation of an in vitro study, where increased bead
phagocytosis by mononuclear phagocytes was observed following treatment with IFN-β. This study
investigated possible immunomodulatory effects of IFN-β in vivo using the ApdE9 transgenic mice
model. This work has provided preliminary qualitative data as well as it revealed pitfalls in the
applied study design. In general it has to be stated, that the number of animals given per treatment
group was too small to apply statistical analysis of the results which have to be conducted in
subsequent studies. Whereas in this work, the treatment was initiated at a very early stage of the
disease in seven-weeks-aged animals, further studies should use preferably older animals which
present advanced AD pathology given at the age of about six month. Hence a possible therapeutic
effect could be assessed more profoundly also better mimicking the clinical situation on heavy
plaque burden at the time of diagnosis. The treatment period of 8 weeks could be maintained and a
subgroup could continue receiving the treatment for a total of 16 weeks. Simultaneously the
improvement of AD symptoms could be studied by testing spatial memory of the animals by water
maze tasks. The combined analyses of clinical performance and changes on the cellular level could
provide stronger data the therapeutic potential of IFN-β. In future mouse IFN-β should be used
instead of human IFN-β, as some recent data suggests that these might not be cross-species reactive
(Ruotsalainen J et al. 2012). IHC analyses have been proven to be sensitive and can be conducted in
the same manner. However, the relatively long storage of samples in PFA due to logistics between
the laboratories might be responsible for the weak staining intensity and this should be avoided.
Real-time PCR is useful in order to investigate the degree of cytokine activity within diseased brain
samples but should be carried out in replica and contain multiple samples per tested brain.
In conclusion, this work provided preliminary, qualitative data implying a potential
immunomodulatory effect of IFN-β on AD pathology in vivo. We observed a trend of Aβ plaque load
reduction and an increase of glial cell activity at the sites of AD lesions following IFN-β treatment in
transgenic murine AD-model. The quantitative effects of IFN-β on AD pathology remain to be shown
in subsequent studies.
80
9. REFERENCES
1. Akiyama H, Barger S, Barnum S, Bradt B, Bauer J, Cole GM, Cooper NR, Eikelenboom P, Emmerling M, Fiebich BL, Finch CE, Frautschy S, Griffin WST, Hampel H, Hull M, Landreth G, Lue LF, Mrak R, Mackenzie IR, McGeer PL, O’Banion MK, Patcher J, Pasinetti G, Plata-Salaman C, Rogers J, Rydel R, Shen Y, Streit W, Strohmeyer R, Tooyoma I, Van Muisinkel FL, Veerhuis R, Walker D, Webster S, Wegrzyniak B, Wenk G, Wyss-Coray T (2000) Inflammation and Alzheimer’s disease. Neurobiology of Aging 21:383-421
2. Altstiel LD, Sperber K (1991)Cytokines in Alzheimer’s disease. Progress in Neuropsychopharmacology and Biological Psyiatrie 15:481-495
3. Alzheimer’s association (2010) Alzheimer’s disease Facts and Figures, Alzheimer’s & Dementia, Volume 6
4. Axtell RC, de Jong BA, Boniface K, van der Voort LF, Bhat R, De Sarno P, Naves R, Han M, Zhong F, Castellanos JG, Mair R, Christakos A, Kolkowitz I, Katz L, Killenstein J, Polman CH, de Waal Malefyt R, Steinman L, Raman C (2010) T helper type 1 and 17 cells determine efficacy of interferon-beta in multiple sclerosis and experimental encephalomyelitis. Nature Medicine 16:406-412
5. Axtell RC, Steinman L (2008) Type 1 interferons cool the Inflamed brain. Immunity 28:600-602
6. Bamberger ME, Harris ME, McDonald DR, Husemann J, Landreth GE (2003)A cell surface receptor complex for fibrillar β-amyloid mediates microglial activation. Journal of Neuroscience 23: 2665–2674
7. Barca O, Devesa-Peleteiro P, Seoane M, Senaris RM, Arce VM (2010) Bimodal effect of interferon-β on astrocyte proliferation and survival: Importance of nuclear factor-κB. Journal of Neuroimmunology 226:73-80
8. Bates D (2011) Treatment effects of immunomodulatory therapies at different stages of multiple sclerosis in short-term trials. Neurology 76:14-25
9. Bekisz J, Schmeisser H, Hernandez J, Goldman ND, Zoon KC (2004) Human interferons alpha, beta and omega. Growth Factors 22:243-251
10. Benveniste EN, Qin H (2007) Type I interferons as anti-inflammatory mediators. Sciences STKE pe:70
11. Bernreuther C, Glatzel M (2006) Die Alzheimer’sche Erkrankung – Neuropathologie und Neurobiologie. Hamburger Ärzteblatt 11:568-570
12. Billiau A (2006) Anti-inflammatory properties of Type I interferons. Antiviral Research 71:108-116
13. Bird TD, Pagon RA, Dolan CR, et al. (eds) (2010) Alzheimer Disease Overview. Gene Reviews, University of Washington, Seattle
14. Blennow K, de Leon MJ, Zetterberg H (2006) Alzheimer’s disease. Lancet 368:387-403
15. Boenisch T (2001) Immunochemical Staining Methods Handbook. 3rd ed. Dako Cytomation, Carpinteria, California
16. Boland K, Behrens M, Choi D, Manias K, Perlmutter DH (1996) The serpin-enzyme complex receptor recognizes soluble, nontoxic amyloid-β peptide but not aggregated, cytotoxic amyloid-β peptide. Journal of Biological Chemistry 271:18032–18044
81
17. Bourne KZ, Ferrari DC, Lange-Dohna C, Rossner S, Wood TG, Perez-Polo JR (2007) Differential regulation of BACE1 promoter activity by nuclear factor-kappa B in neurons and glia upon exposue to beta-amyloid peptides. Journal of Neuroscience Research 85:1194-1204
18. Butovsky O et al. (2005) Activation of microglia by aggregated beta-amyloid or lipopolysaccharide impairs MHC-II expression and renders them cytotoxic whereas IFN-γ and IL-4 render them protective. Molecular and Cellular Neuroscience 29: 381-393
19. Cagnin A, Brooks DJ, Kennedy AM, Gunn RN, Myers R, Turkheimer FE, Jones T, Banati RB (2001) In-vivo measurement of activated microglia in dementia. Lancet 358:461-567
20. Cardinaux JR, Allaman I, Magistretti PJ (2000)Pro-inflammatory cytokines induce the transcription factors C/EBP-beta and C/EBP-delta in astrocytes. Glia 29:91–7
21. Chan A, Sequin R, Magnus T, Papadimitriou C, Toyka KV, Antel JP, Gold R (2003) Phagocytosis of apoptotic inflammatory cells by microglia and its therapeutic implications: termination of CNS autoimmune inflammation and modulation by interferon-beta. Glia 43:231-242
22. Citron M (2010) Alzheimer’s disease: strategies for disease modification. Nature Reviews. Drug Discovery 9:387-398
23. Combs CK, Karlo JC, Kao SC, Landreth GE (2001) beta-Amyloid stimulation of microglia and monocytes results in TNFalpha-dependent expression of inducible nitric oxide synthase and neuronal apoptosis. Journal of Neuroscience 21:1179-1188
24. Conde JR, Streit WJ (2006)Microglia in the aging brain. Journal of Neuropathology and Experimental Neurology 65:199-203
25. Coraci IS et al. (2002)CD36, a class B scavenger receptor, is expressed on microglia in Alzheimer’s disease brains and can mediate production of reactive oxygen species in response to β-amyloid fibrils. American Journal of Pathology 160:101-112
26. Cramer PE, Cirrito JR, Wesson DW, Lee CYD, Karlo JC, Zinn AE, Casali BT, Restivo JL, Goebel WD, James MJ, Brunden KR, Wilson DA, Landreth GE (2012) ApoE-Directed Therapeutics Rapidly Clear β-Amyloid and Reverse Deficits in AD Mouse Models. Science 335:1503-6
27. De Veer MJ, Holko M, Frevel M, Walker E, Der S, Paranjape JM, Silverman RH, Williams BR (2001) Functional classification of interferon-stimulated genes identified using microarrays. Journal of Leukocyte Biology 69:912-920
28. Dickson DW (2003) Neurodegeneration. The Molecular Pathology of Dementia and Movement Disorders. 1
st ed. ISN Press, Basel
29. El Khoury J et al. (1996) Scavenger receptor-mediated adhesion of microglia to β-amyloid fibrils. Nature 382:716-719
30. Escher, Angelika: Neuroaxonale Schädigung in experimentellen Modellen der multiplen Sklerose. Dissertation, Georg-August-Universität Götting, 2008.
31. Espey MG, Chernyshev ON, Reinhard JFJ, Namboodiri MA, Colton CA (1997) Activated human microglia produce the excitotoxin quinolinic acid. Neuroreport 8:431- 4
32. Farfara D, Lifshitz V, Frenkel D (2008) Neuroprotective and neurotoxic properties of glial cells in the pathogenesis of Alzheimer’s disease. Journal of Cellular and Molecular Medicine 12:762-780
33. Fassbender K, et. al (2008) Leitlinien der Deutschen Gesellschaft für Neurologie 2008. Therapie neurodegenerativer Demenzen. Deutsche Gesellschaft für Neurologie
82
34. Fowler TJ, Scadding JW (eds) (2003) Clinical Neurology. 3rd
ed. Arnold, London
35. Gandy S, (2005) The role of cerebral amyloid beta accumulation in common forms of Alzheimer disease. Journal of Clinical Investigation 115:1121-1129
36. Garden GA, Moller T (2006) Microglia biology in health and disease. Journal of Neuroimmune Pharmacology 1:127-37
37. Garzon DJ, Fahnestock M. (2007) Oligomeric amyloid decreases basal levels of brain derived neurtrophic factor (BDNF) mRNA via specific downregulation of BDNF transcripts IV and V differentiated human neuroblastoma cells. Journal of Neurosciences 27:2628-35
38. Giulian D (1999) Microglia and the immune pathology of Alzheimer disease. American Journal of Human Genetics 65:13-18
39. Giulian D et al. (1998) The HHQK domain of β-amyloid provides a structural basis for the immunopathology of Alzheimer’s disease. Journal of Biological Chemistry 273: 29719–29726
40. Giulian D, Haverkamp LJ, Li J, Karshin WL, Yu J, Tom D, Li X, Kirkpatrick JB (1995) Senile plaques stimulate microglia to release a neurotoxin found in Alzheimer brain. Neurochemistry international 27:119-137
41. Greenberg SM, Gurol ME, Rosand J, Smith EE (2004) Amyloid angiopathy-related vascular impairment. Stroke 35: Suppl 1:2616-9
42. Grilli M, Ribola M, Alberici A, Valerio A, Memo M, Spano P. (1995) Identification and characterization of a κB/Rel binding site in the regulatory region of the amyloid precursor protein gene. Journal of Biological Chemistry 270:26774-26777
43. Hall GL, Wing MG, Compston DA, Scolding NJ (1997) Beta-Interferon regulates the immunomodulatory activity of neonatal rodent microglia. Journal of Neuroimmunology 72:11-19
44. Hardy J, Selkoe DJ (2002) The amyloid hypothesis of Alzheimer’s disease: progress and problems on the road to therapeutics. Science 297:353-56
45. Heneka MT, O’Banion MK (2007) Inflammatory processes in Alzheimer’s disease. Journal of Neuroimmunology 184:69-91
46. Heneka MT, O’Banion MK, Terwel D, Kummer MP (2010) Neuroinflammatory processes in Alzheimer’s disease. Journal of neural transmission 117:919-947
47. Heneka MT, Sastre M, Dumitrescu-Ozimek L, Dewachter I, Walte J, Klockgether T, Van Leuven F (2005) Focal glial activation coincides with increased BACE1 activation and precedes amyloid plaque deposition in APP[V717I] transgenic mice. Journal of Neuroinflammation 2:22
48. Heyser CJ, Masliah E, Samimi A, Campbell IL, Gold LH (1997) Progressive decline in avoidance learning paralleled by inflammatory neurodegeneration in transgenic mice expressing interleukin 6 in the brain. Proceedings of the National Academy of Sciences U. S. A. 94:1500-1505
49. Hjorth E, Frenkel D, Weiner H, Schultzberg M (2010) Effects of immunomodulatory substances on phagocytosis of abeta(1-42) by human microglia. International Journal of Alzheimer’s disease, 2010 pii:798424
50. Ida N, Hartmann T, Pantel J, Schröder J, Zerfass R, Förstl H, Sandbrink R, Masters CL, Beyreuther K (1996)Analysis of Heterogeneous βA4 Peptides in Human Cerebrospinal Fluid and Blood by a Newly Developed Sensitive Western Blot Assay. The Journal of Biological Chemistry 271:22908-22914
83
51. Iribarren P et al. (2005a) CpG-containing oligodeoxynucleotide promotes microglial cell uptake of amyloid β- peptide by upregulating the expression of the G-protein-coupled receptor mFPR2. The FASEB Journal 19:2032–2034
52. Iribarren P, Zhou Y, Hu J, Le Y, Wang JM (2005b) Role of formyl peptide receptor-like 1 (FPRL1/FPR2) in mononuclear phagocyte responses in Alzheimer disease. Immunologic Research 31:165–176
53. Itagaki S, Akiyama H, Saito H, McGeer PL (1994)Ultrastuctural localization of complment membrane attack complex (MAC)-like immunoreactivity in brains of patients with Alzheimer’s disease. Brain Research 645:78-84
54. Ito D, Imai Y, Ohsawa K, Nakajima K, Fukuuchi Y, Kohsaka S (1998) Microglia-specific localisation of a novel calcium binding protein, IBA1. Brain Research. Molecular Brain Research 57:1-9
55. Jankowsky JL, Fadale DJ, Anderson J, Xu GM, Gonzales V, Jenkins NA, Copeland NG, Lee MK, Younkin LH, Wagner SL, Younkin SG, Borchelt DR (2004) Mutant presenilins specifically elevate the levels of the 42 residue beta-amyloid peptide in vivo: evidence for augmentation of a 42-specific gamma secretase. Human Molecular Genetics 13:159-170
56. Janus C et al. (2000) Aβ peptide immunization reduces behavioural impairment and plaques in a model of Alzheimer’s disease. Nature 408:979–982
57. Jin S, Kawanokuchi J, Mizuno T, Wang J, Sonobe Y, Takeuchi H, Suzumura A (2007) Interferon-β is neuroprotective against the toxicity induced by activated microglia. Brain Research 1179:140-146
58. Kawanokuchi J, Mizuno T, Kato H, Mitsuma N, Suzumura A (2004) Effects of interferon-beta on microglial functions as inflammatory and antigen presenting cells in the central nervous system. Neuropharmacology 46:734-742.
59. Kieseier BC, Hartung HP (2007) Interferon-beta and neuroprotection in multiple sclerosis – facts, hopes and phantasies. Experimental Neurology 203:1-4
60. Kim MO, Si Q, Zhou JN, Pestell RG, Brosnan CF, Locker J, Lee SC (2002) Interferon-beta activates multiple signaling cascades in primary human microglia. Journal of Neurochemistry 81:1361-1371
61. Kitazawa M, Yamasaki TR, Laferla FM (2004)Microglia as a potential bridge between the amyloid β-peptide and Tau. Annals of New York Academy of Sciences 1035:85-103
62. Kumar GL, Rudbeck L (2009) Immunochemical Staining Methods Handbook. 5th ed. Dako North America, Carpinteria, California
63. Liu B, Hong JS (2003) Role of microglia in inflammation-mediated neurodegenerative diseases: mechanisms and strategies for therapeutic intervention. Journal of Pharmacology and Experimental Therapeutics 304:1-7
64. Liu Y, Walter S, Stagi M, Cherny D, Letiembre M, Schulz-Schaeffer W, Heine H, Penke B, Neumann H, Fassbender K (2005) LPS receptor (CD14): a receptor for phagocytosis of Alzheimer’s amyloid peptide. Brain 128:1778-89
65. Loveless A, Danielli JF (1949) A Dye Phosphate for the Histo- and Cytochemical Demonstration of Alkaline Phosphatase, with some Observations on the Differential Behaviour of Nuclear and Extranuclear Enzymes. Journal of Cell Science 90:57-66
66. Lue LF, Walker DG, Jacobson S, Sabbagh M (2009) Receptor for advanced glycation end products: its role in Alzheimer’s disease and other neurological diseases. Future Neurology 4:167-177
84
67. Maier K, Kuhnert AV, Taheri N, Sättler MB, Storch MK, Williams SK, Bähr M, Diem R (2006) Effects of glatiramer acetate and interferon-beta on neurodegeneration in a model of multiple sclerosis: a comparative study. The American Journal of Pathology 169:1353-1364
68. Malik O, Compston DA, Scolding NJ (1998) Interferon-beta inhibits mitogen induced astrocyte proliferation in vitro. Journal of Neuroimmunology 86:155-162
69. McGeer EG, McGeer PL (2001) Innate Immunity in Alzheimer’s disease: a model for local inflammatory reactions. Molecular interventions 1:22-29
70. McGreal E, Gasque P (2002) Structure-function studies of the receptors for complement C1q. Biochemistry Society Transactions 30:1010-1014
71. Minkeviciene R, Ihalainen J, Malm T, Matilainen O, Keksa-Goldsteine V, Goldsteins G, Iivonen H, Leguit N, Glennon J, Koistinaho J, Banerjee P, Tanila H (2008) Age-related decrease in stimulated glutamate release and vesicular glutamate transporters in APP/PS1 transgenic and wild-type mice. Journal of Neurochemistry 105:584-594
72. Minkeviciene R, Rheims S, Dobszay MB, Zilberter M, Hartikainen J, Fülöp L, Penke B, Zilberter Y, Harkany T, Pitkänen A, Tanila H (2009) Amyloid beta-induced neuronal hyperexcitability triggers progressive epilepsy. Journal of Neuroscience 29:3453-3462
73. Morgan D et al. (2000) Aβ peptide vaccination prevents memory loss in an animal model of Alzheimer’s disease. Nature 408: 982–985
74. Mrak RE, Griffin WS (2001)Interleukin-1, neuroinflammation, and Alzheimer's disease. Neurobiology of Aging 22: 903–908
75. Murray CA, Lynch MA (1998) Evidence that increased hippocampal expression of the cytokine interleukin-1 beta is a common trigger for age- and stress-induced impairments in long-term potentiation. Journal of Neurosciences 18: 2974-2981
76. Nguyen MD, Julien JP, Rivest S (2002) Innate Immunity: the missing link in neuroprotection and neurodegeneration? Nature Reviews. Neuroscience 3:216-227
77. Nunan J, Shearman MS, Checler F, Cappai R, Evin G, Beyreuther K, Masters CL, Small DH (2001) The C-terminal fragment of the Alzheimer’s disease amyloid protein precursor is degraded by a proteasome-dependent mechanism distinct from γ-secretase. European Journal of Biochemistry 268:5329-5336
78. Nunomura A, Perry G, Aliev G, Hirai K, Takeda A, Balraj EK, Jones PK, Ghanbari H, Wataya T, Shimohama S, Chiba S, Atwood CS, Petersen RB, Smith MA (2001) Oxidative damage is the earliest event in Alzheimer’s disease. Journal of Neuropahtology and Experimental Neurology. 60:759-769
79. Orgogozo JM et al. (2003) Subacute meningoencephalitis in a subset of patients with AD after Aβ42 immunization. Neurology 61:46-54
80. Orgogozo JM, Gilman S, Dartigues JF, Laurent B, Puel M, Kirby LC, Jouanny P, Dubois B, Eisner L, Flitman S, Michel BF, Boada M, Frank A, Hock C (2003) Subacute meningoencephalitis in a subset of patients with AD after Abeta42 immunization. Neurology 61:46-54
81. Paresce DM, Ghosh RN, Maxfield FR (1996) Microglial cells internalize aggregates of the Alzheimer's disease amyloid beta-protein via a scavenger receptor. Neuron 17:553 – 565
82. Paresce DM, Ghosh RN, Maxfield FR (1996) Microglial cells internalize aggregates of the Alzheimer’s disease amyloid β-protein via a scavenger receptor. Neuron 17: 553-565
85
83. Pfeifer M, Boncristiano S, Bondolfi L, Stalder A, Deller T, Staufenbiel M, Mathews PM, Jucker M (2002) Cerebral hemorrhage after passive anti- Abeta immunotherapy. Science 298:1379
84. Piani D, Spranger M, Frei K, Schaffner A, Fontana A (1992)Macrophage induced cytotoxicity of N-methyl-D-aspartate receptor positive neurons involves excitatory amino acids rather than reactive oxygen intermediates and cytokines. European Journal of Immunology 22:2429-36
85. Porter JC, Hogg N (1998) Integrins take partners: cross-talk between integrins and other membrane receptors. Trends in Cell Biology 8:390–396
86. Prince M, Jackson J (eds) (2009) World Alzheimer Report 2009. Published by Alzheimer’s Disease International
87. Qiu WQ, Ye Z, Kholodenko D, Seubert P, Selkoe DJ (1997)Degradation of amyloid β-protein by a metalloprotease secreted by microglia and other neural and non-neural cells. Journal of Biological Chemistry 272:6641–6646
88. Querfurth HW, LaFerla FM (2010) Alzheimer’s disease. The New England Journal of Medicine 28:329-344
89. Rogers J et al. (1992) Complement activation by β-amyloid in Alzheimer disease. Proceedings of the National Academy of Sciences USA 89:10016-10020
90. Roher AE, Esh C, Rahman A, Kokjohn TA, Beach TG (2004) Atherosclerosis of cerebral arteries in Alzheimer disease. Stroke 35:2623-2627
91. Ropper AH, Samuels MA (eds) (2009) Adams and Victor’s principles of neurology. 9th ed. McGraw-Hill Companies, New York
92. Rossi F, Bianchini E (1996) Synergistic induction of nitric oxide by beta-amyloid and cytokines in astrocytes. Biochemical and Biophysical Research Communications 225:474–478
93. Rossi F, Bianchini E (1996) Synergistic induction of nitric oxide by beta-amyloid and cytokines in astrocytes. Biochemical and Biophysical Research Communication 225: 474–478
94. Rovelet-Lecrux A, Hannequin D, Raux G, et al. (2006) APP locus duplication causes autosomal dominant early-onset Alzheimer disease with cerebral amyloid angiopathy. Nature Genetics 38:24-26
95. Rowland LP (2005) Merritt’s Neurology. 11th ed. Lippincott, Philadelphia
96. Rubio-Perez JM, Morillas-Ruiz JM (2012) A Review: Inflammatory Process in Alzheimer’s Disease, Role of Cytokines. The Scientific World Journal 2012: 756357
97. Ruotsalainen J, Martikainen M, Niittykoski M, Huhtala T, Aaltonen T, Heikkilä J, Bell J, Vähä-Koskela M, Hinkkanen A (2012) Interferon-β sensitivity of tumor cells correlates with poor response to VA7 virotherapy in mouse glioma models. Molecular Therapy 20:1529-39
98. Sastre M, Dewachter I, Landreth GE, Wilson TM, Klockgether T, van Leuven F, Heneka MT (2003) Nonsteroidal anti-inflammatory drugs and peroxisome proliferator-activated receptor-γ agonists modulate immunostimulated processing of amyloid precursor protein through regulation of β-secretase. Journal of Neurosciences 23:9796-9804
99. Sastre M, Klockgether T, Heneka MT (2006) Contriubution of inflammatory processes to Alzheimer’s disease: molecular mechanisms. International Journal of developmental Neuroscience 24:167-176
100. Sastre M, Walter J, Gentleman SM (2008) Interactions between APP secretases and inflammatory mediators. Journal of Neuroinflammation 5:25
86
101. Sättler MB, Demmer I, Williams SK, Maier K, Merkler D, Gadjanski I, Stadelmann C, Bähr M, Diem R (2006) Effects of interferon-beta-1a on neuronal survival under autoimmune inflammatory conditions. Experimental Neurology 201:172-181
102. Sättler MB, Williams SK, Neusch C, Otto M, Pehlke JR, Bähr M, Diem R (2008) Flupirtine as neuroprotective add-on therapy in autoimmune optic neuritis. The American Journal of Pathology 173:1496-1507
103. Schall, Ursula: Effekte von Interferonen auf die Phagozytosekapazität von mononukleären Phagozyten bei der Alzheimer Erkrankung. Dissertation, Universität des Saarlandes, Medizinische Fakultät, 2008.
104. Schenk D et al. (1999) Immunization with amyloid-β attenuates Alzheimer-disease-like pathology in the PDAPP mouse. Nature 400:173–177
105. Schindowski K, Eckert A, Peters J, Gorriz C, Schramm U, Weinandi T, Maurer K, Fröhlich L, Müller WE (2007) Increased T-cell reactivity and elevated levels of CD8+ memory T-cells in Alzheimer’s disease-patients and T-cell hyporeactivity in an Alzheimer’s disease-mouse model: implications for immunotherapy. Neuromolecular Medicine 9:340-354
106. Schmidtke K, et. al (2008) Leitlinien der Deutschen Gesellschaft für Neurologie 2008. Diagnostik degenerativer Demenzen. Deutsche Gesellschaft für Neurologie
107. Schwartz M, Butovsky O, Brück W, Hanisch UK (2006) Microglial phenotype: is the commitment reversible? Trends in Neuroscience 29:68-74
108. Selkoe DJ (2001) Presenilins, β-amyloid precursor protein and the molecular basis of Alzheimer’s disease. Clinical Neuroscience Research 1:91-103
109. Selmaj KW, Farooq M, Norton WT, Raine CS, Brosnan CF (1990) Proliferation of astrocytes in vitro in response to cytokines. A primary role for tumor necrosis factor. Journal of Immunology 144:129
110. Snyder EM, Nong Y, Almeida CG, et al. (2005) Regulation of NMDA receptor trafficking by amyloid-beta. Natural Neurosciences 8:1051-8
111. Sofroniew MV, Vinters HV (2010) Astrocytes: biology and pathology. Acta Neuropathologica 119:7-35
112. Sokolowski JD, Mandell JW (2011) Phagocytic clearance in neurodegeneration. The American Journal of Pathology 178:1416-1428
113. Sternfeld, Thomas: Die Bedeutung der Angiogenese für den Krankheitsverlauf des kolorektalen Karzinoms. Dissertation, Freie Universität Berlin, Fachbereich Humanmedizin, 2002.
114. Stromer T, Serpell LC (2005) Structure and morphology of the Alzheimer's amyloid fibril. Microscopy Research and Technique 67:210-217
115. Tancredi V, D'Arcangelo G, Grassi F, Tarroni P, Palmieri G, Santoni A, Eusebi F (1992) Tumor necrosis factor alters synaptic transmission in rat hippocampal slices.Neurosciense Letters 146:176-178
116. Tanzi RE, Moir RD, Wagner SL (2004) Clearance of Alzheimer’s Abeta peptide: the many roads to perdition. Neuron 43:605-08
117. Thal DR, Braak H (2005) Postmortale Diagnosestellung bei Morbus Alzheimer. Der Pathologe 26:201-213
118. Town T, Nikolic V, Tan J (2005) The microglial "activaion" continuum: from innate to adaptive responses. Journal of Neuroinflammation 2:24
87
119. Van der Walt A, Butzkueven H, Kolbe S, Marriott M, Alexandrou E, Gresle M, Egan G, Kilpatrick T (2010) Neuroprotection in multiple sclerosis: a therapeutic challenge for the next decade. Pharmacology & Therapeutics 126:82-93
120. Vassar R, Bennett BD, Babu-Khan S, et al. (1999) Beta-secretase cleavage of Alzheimers’s amyloid precursor protein by the transmembrane aspartic protease BACE. Science 286:735-41
121. Walsh DM, Selkoe DJ, (2004) Deciphering the molecular basis of memory failure in Alzheimer's disease. Neuron 44:181-93
122. Walter S, Letiembre M, Liu Y, Heine H, Penke B, Hao W, Bode B, Manietta N, Walter J, Schulz-Schuffler W, Fassbender K (2007) Role of the toll-like receptor 4 in neuroinflammation in Alzheimer’s disease. Cellular Physiology and Biochemistry 20:947-956
123. Webster S, Lue LF, Brachova L, et al. (1997) Molecular and cellular characterization of the membrane attack complex, C5b-9, in Alzheimer’s
124. disease. Neurobiology of Aging 18:415-421
125. Webster S, Rogers J (1996) Relative efficacies of amyloid β peptide (Aβ)binding proteins in Aβ aggregation. Journal of Neuroscience Research 46:58-66
126. Webster SD, Galvan MD, Ferran E, Garzon-Rodriquez W, Glabe CG, Tenner AJ (2001)Antibody-mediated phagocytosis of the amyloid beta-peptide in microglia is differentially modulated by C1q. Journal of Immunology 166:7496-7503
127. Weiner HL, Frenkel D (2006) Immunology and immunotherapy of Alzheimer’s disease. Nature Reviews. Immunology 6:404-416
128. Weyerer S (2005) Gesundheitsberichterstattung des Bundes, Heft 28. Altersdemenz. Herausgeber: Robert Koch-Institut, Berlin
129. Wimo A, Prince M (2010) World Alzheimer Report 2010. The Global economic impact of dementia. Published by Alzheimer’s Disease International
130. Wyss-Coray T. Mucke L (2002) Inflammation in neurodegenerative disease – a double-edged sword. Neuron 35:419-32
131. Xia MQ, Qin SX, Wu LJ, Mackay CR, Hyman BT (1998)Immunohistochemical study of the beta-chemokine receptors CCR3 and CCR5 and their ligands in normal and Alzheimer’s disease brains. American Journal of Pathology 153:31-7
132. Xie L et al. (2002) Alzheimer’s β-amyloid peptides compete for insulin binding to the insulin receptor. Journal of Neurosciences 22:RC221
133. Yaari R, Corey-Bloom J (2007) Alzheimer’s disease. Seminars in Neurology 27:32-41
134. Yamada T et al. (1995) Selective localization of gelatinase A, an enzyme degrading β-amyloid protein, in white matter microglia and in Schwann cells. Acta Neuropathologica (Berl) 89:199-203
135. Yan SD, Stern D, Kane MD, Kuo YM, Lampert HC, Roher AE (1998) RAGE-A beta interactions in the pathophysiology of Alzheimer's Disease. Restorative Neurology and Neurosciences 12: 167-173
136. Zheng H, Koo EH (2006) The amyloid precursor protein: beyond amyloid. Molecular Neurodegeneration 1:5
88
Websites
137. Medscape of WebMD Health Professional Network LLC. Alzheimer Disease. http://emedicine.medscape.com/article/1134817-overview#showall, retrieved19th September, 2010
138. Neura.net: Coyle PK, Fishman P, Ford CC, Fox EJ, Siderowf AD, Traboulsee A (eds). (2003) Measuring brain atrophy in Alzheimer’s disease. http://www.neura.net/images/pdf/Measuring_Brain_Atrophy_in_AD.pdf, retrieved 25th September, 2010
139. ICH WORLD, LLC. Immunocytochemistry Methods, Techniques and Protocols. http://www.ihcworld.com/_protocols/general_ICC/fixation.htm, retrieved: August 25th, 2010
140. Abcam. Fixation and permeabilization in IHC/ICC. http://www.abcam.com/ps/pdf/protocols/fixation_permeabilization.pdf, retrieved: August 25th, 2010
141. University of Helsinki, Neuroscience Center. http://www.helsinki.fi/neurosci/tanila.html, retrieved: June 5th, 2010
142. ICH WORLD, LLC. Introduction to Immunohistochemistry. http://www.ihcworld.com/_intro/ihc-methods.htm, retrieved: August 25th, 2010
143. ICH WOLD, LLC. Protocol Database, Antigen Retrieval Protocols. http://www.ihcworld.com/epitope_retrieval.htm, retrieved: August 25th, 2010
144. ICH WOLD, LLC. GFAP Antibody Staining Protocol for Immunohistochemistry. http://www.ihcworld.com/_protocols/antibody_protocols/gfap_novocastra.htm, retrieved: August 25th, 2010
145. ICH WORLD, LLC. Bielschowsky’s Silver Staining Protocol for Nerve Fibers, Axons, Neurofibrillary Tangles and Senile Plaques. http://www.ihcworld.com/_protocols/special_stains/bielschowsky.htm, retrieved: August 25th, 2010

89
10. ACKNOWLEDGMENT
I would like to express my gratitude to Prof. Dr. Klaus Faßbender for the opportunity to do my
doctoral thesis in his department. I am especially grateful for the opportunity to perform the
experimental part of this thesis in laboratories in Germany and Finland. In this context I would like to
thank Prof. Heikki Tanila (MD, PhD) from the University of Eastern Finland (former University of
Kuopio). I felt very warmly welcomed in his group and I am glad for this outstanding experience!
I very much would like to thank Dr. Silke Walter for her supervision and guidance during the many
steps of this project and her inspiring energy that also infected me.
I thank my many colleagues from both laboratories who have supported me practically or who
shared generously their scientific experience, amongst others there are Nadine, Manuela, Maryse
and Kahn from Homburg, and Pasi and Laku from Kuopio.
The spiritual support during the work was very important to me. I very much thank my parents and
my friends for their constant believe in me.
Finally I would like to thank Janne! The support you gave me helped me to work on the project. You
cheered me up, gave constructional advise and you showed me that we face all projects as a team. In
the process of this work I just learned the very basics of doing research but already this made me
understand the significance of your work. You are doing an amazing job!
90
11. CURRICULUM VITAE PERSONAL DETAILS name Jenny Schmidt date of birth place of birth
26.10.1985 Dresden, Germany
WORK from 11/2012 intern at the University hospital Kuopio (FIN) in training of internal
medicine 06-10/2012 work-training at the University hospital Kuopio EDUCATION 01-06/2012 integration course provided by the Finish employment centre 12/2011 graduation from Medical school in Homburg/Saar
12/2010-07/2011 Internship at the University hospital Homburg/Saar 02/2010-08/2010 internship at the University hospital Kuopio (Fin) 08/2007- 06/2008 international student at the University of Kuopio (FIN) 09/2006 first state examination since 10/2004 study of human medicine at the University of Saarland in Homburg/Saar 2004 qualification for university
1998-2004 grammar school (Dresden-Cotta) 1996-1998 grammar school with focus on sports 1992-1996 primary school (Dresden-Gorbitz) CLINICAL ELECTIVES 08-09/2009 practice for general medicine (Dresden-Gorbitz) 09/2008 department of cardiology (TU Dresden) 07-08/2008 department of clinical neurosciences
(Helsinki University Central Hospital, FIN) 02-03/2007 department of gastroenterology (hospital Dresden-Friedrichstadt) 06-07/ 2005 practical nursing (dermatology, oncology, trauma surgery)
in the hospital Dresden-Friedrichstadt 02-03/2005 practical nursing in the hospital of Thurgau, St. Katharinental
(Switzerland) PART-TIME WORK 05/2011-07/2011 teaching assistant in the department of neurology, University hospital
Homburg/Saar 11/2008-03/2010 graduate assistant in the department of general medicine at the
university of Saarland 04/2005-07/2005 nursing assistant in the University hospital Homburg/Saar 12/2004-05/2005 student assistant at the neuro-imaging laboratory Homburg/Saar 2000-2004 receptionist in a practice for general medicine in Dresden-Gorbitz