CHEM 355 EXPERIMENT 2 Conductimetric...
6
CHEM 355 EXPERIMENT 2 Conductimetric Titration Conductance, G is the reciprocal of its resistance and has unit Ω -1 . The SI unit for conductance is Siemens and 1 Siemens = 1 Ohm -1 = 1 / (1) The conductivity of a solution depends on the number of ions, therefore, it is introduced as molar conductivity. Conductivity of ions depends on several factors including concentration, size, charge of the ion and temperature. In general, conductivity varies with concentration but conductivity sometimes cannot be correlated with concentration since some deviations can be observed due to the interactions. Temperature also effect the conductivity but the dependence of conductivity on temperature varies for different solutions. Another factor affecting conductivity is its size, as size of the ion decreases its conductivity increases. Conductivity can also be used for conductimetric titration that involves measurement of the conductance of the sample solution after successive additions of reagent if the concentrations of various ions in solution are chancing. The conductance of the sample is measured after successive addition of the reagent and the end point is determined from a plot of the conductance or the specific conductance as a function of the volume of added titrant. These titration curves take variety of shapes depending on the chemical system under investigation. In general, however, they are characterized by straight-line portions with dissimilar slopes on either side of the equivalence point. The intersections of the two straight-line portions give the end point. Conductimetric titration can be applied to strong acid - strong base, weak acid - strong base, precipitation and complex formation titrations. Strong acid- strong base titration: HCl is strong electrolyte and completely dissociates in water according to the formula below: HCl (aq) + NaOH (aq) NaCl (aq) +H 2 O (aq) During the titration, H + is reacted with OH - and Na + , Cl - and H 2 O are formed. It is obvious that as the titration proceeds towards the end point, the highly conducting hydrogen ions are being replaced by sodium ions of much lower conductance. Thus, conductivity of solution decreases up to end point. After the end point due to the addition of excess NaOH conductance increases again but slopes of the curves are different due to the conductivity differences between H + and OH - as shown in the Figure 1. mL of alkaline added conductivity or specific conductance Figure 1. Strong acid- strong base conductimetric titration curve
Transcript of CHEM 355 EXPERIMENT 2 Conductimetric...
CHEM 355
EXPERIMENT 2
Conductimetric Titration
Conductance, G is the reciprocal of its resistance and has unit Ω-1
. The SI unit for conductance is
Siemens and 1 Siemens = 1 Ohm-1
𝐺 = 1 / 𝑅 (1) The conductivity of a solution depends on the number of ions, therefore, it is introduced as molar
conductivity. Conductivity of ions depends on several factors including concentration, size, charge of the
ion and temperature. In general, conductivity varies with concentration but conductivity sometimes cannot
be correlated with concentration since some deviations can be observed due to the interactions.
Temperature also effect the conductivity but the dependence of conductivity on temperature varies for
different solutions. Another factor affecting conductivity is its size, as size of the ion decreases its
conductivity increases.
Conductivity can also be used for conductimetric titration that involves measurement of the conductance
of the sample solution after successive additions of reagent if the concentrations of various ions in
solution are chancing. The conductance of the sample is measured after successive addition of the
reagent and the end point is determined from a plot of the conductance or the specific conductance as a
function of the volume of added titrant. These titration curves take variety of shapes depending on the
chemical system under investigation. In general, however, they are characterized by straight-line portions
with dissimilar slopes on either side of the equivalence point. The intersections of the two straight-line
portions give the end point. Conductimetric titration can be applied to strong acid - strong base, weak acid
- strong base, precipitation and complex formation titrations.
Strong acid- strong base titration: HCl is strong electrolyte and completely dissociates in water
according to the formula below:
HCl(aq) + NaOH(aq) NaCl(aq) + H2O(aq)
During the titration, H+ is reacted with OH
- and Na
+, Cl
- and H2O are formed. It is obvious that as the
titration proceeds towards the end point, the highly conducting hydrogen ions are being replaced by
sodium ions of much lower conductance. Thus, conductivity of solution decreases up to end point. After
the end point due to the addition of excess NaOH conductance increases again but slopes of the curves
are different due to the conductivity differences between H+ and OH
- as shown in the Figure 1.
mL of alkaline added
conductivityor specificconductance
Figure 1. Strong acid- strong base conductimetric titration curve
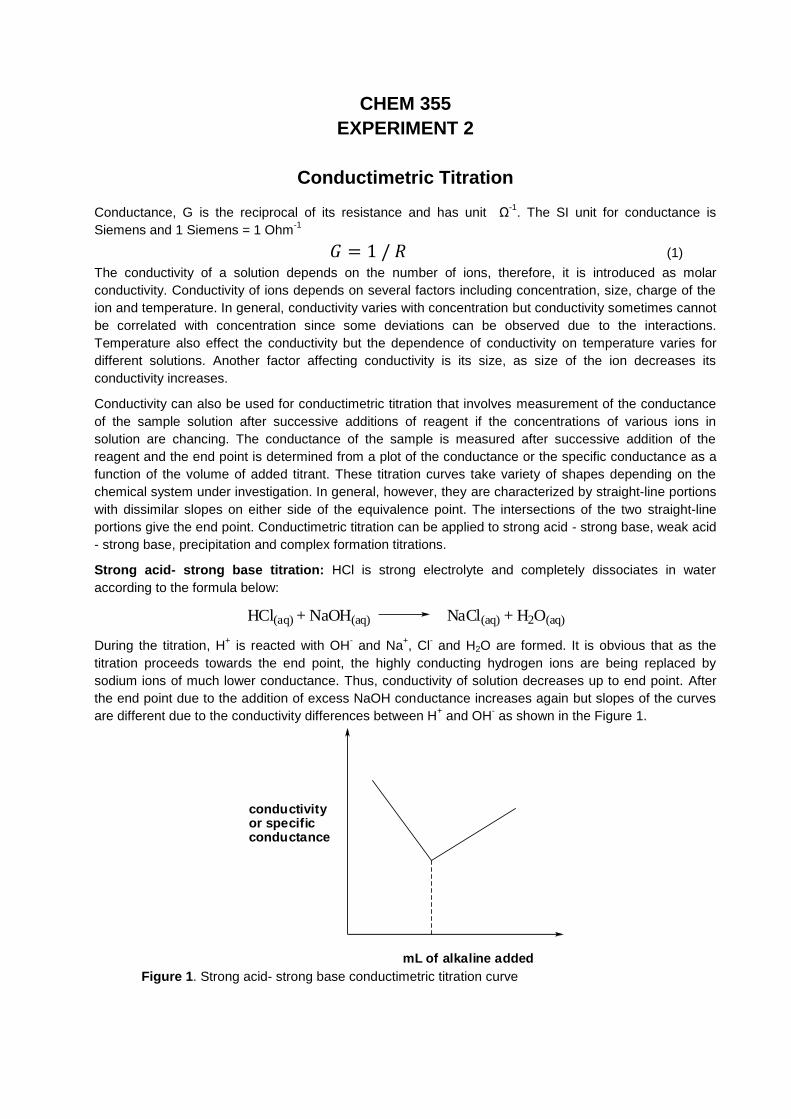
Weak acid- strong base titration: Weak acid does not completely ionize in solution therefore at the
beginning of the titration its conductivity is low.
HAc (aq)+ NaOH(aq) Na+(aq) +Ac-(aq)+ H2O(aq)
OH- reacts with H
+ and Na
+, Ac
- form and conductivity stats to increase. After the end point, excess OH
-
ions result increase in conductance because of the relatively greater mobility of OH-.
conductivityor specificconductance
mL of alkaline added Figure 2. Weak acid- strong base conductimetric titration curve
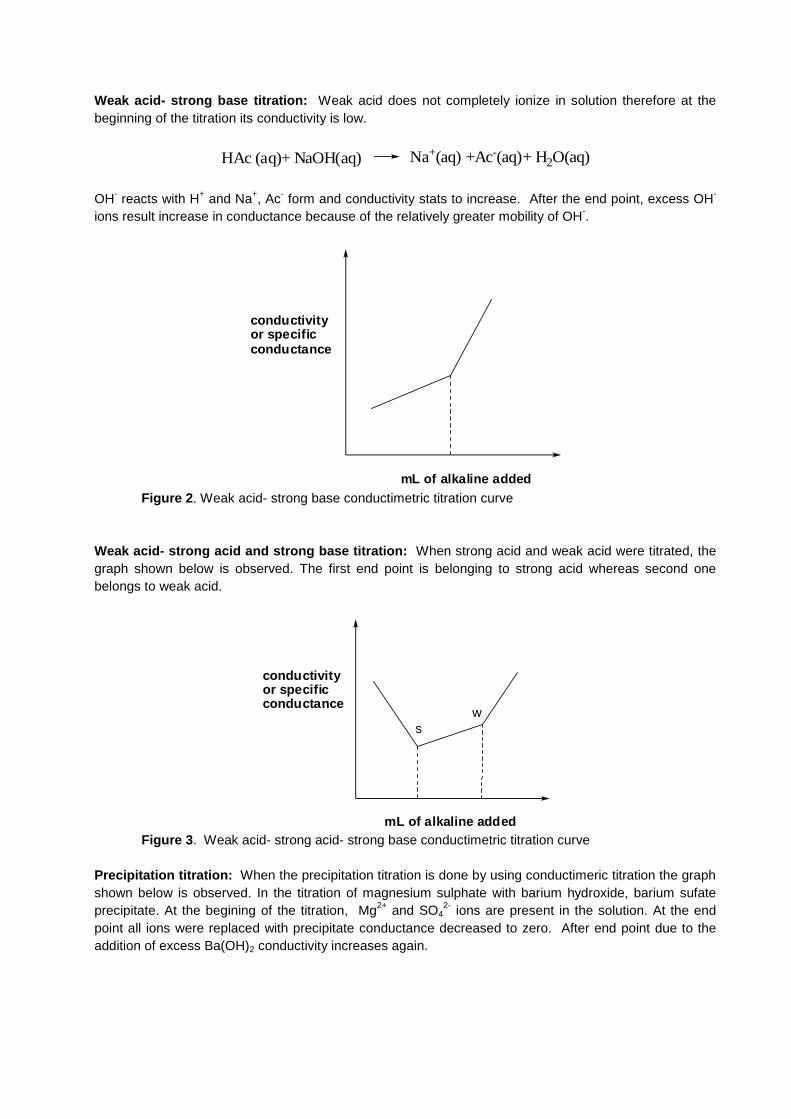
Weak acid- strong acid and strong base titration: When strong acid and weak acid were titrated, the
graph shown below is observed. The first end point is belonging to strong acid whereas second one
belongs to weak acid.
mL of alkaline added
s
w
conductivityor specificconductance
Figure 3. Weak acid- strong acid- strong base conductimetric titration curve
Precipitation titration: When the precipitation titration is done by using conductimeric titration the graph
shown below is observed. In the titration of magnesium sulphate with barium hydroxide, barium sufate
precipitate. At the begining of the titration, Mg2+
and SO42-
ions are present in the solution. At the end
point all ions were replaced with precipitate conductance decreased to zero. After end point due to the
addition of excess Ba(OH)2 conductivity increases again.
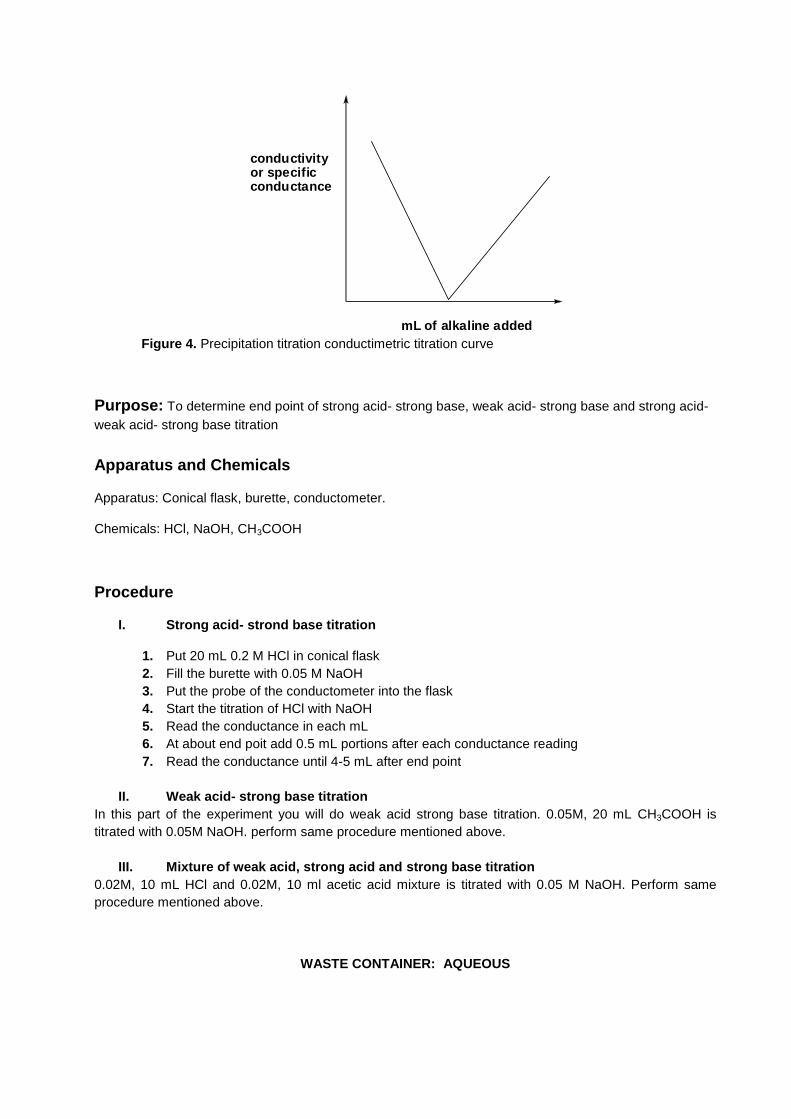
mL of alkaline added
conductivityor specificconductance
Figure 4. Precipitation titration conductimetric titration curve
Purpose: To determine end point of strong acid- strong base, weak acid- strong base and strong acid-
weak acid- strong base titration
Apparatus and Chemicals
Apparatus: Conical flask, burette, conductometer.
Chemicals: HCl, NaOH, CH3COOH
Procedure
I. Strong acid- strond base titration
1. Put 20 mL 0.2 M HCl in conical flask
2. Fill the burette with 0.05 M NaOH
3. Put the probe of the conductometer into the flask
4. Start the titration of HCl with NaOH
5. Read the conductance in each mL
6. At about end poit add 0.5 mL portions after each conductance reading
7. Read the conductance until 4-5 mL after end point
II. Weak acid- strong base titration
In this part of the experiment you will do weak acid strong base titration. 0.05M, 20 mL CH3COOH is
titrated with 0.05M NaOH. perform same procedure mentioned above.
III. Mixture of weak acid, strong acid and strong base titration
0.02M, 10 mL HCl and 0.02M, 10 ml acetic acid mixture is titrated with 0.05 M NaOH. Perform same
procedure mentioned above.
WASTE CONTAINER: AQUEOUS
Treatment of Data
1. Plot conductance versus volume of titrant added graphs for each part.
2. Find theoretical and experimental end points.
Questions
1. Compare the theoretical and experimental end points, discuss the results and possible source of
errors.
2. Discuss the increasing and decreasing lines on the graphs by writing all of the ions present in
each region on the graphs.
3. Write the advantages of conductimetric titrations.
4. Why the conductivity of H+ and OH
- is higher?
DATA SHEET Experiment 2 Conductimetric Titration
Group Number: Date:
Assistant name and signature:
Table 1. Strong acid- strong base titration
Volume of
added NaOH (mL) conductance
Volume of
added NaOH (mL) conductance
Table 2. Weak acid strong base titration
Volume of
added NaOH (mL)
Conductance
(S)
Volume of added NaOH
(mL)
Conductance
(S)
Table 3. Weak acid- strong acid- weak base titration
Volume of
added NaOH
(mL)
Conductance
(S)
Volume of
added NaOH
(mL)
Conductance
(S)


![[æ] [ei] [ Λ ] [d] [s] [a:] [o:]](https://static.fdocument.org/doc/165x107/568146f2550346895db42621/ae-ei-d-s-a-o.jpg)