media. · Web viewELWD with N.A. 0.45; Nikon) and a 100 W fluorescent lamp (C-HGFIE...
12
Supplementary Information Resolution of Inflammation and Sepsis Survival Are Improved by Dietary Ω-3 Fatty Acids Andreas Körner 1 , Martin Schlegel 1 , Julia Theurer 1 , Hannes Frohnmeyer 1 , Michael Adolph 1 , Marieke Heijink 2 , Martin Giera 2 , Peter Rosenberger 1 and Valbona Mirakaj 1 1 Department of Anesthesiology and Intensive Care Medicine, University Hospital Tübingen, Eberhard-Karls University Tübingen, Germany 2 Center for Proteomics and Metabolomics, Leiden University Medical Center (LUMC), The Netherlands 1
-
Upload
nguyennhan -
Category
Documents
-
view
214 -
download
0
Transcript of media. · Web viewELWD with N.A. 0.45; Nikon) and a 100 W fluorescent lamp (C-HGFIE...
Supplementary Information
Resolution of Inflammation and Sepsis Survival Are
Improved by Dietary Ω-3 Fatty Acids
Andreas Körner1, Martin Schlegel1, Julia Theurer1, Hannes Frohnmeyer1, Michael Adolph1,
Marieke Heijink2, Martin Giera2, Peter Rosenberger1 and Valbona Mirakaj1
1Department of Anesthesiology and Intensive Care Medicine, University Hospital Tübingen, Eberhard-Karls University Tübingen, Germany2Center for Proteomics and Metabolomics, Leiden University Medical Center (LUMC), The Netherlands
1
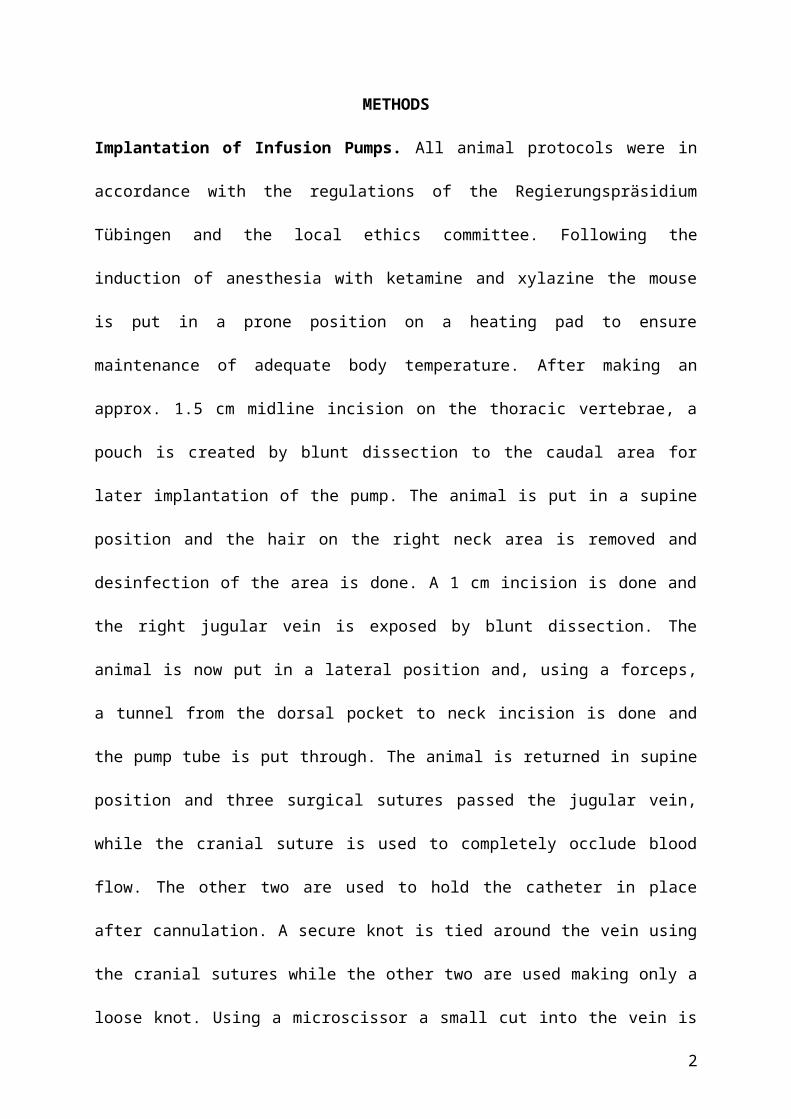
METHODS
Implantation of Infusion Pumps. All animal protocols were in accordance with the
regulations of the Regierungspräsidium Tübingen and the local ethics committee. Following
the induction of anesthesia with ketamine and xylazine the mouse is put in a prone position on
a heating pad to ensure maintenance of adequate body temperature. After making an approx.
1.5 cm midline incision on the thoracic vertebrae, a pouch is created by blunt dissection to the
caudal area for later implantation of the pump. The animal is put in a supine position and the
hair on the right neck area is removed and desinfection of the area is done. A 1 cm incision is
done and the right jugular vein is exposed by blunt dissection. The animal is now put in a
lateral position and, using a forceps, a tunnel from the dorsal pocket to neck incision is done
and the pump tube is put through. The animal is returned in supine position and three surgical
sutures passed the jugular vein, while the cranial suture is used to completely occlude blood
flow. The other two are used to hold the catheter in place after cannulation. A secure knot is
tied around the vein using the cranial sutures while the other two are used making only a
loose knot. Using a microscissor a small cut into the vein is done and the catheter is placed
into it. By pulling the loose ends of the caudal sutures the catheter is secured in the vein. The
suture tails are trimmed and the skin is closed with 5-0 non-absorbable suture (Suppl. Fig. 3).
The administration of LEs was started after surgery. The flow rate of the infusion was set at
10 μl per hour with a concentration of 200 μg/μl (approx. 2 mg/g body weight per day).
Intravital Microscopy of Cremaster Microvasculature. ZyA induced peritonitis was
implemented as described above. Following the induction of anesthesia, a catheter was placed
in the left jugular vein for the administration of drugs and antibodies. Rhodamine-6G (Sigma-
Aldrich) (100 µL, 0.05%) was injected i.v. to stain circulating leukocytes. The cremaster
microcirculation was observed in vivo using a Nikon Eclipse Ci-L microscope (Nikon,
Düsseldorf, Germany) equipped with a 20× objective lens (Objective CFI Super Plan Fluor
2
ELWD with N.A. 0.45; Nikon) and a 100 W fluorescent lamp (C-HGFIE Intensilight, Nikon).
Images were captured with an Orca-R2 Hamamatsu camera (Hamamatsu Photonics,
Hamamatsu, Japan) 4 h after induction of peritonitis. For image acquisition and analysis, NIS-
AR elements software (Nikon) was used. Leukocyte-endothelium interactions in the
microvasculature were analyzed in a standard field (SF) per 5,000 µm2 of vessel surface.
Rolling leukocyte flux was defined as the number of rhodamine-stained leukocytes moving
slower than erythrocytes over 30 sec within the SF. Leukocytes were considered adherent if
remaining stationary at the vessel wall for at least 30 sec.
Human MΦ Efferocytosis and Phagocytosis. For the differentiation of MΦ, peripheral
blood monocytes were isolated from healthy volunteers or human leukapheresis collars from
the Blood Bank of Eberhard Karls University of Tübingen and cultured in RPMI 1640
medium with 10 ng/mL human recombinant GM-CSF (R&D Systems) (37 °C for 7 days). To
prepare apoptotic PMNs, human PMNs obtained from peripheral blood were isolated and
labeled with carboxyfluorescein diacetate (10 μM, 30 min at 37 °C; Molecular Probes) and
allowed to undergo apoptosis in serum-free RPMI 1640 medium for 16-18 h. MΦ (0.1 x 10⁶
cells/well) were then incubated with Ω-3+ (Lipidem, B.Braun) or Ω-3- (Lipofundin, B.Braun)
LEs or vehicle. Apoptotic PMNs were added at a 1:3 ratio (MΦ:PMN) and incubated at 37 °C
for 60 min to induce phagocytosis. In separate experiments, MΦ were incubated either with
Ω-3+ or Ω-3- LE or vehicle for 15 min at 37 °C and then incubated with ZyA particles
(Molecular Probes, Darmstadt, Germany) at a 1:30 ratio (MΦ:ZyA particles) or E-coli
particles at a 1:50 ratio (MΦ:E.coli) for 60 min. In a further experiment, human MΦ were
incubated with 0.1, 1.0, 10, 100 and 1000 μg of baicalein or CDC and the degree of
phagocyted fluorescently labeled ZyA particles was assessed. Fluorescence was determined
by using a fluorescent plate reader (Tecan, Männedorf, Switzerland).
3
LC-MS/MS. Peritoneal lavage samples were spiked with 4 µL of an internal standard
solution (containing PGE4-d4, LTB4-d4 15-HETE-d8 and DHA-d6 at a concentration of 50
ng/ml in methanol). The samples were transferred to a 12-ml glass vial, and 1.75 ml of
methanol was added. The samples were centrifuged at 4,000 rpm for 5 min at 6 °C, and the
supernatant was transferred to a fresh 12-ml glass vial. The pellet was re-extracted with 500
µl of methanol and centrifuged as described above, and the organic extracts were combined.
The methanol was partially removed under a gentle stream of nitrogen at 40 °C for 30 min.
The remaining methanolic extract (approximately 1.5 ml) was diluted with 8 ml of water, and
20 µl of 6 M HCl was added. The prepared samples were cleaned via solid phase extraction
(SPE) (SepPak C18 200 mg, Waters, MA, USA). The samples were loaded onto
preconditioned SPE cartridges (2 ml methanol, followed by 2 ml water), the cartridges were
washed with 3 ml of water followed by 3 ml of n-hexane, and then the samples were eluted
with 3 ml of methylformate. The eluate was dried under a gentle stream of nitrogen,
reconstituted in 200 µL of 40% methanol, and injected.
LC-MS/MS analysis was performed as described below. Briefly, a QTrap 6500 mass
spectrometer operating in negative ESI mode (Sciex, Nieuwerkerk aan den Ijssel, The
Netherlands) was coupled to an LC system employing two LC-30AD pumps, a SIL-30AC
autosampler, and a CTO-20AC column oven (Shimadzu, ’s-Hertogenbosch, The
Netherlands). A 1.7 µm Kinetex C18 50 × 2.1 mm column protected with a C8 precolumn
(Phenomenex, Utrecht, The Netherlands) was used, and the column was maintained at 50 °C.
A binary gradient of water (A) and MeOH (B) containing 0.01% acetic acid was generated as
follows: 0 min 30% B, held for 1 min, then ramped to 45% B at 1.1 min, 53.5% B at 2 min,
55.5% B at 4 min, 90% B at 7 min, and 100% B at 7.1 min, and held for 1.9 min. The
injection volume was 40 µl, and the flow rate was 400 µl/min. The MS was operated as
previously described1. For analyte identification, the mass transition used for each analyte was
combined with its relative retention time (RRT). The calibration lines constructed with
4
standard material for each analyte were used for quantification, and only peaks with a signal
to noise (S/N) ratio > 10 were quantified.
5
Suppl. Figure Legends
Suppl. Figure 1: Overview of the Ω-3+ and Ω-3- LEs induced pro-resolving lipid
mediator biosynthesis at 4 h and 12 h. WT mice were exposed to Ω-3+ or Ω-3- LE or vehicle
for 24 h before injecting ZyA and then collecting peritoneal lavages at 4 h, 12 h, 24 h and 48
h. LC-MS/MS based profiling was performed. Levels of bioactive lipid mediators and
precursors derived from the AA, DHA and EPA pathways. The results represent two to three
independent experiments with n=6-8 mice/group. All results are reported as ng/ml. For
substances where no calibration line was constructed, the values represent area ratios to the
specific internal standard.
Suppl. Figure 2: FACS gating strategy for leukocyte differentiation and efferocytosis.
Peritoneal lavages were prepared as described in the Material and Methods. Leukocytes were
gated on FSC/SSC. Leukocyte subtypes were further classified into Ly6Ghi, Ly6Chi and
Ly6Clo. For defining efferocytosis, the differentiation of intra- and extra-cellular PMN was
assessed by using Ly6G-PerCP-Cy5.5 and Ly6G-APC antibodies. Phagocytized PMNs were
Ly6G-PerCP-Cy5.5+ and Ly6G-APC-.
Suppl. Figure 3: Implantation of infusion pumps. The method is described in detail in the
Material and Methods.
Suppl. Figure 4: Ω-3+ LEs stimulate resolution of inflammation in murine polymicrobial
sepsis. WT mice were administered with Ω-3+ LEs, Ω-3- LEs or vehicle 24 h prior exposure to
CLP and lavages were collected at 4 h. A) Total leukocytes were enumerated by light
microscopy and PMNs were characterized by flow cytometry. B) Classical monocytes, non-
classical monocytes and efferocytosis were determined. Results represent two independent
6
experiments and are expressed as the mean±SEM, n=6-8 per group, *P<0.05; **P<0.01;
***P<0.001, One-way ANOVA followed by Bonferroni’s multiple-comparison test.
Suppl. Figure 5: Ω-3+ LEs enhance pro-resolving lipid mediator biosynthesis in murine
polymicrobial sepsis. WT mice were administered with Ω-3+ LEs, Ω-3- LEs or vehicle 24 h
prior exposure to CLP and lavages were collected at 4 h. LC-MS/MS based profiling was
performed in murine peritoneal lavages. All results are reported as ng/106 cells of peritoneal
lavage. Results represent two independent experiments and are expressed as the mean±SEM,
n=6-8 per group, *P<0.05; **P<0.01; ***P<0.001, One-way ANOVA followed by
Bonferroni’s multiple-comparison test.
Table S1: Composition of Ω-3+ or Ω-3- LEs.
Table S2: Lipid mediator levels in murine peritoneal lavages following administration of
Ω-3+, Ω-3- LEs or vehicle. LC-MS/MS based profiling was performed in peritoneal lavages
of C57BL/6 mice exposed to Ω-3+ LE or vehicle for 24 h before inducing ZyA peritonitis for
4 h. The results represent two to three independent experiments with n=6-8 mice/group. All
results are reported as ng/ml. For substances where no calibration line was constructed, the
values represent area ratios to the specific internal standard.
Suppl. Movie 1A: 24 hours after CLP: General state after treatment with Ω-3+ LEs.
Suppl. Movie 1B: 24 hours after CLP: General state after treatment with Ω-3- LEs.
Suppl. Movie 1C: 24 hours after CLP: General state after treatment with Ω-3+ (left cage) or
Ω-3- LEs (right cage).
Suppl. Movie 1D: 72 hours after CLP: General state after treatment with Ω-3+ LEs.
7
Suppl. Movie 1E: 72 hours after CLP: General state after treatment with Ω-3- LEs.
Suppl. Movie 1F: 72 hours after CLP: General state after treatment with Ω-3+ (left cage) or
Ω-3- LEs (right cage).
Suppl. Movie 2A: This file shows a 20 sec time-lapse movie of rolling (red) and adherent
leukocytes (yellow) in peritonitis mice treated with Ω-3+ LEs.
Suppl. Movie 2B: This file shows a 20 sec time-lapse movie of rolling (red) and adherent
leukocytes (yellow) in peritonitis mice treated with vehicle.
8
REFERENCES
1. Heemskerk MM, Dharuri HK, van den Berg SA, Jonasdottir HS, Kloos DP, Giera M, et al. Prolonged niacin treatment leads to increased adipose tissue PUFA synthesis and anti-inflammatory lipid and oxylipin plasma profile. J Lipid Res 2014, 55(12): 2532-2540.
9


![CMOS linear image sensor - Hamamatsu Photonics3 CMOS linear image sensor S13488 Electrical and optical characteristics [Ta=25 °C, Vdd=5 V, V(CLK)=V(ST)=5 V, f(CLK)=10 MHz] Parameter](https://static.fdocument.org/doc/165x107/60abeb8e2a5f391b163138b2/cmos-linear-image-sensor-hamamatsu-photonics-3-cmos-linear-image-sensor-s13488.jpg)


![Overview of FDSS application - Hamamatsu Photonics · 2016. 9. 6. · Corning SUMITOMO BAKELITE Greiner Kuraray InSphero Coster 3D ®PrimeSurface ... 10* SD [0% sample] 31 NanoBRET™](https://static.fdocument.org/doc/165x107/608ffdd9b0795e36424c1386/overview-of-fdss-application-hamamatsu-photonics-2016-9-6-corning-sumitomo.jpg)