Lecture 7: Assessing Regression Studies
81
Lecture 7: Assessing Regression Studies Introduction to Econometrics,Fall 2021 Zhaopeng Qu Nanjing University Business School October 21 2021 Zhaopeng Qu ( NJU ) Assessing Regression Studies October 21 2021 1 / 81
Transcript of Lecture 7: Assessing Regression Studies
Lecture 7: Assessing Regression StudiesIntroduction to Econometrics,Fall 2021
Zhaopeng Qu
Nanjing University Business School
October 21 2021
Zhaopeng Qu ( NJU ) Assessing Regression Studies October 21 2021 1 / 81
Review of previous lectures
Review of previous lectures
Zhaopeng Qu ( NJU ) Assessing Regression Studies October 21 2021 2 / 81
Review of previous lectures
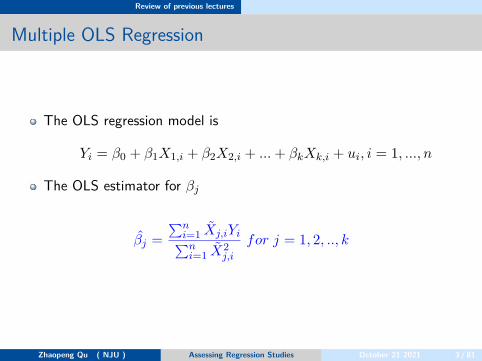
Multiple OLS Regression
The OLS regression model is
Yi = β0 + β1X1,i + β2X2,i + ... + βkXk,i + ui, i = 1, ..., n
The OLS estimator for βj
βj =∑n
i=1 Xj,iYi∑ni=1 X2
j,i
for j = 1, 2, .., k
Zhaopeng Qu ( NJU ) Assessing Regression Studies October 21 2021 3 / 81
Review of previous lectures
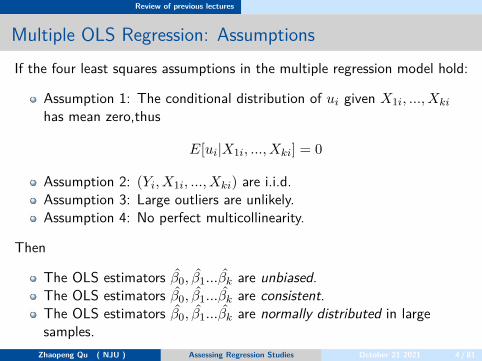
Multiple OLS Regression: AssumptionsIf the four least squares assumptions in the multiple regression model hold:
Assumption 1: The conditional distribution of ui given X1i, ..., Xki
has mean zero,thus
E[ui|X1i, ..., Xki] = 0
Assumption 2: (Yi, X1i, ..., Xki) are i.i.d.Assumption 3: Large outliers are unlikely.Assumption 4: No perfect multicollinearity.
Then
The OLS estimators β0, β1...βk are unbiased.The OLS estimators β0, β1...βk are consistent.The OLS estimators β0, β1...βk are normally distributed in largesamples.
Zhaopeng Qu ( NJU ) Assessing Regression Studies October 21 2021 4 / 81
Review of previous lectures
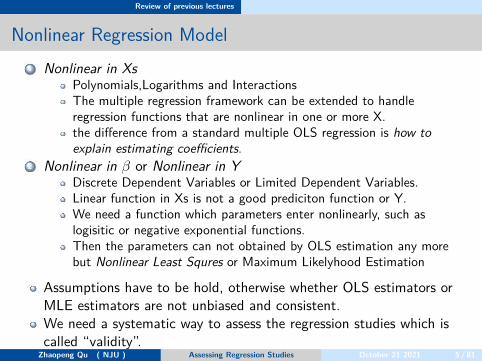
Nonlinear Regression Model1 Nonlinear in Xs
Polynomials,Logarithms and InteractionsThe multiple regression framework can be extended to handleregression functions that are nonlinear in one or more X.the difference from a standard multiple OLS regression is how toexplain estimating coefficients.
2 Nonlinear in β or Nonlinear in YDiscrete Dependent Variables or Limited Dependent Variables.Linear function in Xs is not a good prediciton function or Y.We need a function which parameters enter nonlinearly, such aslogisitic or negative exponential functions.Then the parameters can not obtained by OLS estimation any morebut Nonlinear Least Squres or Maximum Likelyhood Estimation
Assumptions have to be hold, otherwise whether OLS estimators orMLE estimators are not unbiased and consistent.We need a systematic way to assess the regression studies which iscalled “validity”.
Zhaopeng Qu ( NJU ) Assessing Regression Studies October 21 2021 5 / 81
Introduction
Introduction
Zhaopeng Qu ( NJU ) Assessing Regression Studies October 21 2021 6 / 81
Introduction
Introduction
The concepts of internal and external validity provide a generalframework for assessing whether a empirical studies answers a specificquestion of interest rightly and usefully.
Internal validity: the statistical inferences about causal effects arevalid for the population and setting being studied.External validity: the statistical inferences can be generalized fromthe population and setting studied to other populations and settings.
Zhaopeng Qu ( NJU ) Assessing Regression Studies October 21 2021 7 / 81
Introduction
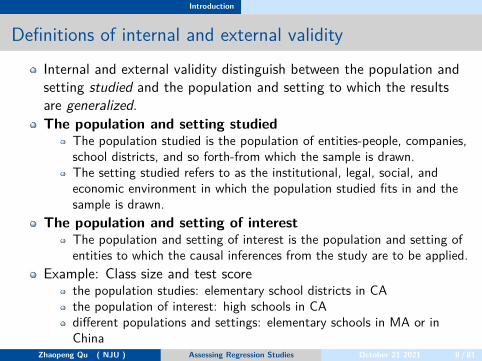
Definitions of internal and external validityInternal and external validity distinguish between the population andsetting studied and the population and setting to which the resultsare generalized.The population and setting studied
The population studied is the population of entities-people, companies,school districts, and so forth-from which the sample is drawn.The setting studied refers to as the institutional, legal, social, andeconomic environment in which the population studied fits in and thesample is drawn.
The population and setting of interestThe population and setting of interest is the population and setting ofentities to which the causal inferences from the study are to be applied.
Example: Class size and test scorethe population studies: elementary school districts in CAthe population of interest: high schools in CAdifferent populations and settings: elementary schools in MA or inChina
Zhaopeng Qu ( NJU ) Assessing Regression Studies October 21 2021 8 / 81
Internal validity
Internal validity
Zhaopeng Qu ( NJU ) Assessing Regression Studies October 21 2021 9 / 81
Internal validity
Internal Validity in OLS Regression
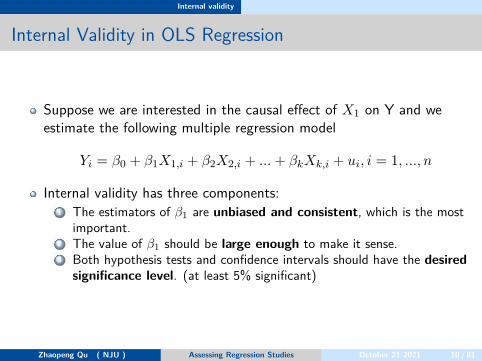
Suppose we are interested in the causal effect of X1 on Y and weestimate the following multiple regression model
Yi = β0 + β1X1,i + β2X2,i + ... + βkXk,i + ui, i = 1, ..., n
Internal validity has three components:1 The estimators of β1 are unbiased and consistent, which is the most
important.2 The value of β1 should be large enough to make it sense.3 Both hypothesis tests and confidence intervals should have the desired
significance level. (at least 5% significant)
Zhaopeng Qu ( NJU ) Assessing Regression Studies October 21 2021 10 / 81
Internal validity
Threats to Internal Validity
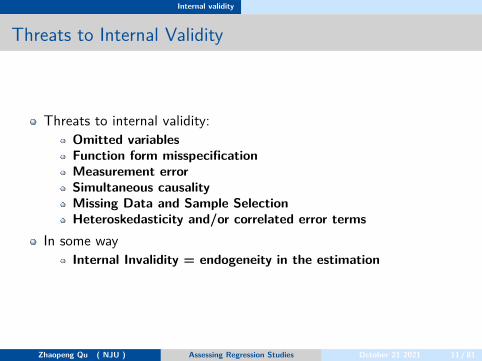
Threats to internal validity:Omitted variablesFunction form misspecificationMeasurement errorSimultaneous causalityMissing Data and Sample SelectionHeteroskedasticity and/or correlated error terms
In some wayInternal Invalidity = endogeneity in the estimation
Zhaopeng Qu ( NJU ) Assessing Regression Studies October 21 2021 11 / 81
Internal validity
Omitted Variable Bias(OVB): Review
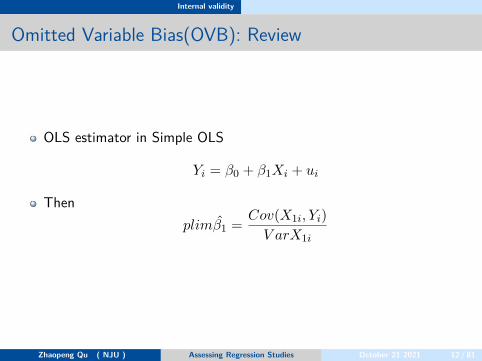
OLS estimator in Simple OLS
Yi = β0 + β1Xi + ui
Thenplimβ1 = Cov(X1i, Yi)
V arX1i
Zhaopeng Qu ( NJU ) Assessing Regression Studies October 21 2021 12 / 81
Internal validity
Omitted Variable Bias(OVB): Review
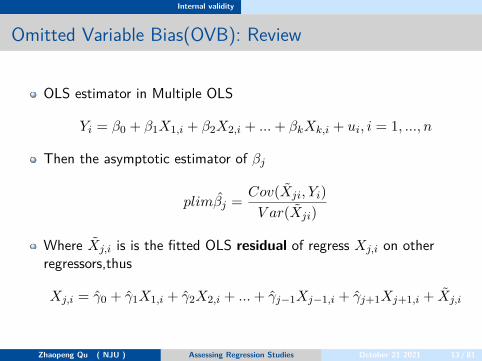
OLS estimator in Multiple OLS
Yi = β0 + β1X1,i + β2X2,i + ... + βkXk,i + ui, i = 1, ..., n
Then the asymptotic estimator of βj
plimβj = Cov(Xji, Yi)V ar(Xji)
Where Xj,i is is the fitted OLS residual of regress Xj,i on otherregressors,thus
Xj,i = γ0 + γ1X1,i + γ2X2,i + ... + γj−1Xj−1,i + γj+1Xj+1,i + Xj,i
Zhaopeng Qu ( NJU ) Assessing Regression Studies October 21 2021 13 / 81
Internal validity
Omitted Variable Bias(OVB): Review
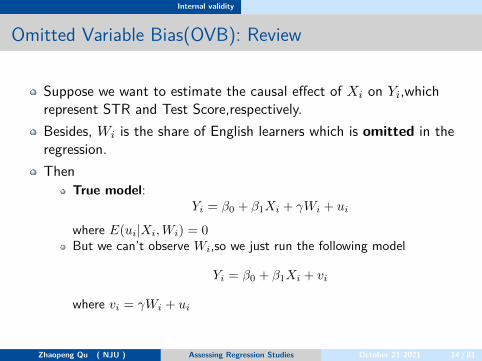
Suppose we want to estimate the causal effect of Xi on Yi,whichrepresent STR and Test Score,respectively.Besides, Wi is the share of English learners which is omitted in theregression.Then
True model:Yi = β0 + β1Xi + γWi + ui
where E(ui|Xi, Wi) = 0But we can’t observe Wi,so we just run the following model
Yi = β0 + β1Xi + vi
where vi = γWi + ui
Zhaopeng Qu ( NJU ) Assessing Regression Studies October 21 2021 14 / 81
Internal validity
Omitted Variable Bias(OVB): Review
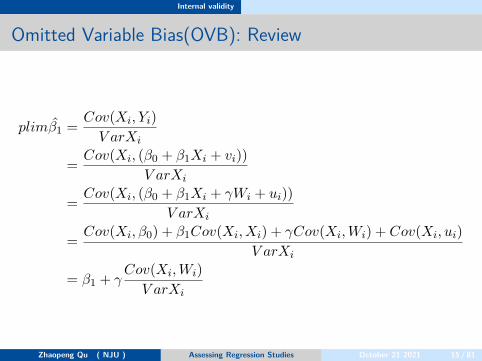
plimβ1 = Cov(Xi, Yi)V arXi
= Cov(Xi, (β0 + β1Xi + vi))V arXi
= Cov(Xi, (β0 + β1Xi + γWi + ui))V arXi
= Cov(Xi, β0) + β1Cov(Xi, Xi) + γCov(Xi, Wi) + Cov(Xi, ui)V arXi
= β1 + γCov(Xi, Wi)
V arXi
Zhaopeng Qu ( NJU ) Assessing Regression Studies October 21 2021 15 / 81
Internal validity
Omitted Variable Bias(OVB): Review
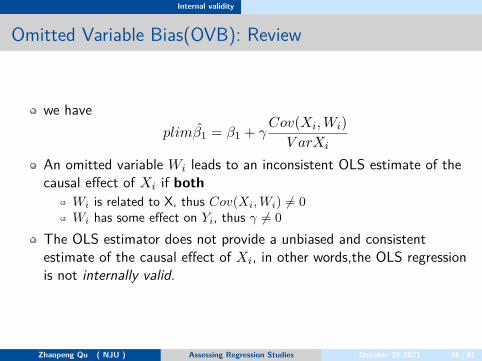
we haveplimβ1 = β1 + γ
Cov(Xi, Wi)V arXi
An omitted variable Wi leads to an inconsistent OLS estimate of thecausal effect of Xi if both
Wi is related to X, thus Cov(Xi, Wi) = 0Wi has some effect on Yi, thus γ = 0
The OLS estimator does not provide a unbiased and consistentestimate of the causal effect of Xi, in other words,the OLS regressionis not internally valid.
Zhaopeng Qu ( NJU ) Assessing Regression Studies October 21 2021 16 / 81
Internal validity
Omiited Variable Bias(OVB): Review
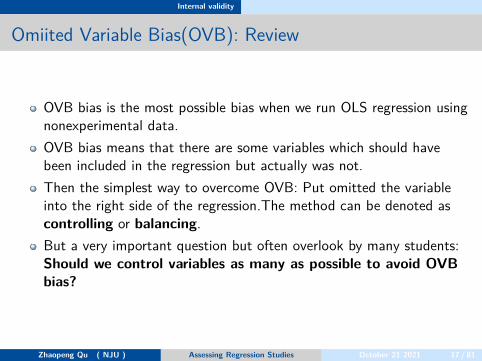
OVB bias is the most possible bias when we run OLS regression usingnonexperimental data.OVB bias means that there are some variables which should havebeen included in the regression but actually was not.Then the simplest way to overcome OVB: Put omitted the variableinto the right side of the regression.The method can be denoted ascontrolling or balancing.But a very important question but often overlook by many students:Should we control variables as many as possible to avoid OVBbias?
Zhaopeng Qu ( NJU ) Assessing Regression Studies October 21 2021 17 / 81
Internal validity
Irrelevant Variables
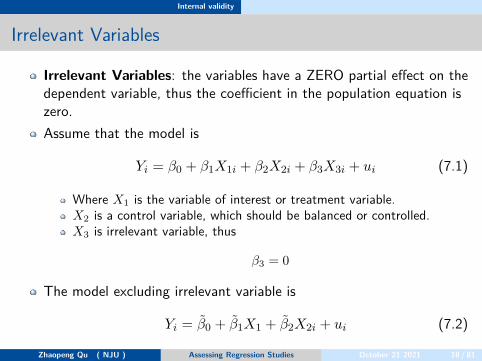
Irrelevant Variables: the variables have a ZERO partial effect on thedependent variable, thus the coefficient in the population equation iszero.Assume that the model is
Yi = β0 + β1X1i + β2X2i + β3X3i + ui (7.1)
Where X1 is the variable of interest or treatment variable.X2 is a control variable, which should be balanced or controlled.X3 is irrelevant variable, thus
β3 = 0
The model excluding irrelevant variable is
Yi = β0 + β1X1 + β2X2i + ui (7.2)
Zhaopeng Qu ( NJU ) Assessing Regression Studies October 21 2021 18 / 81
Internal validity
Irrelevant Variables
Assume that we do not know β3 is actually irrelevant but we considerit as control variable,then what is the consequence?Including an irrelevant variable does not have any consequence on theunbiasedness of the OLS estimators.the OLS estimator β1 is still unbiased and consistent.But including an irrelevant variable will increase the variance ofestimator, in other words,it will make the estimate less precise.
Zhaopeng Qu ( NJU ) Assessing Regression Studies October 21 2021 19 / 81
Internal validity
Recall: The Variance of β
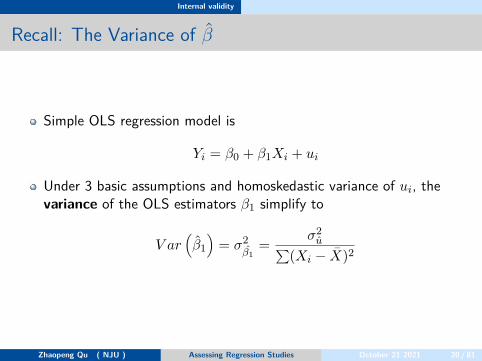
Simple OLS regression model is
Yi = β0 + β1Xi + ui
Under 3 basic assumptions and homoskedastic variance of ui, thevariance of the OLS estimators β1 simplify to
V ar(β1)
= σ2β1
= σ2u∑
(Xi − X)2
Zhaopeng Qu ( NJU ) Assessing Regression Studies October 21 2021 20 / 81
Internal validity
Recall: The Variance of β
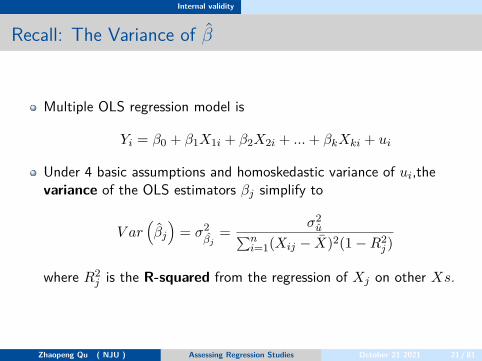
Multiple OLS regression model is
Yi = β0 + β1X1i + β2X2i + ... + βkXki + ui
Under 4 basic assumptions and homoskedastic variance of ui,thevariance of the OLS estimators βj simplify to
V ar(βj
)= σ2
βj= σ2
u∑ni=1(Xij − X)2(1 − R2
j )
where R2j is the R-squared from the regression of Xj on other Xs.
Zhaopeng Qu ( NJU ) Assessing Regression Studies October 21 2021 21 / 81
Internal validity
The Variance of β
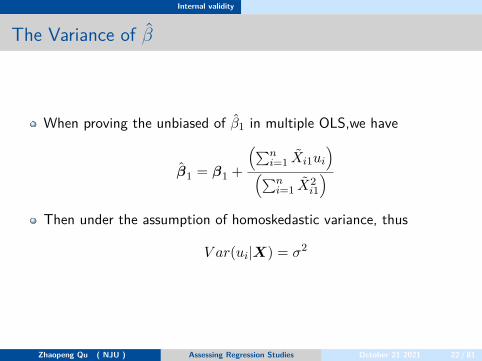
When proving the unbiased of β1 in multiple OLS,we have
β1 = β1 +
(∑ni=1 Xi1ui
)(∑n
i=1 X2i1
)Then under the assumption of homoskedastic variance, thus
V ar(ui|X) = σ2
Zhaopeng Qu ( NJU ) Assessing Regression Studies October 21 2021 22 / 81
Internal validity
The Variance of β
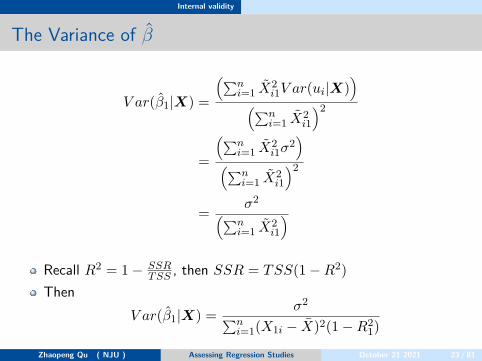
V ar(β1|X) =
(∑ni=1 X2
i1V ar(ui|X))
(∑ni=1 X2
i1
)2
=
(∑ni=1 X2
i1σ2)
(∑ni=1 X2
i1
)2
= σ2(∑ni=1 X2
i1
)Recall R2 = 1 − SSR
T SS , then SSR = TSS(1 − R2)Then
V ar(β1|X) = σ2∑ni=1(X1i − X)2(1 − R2
1)
Zhaopeng Qu ( NJU ) Assessing Regression Studies October 21 2021 23 / 81
Internal validity
Irrelevant Variables
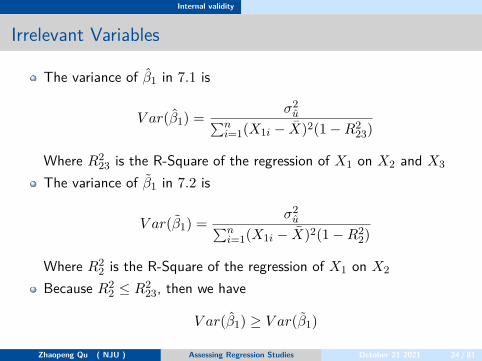
The variance of β1 in 7.1 is
V ar(β1) = σ2u∑n
i=1(X1i − X)2(1 − R223)
Where R223 is the R-Square of the regression of X1 on X2 and X3
The variance of β1 in 7.2 is
V ar(β1) = σ2u∑n
i=1(X1i − X)2(1 − R22)
Where R22 is the R-Square of the regression of X1 on X2
Because R22 ≤ R2
23, then we have
V ar(β1) ≥ V ar(β1)
Zhaopeng Qu ( NJU ) Assessing Regression Studies October 21 2021 24 / 81
Internal validity
Bad Controls v.s Omitted Variable Bias
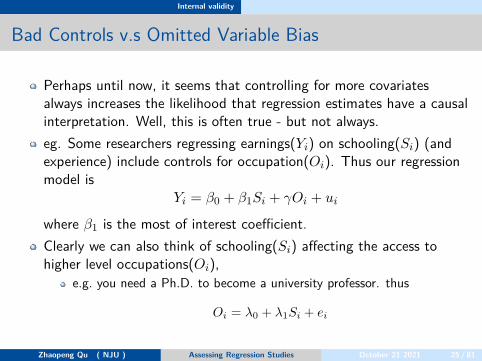
Perhaps until now, it seems that controlling for more covariatesalways increases the likelihood that regression estimates have a causalinterpretation. Well, this is often true - but not always.eg. Some researchers regressing earnings(Yi) on schooling(Si) (andexperience) include controls for occupation(Oi). Thus our regressionmodel is
Yi = β0 + β1Si + γOi + ui
where β1 is the most of interest coefficient.Clearly we can also think of schooling(Si) affecting the access tohigher level occupations(Oi),
e.g. you need a Ph.D. to become a university professor. thus
Oi = λ0 + λ1Si + ei
Zhaopeng Qu ( NJU ) Assessing Regression Studies October 21 2021 25 / 81
Internal validity
Bad Controls v.s Omitted Variable Bias
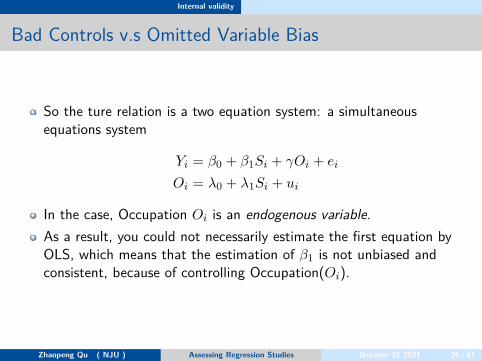
So the ture relation is a two equation system: a simultaneousequations system
Yi = β0 + β1Si + γOi + ei
Oi = λ0 + λ1Si + ui
In the case, Occupation Oi is an endogenous variable.As a result, you could not necessarily estimate the first equation byOLS, which means that the estimation of β1 is not unbiased andconsistent, because of controlling Occupation(Oi).
Zhaopeng Qu ( NJU ) Assessing Regression Studies October 21 2021 26 / 81
Internal validity
Bad Controls v.s Omitted Variable Bias
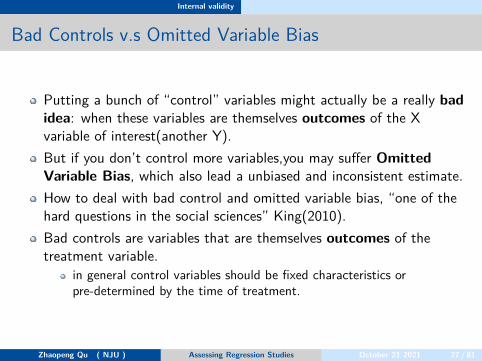
Putting a bunch of “control” variables might actually be a really badidea: when these variables are themselves outcomes of the Xvariable of interest(another Y).But if you don’t control more variables,you may suffer OmittedVariable Bias, which also lead a unbiased and inconsistent estimate.How to deal with bad control and omitted variable bias, “one of thehard questions in the social sciences” King(2010).Bad controls are variables that are themselves outcomes of thetreatment variable.
in general control variables should be fixed characteristics orpre-determined by the time of treatment.
Zhaopeng Qu ( NJU ) Assessing Regression Studies October 21 2021 27 / 81
Internal validity
How to select control variables
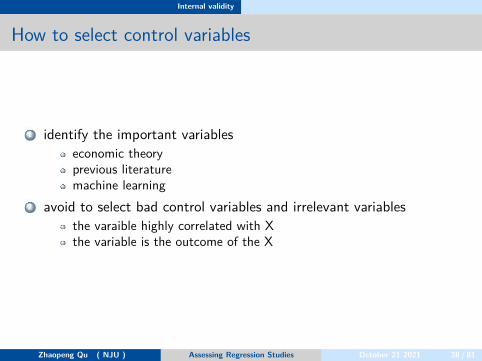
1 identify the important variableseconomic theoryprevious literaturemachine learning
2 avoid to select bad control variables and irrelevant variablesthe varaible highly correlated with Xthe variable is the outcome of the X
Zhaopeng Qu ( NJU ) Assessing Regression Studies October 21 2021 28 / 81
Internal validity
How Should I Include More Variables in My Regression?
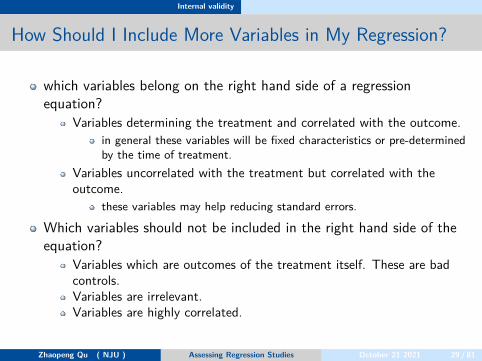
which variables belong on the right hand side of a regressionequation?
Variables determining the treatment and correlated with the outcome.in general these variables will be fixed characteristics or pre-determinedby the time of treatment.
Variables uncorrelated with the treatment but correlated with theoutcome.
these variables may help reducing standard errors.
Which variables should not be included in the right hand side of theequation?
Variables which are outcomes of the treatment itself. These are badcontrols.Variables are irrelevant.Variables are highly correlated.
Zhaopeng Qu ( NJU ) Assessing Regression Studies October 21 2021 29 / 81
Internal validity
Guidelines for controlling variables
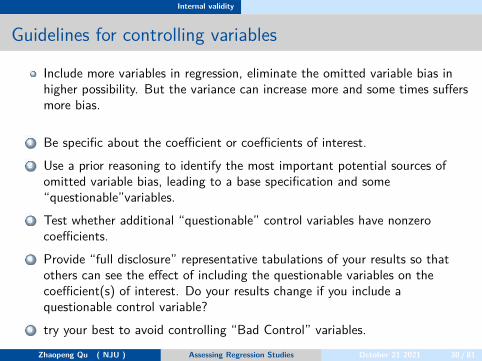
Include more variables in regression, eliminate the omitted variable bias inhigher possibility. But the variance can increase more and some times suffersmore bias.
1 Be specific about the coefficient or coefficients of interest.2 Use a prior reasoning to identify the most important potential sources of
omitted variable bias, leading to a base specification and some“questionable”variables.
3 Test whether additional “questionable” control variables have nonzerocoefficients.
4 Provide “full disclosure” representative tabulations of your results so thatothers can see the effect of including the questionable variables on thecoefficient(s) of interest. Do your results change if you include aquestionable control variable?
5 try your best to avoid controlling “Bad Control” variables.Zhaopeng Qu ( NJU ) Assessing Regression Studies October 21 2021 30 / 81
Internal validity
Solutions to OBV when adequate control variables are notavailable.
use randomized controlled experiment(RCT) methoduse data in which the same observational unit is observed at differentpoints in time(Panel Data).use instrumental variables regression(IV) and other quasi-experimentalmethods
Zhaopeng Qu ( NJU ) Assessing Regression Studies October 21 2021 31 / 81
Internal validity
Functional form misspecification
Functional form misspecification makes the OLS estimator biased andinconsistent.It can be seen as an special case of OVB,in which the omittedvariables are the terms that reflect the missing nonlinear aspects ofthe regression function.It often can be detected by plotting the data and the estimatedregression function, and it can be corrected by using a differentfunctional form.
Zhaopeng Qu ( NJU ) Assessing Regression Studies October 21 2021 32 / 81
Internal validity
Measurement error
When a variable is measured imprecisely,then it might make OLSestimator biased.This bias persists even in very large samples, so the OLS estimator isinconsistent if there is measurement error.for example: recall last year’s earnings
Zhaopeng Qu ( NJU ) Assessing Regression Studies October 21 2021 33 / 81

Internal validity
Measurement error
There are different types of measurement error
1 Measurement error in the dependent variable YLess problematic than measurement error in XUsually not a violation of internal validityBut leads to less precise estimates
2 Measurement error in the independent variable X(errors-in-variablesbias)
Classical measurement errorMeasurement error correlated with XBoth types of measurement error in X are a violation of internal validity
Zhaopeng Qu ( NJU ) Assessing Regression Studies October 21 2021 34 / 81
Internal validity
Measurement error in the dependent variable Y
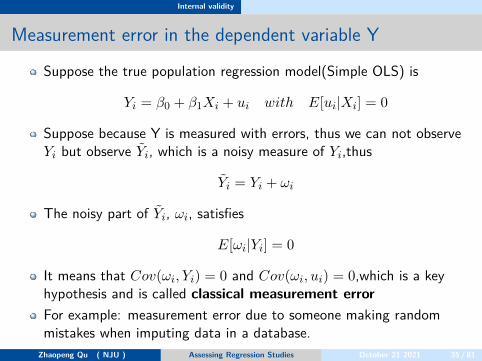
Suppose the true population regression model(Simple OLS) is
Yi = β0 + β1Xi + ui with E[ui|Xi] = 0
Suppose because Y is measured with errors, thus we can not observeYi but observe Yi, which is a noisy measure of Yi,thus
Yi = Yi + ωi
The noisy part of Yi, ωi, satisfies
E[ωi|Yi] = 0
It means that Cov(ωi, Yi) = 0 and Cov(ωi, ui) = 0,which is a keyhypothesis and is called classical measurement errorFor example: measurement error due to someone making randommistakes when imputing data in a database.
Zhaopeng Qu ( NJU ) Assessing Regression Studies October 21 2021 35 / 81
Internal validity
Measurement error in the dependent variable Y
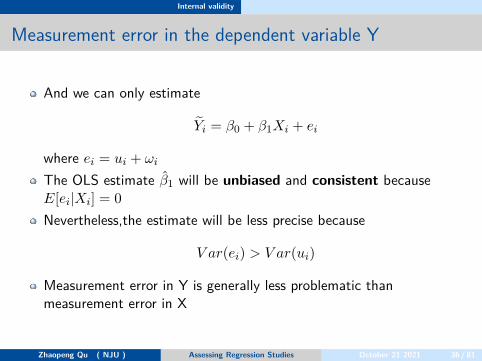
And we can only estimate
Yi = β0 + β1Xi + ei
where ei = ui + ωi
The OLS estimate β1 will be unbiased and consistent becauseE[ei|Xi] = 0Nevertheless,the estimate will be less precise because
V ar(ei) > V ar(ui)
Measurement error in Y is generally less problematic thanmeasurement error in X
Zhaopeng Qu ( NJU ) Assessing Regression Studies October 21 2021 36 / 81
Internal validity
Measurement error in X: classical measurement error
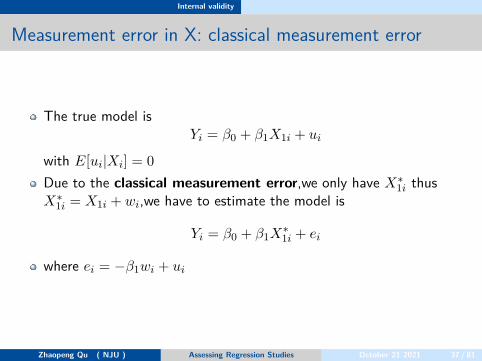
The true model isYi = β0 + β1X1i + ui
with E[ui|Xi] = 0Due to the classical measurement error,we only have X∗
1i thusX∗
1i = X1i + wi,we have to estimate the model is
Yi = β0 + β1X∗1i + ei
where ei = −β1wi + ui
Zhaopeng Qu ( NJU ) Assessing Regression Studies October 21 2021 37 / 81
Internal validity
Measurement error in X: classical measurement error
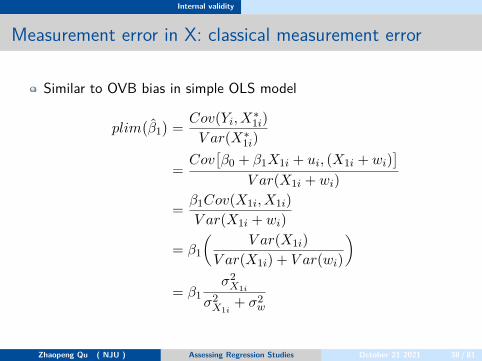
Similar to OVB bias in simple OLS model
plim(β1)
= Cov(Yi, X∗1i)
V ar(X∗1i)
=Cov
[β0 + β1X1i + ui, (X1i + wi)
]V ar(X1i + wi)
= β1Cov(X1i, X1i)V ar(X1i + wi)
= β1
(V ar(X1i)
V ar(X1i) + V ar(wi)
)= β1
σ2X1i
σ2X1i
+ σ2w
Zhaopeng Qu ( NJU ) Assessing Regression Studies October 21 2021 38 / 81
Internal validity
Measurement error in X: classical measurement error
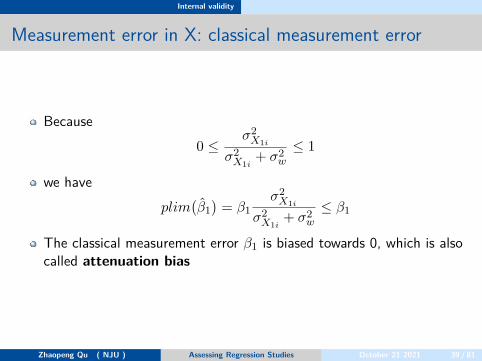
Because0 ≤
σ2X1i
σ2X1i
+ σ2w
≤ 1
we haveplim
(β1)
= β1σ2
X1i
σ2X1i
+ σ2w
≤ β1
The classical measurement error β1 is biased towards 0, which is alsocalled attenuation bias
Zhaopeng Qu ( NJU ) Assessing Regression Studies October 21 2021 39 / 81
Internal validity
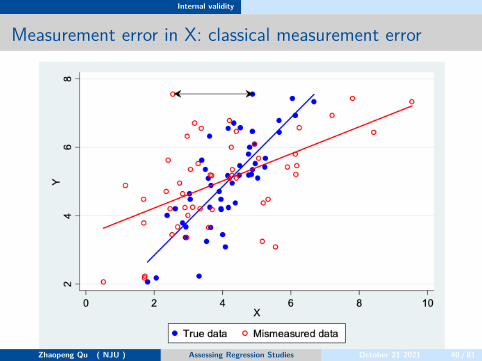
Measurement error in X: classical measurement error
Zhaopeng Qu ( NJU ) Assessing Regression Studies October 21 2021 40 / 81
Internal validity
Solutions to errors-in-variables bias
The best way to solve the errors-in-variables problem is to get anaccurate measure of X.(Say nothing useful)instrumental variables regression
It relies on having another variable (the “instrumental” variable) that iscorrelated with the actual value Xi but is uncorrelated with themeasurement error. We will discuss it later on.
Zhaopeng Qu ( NJU ) Assessing Regression Studies October 21 2021 41 / 81
Internal validity
Simultaneous Causality
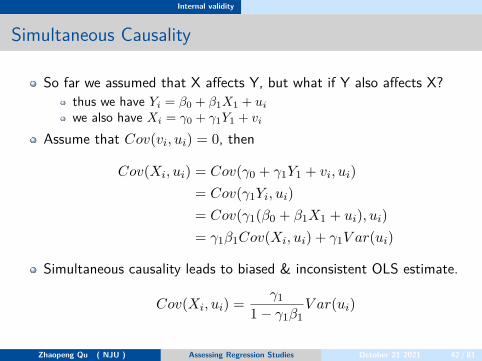
So far we assumed that X affects Y, but what if Y also affects X?thus we have Yi = β0 + β1X1 + ui
we also have Xi = γ0 + γ1Y1 + vi
Assume that Cov(vi, ui) = 0, then
Cov(Xi, ui) = Cov(γ0 + γ1Y1 + vi, ui)= Cov(γ1Yi, ui)= Cov(γ1(β0 + β1X1 + ui), ui)= γ1β1Cov(Xi, ui) + γ1V ar(ui)
Simultaneous causality leads to biased & inconsistent OLS estimate.
Cov(Xi, ui) = γ11 − γ1β1
V ar(ui)
Zhaopeng Qu ( NJU ) Assessing Regression Studies October 21 2021 42 / 81
Internal validity
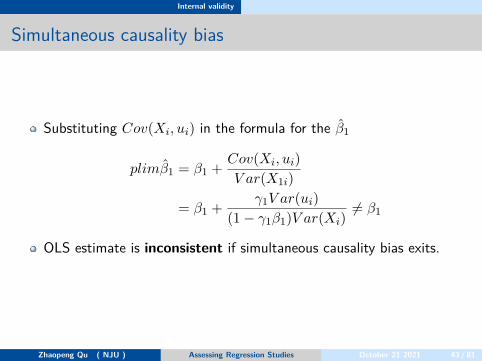
Simultaneous causality bias
Substituting Cov(Xi, ui) in the formula for the β1
plimβ1 = β1 + Cov(Xi, ui)V ar(X1i)
= β1 + γ1V ar(ui)(1 − γ1β1)V ar(Xi)
= β1
OLS estimate is inconsistent if simultaneous causality bias exits.
Zhaopeng Qu ( NJU ) Assessing Regression Studies October 21 2021 43 / 81
Internal validity
Solutions to simultaneous causality bias
instrumental variables regressionand other experimental designs
Zhaopeng Qu ( NJU ) Assessing Regression Studies October 21 2021 44 / 81
Internal validity
Missing Data and Sample Selection
Missing data are a common feature of economic data sets. Whethermissing data pose a threat to internal validity depends on why thedata are missing.We consider 3 types of missing data
1 Data are missing at random: this will not impose a threat to internalvalidity.the effect is to reduce the sample size but not introduce bias.
2 Data are missing based on X: This will not impose a threat to internalvalidity.suppose that we used only the districts in which the student–teacherratio exceeds 20. Although we are not able to draw conclusions aboutwhat happens when STR ≤ 20, this would not introduce bias into ouranalysis of the class size effect for districts with STR ≥ 20
Zhaopeng Qu ( NJU ) Assessing Regression Studies October 21 2021 45 / 81
Internal validity
Missing Data and Sample Selection
3 Data are missing because of a selection process that is related to thevalue of the dependent variable (Y),then this selection process canintroduce correlation between the error term and the regressors:Sample Selection Bias
Eg.the sample selection method (randomly selecting phone numbers ofautomobile owners) was related to the dependent variable (who theindividual supported for president in 1936), because in 1936 car ownerswith phones were more likely to be Republicans.
Solutions to sample selection bias: Heckman Selection Model(orHeckit Model)
Zhaopeng Qu ( NJU ) Assessing Regression Studies October 21 2021 46 / 81
Internal validity
Introduction to Sample Selection Bias
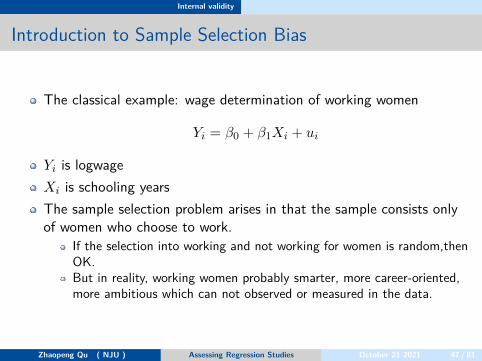
The classical example: wage determination of working women
Yi = β0 + β1Xi + ui
Yi is logwageXi is schooling yearsThe sample selection problem arises in that the sample consists onlyof women who choose to work.
If the selection into working and not working for women is random,thenOK.But in reality, working women probably smarter, more career-oriented,more ambitious which can not observed or measured in the data.
Zhaopeng Qu ( NJU ) Assessing Regression Studies October 21 2021 47 / 81
Internal validity
Wage determination of working women
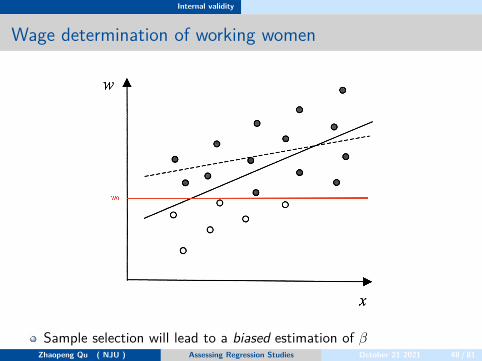
Sample selection will lead to a biased estimation of βZhaopeng Qu ( NJU ) Assessing Regression Studies October 21 2021 48 / 81
Internal validity
Intro to Heckman Sample Selection Model
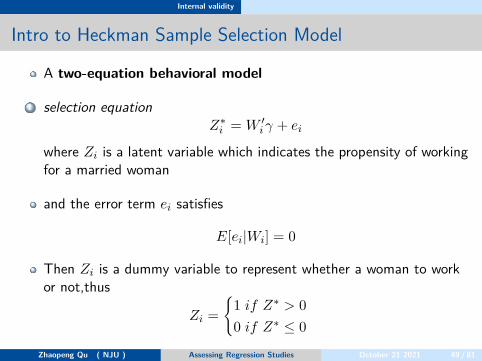
A two-equation behavioral model
1 selection equationZ∗
i = W ′i γ + ei
where Zi is a latent variable which indicates the propensity of workingfor a married woman
and the error term ei satisfies
E[ei|Wi] = 0
Then Zi is a dummy variable to represent whether a woman to workor not,thus
Zi ={
1 if Z∗ > 00 if Z∗ ≤ 0
Zhaopeng Qu ( NJU ) Assessing Regression Studies October 21 2021 49 / 81
Internal validity
Heckman Sample Selection Model
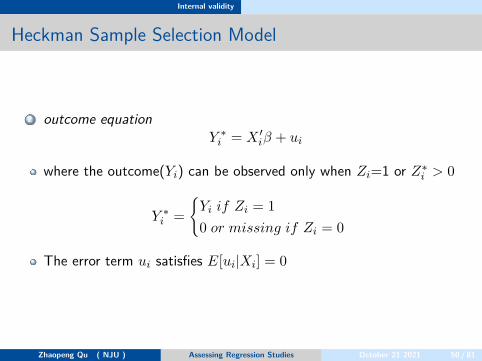
2 outcome equationY ∗
i = X ′iβ + ui
where the outcome(Yi) can be observed only when Zi=1 or Z∗i > 0
Y ∗i =
{Yi if Zi = 10 or missing if Zi = 0
The error term ui satisfies E[ui|Xi] = 0
Zhaopeng Qu ( NJU ) Assessing Regression Studies October 21 2021 50 / 81
Internal validity
Heckman Sample Selection Model
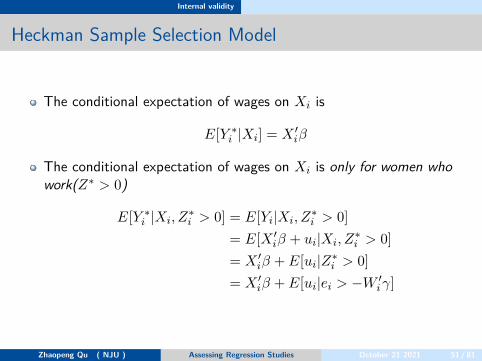
The conditional expectation of wages on Xi is
E[Y ∗i |Xi] = X ′
iβ
The conditional expectation of wages on Xi is only for women whowork(Z∗ > 0)
E[Y ∗i |Xi, Z∗
i > 0] = E[Yi|Xi, Z∗i > 0]
= E[X ′iβ + ui|Xi, Z∗
i > 0]= X ′
iβ + E[ui|Z∗i > 0]
= X ′iβ + E[ui|ei > −W ′
i γ]
Zhaopeng Qu ( NJU ) Assessing Regression Studies October 21 2021 51 / 81
Internal validity
Heckman Sample Selection Model
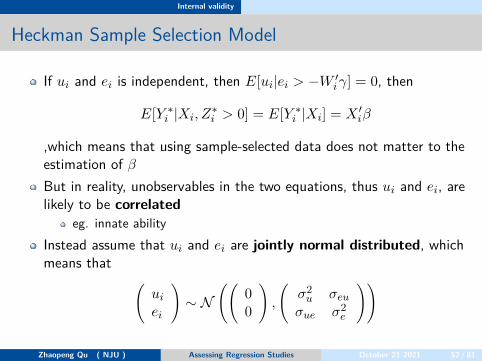
If ui and ei is independent, then E[ui|ei > −W ′i γ] = 0, then
E[Y ∗i |Xi, Z∗
i > 0] = E[Y ∗i |Xi] = X ′
iβ
,which means that using sample-selected data does not matter to theestimation of β
But in reality, unobservables in the two equations, thus ui and ei, arelikely to be correlated
eg. innate abilityInstead assume that ui and ei are jointly normal distributed, whichmeans that (
ui
ei
)∼ N
((00
),
(σ2
u σeu
σue σ2e
))
Zhaopeng Qu ( NJU ) Assessing Regression Studies October 21 2021 52 / 81
Internal validity
Math Review: Two Normal Distributed R.V.s
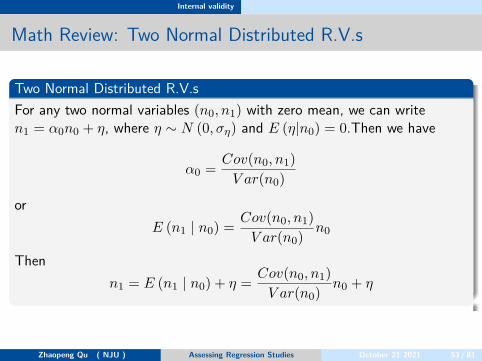
Two Normal Distributed R.V.sFor any two normal variables (n0, n1) with zero mean, we can writen1 = α0n0 + η, where η ∼ N (0, ση) and E (η|n0) = 0.Then we have
α0 = Cov(n0, n1)V ar(n0)
orE (n1 | n0) = Cov(n0, n1)
V ar(n0)n0
Thenn1 = E (n1 | n0) + η = Cov(n0, n1)
V ar(n0)n0 + η
Zhaopeng Qu ( NJU ) Assessing Regression Studies October 21 2021 53 / 81
Internal validity
Heckman Sample Selection Model
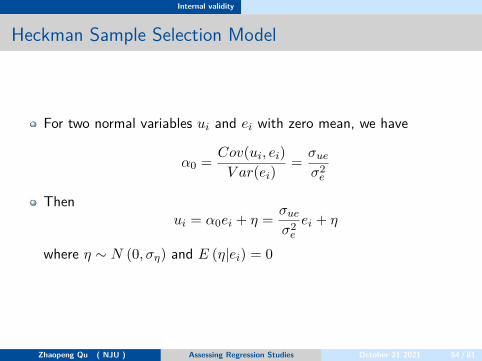
For two normal variables ui and ei with zero mean, we have
α0 = Cov(ui, ei)V ar(ei)
= σue
σ2e
Thenui = α0ei + η = σue
σ2e
ei + η
where η ∼ N (0, ση) and E (η|ei) = 0
Zhaopeng Qu ( NJU ) Assessing Regression Studies October 21 2021 54 / 81
Internal validity
Heckman Sample Selection Model
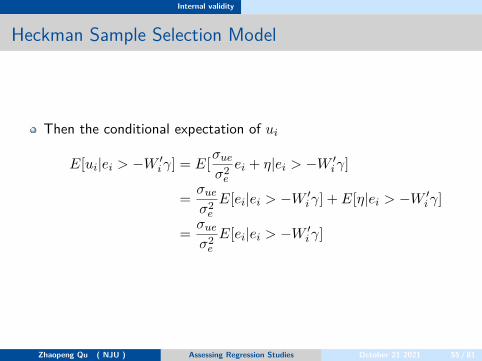
Then the conditional expectation of ui
E[ui|ei > −W ′i γ] = E[σue
σ2e
ei + η|ei > −W ′i γ]
= σue
σ2e
E[ei|ei > −W ′i γ] + E[η|ei > −W ′
i γ]
= σue
σ2e
E[ei|ei > −W ′i γ]
Zhaopeng Qu ( NJU ) Assessing Regression Studies October 21 2021 55 / 81
Internal validity
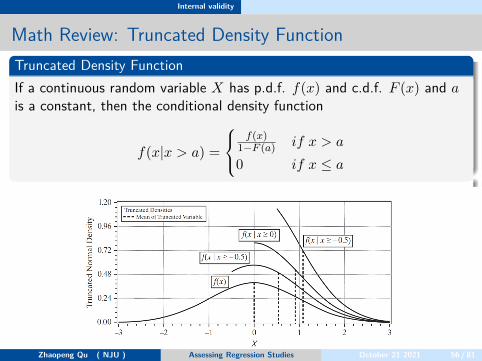
Math Review: Truncated Density FunctionTruncated Density FunctionIf a continuous random variable X has p.d.f. f(x) and c.d.f. F (x) and ais a constant, then the conditional density function
f(x|x > a) =
f(x)
1−F (a) if x > a
0 if x ≤ a
Zhaopeng Qu ( NJU ) Assessing Regression Studies October 21 2021 56 / 81
Internal validity
Truncated Density FunctionThe proof follows from the definition of a conditional probability is
Pr(A|B) = Pr(AB)Pr(B)
then,F (x|X > c) = Pr(X < x, X > c)
Pr(X > c)= Pr(c < X < x)
1 − F (c)
= F (x) − F (c)1 − F (c)
then,
f(x|x > c) = d
dxF (x|X > c) =
ddx [F (x)] − 0
1 − F (c)= f(x)
1 − F (c)
It amounts merely to scaling the density so that it integrates to oneover the range above a.
Zhaopeng Qu ( NJU ) Assessing Regression Studies October 21 2021 57 / 81
Internal validity
Standard Normal Truncated Density FunctionIf X is distributed as standard normal, thus X ∼ N (0, 1), then thep.d.f and c.d.f are as follow
ϕ(x) = 1√2π
e− x22
Φ(x) = 1√2π
∫ x
−∞e− t2
2 dt
And c is a scalar, then we can get the Truncated Density Function ofan R.V. distributed in Standard Normal
f (x | x > c) =ϕ (x)
1 − Φ (c)The Expectation of in a standard normal truncated p.d.f
E(x|x > c) =f(c)
1 − Φ (c)≡ λ (c)
where λ (c) is called by Inverse Mills Ratio.Zhaopeng Qu ( NJU ) Assessing Regression Studies October 21 2021 58 / 81
Internal validity
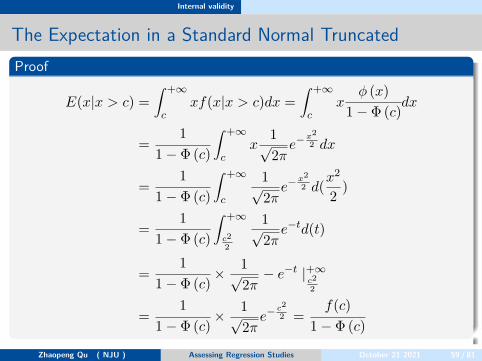
The Expectation in a Standard Normal TruncatedProof
E(x|x > c) =∫ +∞
cxf(x|x > c)dx =
∫ +∞
cx
ϕ (x)1 − Φ (c)
dx
=1
1 − Φ (c)
∫ +∞
cx
1√2π
e− x22 dx
=1
1 − Φ (c)
∫ +∞
c
1√2π
e− x22 d(x2
2)
=1
1 − Φ (c)
∫ +∞
c22
1√2π
e−td(t)
=1
1 − Φ (c)× 1√
2π− e−t |+∞
c22
=1
1 − Φ (c)× 1√
2πe− c2
2 =f(c)
1 − Φ (c)
Zhaopeng Qu ( NJU ) Assessing Regression Studies October 21 2021 59 / 81
Internal validity
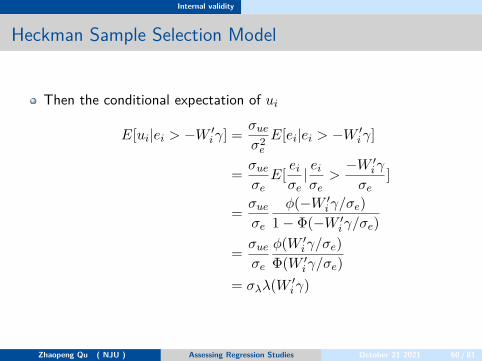
Heckman Sample Selection Model
Then the conditional expectation of ui
E[ui|ei > −W ′i γ] = σue
σ2e
E[ei|ei > −W ′i γ]
= σue
σeE[ ei
σe| ei
σe>
−W ′i γ
σe]
= σue
σe
ϕ(−W ′i γ/σe)
1 − Φ(−W ′i γ/σe)
= σue
σe
ϕ(W ′i γ/σe)
Φ(W ′i γ/σe)
= σλλ(W ′i γ)
Zhaopeng Qu ( NJU ) Assessing Regression Studies October 21 2021 60 / 81
Internal validity
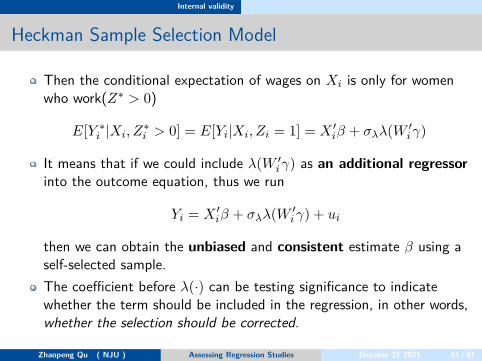
Heckman Sample Selection Model
Then the conditional expectation of wages on Xi is only for womenwho work(Z∗ > 0)
E[Y ∗i |Xi, Z∗
i > 0] = E[Yi|Xi, Zi = 1] = X ′iβ + σλλ(W ′
i γ)
It means that if we could include λ(W ′i γ) as an additional regressor
into the outcome equation, thus we run
Yi = X ′iβ + σλλ(W ′
i γ) + ui
then we can obtain the unbiased and consistent estimate β using aself-selected sample.The coefficient before λ(·) can be testing significance to indicatewhether the term should be included in the regression, in other words,whether the selection should be corrected.
Zhaopeng Qu ( NJU ) Assessing Regression Studies October 21 2021 61 / 81
Internal validity
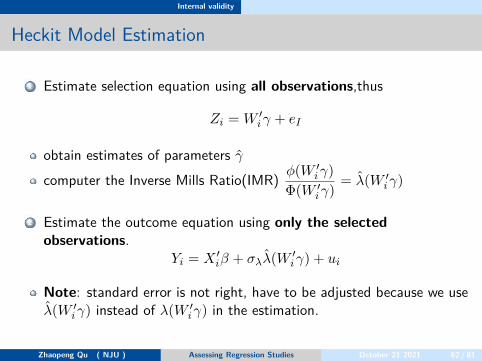
Heckit Model Estimation
1 Estimate selection equation using all observations,thus
Zi = W ′i γ + eI
obtain estimates of parameters γ
computer the Inverse Mills Ratio(IMR) ϕ(W ′i γ)
Φ(W ′i γ)
= λ(W ′i γ)
2 Estimate the outcome equation using only the selectedobservations.
Yi = X ′iβ + σλλ(W ′
i γ) + ui
Note: standard error is not right, have to be adjusted because we useλ(W ′
i γ) instead of λ(W ′i γ) in the estimation.
Zhaopeng Qu ( NJU ) Assessing Regression Studies October 21 2021 62 / 81
Internal validity
Sources of Inconsistency of OLS Standard Errors
A different threat to internal validity. Even if the OLS estimator isconsistent and the sample is large, inconsistent standard errors will letyou make a bad judgment about the effect of the interest.There are two main reasons for inconsistent standard errors:
1 Heteroskedasticity: The solution to this problem is to useheteroskedasticity-robust standard errors and to construct F-statisticsusing a heteroskedasticity-robust variance estimator.
Zhaopeng Qu ( NJU ) Assessing Regression Studies October 21 2021 63 / 81
Internal validity
Sources of Inconsistency of OLS Standard Errors
2 Correlation of the error term across observations.This will not happen if the data are obtained by sampling at randomfrom the population.(i.i.d)Sometimes, however, sampling is only partially random.
When the data are repeated observations on the same entity over timeAnother situation in which the error term can be correlated acrossobservations is when sampling is based on a geographical unit.(cluster)
Both situation means that the assumptions
E(ui, uj) = 0
,the second key assumption in OLS is partially violated.the OLS estimator is unbiased and consistent, but inconsistentstandard errors is not right.
Zhaopeng Qu ( NJU ) Assessing Regression Studies October 21 2021 64 / 81
Internal validity
Clustering Standard Error
Suppose we focus on the topic of class size and student performance,but now the data are collecting on students rather than schooldistrict.Our regression model is
TestScoreig = β0 + β1ClassSizeg + uig
TestScoreig is the dependent variable for student i in class g, with Ggroups.ClassSizeg the independent variable, varies only at the grouplevel.Intuitively,the test score of students in the same class tend to becorrelated. Thus
E[uig, ujg] = ρσ2u
Zhaopeng Qu ( NJU ) Assessing Regression Studies October 21 2021 65 / 81
Internal validity
Clustering Standard Error
Stata: use option vce(cluster clustvar). Where clustvar is avariable that identifies the groups in which on observables are allowedto correlate.R: the vcovHC() function from plm package
Zhaopeng Qu ( NJU ) Assessing Regression Studies October 21 2021 66 / 81
Internal validity
Wrap Up
There are five primary threats to the internal validity of a multipleregression study:
1 Omitted variables2 Functional form misspecification3 Errors in variables (measurement error in the regressors)4 Sample selection5 Simultaneous causality
Zhaopeng Qu ( NJU ) Assessing Regression Studies October 21 2021 67 / 81
Internal validity
Wrap Up
Each of these, if present, results in failure of the first least squaresassumption,which in turn means that the OLS estimator is biased andinconsistent.Incorrect calculation of the standard errors also poses a threat tointernal validity.Applying this list of threats to a multiple regression study provides asystematic way to assess the internal validity of that study.
Zhaopeng Qu ( NJU ) Assessing Regression Studies October 21 2021 68 / 81
External validity
External validity
Zhaopeng Qu ( NJU ) Assessing Regression Studies October 21 2021 69 / 81
External validity
Definition
Suppose we estimate a regression model that is internally valid.Can the statistical inferences be generalized from the population andsetting studied to other populations and settings?
Zhaopeng Qu ( NJU ) Assessing Regression Studies October 21 2021 70 / 81
External validity
Threats to external validity
1 Differences in populationsThe population from which the sample is drawn might differ from thepopulation of interestFor example, if you estimate the returns to education for men, theseresults might not be informative if you want to know the returns toeducation for women.
2 Differences in settingsThe setting studied might differ from the setting of interest due todifferences in laws, institutional environment and physical environment.For example, the estimated returns to education using data from theU.S might not be informative for China.Because the educational system is different and different institutions ofthe labor market.
Zhaopeng Qu ( NJU ) Assessing Regression Studies October 21 2021 71 / 81
External validity
Application to the case of class size and test score
This analysis was based on test results for California school districts.Suppose for the moment that these results are internally valid. Towhat other populations and settings of interest could this finding begeneralized?
generalize to colleges: it is implausiblegeneralize to other U.S. elementary school districts: it is plausible
Zhaopeng Qu ( NJU ) Assessing Regression Studies October 21 2021 72 / 81
External validity
Wrap up
It is not easy to make your studies valid internally.Even harder when you consider generalize your findings.Then common way to generalize the findings actually is to repeat tomake the studies internal valid.Then we make a generalizing conclusions based on a bunch of internalvalid studies.
Zhaopeng Qu ( NJU ) Assessing Regression Studies October 21 2021 73 / 81
Example: Test Scores and Class Size
Example: Test Scores and Class Size
Zhaopeng Qu ( NJU ) Assessing Regression Studies October 21 2021 74 / 81
Example: Test Scores and Class Size
External Validity
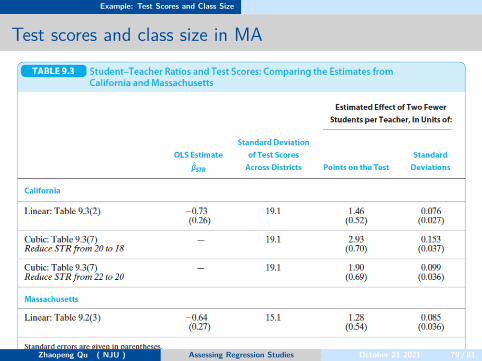
Whether the California analysis can be generalized—that is, whetherit is externally valid—depends on the population and setting to whichthe generalization is made.we consider whether the results can be generalized to otherelementary public school districts in the United States.
more specifically, 220 public school districts in Massachusetts in 1998.if we find similar results in the California and Massachusetts, it wouldbe evidence of external validity of the findings in California.Conversely, finding different results in the two states would raisequestions about the internal or external validity of at least one of thestudies.
Zhaopeng Qu ( NJU ) Assessing Regression Studies October 21 2021 75 / 81
Example: Test Scores and Class Size
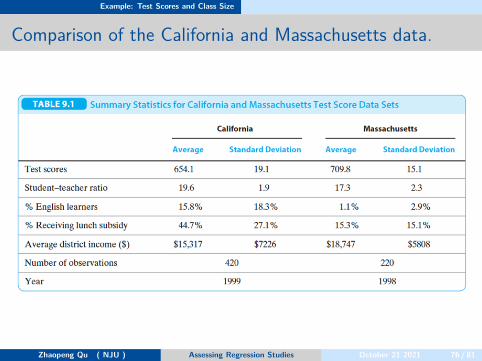
Comparison of the California and Massachusetts data.
Zhaopeng Qu ( NJU ) Assessing Regression Studies October 21 2021 76 / 81
Example: Test Scores and Class Size
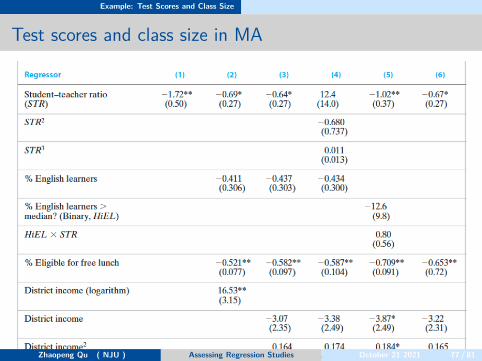
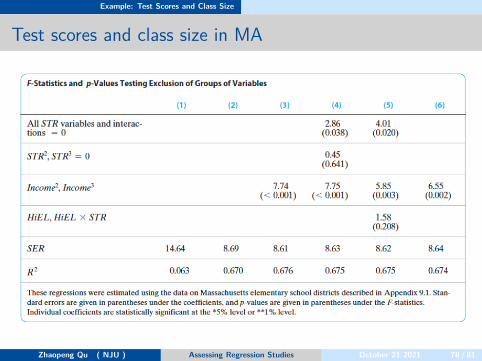
Test scores and class size in MA
Zhaopeng Qu ( NJU ) Assessing Regression Studies October 21 2021 77 / 81
Example: Test Scores and Class Size
Test scores and class size in MA
Zhaopeng Qu ( NJU ) Assessing Regression Studies October 21 2021 78 / 81
Example: Test Scores and Class Size
Test scores and class size in MA
Zhaopeng Qu ( NJU ) Assessing Regression Studies October 21 2021 79 / 81
Example: Test Scores and Class Size
Internal Validity
The similarity of the results for California and Massachusetts does notensure their internal validity.Omitted variables: teacher quality or a low student– teacher ratiomight have families that are more committed to enhancing theirchildren’s learning at home.Functional form: Although further functional form analysis could becarried out, this suggests that the main findings of these studies areunlikely to be sensitive to using different nonlinear regressionspecificationsErrors in variables: The average student–teacher ratio in the districtis a broad and potentially inaccurate measure of class size.because students’ mobility, the STR might not accurately representthe actual class sizes, which in turn could lead to the estimated classsize effect being biased toward zero.
Zhaopeng Qu ( NJU ) Assessing Regression Studies October 21 2021 80 / 81
Example: Test Scores and Class Size
Internal Validity
Selection: data cover all the public elementary school districts in thestate that satisfy minimum size restrictions, so there is no reason tobelieve that sample selection is a problem here.Simultaneous causality: it would arise if the performance on testsaffected the student–teacher ratio.Heteroskedasticity and correlation of the error term acrossobservations
so heteroskedasticity does not threaten internal validity.Correlation of the error term across observations, however, couldthreaten the consistency of the standard errors because simple randomsampling was not used.
Zhaopeng Qu ( NJU ) Assessing Regression Studies October 21 2021 81 / 81