Input Section (Material Properties) - Polymer … · MSE 554 MathCAD Project Input Section...
15
MSE 554 MathCAD Project Input Section (Material Properties) Epoxy Carbon-Fiber Youngs Modulus 1-direction Em1 3.2 10 9 Pa Ef1 400 10 9 Pa Youngs Modulus 2-direction Em2 4.0 10 9 Pa Ef2 300 10 9 Pa Shear Modulus G12 Gm 1.5 10 9 Pa Gf 30 10 9 Pa Poissons Ratio, υ12 ν12m 0.35 ν12f 0.25 Coefficient of Thermal Expansion 1-direction αm1 6.5 10 5 1 Δ°C αf1 5.0 10 6 1 Δ°C Coefficient of Thermal Expansion 2-direction αm2 1.0 10 5 1 Δ°C αf2 5.0 10 6 1 Δ°C Vm 0.40 Vf 0.60 Volume Fraction Input Section (Material Properties) Ply Properties E1 Ef1 Vf Em1 Vm 241.28 GPa Halpin-Tsai for E2 ξ 2 χ Ef2 Em2 Ef2 ξ Em2 E2 Em2 1 ξχ Vf ( ) 1 χ Vf 20.344 GPa ξ 1 χ Gf Gm Gf ξ Gm G12 Gm 1 ξχ Vf ( ) 1 χ Vf 5.062 GPa ν12 ν12f Vf ν12m Vm 0.29 ν21 ν12 E2 E1 0.024 Ply Properties
Transcript of Input Section (Material Properties) - Polymer … · MSE 554 MathCAD Project Input Section...

MSE 554 MathCAD Project
Input Section (Material Properties)
Epoxy Carbon-Fiber
Youngs Modulus 1-direction Em1 3.2 109Pa Ef1 400 10
9Pa
Youngs Modulus 2-direction Em2 4.0 109Pa Ef2 300 10
9Pa
Shear Modulus G12 Gm 1.5 109Pa Gf 30 10
9Pa
Poissons Ratio, υ12 ν12m 0.35 ν12f 0.25
Coefficient of Thermal Expansion 1-direction αm1 6.5 105
1
Δ°C αf1 5.0 10
6
1
Δ°C
Coefficient of Thermal Expansion 2-direction αm2 1.0 105
1
Δ°C αf2 5.0 10
6
1
Δ°C
Vm 0.40 Vf 0.60Volume Fraction
Input Section (Material Properties)
Ply Properties
E1 Ef1 Vf Em1 Vm 241.28 GPa
Halpin-Tsai for E2
ξ 2
χEf2 Em2
Ef2 ξ Em2 E2
Em2 1 ξ χ Vf( )
1 χ Vf20.344 GPa
ξ 1
χGf Gm
Gf ξ Gm G12
Gm 1 ξ χ Vf( )
1 χ Vf5.062 GPa
ν12 ν12f Vf ν12m Vm 0.29
ν21 ν12E2
E1 0.024
Ply Properties

Q and Qbar properties
Q11E1
1 ν12 ν21( ) Q12
ν12 E2
1 ν12 ν21
Q22E2
1 ν12 ν21( ) Q66 G12
Q
Q11
Q12
0
Q12
Q22
0
0
0
Q66
243.003
5.942
0
5.942
20.489
0
0
0
5.062
GPa Q Matrix
M θ( ) cos θ( ) n θ( ) sin θ( )
Θ θ( )
M θ( )2
n θ( )2
M θ( ) n θ( )
n θ( )2
M θ( )2
M θ( ) n θ( )( )
2 M θ( ) n θ( )
2 M θ( ) n θ( )
M θ( )2
n θ( )2
Ψ θ( )
M θ( )2
n θ( )2
2 M θ( ) n θ( )
n θ( )2
M θ( )2
2 M θ( ) n θ( )( )
M θ( ) n θ( )
M θ( ) n θ( )
M θ( )2
n θ( )2
Qbar Matrices Qbar θ( ) Θ θ( ) Q Ψ θ( )
1
Qbar 0deg( )
243.003
5.942
0
5.942
20.489
0
0
0
5.062
GPa Qbar 60 deg( )
32.738
49.321
23.13
49.321
143.995
73.221
23.13
73.221
48.442
GPa
Qbar 20deg( )
193.076
29.84
64.238
29.84
22.62
7.277
64.238
7.277
28.96
GPa Qbar 20 deg( )
193.076
29.84
64.238
29.84
22.62
7.277
64.238
7.277
28.96
GPa
Qbar 45deg( )
73.906
63.781
55.629
63.781
73.906
55.629
55.629
55.629
62.902
GPa Qbar 90deg( )
20.489
5.942
0
5.942
243.003
0
0
0
5.062
GPa
Qbar 30 deg( )
143.995
49.321
73.221
49.321
32.738
23.13
73.221
23.13
48.442
GPa
Q and Qbar properties

Input Layer Details
z0
1.225 mm z1
0.875 mm z2
0.525 mm z3
0.175 mm z4
0.175mm z5
0.525mm
z6
0.875mm z7
1.225mm
θ1
0deg θ2
20deg θ3
45deg θ4
30 deg θ5
60 deg θ6
20 deg θ7
90deg
i 1 7 j 0 7
z
1.225
0.875
0.525
0.175
0.175
0.525
0.875
1.225
mm θ
0
0
0.349
0.785
0.524
1.047
0.349
1.571
θi
020
45
-30
-60
-20
90
deg
zj
-1.225-0.875
-0.525
-0.175
0.175
0.525
0.875
1.225
mm
Input Layer Details

ABD Matrix
A
i
Qbar θi z
izi 1
A
3.151 108
8.19 107
1.425 107
8.19 107
1.958 108
1.425 107
1.425 107
1.425 107
7.974 107
Pa m
B1
2i
Qbar θi z
i 2 zi 1 2
B
8.682 104
1.771 103
4.112 104
1.771 103
9.036 104
1.935 104
4.112 104
1.935 104
1.771 103
N
D1
3i
Qbar θi z
i 3 zi 1 3
D
175.689
20.506
1.248
20.506
120.775
0.9
1.248
0.9
19.428
Pa m3
Row1 augment A1
Pa m B
1
Pa m2
Row2 augment B1
Pa m2
D
1
Pa m3
ABD stack Row1 Row2( ) ABD Matrix
ABD
3.151 108
8.19 107
1.425 107
8.682 104
1.771 103
4.112 104
8.19 107
1.958 108
1.425 107
1.771 103
9.036 104
1.935 104
1.425 107
1.425 107
7.974 107
4.112 104
1.935 104
1.771 103
8.682 104
1.771 103
4.112 104
175.689
20.506
1.248
1.771 103
9.036 104
1.935 104
20.506
120.775
0.9
4.112 104
1.935 104
1.771 103
1.248
0.9
19.428
ABD Matrix

Coefficient of Thermal Expansion
α1αf1 Ef1 Vf αm1 Em1 Vm( )
Ef1 Vf Em1 Vm5.318 10
6
1
Δ°C
α2 αf2 Vf αm2 VmEf1 ν12m Em2 ν12f( )
Ef1 Vf Em2 Vmαm2 αf1( ) Vf Vm 7.7 10
6
1
Δ°C
αx θ( ) M θ( )2
α1 n θ( )2
α2
αy θ( ) n θ( )2
α1 M θ( )2
α2
αxy θ( ) 2 M θ( ) n θ( ) α1 α2( )
αmatrix θ( )
αx θ( )
αy θ( )
αxy θ( )
Coefficient of Thermal Expansion
Input Load
X 10000
Nload
1 X
5 X
2 X
Mload
0
0
0
NM stack Nload Mload( )
1 104
5 104
2 104
0
0
0
ΔT 80 Δ°C

Nt
i
Qbar θi αmatrix θ
i zi
zi 1 ΔT
1.743 105
1.251 105
1.177 104
N
m
Mt1
2i
Qbar θi αmatrix θ
i zi 2 z
i 1 2
ΔT
36.588
36.588
24.976
Nm
m
NMthermal stack Ntm
N Mt
m
N m
1.743 105
1.251 105
1.177 104
36.588
36.588
24.976
NMtotal NM NMthermal
1.643 105
7.505 104
3.177 104
36.588
36.588
24.976
Input Load
Calculate Strains and Curvatures
εκ ABD1
NMtotal
εκ
4.268 104
2.946 105
3.143 104
0.097
0.251
0.364

ε0 submatrix εκ 0 2 0 0( )ε0
4.268 104
2.946 105
3.143 104
MidplaneStrainsκ submatrix εκ 3 5 0 0( )
1
m
εx z( ) ε0 κ z
κ
0.097
0.251
0.364
1
m Midplane
Curvaturesεx 0( )
4.268 104
2.946 105
3.143 104
εyy strains through laminate thicknessεxx strains through laminate thickness
1 103 0 1 10
36 10
4
5 104
4 104
3 104
εx t( )0
t1 10
3 0 1 103
4 104
2 104
0
2 104
4 104
εx t( )1
t
This is εxxThis is εyy
γxy shear strains through laminate thickness
1 103 0 1 10
32 10
4
0
2 104
4 104
6 104
8 104
εx t( )2
t
Calculate Strains and Curvatures

Stresses and Strains in material direction (1,2,3)
Pw t( ) i 0
i j
break
zj 1 t t z
jif
j 1 length z( ) 1for
i
σx t( ) i Pw t( )
Qbar θi εx t( ) αmatrix θ
i ΔT i 0 i length z( )if
0MPa( ) otherwise
σL t( ) i Pw t( )
Θ θi 1
σx t( )
εL t( ) i Pw t( )
Ψ θi 1
εx t( )
t 1.225 mm 1.224 mm 1.225mm
Stresses in each ply in the1-direction
Stresses in each ply in the2-direction
1 0 150
0
50
100
σL t( )0
MPa
t
mm
1 0 15
10
15
20
σL t( )1
MPa
t
mmStresses in each ply in the3-direction
1 0 14
2
0
2
4
σL t( )2
MPa
t
mm

Strains in each ply in the1-direction
Stresses in each ply in the2-direction
1 0 10.06
0.05
0.04
0.03
0.02
0.01
0
εL t( )0
%
t
mm
1 0 10.04
0.02
0
0.02
0.04
εL t( )1
%
t
mmStresses in each ply in the3-direction
1 0 10.1
0.05
0
0.05
0.1
εL t( )2
%
t
mm
Stresses and Strains in material direction (1,2,3)
Warpage Surface Plot for Thermal Loads
εκ ABD1
NMthermal
εκ
4.587 104
4.947 104
3.082 105
0.036
0.06
0.176

κ submatrix εκ 3 5 0 0( )1
m
κ
0.036
0.06
0.176
1
m
ω x y( )1
20.036 x
2 0.06 y
2
0.176
2x y
Warpage Surface Plot for 1m X 1m laminate
ω
Warpage Surface Plot for Thermal Loads
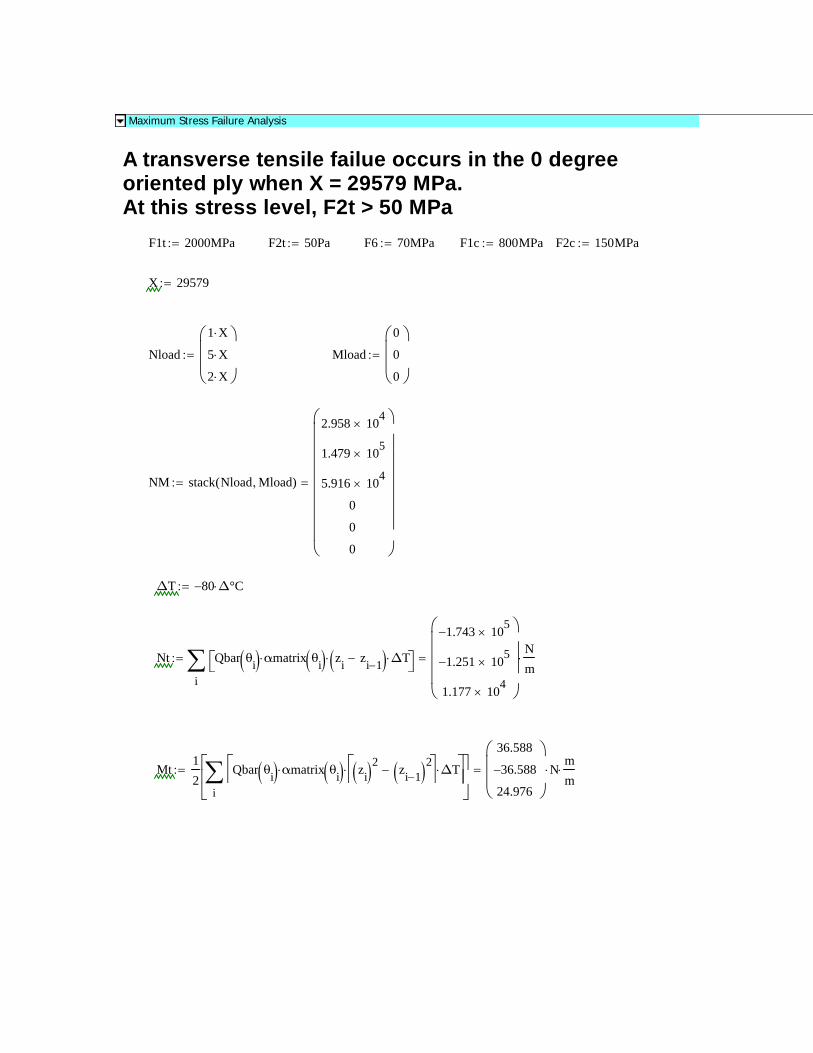
Maximum Stress Failure Analysis
A transverse tensile failue occurs in the 0 degreeoriented ply when X = 29579 MPa. At this stress level, F2t > 50 MPa
F1t 2000MPa F2t 50Pa F6 70MPa F1c 800MPa F2c 150MPa
X 29579
Nload
1 X
5 X
2 X
Mload
0
0
0
NM stack Nload Mload( )
2.958 104
1.479 105
5.916 104
0
0
0
ΔT 80 Δ°C
Nt
i
Qbar θi αmatrix θ
i zi
zi 1 ΔT
1.743 105
1.251 105
1.177 104
N
m
Mt1
2i
Qbar θi αmatrix θ
i zi 2 z
i 1 2
ΔT
36.588
36.588
24.976
Nm
m

NMthermal stack Ntm
N Mt
m
N m
1.743 105
1.251 105
1.177 104
36.588
36.588
24.976
NMtotal NM NMthermal
1.448 105
2.284 104
7.093 104
36.588
36.588
24.976
εκ ABD1
NMtotal
εκ
3.643 104
8.814 104
9.901 104
0.359
0.859
1.42
ε0 submatrix εκ 0 2 0 0( )ε0
3.643 104
8.814 104
9.901 104
κ submatrix εκ 3 5 0 0( )1
m
εx z( ) ε0 κ z
κ
0.359
0.859
1.42
1
m
εx 0( )
3.643 104
8.814 104
9.901 104

Pw t( ) i 0
i j
break
zj 1 t t z
jif
j 1 length z( ) 1for
i
σx t( ) i Pw t( )
Qbar θi εx t( ) αmatrix θ
i ΔT i 0 i length z( )if
0MPa( ) otherwise
σL t( ) i Pw t( )
Θ θi 1
σx t( )
t 1.225 mm 1.224 mm 1.225mm
Stresses in each ply in the 1-direction Stresses in each ply in the 2-direction
1 0 1100
0
100
200
300
σL t( )0
MPa
t
mm
1 0 110
20
30
40
50
60
σL t( )1
MPa
t
mm
Stresses in each ply in the3-direction
1 0 120
10
0
10
σL t( )2
MPa
t
mm
Maximum Stress Failure Analysis