HETEROTRIMERIC G-PROTEIN ALPHA (α) SUBUNIT FROM A...
116
HETEROTRIMERIC G-PROTEIN ALPHA (α) SUBUNIT FROM A. thaliana (AtGPA1) FORMS TRIMERIC STRUCTURES IN SOLUTION by ERSOY ÇOLAK Submitted to the Graduate School of Engineering and Natural Sciences in partial fulfillment of the requirements for the degree of Master of Science Sabancı University Spring 2016
Transcript of HETEROTRIMERIC G-PROTEIN ALPHA (α) SUBUNIT FROM A...
HETEROTRIMERIC G-PROTEIN ALPHA (α) SUBUNIT FROM A. thaliana (AtGPA1)
FORMS TRIMERIC STRUCTURES IN SOLUTION
by
ERSOY ÇOLAK
Submitted to the Graduate School of Engineering and Natural Sciences
in partial fulfillment of
the requirements for the degree of
Master of Science
Sabancı University
Spring 2016
HETEROTRIMERIC G-PROTEIN ALPHA (α) SUBUNIT FROM A. thaliana (AtGPA1)
FORMS TRIMERIC STRUCTURES IN SOLUTION
APPROVED BY:
Prof. Dr. Zehra Sayers
(Dissertation Supervisor)
Prof. Dr. Canan Atılgan
Prof. Dr. Osman Uğur Sezerman
DATE OF APPROVAL: 13.05.2016

© ERSOY ÇOLAK, 2016
All rights reserved.
iv
HETEROTRIMERIC G-PROTEIN ALPHA (α) SUBUNIT FROM A. thaliana (AtGPA1)
FORMS TRIMERIC STRUCTURES IN SOLUTION
Ersoy Çolak
Department of Molecular Biology, Genetics and Bioengineering, Faculty of Natural Sciences and
Engineering, Sabanci University, Orhanli, Tuzla, 34956 Istanbul, Turkey
Keywords: G-proteins, AtGPA1, Alpha Subunit, Small Angle X-ray Scattering (SAXS),
Circular Dichroism Spectropolorimetry (CD), Structural Characterization
ABSTRACT
The heterotrimeric guanine nucleotide-binding proteins (G-proteins) mediate transmission
of signals from G protein coupled receptors (GPCRs) to effector systems including ion
channels, enzymes and intracellular second messengers in yeast, mammals, and plants. The
complex is comprised of alpha (Gα), beta (Gβ) and gamma (Gγ) subunits; Gα has GTP binding
and hydrolysis activity, and Gβ and Gγ interact with downstream effectors as a dimeric
complex. Although the structure and activation mechanism for the mammalian complex are
well known, these are still not fully understood in plants.
In our group subunits of the heterotrimeric complexes from Arabidopsis thaliana and
Oryza sativa (rice) are heterologously expressed in yeast and bacteria respectively. The
recombinant proteins are then purified for biochemical characterization and structural
investigations. Our overall aim is to gain insight into the activation and signaling mechanisms
of the G-protein complex in plants through structural studies on the individual subunits as well
as the in vitro reconstituted complex.
The work in this thesis is undertaken with the primary aim of optimizing the purification
protocol of the A. thaliana G subunit, GPA1, expressed in yeast to obtain sufficient quantities
of homogeneous recombinant protein for biochemical, biophysical, and structural analyses.
v
A A further goal is the recombinant production of a truncated version of the wild-type GPA1,
which lacks the N-terminal 36 amino acids (GPA1t) in E. coli. GPA1t is commonly used in
structural studies due to its stability.
Results show that the optimized purification procedure has improved the yield to 5.5 mg
GPA1 from 0.5 liters P. pastoris culture which represents a fivefold increase compared to earlier
results in the group. Nucleotide (GTP, GDP, GTPγS) binding to the recombinant GPA1 is
confirmed by absorbance spectroscopy and circular dichroism spectropolorimetry (CD). Results
indicate that the secondary structure elements of GPA1 are more stable when it binds GTPγS
as compared to GDP-bound form. Dynamic light scattering (DLS) results and Native-PAGE
analyses combined with small angle X-ray scattering (SAXS) measurements reveal that GPA1
has a tendency to form trimers in solution. SAXS data also shows that GPA1-GDP has a
globular structure with flexible regions extending from the protein. We cloned GPA1t gene in
BL21 cells using the pQE80-L vector and a purification procedure was developed for the
isolation of the recombinant protein. Despite the low protein yield, preliminary biochemical and
biophysical characterizations were carried out on this protein. DLS measurements confirmed
the smaller/more compact size of the GPA1t compared to GPA1. According to the CD analyses
its thermal stability is higher than that of GPA1.
In future studies conditions for the co-existence of the two species (monomer and trimer)
and its physiological significance need to be investigated. Moreover, shape models for both
species need to be developed to understand AtGPA1 interactions with other components in the
heterotrimer.
vi
A. thaliana G-PROTEİNİ ALFA (α) ALTBİRİMİ (AtGPA1) BULUNDUĞU
ORTAMLARDA TRİMERİK YAPILAR OLUŞTURUR
Ersoy Çolak
Moleküler Biyoloji, Genetik ve Biyomühendislik, MSc Programı, 2016
Tez Danışmanı: Prof. Dr. Zehra Sayers
Anahtar Kelimeler: G proteinleri, AtGPA1, Alfa altbirimi, Küçük açı X-ışını Saçılımı
(SAXS), Dairesel Dikroizm Spektroskopi (CD) ve Yapısal Karakterizasyon
ÖZET
Heterotrimerik guanin nükleotit bağlayıcı proteinler (G-proteinleri) maya, memeliler ve
bitkilerde G-protein eşli reseptörler (GPCRs) yardımıyla sinyallerin iyon kanalları, enzimler ve
hücre içi ikincil mesajcılar gibi sistemlere iletilmesine aracılık ederler. Alfa (Gα), beta (Gβ) ve
gama (Gγ) altbirimleri protein kompleksini oluştururlar. Alfa altbirimi (Gα) hem GTP bağlamak
hem de nukleotidin hidrolizinden sorumluyken, beta (Gβ) ve gamma (Gγ) altbirimleri dimerik
bir kompleks olarak efektörlerini etkilerler. Memeli protein kompleksinin yapısı ve aktivasyon
mekanizması iyi bilinmesine rağmen bu süreçler bitkilerde tam anlamı ile anlaşılamamıştır.
Grubumuzda Arabidopsis thaliana ve Oryza sative (Pirinç) heterotrimerik komplekslerinin
altbirimleri sırasıyla maya (Pichia pastoris) ve bakteri (E. coli) hücreleri kullanılarak heterolog
bir şekilde ifade edilmiştir. Rekombinant proteinler daha sonra biyokimyasal karakterizasyon
çalışmaları ve yapısal araştırmalar için saflaştırılmıştır. Bu çalışmaların esas amacı hem in vitro
oluşturulmuş kompleks hem de altbirimler üzerinde yapısal çalışmalarla yaparak bitkilerdeki
G-protein kompleksinin aktivasyonu ve sinyal ileti mekanizması hakkında bilgi elde etmektir.
Bu tez çalışmasında, öncelikli amaç mayadan A. thaliana alfa altbirimi için, GPA1,
saflaştırma protokolünün optimizasyonudur. Böylece biyokimyasal, biyofiziksel ve yapısal
analizler için yeteri miktarda homojen rekombinant protein elde edilmesi hedef alınmıştır. Bir
sonraki adım E.coli’de GPA1 üzerinden N-terminal 36 aminoasit kısaltışmış mutant proteinin
vii
(GPA1t) rekombinant üretimidir. GPA1t gösterdiği stabilite dolayısıyla sık olarak yapısal
çalışmalarda kullanılmaktadır.
Sonuçlar iyileştirilen saflaştırma protokolü ile 0.5 litre P. pastoristen 5.5 mg protein elte
ettiğimizi ve daha önceki kullanılan yönteme göre ürünün 5 kat arttığını göstermektedir.
GPA1’nın nükleotit (GTP, GDP, GTPγS) bağlaması absorbans spektroskopisi ve dairesel
dikroizm spektropolarimetre (CD) ile doğrulanmış bu sonuçlar GPA1’nın ikincil yapısal
elementlerinin GTPγS bağladığında proteinin GDP bağlı formundan daha stabil olduğunu
göstermiştir. Dinamik ışık saçılımı (DLS) sonuçları ve ‘Native-PAGE’ analizleri küçük açı X-
ışını saçılması (SAXS)’ ölçümleri ile bir araya konulduğunda GPA1’nın solüsyon içine trimerik
formlar oluşturmaya yatkın olduğu görülmüştür. SAXS ayrıca GPA1-GDP’nin proteinden
uzayan esnek bölgelerle birlikte küresel bir yapıya sahip olduğunu göstermektedir. Ayrıca
GPA1t geni pQE80-L vektörü kullanarak BL21 hücrelerine klonlanmış ve rekombinant protein
izolasyonu için saflaştırma prosedürü geliştirilmiştir. Düşük miktarda protein elde edilmesine
karşın, ilk biyokimyasal ve biyofiziksel karakterizasyonlar yapılmıştır. DLS ölçümleri GPA1
ile karşılaştırıldığında GPA1t’nin daha küçük/kompakt yapıya sahip olduğunu göstermiştir. CD
analizlerine göre GPA1t’nin termal stabilitesi GPA1’nınkinden daha yüksektir.
Gelecekte yapılacak araştırmaların iki farklı türün (monomer ve trimer) birlikte bulunma
durumları ve bunun fizyolojik öneminin araştırılması üzerine olması anlamlı olacaktır. Ayrıca,
heterotrimer içindeki GPA1’nın diğer bileşenlerle etkileşiminini anlamak için her iki proteinin
modellenmesi önemlidir.

viii
To my family
&
To the memory of my beloved grandmother

ix
ACKNOWLEDGEMENTS
I would like start by expressing how thankful and grateful I am for the effortless support
provided by Prof. Zehra Sayers. Without her, my life would have been a whole different story, and
not in a good way. She trusted me immediately and considered my application even though I had
no belief in myself. Then, she showed me countless times what matters in both science and social
life. At the end, I became a man, a young scientist candidate, who decided to dedicate himself for
the human-being with a greater self-confidence. Most importantly, I am now able to see where my
life is headed to, and I am living a life I could not even dare to dream before. It is all happening
because she has been my mentor not only in science but in life too. The way you live will be my
guide for my entire life. Your discipline and dedication to science, your respect for people in any
circumstances and your endless dynamism are just a few of the things that never stop fascinating
me. Finally, I would like to say that I consider myself to be the luckiest man in Sabanci University
because I had a chance to work under your supervision and I would like to thank you again for all
the opportunities you gave me and for the great conferences both scientific and joyful that we have
had in last two years.
Secondly, there are some other great lecturers in SU who made me wonder what I did right
to deserve all their support. I have had great times with them in last 2 years, I learned a lot, and
even If I cannot tell our stories in short I am extremely happy to know these people are always by
my side: Osman Uğur Sezerman, Canan Atılgan, Melih Papilla, Daniel Lee Calvey, Selim Çetiner,
Batu Erman, Süphan Bakkal, Tolga Sütlü Hocalarım, I appreciate and cherish every moment we
had together.
I am very grateful to Esen Doğan for falling down from the sky in Hamburg and becoming
my dear friend. Your support was priceless. I will miss you, and please come to Denmark soon. I
would like to express my sincere gratitude to my BSc mentor, Prof. Figen Zihnioğlu, from Ege
University. Thank you for teaching me pure biochemistry and most importantly the power of
emotional intelligence. I’ll never understand how you never got angry with me during 5 years of
me making silly mistakes and how you managed to support me tirelessly. I would like to thank all
people whose part of their life passed in Sayers Lab. I learned many valuable things from all, and
in particular from Sandra Quarantini who gave a start to my project. Beautiful people of the weird
x
lab; Ezgi, Nur, Gülfem. Thank you for embracing me like your spoiled son. I will miss the laughter
and chitchats. Adnanım, Ezgim, Özgünüm, Ersin&Irfan Bros, Wissem (Sis.), thank you all for the
unforgettable campus life. Thank you for being able to put up with me. I am deeply thankful for
BioSAXS people in Hamburg. G.F.V and Cy Jeffries thank you for your help for analyzing my
data and being able to obtain important results effecting my life decisions. Of course, I have to
thank Prof. Michel Koch. Even though we only had 2 dinners together, your impact on me was
invaluable and I will never forget that what matters is the “brightness of our minds!”, nothing else.
Last but absolutely not least in the scientific field I cannot thank enough Prof. Ercan Esen
Alp and SycnLight2015 Family. I had my best times with you in Brazil (Paradise). I can easily say
that this Summer School was the beginning of many things, I had a new family after all. Thank
you for being a fantastic scientist, the funniest one that I have ever met and a huge Besiktas fan. I
always have a great joy when reading your blogs.
Beyond these, the people who may not define what an amino acid is… The ones who I
would never let go from my life. They are my dearest friends. I really appreciate all the much-
needed distractions that you provided me, taking me far away from work and science and
brightening my mood whenever I needed it. My Italian crew, my four brothers, Marcito&Vitto
(the best roommates ever), Garu and Luke. We gathered such amazing memories in only 6 months,
that many would not even be able to gather in 6 years. You, my ‘Friends’ twin, UNAGI has never
been so meaningful for two friends. Thank you in advance for the all great fun we will have in the
next 20 years. I cannot promise for more than that because after my sweet revenge in 2035, you
will probably never see me again!
I owe my parents huge gratitude for having the same level of excitement at every single
moment during this journey. Their unconditional love, endless support, and pretending they want
to hear about my project just made everything so simple. I would like to thank my brother for
always making everything harder and keeping me stronger. Dog (He) and cat (I) are finally a whole
after many years. I cannot imagine a life without you guys. Mom & dad never stop checking on
me at least 5-6 times a day, even if I tell you otherwise and I am a grown man. When I say it is
enough, it is a big lie. I will need you until the last moment. Thank you for all the things that you
taught me. I am so blessed for having the best parents in the world.

xi
Finally, to my angel; who could not wait to see me find a cure for a disease, I feel she is
always with me and we will find it together. I miss you grandma, I miss you so much. All this
journey I am having is dedicated to you.
Sabancı University and Turkish Atom Energy Agency are acknowledged for funding my
beamtime in DESY outstation, EMBL, and participation in several conferences. Thank you to the
late Sakıp Sabancı, first being a role-model to all of us and the latter for founding this precious
training house.
It is now time for me to move on to another fantastic adventure and I would thus like to
thank you all one last time for giving me the best moments of my life.
xii
TABLE OF CONTENTS
1. INTRODUCTION................................................................................................................... 1
2. BACKGROUND ..................................................................................................................... 3
2.1. Mammalian Heterotrimeric G-proteins ................................................................................ 3
2.1.1. Signaling in Mammalian G-proteins ............................................................................. 4
2.1.1.1. Core Components of Mammalian G-Signaling: GPCR and RGS .......................... 6
2.1.1.2. Agonist / Activation effects and Antagonist / Inhibitory effects ............................ 8
2.2. Plant Heterotrimeric G-proteins ........................................................................................... 9
2.2.1. Alpha Subunit in A.thaliana ........................................................................................ 10
2.2.1.1. Mystery in self-activating regulation in Alpha Subunit ........................................ 12
2.2.2.2. Structural basis for rapid nucleotide exchange in Alpha Subunit ......................... 13
2.3. G-protein functions in plants .............................................................................................. 15
2.4 Biophysical and Structural Characterization Techniques ................................................... 15
2.4.1 Circular Dichroism Spectropolarimetry (CD) .............................................................. 15
2.4.3. Small Angle X-ray Scattering (SAXS) ........................................................................ 17
2.5. Aim of the Study ................................................................................................................ 18
3. MATERIALS AND METHODS ......................................................................................... 19
3.1. MATERIALS ..................................................................................................................... 19
3.1.2. Chemicals .................................................................................................................... 19
3.1.3. Primers and Vectors ..................................................................................................... 19
3.1.4. Enzymes....................................................................................................................... 20
3.1.5. Commercial Kits .......................................................................................................... 20
3.1.6. Culture Media .............................................................................................................. 21
3.1.6.1. E.coli Systems ....................................................................................................... 21
3.1.6.2. P. Pastoris Systems .............................................................................................. 21
3.1.7. Buffers and Solutions .................................................................................................. 22
3.1.7.1. E.coli Systems ....................................................................................................... 22
3.1.7.2. P. pastoris system ................................................................................................. 23
xiii
3.1.8. Columns ....................................................................................................................... 24
3.1.9. Equipment .................................................................................................................... 24
3.2. METHODS......................................................................................................................... 25
3.2.1. Cloning GPA1t gene using pQE80 vector ................................................................... 25
3.2.1.1. Double digestion using restriction enzymes: KpnI and HindIII ........................... 26
3.2.1.2. Ligation of GPA1t into pQE80-L vector .............................................................. 27
3.2.1.3. Transformation and colony selection .................................................................... 27
3.2.1.4. Plasmid Isolation and Control PCR and Sequence Verification ........................... 28
3.2.2. Gene Expression and Large Scale Culture Growth ..................................................... 28
3.2.3. Purification of Recombinant GPA1t from E.coli ........................................................ 29
3.2.3.1. Batch mode Ni-Affinity Chromatography and Size exclusion chromatography .. 29
3.2.4. Large Scale Expression of GPA1-myc-his in Pichia Pastoris .................................... 31
3.2.5. Purification of Recombinant GPA1 from P. pastoris .................................................. 33
3.2.5.1. Batch Mode Ni-Affinity purification .................................................................... 33
3.2.5.2. Anion Exchange Chromatography and Size Exclusion Chromatography ............ 34
3.2.6. Biophysical and Biochemical Analysis of Purified Protein ........................................ 34
3.2.6.1. Concentration Determination and Analysis of GDP Content ............................... 34
3.2.6.2. Secondary Structure Content Determination and Thermal Denaturation ............. 35
3.2.6.3. Protein Homogeneity Levels and Size Determination .......................................... 36
3.2.6.4. Sample Analysis: SDS-PAGE and Native-PAGE & Western Blotting................ 36
3.2.7. Structural Analysis of Purified Protein: Bio-Small Angle X-ray Scattering (Bio-
SAXS) .................................................................................................................................... 37
4. RESULTS .............................................................................................................................. 40
4.1. Experiments with E.coli system ......................................................................................... 40
4.1.1. Cloning GPA1t + PQE80-L ......................................................................................... 40
4.1.2. Expression of GPA1t in different E.coli strains .......................................................... 42
4.1.3. Large-Scale Expression and Purification of GPA1t .................................................... 43
4.1.4. Dynamic Light Scattering Measurements (DLS) ........................................................ 48
4.1.5. Circular Dichroism Spectropolarimetry Measurements .............................................. 49
4.2. Experiments with P.Pastoris system .................................................................................. 51
4.2.1. Plasmid detection of GPA1 and new stock preparation .............................................. 51
4.2.2. Expression of GPA1 in P. pastoris .............................................................................. 52
xiv
4.2.3. Purification of GPA1 in P. pastoris ............................................................................. 53
4.2.3.1. Nickel-Affinity Purification of GPA1 .................................................................. 53
4.2.3.2. Anion Exchange Chromatography ........................................................................ 54
4.2.3.3. Size Exclusion Chromatography........................................................................... 55
4.2.3.4. Sample Analysis (Western-Native PAGE) ........................................................... 58
4.2.4. Biophysical and Biochemical Characterization of GPA1 ........................................... 60
4.2.4.1. Dynamic Light Scattering Measurements (DLS) ................................................. 60
4.2.4.2. Circular Dichroism Spectropolarimetry Measurements ....................................... 61
4.2.4.3. Functional Nucleotide Binding Assays .................................................................... 63
4.2.3. Structural Characterization of GPA1: Small Angle X-ray Scattering (SAXS) ........... 64
4.2.3.1. Batch Measurements: ............................................................................................ 65
4.2.3.2. In - Line Mode Measurements: Data Collection ................................................... 66
4.2.3.3. Data Reduction...................................................................................................... 68
4.2.3.4. Data Analysis ........................................................................................................ 68
5. DISCUSSION ........................................................................................................................ 71
5.1. GPA1t Cloning, Expression, and purification .................................................................... 71
5.2. GPA1 Purification .............................................................................................................. 73
5.3. Comparative Biochemical and Biophysical Characterization of GPA1 and GPA1t ......... 75
5.4. Structural Characterization of GPA1 with Small Angle X-ray Scattering......................... 77
6. CONCLUSION AND FUTURE WORK ............................................................................ 79
7. REFERENCES ...................................................................................................................... 80
8. APPENDIX A ........................................................................................................................ 88
9. APPENDIX B ........................................................................................................................ 90
10. APPENDIX C ....................................................................................................................... 93
11. APPENDIX D ....................................................................................................................... 95
12. APPENDIX E ....................................................................................................................... 96
xv
LIST OF FIGURES
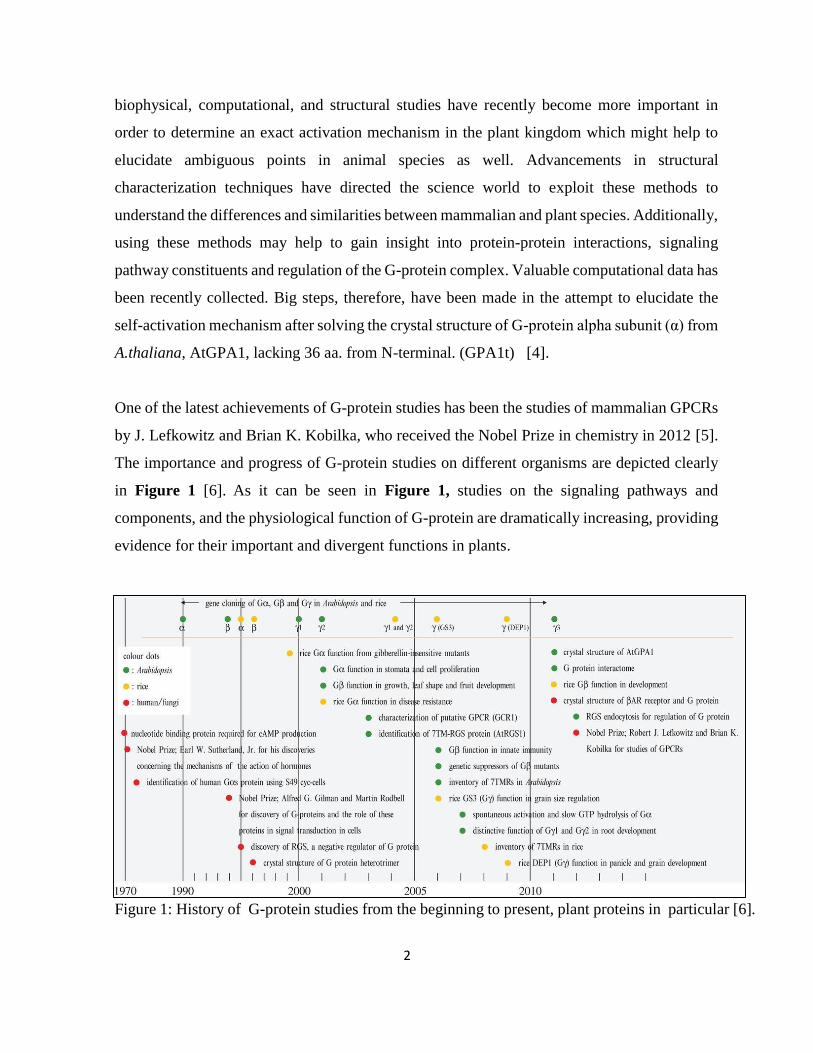
Figure 1: History of G-protein studies from the beginning to present, plant proteins in particular
[6]. .............................................................................................................................................. 2
Figure 2: Schematic classification of G proteins divided into four families based on alpha (α)
subunit. The G alpha (α) subunit is composed of Gαs, Gαi, Gαq/11, and Gα12/13 [7]. .................... 3
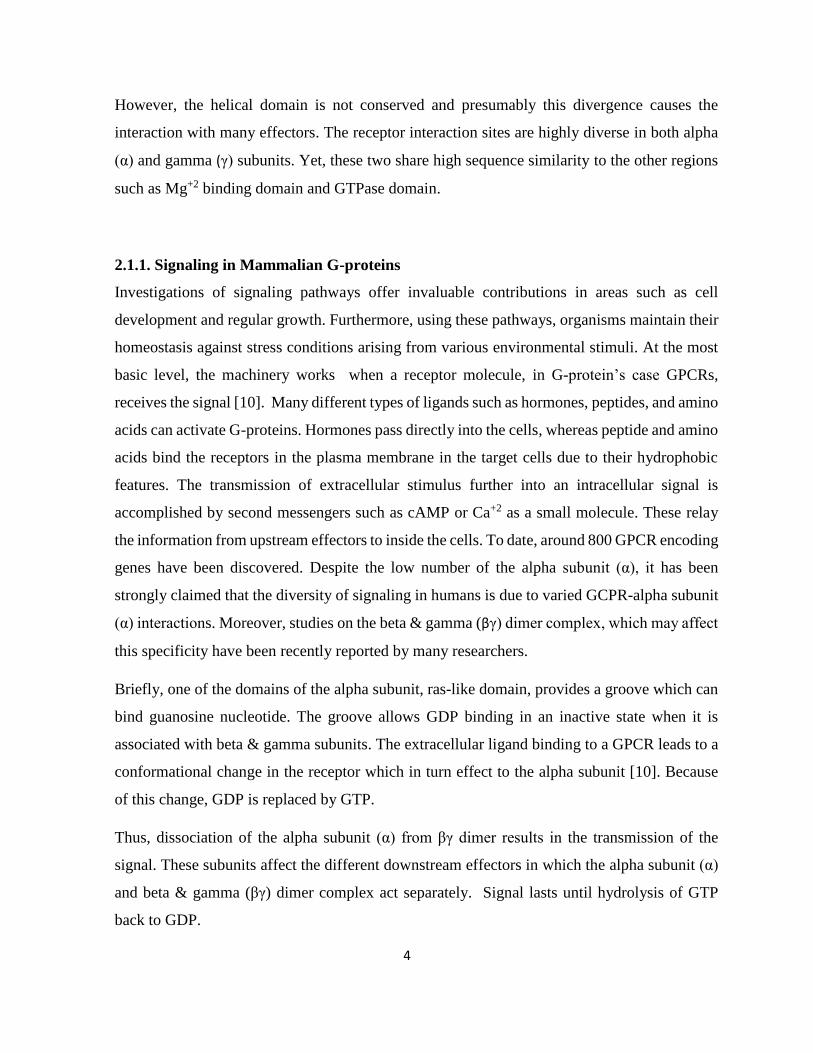
Figure 3: Diversity of GPCRs signaling: Illustration of signal transmission from receiving the
extracellular stimuli to end of the signal in many signaling pathways [11]. .............................. 5
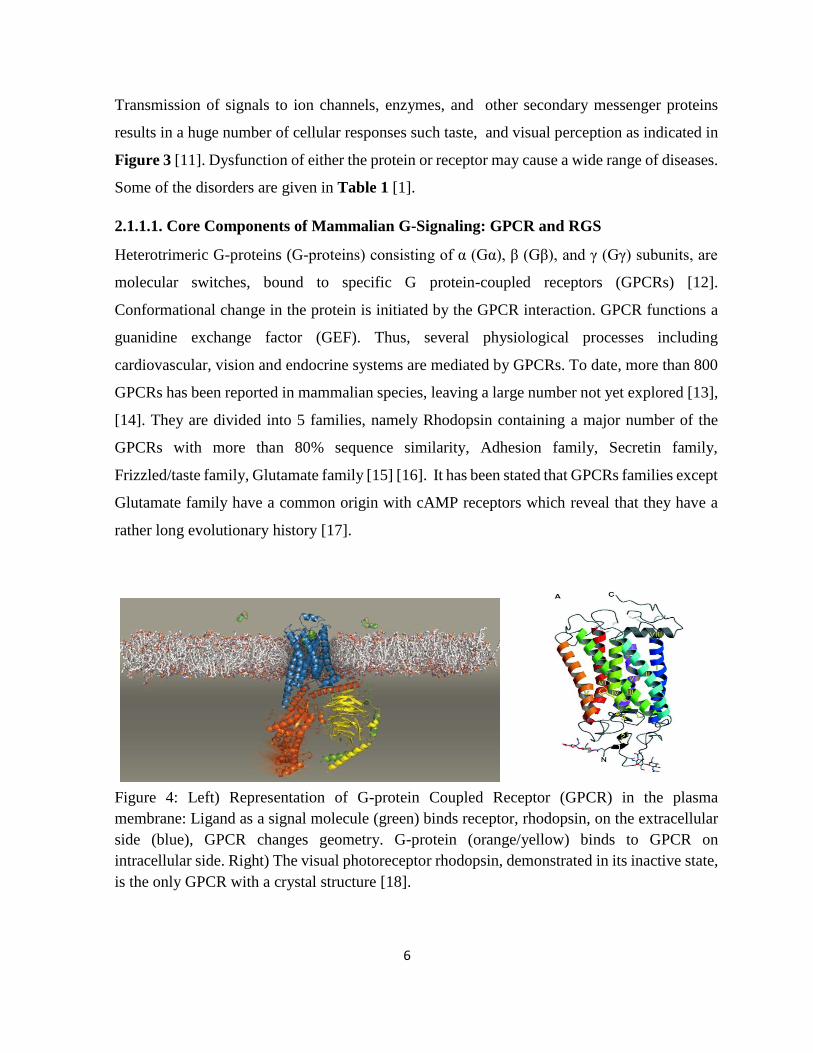
Figure 4: Left) Representation of G-protein Coupled Receptor (GPCR) in the plasma
membrane: [18]. ......................................................................................................................... 6
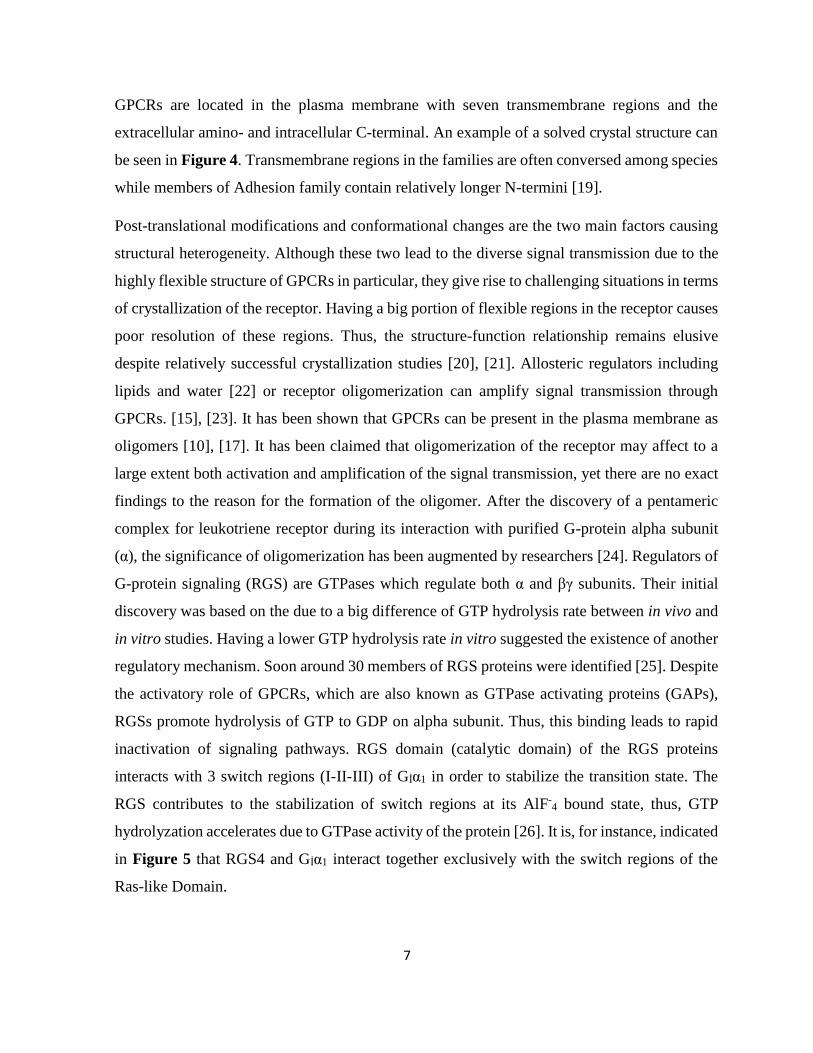
Figure 5: Ribbon representation of the RGS4–Gia1. The ras-like domain of Gia1 is drawn in
dark gray while the alpha helical domain is drawn in light gray. [26]. ..................................... 8
Figure 6: Representation of conformational change on GPCR-G protein complex upon receptor
stimulation by a ligand called an agonist. [33]. ......................................................................... 9
Figure 7: Left) Crystal Structure of G-protein and structural basis of animal G-protein activation
in animals. [4]. ......................................................................................................................... 11
Figure 8: The G protein cycle of animals versus A. thaliana. The proposed mechanism of the
self-activation of Gα in both mammalian and plant systems demonstrating GPCR and RGS
proteins [6]. .............................................................................................................................. 12
Figure 9: Intrinsic properties and regulatory systems of animal and plant G proteins. [45]. ... 13
Figure 10: The Ras domain (red) has similarity to small GTPases. It contains sites for binding
to guanine nucleotides, effectors, and RGS proteins. [45]. ...................................................... 14
Figure 11: Circular Dichroism spectra of "pure" secondary structures. α - helix (solid line), β-
sheet (long dashes), turn (dots) and random coil (short dashes) [59]. ..................................... 16
xvi
Figure 12: Schematic representation of a typical SAS experiment .......................................... 18
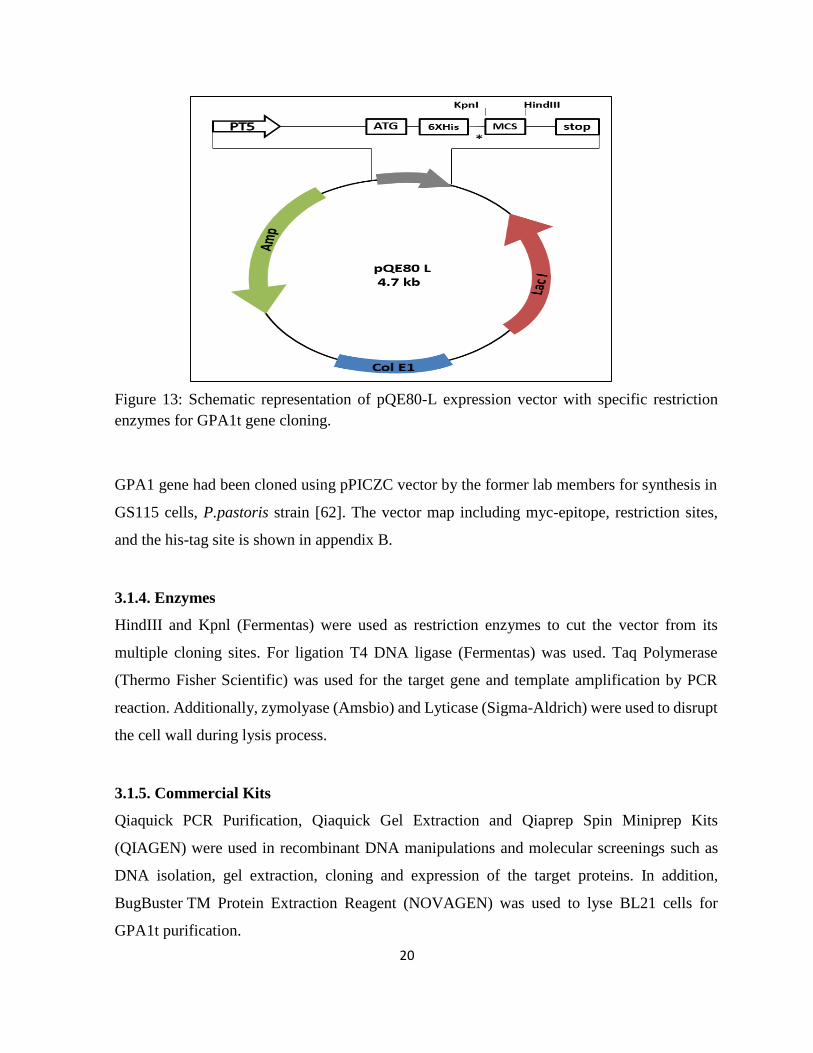
Figure 13: Schematic representation of pQE80-L expression vector with specific restriction
enzymes for GPA1t gene cloning. ........................................................................................... 20
Figure 144: TOP10 E. coli cells were transformed with the ligated plasmid and insert. ......... 41
Figure 15: Control PCR for GPA1t. Different numbers represent selected colonies .............. 41
Figure 16: SDS-PAGE (12%) of the fractions of GPA1t obtained after batch mode nickel
affinity ...................................................................................................................................... 44
Figure 17: A) Elution of GPA1t from a HiLoad 16/600 Superdex 75 pg. SEC chromatogram
indicates 2 main peaks. ............................................................................................................ 46
Figure 18: A) MW: Molecular Marker B) Western blotting of different fractions of GPA1t.. 47
Figure 19: Average intensity distribution of GPA1 for three measurements.. ......................... 48
Figure 20: Circular Dichroism (CD) results for GPA1t with two different nucleotides .......... 49
Figure 21: Thermal stability results for GPA1t with two different nucleotide bindings. ........ 50
Figure 22: Gene verification of Full Length GPA1 gene from Pichia pastoris cells. .............. 52
Figure 23: SDS-PAGE (12%) of the fractions obtained by Batch Mode Nickel affinity of GPA1
protein. ..................................................................................................................................... 53
Figure 24: Left panel: Anion exchange chromatogram indicates that there are 2 main peaks that
peak 2 (P2) contains GPA1. ..................................................................................................... 55
Figure 25: Size Exclusion Chromatography UV absorbance profile from sample 1 (left) and
SDS-PAGE result with collected fractions (right) ................................................................... 56
Figure 26: SEC-UV profile (left) and SDS-PAGE result with selected fractions ................... 57
xvii
Figure 27: Size Exclusion Chromatography UV absorbance profile (left) and SDS-PAGE result
with collected fractions (right). ................................................................................................ 57
Figure 28: western blotting (WB) and native results from left to right: E1 and E2: After Ni-
NTA affinity chromatography from sample 1 ......................................................................... 59
Figure 29: Average intensity distribution of GPA1 for three measurements. The hydrodynamic
radius is found to be around 2.5 nm. ........................................................................................ 60
Figure 30: CD spectra for GPA1 in four different buffer conditions. ...................................... 62
Figure 31: Thermal Denaturation assays for GPA1 ................................................................. 63
Figure 32: Nucleotide binding assays of GPA1 ....................................................................... 63
Figure 33: Left: SEC chromatogram of GPA1 before SAXS measurements. ......................... 64
Figure 34: Analyses from batch mode measurements for AtGPA1 a: Scattering Profile b:
Guinier Plotting analysis c: Pair Distribution Function d: Kratky Plot.................................... 65
Figure 35: Development of the X-Ray scattering profiles of GPA1 as the sample elutes from
SEC: ......................................................................................................................................... 67
Figure 36: Malvern TDA Profile: three different data was collected to estimate the molecular
weight of GPA1 ........................................................................................................................ 67
Figure 37: Scattering curves and Guinier Plots for both monomeric (top) and trimeric (right)
species. ..................................................................................................................................... 68
Figure 38: Pair Distribution Functions for the monomeric and trimeric GPA1 in solution .... 69
Figure 39: Kratky Plot gives the flexibility and random coil likeness of GPA1 sample ......... 69
xviii
LIST OF TABLES
Table 1: The family of mammalian heterotrimeric G- protein subunits show different functions
related to disease potential and regulate by different proteins [1]. ................................................. 5
Table 2: Primers used to insert GPA1t gene into PQE80-L vector. ............................................. 19
Table 3: Preparation of stock solutions used for the media in large scale expression. ................. 22
Table 4: PRC reaction chemicals .................................................................................................. 25
Table 5: PCR conditions used for addition of restriction sites to GPA1t gene with primers into
pQE80L vector. ............................................................................................................................. 25
Table 6:Restriction digestion reaction of GPA1t gene and pQE80L plasmid .............................. 26
Table 7: Ligation reaction mixes for GPA1t and PQE80-L vector .............................................. 27
Table 8: Basic controls for cloning to check the quality of the cells and vector .......................... 42
Table 9:Results of GPA1t DLS measurements. GPA1t has an H(r) of around 2.5 nm with 90.5%
Intensity, suggesting the estimation of the molecular weight of 127 kDa. ................................... 48
Table 10: Predicted secondary structure content of GPA1t .......................................................... 49
Table 11: Numerical responses for GPA1 DLS measurements. ................................................... 61
Table 12: Secondary structure content of GPA1 in different buffer conditions ........................... 62
Table 13: Overall shape information of GPA1 after batch measurements ................................... 66
Table 14: overall shape information for GPA1............................................................................. 70
xix
LIST OF ABBREVIATIONS
ATP: Adenosine triphosphate
BME: β-merchaptoethanol
BMGY: Buffered glycerol-complex medium
BMMY: Buffered methanol-complex medium
BSA: Bovine Serum Albumin
cAMP: Adenylyl cyclase pathway
CD: Circular Dichroism
C-terminus: Carboxyl terminus
DLS: Dynamic Light Scattering
DTT: Dithiothreitol
ECL: Enhanced luminol-based chemiluminescent
EDTA: Ethylenediaminetetraacetic acid
FPLC: Fast Protein Liquid Chromatography
Gα: G-protein alpha subunit
Gβ: G-protein beta subunit
Gγ: G-protein gamma subunit
Gβγ: Protein dimer consisting of Gβ and Gγ subunits
Gα-GDP: Gα bound to GDP, in its inactive state
Gα-GTP: Gα bound to GTP, in its active state
GAP: GTPase Activating Protein
GDI: Guanosine nucleotide dissociation inhibitors
GDP: Guanosine di-phosphate
xx
GEF: Guanosine Nucleotide Exchange Factor
GPA1: Arabidopsis thaliana heterotrimeric G protein α subunit
GPCR: G-Protein Coupled Receptor
GTP: Guanosine triphosphate
GTPase: enzyme converting GTP into GDP
IPTG: Isopropyl β-D-1-thiogalactopyranoside
KAN: Kanamycin
MWCO: Molecular Weight Cut-Off
PCR: Polymerase Chain Reaction
PDB: Protein Data Bank
PMSF: Phenylmethanesulfonyl Fluoride
RGS: Regulator of G proteins
SDS-PAGE: Sodium Dodecyl Sulfate Polyacrylamide Gel Electrophoresis
TAE: Tris-acetate-EDTA
TBS: TRIS Buffered Saline
TBS-T: TRIS Buffered Saline-Tween
YNB: Yeast Nitrogen Base
YPD: Yeast Extract-Peptone-Dextrose
1
1. INTRODUCTION
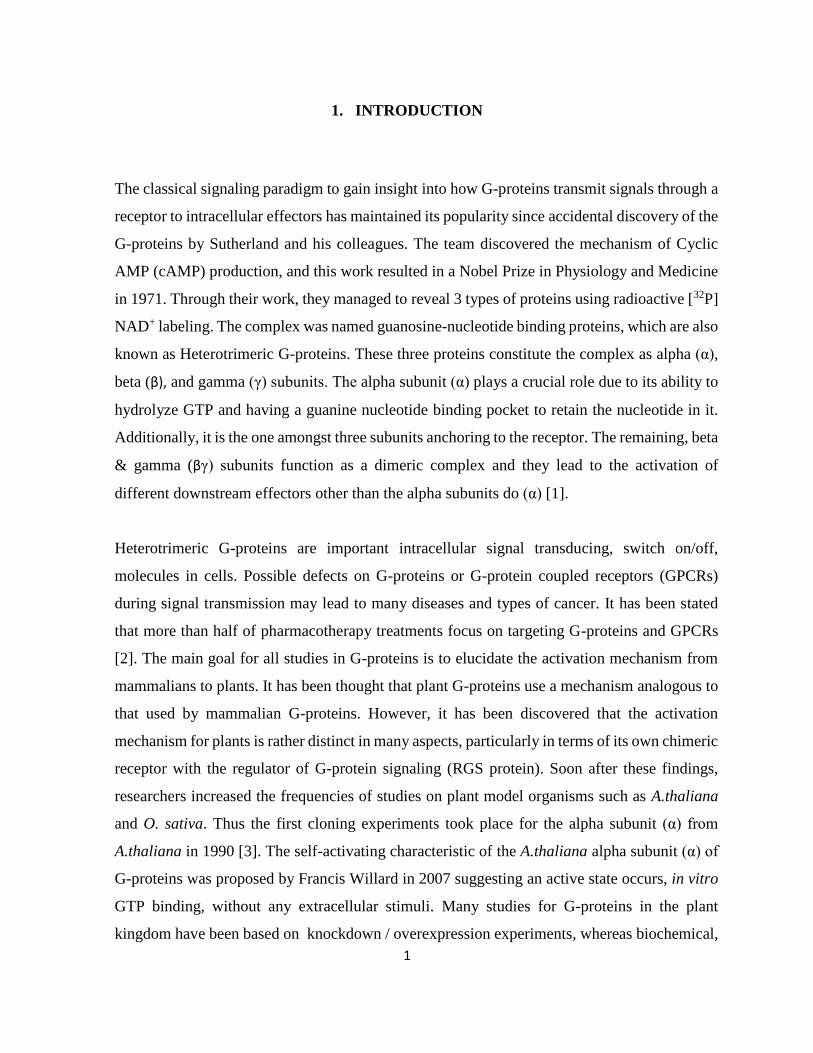
The classical signaling paradigm to gain insight into how G-proteins transmit signals through a
receptor to intracellular effectors has maintained its popularity since accidental discovery of the
G-proteins by Sutherland and his colleagues. The team discovered the mechanism of Cyclic
AMP (cAMP) production, and this work resulted in a Nobel Prize in Physiology and Medicine
in 1971. Through their work, they managed to reveal 3 types of proteins using radioactive [32P]
NAD+ labeling. The complex was named guanosine-nucleotide binding proteins, which are also
known as Heterotrimeric G-proteins. These three proteins constitute the complex as alpha (α),
beta (β), and gamma (γ) subunits. The alpha subunit (α) plays a crucial role due to its ability to
hydrolyze GTP and having a guanine nucleotide binding pocket to retain the nucleotide in it.
Additionally, it is the one amongst three subunits anchoring to the receptor. The remaining, beta
& gamma (βγ) subunits function as a dimeric complex and they lead to the activation of
different downstream effectors other than the alpha subunits do (α) [1].
Heterotrimeric G-proteins are important intracellular signal transducing, switch on/off,
molecules in cells. Possible defects on G-proteins or G-protein coupled receptors (GPCRs)
during signal transmission may lead to many diseases and types of cancer. It has been stated
that more than half of pharmacotherapy treatments focus on targeting G-proteins and GPCRs
[2]. The main goal for all studies in G-proteins is to elucidate the activation mechanism from
mammalians to plants. It has been thought that plant G-proteins use a mechanism analogous to
that used by mammalian G-proteins. However, it has been discovered that the activation
mechanism for plants is rather distinct in many aspects, particularly in terms of its own chimeric
receptor with the regulator of G-protein signaling (RGS protein). Soon after these findings,
researchers increased the frequencies of studies on plant model organisms such as A.thaliana
and O. sativa. Thus the first cloning experiments took place for the alpha subunit (α) from
A.thaliana in 1990 [3]. The self-activating characteristic of the A.thaliana alpha subunit (α) of
G-proteins was proposed by Francis Willard in 2007 suggesting an active state occurs, in vitro
GTP binding, without any extracellular stimuli. Many studies for G-proteins in the plant
kingdom have been based on knockdown / overexpression experiments, whereas biochemical,
2
biophysical, computational, and structural studies have recently become more important in
order to determine an exact activation mechanism in the plant kingdom which might help to
elucidate ambiguous points in animal species as well. Advancements in structural
characterization techniques have directed the science world to exploit these methods to
understand the differences and similarities between mammalian and plant species. Additionally,
using these methods may help to gain insight into protein-protein interactions, signaling
pathway constituents and regulation of the G-protein complex. Valuable computational data has
been recently collected. Big steps, therefore, have been made in the attempt to elucidate the
self-activation mechanism after solving the crystal structure of G-protein alpha subunit (α) from
A.thaliana, AtGPA1, lacking 36 aa. from N-terminal. (GPA1t) [4].
One of the latest achievements of G-protein studies has been the studies of mammalian GPCRs
by J. Lefkowitz and Brian K. Kobilka, who received the Nobel Prize in chemistry in 2012 [5].
The importance and progress of G-protein studies on different organisms are depicted clearly
in Figure 1 [6]. As it can be seen in Figure 1, studies on the signaling pathways and
components, and the physiological function of G-protein are dramatically increasing, providing
evidence for their important and divergent functions in plants.
Figure 1: History of G-protein studies from the beginning to present, plant proteins in particular [6].
3
2. BACKGROUND
2.1. Mammalian Heterotrimeric G-proteins
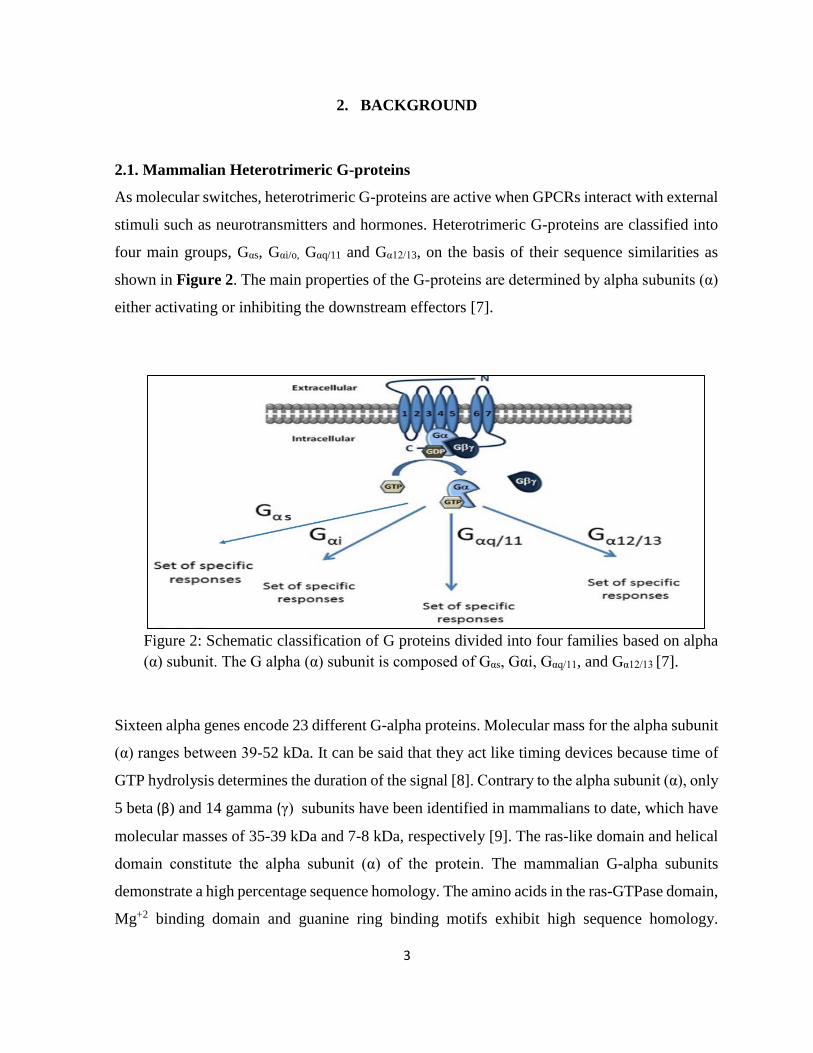
As molecular switches, heterotrimeric G-proteins are active when GPCRs interact with external
stimuli such as neurotransmitters and hormones. Heterotrimeric G-proteins are classified into
four main groups, Gαs, Gαi/o, Gαq/11 and Gα12/13, on the basis of their sequence similarities as
shown in Figure 2. The main properties of the G-proteins are determined by alpha subunits (α)
either activating or inhibiting the downstream effectors [7].
Figure 2: Schematic classification of G proteins divided into four families based on alpha
(α) subunit. The G alpha (α) subunit is composed of Gαs, Gαi, Gαq/11, and Gα12/13 [7].
Sixteen alpha genes encode 23 different G-alpha proteins. Molecular mass for the alpha subunit
(α) ranges between 39-52 kDa. It can be said that they act like timing devices because time of
GTP hydrolysis determines the duration of the signal [8]. Contrary to the alpha subunit (α), only
5 beta (β) and 14 gamma (γ) subunits have been identified in mammalians to date, which have
molecular masses of 35-39 kDa and 7-8 kDa, respectively [9]. The ras-like domain and helical
domain constitute the alpha subunit (α) of the protein. The mammalian G-alpha subunits
demonstrate a high percentage sequence homology. The amino acids in the ras-GTPase domain,
Mg+2 binding domain and guanine ring binding motifs exhibit high sequence homology.
4
However, the helical domain is not conserved and presumably this divergence causes the
interaction with many effectors. The receptor interaction sites are highly diverse in both alpha
(α) and gamma (γ) subunits. Yet, these two share high sequence similarity to the other regions
such as Mg+2 binding domain and GTPase domain.
2.1.1. Signaling in Mammalian G-proteins
Investigations of signaling pathways offer invaluable contributions in areas such as cell
development and regular growth. Furthermore, using these pathways, organisms maintain their
homeostasis against stress conditions arising from various environmental stimuli. At the most
basic level, the machinery works when a receptor molecule, in G-protein’s case GPCRs,
receives the signal [10]. Many different types of ligands such as hormones, peptides, and amino
acids can activate G-proteins. Hormones pass directly into the cells, whereas peptide and amino
acids bind the receptors in the plasma membrane in the target cells due to their hydrophobic
features. The transmission of extracellular stimulus further into an intracellular signal is
accomplished by second messengers such as cAMP or Ca+2 as a small molecule. These relay
the information from upstream effectors to inside the cells. To date, around 800 GPCR encoding
genes have been discovered. Despite the low number of the alpha subunit (α), it has been
strongly claimed that the diversity of signaling in humans is due to varied GCPR-alpha subunit
(α) interactions. Moreover, studies on the beta & gamma (βγ) dimer complex, which may affect
this specificity have been recently reported by many researchers.
Briefly, one of the domains of the alpha subunit, ras-like domain, provides a groove which can
bind guanosine nucleotide. The groove allows GDP binding in an inactive state when it is
associated with beta & gamma subunits. The extracellular ligand binding to a GPCR leads to a
conformational change in the receptor which in turn effect to the alpha subunit [10]. Because
of this change, GDP is replaced by GTP.
Thus, dissociation of the alpha subunit (α) from βγ dimer results in the transmission of the
signal. These subunits affect the different downstream effectors in which the alpha subunit (α)
and beta & gamma (βγ) dimer complex act separately. Signal lasts until hydrolysis of GTP
back to GDP.
5
Figure 3: Diversity of GPCRs signaling: Illustration of signal transmission from receiving the
extracellular stimuli to end of the signal in many signaling pathways [11].
Then the signal stops and G-protein goes back to its basal trimeric form which in turn enables
it to receive the new signal.
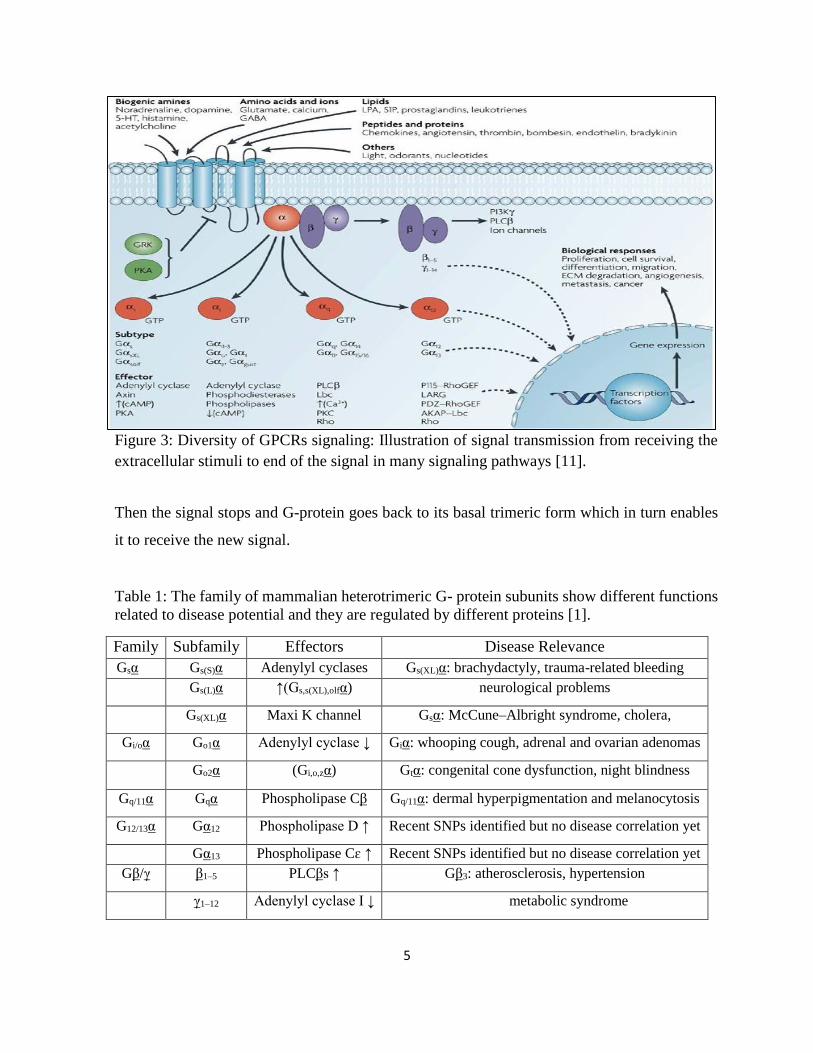
Table 1: The family of mammalian heterotrimeric G- protein subunits show different functions
related to disease potential and they are regulated by different proteins [1].
Family Subfamily Effectors Disease Relevance
Gsα Gs(S)α Adenylyl cyclases Gs(XL)α: brachydactyly, trauma-related bleeding
Gs(L)α ↑(Gs,s(XL),olfα) neurological problems
Gs(XL)α Maxi K channel Gsα: McCune–Albright syndrome, cholera,
Gi/oα Go1α Adenylyl cyclase ↓ Giα: whooping cough, adrenal and ovarian adenomas
Go2α (Gi,o,zα) Gtα: congenital cone dysfunction, night blindness
Gq/11α Gqα Phospholipase Cβ Gq/11α: dermal hyperpigmentation and melanocytosis
G12/13α Gα12 Phospholipase D ↑ Recent SNPs identified but no disease correlation yet
Gα13 Phospholipase Cɛ ↑ Recent SNPs identified but no disease correlation yet
Gβ/γ β1–5 PLCβs ↑ Gβ3: atherosclerosis, hypertension
γ1–12 Adenylyl cyclase I ↓ metabolic syndrome
6
Transmission of signals to ion channels, enzymes, and other secondary messenger proteins
results in a huge number of cellular responses such taste, and visual perception as indicated in
Figure 3 [11]. Dysfunction of either the protein or receptor may cause a wide range of diseases.
Some of the disorders are given in Table 1 [1].
2.1.1.1. Core Components of Mammalian G-Signaling: GPCR and RGS
Heterotrimeric G-proteins (G-proteins) consisting of α (Gα), β (Gβ), and γ (Gγ) subunits, are
molecular switches, bound to specific G protein-coupled receptors (GPCRs) [12].
Conformational change in the protein is initiated by the GPCR interaction. GPCR functions a
guanidine exchange factor (GEF). Thus, several physiological processes including
cardiovascular, vision and endocrine systems are mediated by GPCRs. To date, more than 800
GPCRs has been reported in mammalian species, leaving a large number not yet explored [13],
[14]. They are divided into 5 families, namely Rhodopsin containing a major number of the
GPCRs with more than 80% sequence similarity, Adhesion family, Secretin family,
Frizzled/taste family, Glutamate family [15] [16]. It has been stated that GPCRs families except
Glutamate family have a common origin with cAMP receptors which reveal that they have a
rather long evolutionary history [17].
Figure 4: Left) Representation of G-protein Coupled Receptor (GPCR) in the plasma
membrane: Ligand as a signal molecule (green) binds receptor, rhodopsin, on the extracellular
side (blue), GPCR changes geometry. G-protein (orange/yellow) binds to GPCR on
intracellular side. Right) The visual photoreceptor rhodopsin, demonstrated in its inactive state,
is the only GPCR with a crystal structure [18].
7
GPCRs are located in the plasma membrane with seven transmembrane regions and the
extracellular amino- and intracellular C-terminal. An example of a solved crystal structure can
be seen in Figure 4. Transmembrane regions in the families are often conversed among species
while members of Adhesion family contain relatively longer N-termini [19].
Post-translational modifications and conformational changes are the two main factors causing
structural heterogeneity. Although these two lead to the diverse signal transmission due to the
highly flexible structure of GPCRs in particular, they give rise to challenging situations in terms
of crystallization of the receptor. Having a big portion of flexible regions in the receptor causes
poor resolution of these regions. Thus, the structure-function relationship remains elusive
despite relatively successful crystallization studies [20], [21]. Allosteric regulators including
lipids and water [22] or receptor oligomerization can amplify signal transmission through
GPCRs. [15], [23]. It has been shown that GPCRs can be present in the plasma membrane as
oligomers [10], [17]. It has been claimed that oligomerization of the receptor may affect to a
large extent both activation and amplification of the signal transmission, yet there are no exact
findings to the reason for the formation of the oligomer. After the discovery of a pentameric
complex for leukotriene receptor during its interaction with purified G-protein alpha subunit
(α), the significance of oligomerization has been augmented by researchers [24]. Regulators of
G-protein signaling (RGS) are GTPases which regulate both α and βγ subunits. Their initial
discovery was based on the due to a big difference of GTP hydrolysis rate between in vivo and
in vitro studies. Having a lower GTP hydrolysis rate in vitro suggested the existence of another
regulatory mechanism. Soon around 30 members of RGS proteins were identified [25]. Despite
the activatory role of GPCRs, which are also known as GTPase activating proteins (GAPs),
RGSs promote hydrolysis of GTP to GDP on alpha subunit. Thus, this binding leads to rapid
inactivation of signaling pathways. RGS domain (catalytic domain) of the RGS proteins
interacts with 3 switch regions (I-II-III) of Gİα1 in order to stabilize the transition state. The
RGS contributes to the stabilization of switch regions at its AlF-4 bound state, thus, GTP
hydrolyzation accelerates due to GTPase activity of the protein [26]. It is, for instance, indicated
in Figure 5 that RGS4 and Gİα1 interact together exclusively with the switch regions of the
Ras-like Domain.
8
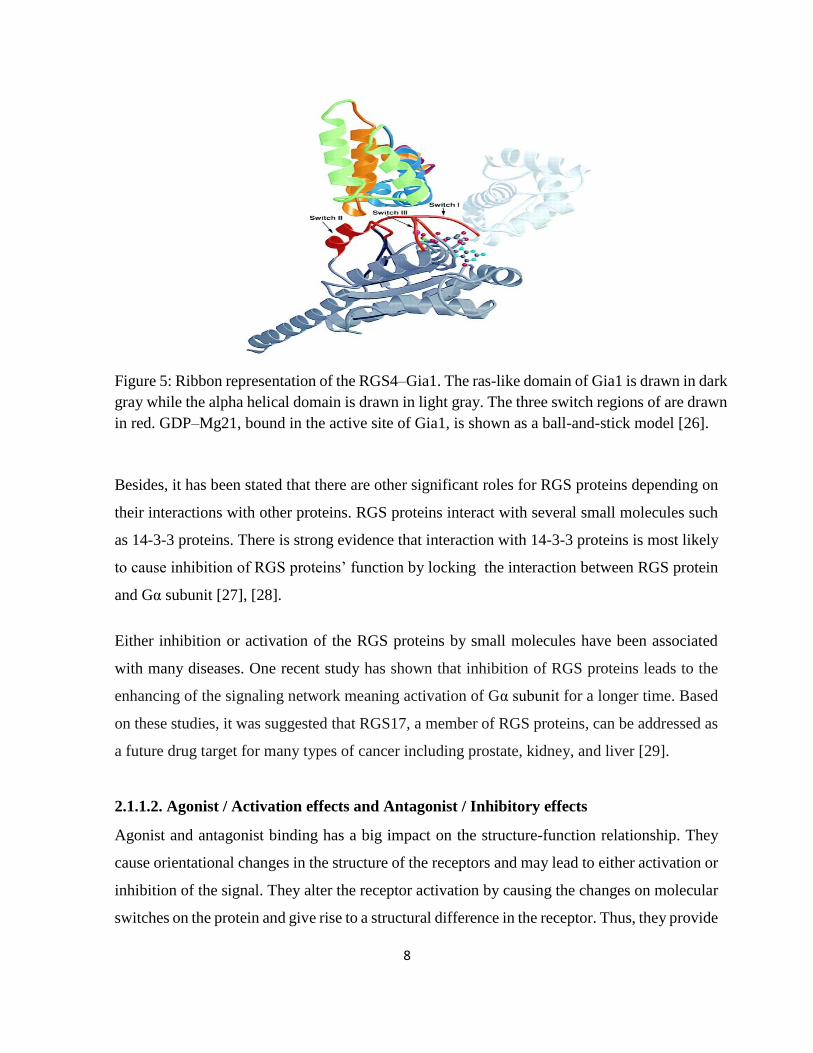
Figure 5: Ribbon representation of the RGS4–Gia1. The ras-like domain of Gia1 is drawn in dark
gray while the alpha helical domain is drawn in light gray. The three switch regions of are drawn
in red. GDP–Mg21, bound in the active site of Gia1, is shown as a ball-and-stick model [26].
Besides, it has been stated that there are other significant roles for RGS proteins depending on
their interactions with other proteins. RGS proteins interact with several small molecules such
as 14-3-3 proteins. There is strong evidence that interaction with 14-3-3 proteins is most likely
to cause inhibition of RGS proteins’ function by locking the interaction between RGS protein
and Gα subunit [27], [28].
Either inhibition or activation of the RGS proteins by small molecules have been associated
with many diseases. One recent study has shown that inhibition of RGS proteins leads to the
enhancing of the signaling network meaning activation of Gα subunit for a longer time. Based
on these studies, it was suggested that RGS17, a member of RGS proteins, can be addressed as
a future drug target for many types of cancer including prostate, kidney, and liver [29].
2.1.1.2. Agonist / Activation effects and Antagonist / Inhibitory effects
Agonist and antagonist binding has a big impact on the structure-function relationship. They
cause orientational changes in the structure of the receptors and may lead to either activation or
inhibition of the signal. They alter the receptor activation by causing the changes on molecular
switches on the protein and give rise to a structural difference in the receptor. Thus, they provide
9
crucial information for biochemical and X-ray methods such as crystallography with the aid of
molecular dynamic simulations [30]. Initiation and termination of signaling pathways differ
depending on intrinsic activities (efficacies) of the agonists and antagonists. Thus, based on this
classification, ligands can be divided into four groups: full agonists, partial agonists, neutral
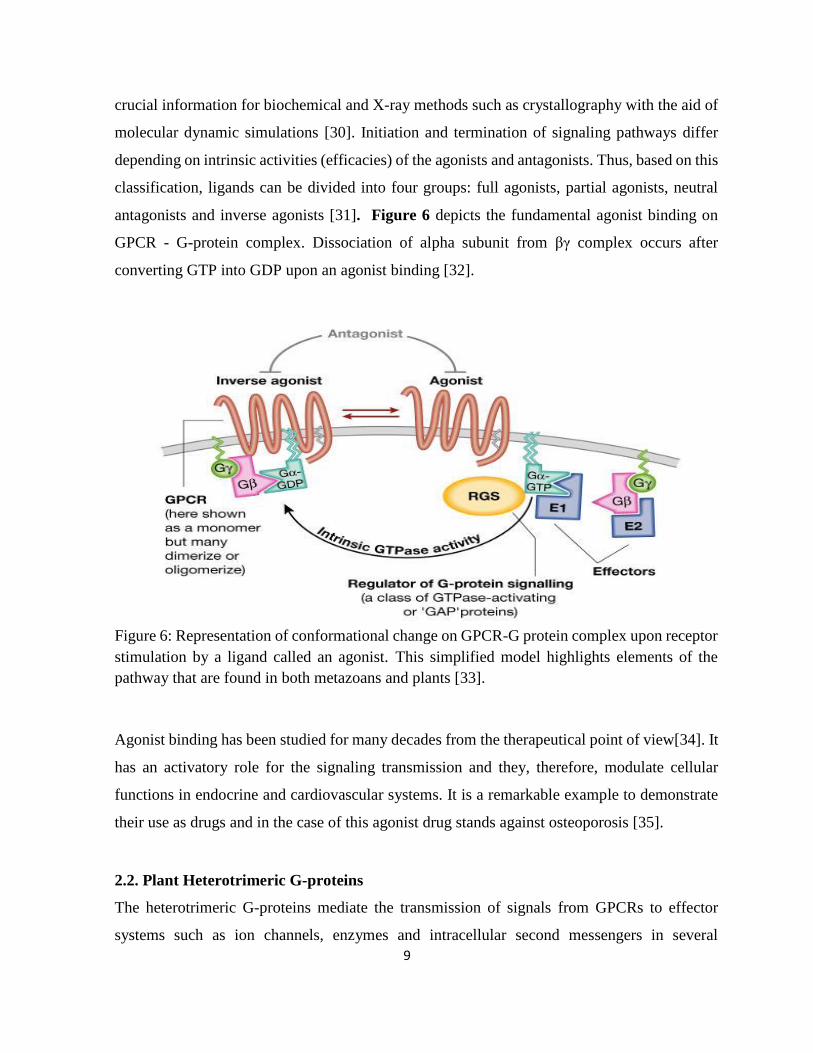
antagonists and inverse agonists [31]. Figure 6 depicts the fundamental agonist binding on
GPCR - G-protein complex. Dissociation of alpha subunit from βγ complex occurs after
converting GTP into GDP upon an agonist binding [32].
Figure 6: Representation of conformational change on GPCR-G protein complex upon receptor
stimulation by a ligand called an agonist. This simplified model highlights elements of the
pathway that are found in both metazoans and plants [33].
Agonist binding has been studied for many decades from the therapeutical point of view[34]. It
has an activatory role for the signaling transmission and they, therefore, modulate cellular
functions in endocrine and cardiovascular systems. It is a remarkable example to demonstrate
their use as drugs and in the case of this agonist drug stands against osteoporosis [35].
2.2. Plant Heterotrimeric G-proteins
The heterotrimeric G-proteins mediate the transmission of signals from GPCRs to effector
systems such as ion channels, enzymes and intracellular second messengers in several
10
organisms including yeast, mammals, and plants. The heterotrimeric complex is comprised of
the alpha (Gα), beta (Gβ), and gamma (Gγ) subunits. There are many genes expressing a
specific subunit in mammalians whereas a limited number of genes express these proteins in
the plant kingdom. Nevertheless, a number of subunits vary among different species. For
instance, only one Alpha (AtGPA1) and one Beta (AGB1) subunit have been identified in A.
thaliana while it increases up to 4 in Glycine max [36]. In addition, there is currently only 3
gamma (AGG1, AGG2, and AGG3) subunits in A.thaliana and the number of subunits can
increase in different species. For example, 8 gamma subunits have been identified in Manihot
esculenta [3]. Plant heterotrimeric G-proteins have been shown to be involved in multiple
physiological processes, such as regulation during development of leaf shape, cell proliferation,
lateral root formation, stomatal density as well as control of the post-germination process [37].
2.2.1. The Alpha Subunit in A.thaliana
The work presented in this thesis is mainly focused on the characterization of AtGPA1 in
A.thaliana through GTP binding and hydrolysis activity it plays a central role in mediating the
signaling in plants. AtGPA1 is found mostly in vegetative tissues including leaves and roots
[38]. It localizes at the plasma membrane and ER membrane which is consistent with the
heterotrimer model [39].
AtGPA1 is encoded by 1149 base pairs which corresponds to a molecular weight of 44,482
Da. Rat Gi1-3 has 36% of identical homology to AtGPA1 in terms of amino acid sequence [3].
It consists of two domains; a ras-like domain and a helical domain. Although, there is no crystal
structure of a heterotrimer, an N-terminal 36 amino acid truncated version of AtGPA1 has been
crystallized and its structure at 2.3 Å resolution has been deposited in Protein Data Bank (PDB)
[4]. Crystal structure reveals that protein secondary structure content consists of 49% alpha
helices, 41% random coil, and 10% extended strand. In addition, this structure has revealed the
GDP/GTP-binding region is placed between ras-like domain and a helical domain. Alterations
in the switch regions and GTP/GDP binding pocket with mutagenetic manipulations by Jones
and his colleagues indicated that helical domain of AtGPA1 is more flexible compared to the
ras-like domain while this rate is relatively similar in both animal domains upon binding. Thus,
this flexibility leads to the spontaneous fluctuation as depicted in Figure 7. Besides, the animal
11
helical domain has much higher mobility compared to that of plant protein. Thus, the
hypothesis has asserted that helical domain is most likely responsible for self-activation in the
plant. Furthermore, they generated chimeras switching ras-like domain and helical domain
between two families and monitored changes in helical domain upon binding. These results
have been a proof to indicate that self-activation can occur only presence of helical domain to
exchange GDP to GTP and initiating the active state for the protein [40].
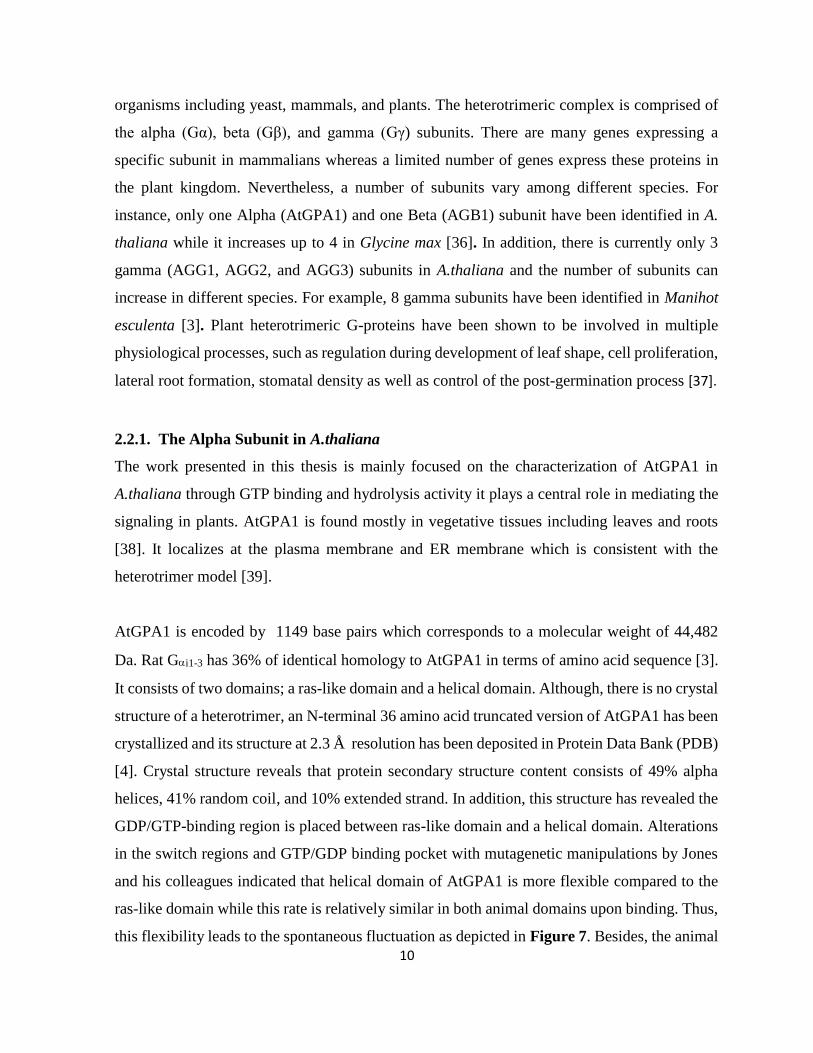
Figure 7: Left) Crystal Structure of G-protein and structural basis of animal G-protein activation
in animals. G alpha subunit (α) forms a stable heterotrimer with βγ dimer (gray and black) at
the steady state. GDP (green) is tightly bound to a ras-domain (orange) of the α subunit, and
covered by helical domain (blue) Right) Structure of Arabidopsis AtGPA1. The spontaneous
fluctuation initiates GDP dissociation and nucleotide exchange. Crystal structures: animal G
protein: (PDB: 1GOT) [41], A.thaliana AtGPA1 (PDB: 2 XTZ) [4].
There is biochemical evidemce in terms of oligomer formation and post-translational
modification. Through antibody detection, it has been shown that some fractions of AtGPA1
which was purified by gel filtration chromatography, had a higher molecular weight than 45
kDa [42]. This is an indication that AtGPA1 may be present as oligomers in vivo which may
have different interaction modes in the signal transmission pathways. Furthermore, based on
indirect evidence, it has been implied that AtGPA1 has sites for both myristoylation and
palmitoylation increasing the protein affinity for the plasma membrane [43], [44].
12
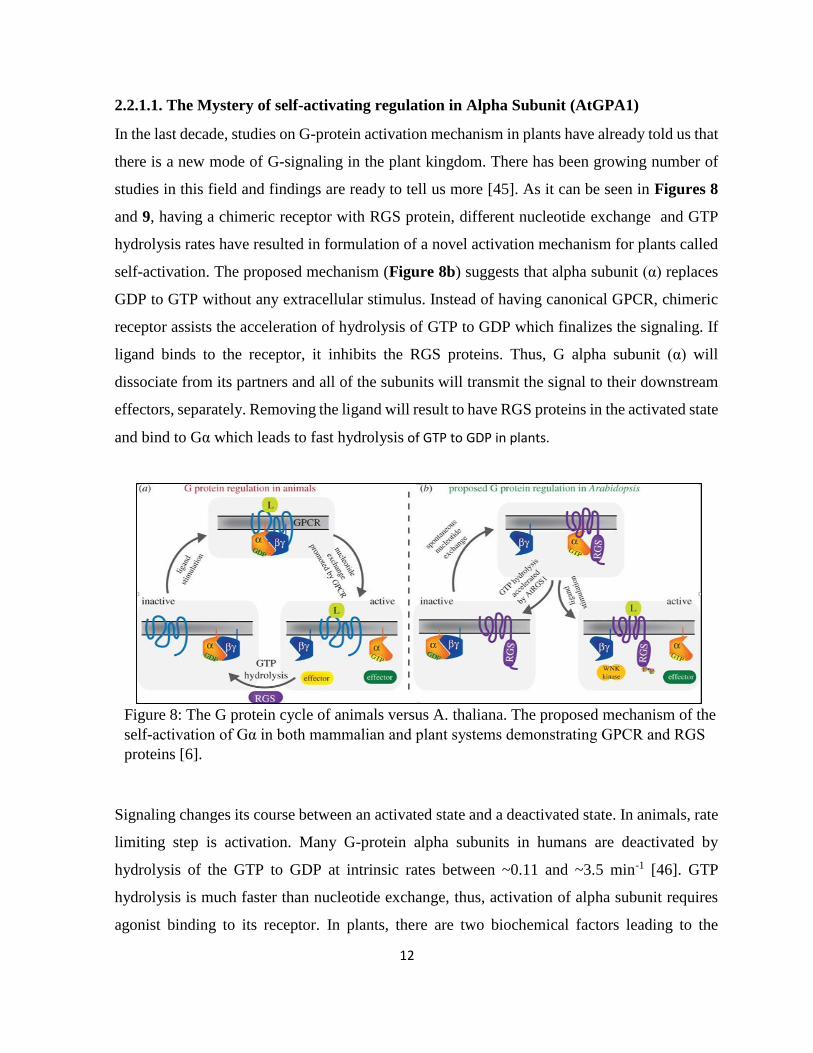
2.2.1.1. The Mystery of self-activating regulation in Alpha Subunit (AtGPA1)
In the last decade, studies on G-protein activation mechanism in plants have already told us that
there is a new mode of G-signaling in the plant kingdom. There has been growing number of
studies in this field and findings are ready to tell us more [45]. As it can be seen in Figures 8
and 9, having a chimeric receptor with RGS protein, different nucleotide exchange and GTP
hydrolysis rates have resulted in formulation of a novel activation mechanism for plants called
self-activation. The proposed mechanism (Figure 8b) suggests that alpha subunit (α) replaces
GDP to GTP without any extracellular stimulus. Instead of having canonical GPCR, chimeric
receptor assists the acceleration of hydrolysis of GTP to GDP which finalizes the signaling. If
ligand binds to the receptor, it inhibits the RGS proteins. Thus, G alpha subunit (α) will
dissociate from its partners and all of the subunits will transmit the signal to their downstream
effectors, separately. Removing the ligand will result to have RGS proteins in the activated state
and bind to Gα which leads to fast hydrolysis of GTP to GDP in plants.
Figure 8: The G protein cycle of animals versus A. thaliana. The proposed mechanism of the
self-activation of Gα in both mammalian and plant systems demonstrating GPCR and RGS
proteins [6].
Signaling changes its course between an activated state and a deactivated state. In animals, rate
limiting step is activation. Many G-protein alpha subunits in humans are deactivated by
hydrolysis of the GTP to GDP at intrinsic rates between ~0.11 and ~3.5 min-1 [46]. GTP
hydrolysis is much faster than nucleotide exchange, thus, activation of alpha subunit requires
agonist binding to its receptor. In plants, there are two biochemical factors leading to the
13
‘’upside down’’ mechanism compared to the animal paradigm. Firstly, AtGPA1 does not
require a GPCR for guanine nucleotide exchange in vitro. Latter has extremely slow hydrolysis
rate of GTP (kcat= 0.05 min–1). Besides, when there is an excess amount of GTP in vitro,
AtGPA1 prefers to bind to the GTP at 99% [4]. Thus, G protein signaling must be regulated by
either increasing hydrolysis of the nucleotide or decreasing nucleotide exchange rates.
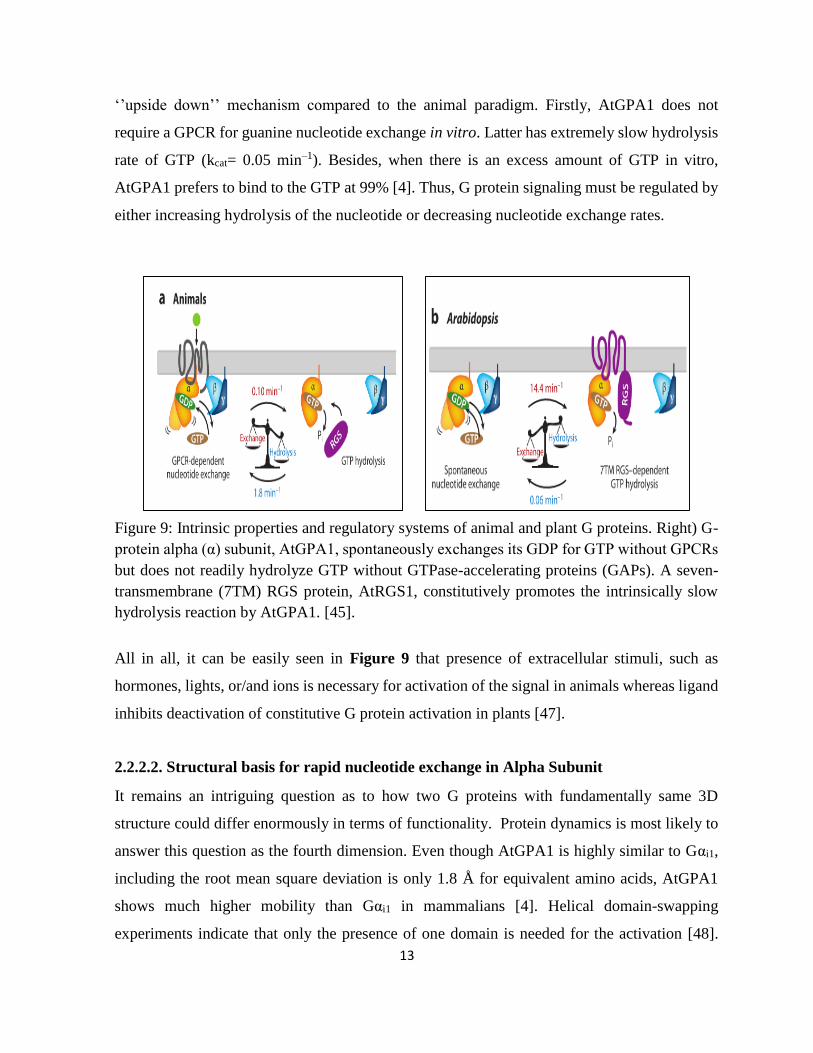
Figure 9: Intrinsic properties and regulatory systems of animal and plant G proteins. Right) G-
protein alpha (α) subunit, AtGPA1, spontaneously exchanges its GDP for GTP without GPCRs
but does not readily hydrolyze GTP without GTPase-accelerating proteins (GAPs). A seven-
transmembrane (7TM) RGS protein, AtRGS1, constitutively promotes the intrinsically slow
hydrolysis reaction by AtGPA1. [45].
All in all, it can be easily seen in Figure 9 that presence of extracellular stimuli, such as
hormones, lights, or/and ions is necessary for activation of the signal in animals whereas ligand
inhibits deactivation of constitutive G protein activation in plants [47].
2.2.2.2. Structural basis for rapid nucleotide exchange in Alpha Subunit
It remains an intriguing question as to how two G proteins with fundamentally same 3D
structure could differ enormously in terms of functionality. Protein dynamics is most likely to
answer this question as the fourth dimension. Even though AtGPA1 is highly similar to Gαi1,
including the root mean square deviation is only 1.8 Å for equivalent amino acids, AtGPA1
shows much higher mobility than Gαi1 in mammalians [4]. Helical domain-swapping
experiments indicate that only the presence of one domain is needed for the activation [48].
14
Controlling of the molecular dynamics of the protein by a single domain is the first evidence
showing the function of the helical domain [8].
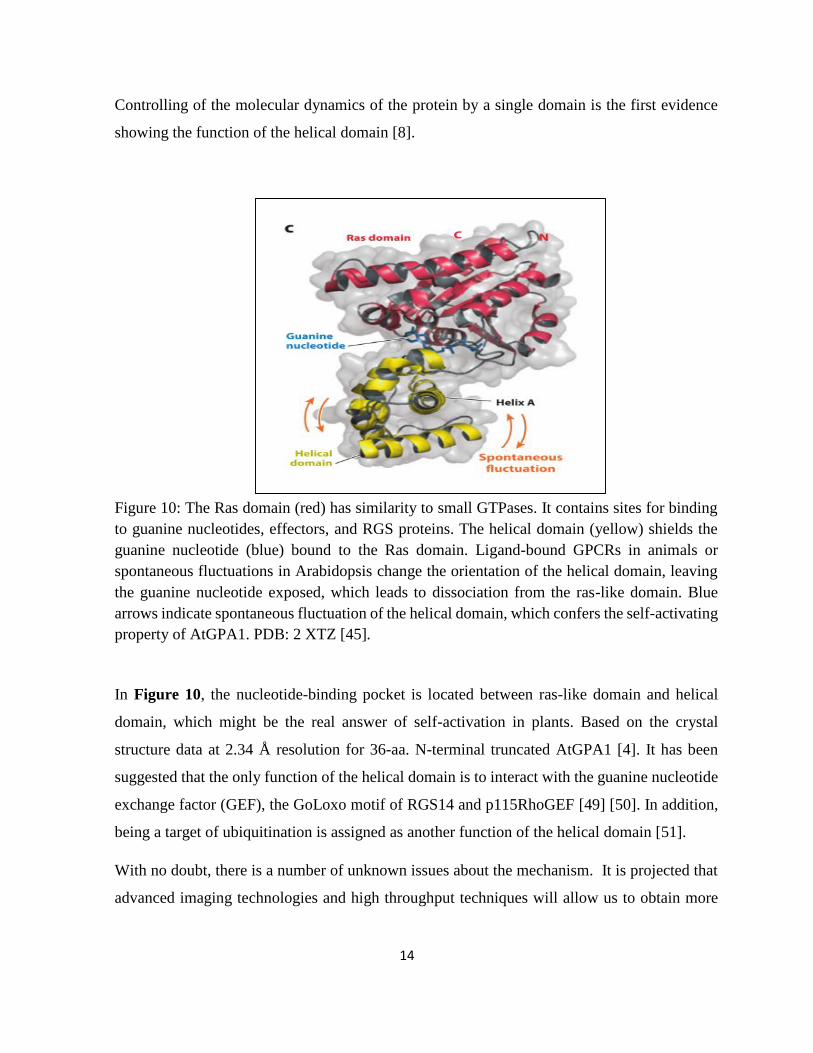
Figure 10: The Ras domain (red) has similarity to small GTPases. It contains sites for binding
to guanine nucleotides, effectors, and RGS proteins. The helical domain (yellow) shields the
guanine nucleotide (blue) bound to the Ras domain. Ligand-bound GPCRs in animals or
spontaneous fluctuations in Arabidopsis change the orientation of the helical domain, leaving
the guanine nucleotide exposed, which leads to dissociation from the ras-like domain. Blue
arrows indicate spontaneous fluctuation of the helical domain, which confers the self-activating
property of AtGPA1. PDB: 2 XTZ [45].
In Figure 10, the nucleotide-binding pocket is located between ras-like domain and helical
domain, which might be the real answer of self-activation in plants. Based on the crystal
structure data at 2.34 Å resolution for 36-aa. N-terminal truncated AtGPA1 [4]. It has been
suggested that the only function of the helical domain is to interact with the guanine nucleotide
exchange factor (GEF), the GoLoxo motif of RGS14 and p115RhoGEF [49] [50]. In addition,
being a target of ubiquitination is assigned as another function of the helical domain [51].
With no doubt, there is a number of unknown issues about the mechanism. It is projected that
advanced imaging technologies and high throughput techniques will allow us to obtain more
15
structural information both in low and high resolution to unveil the mystery of the activation
mechanism for the plant kingdom.
2.3. G-protein functions in plants
In plants, signal transmission mechanism has a distinct pattern compared to animals. This
atypical mechanism affects many physiological phenomena such as growth control, stomate
movements, sugar sensing, channel regulation, and hormone responses [6]. Many transgenic
forms of G-alpha subunit from A.thaliana were generated to analyze the loss of function.
Overexpression and knockout experiments on GPA1 in A.thaliana demonstrate that they have
a direct effect on seed germination and flower development [52][53]. The strength of the effect
for AtGPA1 function shows often the striking difference between species. When morphological
phenotypes, for instance, were analyzed for both A.thaliana and rice mutants, there was no
significant phenotypical change for A.thaliana. However, rice displayed very short grains and
compact panicles compared to its wild-type [54]. In addition, it is not a big surprise that plants
having mutant G-protein show substantial changes for plant hormones. All subunit mutants, for
example, became hypersensitive to ABA inhibition in terms of seed germination [55]. It has
been proven that G-protein signaling in plants differs from animal counterparts. It is placed at
the center of many physiological traits in plants. This unique ‘self-activation’ feature needs to
be investigated further in order to have more knowledge about G-protein functioning in plants
[6].
2.4 Biophysical and Structural Characterization Techniques
2.4.1 Circular Dichroism Spectropolarimetry (CD)
Circular dichroism is an indispensable tool to determine secondary structure content and folding
states of proteins rapidly, due to its sensitive spectra patterns. It is a widely used technique to
monitor protein folding, observing effects on stability or conformation after mutations. In
addition, it is a useful tool to investigate protein -protein interactions (PPIs) [56]. It yields low-
resolution structural information. Yet, it is very specific to changes for oligomers. It is, thus, a
very useful technique to monitor transitions between oligomeric states of proteins through the
alterations on secondary structural elements. It measures left and right-handed circularly
16
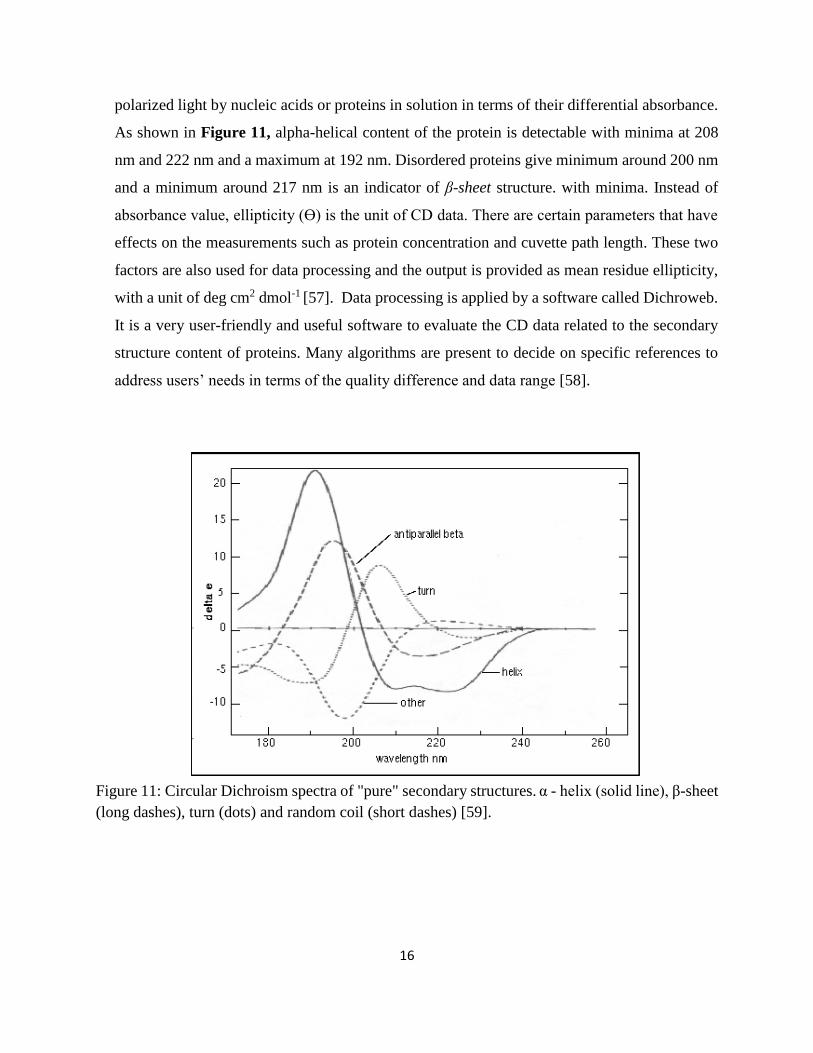
polarized light by nucleic acids or proteins in solution in terms of their differential absorbance.
As shown in Figure 11, alpha-helical content of the protein is detectable with minima at 208
nm and 222 nm and a maximum at 192 nm. Disordered proteins give minimum around 200 nm
and a minimum around 217 nm is an indicator of β-sheet structure. with minima. Instead of
absorbance value, ellipticity (Ɵ) is the unit of CD data. There are certain parameters that have
effects on the measurements such as protein concentration and cuvette path length. These two
factors are also used for data processing and the output is provided as mean residue ellipticity,
with a unit of deg cm2 dmol-1 [57]. Data processing is applied by a software called Dichroweb.
It is a very user-friendly and useful software to evaluate the CD data related to the secondary
structure content of proteins. Many algorithms are present to decide on specific references to
address users’ needs in terms of the quality difference and data range [58].
Figure 11: Circular Dichroism spectra of "pure" secondary structures. α - helix (solid line), β-sheet
(long dashes), turn (dots) and random coil (short dashes) [59].
17
2.4.3. Small Angle X-ray Scattering (SAXS)
Small-angle X-ray scattering is a well-established and a versatile technique providing
information on the global shape and structural parameters of macromolecules in solution [60].
SAXS enables to estimate structural parameters of macromolecules such as molecular mass
(MM), the radius of gyration (Rg), and maximum distance (Dmax) between atom pairs in a
protein [61].
Even though it provides low-resolution information, it is a valuable complementary technique
for structural investigations. In addition, easy sample preparation, low concentration
requirements of the sample, allowing time-resolved measurements, and having no limitation of
molecular weight are only a few strong point of SAXS technique. In addition to its all
advantages, it is also a technique which can be used together with high resolution methods. One
of the major problems of SAXS technique is the weak scattering from macromolecules in a
solution. This problem is overcome through use of SAXS beamline at Synchrotron Radiation
facilities. Synchrotron Radiation (SR) has high photon intensity (high brilliance), high
collimation (small divergence) and it provides wide wavelength tunability. SR is used as an X-
ray source for SAXS experiments in order to get reliable and fast measurements. Incident beam
is scattered at an angle of 2θ where 2θ is the scattering angle.
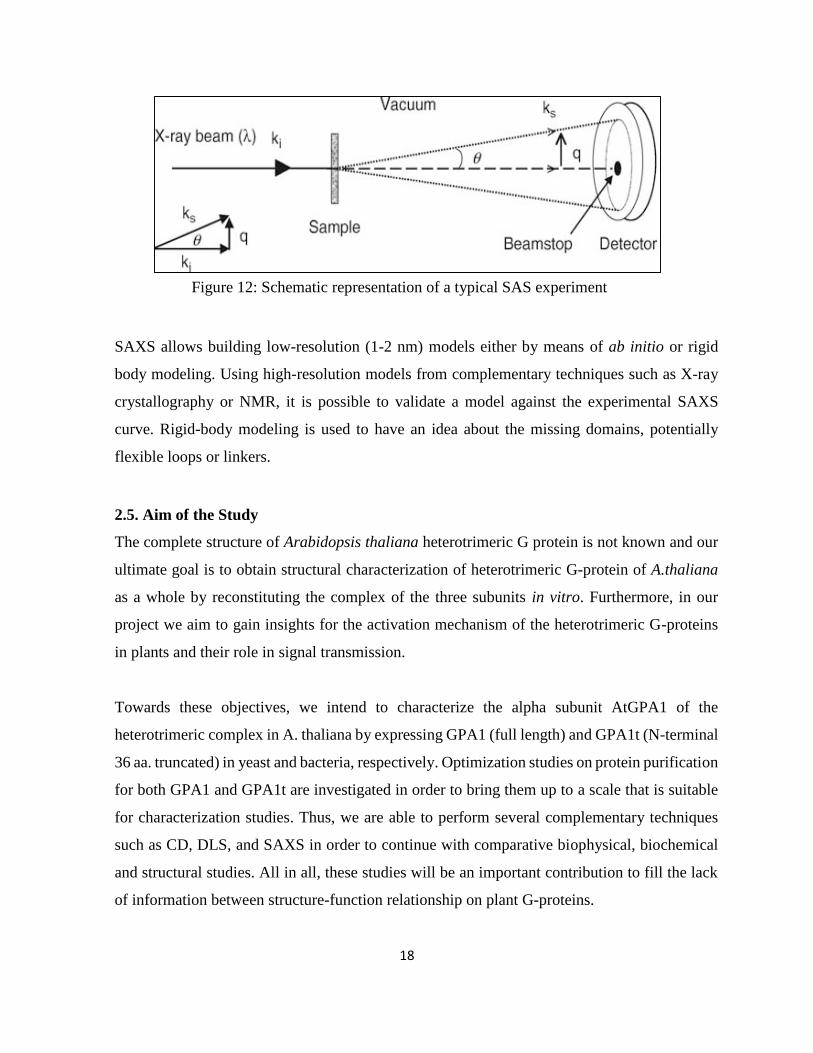
In principle, as it is seen in Figure 12, the beam of X-rays is shaped by the collimator. Density
variations in the sample scatter X-rays away from the primary beam and the beamstop prevents
damage to the detector. Finally, the scattered radiation is collected the detector for further
analysis.
18
Figure 12: Schematic representation of a typical SAS experiment
SAXS allows building low-resolution (1-2 nm) models either by means of ab initio or rigid
body modeling. Using high-resolution models from complementary techniques such as X-ray
crystallography or NMR, it is possible to validate a model against the experimental SAXS
curve. Rigid-body modeling is used to have an idea about the missing domains, potentially
flexible loops or linkers.
2.5. Aim of the Study
The complete structure of Arabidopsis thaliana heterotrimeric G protein is not known and our
ultimate goal is to obtain structural characterization of heterotrimeric G-protein of A.thaliana
as a whole by reconstituting the complex of the three subunits in vitro. Furthermore, in our
project we aim to gain insights for the activation mechanism of the heterotrimeric G-proteins
in plants and their role in signal transmission.
Towards these objectives, we intend to characterize the alpha subunit AtGPA1 of the
heterotrimeric complex in A. thaliana by expressing GPA1 (full length) and GPA1t (N-terminal
36 aa. truncated) in yeast and bacteria, respectively. Optimization studies on protein purification
for both GPA1 and GPA1t are investigated in order to bring them up to a scale that is suitable
for characterization studies. Thus, we are able to perform several complementary techniques
such as CD, DLS, and SAXS in order to continue with comparative biophysical, biochemical
and structural studies. All in all, these studies will be an important contribution to fill the lack
of information between structure-function relationship on plant G-proteins.
19
3. MATERIALS AND METHODS
3.1. MATERIALS
3.1.2. Chemicals
All chemicals used for the experiments were supplied by several companies which are presented
in Appendix A.
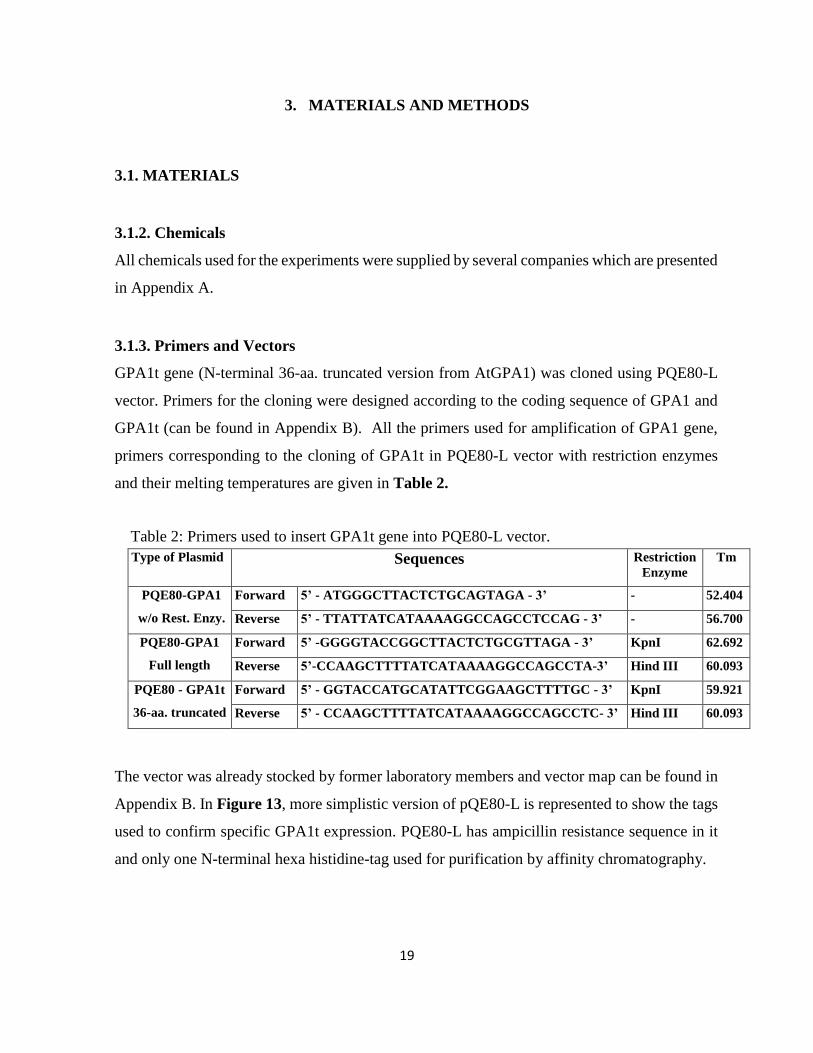
3.1.3. Primers and Vectors
GPA1t gene (N-terminal 36-aa. truncated version from AtGPA1) was cloned using PQE80-L
vector. Primers for the cloning were designed according to the coding sequence of GPA1 and
GPA1t (can be found in Appendix B). All the primers used for amplification of GPA1 gene,
primers corresponding to the cloning of GPA1t in PQE80-L vector with restriction enzymes
and their melting temperatures are given in Table 2.
Table 2: Primers used to insert GPA1t gene into PQE80-L vector.
The vector was already stocked by former laboratory members and vector map can be found in
Appendix B. In Figure 13, more simplistic version of pQE80-L is represented to show the tags
used to confirm specific GPA1t expression. PQE80-L has ampicillin resistance sequence in it
and only one N-terminal hexa histidine-tag used for purification by affinity chromatography.
Type of Plasmid Sequences Restriction
Enzyme
Tm
PQE80-GPA1
w/o Rest. Enzy.
Forward 5’ - ATGGGCTTACTCTGCAGTAGA - 3’ - 52.404
Reverse 5’ - TTATTATCATAAAAGGCCAGCCTCCAG - 3’ - 56.700
PQE80-GPA1
Full length
Forward 5’ -GGGGTACCGGCTTACTCTGCGTTAGA - 3’ KpnI 62.692
Reverse 5’-CCAAGCTTTTATCATAAAAGGCCAGCCTA-3’ Hind III 60.093
PQE80 - GPA1t
36-aa. truncated
Forward 5’ - GGTACCATGCATATTCGGAAGCTTTTGC - 3’ KpnI 59.921
Reverse 5’ - CCAAGCTTTTATCATAAAAGGCCAGCCTC- 3’ Hind III 60.093
20
Figure 13: Schematic representation of pQE80-L expression vector with specific restriction
enzymes for GPA1t gene cloning.
GPA1 gene had been cloned using pPICZC vector by the former lab members for synthesis in
GS115 cells, P.pastoris strain [62]. The vector map including myc-epitope, restriction sites,
and the his-tag site is shown in appendix B.
3.1.4. Enzymes
HindIII and Kpnl (Fermentas) were used as restriction enzymes to cut the vector from its
multiple cloning sites. For ligation T4 DNA ligase (Fermentas) was used. Taq Polymerase
(Thermo Fisher Scientific) was used for the target gene and template amplification by PCR
reaction. Additionally, zymolyase (Amsbio) and Lyticase (Sigma-Aldrich) were used to disrupt
the cell wall during lysis process.
3.1.5. Commercial Kits
Qiaquick PCR Purification, Qiaquick Gel Extraction and Qiaprep Spin Miniprep Kits
(QIAGEN) were used in recombinant DNA manipulations and molecular screenings such as
DNA isolation, gel extraction, cloning and expression of the target proteins. In addition,
BugBuster TM Protein Extraction Reagent (NOVAGEN) was used to lyse BL21 cells for
GPA1t purification.
21
3.1.6. Culture Media
3.1.6.1. E.coli Systems
LB broth (Lenox broth) from Sigma (L-3022) was the growth medium used during the
transformation and expression steps. It contains 10 g Tryptone, 5 g yeast extract and 5 g NaCl
for 1 L liquid culture. 15 g of LB-Agar was added to 1 L liquid culture to prepare solid medium
for the growth of bacterial cells. MilliQ water was used, media were autoclaved at 1 atm, 121oC
for 15 minutes and ampicillin as an appropriate antibiotic at a final concentration of 100 µg/ml
was added to mediums for selection.
3.1.6.2. P. Pastoris Systems
YPD (Yeast extract-peptone-dextrose) Broth was used for the preparation of solid agar and
liquid medium with zeocin as an appropriate antibiotic at a final concentration of 150 µg/ml.
10 g yeast extract and 20 g peptone were dissolved in 900 ml dH20. (Added 20 g of agar for
preparation of solid medium). It was autoclaved at 1 atm, 121oC for 15 min. As a final step, 100
ml of autoclaved 20% D-glucose at 60oC was added for 1 L YPD culture and store at the room
temperature.
Large-scale expression was performed in BMGY and BMMY media. BMGY medium supplies
all the nutrients for yeast cell growth whereas BMMM medium contains 0.5 % methanol as
distinct from BMGY medium in order to induce the protein expression as well.
BMGY (1 Liter): 10 g yeast extract and 20 g peptone were dissolved in 700 ml dH20 and
autoclaved at 1 atm, 121oC for 15 min. Then, it was cooled down to room temperature and the
following ingredients were added prepared from stock solutions as shown in Table 3;
1M Potassium Phosphate, pH: 6 100 ml
10x YNB (13.4% Yeast Nitrogen Base with NH4SO4) 100 ml
500x Biotin (0.02%) 2 ml
10x GY (10% Glycerol) 100 ml
22
BMMY (1 Liter): The only difference from BMGY medium was the addition of 100 ml filter
sterilized solution (5 ml of MetOH +95 ml dH20) instead of adding 100 ml 10x GY. The media
were stored at 4oC.
Table 3: Preparation of stock solutions used for the media in large scale expression.
3.1.7. Buffers and Solutions
3.1.7.1. E.coli Systems
Buffers and solutions during the lysis, purification, and biophysical characterization steps are
listed as follows:
Lysis Buffer (250 ml): 50 mM Tris-HCl pH: 7.5, containing 100 mM NaCl, 1 mM PMSF, 1
mM DTT, 0.5 mg/ml lysozyme from chicken egg white, 1 tablet of protease inhibitors complete
cocktail and 10 mg/ml DNAase.
Wash Buffer for Batch Mode Nickel Affinity Chromatography: 20 mM Tris-HCl pH: 8.0,
containing 500 mM NaCl
Elution Buffer for Batch Mode Nickel Affinity Chromatography: 20 mM Tris-HCl pH: 8.0,
containing 500 mM NaCl and series of imidazole concentration from 5 mM to 300 mM
Dialysis Buffer: Tris-HCl 50 mM pH: 7.4, containing 10 mM NaCl, 5 mM MgCl2, 0.5%
Glycerol and 1 mM PMSF.
Size Exclusion Buffer (SEC) Buffer: 50 mM Tris-HCl, pH: 7.4, 150 mM NaCl, 50 μM GDP, 1
mM DTT
Stocks Recipe
10x YNB 63 gr of YNB in 500 ml dH20. Filter sterilized. Store at 4oC.
500x Biotin Dissolve 20 mg biotin in 100 ml of 0.05 M NaoH. Filter sterilized. Store at 4oC.
10x GY Mix 100 ml Glycerol with 900 ml dH20. Autoclave and store at 4oC.
23
3.1.7.2. P. pastoris system
Lysis Buffer A: 50 mM Tris-HCl pH: 8.0, containing 10 mM MgCl2, 0.1% Triton-X-100, 5%
Glycerol
Lysis buffer B: 200 ml Lysis Buffer A containing 1mM EDTA (0.5 M EDTA stock); 1 mM
PMSF
Lysis Buffer C: 200 ml Lysis Buffer A containing 2 mM PMSF, 2 EDTA-free protease inhibitor
tablet
Purification Buffer 10X (PB): 500 mM Tris-HCl, pH 8.0, containing 3M NaCl, 200 mM
Imidazole, 50 mM MgCl2, 300 µM Al2(SO4)3, 100 mM NaF
*Chemicals for 10X PB above can be stable for long hours without any inactivation, BME,
GDP and PMSF were added right before starting purification process.
Washing Buffer for Batch Mode Nickel Affinity Chromatography: 1X Purification buffer,
containing 10 mM BME (14.2 M β-merchaptoethanol), GDP 50 µM, PMSF 0.2 mM
Elution Buffer for Batch Mode Nickel Affinity Chromatography: Washing buffer containing
280 mM Imidazole.
Dialysis Buffer: 50 mM Tris-HCl pH: 8.0, containing 10 mM NaCl, 5 mM MgCl2, 0,5 %
Glycerol
Wash Buffer for Anion Exchange Chromatography with HiTrap Q HP x 1 ml (GE-Healthcare):
20 mM Tris-HCl pH: 8.0,
Elution Buffer for Anion Exchange Chromatography with HiTrap Q HP x 1 ml (GE-Healthcare):
20 mM Tris-HCl pH: 8.0, containing 700 mM NaCl
Size Exclusion Buffer: 50 mM Tris-HCl pH: 7.4, containing 150 mM NaCl, 50 µM GDP, 1
mM DTT
*The last two chemicals were added immediately before SEC step due to their short half-life.
24
Special care was taken for preparation of buffers used for chromatography steps. They were
prepared with ddH2O, degassed and filtered with 0.22 μm Millipore filter paper before usage.
Buffers used in PAGE-analyses and western blotting can be found in Appendix C.
3.1.8. Columns
HiTrap Q HP, 1 ml Column (GE Healthcare) for anion exchange chromatography, HiLoad
16/60 Superdex 75 pg and HiLoad 16/600 Superdex 200 pg columns (GE Healthcare) for size
exclusion chromatography (SEC) were used.In addition, batch mode affinity chromatography
was applied with Ni-NTA agarose resin (QIAGEN) for initial purification of GPA1. In between
chromatography steps and at the end of each purification set, concentrators with MWCO=10000
and MWCO=30000 (Millipore Centrifugal Filter Unit, Sartorius Biolab Product) were used to
concentrate the target protein depending on the molecular weight of the protein.
3.1.9. Equipment
The equipment used in this study is further listed in Appendix D.
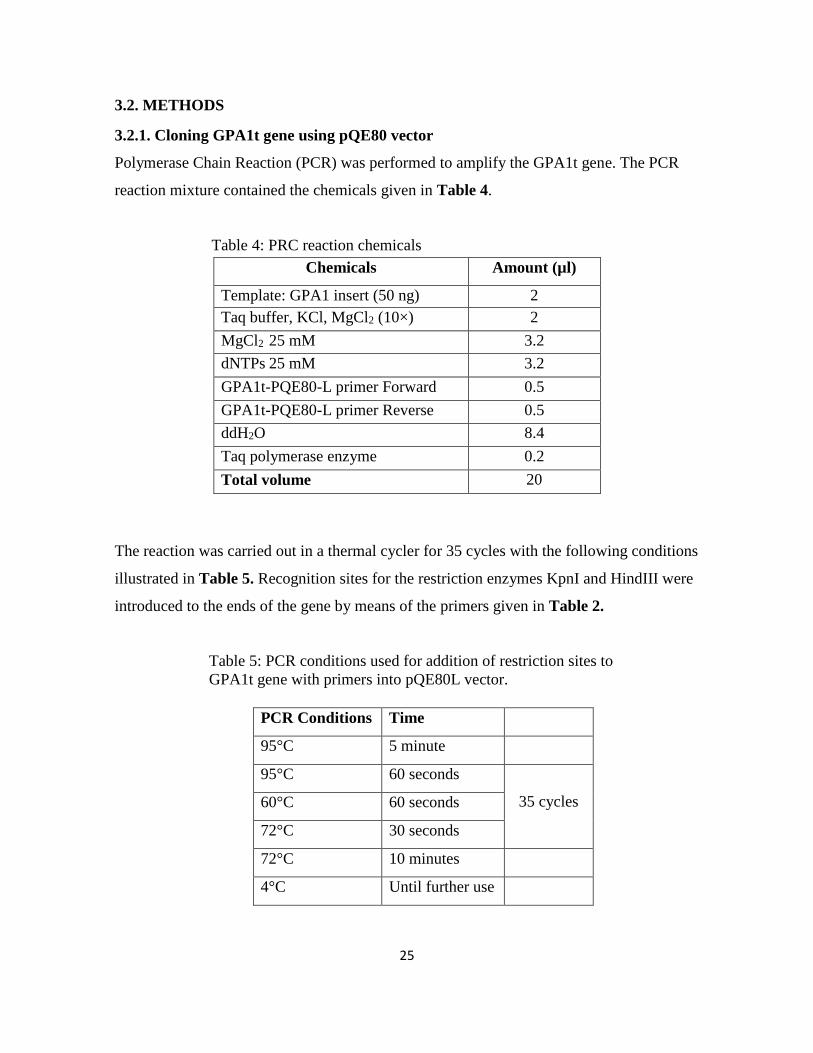
25
3.2. METHODS
3.2.1. Cloning GPA1t gene using pQE80 vector
Polymerase Chain Reaction (PCR) was performed to amplify the GPA1t gene. The PCR
reaction mixture contained the chemicals given in Table 4.
Table 4: PRC reaction chemicals
The reaction was carried out in a thermal cycler for 35 cycles with the following conditions
illustrated in Table 5. Recognition sites for the restriction enzymes KpnI and HindIII were
introduced to the ends of the gene by means of the primers given in Table 2.
Table 5: PCR conditions used for addition of restriction sites to
GPA1t gene with primers into pQE80L vector.
Chemicals Amount (µl)
Template: GPA1 insert (50 ng) 2
Taq buffer, KCl, MgCl2 (10×) 2
MgCl2 25 mM 3.2
dNTPs 25 mM 3.2
GPA1t-PQE80-L primer Forward 0.5
GPA1t-PQE80-L primer Reverse 0.5
ddH2O 8.4
Taq polymerase enzyme 0.2
Total volume 20
PCR Conditions Time
95°C 5 minute
95°C 60 seconds
35 cycles 60°C 60 seconds
72°C 30 seconds
72°C 10 minutes
4°C Until further use
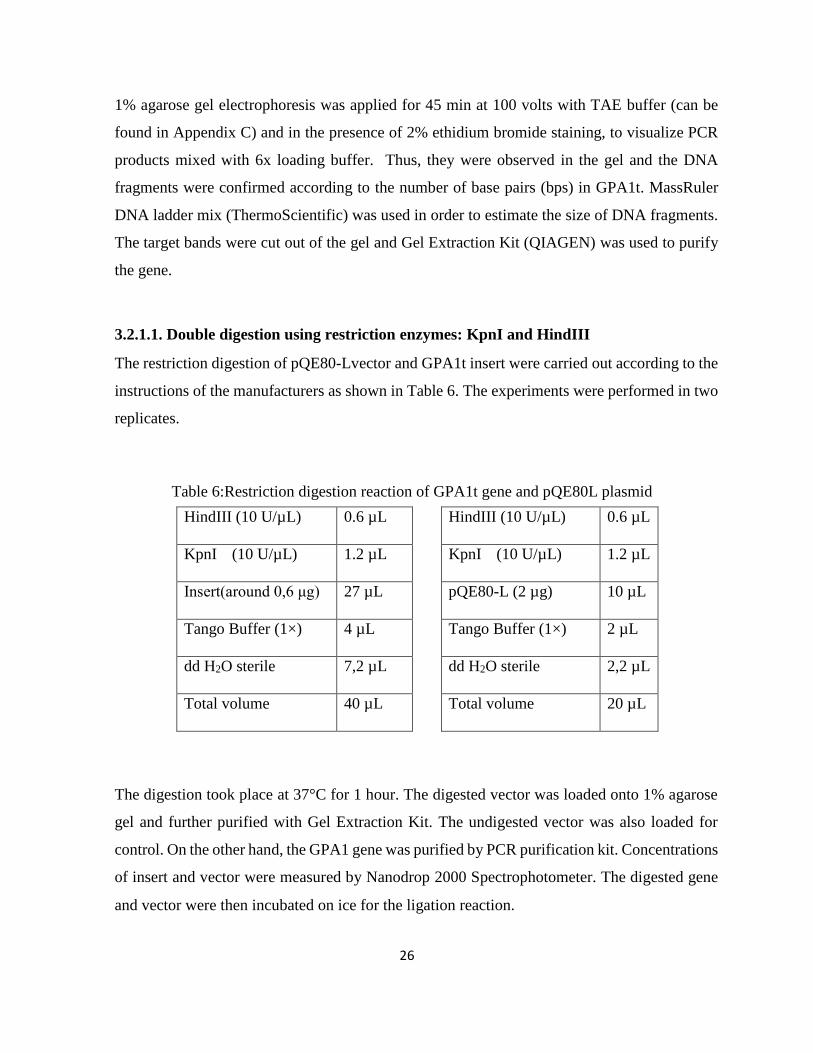
26
1% agarose gel electrophoresis was applied for 45 min at 100 volts with TAE buffer (can be
found in Appendix C) and in the presence of 2% ethidium bromide staining, to visualize PCR
products mixed with 6x loading buffer. Thus, they were observed in the gel and the DNA
fragments were confirmed according to the number of base pairs (bps) in GPA1t. MassRuler
DNA ladder mix (ThermoScientific) was used in order to estimate the size of DNA fragments.
The target bands were cut out of the gel and Gel Extraction Kit (QIAGEN) was used to purify
the gene.
3.2.1.1. Double digestion using restriction enzymes: KpnI and HindIII
The restriction digestion of pQE80-Lvector and GPA1t insert were carried out according to the
instructions of the manufacturers as shown in Table 6. The experiments were performed in two
replicates.
Table 6:Restriction digestion reaction of GPA1t gene and pQE80L plasmid
The digestion took place at 37°C for 1 hour. The digested vector was loaded onto 1% agarose
gel and further purified with Gel Extraction Kit. The undigested vector was also loaded for
control. On the other hand, the GPA1 gene was purified by PCR purification kit. Concentrations
of insert and vector were measured by Nanodrop 2000 Spectrophotometer. The digested gene
and vector were then incubated on ice for the ligation reaction.
HindIII (10 U/µL) 0.6 µL
KpnI (10 U/µL) 1.2 µL
Insert(around 0,6 μg) 27 µL
Tango Buffer (1×) 4 µL
dd H2O sterile 7,2 µL
Total volume 40 µL
HindIII (10 U/µL) 0.6 µL
KpnI (10 U/µL) 1.2 µL
pQE80-L (2 µg) 10 µL
Tango Buffer (1×) 2 µL
dd H2O sterile 2,2 µL
Total volume 20 µL
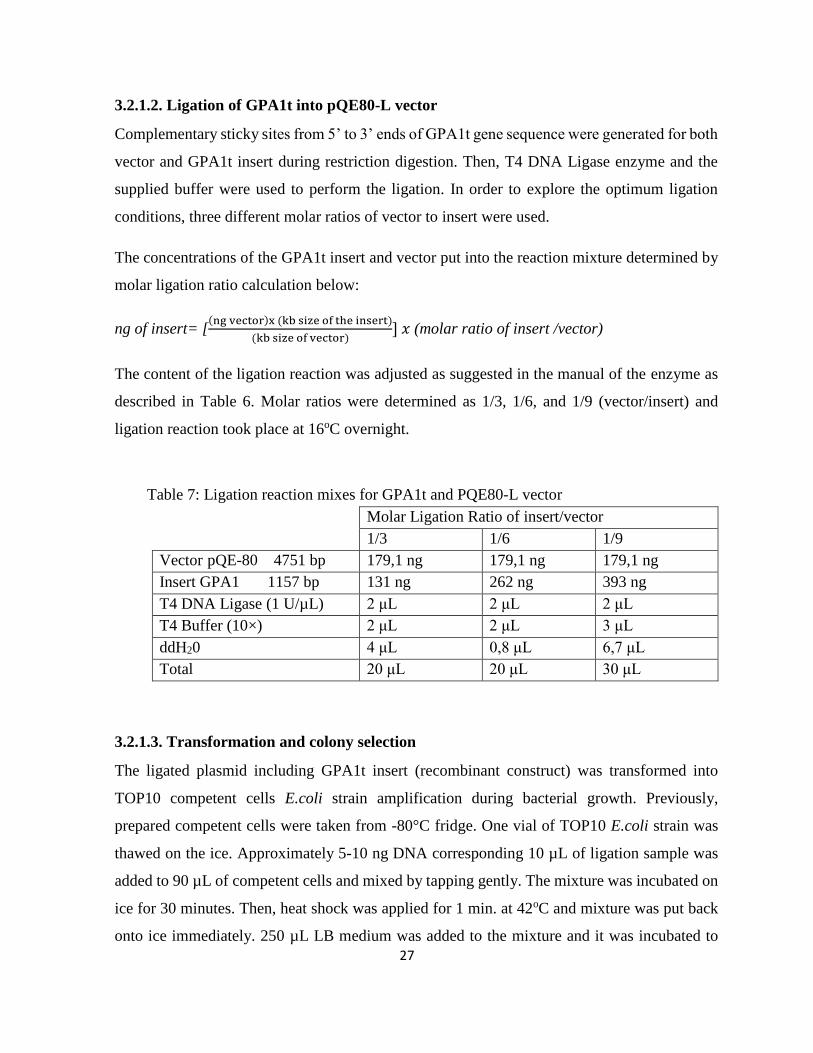
27
3.2.1.2. Ligation of GPA1t into pQE80-L vector
Complementary sticky sites from 5’ to 3’ ends of GPA1t gene sequence were generated for both
vector and GPA1t insert during restriction digestion. Then, T4 DNA Ligase enzyme and the
supplied buffer were used to perform the ligation. In order to explore the optimum ligation
conditions, three different molar ratios of vector to insert were used.
The concentrations of the GPA1t insert and vector put into the reaction mixture determined by
molar ligation ratio calculation below:
ng of insert= [(ng vector)x (kb size of the insert)
(kb size of vector)] 𝑥 (molar ratio of insert /vector)
The content of the ligation reaction was adjusted as suggested in the manual of the enzyme as
described in Table 6. Molar ratios were determined as 1/3, 1/6, and 1/9 (vector/insert) and
ligation reaction took place at 16oC overnight.
Table 7: Ligation reaction mixes for GPA1t and PQE80-L vector
3.2.1.3. Transformation and colony selection
The ligated plasmid including GPA1t insert (recombinant construct) was transformed into
TOP10 competent cells E.coli strain amplification during bacterial growth. Previously,
prepared competent cells were taken from -80°C fridge. One vial of TOP10 E.coli strain was
thawed on the ice. Approximately 5-10 ng DNA corresponding 10 µL of ligation sample was
added to 90 µL of competent cells and mixed by tapping gently. The mixture was incubated on
ice for 30 minutes. Then, heat shock was applied for 1 min. at 42oC and mixture was put back
onto ice immediately. 250 µL LB medium was added to the mixture and it was incubated to
Molar Ligation Ratio of insert/vector
1/3 1/6 1/9
Vector pQE-80 4751 bp 179,1 ng 179,1 ng 179,1 ng
Insert GPA1 1157 bp 131 ng 262 ng 393 ng
T4 DNA Ligase (1 U/µL) 2 μL 2 μL 2 μL
T4 Buffer (10×) 2 μL 2 μL 3 μL
ddH20 4 μL 0,8 μL 6,7 μL
Total 20 μL 20 μL 30 μL
28
grow for 1 hour at 37oC with constant shaking. After 1 hour, cells were spread onto LB agar
medium in the presence of Ampicillin (10 µg/m) for overnight growth at 37°C at 270 rpm.
Observable and well-grown colonies were picked and incubated in 5 ml liquid LB-Ampicillin
(10 µg/ml) medium overnight at 37°C. When characterizing clones for protein expression, at
least 3-4 transformants were chosen as clones may display different levels of expression of
proteins.
3.2.1.4. Plasmid Isolation and Control PCR and Sequence Verification
Plasmid extraction was performed with Qiaprep Spin Miniprep Kit and plasmid was purified
with QIAGEN Plasmid Mini Kit (QIAGEN). Then, control PCR was performed on the
recombinant plasmids utilizing the primers used for cloning (those with the appropriate
restriction sites). Afterwards, an agarose gel was run to visualize the amplified gene. Thus, we
were able to verify the success of the cloning process. In addition, the recombinant plasmid was
sent for sequencing to MCLAB (USA).
3.2.2. Gene Expression and Large Scale Culture Growth
The presence of GPA1t in PQE80-L was confirmed, and glycerol stocks of cells were prepared
from overnight cultures in 30 ml LB medium with ampicillin grown at 270 rpm at 37°C. For
expression the construct (GPA1t+pQE80-L) obtained from TOP10 cells was transformed into
BL21 and Rosetta strains in the presence of ampicillin (AMP). Two media were tested for large-
scale expression, notably LB and terrific broth medium. In the case of LB medium, after
inoculation of overnight grown cells (5 ml LB) into a new 10 ml LB medium containing AMP,
the growth of cells was performed at 37°C under shaking at 270 rpm for small-scale culture to
see gene expression. When OD600 reached the value of 0.6, induction was carried out by
decreasing the temperature to 27°C and adding IPTG at a final concentration of 0.7 mM for 7
hours. At time intervals of 1 hour, the OD600 was measured. Finally, the culture was centrifuged
with the SS-34 rotor at 7000 rpm for 30 min at 4°C and the pellet was stored at -80°C until
further process.
Same protocol above was applied for large-Scale Culture growth. Instead of 10 ml LB medium,
5 ml overnight grown cell culture was inoculated in 1 L fresh LB medium instead of 10 ml LB.
29
Two different strategies were followed for the lysis step to increase the efficiency of the cells.
In one strategy the lysis was carried out using Bug-Buster (NOVAGEN) TM Protein Extraction
Reagent (volume= 5x fresh weight) in the presence of a tablet of protease inhibitors cocktail
(Roche) and 10 mg/ml Benzonase. The mixture was transferred into 500 ml centrifugation
flasks and incubated shaking for 20 min. at room temperature. The homogenate was centrifuged
at 16000 g for 20 min. at 4°C with the SS-34 Sorvall rotor. Finally, the resulting supernatant
was kept for protein purification and part of the sample from the supernatant was loaded on
SDS-PAGE gel.
Additionally, a different lysis step was conducted as follows; The lysis was carried out using
lysis buffer (volume=10× fresh weight) The homogenate was sonicated on ice with a cycle of 38
amplitudes, 8 sec on, 9 sec off, for 15 min. Then, 1% Triton- X100 was added and the mixture
was incubated for 1 hour at 4ºC with gentle shaking. The homogenate was centrifuged at 20,000
g for 45 min. at 4°C and the resulting supernatant was collected, a sample was taken for SDS-
PAGE gel. In order to monitor the expression levels of the gene, samples were mixed with 6x
SDS loading dye and they were boiled for 5 min. at 95 ºC. A constant current of 27 Ampere (A)
was set during the run through stacking part the resolving gel, was run with a constant current of
30 Ampere (30 A). The run lasted until the dye reached the bottom of the gel. First well of the
gel was loaded with Protein molecular weight marker (Fermentas, pqeLAB) to estimate the
molecular weight of each protein in the samples. For visualization of the protein bands, the gel,
separated from the platform, was boiled 2 times with dH2O for 45 seconds. After washing it with
tap water, water it was placed in 80-100 ml coomassie blue staining for 5-6 hours at least and
followed by destaining for overnight incubation. The recipes for both staining and destaining
solutions can be found in Appendix F.
3.2.3. Purification of Recombinant GPA1t from E.coli
3.2.3.1. Batch mode Ni-Affinity Chromatography and Size exclusion chromatography
After large-scale expression, cells were harvested and then lysed with BugBuster TM Protein
Extraction (w/5v) as described in the previous section. Then, in order to remove cell debris and
other impurities, the sample was centrifuged with Sorvall SS-34 rotor, 22000 rpm for 25 min at
30
4oC. The supernatant was kept for the nickel affinity purification. Around 40 µl sample was
kept in terms of visualization of GPA1t by SDS-Page analysis and western blotting.
The resulting supernatant was equilibrated by adding the same volume of washing buffer given
in section 3.1.7.1. The mixture was incubated for 5 min. at 4oC. A plastic column was filled
with 2 ml nickel resin (QIAGEN) and mixed with the equilibrated supernatant. The slurry was
divided into 50 ml falcon tubes equally and incubated on a rotating platform for 45 minutes to
achieve binding of GPA1t to the nickel matrix. With the aid of gravitational force, flow through
(FT) was collected with proteins bound to the nickel resin being retained in the column. After
FT collection, 1 column volume (CV) washing buffer was used for three times to wash the
nickel-agarose resin. Afterwards, elution was started with elution buffer given in section
3.1.7.1. To elute the His-tagged proteins, including GPA1t, a stepwise imidazole gradient was
applied with elution buffer including imidazole in the range between 5 mM and 300 mM. The
resin was incubated for 20 minutes before the first elution step and 5 minutes for the next elution
steps. At the end of the purification, selected fractions with pellet, FT and supernatant were
loaded 12% SDS-PAGE in order to see the concentration and dispersity of the proteins. The
coomassie-stained gel was analyzed, and selected fractions according to estimated molecular
weight of the bands were pooled and they were prepared for the next step, which is dialysis of
GPA1t to remove imidazole.
Overnight dialysis was applied for the pooled fractions in CelluSep Regenerated Cellulose
Tubular Membrane (MW cut-off 12000-14000 Da) against dialysis buffer given in section
3.1.7.1. in the cold room in order to remove high concentration.
After dialysis pooled fractions were subjected size exclusion chromatography (SEC) in order
to obtain the purest GPA1t at the end of the purification process. Before SEC, the samples were
centrifuged at 14000 rpm for 15 min at 4oC with a Beckman Coulter Bench-top centrifuge to
remove aggregates. Then, samples were concentrated at 3000 rpm at 4oC with a Beckman
Coulter Bench-top centrifuge for 10 min. cycles until reaching down to 5 ml or less volume due
to the use of the 5 ml super-loop and to prevent the diffusion of the protein during elution.
Millipore Centrifugal Filter Units with MWCO=30000 were used to eliminate smaller MW
impurities from the GPA1t based on molecular weight of the protein. The sample was
31
concentrated and the concentration of the samples was determined by NanoDrop 2000
spectrophotometer with the extinction coefficient (E 1%= 9.2 M-1cm-1 for GPA1t).
SEC was applied as the last step in purification to separate impurities based on their molecular
weight differences. This technique enables to have not only an increase of the protein purity but
it also confirms that the target protein is obtained in the correct elution volume for its molecular
weight. The correct elution volume is judged by means of column calibration. Thus, different
oligomerization levels can be detected by gel filtration technique (SEC) based on the elution
volume and the corresponding molecular weight before using other biophysical techniques. For
GPA1t, HiLoad 16/60 Superdex 75 pg column connected to the AKTA Prime FPLC system
were used for SEC. Columns were equilibrated with the running buffer before loading samples
and the appropriate program was run to inject the sample into the column. During elution at 1
ml/min flow rate, fractions were collected as the UV peak began to increase until it went back
to the baseline. Estimation of the molecular weight of the protein and assumptions on the
oligomerization state were made with the help of calibrations.
Results of elution were confirmed by means of 12% SDS-PAGE analysis. Concentrations were
determined using NanoDrop 2000 spectrophotometer to decide if there is sufficient amount of
protein for further biochemical and biophysical analyses.
3.2.4. Large Scale Expression of GPA1-myc-his in Pichia Pastoris
pPICZC vector with the construct (GPA1-myc-his) was cloned GS115 cells, Pichia Pastoris
strain by former lab members as described in Kaplan 2009 [62]. Before starting expression,
GS115 cell colonies from glycerol stocks were grown on YPD agar plates containing zeocin
antibiotic at a final concentration of 150 µg/ml. Cells were spread on YPD agar plates and the
plates were incubated for 48 hours at 30oC to grow. pPICZc vector has zeocin antibiotic
resistance gene. Thus, only the cells containing the resistance gene grew and were ready to
express GPA1. After 2 days, small colonies were observed without any contamination and one
of them was selected for large-scale expression. The large-scale expression was carried out
according to [63], as described below;
Day1: Take one single colony from YPD plate with the help of a sterile loop. Inoculate the
colony into 250 ml flask which contains 10 ml YDP containing kanamycin and zeocin at a final
32
concentration of 150 µg/ml and 200 µg/ml, respectively. Incubate the culture overnight at 220
rpm, at 30oC.
*. However, it was not a necessity for the protein expression, kanamycin was used as a random
antibiotic to avoid the potential contamination risk which may be caused by certain type bacteria
cells.
Day 2: Prepare a new sterile 1L flask to make a large-scale expression with 500 ml BMGY
containing kanamycin at a final concentration of 150 µg/ml. Take 5 ml sample from the
overnight culture and inoculate into the 1L flask. Incubate the culture for 24 hours at 240 rpm
at 30oC.
Day 3: Centrifuge 500 ml culture for 18 min. at 1521 g, at 30oC with SLA 3000 centrifuge
rotor. In the meantime, pour new BMGY medium into the flask and add kanamycin at a final
concentration of 150 µg/ml. Resuspend the pellet and inoculate into the 1L flask. Incubate the
culture for 24 hours at 240 rpm at 30oC.
Day 4: Centrifuge 500 ml culture for 18 min. at 1521 g, at 30oC with SLA 3000 rotor. In the
meantime, pour new 500 ml BMMY medium instead of BGMY into the flask. It also differs
from the previous day as kanamycin is not added. Resuspend the pellet with this fresh medium
and inoculate the medium in the 1L flask. Incubate the culture for 24 hours at 240 rpm at 30oC.
In between, 6 hours after inoculation, first induction is applied as 1% filtered-sterilized
methanol addition.
Day 5: 18 hours after the first induction, another 1% filtered-sterilized methanol (5 ml) is added
to 500 ml culture as second induction and the culture was incubated for 24 hours at 240 rpm at
30oC for protein expression.
Day 6: Induction takes 48 hours in total. Then, harvest the cells by centrifugation with SLA-
3000 centrifuge rotor at 3000 g, at 4oC for 35 minutes. Determine the weight of the pellet. Keep
the pellet at 80oC until the following process.
*In this process special care has to be taken in order not to contaminate the yeast culture. Due
to the composition of the medium, it is easy to contaminate these culture.
33
* In each protein expression set, two replicas are subjected in each GPA1 expression meaning
that we have two pellets from two different 500 ml cell culture at the end of expression step.
All steps are applied simultaneously to the two separate cultures.
3.2.5. Purification of Recombinant GPA1 from P. pastoris
Several different methods were tested to lyse the cells such as physical lysis with bead beater
and enzymatic lysis with either lyticase or zymolyase. Based on the results , the latest lysis
protocol was utilized as follows;
The pellet was resuspended at a ratio of 10 ml lysis buffer B / g pellet and repelleted at 2500 g
for 18 min at 4oC. The pellet was then resuspended again at a ratio of 5 ml lysis buffer C /g
pellet at 4oC. The sample was treated with 300 U /ml Zymolase in order to break the cell wall
and incubated with gentle shaking for 40 min. at room temperature. After, this sonication was
applied to about 40 ml sample with cycle parameters (for each cycle) as follows; amplification:
39% amplitude, 10 sec. on, 20 sec. off, 12 min. in total at 40C. At the end, to be sure that the
lysis had occurred properly, cells were observed via light microscope to visualize the disruption
of the membrane. High-speed centrifugation was applied with SLA-3000 centrifuge rotor at
23000 g for 35 minutes at 4oC. The supernatant was kept for purification.
3.2.5.1. Batch Mode Ni-Affinity purification
Washing buffer (WB) described in section 3.1.7.2. was added to the resulting supernatant at a
ratio of 1:1 in order to equilibrate the buffer of the protein. It was incubated for 5 min at 4oC.
A plastic column was filled with 5 ml nickel resin (QIAGEN), then it was mixed with the
equilibrated supernatant and the slurry was divided into 50 ml falcon tubes equally. The slurry
was left at a constant speed shake for not more than 30 minutes to bind the nickel beads. With
the aid of gravitational force, flow through (FT) was collected and wash step was applied in the
same fashion as described in section 3.2.4.1. Then, Elution was applied with Elution buffer
(EB) containing a high concentration of imidazole. 2 Column volume EB was poured into the
column and incubated for 20 minutes under a constant gentle shake. With the aid of
gravitational force, 4 eluates were collected (5 min. incubation between each). At the end of the
34
batch mode, selected samples were loaded on SDS-PAGE gel and overnight dialysis was
applied for pooled fractions as described in section 3.2.4.1.
3.2.5.2. Anion Exchange Chromatography and Size Exclusion Chromatography
After dialysis, anion exchange chromatography was performed on pooled fractions. Before
anion exchange, samples were centrifuged at 14000 rpm for 15 min at 4oC with a Beckman
Coulter Bench-top centrifuge to remove the aggregates. In the meantime, AKTA Prime FPLC
(Fast Protein Liquid Chromatography) system was prepared for anion exchange
chromatography. 1 ml HiTrap Q HP column was connected to the AKTA system and washed
with 2 Column Volume (CV) degassed dH2O followed by equilibration with 2 CV washing
buffer given in section 3.1.7.2. The samples were loaded via 50 ml super-loop and injected to
the column. After obtaining a steady baseline, elution buffer given in section 3.1.7.2 containing
a high concentration (700 mM) of NaCl was applied with a gradient of 0.5 ml/min in the range
between 0 to 100% for 12 minutes to elute the GPA1. 1 ml of fractions were collected as the
peaks appeared. At the end of the anion exchange chromatography, selected fractions together
with before and after dialysis samples were loaded subjected to 12% SDS-PAGE analysis to
monitor the increase in the purity of the protein. The coomassie-stained gel was analyzed, and
selected fractions based on estimated molecular weight of the bands were pooled and being
prepared for the next step, which is SEC.
Size Exclusion Chromatography (SEC) was applied in the same fashion described in section
3.2.4.2. In addition to HiLoad 16/60 Superdex 75 pg, HiLoad 16/60 Superdex 200 pg column
was also used chose the most suitable column to obtain the maximum amount of protein in a
pure state.
At the end of the SEC, selected fractions were subjected to 12 % SDS-PAGE analysis.
Concentrations were determined by using NanoDrop 2000 as described below.
3.2.6. Biophysical and Biochemical Analysis of Purified Protein
3.2.6.1. Concentration Determination and Analysis of GDP Content
All absorbance measurements were made using NanoDrop 2000 UV-Vis Spectrophotometer
(Thermo). Protein concentration was calculated with the program of Protein A280. According
to amino acid sequence of GPA1-myc-his and GPA1t-his, extinction coefficients were
35
calculated as 0.92 M-1cm-1 for GPA1 and 0.98 M-1cm-1 for GPA1t respectively GPA1t using
ExPASy Proteomics Server.
To make an indirect estimation of GDP content of AtGPA1, protein absorbance was taken at
254 nm. If GDP was bound to the protein this would be an indication of the functionality of the
protein. For comparison samples without GDP were also generated as follows. After SEC,
GPA1 sample was boiled for 3 min. Then, buffer exchange was applied against water with the
concentrator of MWCO=30000 (Millipore Centrifugal Filter Unit, Sartorious Biolab Product).
The sample was centrifuged at 12.000g for 10 min. at 4oC. 0.5 ml of water was added to the
concentrator and centrifugation was repeated until the desired concentration was reached. The
lack of the peak at 254 nm after the process indicates the loss of GDP.
3.2.6.2. Secondary Structure Content Determination and Thermal Denaturation
Circular dichroism spectropolarimetry was used to determine the secondary structure content
of the protein. Use of nitrogen is crucial to run CD because it does not only cool down the
machine-lamps but also prevents the formation of ozone which may cause damage and
irreversible consequences for the device. Before switching on the machine, the device was
purged with liquid nitrogen at least for 30 minutes. Following cooling, different units were
switched on in the following order: the computer, temperature control device and water bath.
CD measurements were recorded using a JASCO J-810 CD Spectropolarimetry (Jasco
International, Tokyo, Japan). From parameters tool, accessory section was displayed to adjust
your method as the following: Standard sensitivity: 100 nm/min; Wavelength 260-190 nm; Data
pitch: 0.1 nm; Bandwidth: 0.1; 1 second response; Accumulation number: 3
Protein samples were prepared for CD spectropolarimetry analysis by diluting with water to 0.1
mg/ml in a final volume of 200 µL. 1 mm path length quartz cuvettes were used for CD
measurements. Buffer and sample containing guanine nucleotides and analogs were measured
separately and data were recorded as JWS file. Then, buffers are subtracted from the sample
and the subtracted file was recorded as txt. file. Data were deconvoluted at Dichroweb
(http://dichroweb.cryst.bbk.ac.uk) [64] using the available algorithm CDSSTR and for
secondary structure content reference sets 4 and 7 were. Additionally, thermal denaturation
experiments were conducted to monitor the protein stability in different the presence of different
36
nucleotides in varying temperature conditions. All parameters were the same except that
‘Temperature/Wavelength’ section was selected instead of CD spectra. Measurements were
taken from +4oC to +75oC. These data are analyzed by monitoring changes of the features of
CD profiles at a given wavelength.
3.2.6.3. Protein Homogeneity Levels and Size Determination
All Dynamic Light Scattering (DLS) measurements were accomplished with Zetasizer Nano
ZS (Malvern Instruments) at +4oC. DLS was used to monitor the homogeneity level and
oligomeric states of GPA1 in the solution. Data were represented as intensity, volume, mass
and number distribution of contributions from different components in the sample. Intensity is
the most sensitive factor related to the size distribution of the protein molecules in solution;
thus, it allowed us to get more dependable and consistent results on the heterogeneity of
solutions.
At the end of the measurements, hydrodynamic radius Hr and the polydispersity index (PDI) of
the protein in the solution were determined from the scattered intensity. Besides, the molecular
weight was estimated taking into consideration of the flexible and disordered structure for
GPA1 and GPA1t.
3.2.6.4. Sample Analysis: SDS-PAGE and Native-PAGE & Western Blotting
Sodium dodecyl sulfate (SDS) polyacrylamide gels were prepared at 12 % as which is described
in Appendix C. [65]. Depending on the well volume, either 10 μl or 20 μl protein samples were
loaded containing 6X SDS gel loading dye (125mM Tris-HCl pH 6.8, 2% SDS, 20% glycerol,
0.2% bromophenol blue, 10% (v/v) β-mercaptoethanol). The samples, then, were boiled at 95°C
for 5 minutes and loaded onto SDS-polyacrylamide gels having 5% of stacking part. If the case
was pellet, boiling took 10 minutes. Electrophoresis was applied as described in section 3.2.2.
Native polyacrylamide gels were prepared as given in appendix C. The gel does not contain
SDS as a reducing agent and there is no heat treatment, running takes place at 4oC with the gel
was run in 1x Native running buffer (can be found in Appendix F) at a constant current of 27
mA and increased to 30 mA after observing the move into separating (resolving) gel. Proteins
were visualized as described in section 3.2.2.
37
Western Blotting requires antibody (Anti-his) to confirm the existence of the target protein, in
our case it is the his-tag of GPA1. 12% SDS-PAGE was run in the same fashion with an
unstained ladder. Then, the gel was taken to prepare the western sandwich. PDVF Transfer
Membrane (Thermo) was activated in absolute MetOH for 1 minute. Blotting in TBS (can be
found in Appendix F) lasts until transferring the GPA1 onto PDVF membrane (0.45 μm) for 70
min. at 100 V. After the transfer, the membrane was washed with TBS and incubated with
blocking buffer (10 ml TBS-T, 5% nonfat dry milk) for overnight at 4oC. Next morning, the
membrane was washed twice with TBS-T and rinsed with TBS for 10 min. cycles at room
temperature. Then, the membrane is left with 15 ml TBS-T containing 3% BSA and 1:10.000
anti-His antibody for 1 hour at room temperature. At the end of 1 hour, the membrane is washed
with TBS. In order to obtain protein bands on the film, ECL solution (1 M Tris-HCl pH 8.8, 90
mM Cumeric acid, 250 μM Luminol and 1M H2O2) used for the detection of horseradish
peroxidase (HRP) enzyme activity was poured onto the membrane and washed with it for 5
min. H2O2 was added in the dark room. X-ray film was cut to the appropriate size dependent
on membrane size and the two were put into the cassette together. Incubation time depends on
the power of the luminescence signal. In general, for our experiments, it took around 2-3
minutes to observe the visible signal. X-Ray films were washed with KONIX Developer until
the bands become visible, then, fixer solution was used to retain the protein onto the film. As
the last step, the film was washed with tap water in order to remove excessive solutions on it.
3.2.7. Structural Analysis of Purified Protein: Bio-Small Angle X-ray Scattering (Bio-SAXS)
SAXS analyses are used for determination of structural parameters of biological
macromolecules and for developing shape models at low resolution. SAXS measurements were
carried out at the P12 Bio-SAXS beamline of EMBL at the Petra III facility (DESY, Hamburg,
Germany) operating either in batch or in on-line mode in connection with a chromatography
system and MALVERN instruments for monitoring absorbance (Abs), refractive index (RI),
and right angle light scattering (RALS). Data, in the s range 0.07 - 4.6 nm-1 (where s= 4sin/
, = 0.1 nm and 2 is the scattering angle) was measured using a 2D photon counting Pilatus
2M pixel X-ray detector (Dectris, Switzerland) placed at 3.1 m from the sample.
38
In the batch mode, 2 mg/ml GPA1 samples in Tris-HCl Buffer (50 mM Tris-HCl (pH: 7.5), 150
mM NaCl, 1 mM DTT, 0.5 % glycerol, 5 mM MgCl2) were measured in the presence of three
different nucleotides namely 50 mM GDP, 50 mM GTP, and 50 Mm GTPγS. Data were
collected with 1 sec (20 frames of 50 ms) exposure time and a flux of 1013 ph/s at the sample.
After normalization detector correction, buffer subtraction, concentration correction, radiation
damage control etc.) the scattering curves were used to obtain structural parameters such as the
radius of gyration (Rg), and maximum particle dimension (Dmax). In addition, the extrapolated
zero angle intensity I(0) is calculated in order to estimate the molecular mass (MM) relative to
BSA which is used as a reference.
For the in-line mode measurements, GPA1 samples in Tris Buffer (50 mM Tris-HCl (pH: 7.5),
150 mM NaCl, 1 mM DTT, 0.5 % glycerol, 5 mM MgCl2) containing 50 mM GDP were
injected onto a Superdex 200 10/300 SEC column connected to the multidetector system
(Malvern) integrated to the beamline. Approximately 2000 frames were collected directly from
the elution peaks at 0.25 ml/min flow rate and radiation damage was minimized by continuous
flow through micro-capillaries.
The PRIMUS software [66] in the ATSAS Suite at European Molecular Biology Laboratory
(EMBL), Hamburg Outstation was used to perform primary data reduction and analysis such
as beam intensity correction, background correction, buffer subtraction and concentration
normalization [67].
For batch measurements, molecular mass (MM) was estimated from the extrapolated forward
scattering I(0) in the Guinier region. It was also confirmed dividing the Porod volume by ~1.7
and volume of a 3D ab initio bead model (e.g. DAMMIF or DAMMIN) by ~2.0. On the other
hand, in line measurements with the MALVERN and triple detector array (TDA), three pieces
of information that all depend on concentration (c) were collected:
Absorbance (Abs) in the UV-Vis range: Abs= constant * E * c……………………………..1
Refractive Index (RI) : RI= constant * c* (dn/dc)………………….………2
Right Angle Scattering (RALS) : RALS= constant * c * MM * (dn/dc)2………….…3
39
‘E’ stands for the extinction coefficient at 280 nm and dn/dc is the increment in the RI with
concentration which is mostly equal to 0.150 ml/g for proteins. Molecular mass (MM) comes
exclusively from the RALS signal using the RI to estimate protein concentration and then this
value is used to estimate the MM from RALS signal.
I(0) and the radii of gyration (Rg) were evaluated using the Guinier approximation assuming
that at 0.4<Rg*s<1.3, the intensity is given by I(s) = I(0) exp(-(sRg)2/3). As reference protein
for molecular mass estimations, 5 mg/ml BSA is used in 25 Mm HEPES, pH: 8.0, 1 mM DTT
with 1 mM MgCl2. GNOM analysis was used to calculate the maximum dimension (Dmax) and
the pair distribution function (P(r)) [68]. Data from the total elution volume, collected in
different frames of exposure to X-rays, were analyzed. The most suitable blocks of 20-25
frames were chosen to determine so-called structural shape information. After GNOM analysis
of the blocks, the generated (.out) files can be used for producing low-resolution shape models
of proteins.
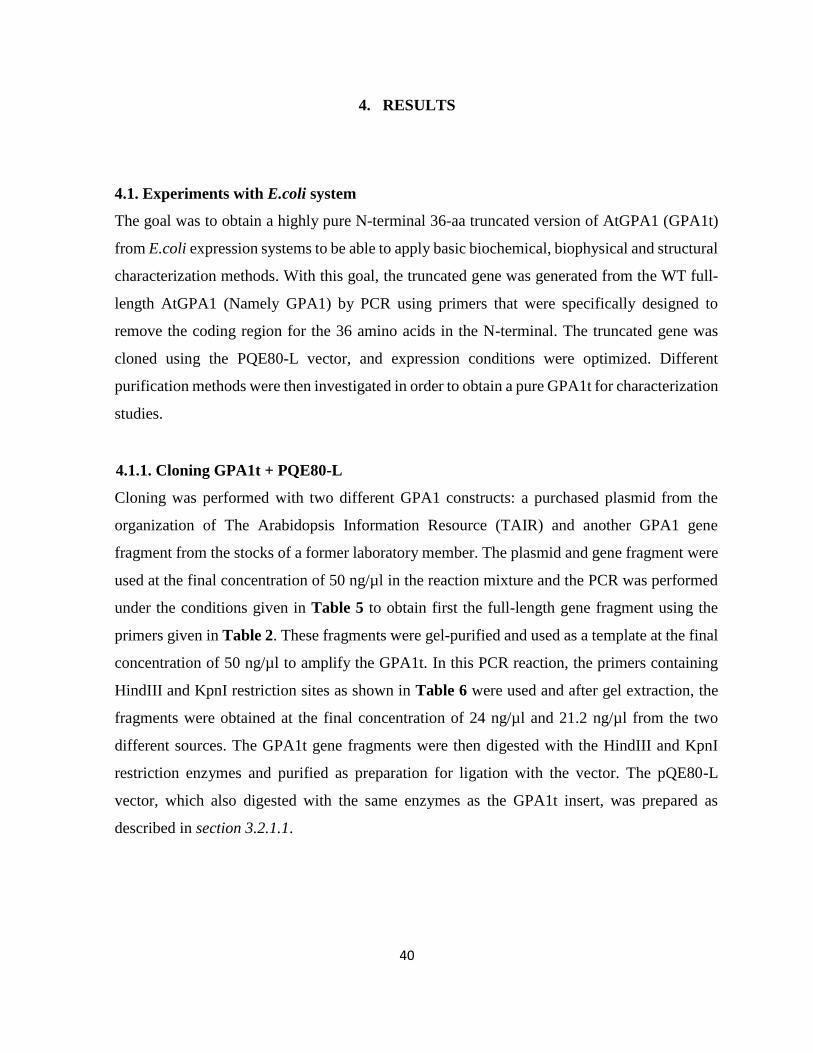
40
4. RESULTS
4.1. Experiments with E.coli system
The goal was to obtain a highly pure N-terminal 36-aa truncated version of AtGPA1 (GPA1t)
from E.coli expression systems to be able to apply basic biochemical, biophysical and structural
characterization methods. With this goal, the truncated gene was generated from the WT full-
length AtGPA1 (Namely GPA1) by PCR using primers that were specifically designed to
remove the coding region for the 36 amino acids in the N-terminal. The truncated gene was
cloned using the PQE80-L vector, and expression conditions were optimized. Different
purification methods were then investigated in order to obtain a pure GPA1t for characterization
studies.
4.1.1. Cloning GPA1t + PQE80-L
Cloning was performed with two different GPA1 constructs: a purchased plasmid from the
organization of The Arabidopsis Information Resource (TAIR) and another GPA1 gene
fragment from the stocks of a former laboratory member. The plasmid and gene fragment were
used at the final concentration of 50 ng/µl in the reaction mixture and the PCR was performed
under the conditions given in Table 5 to obtain first the full-length gene fragment using the
primers given in Table 2. These fragments were gel-purified and used as a template at the final
concentration of 50 ng/µl to amplify the GPA1t. In this PCR reaction, the primers containing
HindIII and KpnI restriction sites as shown in Table 6 were used and after gel extraction, the
fragments were obtained at the final concentration of 24 ng/µl and 21.2 ng/µl from the two
different sources. The GPA1t gene fragments were then digested with the HindIII and KpnI
restriction enzymes and purified as preparation for ligation with the vector. The pQE80-L
vector, which also digested with the same enzymes as the GPA1t insert, was prepared as
described in section 3.2.1.1.
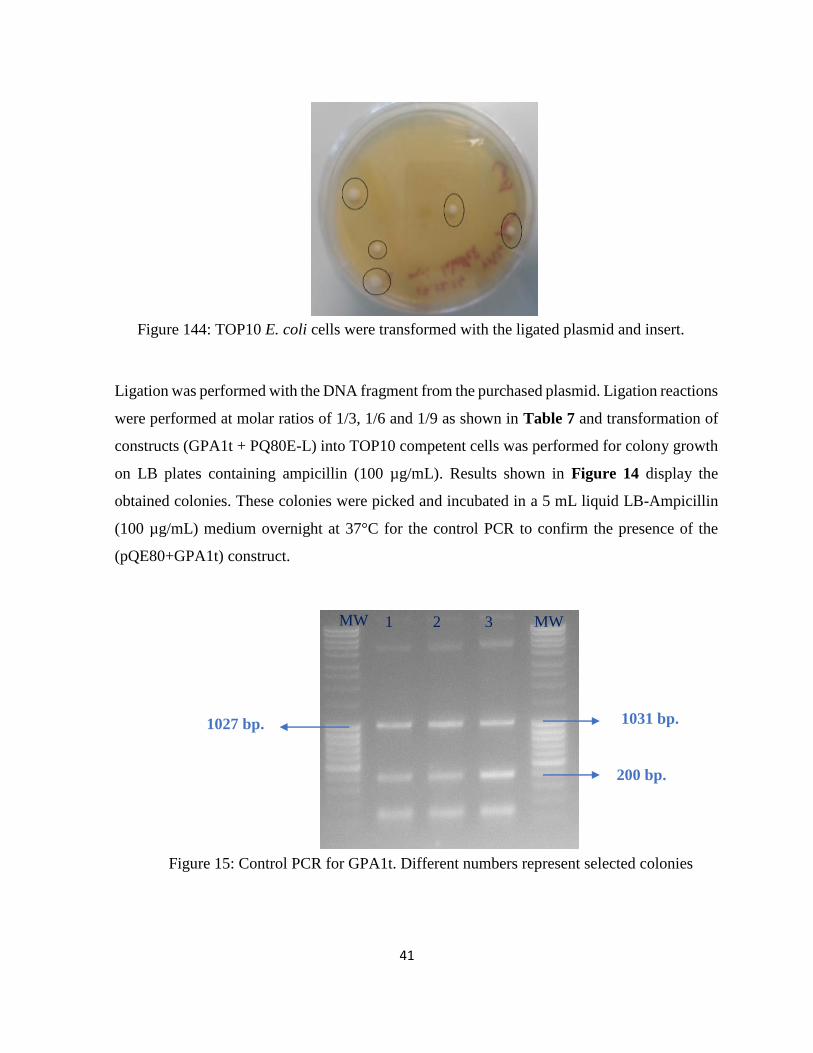
41
Figure 144: TOP10 E. coli cells were transformed with the ligated plasmid and insert.
Ligation was performed with the DNA fragment from the purchased plasmid. Ligation reactions
were performed at molar ratios of 1/3, 1/6 and 1/9 as shown in Table 7 and transformation of
constructs (GPA1t + PQ80E-L) into TOP10 competent cells was performed for colony growth
on LB plates containing ampicillin (100 µg/mL). Results shown in Figure 14 display the
obtained colonies. These colonies were picked and incubated in a 5 mL liquid LB-Ampicillin
(100 µg/mL) medium overnight at 37°C for the control PCR to confirm the presence of the
(pQE80+GPA1t) construct.
Figure 15: Control PCR for GPA1t. Different numbers represent selected colonies
1031 bp. 1027 bp.
200 bp.
MW 1 2 3 MW
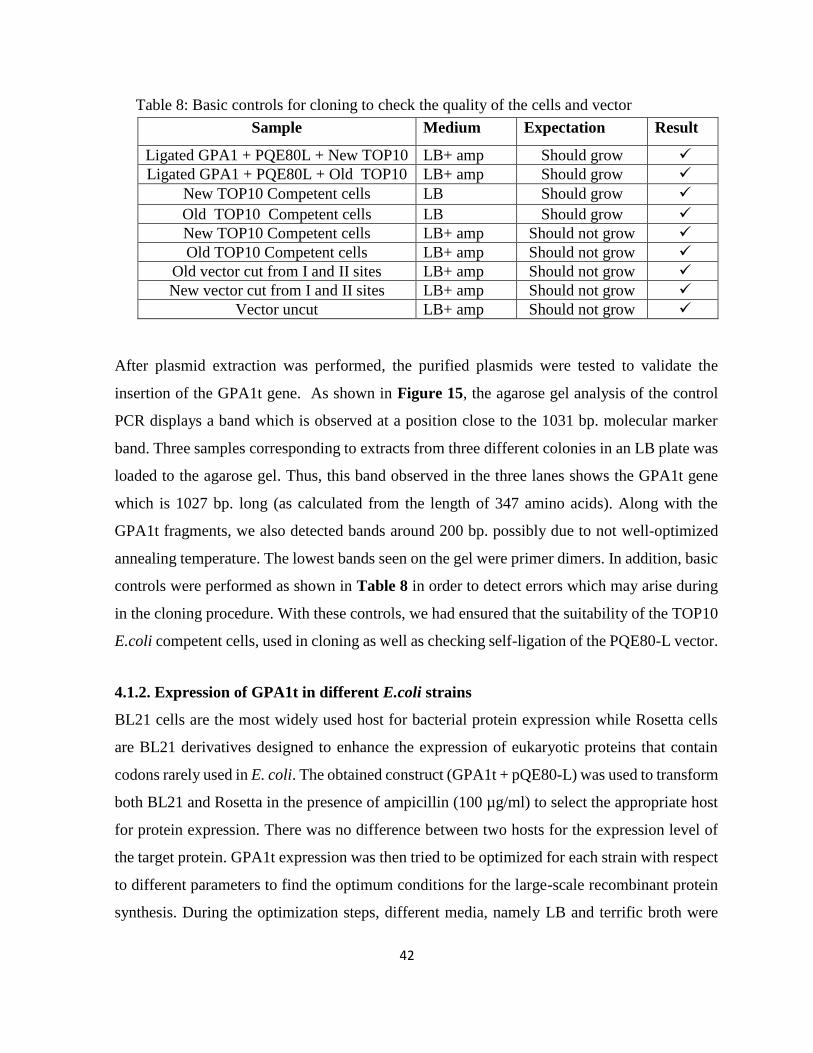
42
Table 8: Basic controls for cloning to check the quality of the cells and vector
After plasmid extraction was performed, the purified plasmids were tested to validate the
insertion of the GPA1t gene. As shown in Figure 15, the agarose gel analysis of the control
PCR displays a band which is observed at a position close to the 1031 bp. molecular marker
band. Three samples corresponding to extracts from three different colonies in an LB plate was
loaded to the agarose gel. Thus, this band observed in the three lanes shows the GPA1t gene
which is 1027 bp. long (as calculated from the length of 347 amino acids). Along with the
GPA1t fragments, we also detected bands around 200 bp. possibly due to not well-optimized
annealing temperature. The lowest bands seen on the gel were primer dimers. In addition, basic
controls were performed as shown in Table 8 in order to detect errors which may arise during
in the cloning procedure. With these controls, we had ensured that the suitability of the TOP10
E.coli competent cells, used in cloning as well as checking self-ligation of the PQE80-L vector.
4.1.2. Expression of GPA1t in different E.coli strains
BL21 cells are the most widely used host for bacterial protein expression while Rosetta cells
are BL21 derivatives designed to enhance the expression of eukaryotic proteins that contain
codons rarely used in E. coli. The obtained construct (GPA1t + pQE80-L) was used to transform
both BL21 and Rosetta in the presence of ampicillin (100 µg/ml) to select the appropriate host
for protein expression. There was no difference between two hosts for the expression level of
the target protein. GPA1t expression was then tried to be optimized for each strain with respect
to different parameters to find the optimum conditions for the large-scale recombinant protein
synthesis. During the optimization steps, different media, namely LB and terrific broth were
Sample Medium Expectation Result
Ligated GPA1 + PQE80L + New TOP10 LB+ amp Should grow
Ligated GPA1 + PQE80L + Old TOP10 LB+ amp Should grow
New TOP10 Competent cells LB Should grow
Old TOP10 Competent cells LB Should grow
New TOP10 Competent cells LB+ amp Should not grow
Old TOP10 Competent cells LB+ amp Should not grow
Old vector cut from I and II sites LB+ amp Should not grow
New vector cut from I and II sites LB+ amp Should not grow
Vector uncut LB+ amp Should not grow
43
used. Based on better expression levels in the LB medium, the effect of other parameters such
as IPTG concentration and temperature changes on the GPA1t synthesis were investigated in
this medium by other lab members. Rosetta cells are essentially BL21 with the added plasmid
pRARE coding for several rare codon tRNAs so that it comes at the cost of having an extra
plasmid in the strain. The expression of the extra plasmid is likely to put a bit more metabolic
burden in the cell compared to BL21 cells. Therefore, we had decided to continue for large-
scale expressions in BL21 cells. BL21 cells were grown in 5 ml LB overnight at 37oC with 300
rpm under constant shaking. Then, it was inoculated to a 2L LB medium. When OD: 600 was
measured around 0.8 induction was initiated by reducing temperature to 27oC and adding 0.7
mM IPTG for 7 hours.
4.1.3. Large-Scale Expression and Purification of GPA1t
After protein screening studies and optimized conditions by other lab members, large-scale 2L
BL21 E. coli cultures were grown for expression. At the end of 7 hours’ expression, bacterial
cells were centrifuged at 7000 rpm at 4oC for 30 min. for purification of GPA1t.
Lysis on 9 g pellet was carried out using 45 ml BugBuster TM Protein Extraction (w/5v) as
described in section 3.2.4.1. Nickel affinity chromatography was performed on 100 ml
supernatant in batch mode with step gradient. The slurry was loaded to a 20 ml plastic column
to collect the flow through. After washing the protein bound to resin three times with a 1X
purification buffer given in section 3.1.7.1., elution was started with elution buffer containing
increasing concentration of imidazole for each elution step. GPA1t eluted in all fractions up to
300 mM imidazole from Ni-NTA agarose. Resin with a 2 column volume (CV) elution buffer
containing 5 mM imidazole was incubated on the rotation table for 20 minutes. Next, 1 CV
eluates were collected six times with increasing imidazole concentration of 5 mM, 10 mM, 20
mM, 50 mM, 100 mM and 300 mM.
The SDS-PAGE results for the collected fractions are shown in Figure 16. There was no protein
band at around 40 kDa in the pellet as seen in lane P. so we concluded that GPA1t was a soluble
protein. In addition, the protein band with a molecular mass of ~55 kDa which was mainly co-
purified with GPA1t by other lab members was observed in the pellet. Flow through and three
wash steps resulted in the loss of protein because a 40 kDa protein band was monitored in both
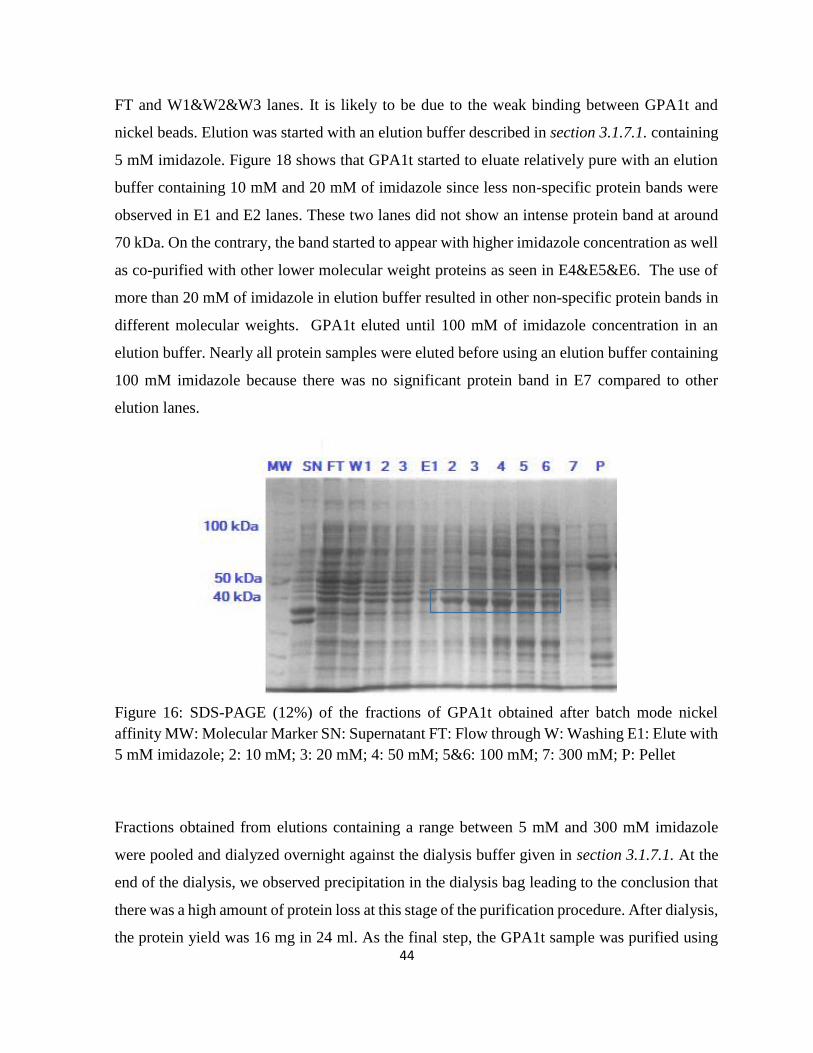
44
FT and W1&W2&W3 lanes. It is likely to be due to the weak binding between GPA1t and
nickel beads. Elution was started with an elution buffer described in section 3.1.7.1. containing
5 mM imidazole. Figure 18 shows that GPA1t started to eluate relatively pure with an elution
buffer containing 10 mM and 20 mM of imidazole since less non-specific protein bands were
observed in E1 and E2 lanes. These two lanes did not show an intense protein band at around
70 kDa. On the contrary, the band started to appear with higher imidazole concentration as well
as co-purified with other lower molecular weight proteins as seen in E4&E5&E6. The use of
more than 20 mM of imidazole in elution buffer resulted in other non-specific protein bands in
different molecular weights. GPA1t eluted until 100 mM of imidazole concentration in an
elution buffer. Nearly all protein samples were eluted before using an elution buffer containing
100 mM imidazole because there was no significant protein band in E7 compared to other
elution lanes.
Figure 16: SDS-PAGE (12%) of the fractions of GPA1t obtained after batch mode nickel
affinity MW: Molecular Marker SN: Supernatant FT: Flow through W: Washing E1: Elute with
5 mM imidazole; 2: 10 mM; 3: 20 mM; 4: 50 mM; 5&6: 100 mM; 7: 300 mM; P: Pellet
Fractions obtained from elutions containing a range between 5 mM and 300 mM imidazole
were pooled and dialyzed overnight against the dialysis buffer given in section 3.1.7.1. At the
end of the dialysis, we observed precipitation in the dialysis bag leading to the conclusion that
there was a high amount of protein loss at this stage of the purification procedure. After dialysis,
the protein yield was 16 mg in 24 ml. As the final step, the GPA1t sample was purified using
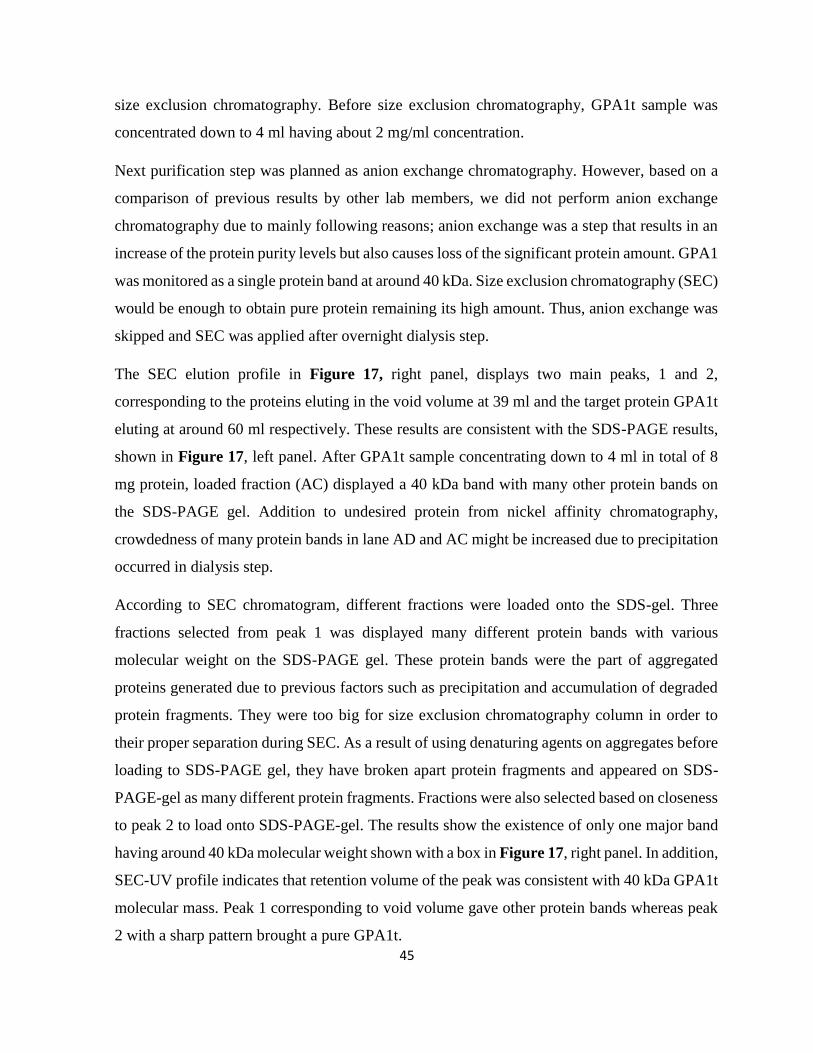
45
size exclusion chromatography. Before size exclusion chromatography, GPA1t sample was
concentrated down to 4 ml having about 2 mg/ml concentration.
Next purification step was planned as anion exchange chromatography. However, based on a
comparison of previous results by other lab members, we did not perform anion exchange
chromatography due to mainly following reasons; anion exchange was a step that results in an
increase of the protein purity levels but also causes loss of the significant protein amount. GPA1
was monitored as a single protein band at around 40 kDa. Size exclusion chromatography (SEC)
would be enough to obtain pure protein remaining its high amount. Thus, anion exchange was
skipped and SEC was applied after overnight dialysis step.
The SEC elution profile in Figure 17, right panel, displays two main peaks, 1 and 2,
corresponding to the proteins eluting in the void volume at 39 ml and the target protein GPA1t
eluting at around 60 ml respectively. These results are consistent with the SDS-PAGE results,
shown in Figure 17, left panel. After GPA1t sample concentrating down to 4 ml in total of 8
mg protein, loaded fraction (AC) displayed a 40 kDa band with many other protein bands on
the SDS-PAGE gel. Addition to undesired protein from nickel affinity chromatography,
crowdedness of many protein bands in lane AD and AC might be increased due to precipitation
occurred in dialysis step.
According to SEC chromatogram, different fractions were loaded onto the SDS-gel. Three
fractions selected from peak 1 was displayed many different protein bands with various
molecular weight on the SDS-PAGE gel. These protein bands were the part of aggregated
proteins generated due to previous factors such as precipitation and accumulation of degraded
protein fragments. They were too big for size exclusion chromatography column in order to
their proper separation during SEC. As a result of using denaturing agents on aggregates before
loading to SDS-PAGE gel, they have broken apart protein fragments and appeared on SDS-
PAGE-gel as many different protein fragments. Fractions were also selected based on closeness
to peak 2 to load onto SDS-PAGE-gel. The results show the existence of only one major band
having around 40 kDa molecular weight shown with a box in Figure 17, right panel. In addition,
SEC-UV profile indicates that retention volume of the peak was consistent with 40 kDa GPA1t
molecular mass. Peak 1 corresponding to void volume gave other protein bands whereas peak
2 with a sharp pattern brought a pure GPA1t.
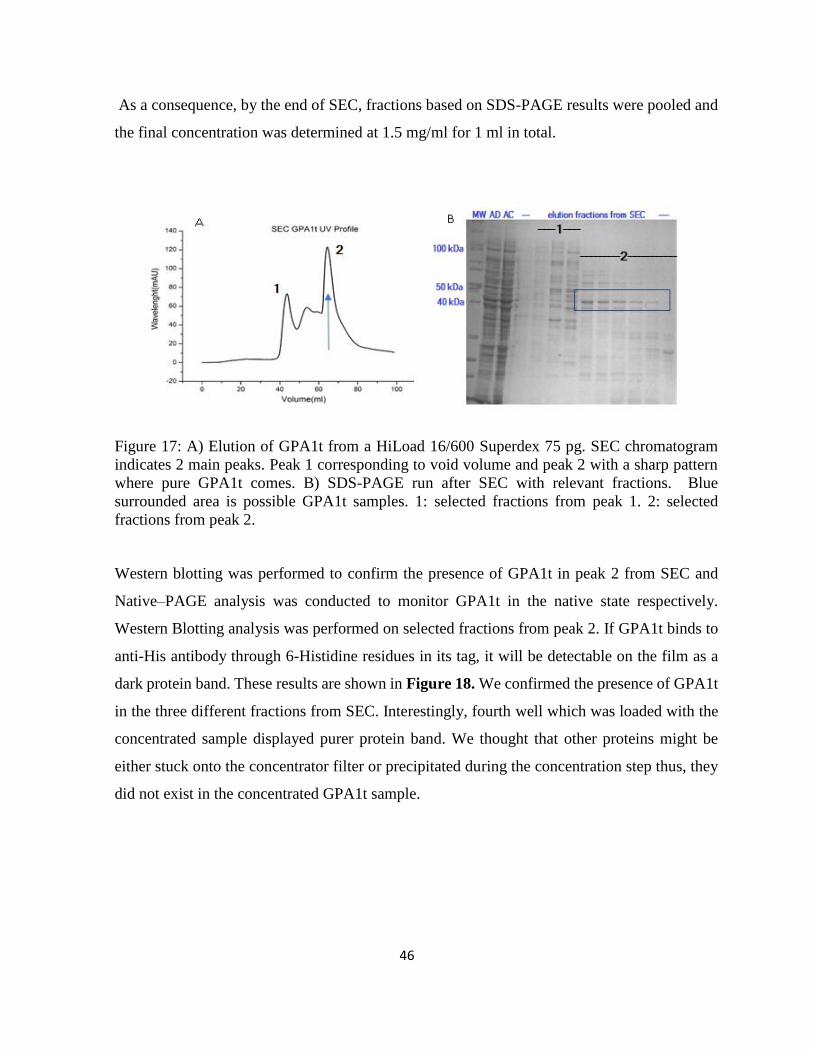
46
As a consequence, by the end of SEC, fractions based on SDS-PAGE results were pooled and
the final concentration was determined at 1.5 mg/ml for 1 ml in total.
Figure 17: A) Elution of GPA1t from a HiLoad 16/600 Superdex 75 pg. SEC chromatogram
indicates 2 main peaks. Peak 1 corresponding to void volume and peak 2 with a sharp pattern
where pure GPA1t comes. B) SDS-PAGE run after SEC with relevant fractions. Blue
surrounded area is possible GPA1t samples. 1: selected fractions from peak 1. 2: selected
fractions from peak 2.
Western blotting was performed to confirm the presence of GPA1t in peak 2 from SEC and
Native–PAGE analysis was conducted to monitor GPA1t in the native state respectively.
Western Blotting analysis was performed on selected fractions from peak 2. If GPA1t binds to
anti-His antibody through 6-Histidine residues in its tag, it will be detectable on the film as a
dark protein band. These results are shown in Figure 18. We confirmed the presence of GPA1t
in the three different fractions from SEC. Interestingly, fourth well which was loaded with the
concentrated sample displayed purer protein band. We thought that other proteins might be
either stuck onto the concentrator filter or precipitated during the concentration step thus, they
did not exist in the concentrated GPA1t sample.
47
Figure 18: A) MW: Molecular Marker B) Western blotting of different fractions of GPA1t.
1&2&3: Fractions from peak 2, SEC. 4: Final concentrated sample. C) Native-PAGE analysis
on different steps of purification. Ni-NTA: E4 Fraction from affinity chromatography. SEC:
Fraction from SEC. BSA: Bovine Serum Albumin as a reference protein for molecular weight.
Native gel was run to monitor the possible aggregation or oligomers of GPA1t. As we do not
use the molecular ladder in Native-PAGE, BSA was used as a reference molecular marker. In
addition, a sample from nickel affinity was run to see the difference of GPA1t samples.
Although the results are difficult to interpret there is only one main band in SEC fraction
compared to Ni-NTA fraction containing many other proteins. Interestingly, it gives only one
protein band with a 40 kDa weight in native conditions while we observed a few protein bands
for pure GPA1 in native state.
Because our purification route was not reproducible we could not manage to obtain enough
protein, which was relatively pure compared to previous purification trials by other lab
members, in order to continue with various characterization studies such as small angle X-ray
scattering measurement. It was observed many times during the purification procedure that
either GPA1t was lost by the end of the purification or did not purify properly because of co-
purified proteins (data not shown).
The results above are the only successful purification trial in order to continue preliminary
characterization studies such as DLS and CD as shown below. Unfortunately, procedure was
not reproducible and we could not be able to produce the protein for another time.
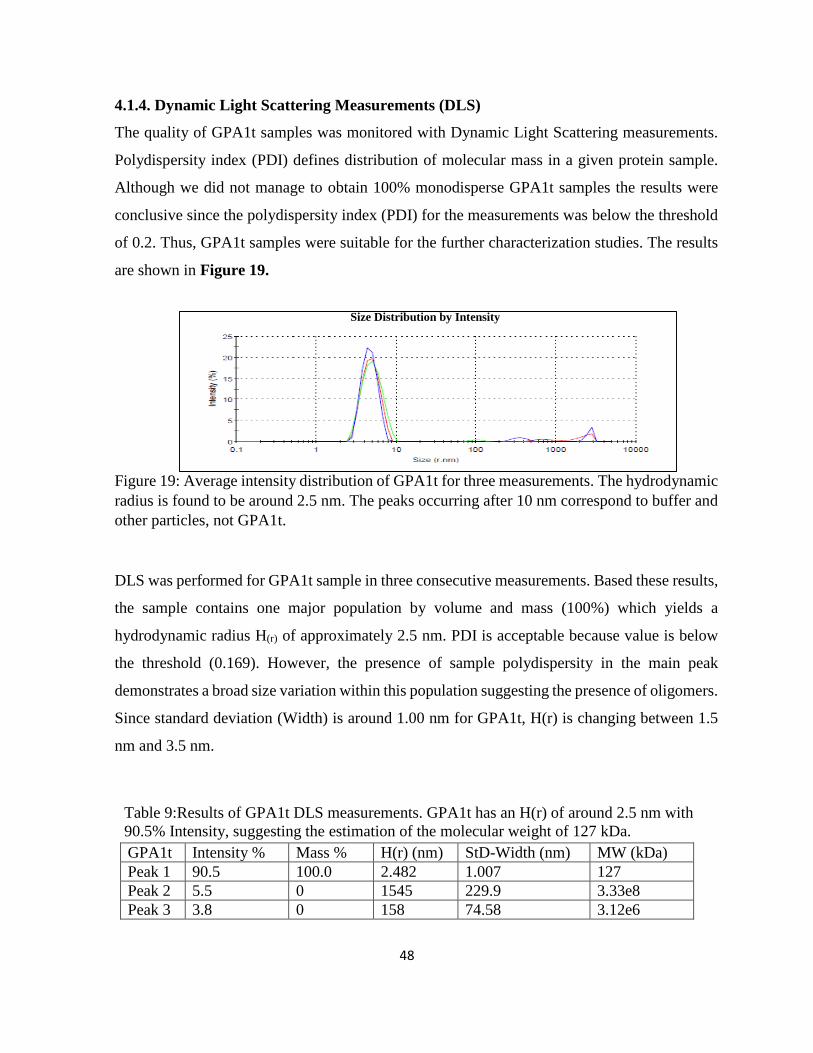
48
4.1.4. Dynamic Light Scattering Measurements (DLS)
The quality of GPA1t samples was monitored with Dynamic Light Scattering measurements.
Polydispersity index (PDI) defines distribution of molecular mass in a given protein sample.
Although we did not manage to obtain 100% monodisperse GPA1t samples the results were
conclusive since the polydispersity index (PDI) for the measurements was below the threshold
of 0.2. Thus, GPA1t samples were suitable for the further characterization studies. The results
are shown in Figure 19.
Figure 19: Average intensity distribution of GPA1t for three measurements. The hydrodynamic
radius is found to be around 2.5 nm. The peaks occurring after 10 nm correspond to buffer and
other particles, not GPA1t.
DLS was performed for GPA1t sample in three consecutive measurements. Based these results,
the sample contains one major population by volume and mass (100%) which yields a
hydrodynamic radius H(r) of approximately 2.5 nm. PDI is acceptable because value is below
the threshold (0.169). However, the presence of sample polydispersity in the main peak
demonstrates a broad size variation within this population suggesting the presence of oligomers.
Since standard deviation (Width) is around 1.00 nm for GPA1t, H(r) is changing between 1.5
nm and 3.5 nm.
Table 9:Results of GPA1t DLS measurements. GPA1t has an H(r) of around 2.5 nm with
90.5% Intensity, suggesting the estimation of the molecular weight of 127 kDa.
GPA1t Intensity % Mass % H(r) (nm) StD-Width (nm) MW (kDa)
Peak 1 90.5 100.0 2.482 1.007 127
Peak 2 5.5 0 1545 229.9 3.33e8
Peak 3 3.8 0 158 74.58 3.12e6
Size Distribution by Intensity
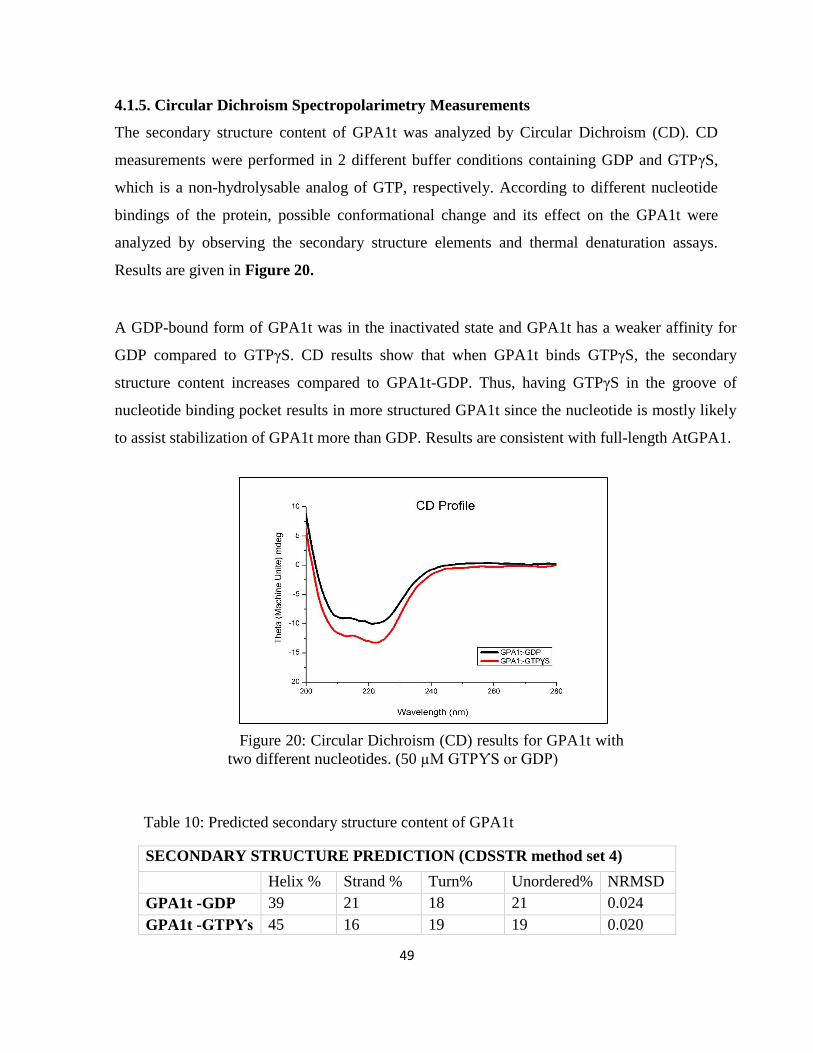
49
4.1.5. Circular Dichroism Spectropolarimetry Measurements
The secondary structure content of GPA1t was analyzed by Circular Dichroism (CD). CD
measurements were performed in 2 different buffer conditions containing GDP and GTPγS,
which is a non-hydrolysable analog of GTP, respectively. According to different nucleotide
bindings of the protein, possible conformational change and its effect on the GPA1t were
analyzed by observing the secondary structure elements and thermal denaturation assays.
Results are given in Figure 20.
A GDP-bound form of GPA1t was in the inactivated state and GPA1t has a weaker affinity for
GDP compared to GTPγS. CD results show that when GPA1t binds GTPγS, the secondary
structure content increases compared to GPA1t-GDP. Thus, having GTPγS in the groove of
nucleotide binding pocket results in more structured GPA1t since the nucleotide is mostly likely
to assist stabilization of GPA1t more than GDP. Results are consistent with full-length AtGPA1.
Figure 20: Circular Dichroism (CD) results for GPA1t with
two different nucleotides. (50 µM GTPƳS or GDP)
Table 10: Predicted secondary structure content of GPA1t
SECONDARY STRUCTURE PREDICTION (CDSSTR method set 4)
Helix % Strand % Turn% Unordered% NRMSD
GPA1t -GDP 39 21 18 21 0.024
GPA1t -GTPƳs 45 16 19 19 0.020
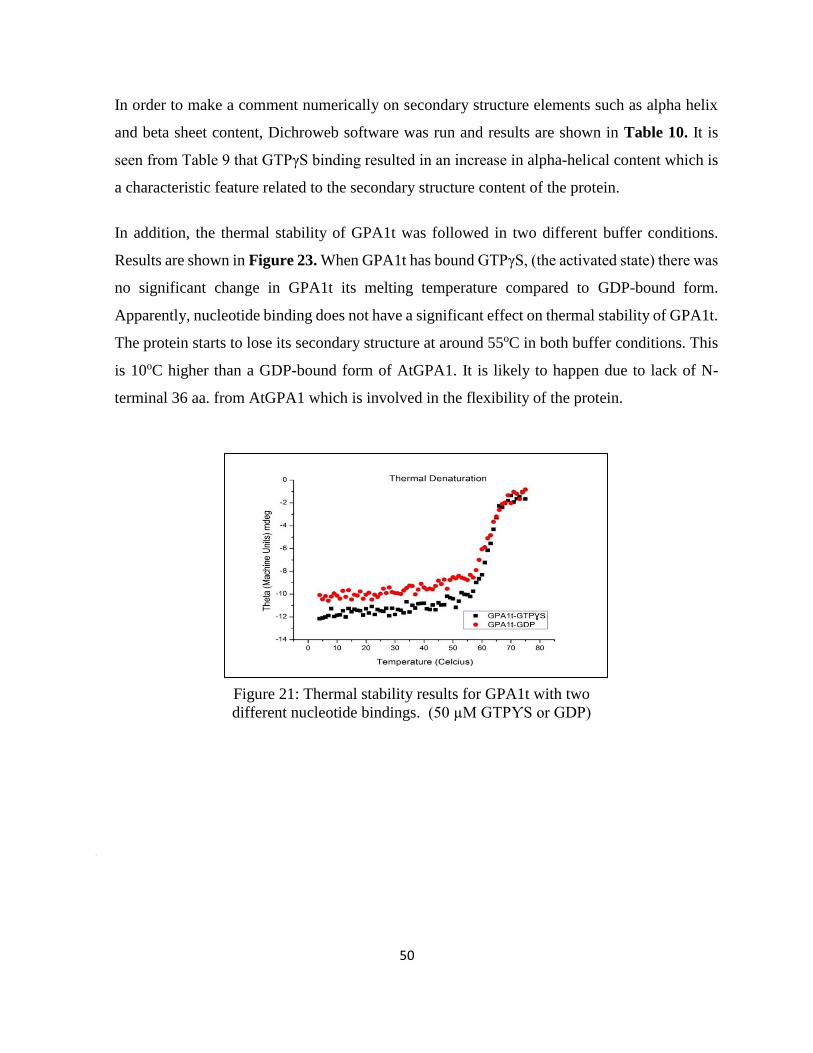
50
In order to make a comment numerically on secondary structure elements such as alpha helix
and beta sheet content, Dichroweb software was run and results are shown in Table 10. It is
seen from Table 9 that GTPγS binding resulted in an increase in alpha-helical content which is
a characteristic feature related to the secondary structure content of the protein.
In addition, the thermal stability of GPA1t was followed in two different buffer conditions.
Results are shown in Figure 23. When GPA1t has bound GTPγS, (the activated state) there was
no significant change in GPA1t its melting temperature compared to GDP-bound form.
Apparently, nucleotide binding does not have a significant effect on thermal stability of GPA1t.
The protein starts to lose its secondary structure at around 55oC in both buffer conditions. This
is 10oC higher than a GDP-bound form of AtGPA1. It is likely to happen due to lack of N-
terminal 36 aa. from AtGPA1 which is involved in the flexibility of the protein.
Figure 21: Thermal stability results for GPA1t with two
different nucleotide bindings. (50 µM GTPƳS or GDP)
O
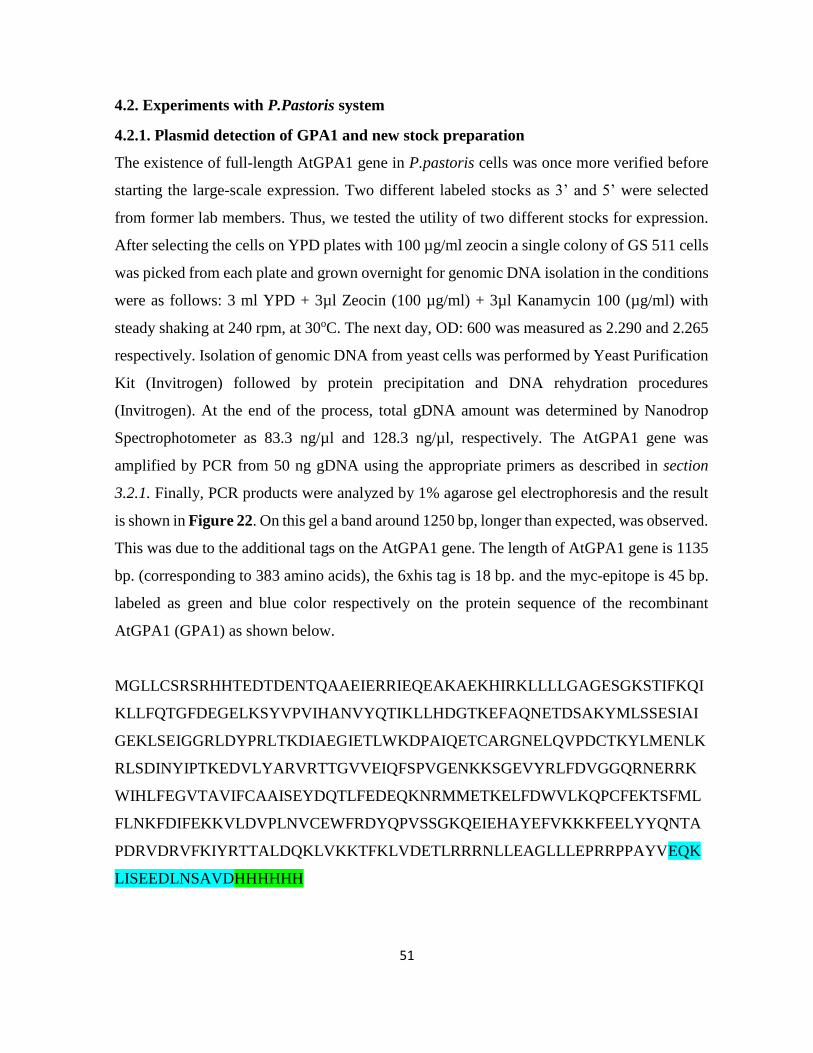
51
4.2. Experiments with P.Pastoris system
4.2.1. Plasmid detection of GPA1 and new stock preparation
The existence of full-length AtGPA1 gene in P.pastoris cells was once more verified before
starting the large-scale expression. Two different labeled stocks as 3’ and 5’ were selected
from former lab members. Thus, we tested the utility of two different stocks for expression.
After selecting the cells on YPD plates with 100 µg/ml zeocin a single colony of GS 511 cells
was picked from each plate and grown overnight for genomic DNA isolation in the conditions
were as follows: 3 ml YPD + 3µl Zeocin (100 µg/ml) + 3µl Kanamycin 100 (µg/ml) with
steady shaking at 240 rpm, at 30oC. The next day, OD: 600 was measured as 2.290 and 2.265
respectively. Isolation of genomic DNA from yeast cells was performed by Yeast Purification
Kit (Invitrogen) followed by protein precipitation and DNA rehydration procedures
(Invitrogen). At the end of the process, total gDNA amount was determined by Nanodrop
Spectrophotometer as 83.3 ng/µl and 128.3 ng/µl, respectively. The AtGPA1 gene was
amplified by PCR from 50 ng gDNA using the appropriate primers as described in section
3.2.1. Finally, PCR products were analyzed by 1% agarose gel electrophoresis and the result
is shown in Figure 22. On this gel a band around 1250 bp, longer than expected, was observed.
This was due to the additional tags on the AtGPA1 gene. The length of AtGPA1 gene is 1135
bp. (corresponding to 383 amino acids), the 6xhis tag is 18 bp. and the myc-epitope is 45 bp.
labeled as green and blue color respectively on the protein sequence of the recombinant
AtGPA1 (GPA1) as shown below.
MGLLCSRSRHHTEDTDENTQAAEIERRIEQEAKAEKHIRKLLLLGAGESGKSTIFKQI
KLLFQTGFDEGELKSYVPVIHANVYQTIKLLHDGTKEFAQNETDSAKYMLSSESIAI
GEKLSEIGGRLDYPRLTKDIAEGIETLWKDPAIQETCARGNELQVPDCTKYLMENLK
RLSDINYIPTKEDVLYARVRTTGVVEIQFSPVGENKKSGEVYRLFDVGGQRNERRK
WIHLFEGVTAVIFCAAISEYDQTLFEDEQKNRMMETKELFDWVLKQPCFEKTSFML
FLNKFDIFEKKVLDVPLNVCEWFRDYQPVSSGKQEIEHAYEFVKKKFEELYYQNTA
PDRVDRVFKIYRTTALDQKLVKKTFKLVDETLRRRNLLEAGLLLEPRRPPAYVEQK
LISEEDLNSAVDHHHHHH
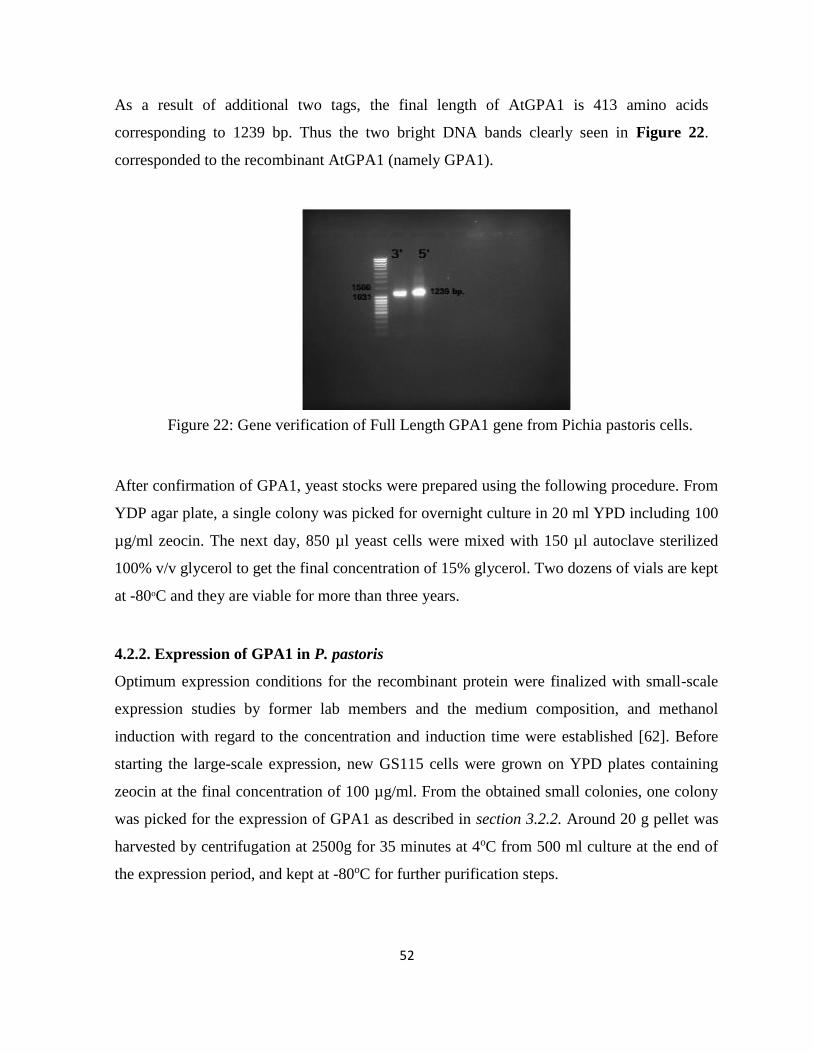
52
As a result of additional two tags, the final length of AtGPA1 is 413 amino acids
corresponding to 1239 bp. Thus the two bright DNA bands clearly seen in Figure 22.
corresponded to the recombinant AtGPA1 (namely GPA1).
Figure 22: Gene verification of Full Length GPA1 gene from Pichia pastoris cells.
After confirmation of GPA1, yeast stocks were prepared using the following procedure. From
YDP agar plate, a single colony was picked for overnight culture in 20 ml YPD including 100
µg/ml zeocin. The next day, 850 µl yeast cells were mixed with 150 µl autoclave sterilized
100% v/v glycerol to get the final concentration of 15% glycerol. Two dozens of vials are kept
at -80oC and they are viable for more than three years.
4.2.2. Expression of GPA1 in P. pastoris
Optimum expression conditions for the recombinant protein were finalized with small-scale
expression studies by former lab members and the medium composition, and methanol
induction with regard to the concentration and induction time were established [62]. Before
starting the large-scale expression, new GS115 cells were grown on YPD plates containing
zeocin at the final concentration of 100 µg/ml. From the obtained small colonies, one colony
was picked for the expression of GPA1 as described in section 3.2.2. Around 20 g pellet was
harvested by centrifugation at 2500g for 35 minutes at 4oC from 500 ml culture at the end of
the expression period, and kept at -80oC for further purification steps.
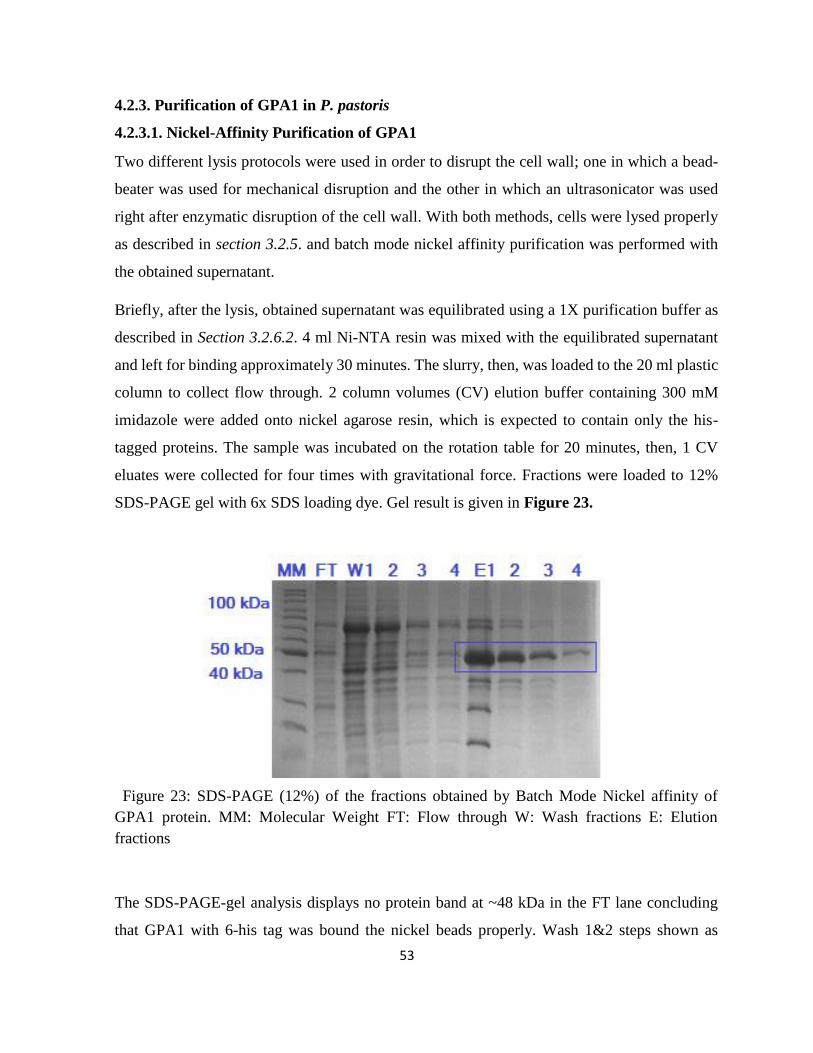
53
4.2.3. Purification of GPA1 in P. pastoris
4.2.3.1. Nickel-Affinity Purification of GPA1
Two different lysis protocols were used in order to disrupt the cell wall; one in which a bead-
beater was used for mechanical disruption and the other in which an ultrasonicator was used
right after enzymatic disruption of the cell wall. With both methods, cells were lysed properly
as described in section 3.2.5. and batch mode nickel affinity purification was performed with
the obtained supernatant.
Briefly, after the lysis, obtained supernatant was equilibrated using a 1X purification buffer as
described in Section 3.2.6.2. 4 ml Ni-NTA resin was mixed with the equilibrated supernatant
and left for binding approximately 30 minutes. The slurry, then, was loaded to the 20 ml plastic
column to collect flow through. 2 column volumes (CV) elution buffer containing 300 mM
imidazole were added onto nickel agarose resin, which is expected to contain only the his-
tagged proteins. The sample was incubated on the rotation table for 20 minutes, then, 1 CV
eluates were collected for four times with gravitational force. Fractions were loaded to 12%
SDS-PAGE gel with 6x SDS loading dye. Gel result is given in Figure 23.
Figure 23: SDS-PAGE (12%) of the fractions obtained by Batch Mode Nickel affinity of
GPA1 protein. MM: Molecular Weight FT: Flow through W: Wash fractions E: Elution
fractions
The SDS-PAGE-gel analysis displays no protein band at ~48 kDa in the FT lane concluding
that GPA1 with 6-his tag was bound the nickel beads properly. Wash 1&2 steps shown as
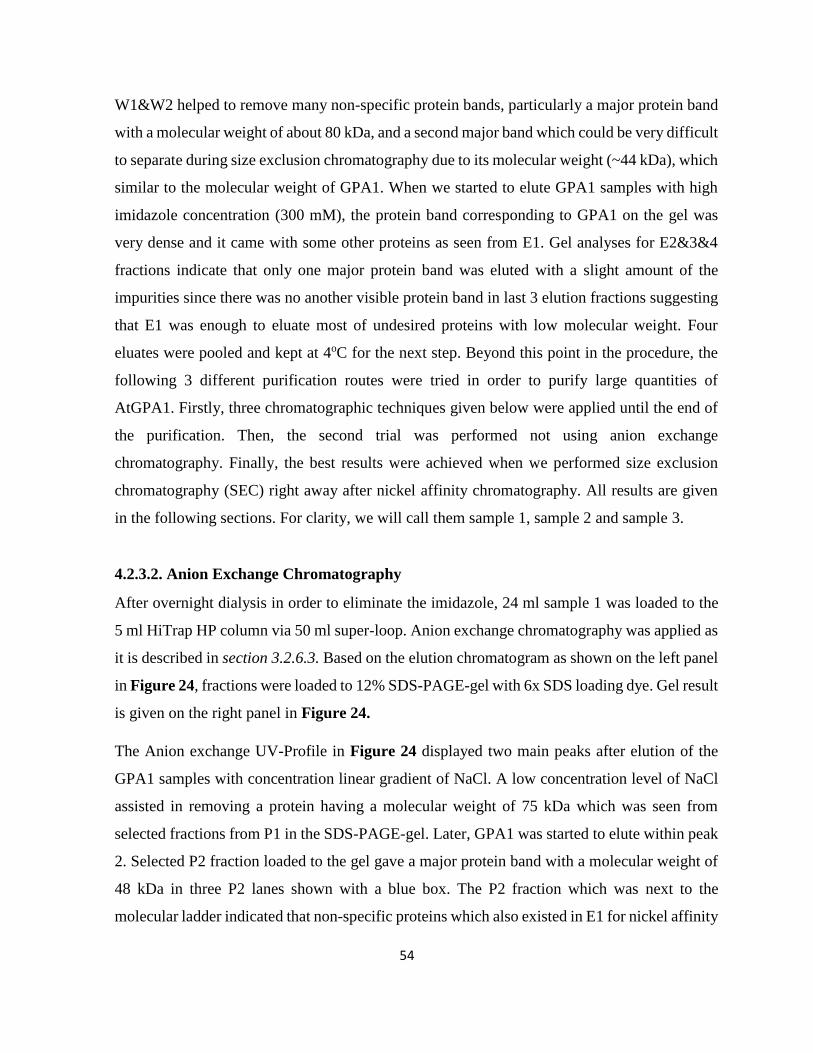
54
W1&W2 helped to remove many non-specific protein bands, particularly a major protein band
with a molecular weight of about 80 kDa, and a second major band which could be very difficult
to separate during size exclusion chromatography due to its molecular weight (~44 kDa), which
similar to the molecular weight of GPA1. When we started to elute GPA1 samples with high
imidazole concentration (300 mM), the protein band corresponding to GPA1 on the gel was
very dense and it came with some other proteins as seen from E1. Gel analyses for E2&3&4
fractions indicate that only one major protein band was eluted with a slight amount of the
impurities since there was no another visible protein band in last 3 elution fractions suggesting
that E1 was enough to eluate most of undesired proteins with low molecular weight. Four
eluates were pooled and kept at 4oC for the next step. Beyond this point in the procedure, the
following 3 different purification routes were tried in order to purify large quantities of
AtGPA1. Firstly, three chromatographic techniques given below were applied until the end of
the purification. Then, the second trial was performed not using anion exchange
chromatography. Finally, the best results were achieved when we performed size exclusion
chromatography (SEC) right away after nickel affinity chromatography. All results are given
in the following sections. For clarity, we will call them sample 1, sample 2 and sample 3.
4.2.3.2. Anion Exchange Chromatography
After overnight dialysis in order to eliminate the imidazole, 24 ml sample 1 was loaded to the
5 ml HiTrap HP column via 50 ml super-loop. Anion exchange chromatography was applied as
it is described in section 3.2.6.3. Based on the elution chromatogram as shown on the left panel
in Figure 24, fractions were loaded to 12% SDS-PAGE-gel with 6x SDS loading dye. Gel result
is given on the right panel in Figure 24.
The Anion exchange UV-Profile in Figure 24 displayed two main peaks after elution of the
GPA1 samples with concentration linear gradient of NaCl. A low concentration level of NaCl
assisted in removing a protein having a molecular weight of 75 kDa which was seen from
selected fractions from P1 in the SDS-PAGE-gel. Later, GPA1 was started to elute within peak
2. Selected P2 fraction loaded to the gel gave a major protein band with a molecular weight of
48 kDa in three P2 lanes shown with a blue box. The P2 fraction which was next to the
molecular ladder indicated that non-specific proteins which also existed in E1 for nickel affinity
55
chromatography co-purified with GPA1. All P2 fractions based on SDS-PAGE analysis were
pooled for next chromatography technique, SEC.
Figure 24: Left panel: Anion exchange chromatogram indicates that there are 2 main peaks that
peak 2 (P2) contains GPA1. Right Panel: SDS-PAGE-gel with collected fractions. MW:
Molecular Marker P1: Selected fractions from first peak P2: Selected fractions from second
(highest) peak.
4.2.3.3. Size Exclusion Chromatography
Size exclusion chromatography (SEC) was performed as a last chromatography technique to
achieve both the highest purity levels of GPA1 and to estimate its molecular weight via
calibrated different types of columns. Before sample loading to the column in each experiment,
both pooled anion-exchange fractions (Sample 1) and samples pooled directly after nickel
affinity were concentrated at 3250 rpm for 10 minutes at 4oC until reaching down to the desired
volume of 5 ml. SEC was applied as it is described in section 3.2.6.2. Three different sets of
results of UV absorbance profile and the SDS-PAGE gel images are shown in the following
figures according to prior steps of the sample.
It is shown in Figure 25 that the amount of protein is very low after 3 different chromatography
steps including the use of HiLoad 16/600 Superdex 200 pg. column. However, it was a pure
protein with a molecular weight about 48 kDa without any other visible protein bands as seen
with the selected fractions (F1, F2, and F3) selected from the highest point of the peak from
SEC-UV profile.
P1
P2
P1
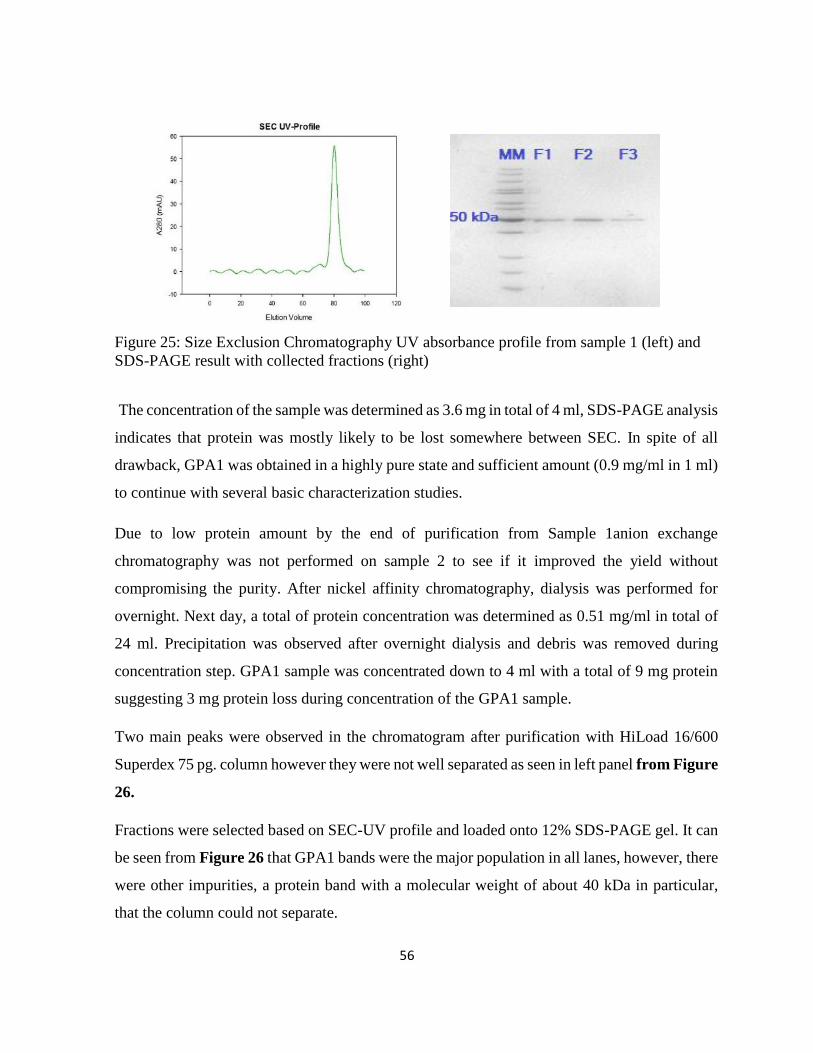
56
Figure 25: Size Exclusion Chromatography UV absorbance profile from sample 1 (left) and
SDS-PAGE result with collected fractions (right)
The concentration of the sample was determined as 3.6 mg in total of 4 ml, SDS-PAGE analysis
indicates that protein was mostly likely to be lost somewhere between SEC. In spite of all
drawback, GPA1 was obtained in a highly pure state and sufficient amount (0.9 mg/ml in 1 ml)
to continue with several basic characterization studies.
Due to low protein amount by the end of purification from Sample 1anion exchange
chromatography was not performed on sample 2 to see if it improved the yield without
compromising the purity. After nickel affinity chromatography, dialysis was performed for
overnight. Next day, a total of protein concentration was determined as 0.51 mg/ml in total of
24 ml. Precipitation was observed after overnight dialysis and debris was removed during
concentration step. GPA1 sample was concentrated down to 4 ml with a total of 9 mg protein
suggesting 3 mg protein loss during concentration of the GPA1 sample.
Two main peaks were observed in the chromatogram after purification with HiLoad 16/600
Superdex 75 pg. column however they were not well separated as seen in left panel from Figure
26.
Fractions were selected based on SEC-UV profile and loaded onto 12% SDS-PAGE gel. It can
be seen from Figure 26 that GPA1 bands were the major population in all lanes, however, there
were other impurities, a protein band with a molecular weight of about 40 kDa in particular,
that the column could not separate.
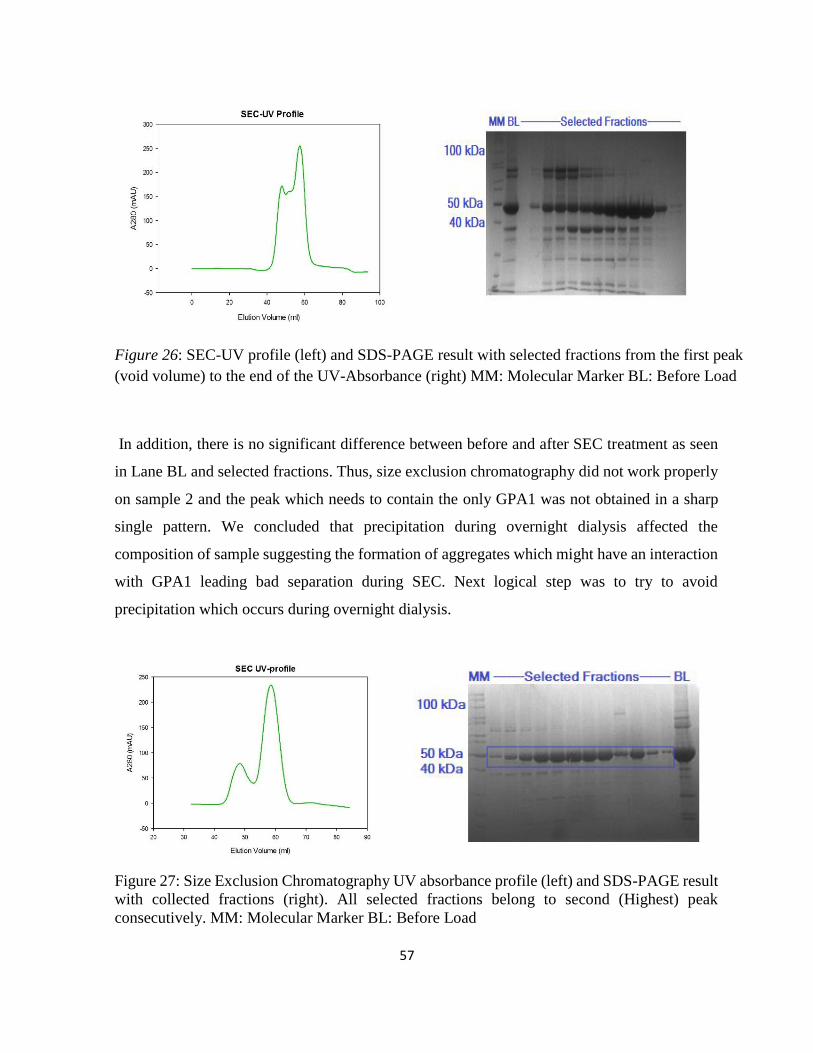
57
Figure 26: SEC-UV profile (left) and SDS-PAGE result with selected fractions from the first peak
(void volume) to the end of the UV-Absorbance (right) MM: Molecular Marker BL: Before Load
In addition, there is no significant difference between before and after SEC treatment as seen
in Lane BL and selected fractions. Thus, size exclusion chromatography did not work properly
on sample 2 and the peak which needs to contain the only GPA1 was not obtained in a sharp
single pattern. We concluded that precipitation during overnight dialysis affected the
composition of sample suggesting the formation of aggregates which might have an interaction
with GPA1 leading bad separation during SEC. Next logical step was to try to avoid
precipitation which occurs during overnight dialysis.
Figure 27: Size Exclusion Chromatography UV absorbance profile (left) and SDS-PAGE result
with collected fractions (right). All selected fractions belong to second (Highest) peak
consecutively. MM: Molecular Marker BL: Before Load
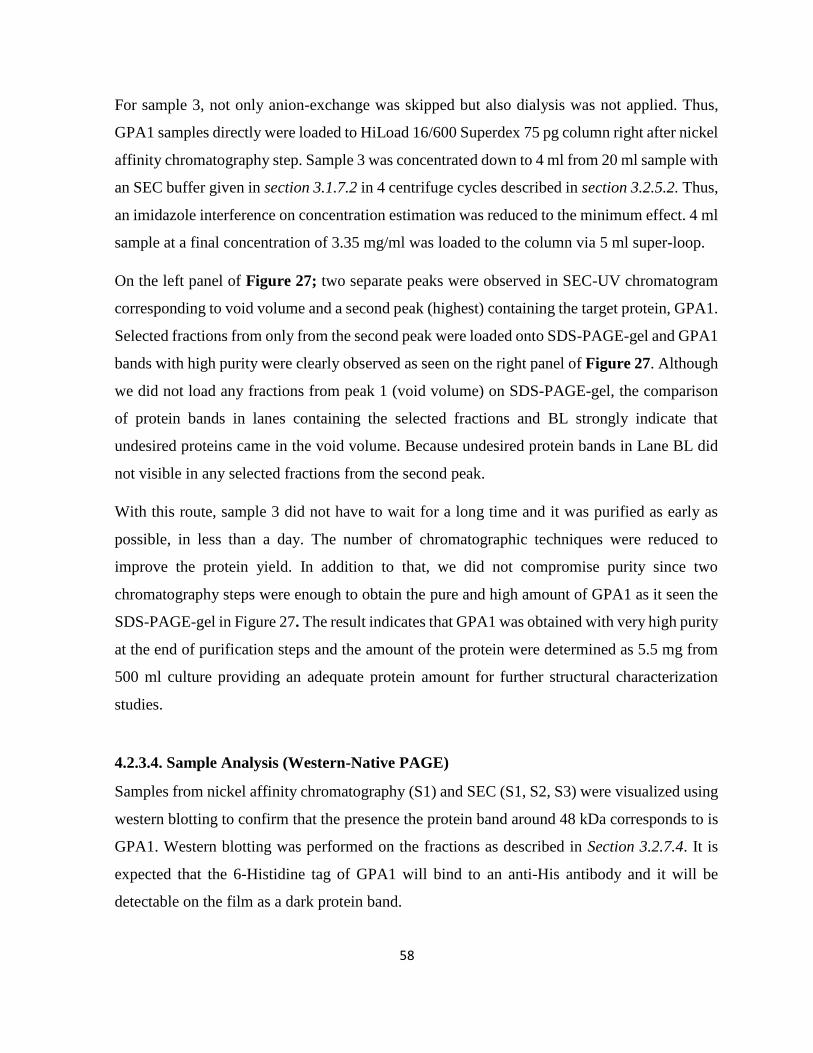
58
For sample 3, not only anion-exchange was skipped but also dialysis was not applied. Thus,
GPA1 samples directly were loaded to HiLoad 16/600 Superdex 75 pg column right after nickel
affinity chromatography step. Sample 3 was concentrated down to 4 ml from 20 ml sample with
an SEC buffer given in section 3.1.7.2 in 4 centrifuge cycles described in section 3.2.5.2. Thus,
an imidazole interference on concentration estimation was reduced to the minimum effect. 4 ml
sample at a final concentration of 3.35 mg/ml was loaded to the column via 5 ml super-loop.
On the left panel of Figure 27; two separate peaks were observed in SEC-UV chromatogram
corresponding to void volume and a second peak (highest) containing the target protein, GPA1.
Selected fractions from only from the second peak were loaded onto SDS-PAGE-gel and GPA1
bands with high purity were clearly observed as seen on the right panel of Figure 27. Although
we did not load any fractions from peak 1 (void volume) on SDS-PAGE-gel, the comparison
of protein bands in lanes containing the selected fractions and BL strongly indicate that
undesired proteins came in the void volume. Because undesired protein bands in Lane BL did
not visible in any selected fractions from the second peak.
With this route, sample 3 did not have to wait for a long time and it was purified as early as
possible, in less than a day. The number of chromatographic techniques were reduced to
improve the protein yield. In addition to that, we did not compromise purity since two
chromatography steps were enough to obtain the pure and high amount of GPA1 as it seen the
SDS-PAGE-gel in Figure 27. The result indicates that GPA1 was obtained with very high purity
at the end of purification steps and the amount of the protein were determined as 5.5 mg from
500 ml culture providing an adequate protein amount for further structural characterization
studies.
4.2.3.4. Sample Analysis (Western-Native PAGE)
Samples from nickel affinity chromatography (S1) and SEC (S1, S2, S3) were visualized using
western blotting to confirm that the presence the protein band around 48 kDa corresponds to is
GPA1. Western blotting was performed on the fractions as described in Section 3.2.7.4. It is
expected that the 6-Histidine tag of GPA1 will bind to an anti-His antibody and it will be
detectable on the film as a dark protein band.
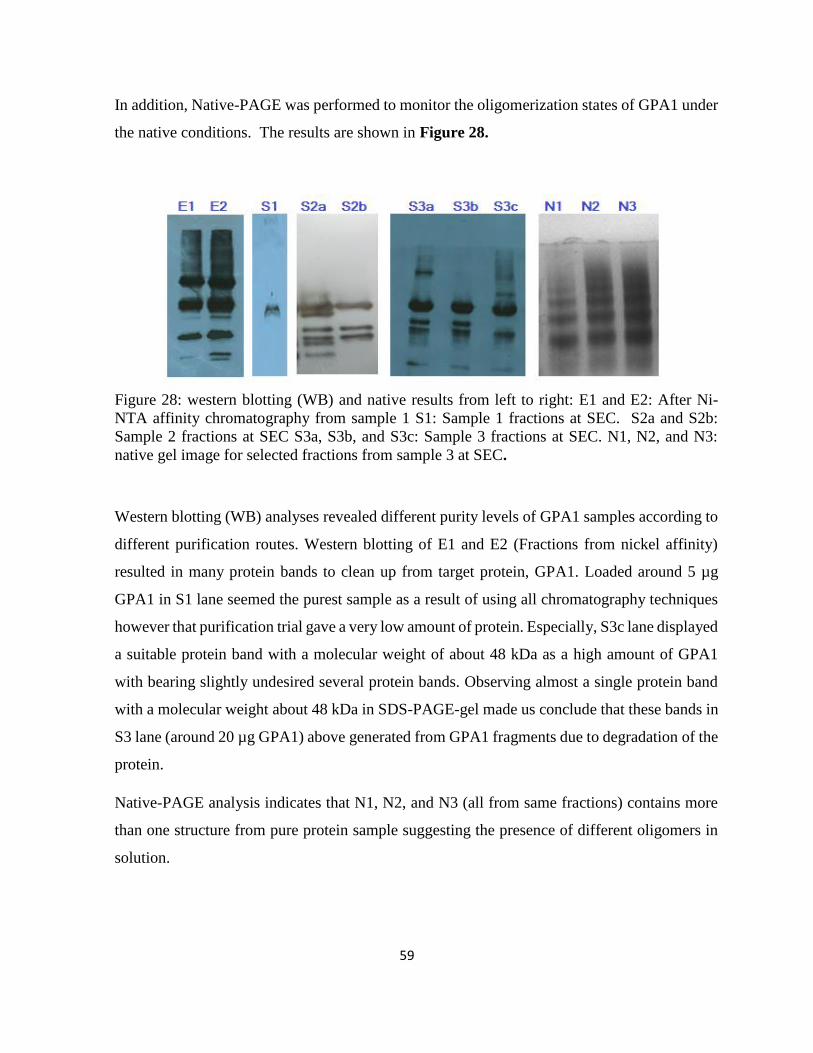
59
In addition, Native-PAGE was performed to monitor the oligomerization states of GPA1 under
the native conditions. The results are shown in Figure 28.
Figure 28: western blotting (WB) and native results from left to right: E1 and E2: After Ni-
NTA affinity chromatography from sample 1 S1: Sample 1 fractions at SEC. S2a and S2b:
Sample 2 fractions at SEC S3a, S3b, and S3c: Sample 3 fractions at SEC. N1, N2, and N3:
native gel image for selected fractions from sample 3 at SEC.
Western blotting (WB) analyses revealed different purity levels of GPA1 samples according to
different purification routes. Western blotting of E1 and E2 (Fractions from nickel affinity)
resulted in many protein bands to clean up from target protein, GPA1. Loaded around 5 µg
GPA1 in S1 lane seemed the purest sample as a result of using all chromatography techniques
however that purification trial gave a very low amount of protein. Especially, S3c lane displayed
a suitable protein band with a molecular weight of about 48 kDa as a high amount of GPA1
with bearing slightly undesired several protein bands. Observing almost a single protein band
with a molecular weight about 48 kDa in SDS-PAGE-gel made us conclude that these bands in
S3 lane (around 20 µg GPA1) above generated from GPA1 fragments due to degradation of the
protein.
Native-PAGE analysis indicates that N1, N2, and N3 (all from same fractions) contains more
than one structure from pure protein sample suggesting the presence of different oligomers in
solution.
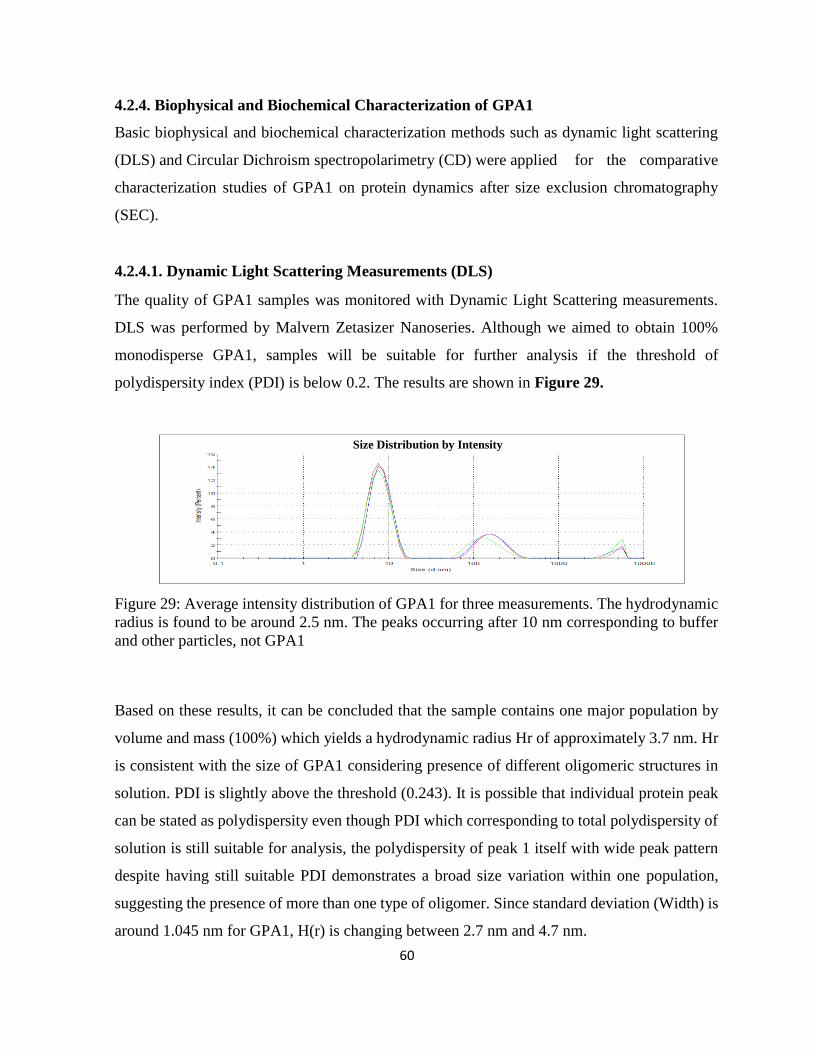
60
4.2.4. Biophysical and Biochemical Characterization of GPA1
Basic biophysical and biochemical characterization methods such as dynamic light scattering
(DLS) and Circular Dichroism spectropolarimetry (CD) were applied for the comparative
characterization studies of GPA1 on protein dynamics after size exclusion chromatography
(SEC).
4.2.4.1. Dynamic Light Scattering Measurements (DLS)
The quality of GPA1 samples was monitored with Dynamic Light Scattering measurements.
DLS was performed by Malvern Zetasizer Nanoseries. Although we aimed to obtain 100%
monodisperse GPA1, samples will be suitable for further analysis if the threshold of
polydispersity index (PDI) is below 0.2. The results are shown in Figure 29.
Figure 29: Average intensity distribution of GPA1 for three measurements. The hydrodynamic
radius is found to be around 2.5 nm. The peaks occurring after 10 nm corresponding to buffer
and other particles, not GPA1
Based on these results, it can be concluded that the sample contains one major population by
volume and mass (100%) which yields a hydrodynamic radius Hr of approximately 3.7 nm. Hr
is consistent with the size of GPA1 considering presence of different oligomeric structures in
solution. PDI is slightly above the threshold (0.243). It is possible that individual protein peak
can be stated as polydispersity even though PDI which corresponding to total polydispersity of
solution is still suitable for analysis, the polydispersity of peak 1 itself with wide peak pattern
despite having still suitable PDI demonstrates a broad size variation within one population,
suggesting the presence of more than one type of oligomer. Since standard deviation (Width) is
around 1.045 nm for GPA1, H(r) is changing between 2.7 nm and 4.7 nm.
Size Distribution by Intensity
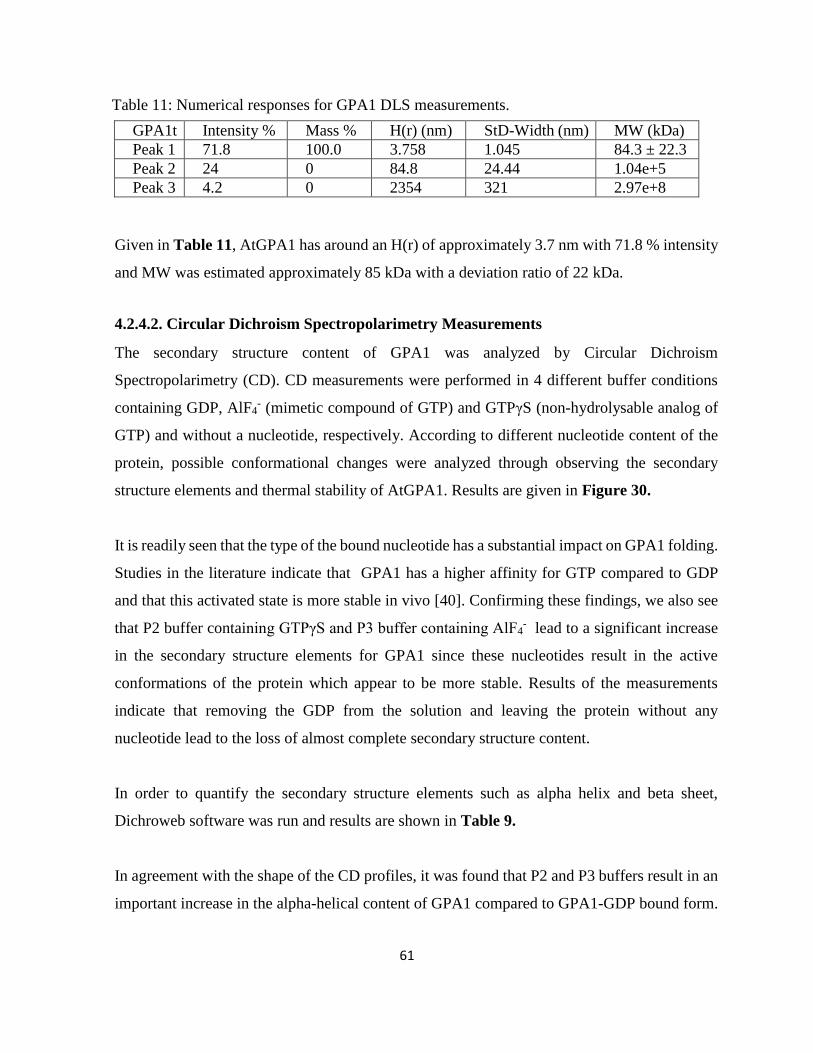
61
Table 11: Numerical responses for GPA1 DLS measurements.
Given in Table 11, AtGPA1 has around an H(r) of approximately 3.7 nm with 71.8 % intensity
and MW was estimated approximately 85 kDa with a deviation ratio of 22 kDa.
4.2.4.2. Circular Dichroism Spectropolarimetry Measurements
The secondary structure content of GPA1 was analyzed by Circular Dichroism
Spectropolarimetry (CD). CD measurements were performed in 4 different buffer conditions
containing GDP, AlF4- (mimetic compound of GTP) and GTPγS (non-hydrolysable analog of
GTP) and without a nucleotide, respectively. According to different nucleotide content of the
protein, possible conformational changes were analyzed through observing the secondary
structure elements and thermal stability of AtGPA1. Results are given in Figure 30.
It is readily seen that the type of the bound nucleotide has a substantial impact on GPA1 folding.
Studies in the literature indicate that GPA1 has a higher affinity for GTP compared to GDP
and that this activated state is more stable in vivo [40]. Confirming these findings, we also see
that P2 buffer containing GTPγS and P3 buffer containing AlF4- lead to a significant increase
in the secondary structure elements for GPA1 since these nucleotides result in the active
conformations of the protein which appear to be more stable. Results of the measurements
indicate that removing the GDP from the solution and leaving the protein without any
nucleotide lead to the loss of almost complete secondary structure content.
In order to quantify the secondary structure elements such as alpha helix and beta sheet,
Dichroweb software was run and results are shown in Table 9.
In agreement with the shape of the CD profiles, it was found that P2 and P3 buffers result in an
important increase in the alpha-helical content of GPA1 compared to GPA1-GDP bound form.
GPA1t Intensity % Mass % H(r) (nm) StD-Width (nm) MW (kDa)
Peak 1 71.8 100.0 3.758 1.045 84.3 ± 22.3
Peak 2 24 0 84.8 24.44 1.04e+5
Peak 3 4.2 0 2354 321 2.97e+8
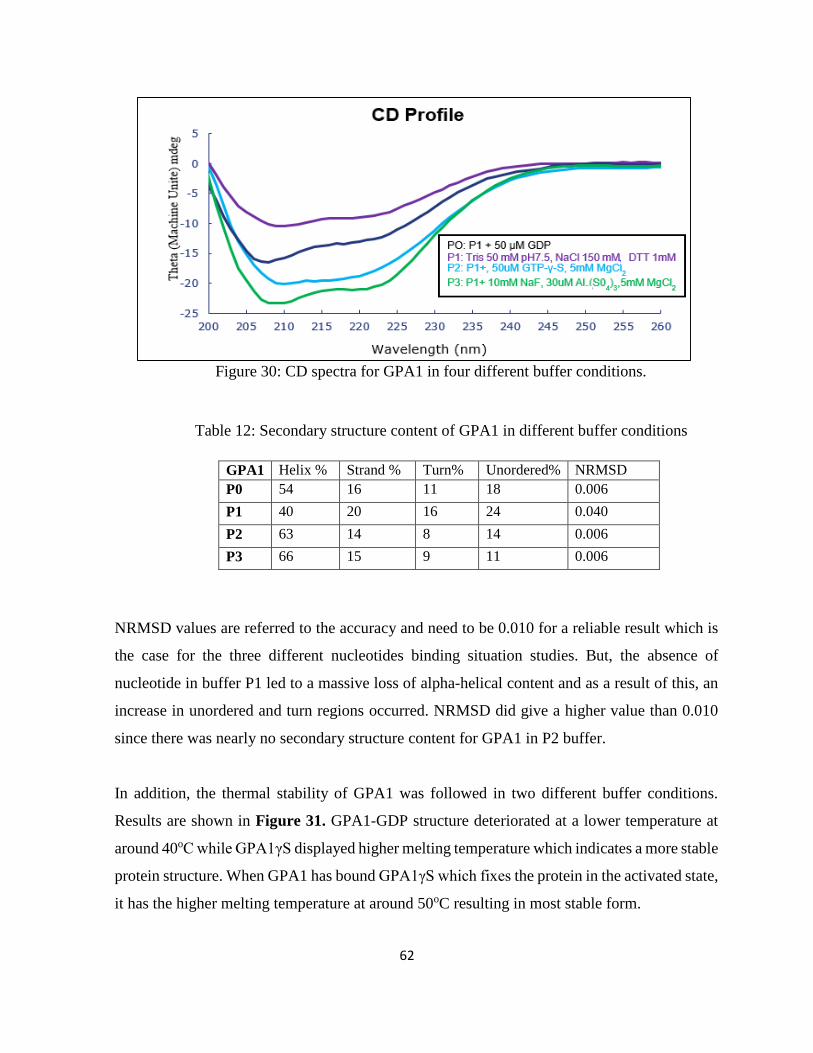
62
Figure 30: CD spectra for GPA1 in four different buffer conditions.
Table 12: Secondary structure content of GPA1 in different buffer conditions
NRMSD values are referred to the accuracy and need to be 0.010 for a reliable result which is
the case for the three different nucleotides binding situation studies. But, the absence of
nucleotide in buffer P1 led to a massive loss of alpha-helical content and as a result of this, an
increase in unordered and turn regions occurred. NRMSD did give a higher value than 0.010
since there was nearly no secondary structure content for GPA1 in P2 buffer.
In addition, the thermal stability of GPA1 was followed in two different buffer conditions.
Results are shown in Figure 31. GPA1-GDP structure deteriorated at a lower temperature at
around 40oC while GPA1γS displayed higher melting temperature which indicates a more stable
protein structure. When GPA1 has bound GPA1γS which fixes the protein in the activated state,
it has the higher melting temperature at around 50oC resulting in most stable form.
GPA1 Helix % Strand % Turn% Unordered% NRMSD
P0 54 16 11 18 0.006
P1 40 20 16 24 0.040
P2 63 14 8 14 0.006
P3 66 15 9 11 0.006
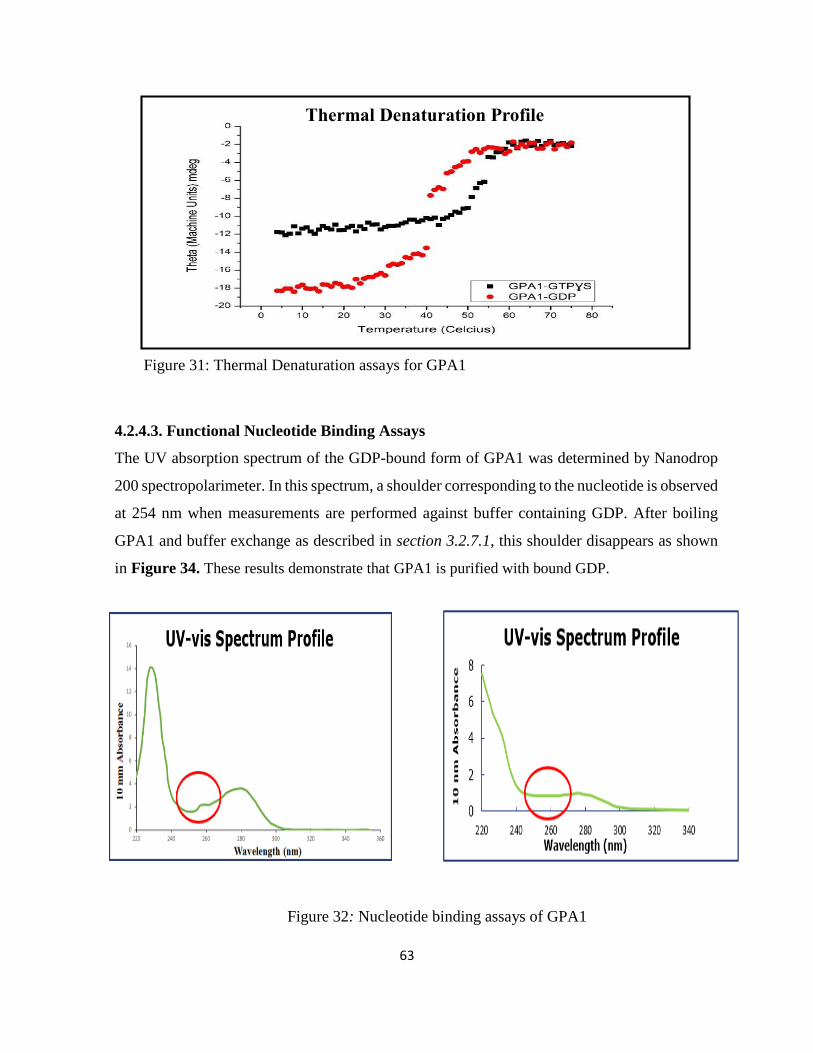
63
Figure 31: Thermal Denaturation assays for GPA1
4.2.4.3. Functional Nucleotide Binding Assays
The UV absorption spectrum of the GDP-bound form of GPA1 was determined by Nanodrop
200 spectropolarimeter. In this spectrum, a shoulder corresponding to the nucleotide is observed
at 254 nm when measurements are performed against buffer containing GDP. After boiling
GPA1 and buffer exchange as described in section 3.2.7.1, this shoulder disappears as shown
in Figure 34. These results demonstrate that GPA1 is purified with bound GDP.
Figure 32: Nucleotide binding assays of GPA1
Thermal Denaturation Profile
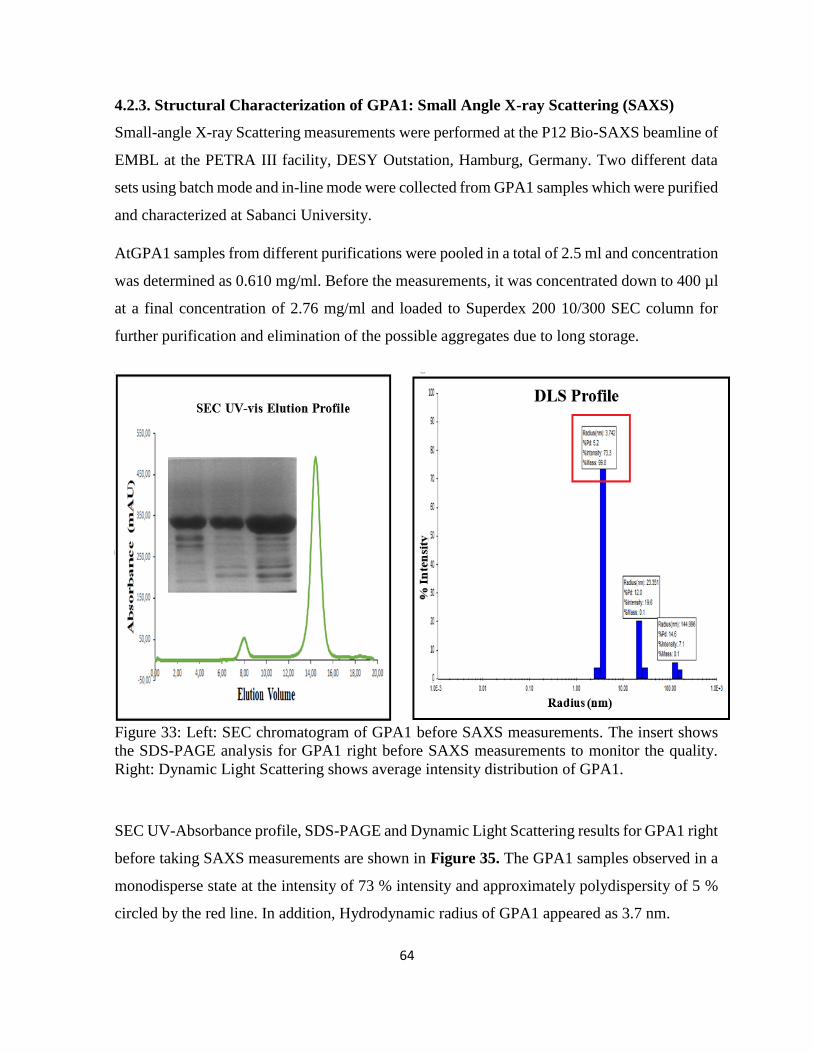
64
4.2.3. Structural Characterization of GPA1: Small Angle X-ray Scattering (SAXS)
Small-angle X-ray Scattering measurements were performed at the P12 Bio-SAXS beamline of
EMBL at the PETRA III facility, DESY Outstation, Hamburg, Germany. Two different data
sets using batch mode and in-line mode were collected from GPA1 samples which were purified
and characterized at Sabanci University.
AtGPA1 samples from different purifications were pooled in a total of 2.5 ml and concentration
was determined as 0.610 mg/ml. Before the measurements, it was concentrated down to 400 µl
at a final concentration of 2.76 mg/ml and loaded to Superdex 200 10/300 SEC column for
further purification and elimination of the possible aggregates due to long storage.
Figure 33: Left: SEC chromatogram of GPA1 before SAXS measurements. The insert shows
the SDS-PAGE analysis for GPA1 right before SAXS measurements to monitor the quality.
Right: Dynamic Light Scattering shows average intensity distribution of GPA1.
SEC UV-Absorbance profile, SDS-PAGE and Dynamic Light Scattering results for GPA1 right
before taking SAXS measurements are shown in Figure 35. The GPA1 samples observed in a
monodisperse state at the intensity of 73 % intensity and approximately polydispersity of 5 %
circled by the red line. In addition, Hydrodynamic radius of GPA1 appeared as 3.7 nm.
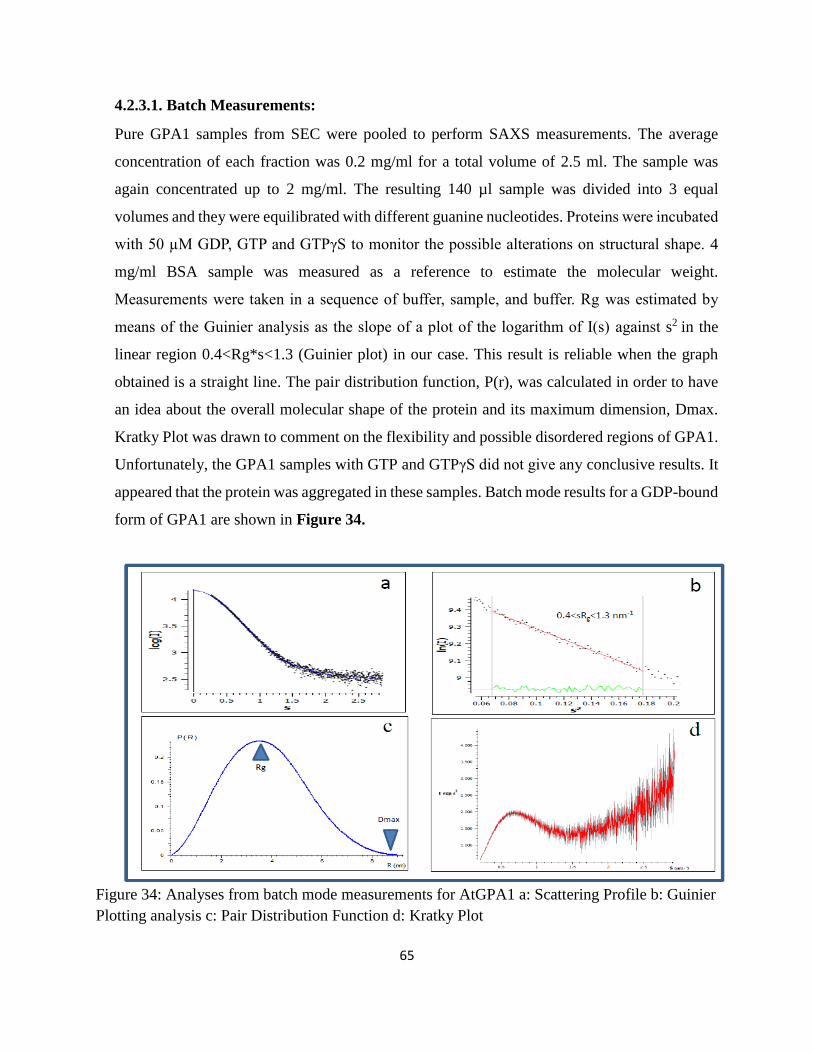
65
4.2.3.1. Batch Measurements:
Pure GPA1 samples from SEC were pooled to perform SAXS measurements. The average
concentration of each fraction was 0.2 mg/ml for a total volume of 2.5 ml. The sample was
again concentrated up to 2 mg/ml. The resulting 140 µl sample was divided into 3 equal
volumes and they were equilibrated with different guanine nucleotides. Proteins were incubated
with 50 µM GDP, GTP and GTPγS to monitor the possible alterations on structural shape. 4
mg/ml BSA sample was measured as a reference to estimate the molecular weight.
Measurements were taken in a sequence of buffer, sample, and buffer. Rg was estimated by
means of the Guinier analysis as the slope of a plot of the logarithm of I(s) against s2 in the
linear region 0.4<Rg*s<1.3 (Guinier plot) in our case. This result is reliable when the graph
obtained is a straight line. The pair distribution function, P(r), was calculated in order to have
an idea about the overall molecular shape of the protein and its maximum dimension, Dmax.
Kratky Plot was drawn to comment on the flexibility and possible disordered regions of GPA1.
Unfortunately, the GPA1 samples with GTP and GTPγS did not give any conclusive results. It
appeared that the protein was aggregated in these samples. Batch mode results for a GDP-bound
form of GPA1 are shown in Figure 34.
Figure 34: Analyses from batch mode measurements for AtGPA1 a: Scattering Profile b: Guinier
Plotting analysis c: Pair Distribution Function d: Kratky Plot
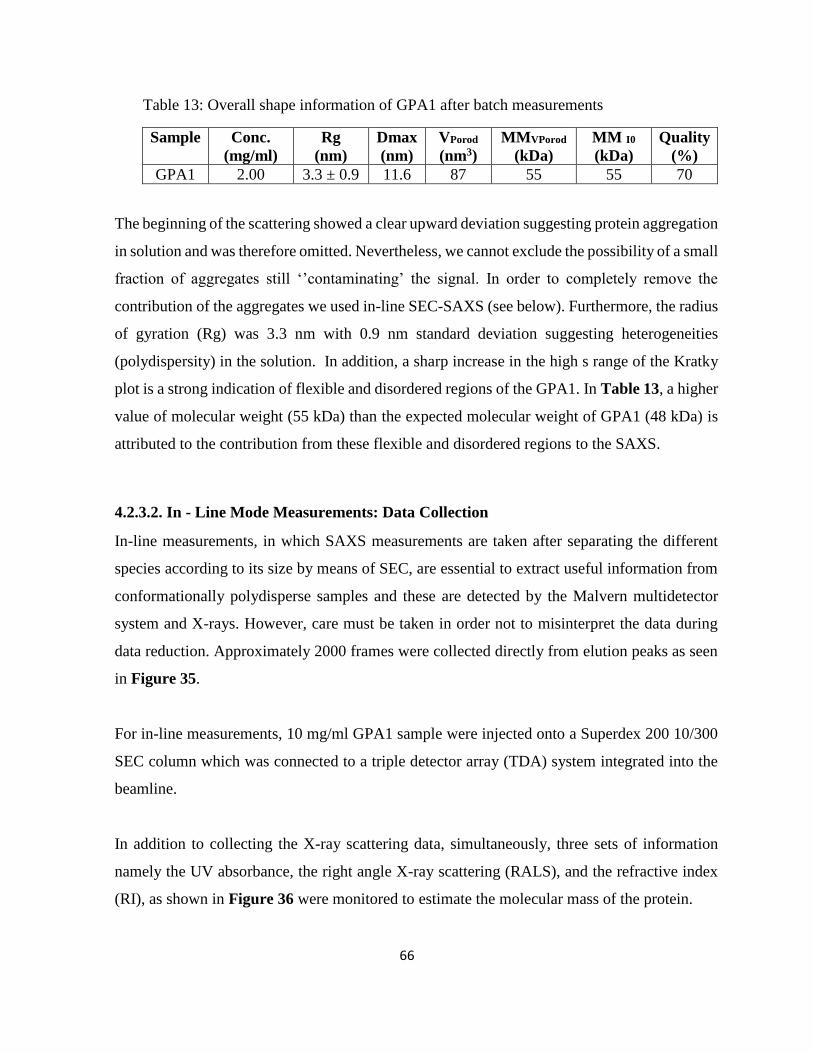
66
Table 13: Overall shape information of GPA1 after batch measurements
Sample Conc.
(mg/ml)
Rg
(nm)
Dmax
(nm)
VPorod
(nm3)
MMVPorod
(kDa)
MM I0
(kDa)
Quality
(%)
GPA1 2.00 3.3 ± 0.9 11.6 87 55 55 70
The beginning of the scattering showed a clear upward deviation suggesting protein aggregation
in solution and was therefore omitted. Nevertheless, we cannot exclude the possibility of a small
fraction of aggregates still ‘’contaminating’ the signal. In order to completely remove the
contribution of the aggregates we used in-line SEC-SAXS (see below). Furthermore, the radius
of gyration (Rg) was 3.3 nm with 0.9 nm standard deviation suggesting heterogeneities
(polydispersity) in the solution. In addition, a sharp increase in the high s range of the Kratky
plot is a strong indication of flexible and disordered regions of the GPA1. In Table 13, a higher
value of molecular weight (55 kDa) than the expected molecular weight of GPA1 (48 kDa) is
attributed to the contribution from these flexible and disordered regions to the SAXS.
4.2.3.2. In - Line Mode Measurements: Data Collection
In-line measurements, in which SAXS measurements are taken after separating the different
species according to its size by means of SEC, are essential to extract useful information from
conformationally polydisperse samples and these are detected by the Malvern multidetector
system and X-rays. However, care must be taken in order not to misinterpret the data during
data reduction. Approximately 2000 frames were collected directly from elution peaks as seen
in Figure 35.
For in-line measurements, 10 mg/ml GPA1 sample were injected onto a Superdex 200 10/300
SEC column which was connected to a triple detector array (TDA) system integrated into the
beamline.
In addition to collecting the X-ray scattering data, simultaneously, three sets of information
namely the UV absorbance, the right angle X-ray scattering (RALS), and the refractive index
(RI), as shown in Figure 36 were monitored to estimate the molecular mass of the protein.
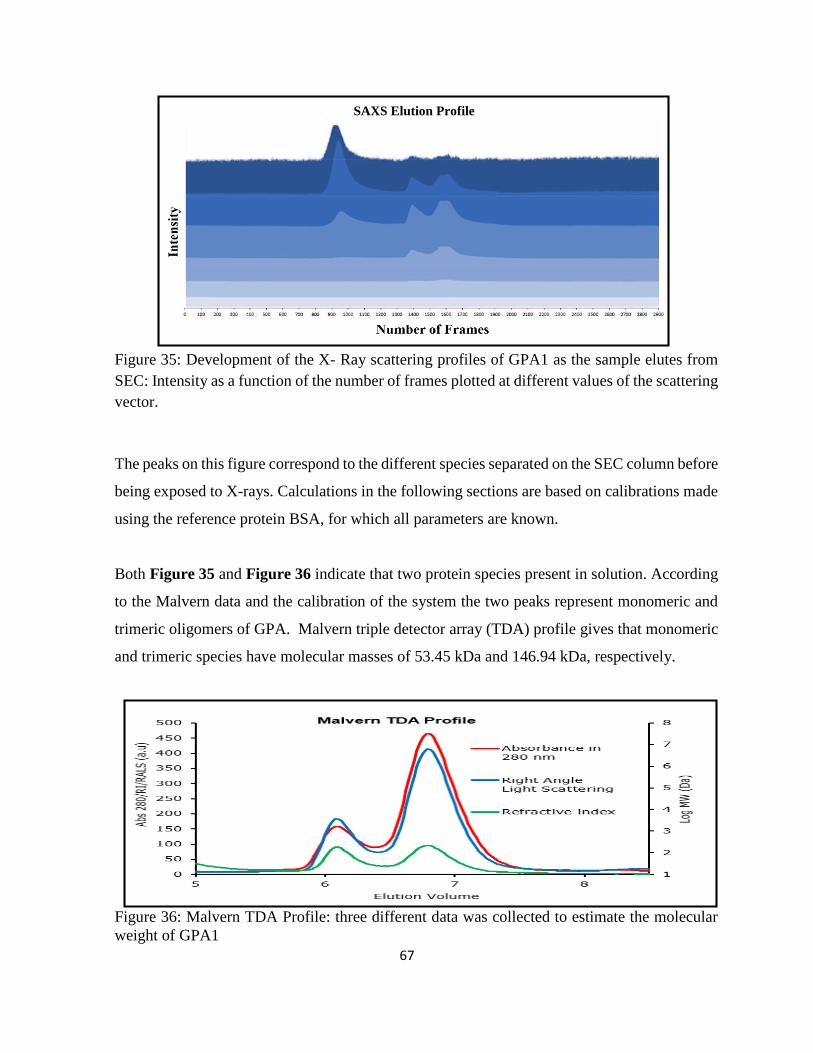
67
Figure 35: Development of the X- Ray scattering profiles of GPA1 as the sample elutes from
SEC: Intensity as a function of the number of frames plotted at different values of the scattering
vector.
The peaks on this figure correspond to the different species separated on the SEC column before
being exposed to X-rays. Calculations in the following sections are based on calibrations made
using the reference protein BSA, for which all parameters are known.
Both Figure 35 and Figure 36 indicate that two protein species present in solution. According
to the Malvern data and the calibration of the system the two peaks represent monomeric and
trimeric oligomers of GPA. Malvern triple detector array (TDA) profile gives that monomeric
and trimeric species have molecular masses of 53.45 kDa and 146.94 kDa, respectively.
Figure 36: Malvern TDA Profile: three different data was collected to estimate the molecular
weight of GPA1
S SAXS Elution Profile
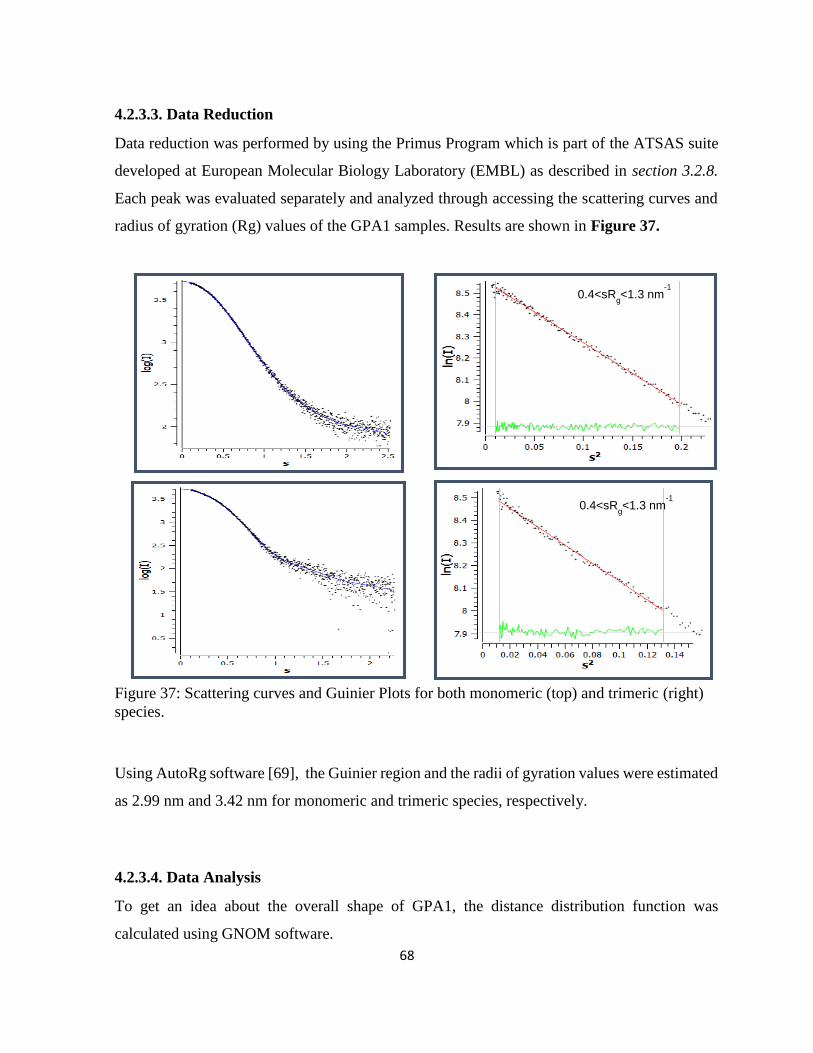
68
4.2.3.3. Data Reduction
Data reduction was performed by using the Primus Program which is part of the ATSAS suite
developed at European Molecular Biology Laboratory (EMBL) as described in section 3.2.8.
Each peak was evaluated separately and analyzed through accessing the scattering curves and
radius of gyration (Rg) values of the GPA1 samples. Results are shown in Figure 37.
Figure 37: Scattering curves and Guinier Plots for both monomeric (top) and trimeric (right)
species.
Using AutoRg software [69], the Guinier region and the radii of gyration values were estimated
as 2.99 nm and 3.42 nm for monomeric and trimeric species, respectively.
4.2.3.4. Data Analysis
To get an idea about the overall shape of GPA1, the distance distribution function was
calculated using GNOM software.
0.4<sRg<1.3 nm
-1
0.4<sRg<1.3 nm
-1
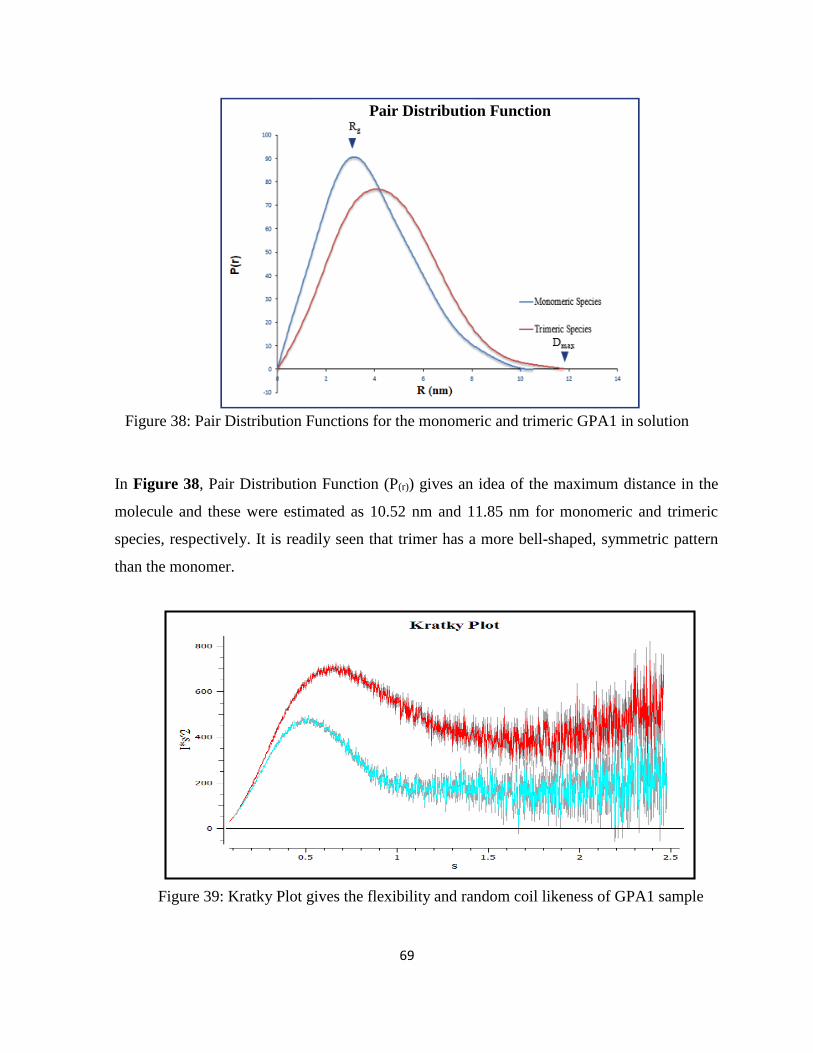
69
Figure 38: Pair Distribution Functions for the monomeric and trimeric GPA1 in solution
In Figure 38, Pair Distribution Function (P(r)) gives an idea of the maximum distance in the
molecule and these were estimated as 10.52 nm and 11.85 nm for monomeric and trimeric
species, respectively. It is readily seen that trimer has a more bell-shaped, symmetric pattern
than the monomer.
Figure 39: Kratky Plot gives the flexibility and random coil likeness of GPA1 sample
Pair Distribution Function
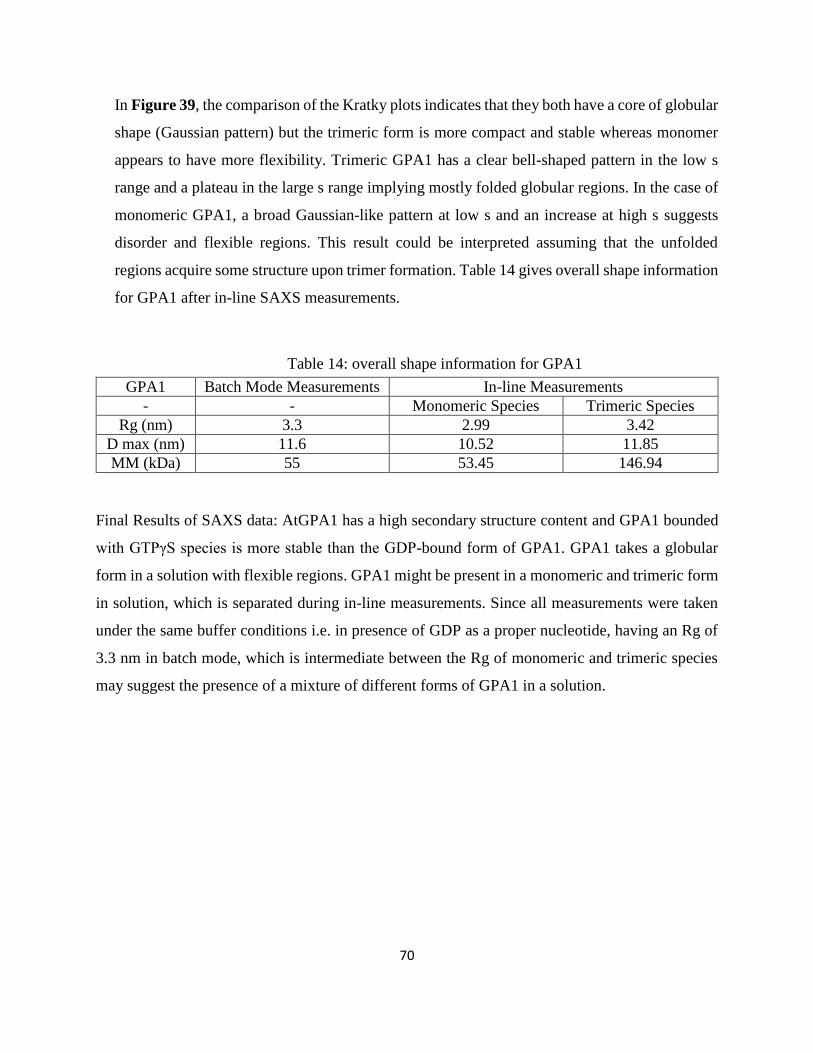
70
In Figure 39, the comparison of the Kratky plots indicates that they both have a core of globular
shape (Gaussian pattern) but the trimeric form is more compact and stable whereas monomer
appears to have more flexibility. Trimeric GPA1 has a clear bell-shaped pattern in the low s
range and a plateau in the large s range implying mostly folded globular regions. In the case of
monomeric GPA1, a broad Gaussian-like pattern at low s and an increase at high s suggests
disorder and flexible regions. This result could be interpreted assuming that the unfolded
regions acquire some structure upon trimer formation. Table 14 gives overall shape information
for GPA1 after in-line SAXS measurements.
Table 14: overall shape information for GPA1
Final Results of SAXS data: AtGPA1 has a high secondary structure content and GPA1 bounded
with GTPγS species is more stable than the GDP-bound form of GPA1. GPA1 takes a globular
form in a solution with flexible regions. GPA1 might be present in a monomeric and trimeric form
in solution, which is separated during in-line measurements. Since all measurements were taken
under the same buffer conditions i.e. in presence of GDP as a proper nucleotide, having an Rg of
3.3 nm in batch mode, which is intermediate between the Rg of monomeric and trimeric species
may suggest the presence of a mixture of different forms of GPA1 in a solution.
GPA1 Batch Mode Measurements In-line Measurements
- - Monomeric Species Trimeric Species
Rg (nm) 3.3 2.99 3.42
D max (nm) 11.6 10.52 11.85
MM (kDa) 55 53.45 146.94
71
5. DISCUSSION
There are an increasing number of reports on the plant G-protein heterotrimer both about the
three subunits individually and about the reconstructed complex in order to elucidate the
activation mechanism and to gain more insights into their structural and biochemical
characteristics. Activation mechanism of mammalian heterotrimer is well known while there
are not enough studies which analyze the mechanism in plants. In our group, a structural
investigation of the A.thaliana complex is undertaken to reveal the activation mechanism in
plants and for a better understanding of the G-protein-mediated molecular pathways. In this
thesis we aimed to characterize the alpha subunit (AtGPA1) of the heterotrimeric complex by
purifying the full-length wild type (WT) version of AtGPA1 (herein referred to as GPA1) and
an N-terminal 36-aa truncated mutant of GPA1 (GPA1t) using recombinant proteins produced
in yeast and bacteria systems, respectively. GPA1 and the mutated protein, GPA1t, are
characterized by means of Dynamic Light Scattering (DLS) and Circular Dichroism
Spectropolarimetry (CD) to investigate the structural differences between the two proteins and
in order to compare their biophysical characteristics. In addition, Small Angle X-ray data were
collected and analyzed for GPA1. All results related to the cloning of GPA1t and expression,
purification, biochemical and biophysical characterization of both proteins as well as the
structural analysis of GPA1 will be discussed below in separate sections. We will also discuss
experimental challenges encountered throughout the thesis work, possible solutions to some of
these and some implications regarding comparative biochemical, biophysical and structural
characterization of the proteins.
5.1. GPA1t Cloning, Expression, and purification
Studies in the literature on plant heterotrimeric G-proteins involve in general, either
overexpression or deletion of G-protein alpha subunit gene in vivo systems [70]. Along with
the rapid developments on the heterologous expression methods, the first successful cloning of
AtGPA1 in the pCIT1828 vector was made by Meyerowitz et al. in 1990 [3]. In addition,
AtGPA1 was previously cloned and expressed by other research groups using different vectors
[71]. Attempts at cloning GPA1 were made also by our former lab members in E.coli using
72
PQE80-L vector resulted in a failure [72]. GPA1 was ,for instance, cloned into pPROEx-Htb
vector which provides fusion proteins with a N-terminal tobacco etch virus (TEV)-protease
cleavable Hexa-his tag and expressed in BL21(DE3) cells [73]. Likewise, GPA1t was expressed
from the pPROEx-Htb plasmid in E. coli Codon Plus (RIPL) BL21 cells [4]. In these
publications the protein yield after purification had not been mentioned. However, it appears
that in both cases the yield was adequate to performed characterization studies both with GPA1
and GPA1t. Because the pPROEx-Ht vector is not readily available in our study, we aimed to
clone GPA1t (N-terminal 36 aa. truncated mutant) in BL21 cells, E.coli using PQE80-L
following the previous cloning strategy. GPA1t gene was inserted into PQE80-L vector through
the use of HindIII and KpnI restriction enzymes. We confirmed the presence of GPA1t in the
ligated construct and transformation of different E.coli strains using control PCR and
sequencing. One of the disadvantages of using PQE80-L plasmid was the lack of cleavage site
in order to remove 6-his tag from GPA1t. Thus, all studies were carried out on GPA1t with the
additional 6 histidine residues. In the future, TAGZyme DAPase (NOVAGEN) used for the
complete removal of N-terminal His tags from proteins may be used. Thus, this would allow
performing all biochemical and biophysical analyses without a tag. Moreover, GPA1t could
be cloned into another plasmid containing a cleave site for the tag.
GPA1t expression was started with small-scale cultures of different E.coli host cells. BL21 and
Rosetta cells were used to optimize the expression steps in order to obtain the best host cell and
induction conditions. There was no significant difference between BL21 or Rosetta cells, E.coli
strains in terms of protein expression levels. Finally, the best parameters for expression were
determined to be: Inoculate a 2 L LB culture with BL21 cells grown overnight and grow the
cells at 37oC and induce with 0.7 mM IPTG at 27oC when OD: 600 reaches the value of 0.6.
Nevertheless, SDS-PAGE results indicated that we could not express the protein with adequate
yield, it also was relatively dirty with non-specific protein bands, specifically a protein band
which has a molecular weight of approximately 55kDa appeared to dominate the gels.
Interestingly, compared to our home-made lysis buffer described in section 3.1.2.1, the use of
BugBuster TM Protein Extraction kit for the lysis step has resulted in less amount of the
unwanted protein band with a 55 kDa molecular weight.
73
Batch mode nickel affinity chromatography and size exclusion chromatography were used to
obtain adequate amount of pure GPA1t. Nickel affinity chromatography is less efficient for
GPA1t than the wild-type GPA1. This trend might be due to the 50% decrease in the number
of histidine residues in the protein sequence after the truncation of 36 residues from N-terminal.
Having a plasmid with 2 his-tags and his-tag cleave sites would be a good strategy to increase
the yield of affinity chromatography. We observed precipitation during dialysis of the protein.
It has been stated that GPA1 has two post-translational modifications; myristoylation and
palmitoylation [74]. Lack of post-translational modifications due to the prokaryotic expression
system of E.coli may cause these aggregates since these modifications are possibly important
to stabilize GPA1 structure in solution. Finally, use of HiLoad 16/60 75 pg Superdex SEC
column right after overnight dialysis led us to obtain the pure and adequate amount of protein.
Thus, from 9 g biomass, we yielded 1.5 mg GPA1t and we were able to carry out biochemical
and biophysical techniques such as dynamic light scattering and circular dichroism
spectropolarimeter. We were not able to compare our yield of purified protein to other studies
because the yield of protein expression and purification as well as the elution volume after size
exclusion chromatography of purified protein was not reported[73], [4].
5.2. GPA1 Purification
Heterologous expression of GPA1 was previously reported by Wise et al. in E.coli. We
expressed GPA1 in yeast using the methanol inducible pPICZC vector which contains a myc-
epitope and a hexa histidine-tag. The expression was conducted in GS 115 cells, P. pastoris
strain. To our knowledge, this is the first study that employs a yeast expression system for the
purification of GPA1.
Nickel affinity, anion exchange, and size exclusion chromatography techniques were used
through this study. Although the combination of these three has given pure GPA1, the yield
was very low. Therefore, we discarded the anion exchange chromatography step and increased
the yield without compromising the purity. GPA1 was purified in a more homogeneous state
and with a better yield higher amount compared to E.coli expression in E.coli cells despite less
culture volume. For instance, we harvested 25 g pellet from 500 mL culture yielding 5.5 mg
protein by the end of purification which is relatively higher than previous studies in our lab
74
since the highest yield of GPA1 obtained was 1.5 mg per 20 gr of pellet [72]. Nevertheless, the
yield was not reproducible in P. pastoris which may be caused by indefinite expression levels
of GPA1 which was the case for other proteins [75]. In addition, despite the use of protease
inhibitors, the effect of proteolytic enzymes was variable.
Initial crude purification was performed using batch mode nickel affinity chromatography.
Since the batch mode nickel affinity protocol was previously optimized [63] we had relatively
clean eluate after nickel affinity chromatography step compared to GPA1t purification.
Moreover, we tried several lysis protocols through the study and we used batch mode-nickel
affinity chromatography as our reference point to determine the quality of the sample based on
SDS-PAGE analysis after nickel affinity. We also, fine-tuned the incubation time for proteins
to bind to the nickel beads. SDS-PAGE results of the proteins that are obtained via 30 min. of
incubation resulted in higher purity in comparison to 60 min. evident through the less number
of non-specific bands [63].
In our purification, dialysis often resulted in a big white precipitate at the bottom of the dialysis
bag. Although post-translational modifications may help stabilization of the protein in solution,
it was reported that N-terminal 36 residues cause high flexibility of the GPA1, therefore, we
hypothesized that presence of these residues may lead to this aggregation suggesting an unstable
state of GPA1 in solution [4]. In addition, it seemed the sample could be loaded on SEC directly
without removing the imidazole, since size-exclusion chromatography also enables elimination
the imidazole inside the solution. Even though anion exchange chromatography helped to
increase the level of purity, it also decreased the yield. Therefore, we also discarded this
technique in the next experiments. Finally, it turned out that the use of size exclusion
chromatography right after nickel affinity batch mode results in high amount pure protein in
order to continue with biophysical, biochemical and structural studies.
75
5.3. Comparative Biochemical and Biophysical Characterization of GPA1 and GPA1t
CD and DLS were carried out to compare the conformations of both proteins and the effect of
nucleotides on protein structure. Nucleotide bindings alter the shape of both proteins. GPA1 in
solution displays a secondary structure content very similar to that observed in the crystal
structure, at 2.3 Å resolution [4]. There are, for instance, alpha helices and beta sheets at 49 %
and 12 % for the crystallized GPA1-GTP (in an active state) whereas our recombinant GPA1
with GTPγS (in an active state) has 54 % alpha helices and 16 % beta sheets in solution. This
increase in the number of secondary structure elements for full length GPA1 is not very
significant since the secondary structure content coming by CD measurements are obtained
from calculations based on different models in CRSSTR data set.
Binding of GDP and GTPγS gave similar results for both GPA1 and GPA1t in terms of the
biophysical characteristics of the molecules which is also consistent with previous reports [47].
It has been previously shown that i) purified recombinant GPA1 bound to GDP can exchange
GDP for GTP and ii) GPA1 forms various structures in solution in terms of the protein dynamics
which can be altered by the exchange of bound GDP for GTP, and GTPɤS (a non-hydrolysable
GTP analog) as well as by the presence of membrane mimetic compounds [40].
Here we demonstrate that binding of GTPγS to GPA1 leads to a significant increase in alpha-
helical content and a decrease in disordered regions compared to GPA1-GDP. Comparison of
the two proteins indicates that GPA1-GTPγS seems less structured than GPA1t-GTPγS. Hence,
it suggests that deletion of 36 residues may have a substantial effect on folding and binding
properties. Other than GDP and GTPγS binding, CD was performed with two other buffer
conditions, containing GTP mimetic compound, AlF4- and without any guanine nucleotide,
respectively (See Figure 30). For GPA1, the lack of nucleotides in solution results in an almost
complete absence of regular secondary structure elements, whereas the highest values of
secondary structure elements were obtained in the presence of a guanine nucleotide mimetic
compound.
76
The level of sample homogeneity and the degree of oligomerization of both proteins were
studied by Dynamic Light Scattering (DLS). DLS results indicate that GPA1 and GPA1t are
both monodisperse and have a hydrodynamic radius of 3.7 nm and 2.5 nm, respectively. DLS
data, thus, indicates that GPA1 is bigger than GPA1t. This is an expected result since it has
been reported that truncation of the first 36 aa from GPA1 induces more compact structure [4].
Therefore, the large difference in size is not only caused by the loss of 36 residues from the
helical domain but also due to a compaction effect because of the absence of the flexible
domain. Additionally, the broad size distribution (high standard deviation values) suggest
different oligomerization levels such as monomer, dimer and trimeric structures which is also
supported by native-PAGE and SAXS analysis for GPA1 (see below). In order to understand
the mechanism of oligomerization in solutions, it is necessary to monitor the monomer-
oligomer equilibrium as a function of the protein concentration.
According to thermal denaturation analyses, GPA1t has much higher melting temperature (Tm),
at around 60oC, than GPA1, around 40ºC, which is an indication of more stable structure.
Interestingly, the thermal stability of GPA1t is almost independent of nucleotide binding with
2-3oC change, whereas GPA1 is more stable (the Tm increases by 10ºC) when nucleotides are
bound to the protein. GPA1-GDP structure deteriorates at a lower temperature (at around 40oC)
while GPA1-GTPγS requires higher temperature which indicates more stable structured
protein. Different nucleotide bindings for GPA1t do not result in a significant thermal stability
difference; Tm of GPA1t-GDP is only 2oC-3oC less than that of GPA1t-GTPγS. The Tm
difference between the two proteins may be explained by the lack of 36 residues from N-
terminal to GPA1 since it has been reported that nucleotide binding stabilizes the helical domain
of GPA1[4]. Truncation of N-terminal 36 aa. from GPA1 leads to the loss of a part of helical
domain at 30%. In the case of GPA1t, the absence of N-terminal 36-aa from helical domain
already stabilizes the protein and nucleotide binding does not cause major changes in stability.
The non-hydrolysable GTP analog, GTPγS, may fix the helical domain in an active state leading
to a less flexible and more structured GPA1 which is explained with higher Tm values for
GPA–GTPγS.
77
It has been reported that AtGPA1 preferentially binds GTPγS in the presence GDP suggesting
that the rate of GTP analog binding is much higher than that of GDP [4]. The Tm studies
mentioned above assist to identify protein stability in terms of different nucleotide binding
affinities and suggest that alteration of signal activation for proteins is possible depending on
the ligands. Thus, both signal transmission and protein-protein interactions can either be
amplified or weaken with nucleotides.
A preliminary check for GDP binding to GPA1 was conducted in the presence of 50 µM GDP
in the elution buffer. Under these conditions the UV absorption spectra of GPA1 display a broad
peak centered at 280 nm and a shoulder at 254 nm resulting from GDP absorption. Recall that
GPA1 was purified with bound GDP. After boiling the sample and exchanging buffer not
containing any nucleotide, the peak at 280 nm, resulting from GPA1 absorption, was still visible
whereas the shoulder at 254 nm disappeared suggesting the removal of GDP from GPA1. To
make a valid comparison of nucleotide bindings for both proteins, we have to perform the same
treatment on GPA1t which we could not show due to lack of adequate protein amount.
Helical domain swapping experiments indicates that this domain controls the molecular
dynamics of the entire protein [8]. Comparative analysis of both GPA1 and GPA1t will provide
insights into the variation of functionality based on their structural differences. Another point
must be an investigation of GPA1 expression by using a eukaryotic expression system (P.
pastoris) versus prokaryotic expression system (E. coli). As E. coli is lack of Post-Translational
Modifications (PTMs) which may alter protein dynamics and its interactions with other
component in vivo, effects of PTMs on GPA1 produced from yeast is needed to be considered
during all comparisons between GPA1 and GPA1t.
5.4. Structural Characterization of GPA1 with Small Angle X-ray Scattering
Small angle X-ray scattering analyses are routinely used for the determination of the overall
structure of biological macromolecules and to develop low resolution shape models [76] Since
the crystal structure data of N-terminal 36-aa. truncated alpha subunit G-protein from
A.thaliana at 2.34 Å is available[4], our SAXS data will provide valuable complementary
78
information in order to help to interpret the behavior of full-length alpha subunit under near
physiological conditions. SAXS measurements were performed in two different ways, batch
mode, and in-line mode coupled to size-exclusion chromatography [77]. We were able to get
basic shape information and confirm its oligomerization state in solution since it has been
reported to be found 3 monomers in an asymmetric unit by J.C.Jones et al in 2011 which may
suggest different oligomers in solution. The GPA1 solution structure can be described as a
mixture of two main populations, monomeric and trimeric species both with flexible and
disordered surface regions and a globular core shape. At equilibrium, GPA1 is present
simultaneously in monomeric and trimeric forms in solution (i.e. during batch measurements),
which can be separated during in-line SEC-SAXS measurements.
The analysis of the scattering curves by means of the Guinier approximation and the pair
distance distribution function of both batch and in-line measurements indicates that monomeric
and trimeric species have radii of gyration at 2.99 nm and 3.42 nm and maximum dimension at
10.52 nm and 11.85 nm, respectively. The molecular mass (MM) was estimated from I(0) in
batch mode measurements and, more accurately, from RALS from the elution peak in the SEC
during in-line measurements. The value of MM was estimated 53.45 kDa and 146.94 for
monomeric and trimeric species respectively. Having slightly larger MM than expected
according to the sequence of GPA1 (48.44 kDa) may be an indication of flexible regions.
Additionally, the MM of the trimeric species is less than the triple value of monomeric MM
suggesting that trimers are quite compact. Supporting this view, both the distance distribution
function and the Kratky plots suggest that trimers are more collapsed and structured compared
to monomeric species. Overall, Dynamic light scattering (DLS) and Native-PAGE analyses
combined with small angle X-ray scattering (SAXS) measurements reveal that GPA1 has a
tendency to form trimers in solution. SAXS data also shows that GPA1-GDP has a globular
structure with some flexibility. Both the flexibility and the intrinsic ability of GPA1 to associate
into trimers might be biologically relevant but such hypothesis needs to be further tested.
79
6. CONCLUSION AND FUTURE WORK
In this thesis, GPA1t which lacks N-terminal 36 amino acids to GPA1 was cloned using
PQE80-L vector and GPA1t was expressed in BL21 cells. Purification procedures for both
GPA1 and GPA1t were tried to be optimized in order to continue with comparative biochemical,
biophysical and structural studies. The proteins, GPA1 and GPA1t, from P. pastoris and E.coli
were characterized by several complementary techniques including PAGE (SDS - native), CD,
DLS and thermal denaturation.
In the course of this thesis, we performed CD and DLS to investigate the comparative
biophysical characterization between the two proteins. We conclude that GPA1t has much
higher melting temperature (Tm) than GPA1, which is an indication of more stable structure.
In itself, GPA1-GDP structure deteriorates at a lower temperature while GPA1-GTPγS requires
higher temperature. In addition, the thermal stability of GPA1t is almost independent of
nucleotide binding with 2-3oC change. DLS results demonstrate that GPA1 and GPA1t have
hydrodynamic radii of 3.7 nm and 2.5 nm, respectively. Thus, DLS measurements confirmed
the smaller/more compact size of the GPA1t compared to GPA1.
SAXS data shows that the GPA1 solution structure is a mixture of two main populations,
monomeric and trimeric species. SAXS data also shows that GPA1-GDP has a globular
structure with flexible regions extending from the protein. In itself, lack of structural
information for wild-type GPA1 causes a big gap in order to understand its activation
mechanism and its interactions with other components. GPA1 produced in yeast will provide
insight into some of the interactions that the protein established through the residues in its N-
terminal.
As future work, the first step, shape models calculated using SAXS data will be obtained for
GPA1 in order to elucidate 3D-structure and dynamic conformational changes which will be a
very important point for the interpretation of the physiological significance of the trimeric
structure in solution. Moreover, effects of the various concentration series on GPA1 will be
studied by SAXS and DLS in order to monitor the existence of different species at equilibrium.
Furthermore, SAXS data will very informative to follow protein dynamics in the structure upon
binding different nucleotides.

80
7. REFERENCES
[1] G. Milligan, E. Kostenis, Heterotrimeric G-proteins: a short history., Br. J. Pharmacol. 147
Suppl (2006) S46–S55. doi:10.1038/sj.bjp.0706405.
[2] D.E. Bosch, D.P. Siderovski, G protein signaling in the parasite Entamoeba histolytica.,
Exp. Mol. Med. 45 (2013) e15. doi:10.1038/emm.2013.30.
[3] H. Ma, M.F. Yanofsky, E.M. Meyerowitz, Molecular cloning and characterization of GPA1,
a G protein alpha subunit gene from Arabidopsis thaliana., Proc. Natl. Acad. Sci. U. S. A.
87 (1990) 3821–3825. doi:10.1073/pnas.87.10.3821.
[4] J.C. Jones, W. Duffy, M. Machius, B.R.S. Temple, H.G. Dohlman, A.M. Jones, The crystal
structure of a self-activating G protein alpha subunit reveals its distinct mechanism of signal
initiation., Sci. Signal. 4 (2011) ra8. doi:10.1126/scisignal.2001446.
[5] R.J. Lefkowitz, A brief history of G-protein coupled receptors (Nobel Lecture), Angew.
Chemie - Int. Ed. 52 (2013) 6366–6378. doi:10.1002/anie.201301924.
[6] D. Urano, J. Chen, J.R. Botella, A.M. Jones, Heterotrimeric G-protein signalling in the plant
kingdom, Open Biol. 3 (2013) 120186. doi:10.1098/rsob.120186.
[7] D. Kamato, L. Thach, R. Bernard, V. Chan, W. Zheng, H. Kaur, et al., Structure, Function,
Pharmacology, and Therapeutic Potential of the G Protein, Gα/q,11, Front. Cardiovasc.
Med. 2 (2015) 1–11. doi:10.3389/fcvm.2015.00014.
[8] J.C. Jones, A.M. Jones, B.R.S. Temple, H.G. Dohlman, Differences in intradomain and
interdomain motion confer distinct activation properties to structurally similar Gα proteins,
109 (2012) 7275–7279. doi:10.1073/pnas.1202943109.
[9] G.B. Downes, N. Gautam, The G protein subunit gene families., Genomics. 62 (1999) 544–
552. doi:10.1006/geno.1999.5992.
[10] B.K Kobilka, G protein coupled receptor structure and activation, Biochim. Biophys. Acta.
1768 (2007) 794–807. doi:10.1016/j.bbamem.2006.10.021.
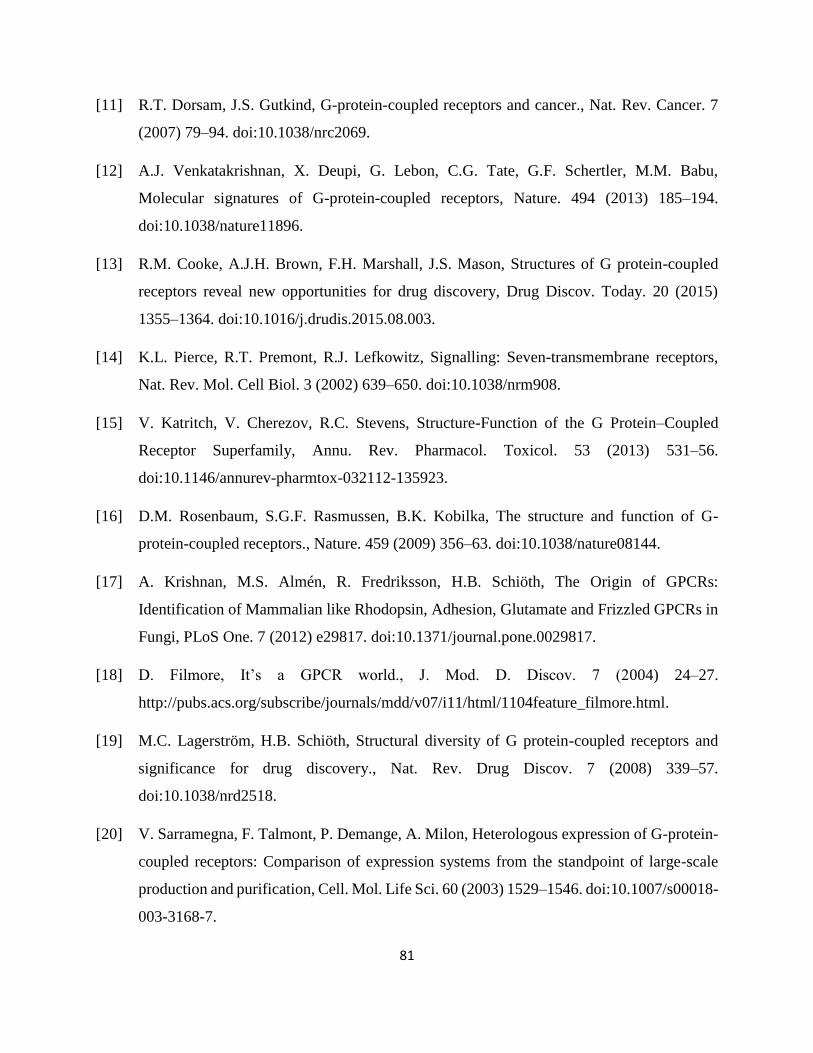
81
[11] R.T. Dorsam, J.S. Gutkind, G-protein-coupled receptors and cancer., Nat. Rev. Cancer. 7
(2007) 79–94. doi:10.1038/nrc2069.
[12] A.J. Venkatakrishnan, X. Deupi, G. Lebon, C.G. Tate, G.F. Schertler, M.M. Babu,
Molecular signatures of G-protein-coupled receptors, Nature. 494 (2013) 185–194.
doi:10.1038/nature11896.
[13] R.M. Cooke, A.J.H. Brown, F.H. Marshall, J.S. Mason, Structures of G protein-coupled
receptors reveal new opportunities for drug discovery, Drug Discov. Today. 20 (2015)
1355–1364. doi:10.1016/j.drudis.2015.08.003.
[14] K.L. Pierce, R.T. Premont, R.J. Lefkowitz, Signalling: Seven-transmembrane receptors,
Nat. Rev. Mol. Cell Biol. 3 (2002) 639–650. doi:10.1038/nrm908.
[15] V. Katritch, V. Cherezov, R.C. Stevens, Structure-Function of the G Protein–Coupled
Receptor Superfamily, Annu. Rev. Pharmacol. Toxicol. 53 (2013) 531–56.
doi:10.1146/annurev-pharmtox-032112-135923.
[16] D.M. Rosenbaum, S.G.F. Rasmussen, B.K. Kobilka, The structure and function of G-
protein-coupled receptors., Nature. 459 (2009) 356–63. doi:10.1038/nature08144.
[17] A. Krishnan, M.S. Almén, R. Fredriksson, H.B. Schiöth, The Origin of GPCRs:
Identification of Mammalian like Rhodopsin, Adhesion, Glutamate and Frizzled GPCRs in
Fungi, PLoS One. 7 (2012) e29817. doi:10.1371/journal.pone.0029817.
[18] D. Filmore, It’s a GPCR world., J. Mod. D. Discov. 7 (2004) 24–27.
http://pubs.acs.org/subscribe/journals/mdd/v07/i11/html/1104feature_filmore.html.
[19] M.C. Lagerström, H.B. Schiöth, Structural diversity of G protein-coupled receptors and
significance for drug discovery., Nat. Rev. Drug Discov. 7 (2008) 339–57.
doi:10.1038/nrd2518.
[20] V. Sarramegna, F. Talmont, P. Demange, A. Milon, Heterologous expression of G-protein-
coupled receptors: Comparison of expression systems from the standpoint of large-scale
production and purification, Cell. Mol. Life Sci. 60 (2003) 1529–1546. doi:10.1007/s00018-
003-3168-7.
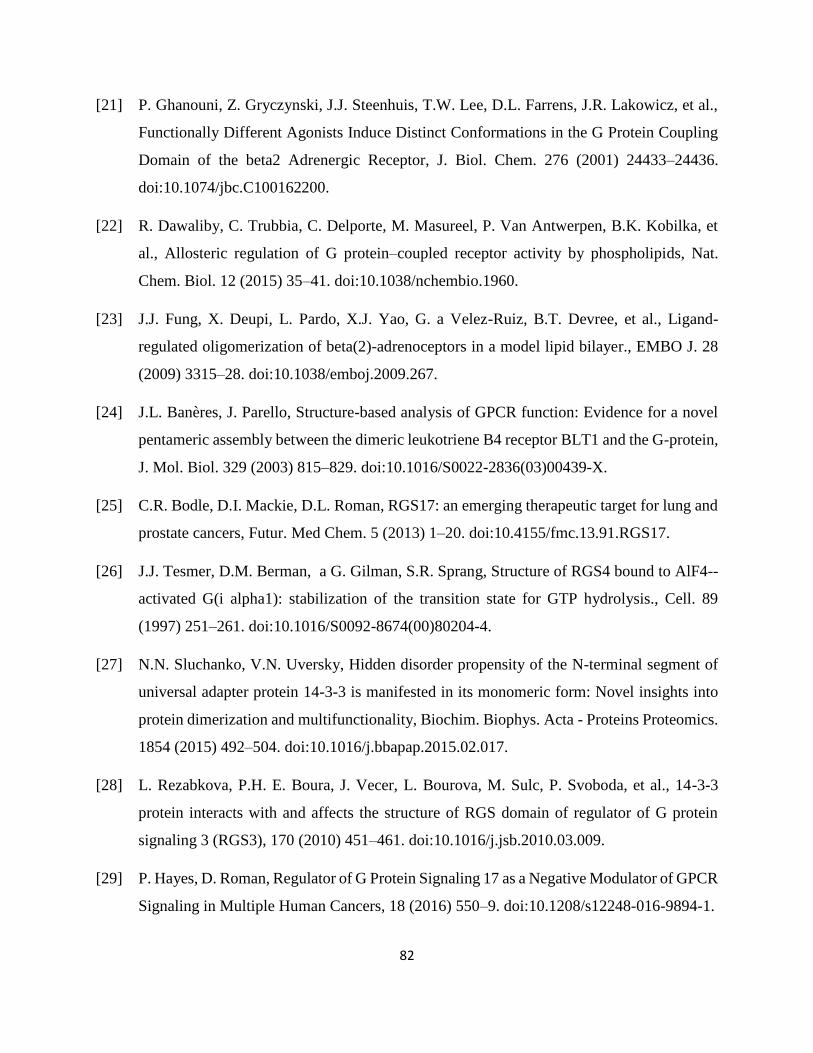
82
[21] P. Ghanouni, Z. Gryczynski, J.J. Steenhuis, T.W. Lee, D.L. Farrens, J.R. Lakowicz, et al.,
Functionally Different Agonists Induce Distinct Conformations in the G Protein Coupling
Domain of the beta2 Adrenergic Receptor, J. Biol. Chem. 276 (2001) 24433–24436.
doi:10.1074/jbc.C100162200.
[22] R. Dawaliby, C. Trubbia, C. Delporte, M. Masureel, P. Van Antwerpen, B.K. Kobilka, et
al., Allosteric regulation of G protein–coupled receptor activity by phospholipids, Nat.
Chem. Biol. 12 (2015) 35–41. doi:10.1038/nchembio.1960.
[23] J.J. Fung, X. Deupi, L. Pardo, X.J. Yao, G. a Velez-Ruiz, B.T. Devree, et al., Ligand-
regulated oligomerization of beta(2)-adrenoceptors in a model lipid bilayer., EMBO J. 28
(2009) 3315–28. doi:10.1038/emboj.2009.267.
[24] J.L. Banères, J. Parello, Structure-based analysis of GPCR function: Evidence for a novel
pentameric assembly between the dimeric leukotriene B4 receptor BLT1 and the G-protein,
J. Mol. Biol. 329 (2003) 815–829. doi:10.1016/S0022-2836(03)00439-X.
[25] C.R. Bodle, D.I. Mackie, D.L. Roman, RGS17: an emerging therapeutic target for lung and
prostate cancers, Futur. Med Chem. 5 (2013) 1–20. doi:10.4155/fmc.13.91.RGS17.
[26] J.J. Tesmer, D.M. Berman, a G. Gilman, S.R. Sprang, Structure of RGS4 bound to AlF4--
activated G(i alpha1): stabilization of the transition state for GTP hydrolysis., Cell. 89
(1997) 251–261. doi:10.1016/S0092-8674(00)80204-4.
[27] N.N. Sluchanko, V.N. Uversky, Hidden disorder propensity of the N-terminal segment of
universal adapter protein 14-3-3 is manifested in its monomeric form: Novel insights into
protein dimerization and multifunctionality, Biochim. Biophys. Acta - Proteins Proteomics.
1854 (2015) 492–504. doi:10.1016/j.bbapap.2015.02.017.
[28] L. Rezabkova, P.H. E. Boura, J. Vecer, L. Bourova, M. Sulc, P. Svoboda, et al., 14-3-3
protein interacts with and affects the structure of RGS domain of regulator of G protein
signaling 3 (RGS3), 170 (2010) 451–461. doi:10.1016/j.jsb.2010.03.009.
[29] P. Hayes, D. Roman, Regulator of G Protein Signaling 17 as a Negative Modulator of GPCR
Signaling in Multiple Human Cancers, 18 (2016) 550–9. doi:10.1208/s12248-016-9894-1.
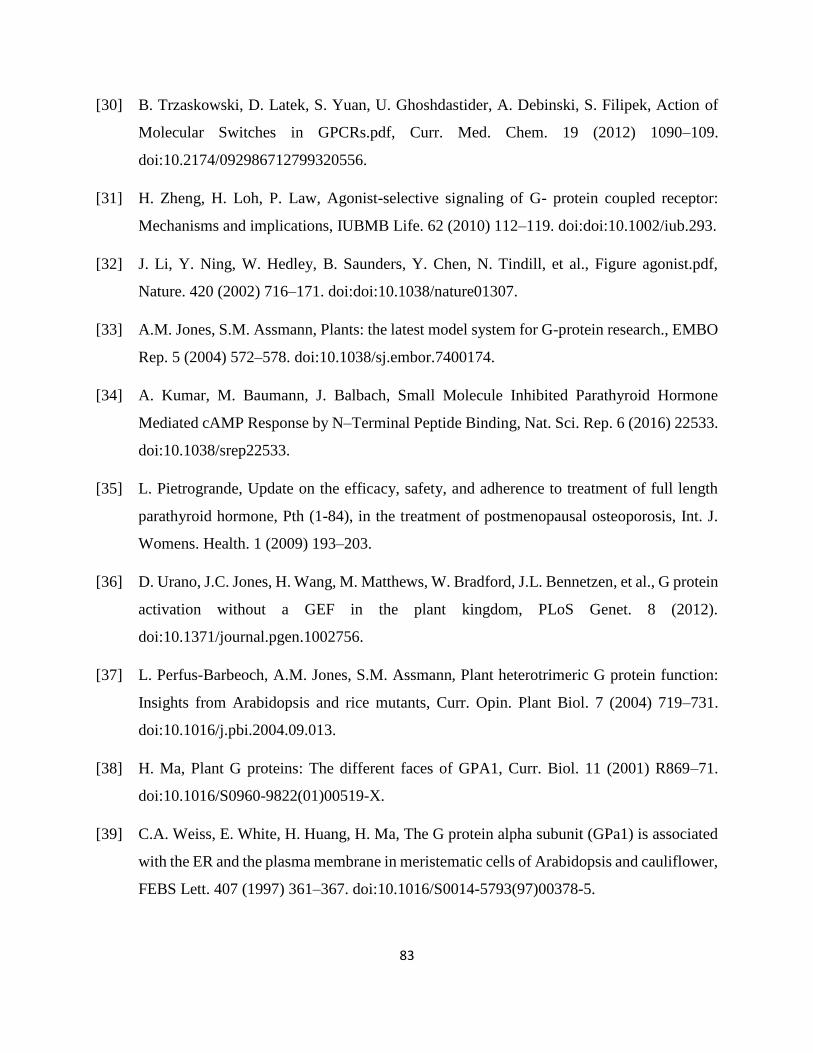
83
[30] B. Trzaskowski, D. Latek, S. Yuan, U. Ghoshdastider, A. Debinski, S. Filipek, Action of
Molecular Switches in GPCRs.pdf, Curr. Med. Chem. 19 (2012) 1090–109.
doi:10.2174/092986712799320556.
[31] H. Zheng, H. Loh, P. Law, Agonist-selective signaling of G- protein coupled receptor:
Mechanisms and implications, IUBMB Life. 62 (2010) 112–119. doi:doi:10.1002/iub.293.
[32] J. Li, Y. Ning, W. Hedley, B. Saunders, Y. Chen, N. Tindill, et al., Figure agonist.pdf,
Nature. 420 (2002) 716–171. doi:doi:10.1038/nature01307.
[33] A.M. Jones, S.M. Assmann, Plants: the latest model system for G-protein research., EMBO
Rep. 5 (2004) 572–578. doi:10.1038/sj.embor.7400174.
[34] A. Kumar, M. Baumann, J. Balbach, Small Molecule Inhibited Parathyroid Hormone
Mediated cAMP Response by N–Terminal Peptide Binding, Nat. Sci. Rep. 6 (2016) 22533.
doi:10.1038/srep22533.
[35] L. Pietrogrande, Update on the efficacy, safety, and adherence to treatment of full length
parathyroid hormone, Pth (1-84), in the treatment of postmenopausal osteoporosis, Int. J.
Womens. Health. 1 (2009) 193–203.
[36] D. Urano, J.C. Jones, H. Wang, M. Matthews, W. Bradford, J.L. Bennetzen, et al., G protein
activation without a GEF in the plant kingdom, PLoS Genet. 8 (2012).
doi:10.1371/journal.pgen.1002756.
[37] L. Perfus-Barbeoch, A.M. Jones, S.M. Assmann, Plant heterotrimeric G protein function:
Insights from Arabidopsis and rice mutants, Curr. Opin. Plant Biol. 7 (2004) 719–731.
doi:10.1016/j.pbi.2004.09.013.
[38] H. Ma, Plant G proteins: The different faces of GPA1, Curr. Biol. 11 (2001) R869–71.
doi:10.1016/S0960-9822(01)00519-X.
[39] C.A. Weiss, E. White, H. Huang, H. Ma, The G protein alpha subunit (GPa1) is associated
with the ER and the plasma membrane in meristematic cells of Arabidopsis and cauliflower,
FEBS Lett. 407 (1997) 361–367. doi:10.1016/S0014-5793(97)00378-5.
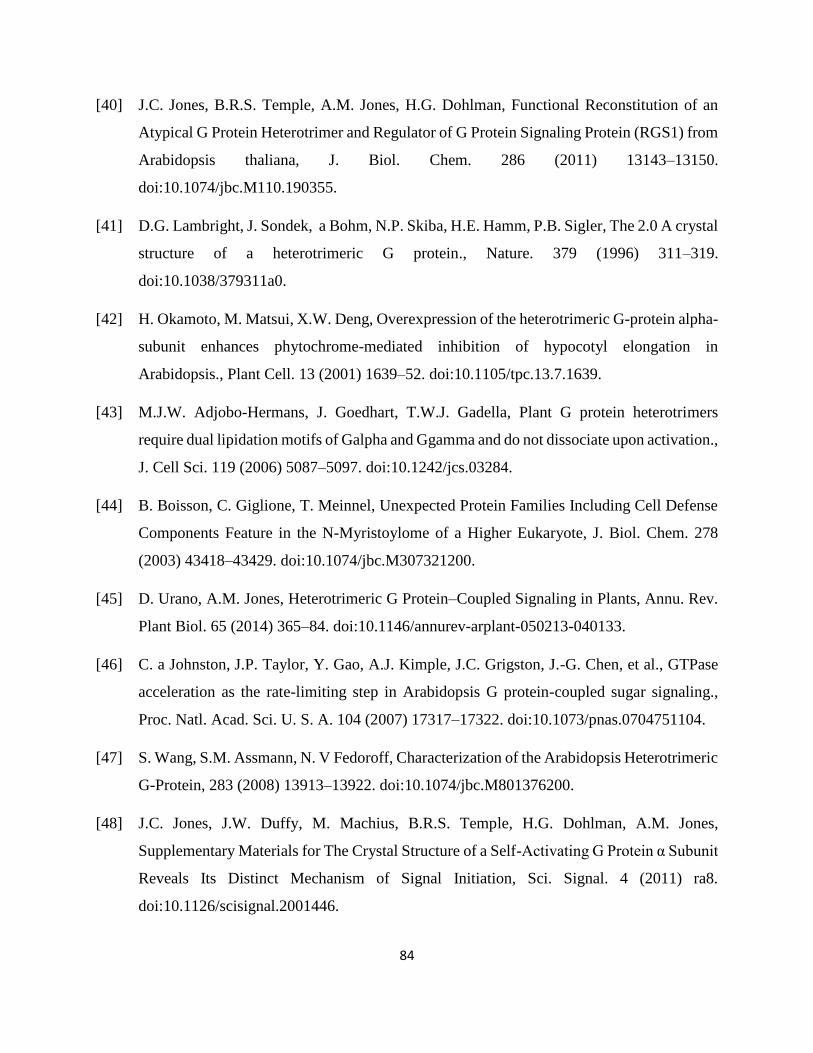
84
[40] J.C. Jones, B.R.S. Temple, A.M. Jones, H.G. Dohlman, Functional Reconstitution of an
Atypical G Protein Heterotrimer and Regulator of G Protein Signaling Protein (RGS1) from
Arabidopsis thaliana, J. Biol. Chem. 286 (2011) 13143–13150.
doi:10.1074/jbc.M110.190355.
[41] D.G. Lambright, J. Sondek, a Bohm, N.P. Skiba, H.E. Hamm, P.B. Sigler, The 2.0 A crystal
structure of a heterotrimeric G protein., Nature. 379 (1996) 311–319.
doi:10.1038/379311a0.
[42] H. Okamoto, M. Matsui, X.W. Deng, Overexpression of the heterotrimeric G-protein alpha-
subunit enhances phytochrome-mediated inhibition of hypocotyl elongation in
Arabidopsis., Plant Cell. 13 (2001) 1639–52. doi:10.1105/tpc.13.7.1639.
[43] M.J.W. Adjobo-Hermans, J. Goedhart, T.W.J. Gadella, Plant G protein heterotrimers
require dual lipidation motifs of Galpha and Ggamma and do not dissociate upon activation.,
J. Cell Sci. 119 (2006) 5087–5097. doi:10.1242/jcs.03284.
[44] B. Boisson, C. Giglione, T. Meinnel, Unexpected Protein Families Including Cell Defense
Components Feature in the N-Myristoylome of a Higher Eukaryote, J. Biol. Chem. 278
(2003) 43418–43429. doi:10.1074/jbc.M307321200.
[45] D. Urano, A.M. Jones, Heterotrimeric G Protein–Coupled Signaling in Plants, Annu. Rev.
Plant Biol. 65 (2014) 365–84. doi:10.1146/annurev-arplant-050213-040133.
[46] C. a Johnston, J.P. Taylor, Y. Gao, A.J. Kimple, J.C. Grigston, J.-G. Chen, et al., GTPase
acceleration as the rate-limiting step in Arabidopsis G protein-coupled sugar signaling.,
Proc. Natl. Acad. Sci. U. S. A. 104 (2007) 17317–17322. doi:10.1073/pnas.0704751104.
[47] S. Wang, S.M. Assmann, N. V Fedoroff, Characterization of the Arabidopsis Heterotrimeric
G-Protein, 283 (2008) 13913–13922. doi:10.1074/jbc.M801376200.
[48] J.C. Jones, J.W. Duffy, M. Machius, B.R.S. Temple, H.G. Dohlman, A.M. Jones,
Supplementary Materials for The Crystal Structure of a Self-Activating G Protein α Subunit
Reveals Its Distinct Mechanism of Signal Initiation, Sci. Signal. 4 (2011) ra8.
doi:10.1126/scisignal.2001446.
85
[49] R.J. Kimple, M.E. Kimple, L. Betts, J. Sondek, D.P. Siderovski, Structural determinants for
GoLoco-induced inhibition of nucleotide release by Galpha subunits., Nature. 416 (2002)
878–81. doi:10.1038/416878a.
[50] Z. Chen, W.D. Singer, P.C. Sternweis, S.R. Sprang, Structure of the p115RhoGEF rgRGS
domain-Galpha13/i1 chimera complex suggests convergent evolution of a GTPase
activator., Nat. Struct. Mol. Biol. 12 (2005) 191–197. doi:10.1038/nsmb888.
[51] L.A. Marotti, R. Newitt, Y. Wang, R. Aebersold, H.G. Dohlman, Direct identification of a
G protein ubiquitination site by mass spectrometry, Biochemistry. 41 (2002) 5067–5074.
doi:10.1021/bi015940q.
[52] H. Ullah, J.G. Chen, S.C. Wang, A.M. Jones, N. Carolina, C. Hill, et al., Role of a
Heterotrimeric G Protein in Regulation of Arabidopsis Seed Germination, Plant Physiol.
129 (2002) 897–907. doi:10.1104/pp.005017.Glc-treated.
[53] H. Ullah, J. Chen, J.C. Young, K. Im, M.R. Sussman, A.M. Jones, Modulation of Cell
Proliferation by Heterotrimeric G Protein in Arabidopsis, 292 (2001) 2066–2069.
[54] R.R. Weerasinghe, S.J. Swanson, S.F. Okada, M.B. Garrett, S.Y. Kim, G. Stacey, et al.,
Touch induces ATP release in Arabidopsis roots that is modulated by the heterotrimeric G-
protein complex, FEBS Lett. 583 (2009) 2521–2526. doi:10.1016/j.febslet.2009.07.007.
[55] S. Pandey, J. Chen, A.M. Jones, S.M. Assmann, G-Protein Complex Mutants Are
Hypersensitive to Abscisic Acid Regulation of Germination and Postgermination
Development 1 [ W ], 141 (2006) 243–256. doi:10.1104/pp.106.079038.1.
[56] N. Greenfield, Using circular dichroism spectra to estimate protein secondary structure, Nat
Protoc. 1 (2007) 2876–2890. doi:10.1038/nprot.2006.202.Using.
[57] N.D. Lazo, D.T. Downing, Circular dichroism of model peptides emulating the amphipathic
alpha-helical regions of intermediate filaments, Biochemistry. 36 (1997) 2559–2565.
doi:10.1021/bi963061b\rbi963061b [pii].
86
[58] L. Whitmore, B.A. Wallace, Protein secondary structure analyses from circular dichroism
spectroscopy: Methods and reference databases, Biopolymers. 89 (2008) 392–400.
doi:10.1002/bip.20853.
[59] S. Brahms, J. Brahms, Determination of protein secondary structure in solution by vacuum
ultraviolet circular dichroism, J. Mol. Biol. 138 (1980) 149–178. doi:10.1016/0022-
2836(80)90282-X.
[60] B.N. Chaudhuri, Emerging applications of small angle solution scattering in structural
biology, Protein Sci. 24 (2015) 267–276. doi:10.1002/pro.2624.
[61] M. V. Petoukhov, D.I. Svergun, Analysis of X-ray and neutron scattering from
biomacromolecular solutions, Curr. Opin. Struct. Biol. 17 (2007) 562–571.
doi:10.1016/j.sbi.2007.06.009.
[62] B.K. Turkoz, Investigation of Cloning Strategies for A. thaliana G-Protein Alpha-subunit
Gene in Pichia pastoris, (2004).
[63] B. Turkoz, Structural Investigation of G-Protein Signaling in Plants, (2009).
[64] S.R. Martin, M.J. Schilstra, Circular Dichroism and Its Application to the Study of
Biomolecules, Methods Cell Biol. 84 (2008) 263–293. doi:10.1016/S0091-679X(07)84010-
6.
[65] S.B. Hladky, D.A. Haydon, Cleavage of Structural Proteins during the Assembly of the
Head of Bacteriophage T4, Nature. 227 (1970) 680–5.
[66] M. V. Petoukhov, D. Franke, A. V. Shkumatov, G. Tria, A.G. Kikhney, M. Gajda, et al.,
New developments in the ATSAS program package for small-angle scattering data analysis,
J. Appl. Crystallogr. 45 (2012) 342–350. doi:10.1107/S0021889812007662.
[67] P.V. Konarev, V.V. Volkov, A.V. Sokolova, M.H.J. Koch, D.I. Svergun, PRIMUS: a
Windows PC-based system for small-angle scattering data analysis, J. Appl. Crystallogr. 36
(2003) 1277–1282. doi:doi:10.1107/S0021889803012779.
[68] A. V. Semenyuk, D.I. Svergun, GNOM. A program package for small-angle scattering data
processing, J. Appl. Crystallogr. 24 (1991) 537–540. doi:10.1107/S002188989100081X.
87
[69] M. V Petoukhov, P. V Konarev, G. Kikhney, I. Dmitri, ATSAS 2.1 - towards automated
and web-supported small-angle scattering data analysis, J. Appl. Crystallogr. 40 (2007)
s223–s228.
[70] M. Guo, C. Aston, S.A. Burchett, C. Dyke, S. Fields, S.J.R. Rajarao, et al., The yeast G
protein alpha subunit Gpa1 transmits a signal through an RNA binding effector protein
Scp160, Mol. Cell. 12 (2003) 517–524. doi:10.1016/S1097-2765(03)00307-1.
[71] J.-G. Chen, F.S. Willard, J. Huang, J. Liang, S.A. Chasse, A.M. Jones, et al., A Seven-
Transmembrane RGS Protein That Modulates Plant Cell.pdf, Sci. Mag. 301 (2003).
doi:10.1126/science.1087790.
[72] H.B. Köse, Expression and purification of Arabidopsis thaliana G-protein Alpha Subunit
(GPA1) using bacteria and yeast systems, (2014).
[73] B.F.S. Willard, D.P. Siderovski, Purification and In Vitro Functional Analysis of the
Arabidopsis thaliana Regulator of, 389 (2002) 320–338. doi:10.1016/S0076-
6879(04)89019-0.
[74] J.D. Fox, D.S. Waugh, Maltose-binding protein as a solubility enhancer., Methods Mol.
Biol. 205 (2003) 99–117. doi:10.1385/1592593011.
[75] S. Macauley-Patrick, M.L. Fazenda, B. McNeil, L.M. Harvey, Heterologous protein
production using the Pichia pastoris expression system, Yeast. 22 (2005) 249–270.
doi:10.1002/yea.1208.
[76] B.V. and Z. Sayers, Investigating increasingly complex macromolecular systems with
small-angle X-ray scattering, IUCrJ. 1 (2014) 523–529. doi:10.1107/S2052252514020843.
[77] M.A. Graewert, D. Franke, C.M. Jeffries, C.E. Blanchet, D. Ruskule, K. Kuhle, et al.,
Automated Pipeline for Purification, Biophysical and X-Ray Analysis of
Biomacromolecular Solutions, Nat. Sci. Rep. 5 (2015) 10734. doi:10.1038/srep10734.
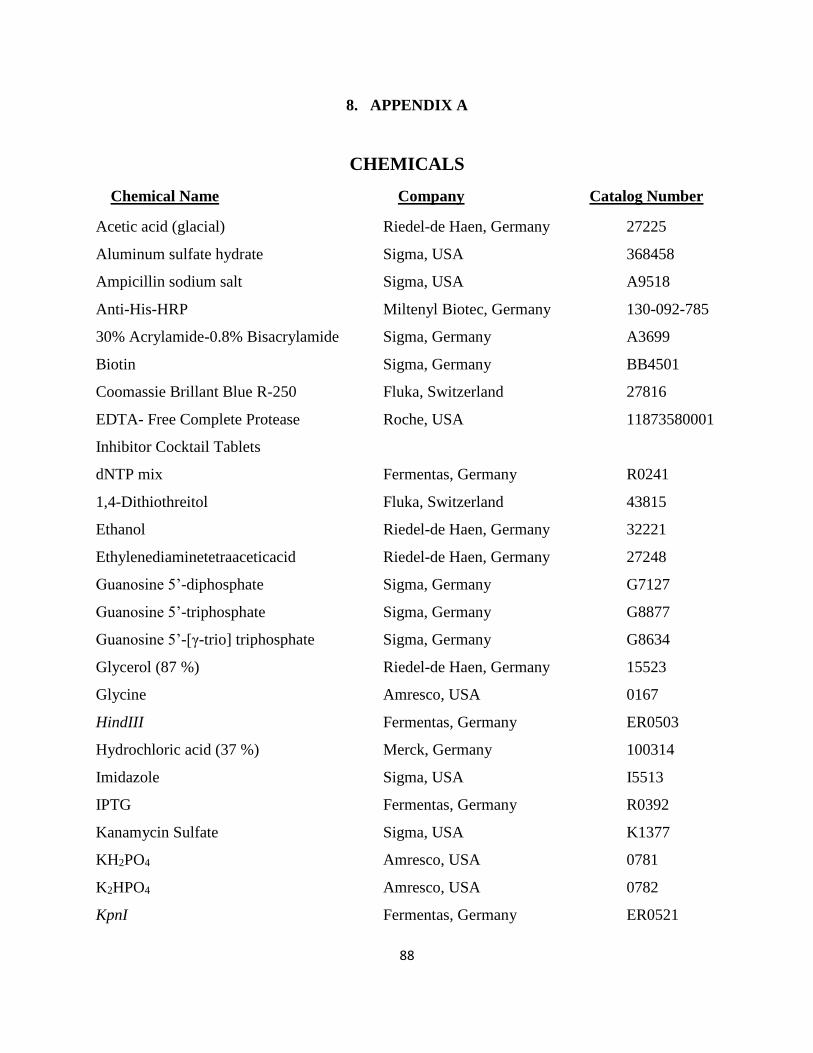
88
8. APPENDIX A
CHEMICALS
Chemical Name Company Catalog Number
Acetic acid (glacial) Riedel-de Haen, Germany 27225
Aluminum sulfate hydrate Sigma, USA 368458
Ampicillin sodium salt Sigma, USA A9518
Anti-His-HRP Miltenyl Biotec, Germany 130-092-785
30% Acrylamide-0.8% Bisacrylamide Sigma, Germany A3699
Biotin Sigma, Germany BB4501
Coomassie Brillant Blue R-250 Fluka, Switzerland 27816
EDTA- Free Complete Protease Roche, USA 11873580001
Inhibitor Cocktail Tablets
dNTP mix Fermentas, Germany R0241
1,4-Dithiothreitol Fluka, Switzerland 43815
Ethanol Riedel-de Haen, Germany 32221
Ethylenediaminetetraaceticacid Riedel-de Haen, Germany 27248
Guanosine 5’-diphosphate Sigma, Germany G7127
Guanosine 5’-triphosphate Sigma, Germany G8877
Guanosine 5’-[γ-trio] triphosphate Sigma, Germany G8634
Glycerol (87 %) Riedel-de Haen, Germany 15523
Glycine Amresco, USA 0167
HindIII Fermentas, Germany ER0503
Hydrochloric acid (37 %) Merck, Germany 100314
Imidazole Sigma, USA I5513
IPTG Fermentas, Germany R0392
Kanamycin Sulfate Sigma, USA K1377
KH2PO4 Amresco, USA 0781
K2HPO4 Amresco, USA 0782
KpnI Fermentas, Germany ER0521
89
Luria Agar Sigma, Germany L-3147
Luria Broth Sigma, Germany L-3022
Lysozyme Sigma, USA L7651
Magnesium chloride hexahydrate Merck, Germany 172571
MassRuler DNA Ladder Mix Fermentas, Germany SM0403
2-Mercaptoethanol Aldrich, Germany M370-1
Methanol Riedel-de Haen, Germany 24229
Sodium chloride Merck, Germany 106404
Sodium fluoride Sigma, USA 201154
Ni-NTA Agarose QIAGEN, USA 30230
Non-Fat Bovine Milk Powder Sigma, USA C3400
Peptone yeast extract Sigma, Germany 77196
PageRuler protein ladder Fermentas, Germany SM0661
Protein Molecular Weight Marker Fermentas, Germany SM0431
PVDF Membrane Sigma, USA P2938
Qiaprep Miniprep Kit Qiagen, USA 19064
Qiaquick PCR Purification Kit Qiagen, USA 28104
Qiaquick Gel Extraction Kit Qiagen, USA 28704
Sodium Chloride Riedel-de Haen, Germany 13423
Sodium dodecyl sulphate Sigma, USA L4390
T4 DNA Ligase Fermentas, Germany EL0011
T4 DNA Polymerase Fermentas, Germany EP0061
Taq polymerase Fermentas, Germany EP0401
Trizma base Sigma, USA T1403
Triton X-100 Applichem, Germany A1388
Tryptone Sigma, Germany 61044
Yeast Extract Sigma, Germany Y1625
Zeocin ThermoFisher, USA R25001
0.5 mm Zirconia/Silica Beads Biospec, USA 1107905Z
Zymolyase Amsbio, USA 120491
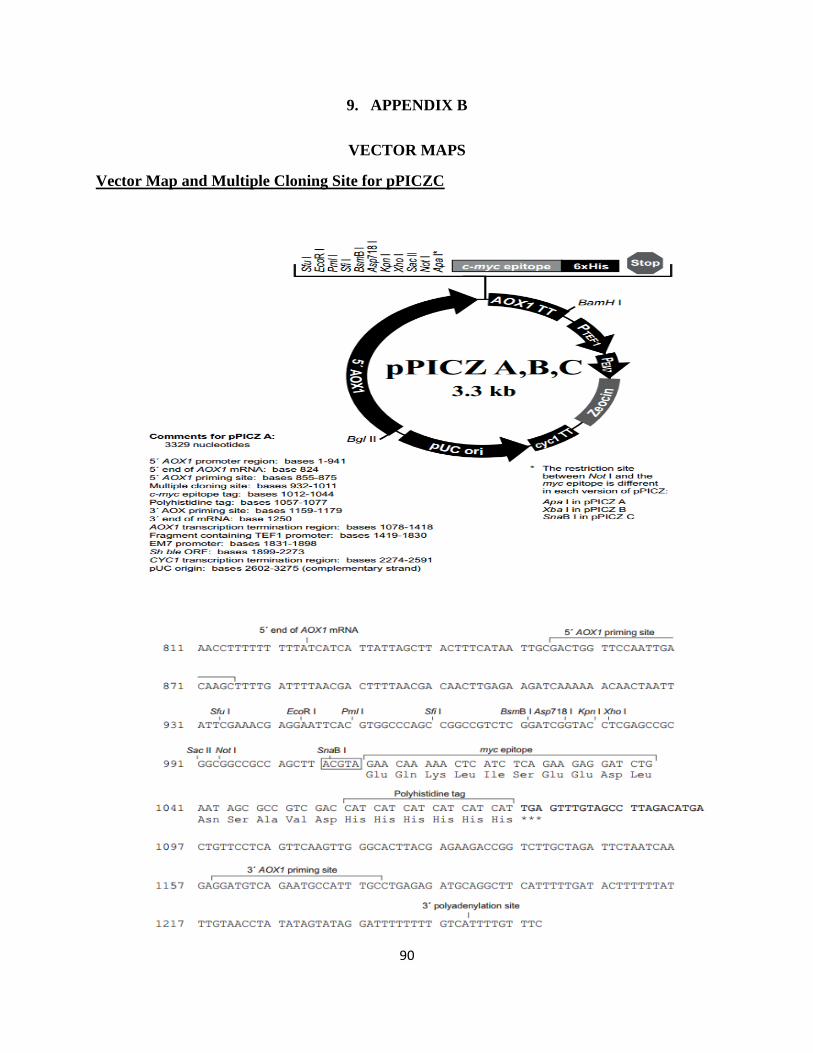
90
9. APPENDIX B
VECTOR MAPS
Vector Map and Multiple Cloning Site for pPICZC
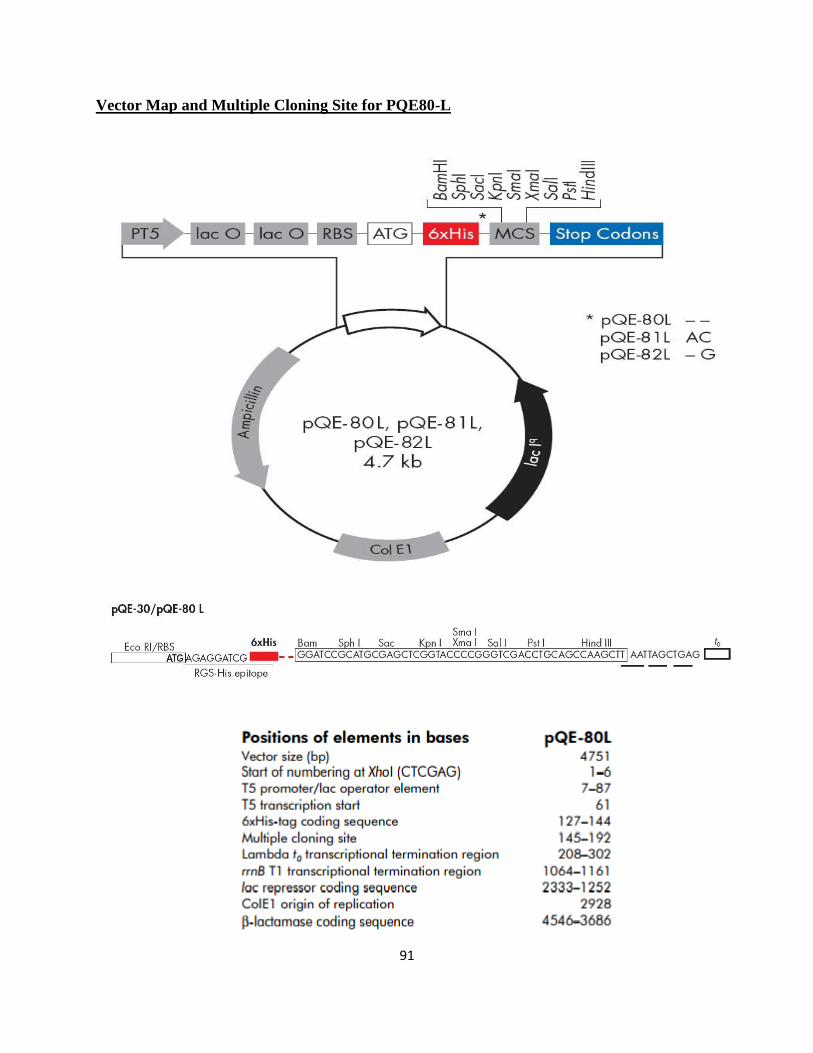
91
Vector Map and Multiple Cloning Site for PQE80-L
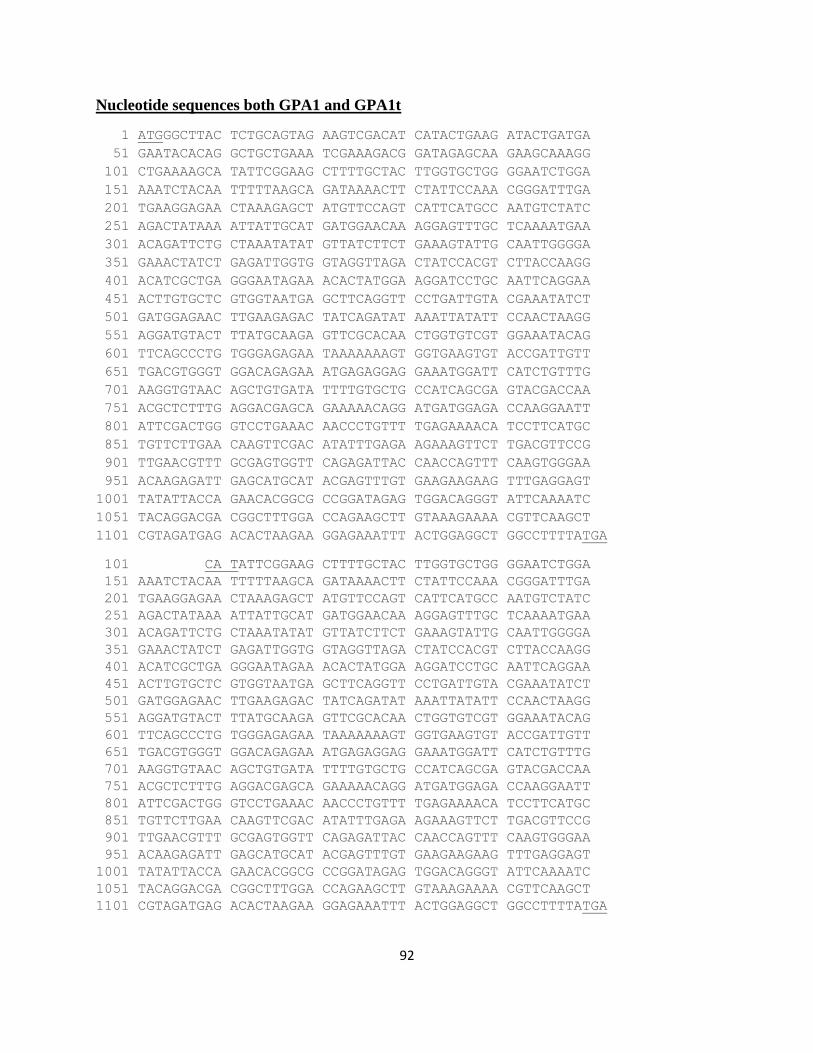
92
Nucleotide sequences both GPA1 and GPA1t
1 ATGGGCTTAC TCTGCAGTAG AAGTCGACAT CATACTGAAG ATACTGATGA
51 GAATACACAG GCTGCTGAAA TCGAAAGACG GATAGAGCAA GAAGCAAAGG
101 CTGAAAAGCA TATTCGGAAG CTTTTGCTAC TTGGTGCTGG GGAATCTGGA
151 AAATCTACAA TTTTTAAGCA GATAAAACTT CTATTCCAAA CGGGATTTGA
201 TGAAGGAGAA CTAAAGAGCT ATGTTCCAGT CATTCATGCC AATGTCTATC
251 AGACTATAAA ATTATTGCAT GATGGAACAA AGGAGTTTGC TCAAAATGAA
301 ACAGATTCTG CTAAATATAT GTTATCTTCT GAAAGTATTG CAATTGGGGA
351 GAAACTATCT GAGATTGGTG GTAGGTTAGA CTATCCACGT CTTACCAAGG
401 ACATCGCTGA GGGAATAGAA ACACTATGGA AGGATCCTGC AATTCAGGAA
451 ACTTGTGCTC GTGGTAATGA GCTTCAGGTT CCTGATTGTA CGAAATATCT
501 GATGGAGAAC TTGAAGAGAC TATCAGATAT AAATTATATT CCAACTAAGG
551 AGGATGTACT TTATGCAAGA GTTCGCACAA CTGGTGTCGT GGAAATACAG
601 TTCAGCCCTG TGGGAGAGAA TAAAAAAAGT GGTGAAGTGT ACCGATTGTT
651 TGACGTGGGT GGACAGAGAA ATGAGAGGAG GAAATGGATT CATCTGTTTG
701 AAGGTGTAAC AGCTGTGATA TTTTGTGCTG CCATCAGCGA GTACGACCAA
751 ACGCTCTTTG AGGACGAGCA GAAAAACAGG ATGATGGAGA CCAAGGAATT
801 ATTCGACTGG GTCCTGAAAC AACCCTGTTT TGAGAAAACA TCCTTCATGC
851 TGTTCTTGAA CAAGTTCGAC ATATTTGAGA AGAAAGTTCT TGACGTTCCG
901 TTGAACGTTT GCGAGTGGTT CAGAGATTAC CAACCAGTTT CAAGTGGGAA
951 ACAAGAGATT GAGCATGCAT ACGAGTTTGT GAAGAAGAAG TTTGAGGAGT
1001 TATATTACCA GAACACGGCG CCGGATAGAG TGGACAGGGT ATTCAAAATC
1051 TACAGGACGA CGGCTTTGGA CCAGAAGCTT GTAAAGAAAA CGTTCAAGCT
1101 CGTAGATGAG ACACTAAGAA GGAGAAATTT ACTGGAGGCT GGCCTTTTATGA
101 CA TATTCGGAAG CTTTTGCTAC TTGGTGCTGG GGAATCTGGA
151 AAATCTACAA TTTTTAAGCA GATAAAACTT CTATTCCAAA CGGGATTTGA
201 TGAAGGAGAA CTAAAGAGCT ATGTTCCAGT CATTCATGCC AATGTCTATC
251 AGACTATAAA ATTATTGCAT GATGGAACAA AGGAGTTTGC TCAAAATGAA
301 ACAGATTCTG CTAAATATAT GTTATCTTCT GAAAGTATTG CAATTGGGGA
351 GAAACTATCT GAGATTGGTG GTAGGTTAGA CTATCCACGT CTTACCAAGG
401 ACATCGCTGA GGGAATAGAA ACACTATGGA AGGATCCTGC AATTCAGGAA
451 ACTTGTGCTC GTGGTAATGA GCTTCAGGTT CCTGATTGTA CGAAATATCT
501 GATGGAGAAC TTGAAGAGAC TATCAGATAT AAATTATATT CCAACTAAGG
551 AGGATGTACT TTATGCAAGA GTTCGCACAA CTGGTGTCGT GGAAATACAG
601 TTCAGCCCTG TGGGAGAGAA TAAAAAAAGT GGTGAAGTGT ACCGATTGTT
651 TGACGTGGGT GGACAGAGAA ATGAGAGGAG GAAATGGATT CATCTGTTTG
701 AAGGTGTAAC AGCTGTGATA TTTTGTGCTG CCATCAGCGA GTACGACCAA
751 ACGCTCTTTG AGGACGAGCA GAAAAACAGG ATGATGGAGA CCAAGGAATT
801 ATTCGACTGG GTCCTGAAAC AACCCTGTTT TGAGAAAACA TCCTTCATGC
851 TGTTCTTGAA CAAGTTCGAC ATATTTGAGA AGAAAGTTCT TGACGTTCCG
901 TTGAACGTTT GCGAGTGGTT CAGAGATTAC CAACCAGTTT CAAGTGGGAA
951 ACAAGAGATT GAGCATGCAT ACGAGTTTGT GAAGAAGAAG TTTGAGGAGT
1001 TATATTACCA GAACACGGCG CCGGATAGAG TGGACAGGGT ATTCAAAATC
1051 TACAGGACGA CGGCTTTGGA CCAGAAGCTT GTAAAGAAAA CGTTCAAGCT
1101 CGTAGATGAG ACACTAAGAA GGAGAAATTT ACTGGAGGCT GGCCTTTTATGA
93
10. APPENDIX C
Buffers and Solutions
Tris-Acetate EDTA Buffer (TAE) (50X): 121.1 g Tris Base, 28.55 ml Glacial Acetic acid, 7.3 g
EDTA, completed to 500 ml.
2X Native Sample Buffer: 200 mM Tris-HCl pH 7.5, 20% (v/v) Glycerol, 0.05% (w/v)
Bromophenol Blue in ddH2O.
Native-PAGE Running Buffer: 25 mM Tris, 192 mM Glycine in ddH2O
2X SDS Sample Buffer: 4% (w/v) SDS, 20% (v/v) Glycerol, 0.004% (w/v) Bromophenol blue,
10% (v/v) 2-mercaptoethanol, 0.125 M Tris-HCl, pH 6.8 in ddH2O.
SDS-PAGE Running Buffer: 25 mM Tris, 192 mM Glycine, 0.1% (w/v) SDS in ddH2O.
Coomassie Staining Solution: 0.1 % (w/v) Coomassie Brillant Blue R-250, 40% (v/v) Methanol,
10% (v/v) Glacial Acetic acid in ddH2O.
Destaining Solution: 4 % (v/v) Methanol, 7.5 % (v/v) Glacial Acetic acid, completed to 1 L.
10X Transfer Buffer: 1,92 M Glycine, 250 mM Tris Base in 1 L. 200 ml Methanol is added to
the solution containing 1X Transfer Buffer
10X TBS Solution: 500 mM Tris Base, 45% NaCl, pH: 8.4. 500μl Tween-20 is added to 1X TBS
buffer.
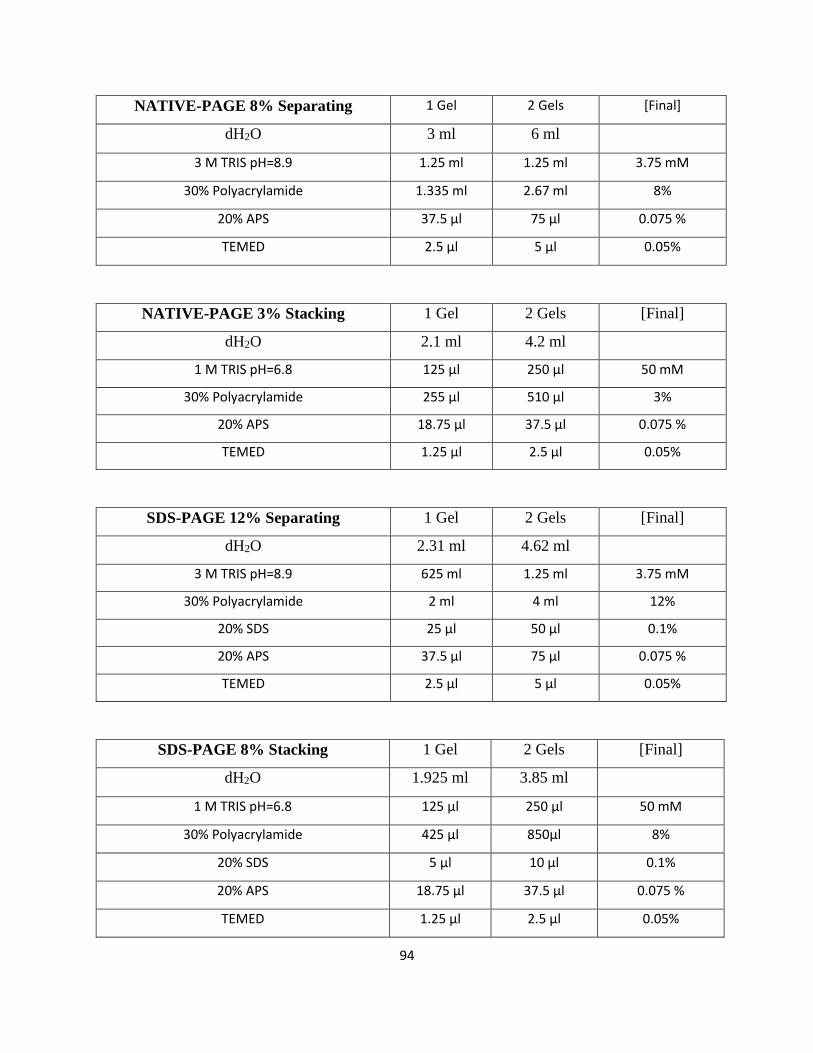
94
NATIVE-PAGE 8% Separating 1 Gel 2 Gels [Final]
dH2O 3 ml 6 ml
3 M TRIS pH=8.9 1.25 ml 1.25 ml 3.75 mM
30% Polyacrylamide 1.335 ml 2.67 ml 8%
20% APS 37.5 μl 75 μl 0.075 %
TEMED 2.5 μl 5 μl 0.05%
NATIVE-PAGE 3% Stacking 1 Gel 2 Gels [Final]
dH2O 2.1 ml 4.2 ml
1 M TRIS pH=6.8 125 μl 250 μl 50 mM
30% Polyacrylamide 255 μl 510 μl 3%
20% APS 18.75 μl 37.5 μl 0.075 %
TEMED 1.25 μl 2.5 μl 0.05%
SDS-PAGE 12% Separating 1 Gel 2 Gels [Final]
dH2O 2.31 ml 4.62 ml
3 M TRIS pH=8.9 625 ml 1.25 ml 3.75 mM
30% Polyacrylamide 2 ml 4 ml 12%
20% SDS 25 μl 50 μl 0.1%
20% APS 37.5 μl 75 μl 0.075 %
TEMED 2.5 μl 5 μl 0.05%
SDS-PAGE 8% Stacking 1 Gel 2 Gels [Final]
dH2O 1.925 ml 3.85 ml
1 M TRIS pH=6.8 125 μl 250 μl 50 mM
30% Polyacrylamide 425 μl 850μl 8%
20% SDS 5 μl 10 μl 0.1%
20% APS 18.75 μl 37.5 μl 0.075 %
TEMED 1.25 μl 2.5 μl 0.05%
95
11. APPENDIX D
Equipments
AKTA Prime: GE-Healthcare, SWEDEN
Autoclave: Hirayama, Hiclave HV-110, JAPAN, Certoclav, Table Top Autoclave CV-EL-12L,
AUSTRIA
Centrifuge: Eppendorf, 5415D, Eppendorf, 5415R, GERMANY, ThermoScientific, SORVALL
RC6+ Centrifuge, USA
Circular Dichroism: JASCO J-810 Spectometer, USA
Dynamic Light Scattering: Malvern, Zetasizer Nano-ZS, UK
Deepfreeze: -80oC, Kendro Lab. Prod., Heraeus Hfu486, GERMANY, -20oC, Bosch, TURKEY
Distilled water: Millipore, Elix-S, Millipore, MilliQ Academic, FRANCE
Electrophoresis: Biogen Inc., Biorad Inc., USA
Ice Machine: Scotsman Inc., AF20, USA
Incubator: Memmert, Modell 300, Modell 600, GERMANY
Laminar Flow: Kendro Lab. Prod., Heraeus, HeraSafe HS12, GERMANY
Magnetic Stirrer: Witeg, WiseStir Magnetic Stirrer, GERMANY
Microliter Pipette: Gilson, Pipetman, FRANCE
Microwave Oven: Bosch, TURKEY
pH Meter: WTW, pH540 GLP MultiCal, GERMANY
Power Supply: Biorad, PowerPac 300, USA
Refrigerator: +4oC, Bosch, TURKEY
Shaker: Forma Scientific, Orbital Shaker 4520, USA, GFL, Shaker 3011, USA, New Brunswick
Sci., Innova 4330, USA
Sonicator: BioBlock Scientific, Vibracell 7504, FRANCE
Spectrophotometer: Nanodrop, ND-2000, USA
Thermocycler: BIORAD, C1000 Touch Termal Cycler, USA
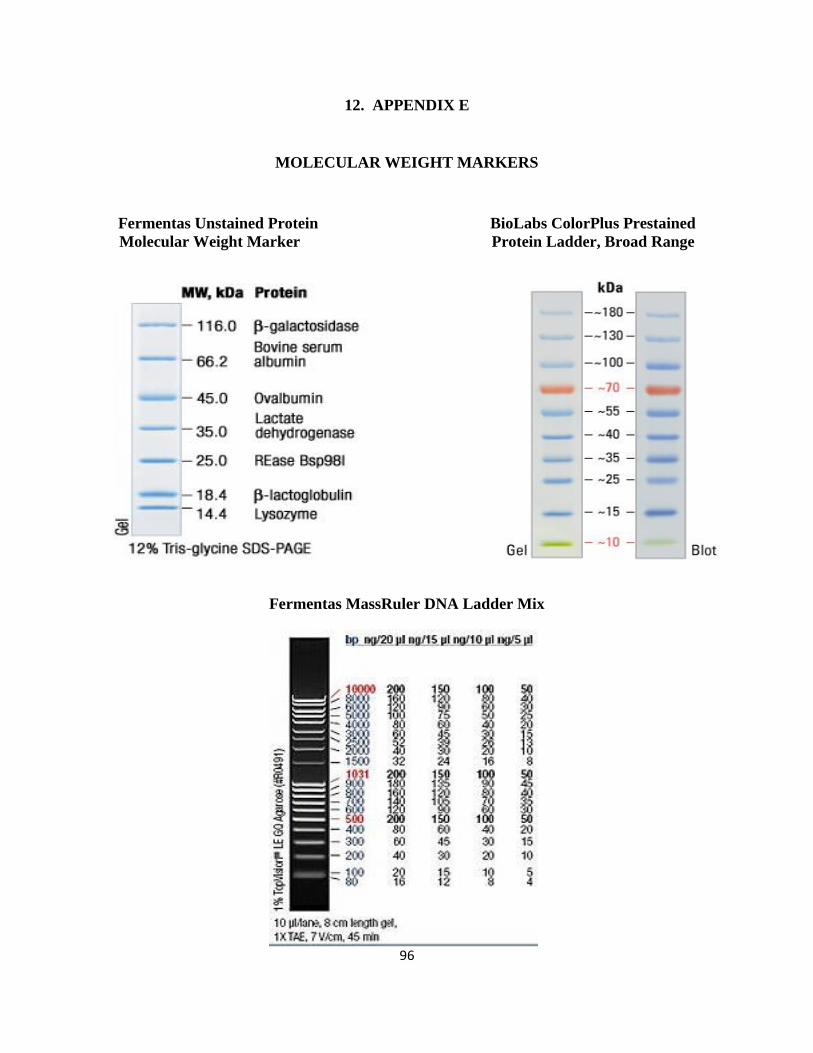
96
12. APPENDIX E
MOLECULAR WEIGHT MARKERS
Fermentas Unstained Protein BioLabs ColorPlus Prestained
Molecular Weight Marker Protein Ladder, Broad Range
Fermentas MassRuler DNA Ladder Mix