Finalised Area Profile 2015 - FORRES - Your Moray · Area profile . Forres (Farrais) is. ......
44
Transcript of Finalised Area Profile 2015 - FORRES - Your Moray · Area profile . Forres (Farrais) is. ......


1 /40
Forres, Moray
Area profile
Forres (Farrais) is a town and former royal burgh situated approximately 25 miles (40 km) east of
Inverness and 12 miles (19 km) west of Elgin near the Moray coast. The earliest written
reference to Forres may be the Οὐάραρ εἴσχυσις ('Varar Es tuary') mentioned in the second
century Geography of Claudius Ptolemy. A royal castle was in the area from at least 900 AD, and
around 1140 AD Forres became a royal burgh. Shakespeare's play Macbeth locates Duncan's
castle in Forres, and the Three Witches meet on a heath near the town in the third scene of the
drama. With a population of 9,951 (Census 2011) Forres is also a gateway town for the Whisky
Trail. There are two distilleries to be found in Forres itself. Dallas Dhu is a Victorian distillery
which is no longer in operation but is maintained in working order by Historic Scotland.
Benromach Distillery is an active distillery with a visitors' centre.
Corporate Policy Unit The Moray Council January 2016

2 /40
Table of Contents
1 Population Structure ..................................................................................... 4 1.1 Age profile ............................................................................................................. 4 1.2 Marital Status ........................................................................................................ 7
2 Identity............................................................................................................ 8 2.1 Ethnicity ................................................................................................................ 8 2.2 Country of Birth ..................................................................................................... 9 2.3 Religion ............................................................................................................... 10 2.4 Length of residency for residents born overseas ................................................. 11 2.5 Language ............................................................................................................ 11
3 Housing ........................................................................................................ 12 3.1 Tenure and House Type ...................................................................................... 13 3.2 Transport............................................................................................................. 14
4 Economy and Labour .................................................................................. 16 4.1 Economic Activity ................................................................................................ 16 4.2 Industry ............................................................................................................... 17 4.3 Occupation .......................................................................................................... 19 4.4 Unemployment .................................................................................................... 20 4.5 Transport............................................................................................................. 20
5 Education ..................................................................................................... 23 5.1 Attainment ........................................................................................................... 26 5.1.1 S4 Attainment ..................................................................................................... 26 5.1.2 S5 Attainment ..................................................................................................... 26 5.2 Leaver Destination .............................................................................................. 27
6 Health and Social care ................................................................................ 29 6.1 Health ................................................................................................................. 29 6.1.1 Maternity ............................................................................................................. 31 6.2 Social Care ......................................................................................................... 32 6.3 Hospital Emergency Admissions ......................................................................... 33
7 Antisocial Behaviour ................................................................................... 34
8 Access to Services ...................................................................................... 36 8.1 Drive time to (2012 data) ..................................................................................... 36 8.2 Public transport to (2012 data) ............................................................................ 37
9 Summary ...................................................................................................... 38

3 /40
Table 1 Age structure of Forres (2011) .................................................................................. 4 Table 2 Over–Sixties in 2001 and 2011 ................................................................................. 4 Table 3 16-29 year old in 2001 and 2011 .............................................................................. 5 Table 4 Marital Status .......................................................................................................... 7 Table 5 Ethnicity .................................................................................................................. 8 Table 6 Country of birth ........................................................................................................ 9 Table 7 Religion ................................................................................................................. 10 Table 8 Length of residence in the UK ............................................................................... 11 Table 9 Household Composition ........................................................................................ 12 Table 10 Tenure and House Type ...................................................................................... 13 Table 11 Cars per household ............................................................................................. 14 Table 12 Economic Activity ................................................................................................ 16 Table 13 Employment by Industry ...................................................................................... 17 Table 14 Occupation .......................................................................................................... 19 Table 15 Travel to Work ..................................................................................................... 21 Table 16 Education Facts ................................................................................................... 23 Table 17 Travel to study ..................................................................................................... 24 Table 18 Highest qualification ............................................................................................ 24 Table 19 S4 Attainment ...................................................................................................... 26 Table 20 S5 Education Attainment ..................................................................................... 26 Table 21 Leaver Destination .............................................................................................. 27 Table 22 Self-assessed Health ........................................................................................... 29 Table 23 Disability .............................................................................................................. 29 Table 24 Long Term health Conditions ............................................................................... 30 Table 25 Health Condition Prevalence rates by GP Practice .............................................. 30 Table 26 Teenage Pregnancies ......................................................................................... 31 Table 27 Provision of Unpaid Care ..................................................................................... 32 Table 28 Emergency Admissions ....................................................................................... 33 Table 29 Number of Antisocial Behaviour Complaints per 1000 population ........................ 34 Table 30 Crime rates .......................................................................................................... 35 Table 31 Drive time (minutes) ............................................................................................. 36 Table 32 Public Transport time to (Minutes) ........................................................................ 37 Table 33 SIMD 2012 Quintile ranks of the single datazone which covers the Forres area .. 38
Figure 1 Population profile of Forres and Moray at 2001 and 2011 ....................................... 5 Figure 2 Number of people employed in each of the groupings at 2001 and 2011 .............. 19

4 /40
1 Population Structure
1.1 Age profile
Forres had a population of 9,951 in 20111, which is an increase from 8,967 people who
lived in the town in 2001. This represents an 11% increase from 2001 to 2011, which is
significantly higher than Moray (7.3%) and Scotland (4.6%).
The age profile of Forres shows the median age for males was 43 and females was 46
which is 3 & 4 years respectively higher than the national averages.
Table 1 Age structure of Forres (2011)2
Age Forres Moray Scotland
% 0 to 4 years old 5.0 5.6 5.5
% 5 to 15 years old 12.1 12.6 11.8
% 16 to 29 years old 14.8 16.1 18.5
% 30 to 44 years old 18.4 19.1 20.0
% 45 to 59 years old 22.1 21.3 21.1
% 60 to 74 years old 18.0 16.9 15.5
% 75 years old and over 9.6 8.4 7.7
Table 1 above shows that, in 2011, the population structure of Forres had proportionally
more older people (and a lower proportion of young people) than Moray and Scotland,
49.7% are 45 and over, which is higher than Moray (46.6%) and Scotland (44.3%).
Both locally and nationally the over 60s population has shown an increase between the
two census dates, the population of Forres however has shown a more marked increase
(5.6%) between these two periods. Forres had a larger proportion of its population over
sixty (2.3% more) than Moray (4.4% more than Scotland) as table 2 below shows.
Table 2 Over–Sixties in 2001 and 2011
Age Forres Moray Scotland % over sixty 2001 22.0 21.5 21.1
% over sixty 2011 27.6 25.3 23.2
1 2011 census
2 2011 census

5 /40
Table 1 also shows a large difference between the percentages of 16-29 year olds in the
2011 Forres population compared to Moray and Scotland, with Forres being significantly
lower. This can also be seen in the fall in the proportion of this age group between 2001
and 2011 in Forres (see figure 1 and table 3 below) compared to an increase within this
age group in both Moray and Scotland.
Figure 1 Population profile of Forres and Moray at 2001 and 20113
There were relatively less school age children in Forres than the rest of Moray in the
2001 and 2011 censuses, which would affect the 16-29 year old population ten years
later in the 2011 census. Hence, Forres does have proportionally fewer 16-29 year olds
but the percentage of school leavers choosing to stay in Forres may be slightly
increasing.
Table 3 16-29 year old in 2001 and 2011
Age Forres Moray Scotland
% 16-29 years old 2001 15.1 15.8 17.5
% 16-29 years old 2011 14.8 16.1 18.5
3 2011 census

6 /40
The trends of the two censuses indicate that the population of Moray is getting older
while the percentage of young people staying in the area after leaving school is slightly
improving. The reason for the increasing over-sixty demographic is thought to be that
people are living longer. In Forres, the increase in the percentage of older people is
higher than for Moray and the relative population percentage continues to climb at a
higher rate.
The Scottish Government have predicted large rises in spending on health and social care
for the elderly (rising from £4.5 billion in 2011/12 to £8 billion in 20314) due to the
higher percentage rise in the numbers of over 60s in comparison to those in younger age
brackets. Hence, for a relatively older population in Forres, spending is expected to
increase proportionately.
4 http://www.audit-scotland.gov.uk/docs/central/2014/nr_140206_reshaping_care.pdf

7 /40
1.2 Marital Status
Table 4 Marital Status 5
Marital status Forres Moray Scotland
All people aged 16 and over 8,250 76,251 4,379,072
% Single (never married or never registered a same-sex civil partnership)
29.1 28.8 35.4
% Married or in a registered same-sex civil partnership 48.7 51.8 45.4
% Separated (but still legally married or still legally in a same-sex civil partnership)
3.5 3.1 3.2
% Divorced or formerly in a same-sex civil partnership which is now legally dissolved
9.6 8.5 8.2
% Widowed or surviving partner from a same-sex civil partnership
9 7.9 7.8
A lower proportion of residents in Forres are married or in a civil partnership compared
with the rest of Moray, but a higher level than Scotland.
Expanding on this, Forres does have a higher rate of widowed/surviving partner
individuals and has a higher incidence of people who are divorced or from legally
dissolved relationships.
5 2011 census

8 /40
2 Identity
2.1 Ethnicity
Table 5 Ethnicity 6
Ethnicity Forres Moray Scotland All people 9,951 93,295 5,295,403
% White - Scottish 75.5 77.7 84.0
% White - Other British 20.6 18.0 7.9
% White - Irish 0.5 0.5 1.0
% White - Polish 0.9 1.1 1.2
% White - Other 1.4 1.7 2.0
% Asian, Asian Scottish or Asian British 0.7 0.6 2.7
% Other ethnic groups 0.4 0.5 1.3
Percentage of households where not all persons are in same ethnic group category
16.1 14.5 10.6
Forres has a lower proportion of white Scottish residents compared with the rest of
Moray.
Over one fifth of residents in Forres are white Other British, which is slightly higher than
Moray as a whole and over two and a half times the national percentage. This much
higher rate will partly to be attributable to the close proximity of the Previous RAF,
current Army Barracks at Kinloss, the RAF base at Lossiemouth, and the Findhorn
Foundation. Over 12% employed people in Forres work in public administration or
defence (see section 4.1) which is close to the value for Moray and over 5% higher than
the national figure. In a comparison with Findhorn which has the same percentage (12%)
and Keith where only 3.3% worked in this field it shows the influence of the MOD bases
on their surrounding areas.
The cumulative Non Scottish White numbers equate to 23.4% of the Forres population.
This figure is slightly higher than Moray (21.3%) and almost twice that of Scotland
(12.1%) and added to the proportion of Scottish White residents makes Forres a
predominantly white population.
There are a higher percentage of households where residents are not from the same
ethnic group compared with both Moray and Scotland; this is likely to be due to the
number of households being made up of Scottish and Other British members.
6 2011 census

9 /40
2.2 Country of Birth
Table 6 Country of birth 7
Country of birth Forres Moray Scotland
All people 9,951 93,295 5,295,403
% Scotland 72.8 75.4 83.3
% England 20.1 17.8 8.7
% Wales 0.9 0.9 0.3
% Northern Ireland 0.9 0.7 0.7
% Republic of Ireland 0.3 0.2 0.4
% Other EU countries (inc UK part not specified)
2.7 2.9 2.6
% Other countries 2.3 2.1 4
In total, Forres has 94.7% British born residents compared to 94.8% in Moray and 93% in
Scotland.
Within this high proportion of British born residents, there was a higher proportion of
English born residents and a balancing lower proportion of Scottish born residents
compared with the rest of Moray. For similar reasons to those given in 2.1 the
distribution of English born residents within Moray is greatly influenced by the high
numbers of English born personnel at, and the location of, the two MOD bases. An
additional factor influencing these numbers may be the close proximity of the Findhorn
Foundation (see Findhorn Profile - where there is an even higher proportion of English
born residents (31.7%)).
7 2011 census

10 /40
2.3 Religion
Table 7 Religion 8
Religion Forres Moray Scotland
All people 9,951 93,295 5,295,403
% Church of Scotland 34.7 34.0 32.4
% Roman Catholic 6.4 6.6 15.9
% Other Christian 8.9 9.4 5.5
% Muslim 0.2 0.3 1.4
% Other religions 1.2 0.9 1.1
% No religion 41.5 41.2 36.7
% Not stated 7.1 7.7 7.0
Forres has a similar proportion of people stating their religious beliefs are that of the
Church of Scotland compared with both Moray and Scotland.
There are a similar proportion of Roman Catholics in the town compared with Moray;
however the rate is less than half of that of Scotland as a whole.
Forres differs slightly from Moray for having a slightly lower rate of those stating their
religious beliefs as “Other Christian”. This category is represented by 8.9% of the
resident population compared with 9.4% for Moray; however, the Forres figure is over
one and a half times higher than the rate for Scotland (5.5%). This value may be
influenced by the percentage of English (influenced by the military bases) in the Forres
population and also the Findhorn Foundation, where many different spiritual principles
are followed and where the rate of “Other Religions” is higher than in the rest of Moray.
8 2011 census

11 /40
2.4 Length of residency for residents born overseas
Table 8 Length of residence in the UK 9
Length of residence in UK Forres Moray Scotland
All people 9,951 93,295 5,295,403
All people born outside the UK 530 (5.3%) 4,883 (5.2%) 369,284 (7.0%)
% Resident in UK for less than 2 years 10.9 14.3 22.1
% Resident in UK for 2 years or more but less than 5 years
14.5 20.2 21.7
% Resident in UK for 5 years or more but less than 10 years
15.7 16.5 18.8
% Resident in UK for 10 years or more 58.9 49.0 37.4
5.3% of residents in Forres were born outside the United Kingdom which is similar to the
Moray average (5.2%) but less than the national figures (7.0%).
A greater proportion of Forres residents born outside the UK (58.9%) have been
“resident in the UK for 10 years or more” compared to 49% in Moray and 37.4% in
Scotland. Thus, there are lower rates in those “resident in the UK” in each of the other
three categories compared to Moray and Scotland. This gives the impression of a more
settled population but given the nature of the MOD bases and the Findhorn Foundation,
they were not necessarily resident in Forres for this period of 10 years, but resident in
the UK.
Only 10.9% of Forres residents have lived in the United Kingdom for less than two years.
2.5 Language
Of the 9,652 residents of Forres aged 3 and over, 98.7% speak English well or very well
which is similar to national figures. This is unsurprising given the high percentage, in
comparative terms, of residents born in the United Kingdom.
33.8% are able to speak Scots10 which is slightly higher than the national rate but
significantly lower than the Moray average (45.3%), which perhaps reflects the slightly
higher proportion of English born residents in Forres.
9 2011 census
10 Scots is the collective name for Scottish dialects

12 /40
3 Housing
Household composition is important information to determine local services provided by the
Council, its partners and the third sector.
Table 9 Household Composition 11
Household Composition Forres Moray Scotland
Total number of households (with residents) 4,556 40,062 2,372,777
% One person household - Aged 65 or over 15.1 13.7 13.1
% One person household - Aged under 65 19.6 16.4 21.6
% One family only: Lone parent: With dependent children 6.7 5.7 7.2
% One family only: Lone parent: All children non-dependent 3.2 3.5 3.9
% One family only: Married or same-sex civil partnership couple: With dependent children
13.1 15.9 13.6
% One family only: Married or same-sex civil partnership couple: No dependent children
19.7 21.7 18.4
% One family only: Cohabiting couple: With dependent children
3.8 4 3.7
% One family only: Cohabiting couple: No dependent children 5.2 5.5 5.5
% Other households: All full-time students - 0 0.9
% Other households: All aged 65 and over 10 9.7 7.8
% Other households: Other 3.5 3.9 4.4
There are 4,556 households in Forres with an average of 2.2 residents per household
which is marginally lower than the 2.3 residents per household in Moray but matches
the National average.
There is a higher proportion of one-person-over-65 households in Forres (15.1%)
compared with that of Moray (13.7%) and Scotland (13.1%). Having a higher rate of
elderly residents living alone is likely to put more pressure on Health & Social Care
services. The presence of very/sheltered housing in Forres may also be contributing to
this calculation.
Over-65 households in Forres account for over 25.1% of all households compared with
23.4% for Moray and 20.9% for Scotland. Although this is not as high as the likes of Keith
(28.6%), Forres has a higher population so a higher number and potential for demand
on services as the average age rises.
11
2011 census

13 /40
In Forres there is a lower proportion of households with dependent children (23.6%)
compared with both Moray (25.6%) and Scotland (24.5%). However there is a slightly
higher rate of lone parent households with dependent children in Forres (6.7%)
compared to Moray (5.7%) but this is still lower than the national (7.2%).
One-person households in Forres account for 34.7% of all households, which is higher
than Moray (30.1%) but the same as Scotland.
3.1 Tenure and House Type
Table 10 Tenure and House Type 12
Tenure Forres Moray Scotland
Total number of households (with residents) 4,556 40,062 2,372,777
% Owned 64.0 65.9 62.0
% Rented from Council 15.4 14.1 13.2
% Other social rented 7.8 5.2 11.1
% Private rented 11.6 12.6 12.4
% Living rent free 1.1 2.1 1.3
% House or bungalow 81.5 87.0 63.4
% Detached 30.7 37.2 21.9
% Semi - detached 27.1 31.4 22.8
% Terraced house (including end-terrace) 23.8 18.4 18.6
% Flat or maisonette or apartment 18.4 12.6 36.4
% Caravan or other mobile or temporary structure - 0.4 0.2
64% of all properties in Forres are owned by the occupants, this value is fairly similar to
the values for Moray (65.9%), Scotland (62%), but different from some of the more rural
areas.
15.4% of housing in the town is rented from the Council which is a higher proportion
than for Findhorn (3.6%), Moray (14.1%) and Scotland (13.2%) but lower than other
small towns in Moray such as Elgin (16.5%) and Keith (21.4%).
Moray has significantly less flats, maisonettes, or apartments (12.6%) than the rest of
Scotland (36.4%); however in Forres 18.4% of its properties are of this type, second only
to Elgin (22.7%) and a another reflection that Forres is more of an urban classification13
(Accessible Small Town).
12
2011 census 13
According to SIMD and the Six-fold Urban Rural Classification, Forres is an “Accessible Small Town”
14 /40
Forres, with 81.5%, has a smaller proportion of houses and bungalows than Moray at
87.0%, but both are much higher than the national average (63.4%).
Forres has a higher proportion of terraced housing than either Moray or Scotland with
23.8% compared to 18.4% and 18.6% respectively, this may be from prior MOD forces
housing (now sold to the public).
Less than a third (30.7%) of the Forres properties were detached, which proportionally is
higher than the national average (21.9%) and lower than the Moray average (37.2%). As
detached properties generally attract greater value and with the lower proportion of this
type of property in Forres, it is no surprise that the average house prices in Forres14
(£160,350) are higher than in Moray (£151,052). These have risen at a faster rate
(5.67%) in the past 12 months than Moray15 (2.75%).
In the past year a higher percentage of housing stock, 246 properties (8.44% of owned
properties), have been sold in Forres16 in comparison to 1,370 (5.19%) in Moray17. It may
be that other areas are restricted in the selling of council houses due to ‘protected area
status’.
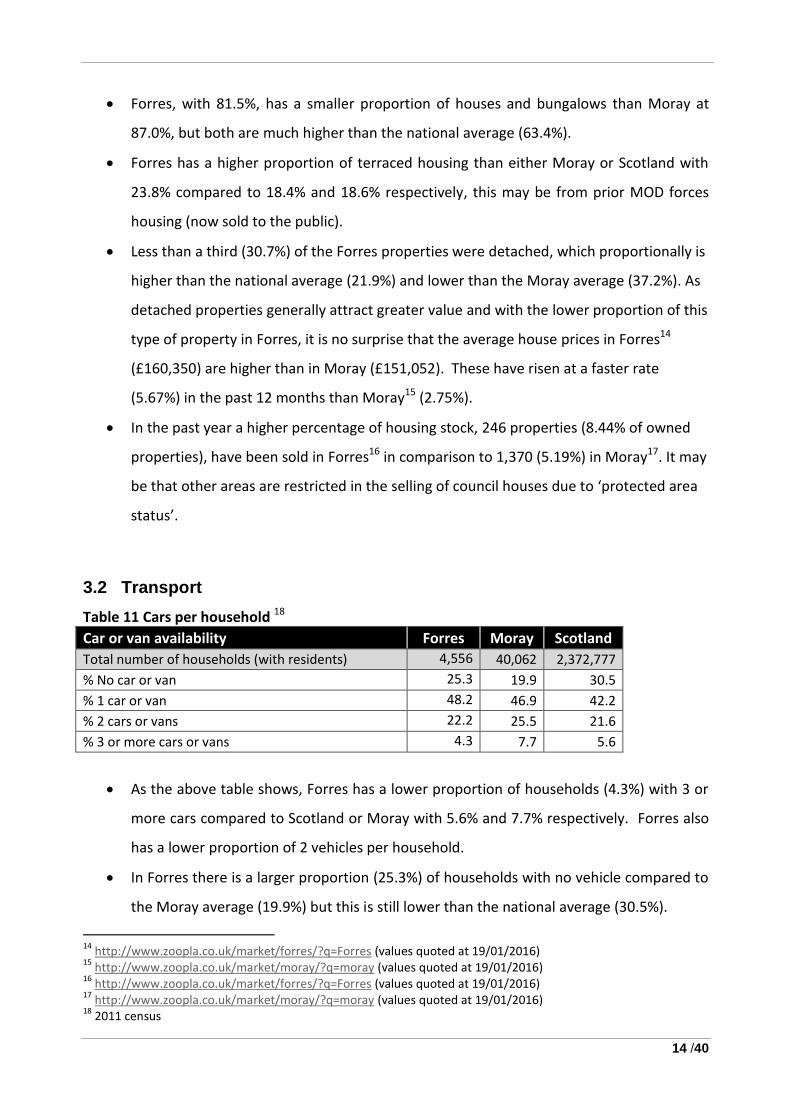
3.2 Transport
Table 11 Cars per household 18
Car or van availability Forres Moray Scotland
Total number of households (with residents) 4,556 40,062 2,372,777
% No car or van 25.3 19.9 30.5
% 1 car or van 48.2 46.9 42.2
% 2 cars or vans 22.2 25.5 21.6
% 3 or more cars or vans 4.3 7.7 5.6
As the above table shows, Forres has a lower proportion of households (4.3%) with 3 or
more cars compared to Scotland or Moray with 5.6% and 7.7% respectively. Forres also
has a lower proportion of 2 vehicles per household.
In Forres there is a larger proportion (25.3%) of households with no vehicle compared to
the Moray average (19.9%) but this is still lower than the national average (30.5%).
14
http://www.zoopla.co.uk/market/forres/?q=Forres (values quoted at 19/01/2016) 15
http://www.zoopla.co.uk/market/moray/?q=moray (values quoted at 19/01/2016) 16
http://www.zoopla.co.uk/market/forres/?q=Forres (values quoted at 19/01/2016) 17
http://www.zoopla.co.uk/market/moray/?q=moray (values quoted at 19/01/2016) 18
2011 census

15 /40
Also Forres has a larger proportion (48.2%) of households with a single vehicle compared
to Moray (46.9%) or Scotland (42.2%).
Given the link to the number of people who work at home, the number of
pupils/students that walk or cycle to school (see section 5), the accessibility of services
and public transport then there is perhaps a lesser need for cars in general hence a
higher number of no car or one-car households. Also with a higher proportion of elderly
there may be a number that no longer drive or due to ready access to services, public
transport and concessionary transport for people aged 60+ have less need to drive.

16 /40
4 Economy and Labour
4.1 Economic Activity
Table 12 Economic Activity 19
Economic Activity Forres Moray Scotland All persons 16 to 74 7,298 68,410 3,970,530
% Economically active 69.3 71.5 69.0
% Employees - part-time 16.3 15.7 13.3
% Employees - full-time 39.1 41.4 39.6
% Self-employed 6.5 8.4 7.5
% Unemployed 5.4 3.9 4.8
% Full-time student - employed 1.8 1.7 2.9
% Full-time student - unemployed 0.3 0.4 0.8
% Economically inactive 30.7 28.5 31.0
% Retired 18.2 16.3 14.9
% Student 3.3 3.4 5.5
% Looking after home or family 3.7 3.9 3.6
% Long-term sick or disabled 3.6 3.2 5.1
% Other 1.8 1.5 1.9
Forres has a largely similar level of economically active adults compared with Scotland
and Moray.
The cumulative values of all Economically Active people in employment, as employees
(full or part-time), in Forres (55.4%) show that there is a lower proportion of people
being employed than in Moray (57.1%) but higher than in Scotland (52.9%).
Since the 2001 census the percentage of people in Forres economically active in full time
employment has reduced from 44.2% to 39.1% in 2011, while in the same period the
economically active in part-time has increased from 13.9% to 16.3% and there is a similar
increase in those self-employed (from 5.8% to 6.5%).
The lower percentage of people being employed from Forres is countered by the higher
proportion that are retired (18.2% compared to 16.3% in Moray and 14.9% in Scotland),
and the slightly higher level of unemployment (5.4% compared to 3.9% in Moray and
4.8% in Scotland).
19
2011 census

17 /40
The slightly higher proportion of retired people in Forres compared with Moray and
Scotland is likely to be a reflection of the higher proportion of people over the age of 65
residing in Forres.
The rate of long-term sick and disabled people in Forres (3.6%) is lower than the Scottish
rate (5.1%) but higher than Moray (3.2%).
Forres has a relatively high percentage of unemployment (5.4%), compared to Moray
(4.8%) but this is still lower than its nearest neighbour Kinloss (6.6%).
4.2 Industry
Table 13 Employment by Industry 20
Industry Forres Moray Scotland
All persons aged 16 to 74 in employment 4,651 45,983 2,516,895
% A. Agriculture, forestry and fishing 2.2 3.2 1.7
% B. Mining and quarrying 1.5 2.9 1.4
% C. Manufacturing 7.8 12.1 8
% D. Electricity, gas, steam and air conditioning supply 0.3 0.3 0.8
% E. Water supply; sewage, waste management and remediation activities
0.6 0.6 0.8
% F. Construction 8.7 9.1 8
% G. Wholesale and retail trade; repair of motor vehicles and motorcycles
16.9 14.8 15
% H. Transport and storage 5.5 4.2 5
% I. Accommodation and food service activities 5.8 6 6.3
% J. Information and communication 1.6 1.1 2.7
% K. Financial and insurance activities 1.1 1.2 4.5
% L. Real estate activities 1.2 1.1 1.2
% M. Professional scientific and technical activities 3.6 3.5 5.2
% N. Administrative and support service activities 5.5 3.2 4.3
% O. Public administration and defence; compulsory social security
12.2 11.9 7
% P. Education 8.6 7.9 8.4
% Q. Human health and social work activities 12.9 12.7 15
% R, S, T, U. Other 3.9 4.1 4.9
20
2011 census

18 /40
The main Industries for employment for the residents of Forres are within: “Wholesale
and retail trade; repair of motor vehicles and motorcycles”; “Human health and social
work activities” and “Public administration and defence”, with the percentages
employed in these areas 16.9%, 12.9% and 12.2% respectively. The percentages
employed in Forres within these three areas are higher than Moray and although two of
the areas were higher than national, “Human health…” was lower than Scotland by over
2%.
The biggest differences between Moray as a whole and Forres were the proportion of
those employed in “Wholesale and retail trade; repair of motor vehicles and
motorcycles” and “Administrative and support service activities” where the difference
was more than 2% higher in Forres in each of these industry sectors.
In “Wholesale and retail trade; repair of motor vehicles and motorcycles” the proportion
for Forres (16.9%) was higher than Moray (14.8%) or national (15%) but lower than in
Keith (19.3%) or Elgin (17.6%).
Although the percentages are not vastly different, Forres has the highest proportions in
Moray of people working in the “Administration and support services activities”, 5.5%
compared to 3.2% in Moray and 4.3% nationally. This may be due to the presence of the
call centre in Forres.
Conversely, the proportion of those employed in “Manufacturing” in Forres (7.8%) was
over 4% lower than Moray (12.1%). This is not surprising as the Moray figure includes
some major manufacturing bases e.g. Dufftown (29.7%), Aberlour (35%), and Keith
(17.7%) which have no equivalent in Forres.
The biggest differences between Moray (11.9%) and the national figures (7%) were the
proportion of those employed in “Public administration and defence” where the
difference was more than 5% higher in Forres (12.2%) and Findhorn (12.5%) in this
industry sector, which is not surprising given the close proximity to the Kinloss and
Lossiemouth bases. Kinloss and Lossiemouth being even closer have higher percentages
still (38.9% and 30.7% respectively).
Conversely, the proportion of those employed in “Financial and insurance activities” in
Forres (1.1%) was over 3% lower than the national percentage (4.5%) but is similar to the
Moray proportion (1.2%).

19 /40
4.3 Occupation
Table 14 Occupation 21
Occupation Forres Moray Scotland
All persons 16 to 74 in employment 4,651 45,983 2,516,895
% Managers, directors and senior officials 6.5 7.6 8.4
% Professional occupations 12.3 11.4 16.8
% Associate professional and technical occupations
14.1 14.7 12.6
% Administrative and secretarial occupations 9.1 8.4 11.4
% Skilled trades occupations 14.9 16.6 12.5
% Caring, leisure and other service occupations 10.5 10 9.7
% Sales and customer service occupations 10.6 8.1 9.3
% Process, plant and machine operatives 8.3 10.4 7.7
% Elementary occupations 13.7 12.8 11.6
The top three highest income occupation groupings (see first three in table 14 above)
accounted for only 32.9% of the employed working population of Forres which is slightly
lower than Moray (33.7%), significantly lower than the national (37.8%) and varies
greatly from Findhorn, Kinloss (both over 56%), and Lossiemouth (over 43%).
Figure 2 Number of people employed in each of the groupings at 2001 and 2011
21
2011 census

20 /40
The biggest difference between the Moray area and Forres was the proportion of “Sales
and customer service occupations”, with Forres being higher (by 2.5%) than Moray
which reflects the higher proportion of people in the “Administrative and secretarial
occupations” category in the Industry sector in Forres compared to the other areas of
Moray, this may be due to the presence of the call centre. It also reflects the higher
proportion of people in the “Wholesale and retail trade; repair of motor vehicles and
motorcycles” industry (see section 4.1 above).
The other main area of difference was a lower proportion of “Process, plant and
machine operatives” in Forres, again reflecting a lower level of manufacturing in Forres
(8.3%) compared to Moray (10.4%).
Overall, “Skilled trades occupations” accounted for the highest proportion of those
employed from Forres (14.9%). This is also the case for Moray where the proportion is
16.6%. Nationally, the highest proportion of those employed is found in the
“Professional occupations” (16.8%), however these only account for 12.3% and 11.4% in
Forres and Moray respectively.
4.4 Unemployment
In the 2011 census of all persons in Forres aged 16-74, 5.4% (391 people) were
unemployed compared to 4.8% of people nationally. In Forres, this equates to a rise of
1.22% from the 2001 census figure of 4.14% (271 people).
In Forres, of those aged 16 to 74 who were unemployed, 35.8% were aged 16 to 24 and
21.7% were aged 50 to 74. Nationally these figures were both lower (30.2% and 18.4%
respectively) and in Moray they were also both lower than Forres (34.7% and 19.9%
respectively).
Although 9.7% of those listed as unemployed in Forres have “Never Worked” (slightly
higher than Moray (9.1%)), this is significantly lower than the national level of 13.9%.
Also Forres seems to have a lower proportion of long term unemployed (last worked
before 2005) compared to national levels and a resultant higher proportion who last
worked in 2010 to 2011 (i.e. in the last 12 months before the census).
4.5 Transport

21 /40
Forres has a similar level of residents travelling to work by car (63%), to both Moray and
Scotland where nearly two thirds of people use this mode of transport. However the
proportion of those using a bus is a third of the rate seen nationally but similar to Moray
as a whole.
A high percentage of Forres residents walk to work, given the distance to any other
major settlement it would indicate that these residents live and work locally within the
community. There are also a large number of residents who use “other” modes of
transport to travel to their workplace, some of these methods may include; bicycle,
motorbike etc. A lower proportion of Forres residents work from home (10.2%), in
comparison with Moray (12.1%) and Scotland (10.8%) but given the proximity to the
town and the industries and occupations involved e.g. Call Centre operatives and MOD
base personnel this perhaps is not surprising and similar rates are found in Kinloss and
Lossiemouth (both around 10%).
Table 15 Travel to Work 22
Travel to work Forres Moray Scotland
All persons aged 16 to 74 who were in employment (excluding full-time students)
4,520 44,816 2,400,925
% Car (including passengers car pools and taxis) 63 63.7 62.4
% Train 2.5 2.2 3.7
% Bus 3.8 3.4 10
% On foot 13.7 12.2 9.9
% Other 6.8 6.3 3.1
% Works mainly at or from home 10.2 12.1 10.8
Between the 2001 and 2011 censuses, the percentage using a train or bus increased to
6.3% from 5.1%. Meantime car use decreased slightly to 63% from 66.4% coming more
in line with Moray as a whole.
Walking to work was not specifically mentioned in the 2001 census but “other “methods,
which would have included walking, reduced from 24.1% in 2001 to 20.5% in 2011.
Additionally, the working from home rate increased by just under 6%, up from 4.4% to
10.2% between 2001 and 2011.
The last few points indicate that the “other” methods and “car” have decreased as more
people are working from home or using public transport.
22
2011 census

22 /40
Forres shows close similarities to Kinloss and Lossiemouth in the each of the categories
(taking “on foot” and “other” together), while there are distinct differences between
Forres and Findhorn e.g. working at home in Findhorn (24.3%) was more than double the
Forres rate (10.2%). Overall Forres is closest to the Moray transport to work profile, with
the main differences in walking to work and working from home.

23 /40
5 Education
Table 16 Education Facts 23
Interesting facts Forres Moray Scotland
Percentage 16 to 17 year olds in education 74.3 76.6 79.8
Percentage of households where no person aged 16 to 64 has a highest level of qualification of Level 2 or above, or no person aged 16-18 is a full-time student
50.7 49 47.2
Forres has a slightly lower number of 16-17 year olds in full time education than the rest
of Moray and Scotland, indicating that pupils are leaving school early and either entering
or seeking employment or training. Given the occupations prevalent in Forres,
mentioned in section 4.2, and the leaver destinations in section 5.2 this could be the
“Skilled trades occupations” or “Sales and customer service occupations” (e.g. call
centre) offering opportunities and/or apprenticeships. However, the unemployment rate
for younger people in Forres is higher than national and Moray levels (see section 4.3).
With a rate of 74.3% Forres shows a lower proportion of 16-17 year olds in education
than Hopeman (88.9%) but higher than Dufftown or Portgordon (61.9% and 64.3%
respectively).
Forres (with 50.7%) has a slightly higher proportion of households, compared with both
Moray (49%) and Scotland (47.2%), where no one holds a national level qualification
above level 2 (SCE Higher or similar) or no person aged 16-18 is a full-time student. This
is significantly higher than Kinloss (26%) but lower than Keith, Rothes, Dufftown,
Aberlour or Buckie all of which are above 58%, (the highest of these being Keith with
60.7%).
23
2011 census

24 /40
Table 17 Travel to study 24
Travel to study Forres Moray Scotland
All people aged 4 and over studying 1,588 15,771 996,282
% Car (including passengers car pools and taxis) 25 23.2 22.3
% Train 1 1 2.9
% Bus 9.1 20.3 21.5
% On foot 52.1 41.5 39.1
% Other 2.6 2 1.7
% Studies mainly at or from home 10.1 12 12.4
In Forres a significantly higher proportion (52.1%) of pupils/students walked to school
compared to the rest of Scotland and Moray, this is likely to be due to the Primary and
Secondary schools being located in Forres itself and it being a tight geographic locality. A
higher proportion (2.6%) of pupils/students used “other” means (e.g. bicycle) which was
higher than both the national and Moray figures. There is also a high proportion of
households with one car or no car (see section 3.2) which may indicate the need for
walking or the lack of need for the car.
Despite Forres’ tight geographic locality, 25% travel to school by car, this is higher than
both the Moray and national percentages. Forres is approx. 2.5 miles from end to end
and with 63% of those employed from Forres, travelling by car (see section 4.4), and a
high proportion of households with only one car (see section 3.2) then there may be an
element of dropping off pupils on the way to work.
Table 18 Highest qualification 25
Highest qualification26 Forres Moray Scotland
All persons aged 16 and over 8250 76,251 4,379,072
% With no qualifications 26.3 26.7 26.8
% Highest qualification attained - Level 1 26.2 26.3 23.1
% Highest qualification attained - Level 2 14.5 14.4 14.3
% Highest qualification attained - Level 3 9.8 9.9 9.7
% Highest qualification attained - Level 4 and above 23.1 22.7 26.1
24
2011 census 25
Census 2011 http://www.scotlandscensus.gov.uk/variables-classification/highest-level-qualification
26 The following table shows what the levels used in the census mean.
Level 1 Standard Grade (equivalent or above) Level 2 Higher (equivalent or above)
Level 3 HNC (equivalent or above) Level 4 Degree (equivalent or above)

25 /40
The proportion of persons aged 16 and over without any qualifications in Forres (26.3%)
is similar to Moray and National proportions.
Forres has a similar proportion educated to degree level and beyond, compared with
Moray but this is slightly lower than the national figure. This information supports what
is found in the occupation, unemployment and the leaver destination sections (see
sections 4.2, 4.2 & 5.2).
Forres in general is the area with a profile closest to the Moray profile, but has a
significantly lower proportion having attained a qualification at level 4 or above
compared to Findhorn (48.1%) however Forres is also significantly higher than Keith
(14.2%) or Buckie (14.7%), these two areas have the highest rates of those with no
qualifications.

26 /40
5.1 Attainment
5.1.1 S4 Attainment
Table 19 S4 Attainment 27
Name Forres Moray Scotland
Total S4 Students from 2008/9 to 2012/13 496 5,499 280,909
S4: No pupils with 5 awards at SCQF level 5 and above 192 2,161 103,795
Percentage of pupils with 5 awards at SCQF level 5 and above 38.7% 39.3% 36.9%
Average S4 Tariff (approx) 183 198 185
The average S4 Tariff score for Forres, which takes into account the number of awards
achieved by each pupil and their grades, was similar to Moray’s and higher than
Scotland’s over the 5 years between 2008/09 and 2012/13. The tariff score suggests that
S4 attainment in Forres is similar to the rest of Scotland but lower than Moray.
The percentage of S4 pupils from Forres who attained five or more level-5 awards
(Standard Grade Credit or Intermediate 2 level) is higher than the national rate but lower
than the Moray rate.
5.1.2 S5 Attainment
Table 20 S5 Education Attainment 28
Name Forres Moray Scotland
Total Students for S5 398 4,380 235,893
S5: No pupils with 1 award at SCQF level 6 and above : 2008/9 - 2012/13 237 1,996 101,481
S5: Percentage of pupils with 1 award at SCQF level 6 and above : 2008/9 - 2012/13
59.6% 45.6% 43.0%
S5: No pupils with 3 awards at SCQF level 6 and above : 2008/9 - 2012/13 141 1,399 74,789
S5: Percentage of pupils with 3 awards at SCQF level 6 and above : 2008/9 - 2012/13
35.4% 31.9% 31.7%
S5: No pupils with 5 awards at SCQF level 6 and above : 2008/9 - 2012/13 58 595 34667
S5: Percentage of pupils with 5 awards at SCQF level 6 and above : 2008/9 - 2012/13
14.6% 13.6% 14.7%
5 year Tariff average (approx) 366 365 347
Because each year there is a low number of S5 pupils sitting exams the data provided
uses a 5 year period from 2008/09-2012/13 to gain a larger sample size to explore how
attainment in Forres compares with the rest of Moray and Scotland.
27
Data for the 5 year period from 2008/09-2012/13, Source – Scottish Neighbourhood Statistics - http://www.sns.gov.uk 28
Data for the 5 year period from 2008/09-2012/13, Source – Scottish Neighbourhood Statistics - http://www.sns.gov.uk

27 /40
Across the first two attainment areas, Forres performs significantly better than Moray
and Scotland with larger percentages achieving one or three awards at “level 6 or
above”. However, although Forres is higher than Moray in achieving five awards at “level
6 or above” its rate is about the same as Scotland’s.
Compared to other areas for attaining 1, or 3 awards at level 6 or above, Forres with
59.6% and 35.4% is lower than Findhorn or Aberlour but higher than Keith or Dufftown.
Fifty-eight out of 398 S5 pupils from Forres over the 5 years achieved five or more level 6
(Higher Grade) awards.
The tariff scores in Forres are above Scotland but about the same as Moray, on average.
5.2 Leaver Destination
Table 21 Leaver Destination 29
Name Forres Moray Scotland
Total leavers 452 5,237 265,363
Higher Education 36.1% 33.3% 36.0%
Further Education 25.0% 27.2% 27.1%
Training 3.1% 1.5% 5.7%
Employment 24.3% 28.7% 19.7%
Total Positive 88.5% 90.7% 88.4%
Unemployment and seeking employment or training
9.7% 7.4% 9.6%
Unemployed not seeking employment or training
1.8% 1.7% 1.3%
Total Negative Destination 11.5% 9.1% 10.9%
Unknown 0% 0.2% 0.6%
Forres has a slightly higher proportion of pupils entering Higher Education (36.1%) than
the rest of Moray (33.3%) and about the same as the national proportion. This compares
well against Kinloss (25.6%) although well behind Alves (49.6%).
The proportion of pupils entering employment from Forres (24.3%) is higher than the
national (19.7%) but significantly lower than Moray (28.7%) by 4.4%.
Whilst Moray shows similar averages to the national values for those entering Further
Education, Forres has a lower proportion choosing this avenue as a positive destination.
Forres has a similar level of positive destinations to Scotland, however Forres is slightly
lower than Moray, and the difference is accounted for in a slightly higher level of
unemployment (see section 4.3).
29
Data for the 5 year period from 2008/09-2012/13, Source – Scottish Neighbourhood Statistics - http://www.sns.gov.uk

28 /40
Many of the other areas in Moray do not have any training, in Forres this is not the case
with 3.1% of leavers accounted for in this destination.

29 /40
6 Health and Social care
6.1 Health
Table 22 Self-assessed Health 30
Forres Moray Scotland
All people 9,951 93,295 5,295,403
% Very good 51.9 53.7 52.5
% Good 32.4 31.3 29.7
% Fair 11.5 11.1 12.2
% Bad 3.1 2.9 4.3
% Very bad 1.2 0.9 1.3
As detailed in the table above Forres shows much similarity with both Moray and
Scotland as a whole. There are no notable differences within any of the fields.
Over 84% of Forres residents describe themselves as being of either “Very good” or
“Good” health compared to 85% in Moray and 82.2% in Scotland.
Forres has a higher average proportion of older residents than either local or national. So
despite Forres having this older demographic, the combined proportion of residents
describing themselves as being in bad or very bad health is 4.3%, lower than the national
rate (5.6%) but higher than the Moray rate (3.8%).
Table 23 Disability 31
Long-term health problem or disability Forres Moray Scotland
All people 9,951 93,295 5,295,403
% Limited a lot 8.4 7.6 9.6
% Limited a little 11.3 10.2 10.1
% Not limited 80.4 82.3 80.4
19.7% (1,960 people) of Forres residents stated they were limited a little or a lot by a
disability or long term health issue, higher than the Moray figure but the same as the
national percentage.
30
2011 census 31
2011 census

30 /40
Table 24 Long Term health Conditions 32
Long-term health condition Forres Moray Scotland
All people 9,951 93,295 5,295,403
% With no condition 68.5 70.9 70.1
% With one or more long-term health conditions 31.5 29.1 29.9
% With deafness or partial hearing loss 7.9 7 6.6
% With blindness or partial sight loss 2.9 2.5 2.4
% With learning disability (for example, Down's Syndrome) 0.5 0.5 0.5
% With learning difficulty (for example, dyslexia) 2.2 2 2
% With developmental disorder (for example, Autistic Spectrum Disorder, Asperger's Syndrome)
0.7 0.6 0.6
% With physical disability 6.5 5.8 6.7
% With mental health condition 4 3.2 4.4
% With other condition 19.3 18.2 18.7
There are no major differences within the fields above in relation to either Local or
National figures.
Slightly more 31.5% (29.1% Moray) of Forres residents have one or more long term
health conditions.
The most prevalent in the table above is deafness or partial hearing loss (7.9%), followed
by physical disability (6.5%) and mental health condition (4.0%).
Table 25 Health Condition Prevalence rates by GP Practice 33
Health Condition Prevalence Rates (per 100 patients) Forres Moray Scotland
“Smoking” (conditions assessed for smoking) 24.33 25.52 24.74
Hypertension 13.65 14.84 13.94
Obesity 10.74 10.53 8.05
Depression 7.41 3.58 5.5
Diabetes 5.30 5.49 4.79
The table above shows the 5 most common health conditions recorded at the Forres
Health & Care Centre, which is served by two GP Practices, Forres Health Centre, and
Varis Medical Practice. The data collection is from March 2013 to April 2014 through the
NHS Quality & Outcomes framework. The two practices serve a large area that covers
Forres and surrounding areas with a total GP patient roll of 15,638 (January 2013). For
comparison, the Moray and Scotland rates have been included.
32
2011 census 33
https://isdscotland.scot.nhs.uk/Health-Topics/General-Practice/Publications/2014-09-30/QOF_Scot_201314_Practice_prevalencev2.xls

31 /40
The top three health conditions reported through GP Practices are the same for Forres,
Moray and nationally. The Forres Health & Care Centre shows a lower incidence relating
to smoking condition and hypertension compared to Moray.
The rates of depression at the Forres Health & Care Centre are the highest in Moray and
are more than double the rate for Moray and over a third higher than the national rate.
While the rates for mental health in Forres are not the highest in Moray, they are among
the highest and above the Moray and national averages.
Diabetes rates in Forres are slightly lower than the Moray rate but remain higher than
the national rates, while the obesity rates in Forres (10.74 pre 100) are slightly higher
than the Moray (10.53) rate and significantly higher (over 33% higher) than the national
(8.01).
Of the 24 health conditions recorded at GP Practices through the NHS Quality &
Outcomes Framework, Forres Health & Care Centre had 12 conditions where the raw
prevalence rates per 100 patients were above the national rate, these were: Obesity;
Depression; Diabetes; Cardiovascular Disease (2.63); Heart Failure (0.94);
Hypothyroidism (5.35); Mental Health (0.91); Chronic Kidney Disease (4.44); Cancer
(2.20); Atrial Fibrillation (1.96); Peripheral Arterial Disease (1.09); and Rheumatoid
Arthritis (0.68).
6.1.1 Maternity
Table 26 Teenage Pregnancies 34
Name Moray Scotland
Teenage pregnancies aged under 16, rate per 1000 women aged 13_15. : 2009-2011
5.6 6.6
Teenage pregnancies aged under 18, rate per 1000 women aged 15_17. : 2009-2011
27.5 34.4
Teenage pregnancies aged under 20, rate per 1000 women aged 15_19. : 2009-2011
42.7 49
There are relatively fewer teenage pregnancies in Moray than for the rest of Scotland.
There is a decreasing trend for teenage pregnancies in Moray.
34
Source – Scottish Neighbourhood Statistics - http://www.sns.gov.uk

32 /40
Data for Forres teenage pregnancies is not freely available. However in the six years
between 2006 and 2011 there were 47 recorded births to a first time mother35 where
the mother was a under the age of twenty and living in Forres.
Smoking during pregnancy: There were 102 incidents of women from Forres recorded as
being smokers (at the time of booking) in the six years from 2008-13. The percentage of
pregnant women who smoke at booking is 21.2% for Moray and 20% for Scotland
(2013). For Forres the percentage varies greatly between the two areas of Forres that
are used to measure namely “Forres Central East and seaward” has a rate of 7.4% while
“Forres South West and Mannachie” is much higher at 34.6%. Buckie has the highest
rate in Moray at 36.4% so this second area of Forres is the second highest intermediate
area in Moray.
6.2 Social Care
Table 27 Provision of Unpaid Care 36
Provision of unpaid care Forres Moray Scotland
All people 9,951 93,295 5,295,403
% Not providing care 91 91.6 90.7
% Providing 1 to 19 hours of care a week 5 4.8 5.2
% Providing 20 to 34 hours of care a week 0.9 0.7 0.9
% Providing 35 to 49 hours of care a week 0.5 0.6 0.8
% Providing 50 or more hours of care a week 2.6 2.2 2.5
896 (9%) of Forres residents provide care to either a friend or family member.
Nearly 56% of those who carry out unpaid care in Forres provide 1 to 19 hours of care a
week.
259 (2.6%) of residents in Forres provide over 50 hours of care per week, which is higher
than the Moray rate and fractionally higher than the national rate.
35
http://www.sns.gov.uk/ 36
2011 census

33 /40
6.3 Hospital Emergency Admissions
Table 28 Emergency Admissions 37
Forres Moray Scotland
Emergency admissions - both sexes - all ages - rate/100,000 : 2012
8,139 7,476 10,194
Emergency admissions - both sexes - aged 65 and over - rate/100,000 : 2012
18,197 16,945 25,493
The rate of Emergency Admissions (for all ages) in Forres is higher than the rest of Moray
but is significantly lower than the national average. For all ages, residents of Forres are
20% less likely to be admitted to hospital as an emergency than Scotland as a whole.
The Forres residents who are 65 and over, are 28% less likely to be admitted to hospital
as an emergency than nationally but more likely than those in the rest of Moray.
Comparing Forres residents of all ages with those aged 65 and over, the rates for those
over 65 are 2.2 times higher than the overall Forres population.
In general emergency admissions are higher in areas nearer a hospital and less so in rural
and more remote areas. This is reflected in the rates in Forres, Dufftown in relation to
Moray but the Moray rates are some of the lowest nationally.
37
Source – Scottish Neighbourhood Statistics - http://www.sns.gov.uk

34 /40
7 Antisocial Behaviour
Table 29 Number of Antisocial Behaviour Complaints per 1000 population 38
Type of Complaint Forres Moray
Noise 16.8 12.2
Rowdy Behaviour 4.9 4.0
Neighbour Dispute 2.5 3.9
Graffiti 0.2 0.3
Vandalism 9.6 8.1
Litter 0.1 1.7
Fly Tipping 0.2 3.5
Dog Fouling 1.0 1.3
Forres had a higher rate of incidents of Anti-Social Behaviour compared to Moray (35.1
to 34.9 per 1000 pop. per year).
Across the following complaint types, Forres was higher than the Moray averages: Noise;
Vandalism; Rowdy Behaviour, while in other types such as Litter, and Fly Tipping they are
considerably lower. Overall Forres almost twice as high as Kinloss (18.5 per 1000 pop.
per year) and five times as high as Alves (7.0 per 1000 pop. per year).
In 2012, the ranking of the thirteen Forres datazones ranged from quintile 1 to 5 for
crime in the Scottish Index of Multiple Deprivation (SIMD)39 rankings with Forres Central
ranking 1 to the outer areas of Forres ranking 5. This shows that datazones with a more
concentrated population had a higher crime rate.
When broken down further into Vigintiles the Forres Datazones ranged from 19 (with a
SIMD rank of 5976 with a negligible crime rate per 10,000 population) down to 1 (with a
rank of 143 and a crime rate of 1,574 per 10,000) placing it in the most deprived 5% .
This shows that there are pockets of higher crime in Forres.
38
Average number of complaints per year over the two years 2012/13 and 2013/14 – from police records 39
The SIMD is the Scottish Government's official tool for identifying those places in Scotland suffering from deprivation. It incorporates several different aspects of deprivation, combining them into a single index. It divides Scotland into 6,505 small areas, called datazones, each containing around 350 households. The Index provides a relative ranking for each datazone, from 1 (most deprived) to 6,505 (least deprived).

35 /40
Table 30 Crime rates 40
Number of Crimes per 1,000 residents per year
Year Forres Moray 2012/13 91.4 95.7
2013/14 77.5 101.1
From the above table, Forres’ crime rates for both years were less than Moray as a
whole and the rate in 2013/14 fell in Forres unlike Moray, which went up. The main
reason for the fall in Forres numbers and rate, was a fall in the number of incidents of
“Miscellaneous (Minor Assault, Breach of the Peace, Threatening Behaviour)”, “Other
Crimes (Knives, Supply/Possession of Drugs)” and “Crimes of Dishonesty”.
40
From police records of reported crimes

36 /40
8 Access to Services
The Scottish Index of Multiple Deprivation rates 6,506 Datazones across Scotland and gives a
scoring of between 1 and 5 (1 being the most deprived, 5 being the least deprived) to seven key
domains (Income, Housing, Health, Employment, Education/Skills & Training, Crime and Access
to services). In the “Access to Services” area Forres data zones range from the most deprived to
the least deprived quintiles with Forres Mannachie ranking as 1 (most deprived) and Forres
Central as 5 (least deprived) despite the drive times and public transport times listed below.
8.1 Drive time to (2012 data)
Table 31 Drive time (minutes) 41
Name (Datazone) GP Post
Office Petrol Station
Primary School
Secondary School
Shopping Facilities
Forres Mannachie 4.5 4.3 4.1 5.6 3.7 4.7
Forres Forbeshill 5.4 4.4 2.6 3.8 5.0 4.1
Forres Sueno 5.2 4.2 2.3 4.3 4.8 3.9
Forres Balnaferry 3.2 3.1 3.6 3.9 3.5 4.0
Forres Greshop 4.0 3.3 2.6 2.9 4.6 4.2
Forres Thornhill 2.9 2.8 3.3 3.6 3.1 3.7
Forres Plasmon Mills 2.9 2.8 3.3 4.7 3.3 3.7
Forres St Leonards 3.3 2.9 1.7 2.9 2.4 2.6
Forres Waterford 3.3 1.7 2.2 4.0 3.9 3.1
Forres Pilmuir 2.8 2.5 2.6 2.6 3.0 3.4
Forres Grant Park 3.5 2.4 1.5 2.1 3.2 2.1
Forres Burdshaugh 1.8 1.9 2.0 1.9 1.6 2.6
Forres Central 2.5 1.5 1.3 1.8 2.5 1.3
Moray 5.0 3.8 4.9 4.4 6.4 7.1
Virtual Comparator 5.4 4.2 5.7 5.2 7.9 7.4
The above table provides estimated journey times by car to essential services for those
residing in different datazones in Forres ranked from the most deprived at the top to
the least deprived at the bottom. Apart from 6 areas/destinations marked in red bold
among the Forres listings, all the other areas have a lower drive time to the services
than Moray and/or the virtual comparator.
41
The SIMD divides Scotland into 6,505 small areas, called datazones, each containing around 350 households. The Index provides a relative ranking for each datazone. In quintiles, the rankings are 1 (most deprived) to 5 (least deprived).

37 /40
8.2 Public transport to (2012 data)
Table 32 Public Transport time to (Minutes) 42
The above table provides estimated journey times by public transport to essential
services for those residing in Forres. All are below the Moray or virtual times with the
exception of three areas where the journey to the Post Office is above both the Moray
and virtual comparator average.
42
The SIMD divides Scotland into 6,505 small areas, called datazones, each containing around 350 households. The Index provides a relative ranking for each datazone. In quintiles, the rankings are 1 (most deprived) to 5 (least deprived).
Datazone GP Post
Office Shopping Facilities
Forres Mannachie 16.6 18.0 18.5
Forres Forbeshill 17.0 15.7 16.0
Forres Sueno 11.9 10.6 10.8
Forres Balnaferry 13.9 15.9 17.2
Forres Greshop 10.8 9.7 9.7
Forres Thornhill 11.4 12.9 13.7
Forres Plasmon Mills 10.1 11.8 13.1
Forres St Leonards 11.7 11.4 9.1
Forres Waterford 9.7 6.8 9.6
Forres Pilmuir 7.6 8.2 8.8
Forres Grant Park 7.7 6.2 5.0
Forres Burdshaugh 3.1 4.3 6.9
Forres Central 5.4 3.9 2.2
Moray 17.8 13.9 21.4
Virtual Comparator 16.1 13.0 19.5

38 /40
9 Summary
Table 33 SIMD 2012 Quintile ranks of the single datazone which covers the Forres area 43
Name Income Housing Health Employment Education/
Skills/ Training
Crime Access to Services
Overall
Forres Mannachie 5 5 5 4 5 5 1 5
Forres Forbeshill 5 5 5 5 5 5 2 5
Forres Sueno 5 5 5 5 5 4 2 5
Forres Balnaferry 3 5 4 4 4 4 2 4
Forres Greshop 2 4 5 3 2 2 3 3
Forres Thornhill 2 3 4 3 2 3 3 3
Forres Plasmon Mills
2 1 3 2 1 3 3 2
Forres St Leonards 5 5 5 5 5 2 4 5
Forres Waterford 2 4 2 1 3 2 4 2
Forres Pilmuir 3 4 3 3 3 3 4 3
Forres Grant Park 2 3 2 2 4 2 5 2
Forres Burdshaugh 2 4 2 2 3 2 5 2
Forres Central 2 3 2 1 2 1 5 1
Although Forres as a whole may resemble Moray as a whole there are a number of
differences between areas within Forres (shown in table 33 above in the variance of SIMD
quintiles) and also between Forres and Moray some of which are listed below…
1. 49.7% of the Forres population are above the age of 45, which is higher than Moray
(46.6%) and Scotland (44.3%).
2. In the 10 years between 2001 & 2011, Forres has seen an overall population rise of 11%
and in the same period, the proportion of over-sixties has risen by 5.6% from 22% to
27.6%. With a higher percentage of older people coupled with a higher percentage
widowed, divorced, and single people potentially living alone this is likely to increase
public expenditure in this area.
3. 20.6% of Forres residents are of “White – Other British” dissent, which is higher than
Moray (18%) and differs dramatically from Scotland (7.9%). Looking at the country of
birth (20.1% England), along with the cumulative percentages of other white groups
(Irish, Polish, & Other) shows the effect that the defence bases and the Findhorn
Foundation have on the diversity of ethnicity and origin in the Forres area.
43
The SIMD divides Scotland into 6,505 small areas, called datazones, each containing around 350 households. The Index provides a relative ranking for each datazone. In quintiles, the rankings are 1 (most deprived) to 5 (least deprived).

39 /40
4. Forres has a higher rate of widowed/surviving partner individuals and has a higher
incidence of people who are divorced or from legally dissolved relationships.
5. Forres has a higher percentage of single occupant households (34.7%), (Moray 30.1%,
Scotland 34.7%). Forres also has 25.1% of households where residents are above the age
of 65. This may increase the cost of social care, as any needs would be less likely to be
met by either family or friends.
6. Moray has significantly less flats, maisonettes, or apartments (12.6%) than the rest of
Scotland (36.4%); however in Forres 18.4% of its properties are of this type. Forres also
has a higher than national proportion of houses and bungalows (81.5%).
7. Forres has a larger proportion of households with no vehicle or just one than the rest of
Moray.
8. Compared to Moray, there is a higher proportion of Forres residents who are retired
(18.2%), are long-term sick (3.6%), and a higher proportion who are unemployed (5.4%),
or in part-time work (16.3%), and a lower proportion of self-employed (6.5% compared
to Moray (8.4%)) giving a picture of a slightly more dependant environment.
9. “Wholesale and retail trade; repair of motor vehicles and motorcycles” is the industry
category which accounts for the largest proportion (16.9%) of Forres residents in
employment, though with the proximity to the MOD bases “Public administration and
defence; compulsory social security” appears in the top three. Although the figure is not high,
Forres has the highest proportions in Moray of people working in “Administration and
support services activities”.
10. “Skilled trades’ occupations” accounted for the highest proportion of those employed
from Forres (14.9%) while the biggest difference between the Moray area and Forres
was the proportion of “Sales and customer service occupations”.
11. Although Forres did not have the highest rate of unemployment of the areas of within
Moray, the rate was significant enough to mention including the increase over the past
decade.
12. Of those travelling to work or school, a lower proportion of Forres residents work from
home compared to the rest of Moray. Higher proportions walk to work or school or use
“other” modes of transport.
13. Forres has a slightly lower rate of 16-17 year olds in full time education than the rest of
Moray and Scotland.

40 /40
14. Forres has a similar proportion educated to degree level and beyond, compared with
Moray but this is slightly lower than the national figure.
15. In relation to attainment, the tariff score suggests that S4 attainment in Forres is similar
to the rest of Scotland but lower than Moray while the S5 attainment is closer to Moray
levels but higher than national.
16. Despite the above lower attainment, Forres has a slightly higher proportion of pupils
entering Higher Education (36.1%) than the rest of Moray (33.3%). Forres has also a
higher proportion of pupils entering training than many areas of Moray.
17. Over 84% of Forres residents describe themselves as being of either “Very good” or
“Good” health compared to 85% in Moray and 82.2% in Scotland despite a higher than
average proportion of older residents and the prevalence of 12 conditions out of 24
(measured by the QOF) being higher than national.
18. The rates of Emergency hospital admissions from Forres are higher than Moray but
significantly lower than the national figures.
19. While the rates for mental health in Forres are not the highest in Moray, they are among
the highest while the rate of depression is the highest and both are above the Moray and
national averages. Obesity it another condition where rates are higher in Forres.
20. Rates of Smoking while pregnant is higher in the Forres South West and Mannachie area
than it is for the majority of areas in Moray, yet in Forres Central, East and seaward it is
much lower.
21. The rate of incidents of anti-social behaviour in Forres was slightly higher than Moray as
a whole. The crime figures for Forres are on a decreasing trend as opposed to an
increasing trend for the Moray area; however, there are pockets of higher crime
identified by the datazones.


D-01555
Performance Management OfficerCorporate Policy Unit
The Moray council
Tel: 01343 543451