EffectsofUbiquinol-10onMicroRNA-146aExpression...
8
Hindawi Publishing Corporation Mediators of Inflammation Volume 2009, Article ID 415437, 7 pages doi:10.1155/2009/415437 Research Article Effects of Ubiquinol-10 on MicroRNA-146a Expression In Vitro and In Vivo Constance Schmelzer, 1 Mitsuaki Kitano, 2 Gerald Rimbach, 3 Petra Niklowitz, 4 Thomas Menke, 4 Kazunori Hosoe, 5 and Frank D¨ oring 1 1 Institute of Human Nutrition and Food Science, Molecular Nutrition, Christian-Albrechts-University of Kiel, Heinrich-Hecht-Platz 10, 24118 Kiel, Germany 2 Frontier Biochemical and Medical Research Laboratories, Kaneka Corporation, Takasago, Hyogo, Japan 3 Institute of Human Nutrition and Food Science, Food Science, Christian-Albrechts-University of Kiel, Hermann-Rodewald-Street 6, 24098 Kiel, Germany 4 Vestische Kinder-und Jugendklinik Datteln, Universit¨ at Written/Herdecke, Dr.-Friedrich-Steiner Street 5, 45711 Datteln, Germany 5 Functional Food Ingredients Division, Kaneka Corporation, Osaka, Japan Correspondence should be addressed to Frank D¨ oring, [email protected] Received 27 October 2008; Revised 2 February 2009; Accepted 22 February 2009 Recommended by Philipp M. Lepper MicroRNAs (miRs) are involved in key biological processes via suppression of gene expression at posttranscriptional levels. According to their superior functions, subtle modulation of miR expression by certain compounds or nutrients is desirable under particular conditions. Bacterial lipopolysaccharide (LPS) induces a reactive oxygen species-/NF-κB-dependent pathway which increases the expression of the anti-inflammatory miR-146a. We hypothesized that this induction could be modulated by the antioxidant ubiquinol-10. Preincubation of human monocytic THP-1 cells with ubiquinol-10 reduced the LPS-induced expression level of miR-146a to 78.9 ± 13.22%. In liver samples of mice injected with LPS, supplementation with ubiquinol-10 leads to a reduction of LPS-induced miR-146a expression to 78.12 ± 21.25%. From these consistent in vitro and in vivo data, we conclude that ubiquinol-10 may fine-tune the inflammatory response via moderate reduction of miR-146a expression. Copyright © 2009 Constance Schmelzer et al. This is an open access article distributed under the Creative Commons Attribution License, which permits unrestricted use, distribution, and reproduction in any medium, provided the original work is properly cited. 1. Introduction MicroRNAs (miRs) are endogenous ∼22 nucleotide non- coding RNAs which suppress gene expression at posttran- scriptional levels by binding to the 3 -untranslated region of specific mRNA targets through base pairing [1]. A number of recent studies reveal that miRs have critical functions in key biological processes such as cell proliferation and cell death during development [2], fat metabolism [3, 4], or insulin secretion [5]. Expression profiling approaches implicated a differential expression of several miRs in cancer cells [1]. Regulated expression of miRs is scarcely understood but is of special interest in the context of innate immunity and inflammation [6]. Expression profiling of more than 200 miRs in human monocytic THP-1 cells revealed that miR- 146a is substantially inducible by LPS or other Toll-like receptor ligands [7]. Moreover, promoter analysis of the miR-146a gene suggests a role of NF-κB in LPS-dependent upregulation of miR-146a [7]. Modulation of the LPS → reactive oxygen species → NF- κB signalling pathway and dependent miR-146a expression could be an approach in order to fine-tune the inflammatory response. The importance of such a modulation is of special interest because the balance between pro- and anti- inflammatory signals is critical in certain inflammatory dis- eases such as atherosclerosis. Here we hypothesized that the reduced form of Coenzyme Q 10 (QH 2 , ubiquinol-10) affects LPS-inducible expression of the anti-inflammatory miR- 146a. The hypothesis was based on functions of CoQ 10 as a potent antioxidant and putative modulator of inflammation via gene expression [8, 9]. In the present work, we tested our hypothesis using an in vitro and an in vivo model. Initially,
Transcript of EffectsofUbiquinol-10onMicroRNA-146aExpression...
Hindawi Publishing CorporationMediators of InflammationVolume 2009, Article ID 415437, 7 pagesdoi:10.1155/2009/415437
Research Article
Effects of Ubiquinol-10 on MicroRNA-146a ExpressionIn Vitro and In Vivo
Constance Schmelzer,1 Mitsuaki Kitano,2 Gerald Rimbach,3 Petra Niklowitz,4
Thomas Menke,4 Kazunori Hosoe,5 and Frank Doring1
1 Institute of Human Nutrition and Food Science, Molecular Nutrition, Christian-Albrechts-University of Kiel,Heinrich-Hecht-Platz 10, 24118 Kiel, Germany
2 Frontier Biochemical and Medical Research Laboratories, Kaneka Corporation, Takasago, Hyogo, Japan3 Institute of Human Nutrition and Food Science, Food Science, Christian-Albrechts-University of Kiel,Hermann-Rodewald-Street 6, 24098 Kiel, Germany
4 Vestische Kinder-und Jugendklinik Datteln, Universitat Written/Herdecke, Dr.-Friedrich-Steiner Street 5, 45711 Datteln, Germany5 Functional Food Ingredients Division, Kaneka Corporation, Osaka, Japan
Correspondence should be addressed to Frank Doring, [email protected]
Received 27 October 2008; Revised 2 February 2009; Accepted 22 February 2009
Recommended by Philipp M. Lepper
MicroRNAs (miRs) are involved in key biological processes via suppression of gene expression at posttranscriptional levels.According to their superior functions, subtle modulation of miR expression by certain compounds or nutrients is desirable underparticular conditions. Bacterial lipopolysaccharide (LPS) induces a reactive oxygen species-/NF-κB-dependent pathway whichincreases the expression of the anti-inflammatory miR-146a. We hypothesized that this induction could be modulated by theantioxidant ubiquinol-10. Preincubation of human monocytic THP-1 cells with ubiquinol-10 reduced the LPS-induced expressionlevel of miR-146a to 78.9 ± 13.22%. In liver samples of mice injected with LPS, supplementation with ubiquinol-10 leads to areduction of LPS-induced miR-146a expression to 78.12 ± 21.25%. From these consistent in vitro and in vivo data, we concludethat ubiquinol-10 may fine-tune the inflammatory response via moderate reduction of miR-146a expression.
Copyright © 2009 Constance Schmelzer et al. This is an open access article distributed under the Creative Commons AttributionLicense, which permits unrestricted use, distribution, and reproduction in any medium, provided the original work is properlycited.
1. Introduction
MicroRNAs (miRs) are endogenous ∼22 nucleotide non-coding RNAs which suppress gene expression at posttran-scriptional levels by binding to the 3′-untranslated region ofspecific mRNA targets through base pairing [1]. A number ofrecent studies reveal that miRs have critical functions in keybiological processes such as cell proliferation and cell deathduring development [2], fat metabolism [3, 4], or insulinsecretion [5]. Expression profiling approaches implicated adifferential expression of several miRs in cancer cells [1].Regulated expression of miRs is scarcely understood but isof special interest in the context of innate immunity andinflammation [6]. Expression profiling of more than 200miRs in human monocytic THP-1 cells revealed that miR-146a is substantially inducible by LPS or other Toll-like
receptor ligands [7]. Moreover, promoter analysis of themiR-146a gene suggests a role of NF-κB in LPS-dependentupregulation of miR-146a [7].
Modulation of the LPS→ reactive oxygen species→NF-κB signalling pathway and dependent miR-146a expressioncould be an approach in order to fine-tune the inflammatoryresponse. The importance of such a modulation is ofspecial interest because the balance between pro- and anti-inflammatory signals is critical in certain inflammatory dis-eases such as atherosclerosis. Here we hypothesized that thereduced form of Coenzyme Q10 (QH2, ubiquinol-10) affectsLPS-inducible expression of the anti-inflammatory miR-146a. The hypothesis was based on functions of CoQ10 as apotent antioxidant and putative modulator of inflammationvia gene expression [8, 9]. In the present work, we tested ourhypothesis using an in vitro and an in vivo model. Initially,
2 Mediators of Inflammation
we utilized the human monocytic cell line THP-1 as a well-established model of LPS-induced miR-146a expression andapplied ubiquinol-10. Additionally, liver samples of LPS-injected mice supplemented with ubiquinol-10 were used tostrengthen the hypothesis that ubiquinol-10 has a relevancein fine-tuning LPS-induced miR-146a expression levels.
2. Materials and Methods
2.1. Reagents. Ubiquinol-10 aqueous solution (PEG-60hydrogenated castor oil, ubiquinol-10, glycerol, water) andcorresponding vehicle (no ubiquinol-10 supplement) werepurchased from KANEKA Corporation, Japan. Lipopolysac-charide (LPS, E. coli O55:B5) was obtained from Sigma-Aldrich (Germany).
2.2. Cell Culture. THP-1 cells were routinely cultivated inRPMI medium 1640 supplemented with 10% FCS and1% antibiotics (penicillin/streptomycin) in a humidifiedincubator containing 5% CO2 at 37◦C. Twenty four hoursbefore preincubation, cells were plated at a density of 1 ×10⁶ cells per well in a 6-well plate. Subsequently, cells werepreincubated with 10 μM ubiquinol-10 or the respectivevehicle control. After 24 hours, cell culture medium wasremoved and fresh LPS-containing medium (1 μg/mL) wasadded for 4 hours. Finally, cells were collected in Qiazol-lysis buffer (Qiagen, Germany) for isolation of total RNA oralternatively scraped in Phosphate Buffered Saline (PBS) forHPLC-analysis.
2.3. Animals. Male C57/BL6J mice (10–12 weeks old, 25 gweight) were purchased from Charles River Lab., Inc., Japan.Animals were separated into two groups: (1) interventiongroup (n = 6), which was given a diet enriched withubiquinol-10 (QH2, 250 mg/kg/d) for one week and (2) thecontrol group (n = 6), which received a diet preparedby using corn oil in equal proportions to 1% (v/w) ofthe diet as a vehicle. In other respects all animals weremaintained on a standard laboratory diet (powdered CE-2, CREA Japan) and housed under conditions at 22 ± 2◦Cwith a 12-hour light/dark cycle. Food intake and body weightwere monitored daily but indicated no relevant differencesbetween animals. After the 7-day supplementation or controldiet period, an intraperitoneal injection (1mg/kg BW) oflipopolysaccharide (LPS, E. coli, O55:B5, Sigma-Aldrich,Japan) was administered for further 4 hours. However, forHPLC-experiments, only saline-injected mice were used. Inall other aspects, animal treatment was identical. Subse-quently, all mice were sacrificed, and liver samples werecollected and stored at −80◦C in RNAlater Storage Solution(Qiagen, Japan) until use.
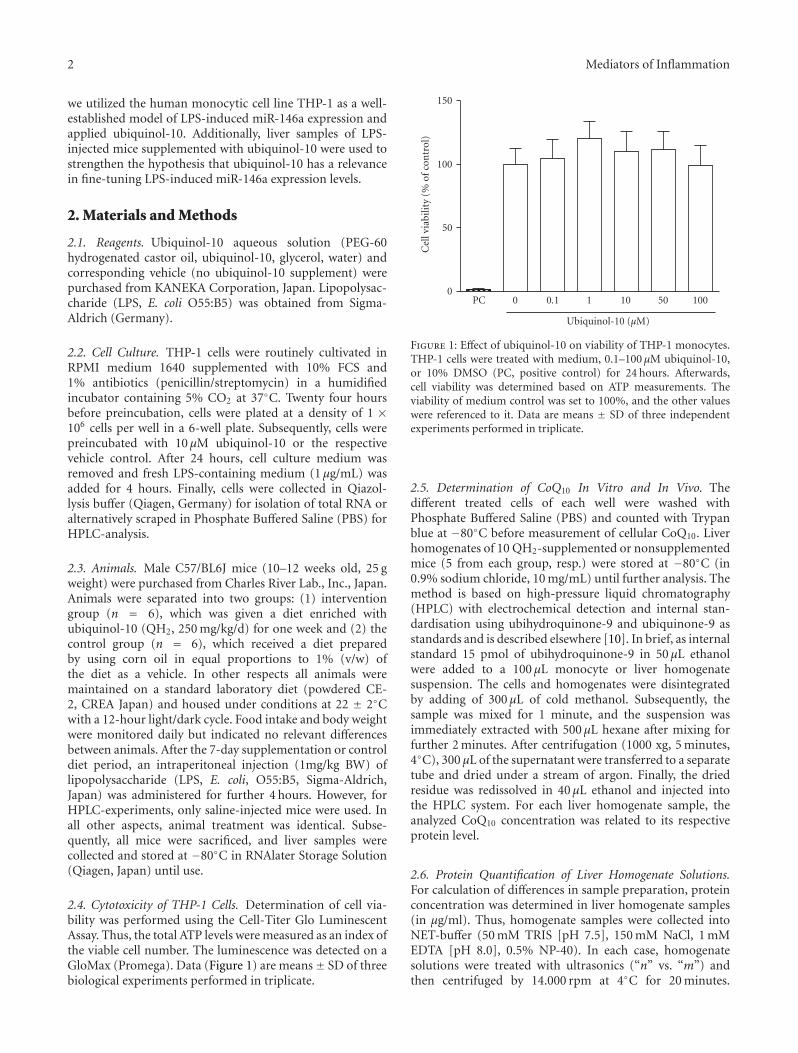
2.4. Cytotoxicity of THP-1 Cells. Determination of cell via-bility was performed using the Cell-Titer Glo LuminescentAssay. Thus, the total ATP levels were measured as an index ofthe viable cell number. The luminescence was detected on aGloMax (Promega). Data (Figure 1) are means± SD of threebiological experiments performed in triplicate.
Cel
lvia
bilit
y(%
ofco
ntr
ol)
0
50
100
150
Ubiquinol-10 (μM)
PC 0 0.1 1 10 50 100
Figure 1: Effect of ubiquinol-10 on viability of THP-1 monocytes.THP-1 cells were treated with medium, 0.1–100 μM ubiquinol-10,or 10% DMSO (PC, positive control) for 24 hours. Afterwards,cell viability was determined based on ATP measurements. Theviability of medium control was set to 100%, and the other valueswere referenced to it. Data are means ± SD of three independentexperiments performed in triplicate.
2.5. Determination of CoQ10 In Vitro and In Vivo. Thedifferent treated cells of each well were washed withPhosphate Buffered Saline (PBS) and counted with Trypanblue at −80◦C before measurement of cellular CoQ10. Liverhomogenates of 10 QH2-supplemented or nonsupplementedmice (5 from each group, resp.) were stored at −80◦C (in0.9% sodium chloride, 10 mg/mL) until further analysis. Themethod is based on high-pressure liquid chromatography(HPLC) with electrochemical detection and internal stan-dardisation using ubihydroquinone-9 and ubiquinone-9 asstandards and is described elsewhere [10]. In brief, as internalstandard 15 pmol of ubihydroquinone-9 in 50 μL ethanolwere added to a 100 μL monocyte or liver homogenatesuspension. The cells and homogenates were disintegratedby adding of 300 μL of cold methanol. Subsequently, thesample was mixed for 1 minute, and the suspension wasimmediately extracted with 500 μL hexane after mixing forfurther 2 minutes. After centrifugation (1000 xg, 5 minutes,4◦C), 300 μL of the supernatant were transferred to a separatetube and dried under a stream of argon. Finally, the driedresidue was redissolved in 40 μL ethanol and injected intothe HPLC system. For each liver homogenate sample, theanalyzed CoQ10 concentration was related to its respectiveprotein level.
2.6. Protein Quantification of Liver Homogenate Solutions.For calculation of differences in sample preparation, proteinconcentration was determined in liver homogenate samples(in μg/ml). Thus, homogenate samples were collected intoNET-buffer (50 mM TRIS [pH 7.5], 150 mM NaCl, 1 mMEDTA [pH 8.0], 0.5% NP-40). In each case, homogenatesolutions were treated with ultrasonics (“n” vs. “m”) andthen centrifuged by 14.000 rpm at 4◦C for 20 minutes.
Mediators of Inflammation 3
Table 1: Concentration and redox state of CoQ10 in the human monocytic cell line THP-1 after incubation with various concentrations ofubiquinol-10 for 24 hours. Data are given as means ± SD of two independent measurements performed in duplicate.
Extracellular Cellular
μM ubiquinol-10 pmol CoQ10/106 cells % ubiquinol-10 μM ubiquinol-10((a)-(b))
0, medium control 25.62± 4.42 74.40± 0.14 4.56
0, vehicle control 23.07± 0.46 74.70± 1.56 4.12
0.1 24.68± 2.01 75.25± 0.35 4.44
1.0 26.48± 3.36 79.35± 0.07 5.03
10.0 72.35± 1.14 86.10± 0.71 14.90
100 627.46± 138.08 90.35± 1.48 140.35(a)
Suggested diameter of monocytes: 20 μm(b)Related to mean values.
The protein concentration was determined by the Bradfordmethod according to the manufacturer’s instructions.
2.7. RNA Isolation and Quantitative RT-PCR of THP-1 Cells.Total RNA was isolated by using the miRNeasy Isolation Kit(Qiagen, Germany), and cDNA was converted by the Taq-ManMicroRNA Reverse Transcription Kit (Applied Biosys-tems). miRNA-146a expression was measured and quantifiedby using the TaqManMicroRNA Assays (Applied Biosystems)according to the manufacturer’s protocol and normalisedby snoRNA202 (Applied Biosystems). Quantitative RT-PCRreaction was performed on an Applied Biosystems 7300 Real-Time PCR System.
2.8. RNA Isolation of Liver Samples and Quantitative RT-PCR.Total RNA was isolated with Qiazol lysis reagent obtainedwith the miRNeasy Isolation Kit (Qiagen, Germany). cDNAwas converted by the TaqMan MicroRNA Reverse Transcrip-tion (RT) Kit (Applied Biosystems). The RT reaction productwas diluted 10 times in water and subsequently used forRT-PCR amplification of miRNA-146a by using the TaqManMicroRNA Assays (Applied Biosystems) according to themanufacturer’s protocol and normalized by snoRNA202(Applied Biosystems). A 6-fold total RNA-dilution seriesfrom a control-treated (+LPS) mouse liver served as standardto ensure a linear range of the amplification. QuantitativeRT-PCR reaction was performed on an Applied Biosystems7300 Real-Time PCR System.
2.9. Statistics. Results were analyzed by an unpaired, two- orone-sided Student’s t-test using SPSS 11.5 for Windows andGraphPad Prism 4.0 software. P-values less than or equal to.05 were considered statistically significant.
3. Results and Discussion
3.1. No Cytotoxic Effects but Cellular Accumulation ofUbiquinol-10 in the Human Monocytic Cell Line THP-1. Toexclude cytotoxic side effects in our experimental set-up,vitality of THP-1 cells was determined after incubation withubiquinol-10. As shown in Figure 1, incubation of THP-1 cells with increasing ubiquinol-10 concentrations (0.1–100 μM) for 24 hours led to no significant effects on cell
vitality. Thus, in THP-1 cells no cytotoxicity was foundfor ubiquinol-10 at physiological (1.0 μM), supraphysio-logical (10 μM), and pharmacological (>10 μM) concen-trations. The putative effects of extracellular ubiquinol-10 on miR expression depend on its capability to reachcellular concentrations above background level. Therefore,we determined the cellular concentration of CoQ10 as afunction of medium ubiquinol-10. As shown in Table 1,cellular CoQ10 levels arose with increasing extracellularubiquinol-10 concentrations (0.1–100 μM). As mainly thereduced form of CoQ10 can function as an antioxidant[11], we determined the proportion between the oxidizedand reduced form of CoQ10. Depending on the extracel-lular ubiquinol-10 concentration, about 75–90% of cellularCoQ10 was present in its reduced form (Table 1). Moreover,our previous results have shown that monocytic cells are ableto convert oxidized CoQ10 effectively into its reduced form[12]. Thus, at physiological and supraphysiological CoQ10
levels in the medium (0.1–10 μM), the intracellular CoQ10
distribution is clearly in favor of the reduced form (75–90%). Other in vitro and in vivo studies also revealed anintracellular incorporation of CoQ10 after supplementationin blood cells, thereby leading, for example, to a reductionof DNA strand breakdowns [11, 13]. Taken together, wewere able to increase the cellular ubiquinol-10 concentra-tion without any cytotoxic side-effects in human THP-1cells.
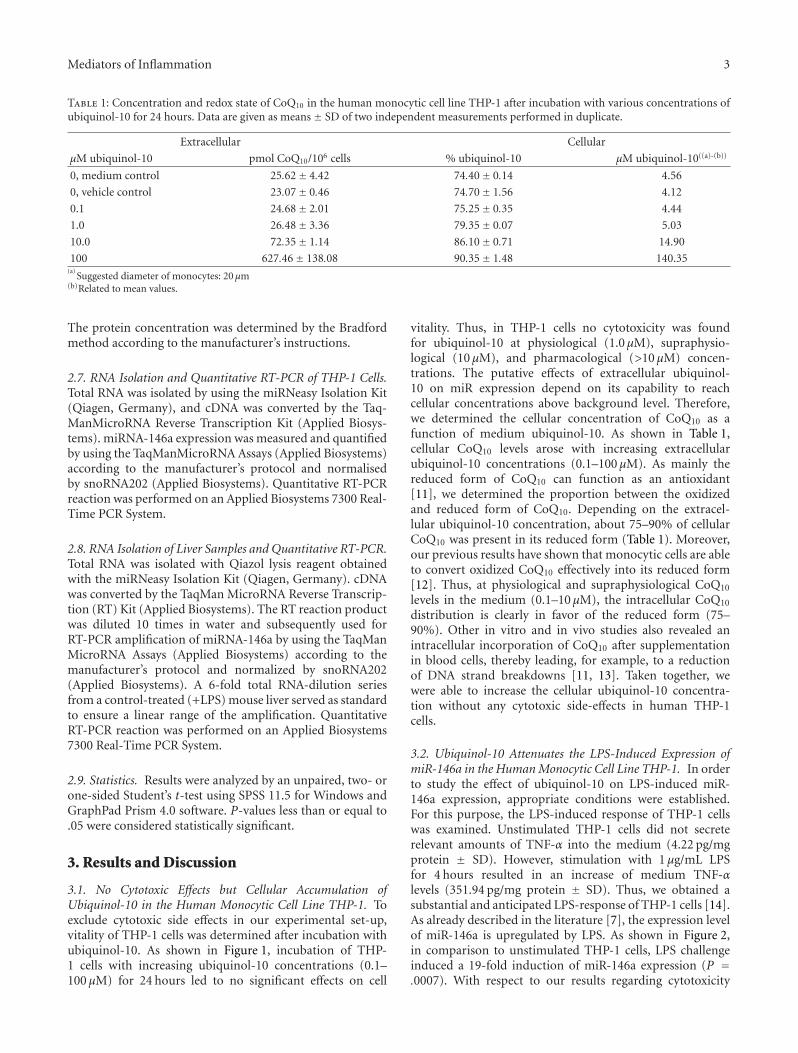
3.2. Ubiquinol-10 Attenuates the LPS-Induced Expression ofmiR-146a in the Human Monocytic Cell Line THP-1. In orderto study the effect of ubiquinol-10 on LPS-induced miR-146a expression, appropriate conditions were established.For this purpose, the LPS-induced response of THP-1 cellswas examined. Unstimulated THP-1 cells did not secreterelevant amounts of TNF-α into the medium (4.22 pg/mgprotein ± SD). However, stimulation with 1 μg/mL LPSfor 4 hours resulted in an increase of medium TNF-αlevels (351.94 pg/mg protein ± SD). Thus, we obtained asubstantial and anticipated LPS-response of THP-1 cells [14].As already described in the literature [7], the expression levelof miR-146a is upregulated by LPS. As shown in Figure 2,in comparison to unstimulated THP-1 cells, LPS challengeinduced a 19-fold induction of miR-146a expression (P =.0007). With respect to our results regarding cytotoxicity
4 Mediators of Inflammation
miR
-146
ale
vel(
rela
tive
tove
hic
leco
ntr
ol)
0
5
10
15
20
25
QH2 − − +
LPS − + +
∗∗∗
Figure 2: Effect of ubiquinol-10 on LPS-induced miR-146a expres-sion in THP-1 cells. THP-1-cells were preincubated without (−) orwith (+) 10 μM ubiquinol-10 for 24 hours. Afterwards, cells weretreated without (−) or with (+) 1 μg LPS/mL for 4 hours. After thistreatment, total RNA was extracted, converted to cDNA and miRswere assayed by TaqMan-based qRT-PCR. Observed expressionlevels of miRs in the respective treated cells were normalized to thecorresponding levels of the endogenous control (snoRNA202). Data(two-sided t-test) are means± SEM of three biological experimentsperformed in quadruplicate. ∗P < .05 versus unstimulated cells.∗∗∗P < .001 versus unstimulated cells.
and cellular accumulation of ubiquinol-10, THP-1 cells werepreincubated with 10 μM ubiquinol-10 for 24 hours as aneffective dose. This is nearly in accordance to other invitro studies performed with CoQ10 [15, 16] and is only 2-fold higher than CoQ10 serum levels after supplementationin humans [17]. Thereafter, cells were stimulated with1 μg/mL LPS for 4 hours and the resulting steady-stateexpression level of miR-146a was determined. As shown inFigure 2, preincubation of THP-1 cells with ubiquinol-10reduced the LPS-induced expression level of miR-146a to78.9 ± 13.22%. Although these effects were not statisticallysignificant (P ≤ .05), the reduced expression levels of miR-146a in the ubiquinol-10-pretreated cells (QH2 + LPS) mightbe a first hint for a fine-tuning mechanism of QH2 onmiR-146a expression when compared to the high signifi-cant induction levels in control cells after LPS-stimulation(Veco LPS).
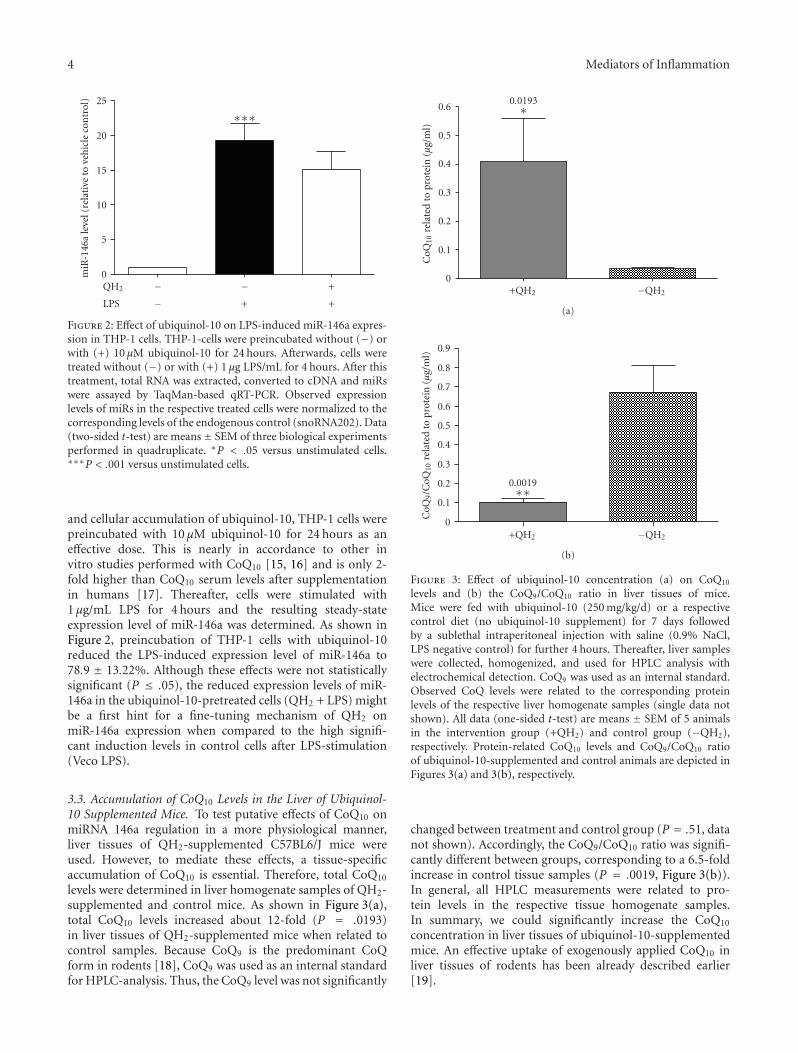
3.3. Accumulation of CoQ10 Levels in the Liver of Ubiquinol-10 Supplemented Mice. To test putative effects of CoQ10 onmiRNA 146a regulation in a more physiological manner,liver tissues of QH2-supplemented C57BL6/J mice wereused. However, to mediate these effects, a tissue-specificaccumulation of CoQ10 is essential. Therefore, total CoQ10
levels were determined in liver homogenate samples of QH2-supplemented and control mice. As shown in Figure 3(a),total CoQ10 levels increased about 12-fold (P = .0193)in liver tissues of QH2-supplemented mice when related tocontrol samples. Because CoQ9 is the predominant CoQform in rodents [18], CoQ9 was used as an internal standardfor HPLC-analysis. Thus, the CoQ9 level was not significantly
CoQ
10re
late
dto
prot
ein
(μg/
ml)
0
0.1
0.2
0.3
0.4
0.5
0.6
+QH2 −QH2
0.0193∗
(a)
CoQ
9/C
oQ10
rela
ted
topr
otei
n(μ
g/m
l)
0
0.1
0.2
0.3
0.4
0.5
0.6
0.7
0.8
0.9
+QH2 −QH2
0.0019∗∗
(b)
Figure 3: Effect of ubiquinol-10 concentration (a) on CoQ10
levels and (b) the CoQ9/CoQ10 ratio in liver tissues of mice.Mice were fed with ubiquinol-10 (250 mg/kg/d) or a respectivecontrol diet (no ubiquinol-10 supplement) for 7 days followedby a sublethal intraperitoneal injection with saline (0.9% NaCl,LPS negative control) for further 4 hours. Thereafter, liver sampleswere collected, homogenized, and used for HPLC analysis withelectrochemical detection. CoQ9 was used as an internal standard.Observed CoQ levels were related to the corresponding proteinlevels of the respective liver homogenate samples (single data notshown). All data (one-sided t-test) are means ± SEM of 5 animalsin the intervention group (+QH2) and control group (−QH2),respectively. Protein-related CoQ10 levels and CoQ9/CoQ10 ratioof ubiquinol-10-supplemented and control animals are depicted inFigures 3(a) and 3(b), respectively.
changed between treatment and control group (P = .51, datanot shown). Accordingly, the CoQ9/CoQ10 ratio was signifi-cantly different between groups, corresponding to a 6.5-foldincrease in control tissue samples (P = .0019, Figure 3(b)).In general, all HPLC measurements were related to pro-tein levels in the respective tissue homogenate samples.In summary, we could significantly increase the CoQ10
concentration in liver tissues of ubiquinol-10-supplementedmice. An effective uptake of exogenously applied CoQ10 inliver tissues of rodents has been already described earlier[19].
Mediators of Inflammation 5m
iR-1
46a
leve
l(r
elat
ive
toen
doge
nou
sco
ntr
ol)
0
1
2
3
4
5
6
1 2 3 4 5 6 7 8 9 10 11 12
QH2 − +
LPS + +
(a)
miR
-146
ale
vel
(rel
ativ
eto
endo
gen
ous
con
trol
)
0
1
2
3
4
QH2 − +
LPS + +
(b)
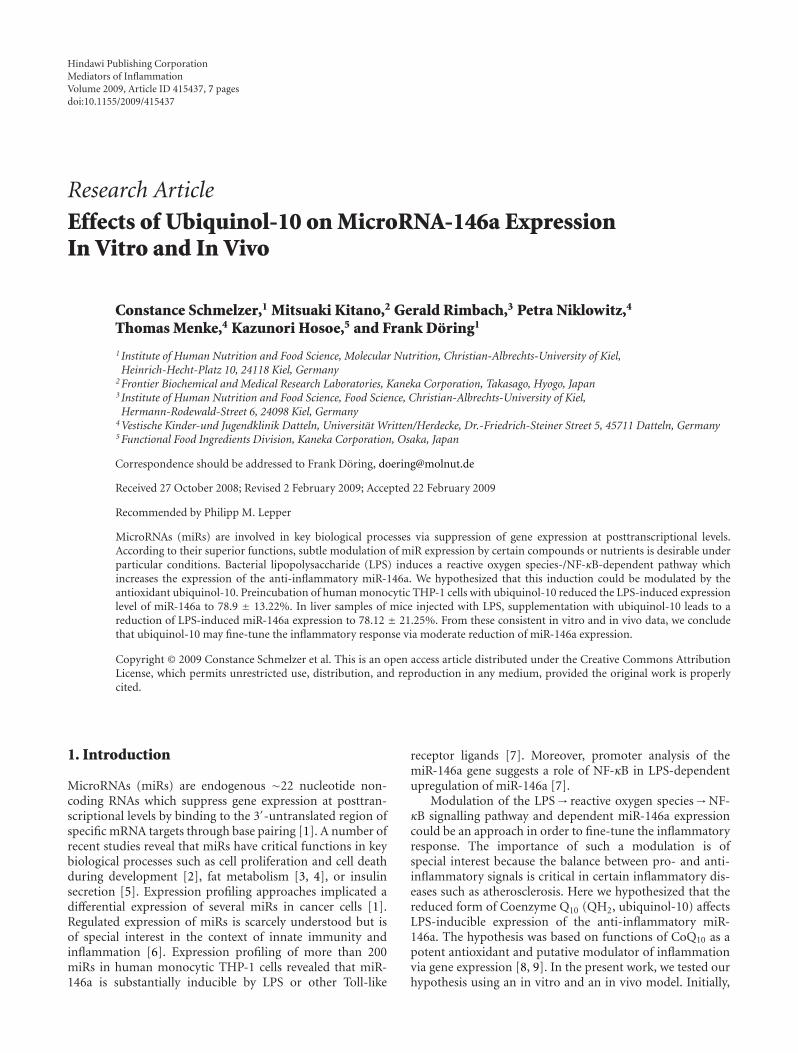
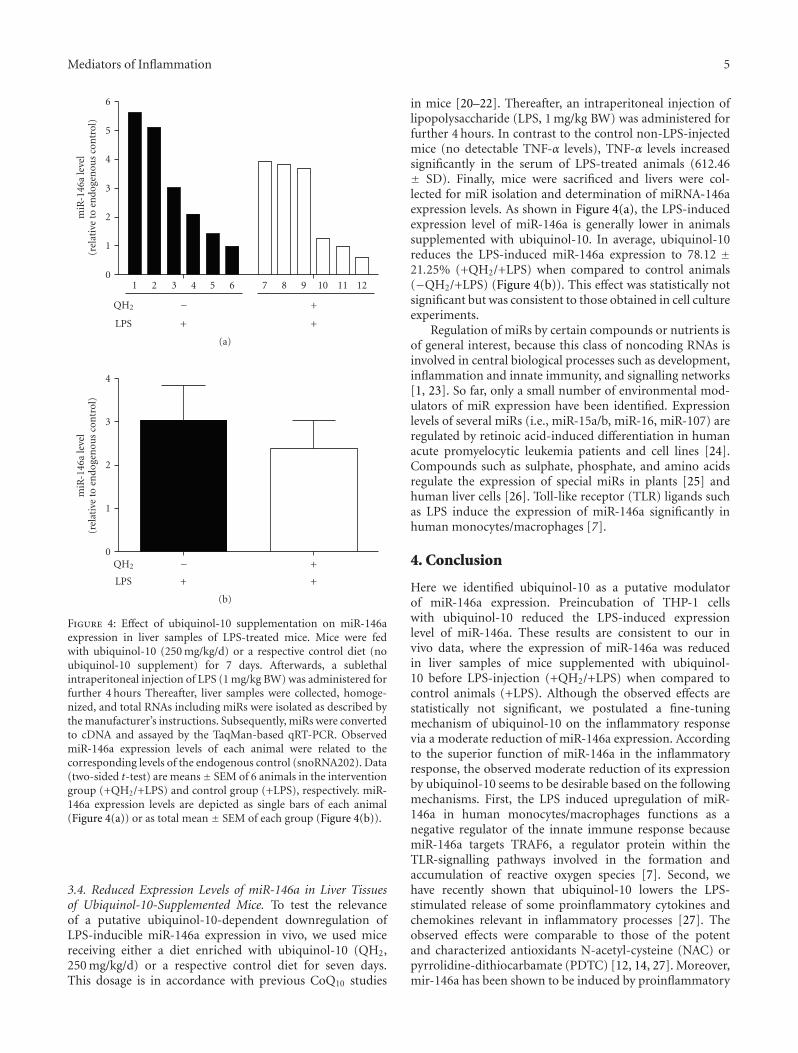
Figure 4: Effect of ubiquinol-10 supplementation on miR-146aexpression in liver samples of LPS-treated mice. Mice were fedwith ubiquinol-10 (250 mg/kg/d) or a respective control diet (noubiquinol-10 supplement) for 7 days. Afterwards, a sublethalintraperitoneal injection of LPS (1 mg/kg BW) was administered forfurther 4 hours Thereafter, liver samples were collected, homoge-nized, and total RNAs including miRs were isolated as described bythe manufacturer’s instructions. Subsequently, miRs were convertedto cDNA and assayed by the TaqMan-based qRT-PCR. ObservedmiR-146a expression levels of each animal were related to thecorresponding levels of the endogenous control (snoRNA202). Data(two-sided t-test) are means± SEM of 6 animals in the interventiongroup (+QH2/+LPS) and control group (+LPS), respectively. miR-146a expression levels are depicted as single bars of each animal(Figure 4(a)) or as total mean ± SEM of each group (Figure 4(b)).
3.4. Reduced Expression Levels of miR-146a in Liver Tissuesof Ubiquinol-10-Supplemented Mice. To test the relevanceof a putative ubiquinol-10-dependent downregulation ofLPS-inducible miR-146a expression in vivo, we used micereceiving either a diet enriched with ubiquinol-10 (QH2,250 mg/kg/d) or a respective control diet for seven days.This dosage is in accordance with previous CoQ10 studies
in mice [20–22]. Thereafter, an intraperitoneal injection oflipopolysaccharide (LPS, 1 mg/kg BW) was administered forfurther 4 hours. In contrast to the control non-LPS-injectedmice (no detectable TNF-α levels), TNF-α levels increasedsignificantly in the serum of LPS-treated animals (612.46± SD). Finally, mice were sacrificed and livers were col-lected for miR isolation and determination of miRNA-146aexpression levels. As shown in Figure 4(a), the LPS-inducedexpression level of miR-146a is generally lower in animalssupplemented with ubiquinol-10. In average, ubiquinol-10reduces the LPS-induced miR-146a expression to 78.12 ±21.25% (+QH2/+LPS) when compared to control animals(−QH2/+LPS) (Figure 4(b)). This effect was statistically notsignificant but was consistent to those obtained in cell cultureexperiments.
Regulation of miRs by certain compounds or nutrients isof general interest, because this class of noncoding RNAs isinvolved in central biological processes such as development,inflammation and innate immunity, and signalling networks[1, 23]. So far, only a small number of environmental mod-ulators of miR expression have been identified. Expressionlevels of several miRs (i.e., miR-15a/b, miR-16, miR-107) areregulated by retinoic acid-induced differentiation in humanacute promyelocytic leukemia patients and cell lines [24].Compounds such as sulphate, phosphate, and amino acidsregulate the expression of special miRs in plants [25] andhuman liver cells [26]. Toll-like receptor (TLR) ligands suchas LPS induce the expression of miR-146a significantly inhuman monocytes/macrophages [7].
4. Conclusion
Here we identified ubiquinol-10 as a putative modulatorof miR-146a expression. Preincubation of THP-1 cellswith ubiquinol-10 reduced the LPS-induced expressionlevel of miR-146a. These results are consistent to our invivo data, where the expression of miR-146a was reducedin liver samples of mice supplemented with ubiquinol-10 before LPS-injection (+QH2/+LPS) when compared tocontrol animals (+LPS). Although the observed effects arestatistically not significant, we postulated a fine-tuningmechanism of ubiquinol-10 on the inflammatory responsevia a moderate reduction of miR-146a expression. Accordingto the superior function of miR-146a in the inflammatoryresponse, the observed moderate reduction of its expressionby ubiquinol-10 seems to be desirable based on the followingmechanisms. First, the LPS induced upregulation of miR-146a in human monocytes/macrophages functions as anegative regulator of the innate immune response becausemiR-146a targets TRAF6, a regulator protein within theTLR-signalling pathways involved in the formation andaccumulation of reactive oxygen species [7]. Second, wehave recently shown that ubiquinol-10 lowers the LPS-stimulated release of some proinflammatory cytokines andchemokines relevant in inflammatory processes [27]. Theobserved effects were comparable to those of the potentand characterized antioxidants N-acetyl-cysteine (NAC) orpyrrolidine-dithiocarbamate (PDTC) [12, 14, 27]. Moreover,mir-146a has been shown to be induced by proinflammatory
6 Mediators of Inflammation
cytokines such as TNF-α, interleukin 1-beta (IL-1β), andTLRs [7, 28, 29]. miR-146a was also detected in tissuesrelated to inflammatory diseases including, for example, syn-ovial fibroblasts and rheumatoid synovial tissue [28]. Thus,we conclude that ubiquinol-10 reduces both the secretionof proinflammatory agents and the expression of the anti-inflammatory miR-146a. As a consequence, ubiquinol-10acts as an anti-inflammatory compound but perpetuatesthe essential inflammatory response via moderate reductionof miR-146a expression. This dual effect could be dueto the radical scavenging activity of ubiquinol-10 sincereactive oxygen species are involved in the TLR-signallingpathways.
In conclusion, the consistent in vitro and in vivo datasuggest that ubiquinol-10 may fine-tune the inflammatoryresponse via moderate reduction of miR-146a expression.
Acknowledgment
This work was supported by Kaneka Corporation, Japan.
References
[1] K. Chen and N. Rajewsky, “The evolution of gene regulationby transcription factors and microRNAs,” Nature ReviewsGenetics, vol. 8, no. 2, pp. 93–103, 2007.
[2] J. Brennecke, D. R. Hipfner, A. Stark, R. B. Russell, andS. M. Cohen, “bantam encodes a developmentally regulatedmicroRNA that controls cell proliferation and regulates theproapoptotic gene hid in Drosophila,” Cell, vol. 113, no. 1, pp.25–36, 2003.
[3] C. Esau, S. Davis, S. F. Murray, et al., “miR-122 regulation oflipid metabolism revealed by in vivo antisense targeting,” CellMetabolism, vol. 3, no. 2, pp. 87–98, 2006.
[4] P. Xu, S. Y. Vernooy, M. Guo, and B. A. Hay, “The DrosophilamicroRNA mir-14 suppresses cell death and is required fornormal fat metabolism,” Current Biology, vol. 13, no. 9, pp.790–795, 2003.
[5] M. N. Poy, L. Eliasson, J. Krutzfeldt, et al., “A pancreatic islet-specific microRNA regulates insulin secretion,” Nature, vol.432, no. 7014, pp. 226–230, 2004.
[6] E. Sonkoly, M. Stahle, and A. Pivarcsi, “MicroRNAs andimmunity: novel players in the regulation of normal immunefunction and inflammation,” Seminars in Cancer Biology, vol.18, no. 2, pp. 131–140, 2008.
[7] K. D. Taganov, M. P. Boldin, K.-J. Chang, and D. Baltimore,“NF-κB-dependent induction of microRNA miR-146, aninhibitor targeted to signaling proteins of innate immuneresponses,” Proceedings of the National Academy of Sciences ofthe United States of America, vol. 103, no. 33, pp. 12481–12486,2006.
[8] D. A. Groneberg, B. Kindermann, M. Althammer, et al.,“Coenzyme Q10 affects expression of genes involved in cellsignalling, metabolism and transport in human CaCo-2 cells,”International Journal of Biochemistry & Cell Biology, vol. 37,no. 6, pp. 1208–1218, 2005.
[9] F. Doring, C. Schmelzer, I. Lindner, C. Vock, and K. Fujii,“Functional connections and pathways of coenzyme Q10-inducible genes: an in-silico study,” IUBMB Life, vol. 59, no.10, pp. 628–633, 2007.
[10] T. Menke, P. Niklowitz, S. Adam, M. Weber, B. Schluter,and W. Andler, “Simultaneous detection of ubiquinol-10,ubiquinone-10, and tocopherols in human plasma microsam-ples and macrosamples as a marker of oxidative damage inneonates and infants,” Analytical Biochemistry, vol. 282, no. 2,pp. 209–217, 2000.
[11] M. Tomasetti, G. P. Littarru, R. Stocker, and R. Alleva,“Coenzyme Q10 enrichment decreases oxidative DNA damagein human lymphocytes,” Free Radical Biology and Medicine,vol. 27, no. 9-10, pp. 1027–1032, 1999.
[12] C. Schmelzer, G. Lorenz, I. Lindner, et al., “Effects of coenzymeQ10 on TNF-α secretion in human and murine monocytic celllines,” BioFactors, vol. 31, no. 1, pp. 35–41, 2007.
[13] P. Niklowitz, A. Sonnenschein, B. Janetzky, W. Andler, and T.Menke, “Enrichment of coenzyme Q10 in plasma and bloodcells: defense against oxidative damage,” International Journalof Biological Sciences, vol. 3, no. 4, pp. 257–262, 2007.
[14] C. Schmelzer, G. Lorenz, G. Rimbach, and F. Doring,“Influence of Coenzyme Q10 on release of pro-inflammatorychemokines in the human monocytic cell line THP-1,”BioFactors, vol. 31, no. 3-4, pp. 211–217, 2007.
[15] H. Tsuneki, N. Sekizaki, T. Suzuki, et al., “Coenzyme Q10
prevents high glucose-induced oxidative stress in humanumbilical vein endothelial cells,” European Journal of Pharma-cology, vol. 566, no. 1–3, pp. 1–10, 2007.
[16] K. Winkler-Stuck, F. R. Wiedemann, C.-W. Wallesch, and W. S.Kunz, “Effect of coenzyme Q10 on the mitochondrial functionof skin fibroblasts from Parkinson patients,” Journal of theNeurological Sciences, vol. 220, no. 1-2, pp. 41–48, 2004.
[17] P. Niklowitz, T. Menke, T. Wiesel, et al., “Coenzyme Q10 inplasma and erythrocytes: comparison of antioxidant levels inhealthy probands after oral supplementation and in patientssuffering from sickle cell anemia,” Clinica Chimica Acta, vol.326, no. 1-2, pp. 155–161, 2002.
[18] A. Galinier, A. Carriere, Y. Fernandez, et al., “Biological vali-dation of coenzyme Q redox state by HPLC-EC measurement:relationship between coenzyme Q redox state and coenzymeQ content in rat tissues,” FEBS Letters, vol. 578, no. 1-2, pp.53–57, 2004.
[19] G. Dallner and P. J. Sindelar, “Regulation of ubiquinonemetabolism,” Free Radical Biology and Medicine, vol. 29, no.3-4, pp. 285–294, 2000.
[20] S. R. McDonald, R. S. Sohal, and M. J. Forster, “Concurrentadministration of coenzyme Q10 and α-tocopherol improveslearning in aged mice,” Free Radical Biology and Medicine, vol.38, no. 6, pp. 729–736, 2005.
[21] J. Yan, K. Fujii, J. Yao, et al., “Reduced coenzyme Q10supplementation decelerates senescence in SAMP1 mice,”Experimental Gerontology, vol. 41, no. 2, pp. 130–140, 2006.
[22] Y. Ashida, H. Yamanishi, T. Terada, N. Oota, K. Sekine, andK. Watabe, “CoQ10 supplementation elevates the epidermalCoQ10 level in adult hairless mice,” BioFactors, vol. 25, no. 1–4,pp. 175–178, 2005.
[23] Q. Cui, Z. Yu, E. O. Purisima, and E. Wang, “Principles ofmicroRNA regulation of a human cellular signaling network,”Molecular Systems Biology, vol. 2, article 46, pp. 1–7, 2006.
[24] R. Garzon, F. Pichiorri, T. Palumbo, et al., “MicroRNA geneexpression during retinoic acid-induced differentiation ofhuman acute promyelocytic leukemia,” Oncogene, vol. 26, no.28, pp. 4148–4157, 2007.
[25] T.-J. Chiou, “The role of microRNAs in sensing nutrientstress,” Plant, Cell and Environment, vol. 30, no. 3, pp. 323–332, 2007.
Mediators of Inflammation 7
[26] S. N. Bhattacharyya, R. Habermacher, U. Martine, E. I.Closs, and W. Filipowicz, “Relief of microRNA-mediatedtranslational repression in human cells subjected to stress,”Cell, vol. 125, no. 6, pp. 1111–1124, 2006.
[27] C. Schmelzer, G. Lorenz, G. Rimbach, and F. Doring, “In vitroeffects of the reduced form of coenzyme Q10 on secretion levelsof TNF-α and chemokines in response to LPS in the humanmonocytic cell line THP-1,” Journal of Clinical Biochemistryand Nutrition, vol. 44, no. 1, pp. 62–66, 2009.
[28] T. Nakasa, S. Miyaki, A. Okubo, et al., “Expression ofMicroRNA-146 in rheumatoid arthritis synovial tissue,”Arthritis & Rheumatism, vol. 58, no. 5, pp. 1284–1292, 2008.
[29] F. J. Sheedy and L. A. J. O’Neill, “Adding fuel to fire:microRNAs as a new class of mediators of inflammation,”Annals of the Rheumatic Diseases, vol. 67, supplement 3, pp.iii50–iii55, 2008.

Submit your manuscripts athttp://www.hindawi.com
Stem CellsInternational
Hindawi Publishing Corporationhttp://www.hindawi.com Volume 2014
Hindawi Publishing Corporationhttp://www.hindawi.com Volume 2014
MEDIATORSINFLAMMATION
of
Hindawi Publishing Corporationhttp://www.hindawi.com Volume 2014
Behavioural Neurology
EndocrinologyInternational Journal of
Hindawi Publishing Corporationhttp://www.hindawi.com Volume 2014
Hindawi Publishing Corporationhttp://www.hindawi.com Volume 2014
Disease Markers
Hindawi Publishing Corporationhttp://www.hindawi.com Volume 2014
BioMed Research International
OncologyJournal of
Hindawi Publishing Corporationhttp://www.hindawi.com Volume 2014
Hindawi Publishing Corporationhttp://www.hindawi.com Volume 2014
Oxidative Medicine and Cellular Longevity
Hindawi Publishing Corporationhttp://www.hindawi.com Volume 2014
PPAR Research
The Scientific World JournalHindawi Publishing Corporation http://www.hindawi.com Volume 2014
Immunology ResearchHindawi Publishing Corporationhttp://www.hindawi.com Volume 2014
Journal of
ObesityJournal of
Hindawi Publishing Corporationhttp://www.hindawi.com Volume 2014
Hindawi Publishing Corporationhttp://www.hindawi.com Volume 2014
Computational and Mathematical Methods in Medicine
OphthalmologyJournal of
Hindawi Publishing Corporationhttp://www.hindawi.com Volume 2014
Diabetes ResearchJournal of
Hindawi Publishing Corporationhttp://www.hindawi.com Volume 2014
Hindawi Publishing Corporationhttp://www.hindawi.com Volume 2014
Research and TreatmentAIDS
Hindawi Publishing Corporationhttp://www.hindawi.com Volume 2014
Gastroenterology Research and Practice
Hindawi Publishing Corporationhttp://www.hindawi.com Volume 2014
Parkinson’s Disease
Evidence-Based Complementary and Alternative Medicine
Volume 2014Hindawi Publishing Corporationhttp://www.hindawi.com
![Exploring the Involvement of NLRP3 and IL-1β in …downloads.hindawi.com/journals/mi/2019/2363460.pdfhand osteoarthritis [26] were recruited in the Rheumatol-ogy Unit of Siena Hospital](https://static.fdocument.org/doc/165x107/5f93c90a1258491ec9221a4a/exploring-the-involvement-of-nlrp3-and-il-1-in-hand-osteoarthritis-26-were-recruited.jpg)