
Cerebral Vasculopathy in Children with Sickle Cell …Cerebral Vasculopathy in Children with Sickle...
108
ξ Sofia Vargas Nobre de Gusmão Licenciada em Bioquímica Cerebral Vasculopathy in Children with Sickle Cell Disease A study of genetic modulators of the disease September 2015 Dissertação para obtenção do Grau de Mestre em Genética Molecular e Biomedicina Orientadora: Dra. Paula Kjöllerström, Médica Pediatra, Hospital de D. Estefânia Co-orientadora: Doutora Paula Faustino, Investigadora Auxiliar, Instituto Nacional de Saúde Dr. Ricardo Jorge
Transcript of Cerebral Vasculopathy in Children with Sickle Cell …Cerebral Vasculopathy in Children with Sickle...
ξ
Sofia Vargas Nobre de Gusmão
Licenciada em Bioquímica
Cerebral Vasculopathy in Children
with Sickle Cell Disease
A study of genetic modulators of the disease
September 2015
Dissertação para obtenção do Grau de Mestre em
Genética Molecular e Biomedicina
Orientadora: Dra. Paula Kjöllerström, Médica Pediatra,
Hospital de D. Estefânia
Co-orientadora: Doutora Paula Faustino, Investigadora Auxiliar,
Instituto Nacional de Saúde Dr. Ricardo Jorge

I
Cerebral Vasculopathy in Children with Sickle Cell Disease
A study of genetic modulators of the disease
Copyright Sofia Vargas, FCT/UNL, UNL
A Faculdade de Ciências e Tecnologia e a Universidade Nova de Lisboa têm o direito, perpétuo e sem limites
geográficos, de arquivar e publicar esta dissertação através de exemplares impressos reproduzidos em papel ou
de forma digital, ou por qualquer outro meio conhecido ou que venha a ser inventado, e de a divulgar através de
repositórios científicos e de admitir a sua cópia e distribuição com objetivos educacionais ou de investigação,
não comerciais, desde que seja dado crédito ao autor e editor.

II
III
ACKNOWLEDGMENTS
Beforehand this Project would not have been possible without appropriate authorizations from Dr.
Fernando de Almeida and Eng. José Albuquerque, of the Directive Board of Instituto Nacional de
Saúde Dr. Ricardo Jorge (INSA), and Dr. Glória Isidro, Coordinator of the Human Genetics
Department of INSA, for which I am extremely grateful.
To Dr. Paula Kjöllerström and Dr. Raquel Maia, medical doctors at Hospital de D. Estefânia, who
conceived the idea, and to Dr. Rita Sobral for helping in the inclusion criteria of children, a very warm
thank you. This project would not exist without you.
A special note of acknowledgement to Doctor Paula Faustino, who brought what as an idea into
actual work, who made herself and her laboratory available for such work to be developed and, above
all, who believed in me to carry the project. For your constant availability, for crediting my own ideas
and work, while never ceasing to guide me, thank you.
I thank Doctor João Lavinha and Doctor Susana David for their availability to answer my questions
and contribute with relevant insights that helped me to understand several concepts and to further
develop my study. I thank Dr. Anabela Morais, of Hospital de Santa Maria, and Dr. Tiago Milheiro
Silva, intern in Hospital de D. Estefânia, for their amazing help in consulting patient’s medical
records.
I thank Andreia Coelho for the previous work done in the lab, which was essential to the present
project.
To everyone in the Unidade de Tecnologia e Inovação (UTI) of INSA a very special thank you.
Your help was invaluable both in expediting and processing all the samples that needed to be analyzed
but also for all the help in understanding the methodologies used. You all made me feel very welcome
and the good spirits of the team always brightened my day.
Lastly, I must thank my closest friends and family – you know who you are. I would not have done
this work without our amazing support, patience and encouragement. Whenever I was stressed, my
family pushed me on. As always. My friends kindly read parts of this dissertation and gave me
pertinent opinions and suggestions on how to improve or where to adjust, always with honesty and
straightforwardness.
Thank you all so much.
This work was partially funded by FCT: PEst-OE/SAU/UI0009/2013

IV
V
RESUMO
A anemia de células falciformes (ACF) é uma doença genética de transmissão autossómica
recessiva, causada pela mutação HBB:c.20A>T. Origina a hemoglobina S que forma polímeros no
interior do eritrócito, aquando da desoxigenação, deformando-o e causando hemólise precoce. As
manifestações clínicas da ACF são heterogéneas, sendo que uma das mais graves, o AVC isquémico,
ocorre em 11% dos doentes até aos 20 anos.
Neste trabalho, foram estudadas 66 crianças com ACF, agrupadas quanto ao grau de vasculopatia
cerebral (AVC, Risco e Controlo) numa tentativa de identificar modificadores genéticos do risco e
ocorrência de AVC. Foram feitos estudos de associação entre os três grupos fenotípicos e parâmetros
hematológicos e bioquímicos dos doentes, bem como 23 regiões polimórficas em genes relacionados
com aderência celular (VCAM-1, THBS-1, CD36), tónus vascular (NOS3, ET-1) e inflamação (TNF-α,
HMOX). Os referidos parâmetros dos doentes foram recolhidos dos seus registos hospitalares. Os
moduladores genéticos conhecidos da ACF (haplotipo no agrupamento da beta-globina, genótipo em
HBA e BCL11A) e as variantes genéticas putativamente modificadoras da vasculopatia cerebral foram
caracterizados e avaliados quanto a diferenças nas distribuições entre os referidos grupos.
O alelo C do rs1409419 em VCAM-1 e o alelo C do rs2070744 em NOS3 foram observados em
associação com o AVC, enquanto o alelo T do rs1409419 foi associado a proteção. Os alelos 4a e 4b
do VNTR de 27 bp em NOS3 parecem estar associados, respetivamente, a risco e a proteção do AVC.
Os STRs mais longos no promotor de HMOX-1 parecem predispor para AVC. Verificaram-se níveis
mais elevados de hemoglobina fetal no grupo Controlo, como resultado da presença do haplotipo
Senegal ou do alelo T de rs11886868 em BCL11A, e níveis mais elevados de lactato desidrogenase,
marcador de hemólise, no grupo de Risco. São discutidos os mecanismos moleculares subjacentes à
função modificadora das variantes relevantes.
Palavras-chave: anemia de células falciformes, hemólise, AVC, vasculopatia cerebral, modificadores
genéticos

VI
VII
ABSTRACT
Sickle cell disease (SCD) is a genetic disorder with recessive transmission, caused by the mutation
HBB:c.20A>T. It originates hemoglobin S that forms polymers inside the erythrocyte, upon
deoxygenation, deforming it and ultimately leading to premature hemolysis. The disease presents with
high heterogeneity of clinical manifestations, the most devastating of which, ischemic stroke, occurs in
11% of patients until 20 years of age.
In this study, we tried to identify genetic modifiers of risk and episodes of stroke by studying 66
children with SCD, grouped according to the degree of cerebral vasculopathy (Stroke, Risk and
Control). Association studies were performed between the three phenotypic groups and hematological
and biochemical parameters of patients, as well as with 23 polymorphic regions in genes related to
vascular cell adhesion (VCAM-1, THBS-1 and CD36), vascular tonus (NOS3 and ET-1) and
inflammation (TNF-α and HMOX-1). Relevant data was collected from patient’s medical records.
Known genetic modulators of SCD (beta-globin cluster haplotype and HBA and BCL11A genotypes)
and putative genetic modifiers of cerebral vasculopathy were characterized. Differences in their
distribution among groups were assessed.
VCAM-1 rs1409419 allele C and NOS3 rs207044 allele C were associated to stroke events, while
VCAM-1 rs1409419 allele T was found to be protective. Alleles 4a and 4b of NOS3 27 bp VNTR
appeared to be respectively associated to stroke risk and protection. HMOX-1 longer STRs seemed to
predispose to stroke. Higher hemoglobin F levels were found in Control group, as a result of Senegal
haplotype or of BCL11A rs11886868 allele T, and higher lactate dehydrogenase levels, marker of
hemolysis, were found in Risk group. Molecular mechanisms underlying the modifier functions of the
relevant genetic variants are discussed.
Keywords: sickle cell anemia, hemolysis, stroke, cerebral vasculopathy, genetic modifiers

VIII
IX
CONTENTS
CHAPTER I……………………….…………………………………………………………………………..………………….……………..1
I. Introduction .......................................................................................................................................................... 3
I.1. Human Hemoglobin ................................................................................................................................ 3
I.2. Sickle Cell Disease ................................................................................................................................. 6
1.2.1. Genetic basis and Pathophysiology of Sickle Cell Disease ............................................................ 6
1.2.2. Disease transmission and presentation ............................................................................................ 7
1.2.3. Genetic origins and prevalence of the sickle cell hemoglobin gene ............................................... 8
1.2.4. Clinical manifestations ................................................................................................................... 9
I.3. Cerebral Vasculopathy in Sickle Cell Disease ...................................................................................... 12
I.3.1. Silent Cerebral Infarcts and Overt Strokes .................................................................................... 12
I.3.2. Incidence ....................................................................................................................................... 13
I.3.3. Risk Factors and Predictors ........................................................................................................... 14
I.3.4. Pathophysiology of Ischemic Stroke ............................................................................................. 14
I.3.5. Diagnosis of vasculopathy in SCD patients................................................................................... 16
I.4. Disease Management ............................................................................................................................ 18
I.5. Genetic Modifiers ................................................................................................................................. 20
I.5.1. Genetic modulation of overall SCD severity ................................................................................. 20
I.5.2. Putative Genetic modulators of Ischemic Stroke in SCD…………………………………….………….......22
Objectives…………………………………………………………………………………………………………………...…………..25
CHAPTER II ……………………………………….…………..……….………………………………………………...…………………..27
II. Methods and Materials ..................................................................................................................................... 29
II.1. Sample ................................................................................................................................................. 29
II.1.1. Population sample ........................................................................................................................ 29
II.1.2 Biological samples ........................................................................................................................ 29
II.2. Methods ............................................................................................................................................... 29
II.2.1. Genomic DNA amplification through PCR ................................................................................. 30
II.2.2. Restriction fragment length polymorphism .................................................................................. 31
II.2.3. Automated Sanger Sequencing .................................................................................................. 311
II.2.4. Fluorescent Fragment Length Analysis ........................................................................................ 32
II.2.5. Haplotype reconstruction ............................................................................................................. 32
X
II.2.6. Statistical Analysis ....................................................................................................................... 32
CHAPTER III………………………………………….…….……….…………………………...…………………………………………..35
III. Results and Discussion. ................................................................................................................................... 37
Part 1: Genetic Characterization ……………………………………………………………………………...37
III.1.1. Confirmation of the presence of HbS mutation in homozygous state ............................................. 37
III.1.2. β-globin cluster haplotype determination ........................................................................................ 38
III.1.3. Diagnosis of α-thalassemia (-α3.7 kb del) ....................................................................................... 41
III.1.4. Analysis of putative genetic modulators ......................................................................................... 42
III.1.4.1. BCL11A ................................................................................................................................... 42
III.1.4.2. VCAM-1 ................................................................................................................................... 43
III.4.3. THBS-1 ....................................................................................................................................... 45
III.1.4.4. CD36 ........................................................................................................................................ 47
III.1.4.5. NOS3 ........................................................................................................................................ 48
III.1.4.6. ET-1 ......................................................................................................................................... 50
III.1.4.7. TNF-α ...................................................................................................................................... 52
III.1.4.8. HMOX-1 .................................................................................................................................. 53
Part 2: Association Studies ………………………………………………………………………………………………………...55
III.2.1. VCAM-1, SNP rs1409419 modulates stroke risk ............................................................................ 55
III.2.2. NOS3 polymorphisms are associated with stroke risk and events ................................................... 57
III.2.3. Long HMOX-1 promoter repeats may predispose to stroke events ................................................. 62
III.2.4. Other putative disease modulator genes were not associated to stroke risk or protection ............... 63
Part 3: Biochemical Characterization ………………………………………………………………………...65
III.3.1. “HbSF” phenotype is responsible for the low %HbS in this population ......................................... 65
III.3.2. High HbF levels result from Senegal haplotype and BCL11A ........................................................ 66
III.3.3. Lower HbF levels are associated with stroke episodes ................................................................... 67
III.3.4. Severity of anemia was equivalent in all groups ............................................................................. 68
III.3.5. Level of hemolysis is associated with cerebrovascular disease....................................................... 68
III.3.6. Pro-inflammatory and pro-coagulant states may contribute to stroke events .................................. 70
Concluding Remarks ……………………….……………………………………………………..…………………………………72
Future Perspectives …………………………………………………...……………………………………………………………..74
Literature Cited …………………………………...…………………………………………………….……………….……………75
XI
FIGURES
CHAPTER I - INTRODUCTION
Figure I.1.: A – Hemoglobin molecule. B – Globin chain. ..................................................................................... 3
Figure I.2.: Schematic representation of chromosomal localization and genomic organization of the human
globin genes. ........................................................................................................................................................ 4
Figure I.3.: Development of erythropoiesis during embryonic, fetal and adult phases. .......................................... 5
Figure I.4.: Sickle cell disease. A – Pathophysiology of SCD. B – Peripheral blood smear. .................................. 7
Figure I.5.: Common haplotypes associated with the βS-globin gene. .................................................................... 8
Figure I.6.: Model of overlapping subphenotypes of SCD. .................................................................................. 10
Figure I.7.: Decreased NO bioavailability in SCD. ............................................................................................... 12
Figure I.8.: Rates of infarctive and hemorrhagic stroke in SCA patients by age. ............................................... 13
Figure I.9.: Representation of the Circle of Willis in situ. .................................................................................... 15
Figure I.10.: Pathophysiology of stroke in SCD. .................................................................................................. 16
CHAPTER III – RESULTS AND DISCUSSION
Figure III.1.: Diagnosis of sickle cell mutation by PCR-RFLP............................................................................. 37
Figure III.2.: Electrophoresis of products of enzymatic restriction for β-globin cluster haplotype determination.
............................................................................................................................................................................ 39
Figure III.3.: Gap-PCR analysis for diagnosis of -α3.7 kb del (α-thalassemia). A – Schematic representation of
the breakpoints in genes α2 and α1 and the resulting hybrid gene. B – Electrophoresis in agarose gel showing
the three possible genotypes associated to α-thalassemia .................................................................................. 41
Figure III.4.: Electrophoresis of the products of enzymatic restriction with MboII for characterization of the SNP
rs11886868 of BCL11A. ..................................................................................................................................... 43
Figure III.5.: Automated sequencing output of a fragment of the promoter of VCAM-1. ..................................... 44
Figure III.6.: Electrophoresis of products of enzymatic restriction with FauI for characterization of rs2292305 of
THBS-1. .............................................................................................................................................................. 46
Figure III.7.: Allelic frequencies for SNP rs2292305 of THBS-1 for overall population and African, American
and European subpopulations. ............................................................................................................................ 46
Figure III.8.: Automated sequencing output of a fragment of CD36 for analysis of SNP rs1984112................... 47
Figure III.9.: Electrophoresis of DNA products for characterization of the polymorphisms of NOS3. A – SNP
rs2070744. B – SNP rs1799983. C – VNTR 27 bp. ........................................................................................... 48
Figure III.10.: Electrophoresis of products of enzymatic restriction with CaC8I for diagnosis of the SNP rs5370
of ET-1.. ............................................................................................................................................................. 51
Figure III.11.: Sequencing output for SNP rs1800997 of ET-1............................................................................. 51
Figure III.12.: ARMS-PCR for characterization of the SNP rs1800629 of TNF-α, for samples 056-058. ........... 52
Figure III.13.: ARMS-PCR for chaacterization of rs2071746 of HMOX-1, for the identified samples. ............... 53
Figure III.14.: GeneScanTM
output for characterization of rs3074372 of HMOX-1. ............................................. 54
Figure III.15.: Allele distribution by number of GT repetitions of the STR rs3074372 of HMOX-1. .................. 54
XII
Figure III.16.: Distributions of %HbS in the total population of study and the “High HbF” and “Low HbF”
groups.. ............................................................................................................................................................... 65
Figure III.17.: Distributions of LDH values in the 3 phenotype groups................................................................ 69
Figure III.18.: Distribution of reticulocyte counts in the 3 phenotype groups. ..................................................... 70
Figure III.19.: A - Distributions of leukocyte counts in the 3 phenotype groups. B - Distribution of platelet
counts in the 3 phenotype groups.. ..................................................................................................................... 71
XIII
TABLES
CHAPTER I - INTRODUCTION
Table I.1.: Hematologic parameters characterizing different sickle cell disease genotypes. .................................. 8
Table I.2.: Stroke risk in children with SCA. ........................................................................................................ 17
CHAPTER II – METHODS AND MATERIALS
Table II.1. Molecular methodologies applied according to the genetic variant under study ................................. 30
CHAPTER III – RESULTS AND DISCUSSION
Table III.1.: Determination of the three main African β-globin cluster haplotypes based on RFLP profile of
specific SNPs. .................................................................................................................................................... 38
Table III.2.: SNP profile for β-globin cluster haplotype of the 22 new samples. .................................................. 39
Table III.3.: Comparison between haplotype distributions obtained in the current study and reported by Lavinha
et al., 1992. ......................................................................................................................................................... 39
Table III.4.:Haplotypes for SNPs in the promoter of VCAM-1 generated by PHASE software. .......................... 45
Table III.5.: Haplotypes for SNPs in the promoter of NOS3 generated by PHASE software. .............................. 50
Table III.6.: VCAM-1 SNP rs1409419 significantly associated with phenotypic groups. ..................................... 55
Table III.7.: VCAM-1 haplotypes significantly associated with phenotypic groups ............................................. 56
Table III.8.: NOS3 individual polymorphisms significantly associated with phenotypic groups. ........................ 58
Table III.9.: NOS3 haplotypes significantly associated with phenotypic groups. ................................................. 60
Table III.10.: HMOX-1 STR rs3074372 significantly associated with phenotypic groups. .................................. 62
Table III.11.: Association between levels of HbF and the presence of Senegal haplotype or C allele for
rs11886868 of BCL11A. ..................................................................................................................................... 66
Table III.12.: Association between levels of HbF and population subgroups. ...................................................... 67

XIV
XV
ABBREVIATIONS
ACS – Acute chest syndrome
BMT – Bone marrow transplantation
bp – base pairs
CAM – Cell adhesion molecule
CBT – Chronic blood transfusion (therapy)
CD36 – Cluster of differentiation 36
CO – Carbon monoxide
CVA – Cerebrovascular accident
CVD – Cardiovascular disease
ddNTP- dideoxyribonucleotide
dNTP - deoxyribonucleotide
ECM – Extracellular matrix
eNOS – Endothelial nitric oxide synthase
ET – Endothelin
EtBr – Ethidium bromide
Hb – Hemoglobin
HbA – Adult hemoglobin
HbC – C variant hemoglobin
HbF – Fetal hemoglobin
HbS – Sickle hemoglobin
HED – Hemolysis-endothelial dysfunction
(subphenotype)
HO – Heme oxygenase
HPFH – Hereditary persistence of fetal hemoglobin
HPLC – High performance liquid chromatography
HS – Hypersensitive site
HU – Hydroxyurea
ICA – Internal carotid artery
IVS – Intervening sequence
LCR – Locus control region
LDH – Lactate dehydrogenase
MCA – Middle cerebral artery
MCS – Multispecies conserved sequence
MCV – Mean corpuscular volume
MRA – Magnetic resonance angiography
MRE – Major regulatory element
MRI – Magnetic resonance imaging
NO – Nitric oxide
NOS – Nitric oxide synthase
O2 – Oxygen
RBC – Red blood cell
SCA – Sickle Cell Anemia
SCD – Sickle Cell Disease
SCI – Silent cerebral infarct
SIT – Silent Infarct Transfusion (Trial)
STR – Short tandem repeat
TAMMV –Time-averaged mean of maximum
velocity
TCD – Transcranial Doppler (ultrasonography)
Td – Delay time
THBS – Thrombospondin
TIA – Transient ischemic attack
TNF – Tumor necrosis factor
TSP – Thrombospondin
Tt – Transit time
UTR – Untranslated region
UV – Ultra-violet (light)
VCAM – Vascular cell adhesion molecule
VVO – Viscosity-vaso-occlusion (subphenotype)
VNTR – Variable number tandem repeat
WBC – White blood cells

XVI

1
CHAPTER I
INTRODUCTION

CHAPTER I ~ INTRODUCTION
2
CHAPTER I ~ INTRODUCTION
3
I. INTRODUCTION
I.1. Human Hemoglobin
Hemoglobin (Hb) is the oxygen-transporting protein in erythrocytes of vertebrates. It is composed
of four subunits, each comprising one prosthetic group (heme) and one polypeptide chain (globin).
Heme is an iron-containing pigment that combines with molecular oxygen (O2), allowing hemoglobin
to transport it (Nussbaum, et al., 2007). Globin chains are either α-like or β-like proteins, and
hemoglobin has two of each globin chains, being therefore described as a tetramer or as a dimer of αβ
promoters (Nelson & Cox, 2005). The tertiary structure of all globin polypeptides is extremely
conserved throughout species, with seven or eight helical regions (A to H – see Figure I.1.).
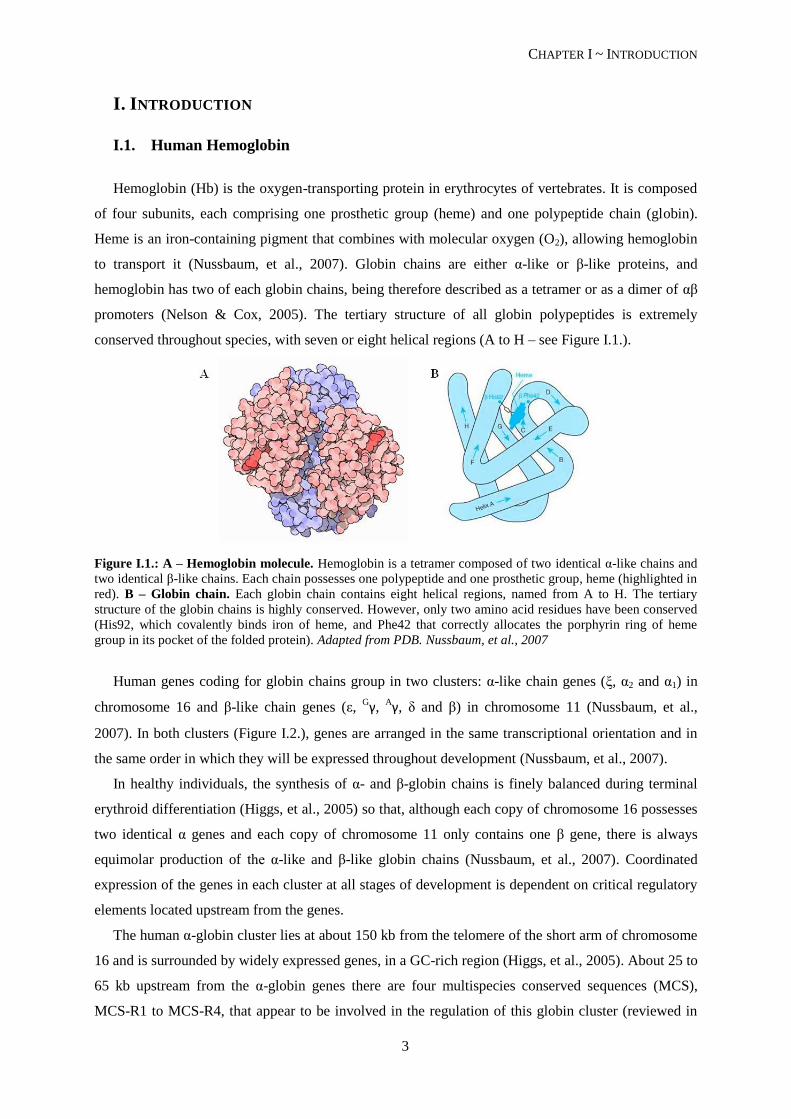
Figure I.1.: A – Hemoglobin molecule. Hemoglobin is a tetramer composed of two identical α-like chains and
two identical β-like chains. Each chain possesses one polypeptide and one prosthetic group, heme (highlighted in
red). B – Globin chain. Each globin chain contains eight helical regions, named from A to H. The tertiary
structure of the globin chains is highly conserved. However, only two amino acid residues have been conserved
(His92, which covalently binds iron of heme, and Phe42 that correctly allocates the porphyrin ring of heme
group in its pocket of the folded protein). Adapted from PDB. Nussbaum, et al., 2007
Human genes coding for globin chains group in two clusters: α-like chain genes (ξ, α2 and α1) in
chromosome 16 and β-like chain genes (ε, Gγ,
Aγ, δ and β) in chromosome 11 (Nussbaum, et al.,
2007). In both clusters (Figure I.2.), genes are arranged in the same transcriptional orientation and in
the same order in which they will be expressed throughout development (Nussbaum, et al., 2007).
In healthy individuals, the synthesis of α- and β-globin chains is finely balanced during terminal
erythroid differentiation (Higgs, et al., 2005) so that, although each copy of chromosome 16 possesses
two identical α genes and each copy of chromosome 11 only contains one β gene, there is always
equimolar production of the α-like and β-like globin chains (Nussbaum, et al., 2007). Coordinated
expression of the genes in each cluster at all stages of development is dependent on critical regulatory
elements located upstream from the genes.
The human α-globin cluster lies at about 150 kb from the telomere of the short arm of chromosome
16 and is surrounded by widely expressed genes, in a GC-rich region (Higgs, et al., 2005). About 25 to
65 kb upstream from the α-globin genes there are four multispecies conserved sequences (MCS),
MCS-R1 to MCS-R4, that appear to be involved in the regulation of this globin cluster (reviewed in
CHAPTER I ~ INTRODUCTION
4
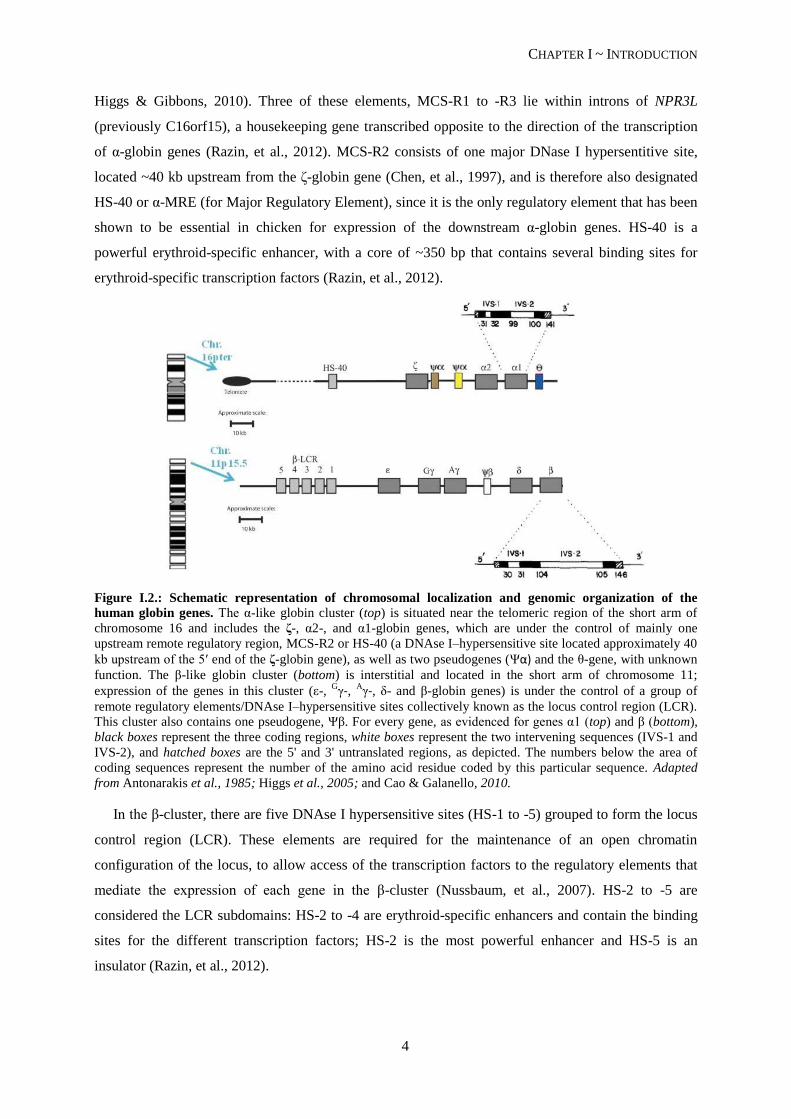
Higgs & Gibbons, 2010). Three of these elements, MCS-R1 to -R3 lie within introns of NPR3L
(previously C16orf15), a housekeeping gene transcribed opposite to the direction of the transcription
of α-globin genes (Razin, et al., 2012). MCS-R2 consists of one major DNase I hypersentitive site,
located ~40 kb upstream from the ζ-globin gene (Chen, et al., 1997), and is therefore also designated
HS-40 or α-MRE (for Major Regulatory Element), since it is the only regulatory element that has been
shown to be essential in chicken for expression of the downstream α-globin genes. HS-40 is a
powerful erythroid-specific enhancer, with a core of ~350 bp that contains several binding sites for
erythroid-specific transcription factors (Razin, et al., 2012).
Figure I.2.: Schematic representation of chromosomal localization and genomic organization of the
human globin genes. The α-like globin cluster (top) is situated near the telomeric region of the short arm of
chromosome 16 and includes the ζ-, α2-, and α1-globin genes, which are under the control of mainly one
upstream remote regulatory region, MCS-R2 or HS-40 (a DNAse I–hypersensitive site located approximately 40
kb upstream of the 5′ end of the ζ-globin gene), as well as two pseudogenes (Ψα) and the θ-gene, with unknown
function. The β-like globin cluster (bottom) is interstitial and located in the short arm of chromosome 11;
expression of the genes in this cluster (ε-, Gγ-, A
γ-, δ- and β-globin genes) is under the control of a group of
remote regulatory elements/DNAse I–hypersensitive sites collectively known as the locus control region (LCR).
This cluster also contains one pseudogene, Ψβ. For every gene, as evidenced for genes α1 (top) and β (bottom),
black boxes represent the three coding regions, white boxes represent the two intervening sequences (IVS-1 and
IVS-2), and hatched boxes are the 5' and 3' untranslated regions, as depicted. The numbers below the area of
coding sequences represent the number of the amino acid residue coded by this particular sequence. Adapted
from Antonarakis et al., 1985; Higgs et al., 2005; and Cao & Galanello, 2010.
In the β-cluster, there are five DNAse I hypersensitive sites (HS-1 to -5) grouped to form the locus
control region (LCR). These elements are required for the maintenance of an open chromatin
configuration of the locus, to allow access of the transcription factors to the regulatory elements that
mediate the expression of each gene in the β-cluster (Nussbaum, et al., 2007). HS-2 to -5 are
considered the LCR subdomains: HS-2 to -4 are erythroid-specific enhancers and contain the binding
sites for the different transcription factors; HS-2 is the most powerful enhancer and HS-5 is an
insulator (Razin, et al., 2012).
CHAPTER I ~ INTRODUCTION
5
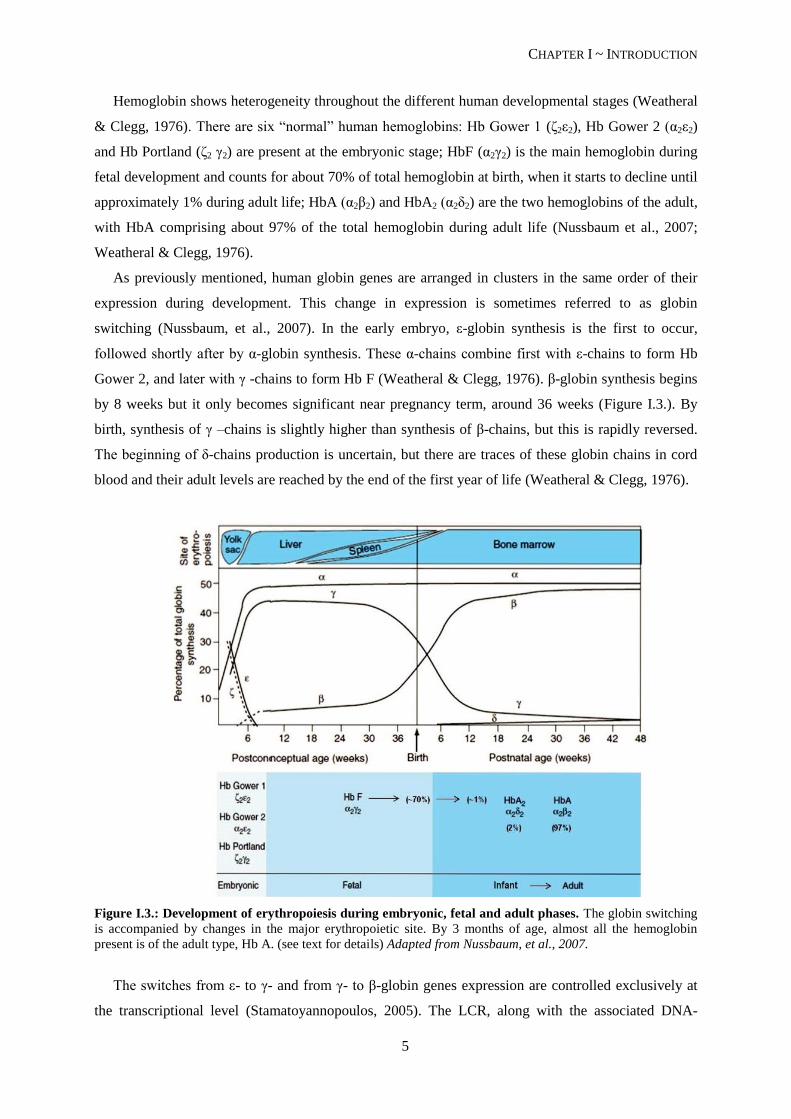
Hemoglobin shows heterogeneity throughout the different human developmental stages (Weatheral
& Clegg, 1976). There are six “normal” human hemoglobins: Hb Gower 1 (ζ2ε2), Hb Gower 2 (α2ε2)
and Hb Portland (ζ2 γ2) are present at the embryonic stage; HbF (α2γ2) is the main hemoglobin during
fetal development and counts for about 70% of total hemoglobin at birth, when it starts to decline until
approximately 1% during adult life; HbA (α2β2) and HbA2 (α2δ2) are the two hemoglobins of the adult,
with HbA comprising about 97% of the total hemoglobin during adult life (Nussbaum et al., 2007;
Weatheral & Clegg, 1976).
As previously mentioned, human globin genes are arranged in clusters in the same order of their
expression during development. This change in expression is sometimes referred to as globin
switching (Nussbaum, et al., 2007). In the early embryo, ε-globin synthesis is the first to occur,
followed shortly after by α-globin synthesis. These α-chains combine first with ε-chains to form Hb
Gower 2, and later with γ -chains to form Hb F (Weatheral & Clegg, 1976). β-globin synthesis begins
by 8 weeks but it only becomes significant near pregnancy term, around 36 weeks (Figure I.3.). By
birth, synthesis of γ –chains is slightly higher than synthesis of β-chains, but this is rapidly reversed.
The beginning of δ-chains production is uncertain, but there are traces of these globin chains in cord
blood and their adult levels are reached by the end of the first year of life (Weatheral & Clegg, 1976).
Figure I.3.: Development of erythropoiesis during embryonic, fetal and adult phases. The globin switching
is accompanied by changes in the major erythropoietic site. By 3 months of age, almost all the hemoglobin
present is of the adult type, Hb A. (see text for details) Adapted from Nussbaum, et al., 2007.
The switches from ε- to γ- and from γ- to β-globin genes expression are controlled exclusively at
the transcriptional level (Stamatoyannopoulos, 2005). The LCR, along with the associated DNA-
CHAPTER I ~ INTRODUCTION
6
binding proteins, interacts with the genes of the locus to form an active chromatin hub (a nuclear
compartment), that directly associates with the different genes in the cluster, in a sequential manner,
from the 5’ ε-gene in embryos, to the 3’ δ- and β-globin genes in adults (Nussbaum, et al., 2007). The
ζ- to α-globin gene switch is controlled predominantly at the transcriptional level, although post-
transcriptional mechanisms are also involved (Stamatoyannopoulos, 2005).
The temporal switches of globin synthesis are accompanied by changes in the major site of
erythropoiesis (Figure I.3.): embryonic globin synthesis occurs in the yolk sac, from weeks 3 to 8;
around the 5th week of gestation, globin synthesis occurs primarily in the fetal liver; and by adulthood,
the major site of erythropoiesis is the bone marrow (Nussbaum, et al., 2007).
I.2. Sickle Cell Disease
The hemoglobinopathies are a class of hereditary diseases that can be further divided in three
distinct groups, according to the resulting consequence of the mutation: i) structural (qualitative)
variants, in which the mutation causes an alteration in the globin polypeptide without affecting its rate
of synthesis; ii) thalassemias (quantitative defects) in which the synthesis or stability of the globin
protein are affected, causing an imbalance in the available globin chains; and iii) hereditary
persistence of fetal hemoglobin (HPFH), a defect in the globin switching, that impairs the switch from
γ- to β-globin, leading to high levels of HbF during adulthood (Nussbaum, et al., 2007). HPFH is a
benign condition that can ameliorate the outcome of some cases of β–globin associated anemias.
1.2.1. Genetic basis and Pathophysiology of Sickle Cell Disease
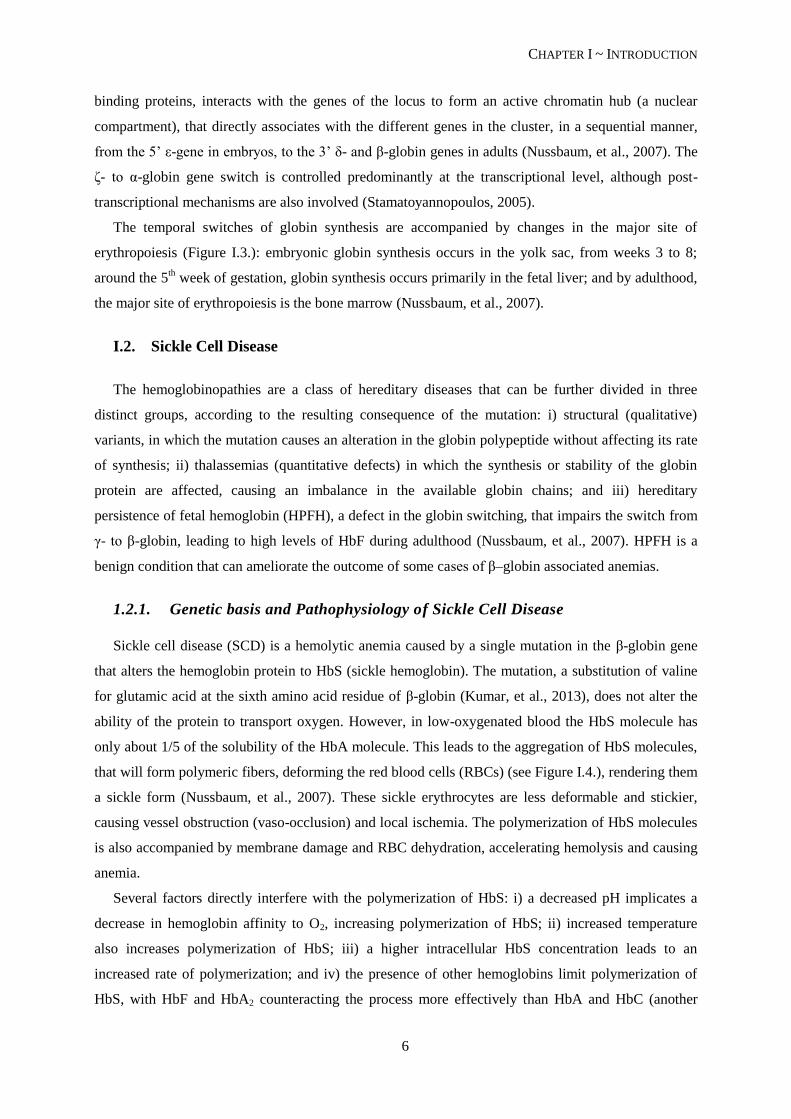
Sickle cell disease (SCD) is a hemolytic anemia caused by a single mutation in the β-globin gene
that alters the hemoglobin protein to HbS (sickle hemoglobin). The mutation, a substitution of valine
for glutamic acid at the sixth amino acid residue of β-globin (Kumar, et al., 2013), does not alter the
ability of the protein to transport oxygen. However, in low-oxygenated blood the HbS molecule has
only about 1/5 of the solubility of the HbA molecule. This leads to the aggregation of HbS molecules,
that will form polymeric fibers, deforming the red blood cells (RBCs) (see Figure I.4.), rendering them
a sickle form (Nussbaum, et al., 2007). These sickle erythrocytes are less deformable and stickier,
causing vessel obstruction (vaso-occlusion) and local ischemia. The polymerization of HbS molecules
is also accompanied by membrane damage and RBC dehydration, accelerating hemolysis and causing
anemia.
Several factors directly interfere with the polymerization of HbS: i) a decreased pH implicates a
decrease in hemoglobin affinity to O2, increasing polymerization of HbS; ii) increased temperature
also increases polymerization of HbS; iii) a higher intracellular HbS concentration leads to an
increased rate of polymerization; and iv) the presence of other hemoglobins limit polymerization of
HbS, with HbF and HbA2 counteracting the process more effectively than HbA and HbC (another
CHAPTER I ~ INTRODUCTION
7
substitution of the glutamic acid in the 6th position of the β-globin chain, this time by lysine) (Schnog,
et al., 2004).
Figure I.4.: Sickle cell disease. A – Pathophysiology of SCD. Due to the presence of the abnormal valine
residue at position 6, Hb S molecules form polymers during low oxygen sates. These polymers cause a distortion
of the erythrocyte, which becomes elongated with a sickle shape. The sickling episode is accompanied by a
calcium influx that causes loss of potassium and water, with further damages to the membrane skeleton. The
distortion is reversible upon reoxygenation, at an early stage; over time, the cumulative damage causes an
irreversible distortion in the red blood cell, which is then rapidly hemolyzed. B – Peripheral blood smear. The
arrows point to two sickle erythrocytes, the phenotypic hallmark of sickle cell disease. Adapted from Kumar, et
al., 2013.
1.2.2. Disease transmission and presentation
SCD presents itself in homozygous individuals (HbS: αA
2βS
2) or compound heterozygous
individuals with a different mutation in the second β allele (β0-thalassemia, β
+-thalassemia, HbC).
Heterozygous individuals for the hemoglobin S variant (HbAS: [αA
2βA
2, αA
2βS
2] and [αA
2βAβ
S]) are
clinically “normal” but may present the sickle cell anemia trait, ie, in extreme low-oxygenation
situations, such as high altitudes or great physical efforts, their RBCs may deform (Nussbaum, et al.,
2007).
SCD is therefore a recessive disease in its clinical manifestations but the affected gene has
dominant expression, since HbAS individuals may present sickle RBCs in deoxygenated blood
samples (Schnog, et al., 2004).
All major forms of SCD present with hemolytic anemia, which is characterized by low hemoglobin
levels, high reticulocyte counts and elevated serum levels of serum lactate dehydrogenase (LDH)
(Schnog, et al., 2004). Mean corpuscular volume (MCV) is normal to slightly raised (see reference
values in Supplemental Material, Tables S1 and S2). Sickle erythrocytes can be visualized in routine
peripheral blood smear (Schnog, et al., 2004). The hemoglobin solubility test, in which a precipitate is
CHAPTER I ~ INTRODUCTION
8
formed with oxygen depletion, allows the confirmation of the presence of HbS but it does not make a
distinction between the different genotypes (summarized in Table I.1) (Schnog, et al., 2004).
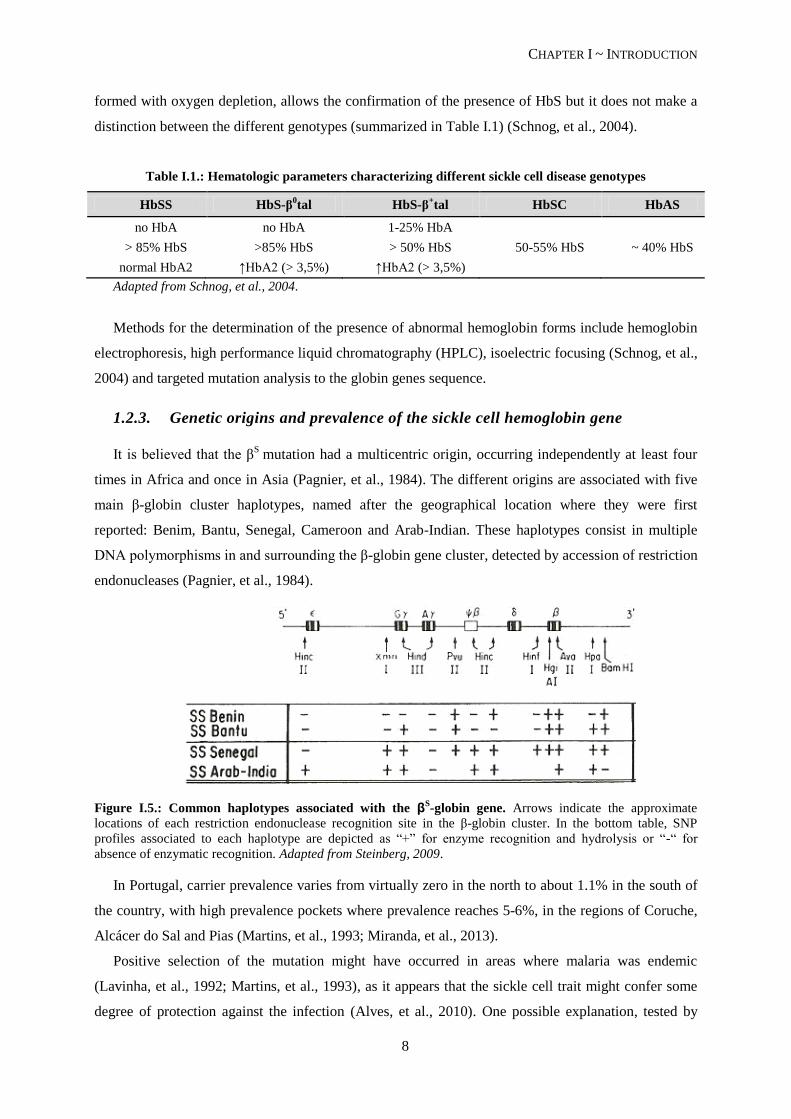
Table I.1.: Hematologic parameters characterizing different sickle cell disease genotypes
HbSS HbS-β0tal HbS-β
+tal HbSC HbAS
no HbA no HbA 1-25% HbA
> 85% HbS >85% HbS > 50% HbS 50-55% HbS ~ 40% HbS
normal HbA2 ↑HbA2 (> 3,5%) ↑HbA2 (> 3,5%)
Adapted from Schnog, et al., 2004.
Methods for the determination of the presence of abnormal hemoglobin forms include hemoglobin
electrophoresis, high performance liquid chromatography (HPLC), isoelectric focusing (Schnog, et al.,
2004) and targeted mutation analysis to the globin genes sequence.
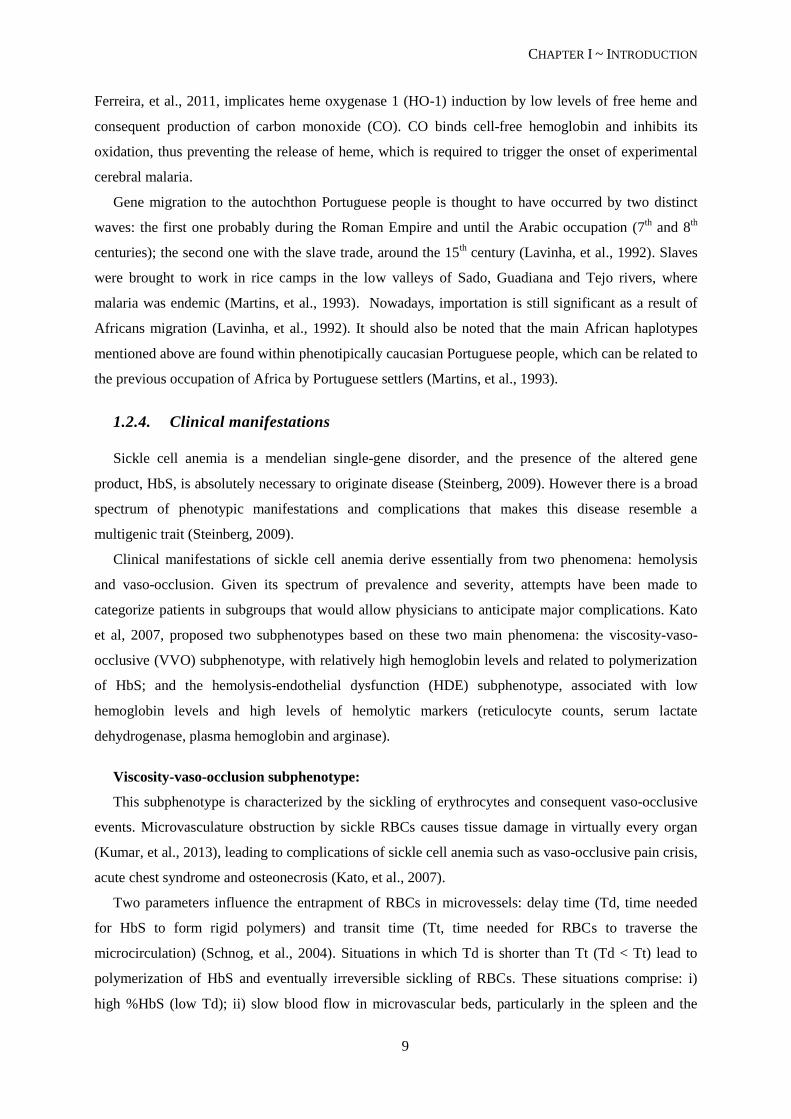
1.2.3. Genetic origins and prevalence of the sickle cell hemoglobin gene
It is believed that the βS
mutation had a multicentric origin, occurring independently at least four
times in Africa and once in Asia (Pagnier, et al., 1984). The different origins are associated with five
main β-globin cluster haplotypes, named after the geographical location where they were first
reported: Benim, Bantu, Senegal, Cameroon and Arab-Indian. These haplotypes consist in multiple
DNA polymorphisms in and surrounding the β-globin gene cluster, detected by accession of restriction
endonucleases (Pagnier, et al., 1984).
Figure I.5.: Common haplotypes associated with the βS-globin gene. Arrows indicate the approximate
locations of each restriction endonuclease recognition site in the β-globin cluster. In the bottom table, SNP
profiles associated to each haplotype are depicted as “+” for enzyme recognition and hydrolysis or “-“ for
absence of enzymatic recognition. Adapted from Steinberg, 2009.
In Portugal, carrier prevalence varies from virtually zero in the north to about 1.1% in the south of
the country, with high prevalence pockets where prevalence reaches 5-6%, in the regions of Coruche,
Alcácer do Sal and Pias (Martins, et al., 1993; Miranda, et al., 2013).
Positive selection of the mutation might have occurred in areas where malaria was endemic
(Lavinha, et al., 1992; Martins, et al., 1993), as it appears that the sickle cell trait might confer some
degree of protection against the infection (Alves, et al., 2010). One possible explanation, tested by
CHAPTER I ~ INTRODUCTION
9
Ferreira, et al., 2011, implicates heme oxygenase 1 (HO-1) induction by low levels of free heme and
consequent production of carbon monoxide (CO). CO binds cell-free hemoglobin and inhibits its
oxidation, thus preventing the release of heme, which is required to trigger the onset of experimental
cerebral malaria.
Gene migration to the autochthon Portuguese people is thought to have occurred by two distinct
waves: the first one probably during the Roman Empire and until the Arabic occupation (7th and 8
th
centuries); the second one with the slave trade, around the 15th century (Lavinha, et al., 1992). Slaves
were brought to work in rice camps in the low valleys of Sado, Guadiana and Tejo rivers, where
malaria was endemic (Martins, et al., 1993). Nowadays, importation is still significant as a result of
Africans migration (Lavinha, et al., 1992). It should also be noted that the main African haplotypes
mentioned above are found within phenotipically caucasian Portuguese people, which can be related to
the previous occupation of Africa by Portuguese settlers (Martins, et al., 1993).
1.2.4. Clinical manifestations
Sickle cell anemia is a mendelian single-gene disorder, and the presence of the altered gene
product, HbS, is absolutely necessary to originate disease (Steinberg, 2009). However there is a broad
spectrum of phenotypic manifestations and complications that makes this disease resemble a
multigenic trait (Steinberg, 2009).
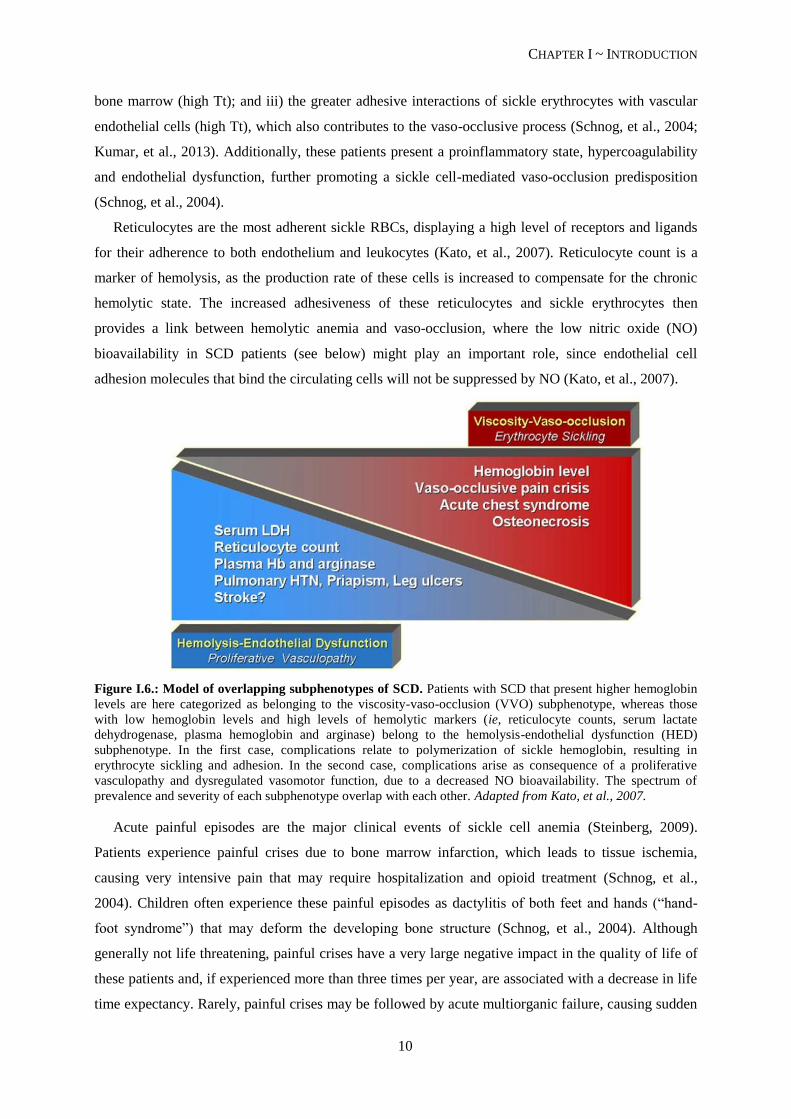
Clinical manifestations of sickle cell anemia derive essentially from two phenomena: hemolysis
and vaso-occlusion. Given its spectrum of prevalence and severity, attempts have been made to
categorize patients in subgroups that would allow physicians to anticipate major complications. Kato
et al, 2007, proposed two subphenotypes based on these two main phenomena: the viscosity-vaso-
occlusive (VVO) subphenotype, with relatively high hemoglobin levels and related to polymerization
of HbS; and the hemolysis-endothelial dysfunction (HDE) subphenotype, associated with low
hemoglobin levels and high levels of hemolytic markers (reticulocyte counts, serum lactate
dehydrogenase, plasma hemoglobin and arginase).
Viscosity-vaso-occlusion subphenotype:
This subphenotype is characterized by the sickling of erythrocytes and consequent vaso-occlusive
events. Microvasculature obstruction by sickle RBCs causes tissue damage in virtually every organ
(Kumar, et al., 2013), leading to complications of sickle cell anemia such as vaso-occlusive pain crisis,
acute chest syndrome and osteonecrosis (Kato, et al., 2007).
Two parameters influence the entrapment of RBCs in microvessels: delay time (Td, time needed
for HbS to form rigid polymers) and transit time (Tt, time needed for RBCs to traverse the
microcirculation) (Schnog, et al., 2004). Situations in which Td is shorter than Tt (Td < Tt) lead to
polymerization of HbS and eventually irreversible sickling of RBCs. These situations comprise: i)
high %HbS (low Td); ii) slow blood flow in microvascular beds, particularly in the spleen and the
CHAPTER I ~ INTRODUCTION
10
bone marrow (high Tt); and iii) the greater adhesive interactions of sickle erythrocytes with vascular
endothelial cells (high Tt), which also contributes to the vaso-occlusive process (Schnog, et al., 2004;
Kumar, et al., 2013). Additionally, these patients present a proinflammatory state, hypercoagulability
and endothelial dysfunction, further promoting a sickle cell-mediated vaso-occlusion predisposition
(Schnog, et al., 2004).
Reticulocytes are the most adherent sickle RBCs, displaying a high level of receptors and ligands
for their adherence to both endothelium and leukocytes (Kato, et al., 2007). Reticulocyte count is a
marker of hemolysis, as the production rate of these cells is increased to compensate for the chronic
hemolytic state. The increased adhesiveness of these reticulocytes and sickle erythrocytes then
provides a link between hemolytic anemia and vaso-occlusion, where the low nitric oxide (NO)
bioavailability in SCD patients (see below) might play an important role, since endothelial cell
adhesion molecules that bind the circulating cells will not be suppressed by NO (Kato, et al., 2007).
Figure I.6.: Model of overlapping subphenotypes of SCD. Patients with SCD that present higher hemoglobin
levels are here categorized as belonging to the viscosity-vaso-occlusion (VVO) subphenotype, whereas those
with low hemoglobin levels and high levels of hemolytic markers (ie, reticulocyte counts, serum lactate
dehydrogenase, plasma hemoglobin and arginase) belong to the hemolysis-endothelial dysfunction (HED)
subphenotype. In the first case, complications relate to polymerization of sickle hemoglobin, resulting in
erythrocyte sickling and adhesion. In the second case, complications arise as consequence of a proliferative
vasculopathy and dysregulated vasomotor function, due to a decreased NO bioavailability. The spectrum of
prevalence and severity of each subphenotype overlap with each other. Adapted from Kato, et al., 2007.
Acute painful episodes are the major clinical events of sickle cell anemia (Steinberg, 2009).
Patients experience painful crises due to bone marrow infarction, which leads to tissue ischemia,
causing very intensive pain that may require hospitalization and opioid treatment (Schnog, et al.,
2004). Children often experience these painful episodes as dactylitis of both feet and hands (“hand-
foot syndrome”) that may deform the developing bone structure (Schnog, et al., 2004). Although
generally not life threatening, painful crises have a very large negative impact in the quality of life of
these patients and, if experienced more than three times per year, are associated with a decrease in life
time expectancy. Rarely, painful crises may be followed by acute multiorganic failure, causing sudden
CHAPTER I ~ INTRODUCTION
11
death (Schnog, et al., 2004). Interestingly, there is a reduced rate of painful events associated with
hyperhemolysis cases, due to a reduction of blood viscosity. However, when these events occur in
association with more severe hemolytic anemia, a reduced survival rate is observed (Steinberg, 2009).
Acute chest syndrome (ACS) occurs in 15-40% of sickle cell anemia patients and is characterized
by a pulmonary infiltrate on chest X-ray in a patient displaying dyspnea, pleuritic pain, cof or fever,
usually associated with a drop of hemoglobin levels. It could be caused by sickle erythrocytes
sequestration, fat embolism or pulmonary vasculature thrombosis, and is usually recurrent (Schnog, et
al., 2004).
Hemolysis-endothelial dysfunction subphenotype:
Hemolysis is a critical measure of SCD severity, and appears to be the cause of some disease
complications, as mentioned above. The hemolytic process may be intra- or extravascular.
Intravascular hemolysis occurs in the vascular compartment, i.e., inside the blood vessels, and might
occur by mechanical forces, biochemical or physical agents (Kumar, et al., 2013), and complement
recognition (Schnog, et al., 2004). Sickle RBCs are more sensitive to these aggressions due to the
membrane damages that occur during deoxygenation. Extravascular hemolysis occurs essentially
inside the spleen and liver, two organs rich in macrophages that capture the entrapped RBCs. Due to
the loss of deformative capacity of sickle erythrocytes, they get stuck in splenic sinusoids much more
frequently than normal RBCs, raising the rate of phagocytosis and therefore hemolysis (Kumar, et al.,
2013). Both hemolytic processes account for the diminished life span of these cells, from the normal
120 days to only about 17 days (Schnog, et al., 2004).
In order to compensate for the reduced life time of RBCs, these patients have an elevated rate of
erythropoiesis, which ultimately causes normally inactive bone marrow sites to reactivate (Schnog, et
al., 2004), leading to bone reabsortion and secondary bone formation with consequent skeletal
deformation (usually high cheekbones and skull alterations) (Kumar, et al., 2013). Additionally, to
maintain a steady oxygen supply, patients develop a hyperdynamic circulation, with plasma volume
expansion, eventually leading to dilated cardiomyopathy in an early age (Schnog, et al., 2004).
Chronic hemolysis causes retention of degradation resulting products (Kumar, et al., 2013) due to
saturation of excretory mechanisms. Heme degradation leads to high levels of non-conjugated
bilirubin which in turn causes jaundice and development of gallstones (Schnog, et al., 2004).
A major role of hemolysis in the bioavailability of NO has been established. NO is an ubiquitous
uncharged gas that functions as a signaling molecule with a well-established role in vascular
homeostasis, platelet aggregation inhibition (Cooke, et al., 2007) and transcriptional repression of the
cell adhesion molecules (Kato, et al., 2007). SCD patients have a NO-resistance state associated with
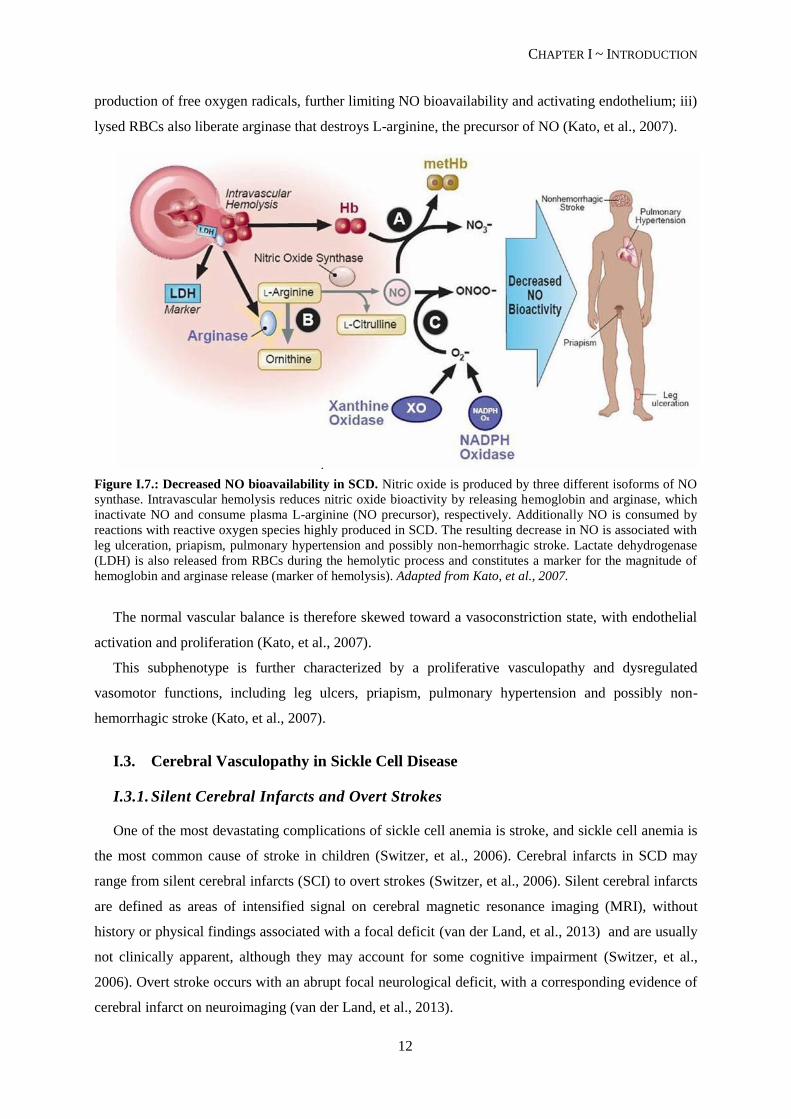
hemolysis in three distinct ways (see Figure I.7.): i) plasma hemoglobin liberated by intravascular
hemolysis of the deformed RBCs consumes NO; ii) hemoglobin, heme and heme iron catalyze the
CHAPTER I ~ INTRODUCTION
12
production of free oxygen radicals, further limiting NO bioavailability and activating endothelium; iii)
lysed RBCs also liberate arginase that destroys L-arginine, the precursor of NO (Kato, et al., 2007).
Figure I.7.: Decreased NO bioavailability in SCD. Nitric oxide is produced by three different isoforms of NO
synthase. Intravascular hemolysis reduces nitric oxide bioactivity by releasing hemoglobin and arginase, which
inactivate NO and consume plasma L-arginine (NO precursor), respectively. Additionally NO is consumed by
reactions with reactive oxygen species highly produced in SCD. The resulting decrease in NO is associated with
leg ulceration, priapism, pulmonary hypertension and possibly non-hemorrhagic stroke. Lactate dehydrogenase
(LDH) is also released from RBCs during the hemolytic process and constitutes a marker for the magnitude of
hemoglobin and arginase release (marker of hemolysis). Adapted from Kato, et al., 2007.
The normal vascular balance is therefore skewed toward a vasoconstriction state, with endothelial
activation and proliferation (Kato, et al., 2007).
This subphenotype is further characterized by a proliferative vasculopathy and dysregulated
vasomotor functions, including leg ulcers, priapism, pulmonary hypertension and possibly non-
hemorrhagic stroke (Kato, et al., 2007).
I.3. Cerebral Vasculopathy in Sickle Cell Disease
I.3.1. Silent Cerebral Infarcts and Overt Strokes
One of the most devastating complications of sickle cell anemia is stroke, and sickle cell anemia is
the most common cause of stroke in children (Switzer, et al., 2006). Cerebral infarcts in SCD may
range from silent cerebral infarcts (SCI) to overt strokes (Switzer, et al., 2006). Silent cerebral infarcts
are defined as areas of intensified signal on cerebral magnetic resonance imaging (MRI), without
history or physical findings associated with a focal deficit (van der Land, et al., 2013) and are usually
not clinically apparent, although they may account for some cognitive impairment (Switzer, et al.,
2006). Overt stroke occurs with an abrupt focal neurological deficit, with a corresponding evidence of
cerebral infarct on neuroimaging (van der Land, et al., 2013).
CHAPTER I ~ INTRODUCTION
13
SCIs vary from clinical strokes in size and location, therefore accounting for their different
severity: SCIs usually occur deep in the white matter of the frontal (81%) and parietal (45%) lobes and
are typically smaller, whereas clinically apparent strokes locate in the cortex and deep in the white
matter, with larger dimensions (DeBaun, et al., 2012).
I.3.2. Incidence
Global incidence of overt stroke in children is 1.29/100000 per year. Children with SCD have a
221-times greater risk for the occurrence of overt stroke and an increased risk for cerebral infarcts to
develop of about 410 times (Switzer, et al., 2006). SCI are the most common cause of neurological
disease in children with SCD, occurring in 17% of the cases before the 6th birthday, and 27% before
the 14th
birthday (Switzer, et al., 2006). Overt stroke occurs in about 11% of SCD patients before the
age of 20 and in 24% of such patients by the age of 45 (Switzer, et al., 2006). The major incidence is
observed during the first decade of life, with 2-5% of occurrences happening before the 6th anniversary
(DeBaun, et al., 2012).
Among patients with the common genotypes of SCD, cerebrovascular accidents (CVAs) are most
frequent in those with genotype αA
2βS
2 (SS), followed in decreasing order by genotypes αA
2βSβ
0-
thalassemia (Sβ0-thal), α
A2β
Sβ
+-thalassemia (Sβ
+-thal) and α
A2β
Sβ
c (SC) (Ohene-Frempong, et al.,
1998).
Children with less than 2 years of age have the lowest CVA incidence (Ohene-Frempong, et al.,
1998), but the highest risk for infarctive stroke occurs during the first decade of life, between ages 2
and 9. This risk decreases during the second decade, to rise again throughout the third (Switzer, et al.,
2006). About two thirds of patients present recurrent cerebral infarction within the two to three years
after the initial event (Switzer, et al., 2006).
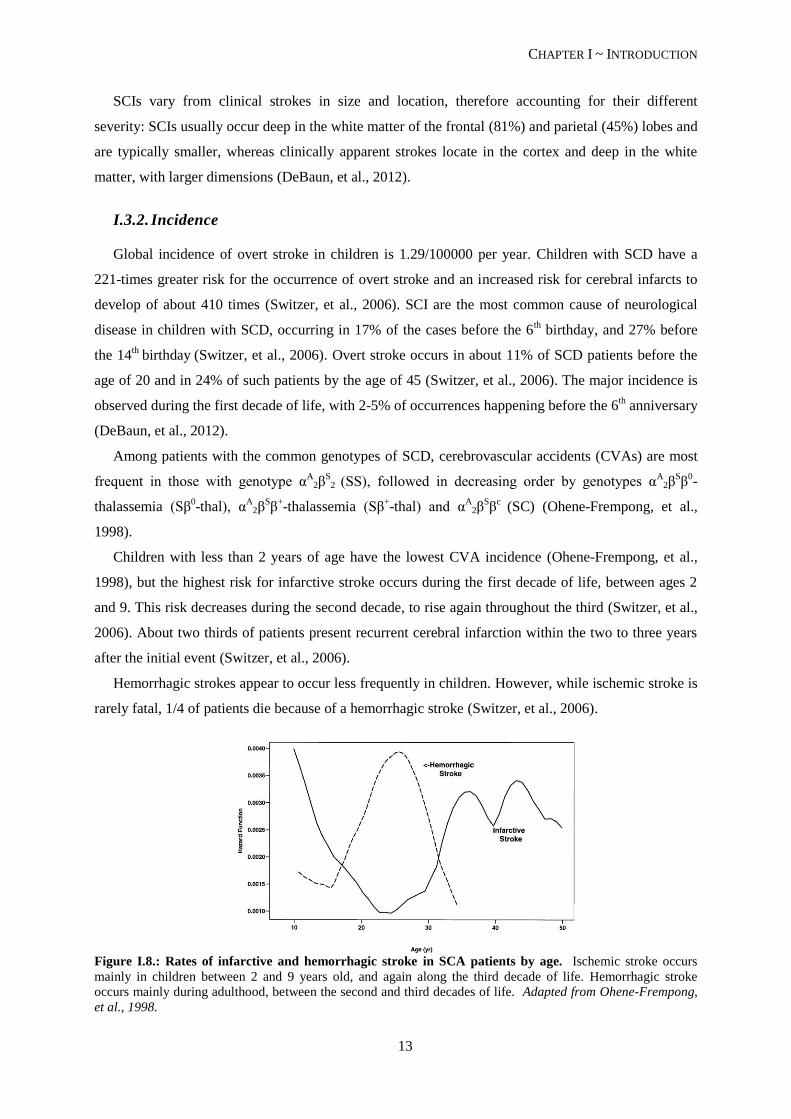
Hemorrhagic strokes appear to occur less frequently in children. However, while ischemic stroke is
rarely fatal, 1/4 of patients die because of a hemorrhagic stroke (Switzer, et al., 2006).
Figure I.8.: Rates of infarctive and hemorrhagic stroke in SCA patients by age. Ischemic stroke occurs
mainly in children between 2 and 9 years old, and again along the third decade of life. Hemorrhagic stroke
occurs mainly during adulthood, between the second and third decades of life. Adapted from Ohene-Frempong,
et al., 1998.
CHAPTER I ~ INTRODUCTION
14
I.3.3. Risk Factors and Predictors
The most relevant risk factors for SCIs to occur include seizures, low hemoglobin levels, systolic
hypertension in adults (but not children), and being male (Kinney, et al., 1999) (DeBaun, et al., 2012).
Seizures in children with SCD increase the risk for SCI 15 times (Kinney, et al., 1999). A higher
frequency of ischemic lesions was reported in association with elevated red blood cell counts,
probably associated with early impairment of spleen function, and with the Senegal βS haplotype
(Kinney, et al., 1999). This haplotype effect is independent of HbF concentration, a major modulator
of SCD severity (see page 21) since there appears to be no protective effect from higher HbF levels in
the lesions (Kinney, et al., 1999). An elevated white blood cell (WBC) count has also been implicated
as risk factor for SCIs (Kinney, et al., 1999; Switzer, et al., 2006).
Aside from the steady-state leukocytosis and baseline hemoglobin below 7 g/dL (Fasano, et al.,
2015), stroke predictors differ from SCI risk factors, further implying different etiologies for these
cerebrovascular anomalies. The most significant predictors of stroke comprise previous transient
ischemic attack (TIA), relative hypertension, increased frequency of acute chest syndrome (Fasano, et
al., 2015) and nocturnal hypoxemia (O2 saturation below 96%) (Switzer, et al., 2006). The presence of
SCI is a risk factor for additional neurological damage, increasing 14 times the risk of overt stroke and
progressive silent cerebral infarct (DeBaun, et al., 2012).
High white blood cell counts have been implicated in both ischemic (Switzer, et al., 2006) and
hemorrhagic stroke (Ohene-Frempong, et al., 1998), the latter probably when in association with low
total hemoglobin levels (Switzer, et al., 2006). The type of stroke may arise by different
pathophysiologic mechanisms or as a consequence of progressive cerebrovascular damage (Ohene-
Frempong, et al., 1998).
I.3.4. Pathophysiology of Ischemic Stroke
Stroke in SCD has been described since 1923 and, in 1972, Stockman et al. conducted a case-study
that demonstrated the particular vulnerability of the internal carotid artery and circle of Willis to these
ischemic events. In this case-study, the authors proposed that the large vessel disease might derive
from a small vessel disease, where the sickle RBCs would occlude the nutrient arteries of the large
arteries (vasa vasorum) causing ischemia and progressive intima and media-wall proliferation of the
latter (Stockman, et al., 1972). This sickle cell entrapment in the microvasculature may also be the
cause of silent cerebral infarcts (Switzer, et al., 2006). In SCD patients, sickle RBCs are unusually
adherent to the vascular endothelium and the strength of interaction appears to correlate to the clinical
severity of vaso-occlusive events inherent to the disease (Switzer, et al., 2006).
As mentioned before, stroke subtype in SCD varies with age and ischemic stroke is more prevalent
during the first decade of life. This type of stroke accounts for 54% of all CVAs (reviewed in
Verduzco & Nathan, 2009).
CHAPTER I ~ INTRODUCTION
15
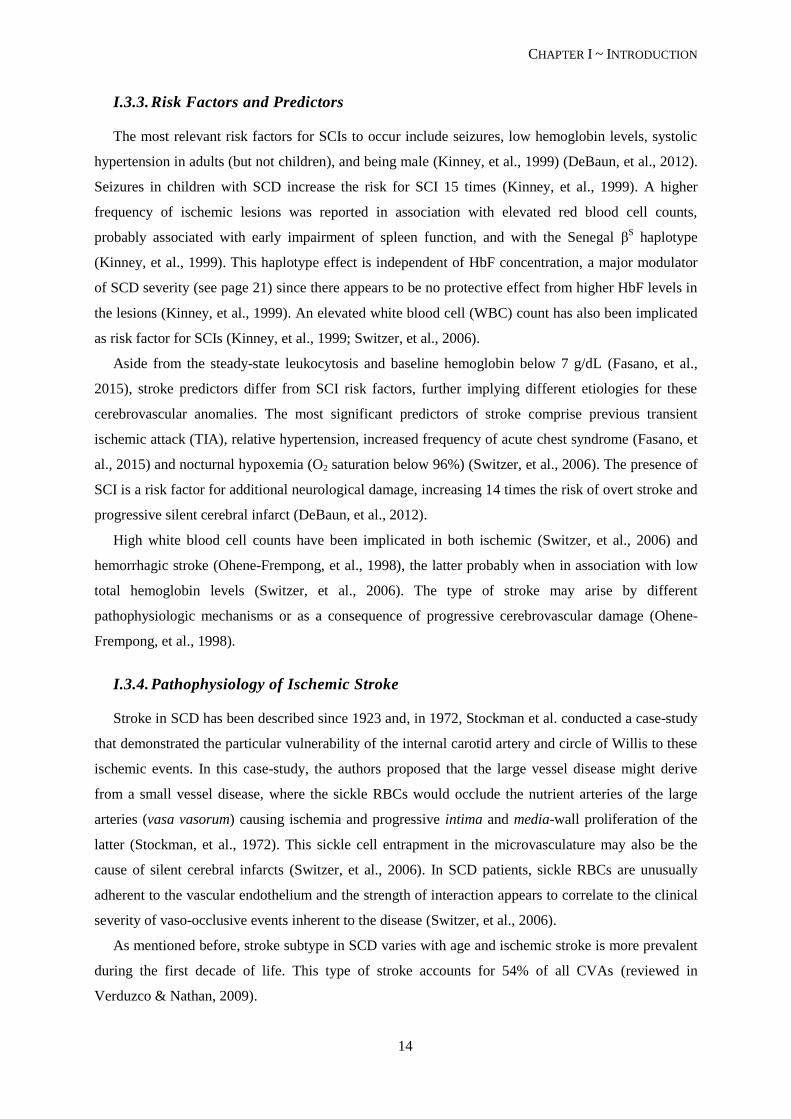
The stroke syndrome in children with SCD occurs mainly by infarction of the large arteries of the
anterior portion of the Circle of Willis, preferentially just beyond the origin of the ophthalmic artery,
internal carotids (Adams, 2007) and anterior cerebral arteries (Switzer, et al., 2006) (See Figure I.9.).
Intermediate regions are less involved and the posterior vasculature is almost entirely spared (Switzer,
et al., 2006).
Figure I.9.: Representation of the Circle of Willis in situ. Localization of the large arteries of the brain. In a
dashed line the Circle of Willis is depicted. The arteries mainly implicated in ischemic stroke events are also
highlighted (full boxes). Adapted from Netter, 2006.
The most common hystopathological finding in CVAs associated to SCD is damage to the
endothelium of the mentioned arteries, particularly at branch points, inducing intimal proliferation,
fibrin deposition and thrombus formation (Kassim & DeBaun, 2013). Thickening of the tunica intima
is due to the proliferation of fibroblasts and smooth muscle cells that occurs as a consequence of
recurrent endothelial damage by RBCs (Switzer, et al., 2006).
Sickle cell adherence to the endothelium activates it, promoting the activity of transcription factors
and vasoconstrictors, such as endothelin-1 (ET-1). Vascular relaxation is inhibited and there is an
increase in the expression of surface adhesion molecules that further promote erythrocyte-endothelium
interaction. In addition, free hemoglobin inactivates NO, further increasing vascular tone, and patients
with SCD present both a pro-coagulant and a pro-inflammatory state (see Figure I.10.). The net result
is vascular wall remodeling and vasculopathy (Switzer, et al., 2006).
CHAPTER I ~ INTRODUCTION
16
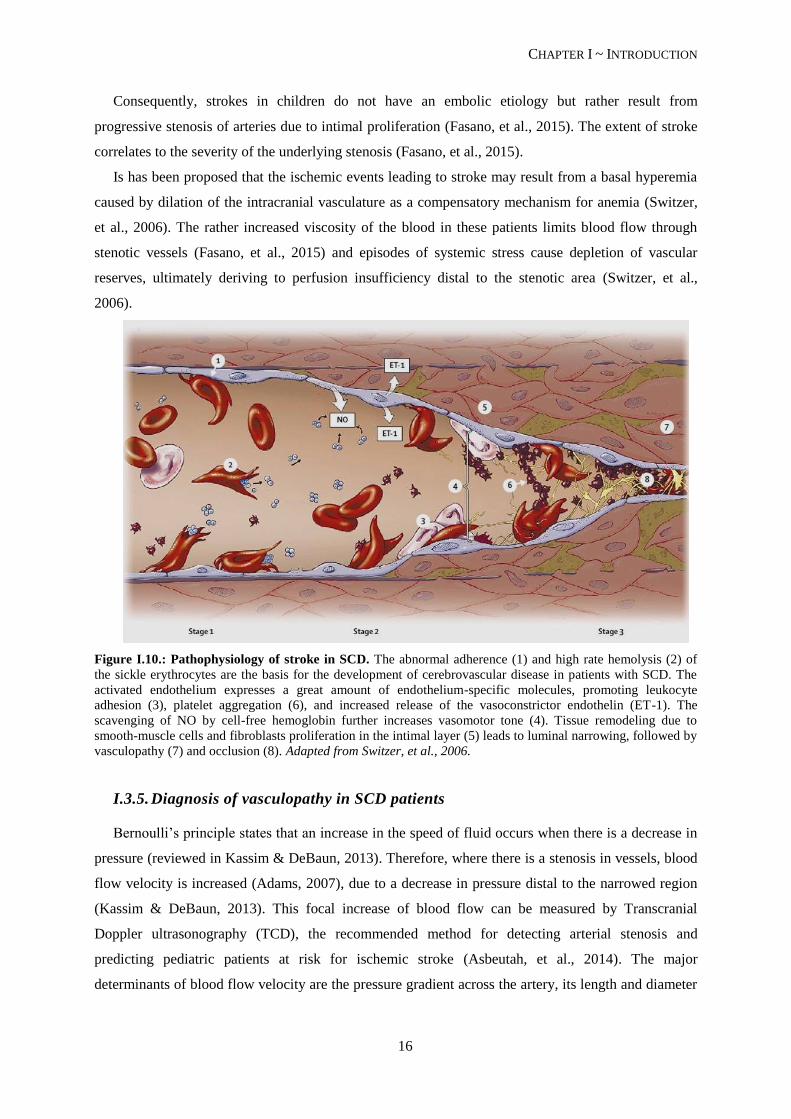
Consequently, strokes in children do not have an embolic etiology but rather result from
progressive stenosis of arteries due to intimal proliferation (Fasano, et al., 2015). The extent of stroke
correlates to the severity of the underlying stenosis (Fasano, et al., 2015).
Is has been proposed that the ischemic events leading to stroke may result from a basal hyperemia
caused by dilation of the intracranial vasculature as a compensatory mechanism for anemia (Switzer,
et al., 2006). The rather increased viscosity of the blood in these patients limits blood flow through
stenotic vessels (Fasano, et al., 2015) and episodes of systemic stress cause depletion of vascular
reserves, ultimately deriving to perfusion insufficiency distal to the stenotic area (Switzer, et al.,
2006).
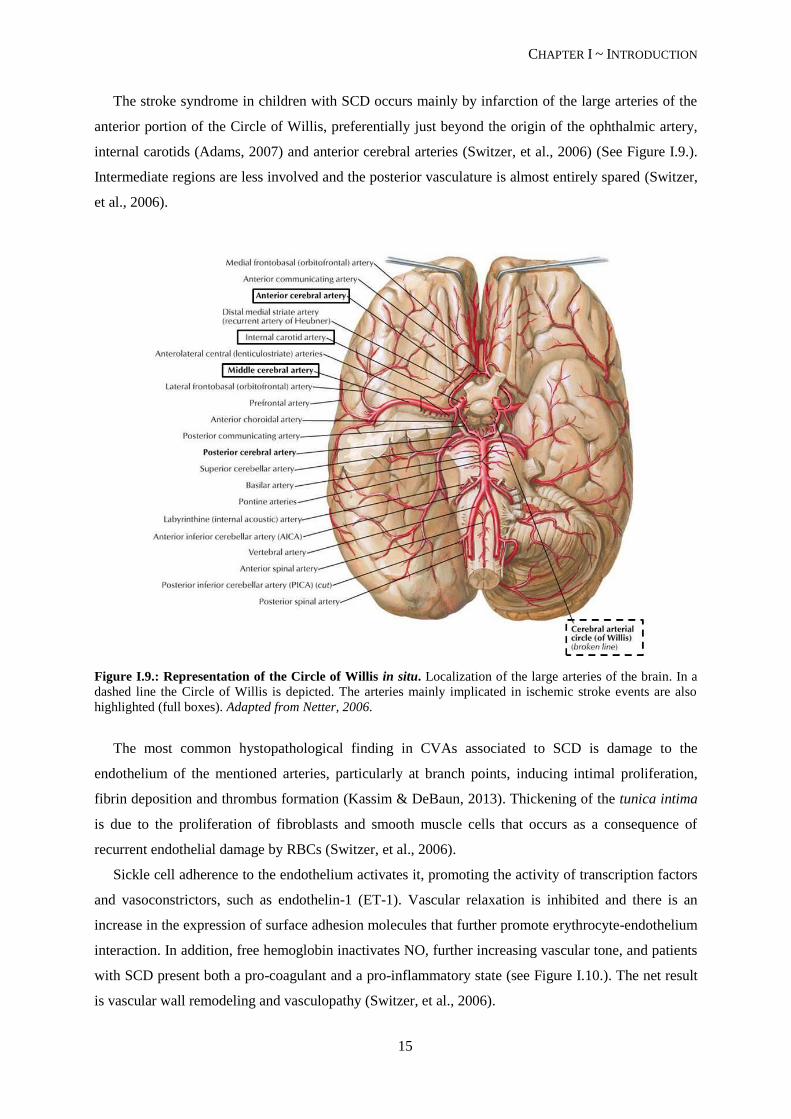
Figure I.10.: Pathophysiology of stroke in SCD. The abnormal adherence (1) and high rate hemolysis (2) of
the sickle erythrocytes are the basis for the development of cerebrovascular disease in patients with SCD. The
activated endothelium expresses a great amount of endothelium-specific molecules, promoting leukocyte
adhesion (3), platelet aggregation (6), and increased release of the vasoconstrictor endothelin (ET-1). The
scavenging of NO by cell-free hemoglobin further increases vasomotor tone (4). Tissue remodeling due to
smooth-muscle cells and fibroblasts proliferation in the intimal layer (5) leads to luminal narrowing, followed by
vasculopathy (7) and occlusion (8). Adapted from Switzer, et al., 2006.
I.3.5. Diagnosis of vasculopathy in SCD patients
Bernoulli’s principle states that an increase in the speed of fluid occurs when there is a decrease in
pressure (reviewed in Kassim & DeBaun, 2013). Therefore, where there is a stenosis in vessels, blood
flow velocity is increased (Adams, 2007), due to a decrease in pressure distal to the narrowed region
(Kassim & DeBaun, 2013). This focal increase of blood flow can be measured by Transcranial
Doppler ultrasonography (TCD), the recommended method for detecting arterial stenosis and
predicting pediatric patients at risk for ischemic stroke (Asbeutah, et al., 2014). The major
determinants of blood flow velocity are the pressure gradient across the artery, its length and diameter
CHAPTER I ~ INTRODUCTION
17
and blood viscosity, which is influenced by the hematocrit (the percentage of RBC in the blood; also
known as packed cell volume - PCV) and leukocyte and platelet counts (Asbeutah, et al., 2014).
Blood flow at the medial cerebral artery is measured as a time-averaged mean of maximum
velocity (TAMMV) by TCD. Its values vary from adults (60 cm/s) to children, and from healthy
children (90 cm/s) to those with SCD (130 cm/s) (Adams, 2007). TAMMV has a higher predictive
value for overt stroke than peak systolic velocity (Fasano, et al., 2015). As mentioned before,
increased blood velocity in the terminal portion of the internal carotid artery or the medial cerebral
artery indicates intracranial vasculopathy that may progress to overt stroke (Kassim & DeBaun, 2013).
Children with a TAMMV below 170 cm/s are considered “normal” or average risk; between 170 cm/s
and 199 cm/s, children present a moderate risk, and are classified as “conditional”; 200 cm/s and
above, children are at high risk for developing overt stroke (Adams, 2007). Additionally, velocities
greater than 200 cm/s appear to be associated with a more impendent risk of stroke (Adams, 2007).
However, the relationship between an elevated TCD measurement and the incidence of stroke is
not precise: approximately seven children with an elevated TCD measurement must undergo
transfusion therapy (see below) in order to prevent one of them from having a stroke; and individuals
above 16 years of age do not appear to have significantly higher risk of stroke even in the presence of
elevated TCD measurements (Fasano, et al., 2015).
In a variety of studies, magnetic resonance angiography (MRA) on children with SCD allowed
identification of about 10% of cases with cerebral vasculopathy, even when neurologically
asymptomatic (Fasano, et al., 2015). The risk of developing a first overt stroke due to cerebral
vasculopathy in the absence of an abnormal TCD has not been defined (Fasano, et al., 2015).
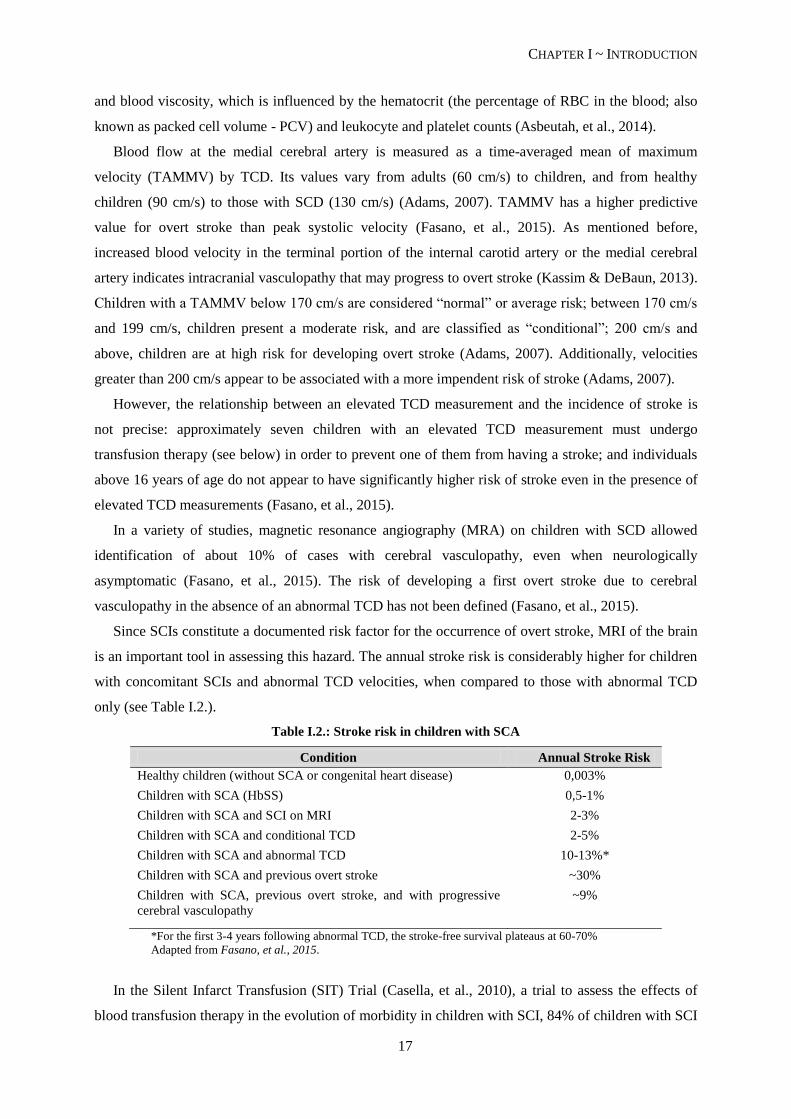
Since SCIs constitute a documented risk factor for the occurrence of overt stroke, MRI of the brain
is an important tool in assessing this hazard. The annual stroke risk is considerably higher for children
with concomitant SCIs and abnormal TCD velocities, when compared to those with abnormal TCD
only (see Table I.2.).
Table I.2.: Stroke risk in children with SCA
Condition Annual Stroke Risk
Healthy children (without SCA or congenital heart disease) 0,003%
Children with SCA (HbSS) 0,5-1%
Children with SCA and SCI on MRI 2-3%
Children with SCA and conditional TCD 2-5%
Children with SCA and abnormal TCD 10-13%*
Children with SCA and previous overt stroke ~30%
Children with SCA, previous overt stroke, and with progressive
cerebral vasculopathy
~9%
*For the first 3-4 years following abnormal TCD, the stroke-free survival plateaus at 60-70%
Adapted from Fasano, et al., 2015.
In the Silent Infarct Transfusion (SIT) Trial (Casella, et al., 2010), a trial to assess the effects of
blood transfusion therapy in the evolution of morbidity in children with SCI, 84% of children with SCI
CHAPTER I ~ INTRODUCTION
18
did not have evidence of vasculopathy as assessed by MRA and, for those with both findings, there
was no correlation between the side of vasculopathy and the side of SCI. About 1/3 of children lack
vasculopathy at the time of first overt stroke, and about 20% of strokes in SCD patients coincide with
other acute medical events (Casella, et al., 2010; Fasano, et al., 2015).
I.4. Disease Management
Since SCD is a genetic disease, couples at high risk should attend genetic consults in order to be
informed of their situation and options, namely the choice to submit to prenatal diagnostic testing.
Neo-natal diagnostic measures should also be implemented, since the sooner a child is diagnosed with
SCD, the easier it becomes to timely understand symptoms and try to ameliorate them, therefore
improving the quality of life of these children. Screening programs are also important, especially in
areas with high carrier prevalence.
Because a cure for SCD is unavailable, specific therapies are necessary to address the different
clinical manifestations, such as vaccination and penicillin prophylaxis to prevent infections and
administration of painkillers and fluids to relief pain crises (Schnog, et al., 2004).
Many pharmacological approaches have been and are being tested, but thus far only hydroxyurea
(HU) has been proven to reduce pain crises and ACS (Schnog, et al., 2004). HU is a ribonucleotide
reductase inhibitor, primarily used in myeloproliferative diseases (Schnog, et al., 2004). It has been
showed to stimulate HbF production, therefore decreasing HbS concentration and inhibiting its
polymerization (Switzer, et al., 2006). Furthermore, HU decreases expression of RBCs and
endothelial-cell adhesion molecules, may work as a NO donor and reduces reticulocyte (Switzer, et al.,
2006), leukocyte and platelet counts (Fasano, et al., 2015).
Additionally, HU therapy decreases TCD velocity, probably as a result of a reduction in turbulent
flow and consequent endothelial damage around stenosis, and improves cerebral oxygen saturation,
(probably due to increased hemoglobin levels and lower total blood viscosity), which may raise the
threshold for infarction (Verduzco & Nathan, 2009). However, its efficacy in preventing primary
stroke events has not yet been supported by a controlled, randomized trial (Verduzco & Nathan, 2009).
Despite being relatively safe and effective in pediatric patients (Schnog, et al., 2004), HU can cause
marked neutropenia and thrombocytopenia, which requires close monitoring of cell counts (Switzer, et
al., 2006). The carcinogenic potential appears to be small (Switzer, et al., 2006), but it cannot be
discarded for long-term exposure (Schnog, et al., 2004). Also, about 40% of patients fail to respond to
treatment with HU (Schnog, et al., 2004). For all the above mentioned reasons HU therapy is currently
limited to clinically severely affected patients (Schnog, et al., 2004).
Concerning stroke risk assessment, the current guideline for patients with SCD is TCD screening,
on an annual basis, between ages 2 and 16, or more frequently for higher risk cases (Asbeutah, et al.,
2014).
CHAPTER I ~ INTRODUCTION
19
Chronic blood transfusion (CBT) has proven to be effective for both primary and secondary stroke
prevention, in randomized controlled trials (Verduzco & Nathan, 2009) (Fasano, et al., 2015), with a
reduction of the risk of a first overt stroke in children with high TCD velocities of about 90%, and a
decrease from 70% to 20% of a second stroke event (Fasano, et al., 2015). When discontinued, a high
rate of strokes or recurrence was observed (Adams, 2007) (Fasano, et al., 2015).
Blood transfusions improve oxygen saturation by increasing arterial oxygen pressure and
hemoglobin-oxygen affinity, therefore reducing RBC sickling (Switzer, et al., 2006). This might
explain the reduced incidence of stroke, as well as painful crises and ACS (Schnog, et al., 2004). An
immediate hemodynamic effect has been described, with reduction of blood velocity in middle
cerebral artery (Switzer, et al., 2006).
Although CBT apparently delays the progression of cerebral vasculopathy, it does not reverse
vasculopathy, prevent its progression or eliminate de ongoing risk of cerebral infarcts (Fasano, et al.,
2015). Those cases where CBT fails to normalize TCD values are considered high risk (Fasano, et al.,
2015).
As mentioned above, seven patients must undergo CBT to prevent one stroke (Fasano, et al., 2015).
Additionally, CBT-related complications, such as alloimunization, risk of transmission of viral
infections and iron overload (Schnog, et al., 2004) raise some concerns in both families and clinicians
about the benefits vs risks of this approach (Switzer, et al., 2006). In case of iron overload, a
concomitant chelation therapy must be performed in order to continue transfusion therapy. (Schnog, et
al., 2004).
HU therapy has been considered an acceptable alternative to CBT for children with TCD velocities
higher than normal that lack significant cerebral vasculopathy, since in small cohorts it has shown a
reduction of TCD values from abnormal or conditional to normal (Fasano, et al., 2015). Some studies
showed a similar stroke recurrence between patients transitioned from CBT to HU and those
undergoing transfusion prophylaxis (Switzer, et al., 2006). The efficacy of a combination of both
therapies, however, remains to be studied in large cohorts (Fasano, et al., 2015).
Severely affected patients may be referred by clinicians for bone marrow transplantation (BMT),
the only potentially curative treatment currently available for SCD (Switzer, et al., 2006). BMT has
resulted in marked disease amelioration (Schnog, et al., 2004), with no stroke recurrence history and
actual vasculopathy regression (Switzer, et al., 2006). This allows children to become transfusion-
independent (Fasano, et al., 2015).
However, this therapeutic approach remains limited mainly due to compatible donor availability
(usually an HLA-matched sibling) (Switzer, et al., 2006), difficulty in predicting a severe clinical
course prior to significant organ damage and the high morbidity (Schnog, et al., 2004), including the
risk of peritransplant neurological events like intracranial hemorrhage and seizures (Switzer, et al.,
2006) (Fasano, et al., 2015). These events appear to be even more significant in patients with a history
of stroke (Switzer, et al., 2006).
CHAPTER I ~ INTRODUCTION
20
There is no established therapy available for primary or secondary SCI prevention (DeBaun, et al.,
2012), although there are some lines of evidence of lesion reduction following blood transfusions as
well as a decrease in the risk of new silent infarcts (Switzer, et al., 2006).
I.5. Genetic Modifiers
The great phenotypic variability of SCD patients makes it very hard for clinicians to anticipate the
disease’s clinical course (Thein, 2013). It has been proposed that this variability might be associated,
at least to some extent, with different genetic backgrounds.
Ideally the identification of specific biomarkers for disease severity would help stratify patients
according to their susceptibility for major SCD-related complications. HbF and α-thalassemia are two
well studied biomarkers for severity in SCD. These conditions are also the two main modulators of the
disease, as they are capable of changing the intracellular concentration of HbS, which in turn dictates
the rate of polymerization – the key phenomenon to causing SCD related medical problems
(Damanhouri, et al., 2015).
As mentioned before, the brain is a major site of morbidity in children with SCD and nowadays
TCD screening is the main biomarker used for detection of cerebral vasculopathy (Thein, 2013).
However, a truly meaningful point for primary prevention should avert vascular damage prior to the
increase in TCD velocities (Thein, 2013). The limitations of TCD screening on accurately identifying
all SCD patients at risk for development of cerebrovascular complications, associated with some
reluctance of both physicians and families to commit to an indefinite chronic transfusion program,
demand the determination of more sensitive and specific stroke prediction biomarkers (Flanagan, et
al., 2011).
Studies with twins showed an increased risk for stroke if a child has a sibling that has already
experienced an overt stroke. These studies show a genetic contribution to stroke, furthermore
evidenced by several association studies between putative gene polymorphisms and the development
of cerebrovascular disease in SCD patients (Domingos, et al., 2014). Hence the identification of such
genetic modulators can provide a more accurate estimation of disease severity as well as evidence or
clues for new targets for therapeutic intervention (Thein, 2013).
One should however keep in mind that the clinical course of the disease is not only influenced by
genetic factors, but also environmental, social and economical factors (Domingos, et al., 2014).
I.5.1. Genetic modulation of overall SCD severity
β-globin genotype
Since HbS concentration directly influences the rate of polymerization, the different genotypes (see
Table I.1., pp. 8) that lead to SCD render different phenotypic severities: in SCA (SS) and SCD-Sβ0-
thalassemia patients almost all available hemoglobin is HbS, and these patients present the most
severe forms of the disease; SCD-SC and SCD-Sβ+-thalassemia patients have lower percents of HbS,
CHAPTER I ~ INTRODUCTION
21
usually presenting milder forms of the disease (Thein, 2013). However, this tendency is not an
absolute rule.
βS-globin associated haplotypes
As mentioned earlier, the sickle cell mutation occurs in association with specific βS-globin
haplotypes (see page 8), characteristic of the geographical origin of the primitive mutation. Although
there is high heterogeneity of clinical manifestations within each haplotype, these haplotypes have
been associated with clear hematological and clinical differences (Steinberg, 2009). As general rule,
the most severe clinical courses have been associated to Bantu haplotype, with highest incidence of
organ damage; milder phenotypes, as measured by lower rates of hospitalization and fewer painful
episodes, have been associated to Senegal/Arab-Indian haplotypes; and Benim haplotype has been
associated to intermediate features (Steinberg, 2009).
Hereditary persistence of fetal hemoglobin (HPFH)
Akinsheye, et al., 2011, have defined the “HbSF” phenotype described in 1984 by Steinberg, as the
presence of 10% or more HbF in SCD patients with 4 or more years of age, since this is the age at
which HbF levels stabilize. HbF prevents polymerization of HbS molecules by two means: by
decreasing the intracellular concentration of HbS, it slows the polymerization rate; and the hybrid
tetramers (α2βγ) (Thein, 2013) are incapable of entering the HbS polymerization phase, halting it
(Damanhouri, et al., 2015).
HbF is genetically modulated (Steinberg, 2009). It varies from adult hemoglobin due to its higher
affinity for oxygen, necessary for the growing fetus to better access it from the mother’s bloodstream
(Damanhouri, et al., 2015). Its persistence in adulthood is an abnormal condition (HPFH) that turns
out to be advantageous to anemic patients. HbF level is a major survival predictor in SCD patients and
lower levels have been implicated in increased risk for brain infarcts in children (Wang, et al., 2008).
Two main genetic alterations lead to increased %HbF and usually milder SCD phenotypes: i) a
CT polymorphism 158 bp 5’ to HBG2 (rs7482144), associated with β-globin cluster haplotypes
Senegal and Arab-Indian (Steinberg, 2009); and ii) a TC polymorphism in the second intron of
BCL11A (rs11886868), that locates at chromosome 2p16.1and codes for a γ-globin zinc-finger
repressor (Uda, et al., 2008).
Other minor mechanisms are certainly involved in further regulating HbF expression.
Co-inheritance of α-thalassemia
About 1/3 of patients with SCD have coincidental α-thalassemia (Steinberg, 2009). Most of these
patients are heterozygous for the –α3.7kb
deletion (HGVS name NG_000006.1:g.34164_37967del3804),
and 3-5% represent homozygous cases (Thein, 2013).
CHAPTER I ~ INTRODUCTION
22
These SCD-α-thalassemia patients have higher %Hb and RBC lifespan, with lower MCV,
reticulocyte counts, bilirubin level and RBC aggregates (Damanhouri, et al., 2015). In fact, by
reducing the mean cellular HbS concentration, α-thalassemia lowers its polymerization and
consequent sickling and hemolysis of RBCs, while raising hematocrit and thus overall blood viscosity
(Thein, 2013).
Due to the decreased rate of hemolysis and the evidence of a reduction in the incidence of elevated
TCD flow velocities and stroke (Steinberg, 2009), several authors associate this condition with stroke
prevention, albeit the apparently little effect in overall survival (Thein, 2013; Coelho, et al., 2014).
Flanagan et al, 2001, however, found a higher frequency of the deletion in their study control group
(ie, no-stroke group).
Although extensively studied and repeatedly implicated in modulating the overall sickle cell
disease severity, HbF level and co-inheritance of α-thalassemia cannot fully explain the phenotypic
diversity. Several genes, and their alterations, have been studied for implications in particular clinical
or laboratory manifestations, based on their potential role in pathophysiologic events.
1.5.2. Putative Genetic modulators of Ischemic Stroke in SCD
In the context of ischemic stroke, such polymorphic genes may be divided into three main groups,
according to the underlying pathologic event, known to participate in the pathophysiology of
vasculopathy (see above): endothelium activation, vasodilation/vasoconstriction balance and systemic
inflammation. It should be noted that this division is not strict but rather a simplification to aid in the
understanding of the possible roles of the gene alterations since all genes mentioned below have
systemic implications, and may contribute in more than one way to the outcome of the disease.
I. ENDOTHELIUM ACTIVATION
Vascular cell adhesion molecule – 1 gene: VCAM-1
VCAM-1 is a critical member of the cell adhesion molecules (CAMs) that coordinates the
inflammatory response (Taylor, et al., 2002). A link has been observed between an increased serum
lactate dehydrogenase (LDH) level – a proximal biochemical marker of hemolysis – and a generalized
endothelial activation, characterized by increased levels of adhesion molecules, especially VCAM-1
(Coelho, et al., 2014). This sialoglycoprotein is highly expressed at the surface of endothelial cells of
both large and small vessels, following cytokine stimulation, and sickle erythrocytes are particularly
prone to adhere to VCAM-1 (Swerlick, et al., 1993; Gee & Platt, 1995).
VCAM-1 gene is found in chromosome 1q31-32, spanning for about 25 kb and containing 9 exons
(Cybulsky, et al., 1991). Several VCAM-1 single nucleotide polymorphisms (SNPs) have been studied
and associated to phenotypic differences between SCD patients, either individually or grouped in
haplotypes. Particularly, variants rs1041163, rs3978598 and rs3783613 have been associated to small
vessel stroke (Hoppe, et al., 2004), leukocytosis and protection against 11.9% of stroke risk (Taylor, et
CHAPTER I ~ INTRODUCTION
23
al., 2002), respectively, and some promoter haplotypes have been associated to hyperactive variants
(Idelman, et al., 2007).
Thrombospondin-1 gene: THBS-1
Thrombospondin (THBS) is an extracellular matrix (ECM) homotrimeric glycoprotein that binds
various matrix proteins, integrins and cell surface receptors, such as Cluster of Differentiation – 36
(CD36; see below) (Liu, et al., 2015). It modulates a wide range of biological functions including cell
adhesion, endothelial cell proliferation and chemotaxis (Liu, et al., 2015). There have been reports of
increased levels of THBS in conditions associated with tissue damage and inflammation, (Liu, et al.,
2015).
One nonsynonymous SNP, rs2292305, has been described in the THBS-1 gene – located in
chromosome 15q15 (Jaffe, et al., 1990) – as being associated with intima-media thickness (IMT) in the
internal carotid artery (Liao, et al., 2008). IMT is a marker of subclinical atherosclerosis and is
associated with increased risk of stroke and cardiovascular disease (CVD) (O'Leary, et al., 1999).
Cluster of Differentiation – 36 gene: CD36
CD36 is a transmembrane protein (Rać, et al., 2007 ) whose expression is significantly higher in
reticulocytes and RBCs of SCD patients, when compared to controls (Odièvre, et al., 2008). This
glycoprotein is implicated in the binding of RBCs to endothelial lining of blood vessels by its binding
to THBS (Damanhouri, et al., 2015).
CD36 gene locates in chromosome 7q11.2, and possesses 15 exons (Rać, et al., 2007 ). At least one
SNP at the 5’UTR, rs1984112, has been associated with higher reticulocyte counts, a marker for
increased hemolysis (Coelho, et al., 2014).
II. VASODILATION/VASOCONSTRICTION BALANCE
Endothelial Nitric Oxide Synthase gene: eNOS or NOS3
NO is produced in a basal level by eNOS in endothelial cells, allowing for the establishment of a
resting tone of the resistance vessels that regulates the arterial blood pressure (Kelm, et al., 1999). The
importance of NO and the relevance in NO production disequilibrium in SCD have been discussed
above. NO produced by eNOS appears to be beneficial in ischemic stroke (Tao & Chen, 2009).
NOS3 gene is located on chromosome 7q35-q36 and contains 26 exons throughout 21 kb (Tao &
Chen, 2009). Three polymorphisms have been implicated in decreased NO production and propensity
for vascular disease: rs2070744 (in the promoter of NOS3), rs1799983 (in exon 7, missense) and a 27-
bp VNTR in intron 4 (for detailed review consult Cooke, et al., 2007).
Endothelin-1 gene: ET-1
Endothelin-1 (ET-1) is the most potent vasoconstrictor involved in the control of endogenous
vasomotor tone (Abraham & Dashwood, 2008). Additionally, it plays an important role in overall
CHAPTER I ~ INTRODUCTION
24
endothelial dysfunction, up-regulating many inflammatory genes, promoting tissue remodeling and
even directly decreasing NO levels (Abraham & Dashwood, 2008).
ET-1 codes for pre-pro-endothelin which is then cleaved into a 21 amino acid vasoconstrictor
peptide (Rajput, et al., 2006). This gene is located on chromosome 6p24-23, spans for 7 kb and
consists of 5 exons (Rajput, et al., 2006). Two polymorphisms have been associated with varying
levels of serum ET-1: rs5370 (in exon 5) and rs1800997 (a deletion in the 5’UTR); in both cases, the
wild type alleles appear to be associated with lower levels of serum ET-1 (Rajput, et al., 2006), which
is possibly a protective feature.
III. SYSTEMIC INFLAMMATION
Tumor necrosis factor – alpha gene: TNF-α
TNF-α is a potent cytokine, produced mainly by macrophages and T cells, with a wide range of
pro-inflammatory activities, including stimulation of inflammation, leukocyte chemotaxis and
recruitment, and endothelial cell and leukocyte activation and adhesion (Cajado, et al., 2011). Patients
with SCD have high levels of circulating TNF-α and TNF-α mRNA in steady state, consistent with the
previously mentioned pro-inflammatory state of these individuals (Cajado, et al., 2011).
TNF-α is located on chromosome 6p21.3, in a highly polymorphic region (Hajeer & Hutchinson,
2000 ). The SNP rs1800629, in the promoter, is associated with varying levels of TNF-α, with the
variant allele (A; wild type, G) causing an increase in transcription (Cajado, et al., 2011). However,
different studies present controversial meaning to such variation. Both GG and AA genotypes have
been associated with protection or higher incidence of overt stroke (Belisário, et al., 2015; Hoppe, et
al., 2007).
Heme oxygenase – 1 gene: HMOX-1
Heme oxygenase – 1 (HO-1) is the rate limiting enzyme responsible for the catabolism of heme,
which results in biliverdin-IXa, iron and CO (Durante, 2003; Shibahara, 2003). All these products
have potential antioxidant or anti-inflammatory properties, and CO, like NO, can inhibit smooth
muscle cell proliferation and platelet aggregation, as well as modulate vascular tone (Durante, 2003).
The expression levels of HO-1 have been associated with modulation of vascular inflammation (Bean,
et al., 2012).
HMOX-1 gene, coding for inducible HO-1, is located on chromosome 22q12 (Kimpara, et al.,
1997) and two promoter variants appear to modulate its expression: rs2071746 (alleles G and A) and
rs3074372, a highly polymorphic (GT)n microssatelite (reviewed in Shibahara, 2003).
*
Individually, these genetic modulators may have less significant effects but, as a group, or when
occurring in specific combinations with one another (epistasis) or with the environment, their
contribution to morbidity and mortality may increase significantly (Steinberg, 2009).
CHAPTER I ~ INTRODUCTION
OBJECTIVES
25
OBJECTIVES
Given the relatively high incidence of overt stroke in pediatric SCD patients (about 11% before the
age of 20 years) the assessment of personalized early predictors of the risk of stroke is imperative in
order to allow an early implementation of preventive therapies.
Some studies have suggested a relevant contribution of genetic factors for the increased risk of
stroke in SCD patients. Thus, in the present project, the main objective was to search for associations
between putative genetic modifiers of vascular tonus, vascular cell adhesion and inflammation, and the
risk for cerebral infarcts, particularly overt stroke, in the context of SCD in pediatric patients.
This required several stages:
1. To create a database, containing all relevant demographic, clinical, hematological, biochemical
and imaging information retrospectively collected, from hospital records of SCD children
attending four hospitals in Great Lisboa:
a. Age, sex, geographic origin
b. Steady-state data concerning hemolytic and inflammatory parameters (level of
different hemoglobins, LDH, total bilirubin and platelet, reticulocyte and leukocyte
counts)
c. Presence of known phenotypic stroke risk factors, such as high TCD velocities, SCI on
MRI, and previous occurrence of overt stroke.
d. Therapeutic regime
2. To identify sickle cell disease genotype (HBB)
3. To genotype candidate genes and assess relevant genetic variants:
a. -α3.7kb
deletion
b. Genetic modulators of fetal hemoglobin level (βS-cluster
haplotype - rs7482144,
rs2070972, and rs968857; BCL11A - rs11886868)
c. Polymorphisms (SNP, indel, STR) on VCAM1 (rs3917024, rs3783598, rs1041163,
rs3783613), CD36 (rs1984112), THBS-1 (rs2292305), NOS3 (rs2070744, rs1799983,
27-bp VNTR), ET-1 (rs5370, rs1800997), TNF-α (rs1800629) and HMOX1
(rs2071746, rs3074372).
4. To perform association studies between the mentioned genetic variants and the clinical,
hematological and biochemical data of patients.
5. Ultimately, to attempt to delineate a profile of genetic biomarkers able to predict the risk level of
overt stroke occurrence in SCD pediatric patients.

26

27
CHAPTER II
METHODS
AND MATERIALS

CHAPTER II ~ METHODS AND MATERIALS
28
CHAPTER II ~ METHODS AND MATERIALS
29
II. METHODS AND MATERIALS
II.1. Sample
II.1.1. Population sample
The present study was drawn from 66 children with sickle cell disease, 65 homozygous for the
sickle cell anemia mutation (βSβ
S) and one compound heterozygote with β
0-thalassemia (β
Sβ
0-thal).
The SCD genotype for each child was confirmed in our laboratory (see below). Children were
attending at four hospitals in and around Lisboa: Hospital de Dona Estefânia (HDE; n=25), Hospital
de Santa Maria (HSM; n=23), Hospital Fernando Fonseca (HFF; n=17) and Hospital Garcia de Orta
(HGO; n=1).All children were descendent of African families, from several different geographical
regions: Angola, Cape Verde, Guinea-Bissau, São Tomé e Príncipe and Nigeria.
The sample was composed of 29 females (43.9%) and 37 males (56.1%), and was divided into
three groups, according to different inclusion criteria: Stroke group included 13 children with history
of at least one episode of overt stroke, between ages 5 and 13; Risk group included children with high
TCD velocities, either “conditional” (170 – 199 cm/s) or “high risk” (>200 cm/s), and children with
silent infarcts or cerebral vasculopathy on MRI. No severity levels were established in the Risk group,
even though some individuals possessed both risk factors. Finally, Control group included 24 children
with SCD and without previous history of stroke, “normal” TCD velocities and no abnormalities on
MRI. Clinical data, including hematologic and analytic values, and TCD or MRI reports, were
obtained from patients’ medical records. These data were collected from steady-state periods and the
averages of values were considered for study purposes.
Written informed consent was obtained by clinicians from the children’s legal representatives and
blood samples were anonymized prior to being sent to Instituto Nacional de Saúde (INSA).
II.1.2 Biological samples
Peripheral blood samples (3 mL) were collected in EDTA, in the respective hospitals, and sent to
INSA. Genomic DNA was then automatically extracted using MagNA Pure nucleic acid extractor
(Roche®) and stored at 4ºC (Sanyo Medicool Refrigerator).
II.2. Methods
The molecular identification of sickle cell mutation and the β-globin cluster SNPs characterization
were both performed by polymerase chain reaction (PCR) followed by restriction fragment length
polymorphism (RFLP).
Genetic variants to be studied in this project were selected based on results obtained from previous
work on sickle cell anemia performed in our lab (Coelho, et al., 2014), or were selected from literature
revision, using online databases such as NCBI (http://www.ncbi.nlm.nih.gov/pubmed) and Ensemble
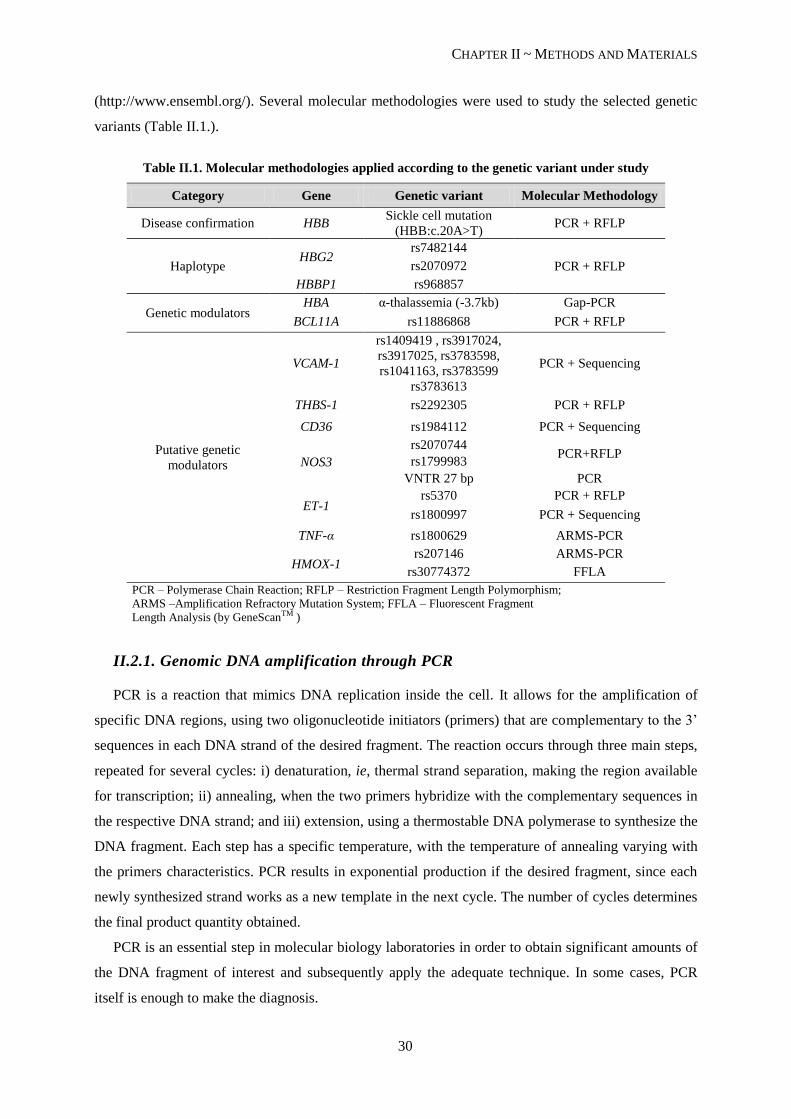
CHAPTER II ~ METHODS AND MATERIALS
30
(http://www.ensembl.org/). Several molecular methodologies were used to study the selected genetic
variants (Table II.1.).
Table II.1. Molecular methodologies applied according to the genetic variant under study
Category Gene Genetic variant Molecular Methodology
Disease confirmation HBB Sickle cell mutation
(HBB:c.20A>T) PCR + RFLP
Haplotype HBG2
rs7482144
PCR + RFLP rs2070972
HBBP1 rs968857
Genetic modulators HBA α-thalassemia (-3.7kb) Gap-PCR
BCL11A rs11886868 PCR + RFLP
Putative genetic
modulators
VCAM-1
rs1409419 , rs3917024,
rs3917025, rs3783598,
rs1041163, rs3783599 PCR + Sequencing
rs3783613
THBS-1 rs2292305 PCR + RFLP
CD36 rs1984112 PCR + Sequencing
NOS3
rs2070744 PCR+RFLP
rs1799983
VNTR 27 bp PCR
ET-1 rs5370 PCR + RFLP
rs1800997 PCR + Sequencing
TNF-α rs1800629 ARMS-PCR
HMOX-1 rs207146 ARMS-PCR
rs30774372 FFLA
PCR – Polymerase Chain Reaction; RFLP – Restriction Fragment Length Polymorphism;
ARMS –Amplification Refractory Mutation System; FFLA – Fluorescent Fragment
Length Analysis (by GeneScanTM )
II.2.1. Genomic DNA amplification through PCR
PCR is a reaction that mimics DNA replication inside the cell. It allows for the amplification of
specific DNA regions, using two oligonucleotide initiators (primers) that are complementary to the 3’
sequences in each DNA strand of the desired fragment. The reaction occurs through three main steps,
repeated for several cycles: i) denaturation, ie, thermal strand separation, making the region available
for transcription; ii) annealing, when the two primers hybridize with the complementary sequences in
the respective DNA strand; and iii) extension, using a thermostable DNA polymerase to synthesize the
DNA fragment. Each step has a specific temperature, with the temperature of annealing varying with
the primers characteristics. PCR results in exponential production if the desired fragment, since each
newly synthesized strand works as a new template in the next cycle. The number of cycles determines
the final product quantity obtained.
PCR is an essential step in molecular biology laboratories in order to obtain significant amounts of
the DNA fragment of interest and subsequently apply the adequate technique. In some cases, PCR
itself is enough to make the diagnosis.
CHAPTER II ~ METHODS AND MATERIALS
31
Some PCR variants, such as Gap-PCR and Amplification Refractory Mutation System (ARMS)-
PCR, both preformed throughout this study, also allow for direct molecular diagnosis. Gap-PCR is
used to detect large known deletions, by using primers flanking the deletion breakpoints. Gap-PCR
was used to diagnose α-thalassemia (see details in Supplementary Material, Table S4). ARMS-PCR
allows for direct detection of known SNPs, as it uses allele-specific primers, ie, primers that contain
either the complementary wild-type nucleotide or the variant one in their 3’ end. Under stringent
conditions annealing will occur only in the absence of mismatches.
For every genetic variation under study, genomic DNA was adequately amplified in a
Thermocycler instrument (T1 or T Gradient; Biometra®) using specific primers and PCR conditions
detailed in Supplementary Material, Tables S3 to S6.
PCR control was performed by electrophoretic migration of the obtained PCR products in agarose
gels containing ethidium bromide (EtBr). Standard electrophoresis was carried out at 70 V for 35 min
(BIORAD PowerPac300 or PowerPac Basic), with agarose (Seakem® LE Agarose, Lonza) gels of 1%
(w/v), in TBE 1x, with 6% (v/v) of EtBr (10 mg/mL, Sigma®). Whenever necessary, conditions were
adapted. Gel revelation was performed in a UV chamber (EagleEyeTM
II, Statagene®).
II.2.2. Restriction fragment length polymorphism
Restriction enzymes recognize specific, palindromic sequences of ~ 6 nucleotides in each strand of
the DNA molecule and cleave them in a defined manner. A restriction assay allows for the detection of
SNPs as, under optimal reaction conditions, the enzyme will hydrolyze only the DNA molecules that
contain the nucleotide sequence required for recognition. The presence of a SNP will either create or
delete a restriction site; therefore, prior knowledge of the sequence and the genetic modification is
required.
The general protocol for enzymatic restriction assays preformed in this study used 5 U of enzyme
for cleavage of 15 µL of PCR product, at optimal enzyme temperature for a minimum of 3h of
incubation (eppendorf Thermomixer® Compact or Thermomixer® Comfort). Detailed conditions for
each SNP are described in Supplementary Material, Table S7.
Enzymatic restriction control was performed by electrophoretic migration of the obtained
hydrolyzed products in agarose gels. Standard electrophoresis was carried out at 70 V for 60 min, with
agarose (Seakem LE Agarose, Lonza) gels of 2% (w/v), in TBE 1x with 6% (v/v) of EtBr (10mg/mL,
Sigma®). Whenever necessary, conditions were adapted. Gel revelation was performed in a UV
chamber (EagleEyeTM
II, Statagene®).
II.2.3. Automated Sanger Sequencing
Sanger Sequencing allows for the determination of the nucleotide sequence of a DNA fragment,
using one single DNA strand for template. Each daughter strand is terminated when it incorporates a
dideoxyribonucleotide (ddNTP), a modified, fluorescent deoxyribonucleotide (dNTP). For each
CHAPTER II ~ METHODS AND MATERIALS
32
ddNTP (ddATP, ddTTP, ddCTP, ddGTP), a different fluorescent dye is used. Obtained strand sizes
vary from one another in one single nucleotide.
The automated sequencing reaction was performed using the commercial kit BigDye® Terminator
V 1.1. Cycle Kit (Applied Biossystems), according to the manufacturer’s instructions, using a
Biometra® Thermocyler .
Fluorescent signals and strand sizes were then discriminated through capillary electrophoresis in
the automated sequencer 3130XI Genetic Analyser, AbiPrism (Applied Biossystems), and results were
analyzed using FinchTV v1.4.0. software (Geospiza, Inc).
II.2.4. Fluorescent Fragment Length Analysis
Microsatellite detection was performed using the ABI Prism GeneScan™ software for fluorescent
fragment length analysis in the automated sequencer 3130XI Genetic Analyser, AbiPrism (Applied
Biossystems). This technique requires fluorescent-labeled primers added to the PCR mixture to obtain
fluorescent PCR products. These products are then separated through capillary electrophoresis and the
peak position allows for microsatellite size determination.
SNP rs3074372 in HMOX-1 has a (GT)n microssatelite, ranging from 21 to 40 repetitions (n). PCR
was preformed, as described in Supplementary Material, Table S6, using FAM-labeled forward
primers (ThermoScientific).
II.2.5. Haplotype reconstruction
Haplotype reconstruction was performed using PHASE software v2.1. developed by Professor
Mathew Stephens at Washington University and according to the developer’s instructions
(https://els.comotion.uw.edu/express_license_technologies/phase). Haplotypes were reconstructed for
genetic variants in NOS3 (rs2070744, 27-bp VNTR, rs1799983) and in the promoter of VCAM1
(rs1409419, rs3917024, rs3917025, rs3783598, rs1041163, rs3783599).
II.2.6. Statistical Analysis
A database was constructed using all the useful information from patients files, including the event
of stroke, the result of MRI and TCD scans, and hematological (total hemoglobin, reticulocyte count,
leukocyte count, platelet count) and biochemical (LDH, total bilirubin) information. All genetic
variants analyzed throughout the study were also included.
Statistical analysis was performed using R software (http://www.R-project.org.) after proper data
preparation in Excel spreadsheets. Allele counts were performed in the overall population (n=66) and
the Hardy-Weinberg Equilibrium (HWE) was manually calculated for each genetic variant. For all of
those who were in HWE, allele and genotype frequency differences were assessed between the three
groups under study – Stroke (S), Risk (R) or Control (C). Groups were confronted two at a time [S x
C, R x C, S x R and (S + R) x C], using 2x2 contingency tables for the presence or absence of the
CHAPTER II ~ METHODS AND MATERIALS
33
genetic variant. Genotypes were also studied under three inheritance modes: dominant (AA), recessive
(aa) and overdominant (Aa). For each inheritance mode and each two groups a new 2x2 contingency
table was created. Hypothesis tests were formulated, considering the null hypothesis H0 as the absence
of significant differences between the frequencies of alleles/genotypes in the two groups. Fisher’s
exact test was carried out using R, with 5% significance to reject the null hypothesis. For all cases
yielding p-values < 0.05, the Odds Ratio obtained using the same R function was considered. An
association between the genetic variation and the group was proposed when the 95% confidence
interval obtained for the Odds Ratio did not include 1, that is, direct association if 1 > CI95% > inf, or
inverse association if 0 < CI95% < 1. Finally, the p-values obtained were corrected using the False
Discovery Rate method in R, for each genetic variation independently, but including all groups and
inheritance modes (standard n = 16). Results were considered significant when the corrected p-values
were below 0.10 (90% significance).
The three groups were then confronted for differences in the distributions of hematological (Total
hemoglobin, erythrocyte count, leukocyte count, platelet count and reticulocyte count) and
biochemical parameters (lactate dehydrogenase and total bilirubin). For each parameter under analysis,
a set of boxplots was created for lateral comparison between groups. Then a test hypothesis was
formulated considering H0 the absence of difference between the means of each parameter in each
group. Wilcox-Mann-Whitney tests were carried out in R, and p-values < 0.05 were considered
significant to reject the null hypothesis, with 95% significance.

CHAPTER II ~ METHODS AND MATERIALS
34
35
CHAPTER III
RESULTS
AND DISCUSSION

CHAPTER III ~ RESULTS AND DISCUSSION
Part 1: Genetic Characterization
36
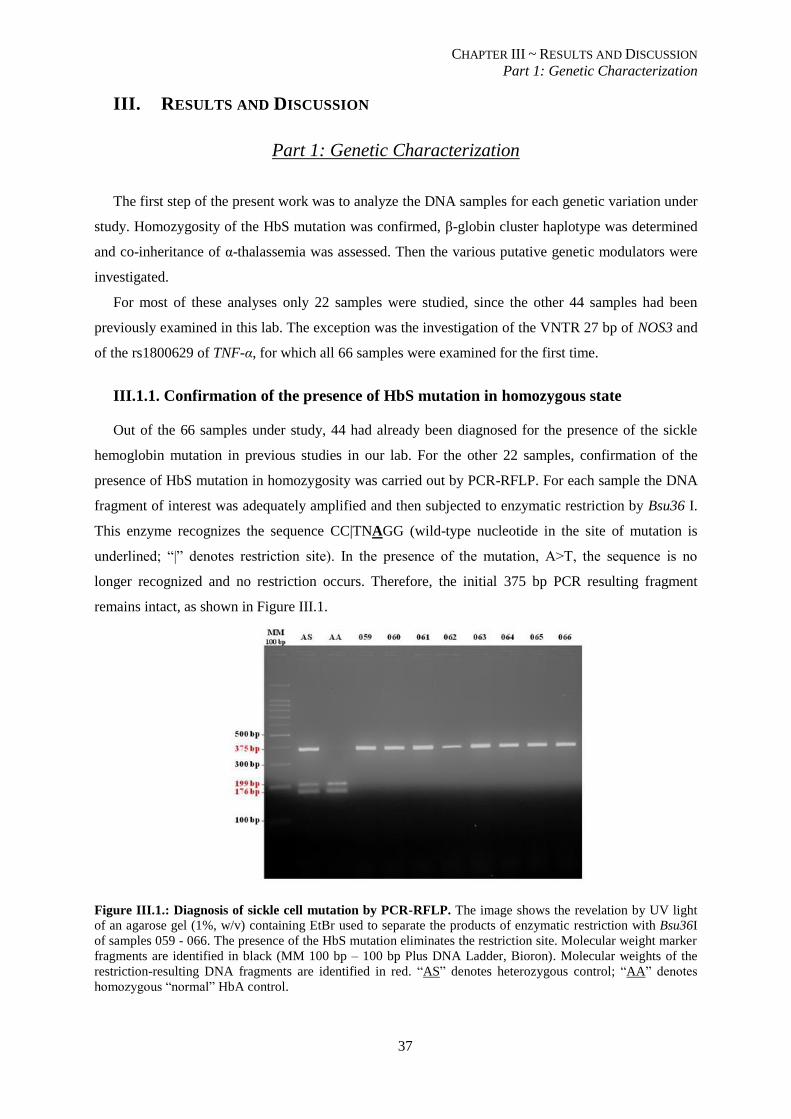
CHAPTER III ~ RESULTS AND DISCUSSION
Part 1: Genetic Characterization
37
III. RESULTS AND DISCUSSION
Part 1: Genetic Characterization
The first step of the present work was to analyze the DNA samples for each genetic variation under
study. Homozygosity of the HbS mutation was confirmed, β-globin cluster haplotype was determined
and co-inheritance of α-thalassemia was assessed. Then the various putative genetic modulators were
investigated.
For most of these analyses only 22 samples were studied, since the other 44 samples had been
previously examined in this lab. The exception was the investigation of the VNTR 27 bp of NOS3 and
of the rs1800629 of TNF-α, for which all 66 samples were examined for the first time.
III.1.1. Confirmation of the presence of HbS mutation in homozygous state
Out of the 66 samples under study, 44 had already been diagnosed for the presence of the sickle
hemoglobin mutation in previous studies in our lab. For the other 22 samples, confirmation of the
presence of HbS mutation in homozygosity was carried out by PCR-RFLP. For each sample the DNA
fragment of interest was adequately amplified and then subjected to enzymatic restriction by Bsu36 I.
This enzyme recognizes the sequence CC|TNAGG (wild-type nucleotide in the site of mutation is
underlined; “|” denotes restriction site). In the presence of the mutation, A>T, the sequence is no
longer recognized and no restriction occurs. Therefore, the initial 375 bp PCR resulting fragment
remains intact, as shown in Figure III.1.
Figure III.1.: Diagnosis of sickle cell mutation by PCR-RFLP. The image shows the revelation by UV light
of an agarose gel (1%, w/v) containing EtBr used to separate the products of enzymatic restriction with Bsu36I
of samples 059 - 066. The presence of the HbS mutation eliminates the restriction site. Molecular weight marker
fragments are identified in black (MM 100 bp – 100 bp Plus DNA Ladder, Bioron). Molecular weights of the
restriction-resulting DNA fragments are identified in red. “AS” denotes heterozygous control; “AA” denotes
homozygous “normal” HbA control.
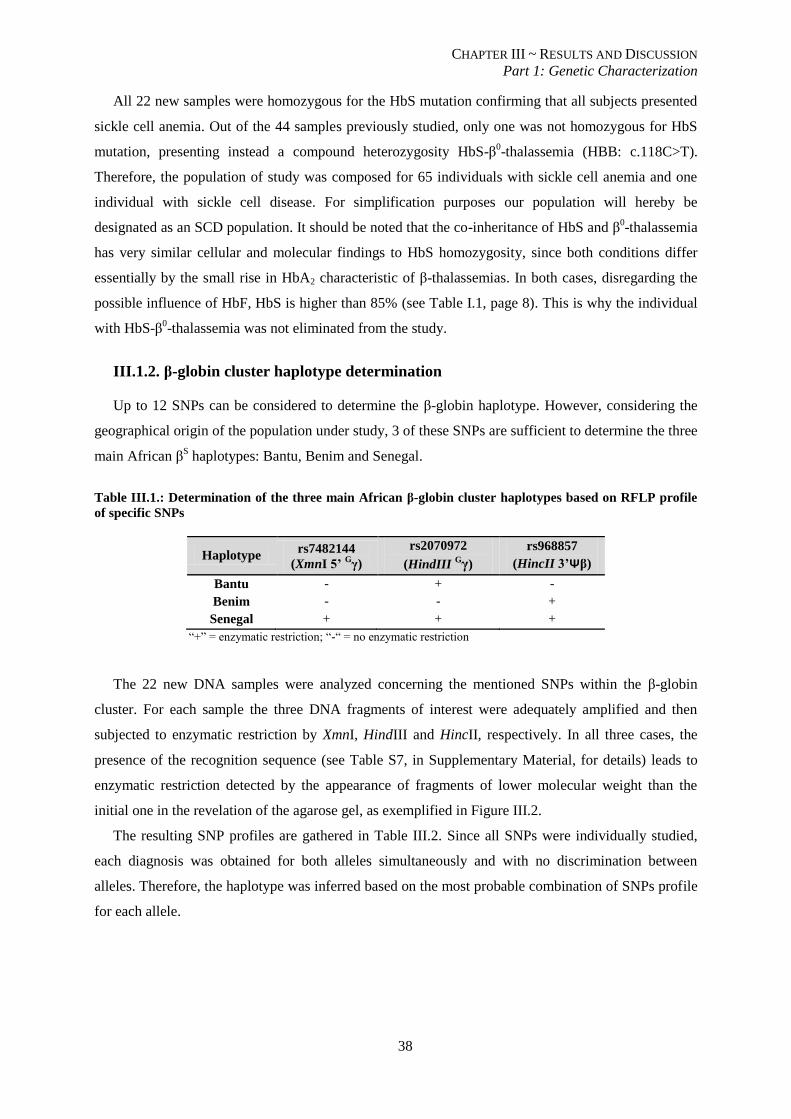
CHAPTER III ~ RESULTS AND DISCUSSION
Part 1: Genetic Characterization
38
All 22 new samples were homozygous for the HbS mutation confirming that all subjects presented
sickle cell anemia. Out of the 44 samples previously studied, only one was not homozygous for HbS
mutation, presenting instead a compound heterozygosity HbS-β0-thalassemia (HBB: c.118C>T).
Therefore, the population of study was composed for 65 individuals with sickle cell anemia and one
individual with sickle cell disease. For simplification purposes our population will hereby be
designated as an SCD population. It should be noted that the co-inheritance of HbS and β0-thalassemia
has very similar cellular and molecular findings to HbS homozygosity, since both conditions differ
essentially by the small rise in HbA2 characteristic of β-thalassemias. In both cases, disregarding the
possible influence of HbF, HbS is higher than 85% (see Table I.1, page 8). This is why the individual
with HbS-β0-thalassemia was not eliminated from the study.
III.1.2. β-globin cluster haplotype determination
Up to 12 SNPs can be considered to determine the β-globin haplotype. However, considering the
geographical origin of the population under study, 3 of these SNPs are sufficient to determine the three
main African βS haplotypes: Bantu, Benim and Senegal.
Table III.1.: Determination of the three main African β-globin cluster haplotypes based on RFLP profile
of specific SNPs
Haplotype rs7482144
(XmnI 5’ Gγ)
rs2070972
(HindIII Gγ)
rs968857
(HincII 3’Ψβ)
Bantu - + -
Benim - - +
Senegal + + +
“+” = enzymatic restriction; “-“ = no enzymatic restriction
The 22 new DNA samples were analyzed concerning the mentioned SNPs within the β-globin
cluster. For each sample the three DNA fragments of interest were adequately amplified and then
subjected to enzymatic restriction by XmnI, HindIII and HincII, respectively. In all three cases, the
presence of the recognition sequence (see Table S7, in Supplementary Material, for details) leads to
enzymatic restriction detected by the appearance of fragments of lower molecular weight than the
initial one in the revelation of the agarose gel, as exemplified in Figure III.2.
The resulting SNP profiles are gathered in Table III.2. Since all SNPs were individually studied,
each diagnosis was obtained for both alleles simultaneously and with no discrimination between
alleles. Therefore, the haplotype was inferred based on the most probable combination of SNPs profile
for each allele.
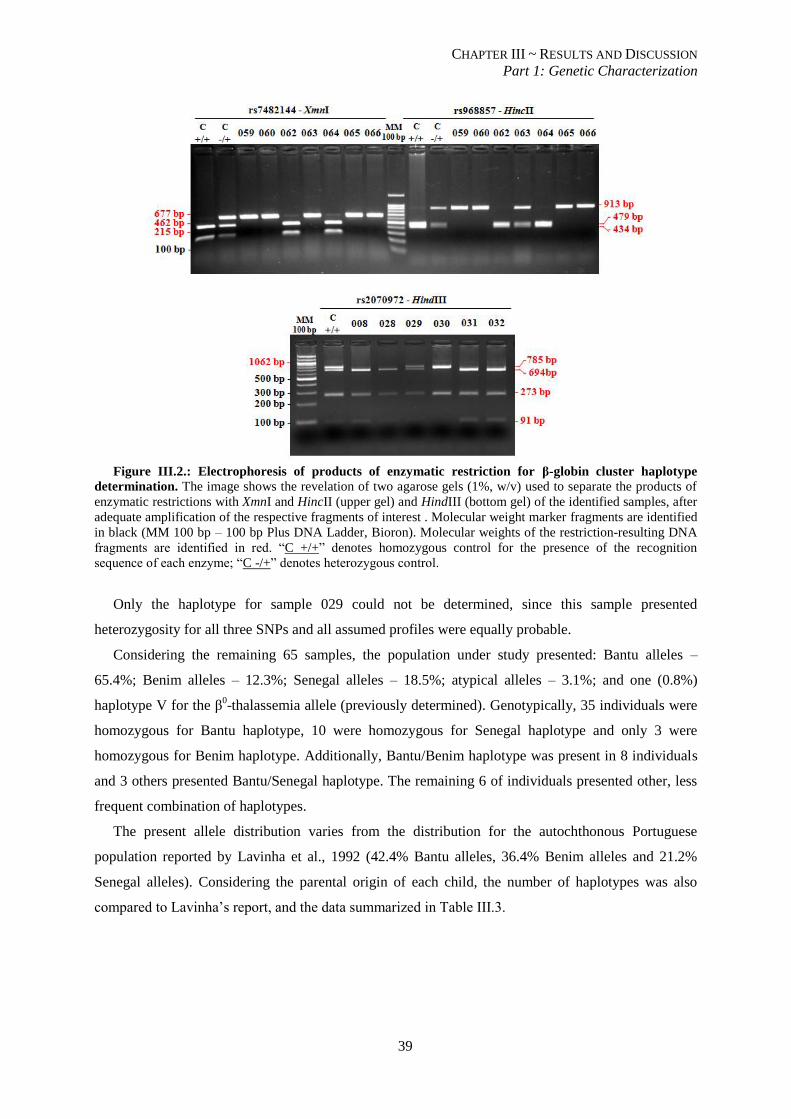
CHAPTER III ~ RESULTS AND DISCUSSION
Part 1: Genetic Characterization
39
Figure III.2.: Electrophoresis of products of enzymatic restriction for β-globin cluster haplotype
determination. The image shows the revelation of two agarose gels (1%, w/v) used to separate the products of
enzymatic restrictions with XmnI and HincII (upper gel) and HindIII (bottom gel) of the identified samples, after
adequate amplification of the respective fragments of interest . Molecular weight marker fragments are identified
in black (MM 100 bp – 100 bp Plus DNA Ladder, Bioron). Molecular weights of the restriction-resulting DNA
fragments are identified in red. “C +/+” denotes homozygous control for the presence of the recognition
sequence of each enzyme; “C -/+” denotes heterozygous control.
Only the haplotype for sample 029 could not be determined, since this sample presented
heterozygosity for all three SNPs and all assumed profiles were equally probable.
Considering the remaining 65 samples, the population under study presented: Bantu alleles –
65.4%; Benim alleles – 12.3%; Senegal alleles – 18.5%; atypical alleles – 3.1%; and one (0.8%)
haplotype V for the β0-thalassemia allele (previously determined). Genotypically, 35 individuals were
homozygous for Bantu haplotype, 10 were homozygous for Senegal haplotype and only 3 were
homozygous for Benim haplotype. Additionally, Bantu/Benim haplotype was present in 8 individuals
and 3 others presented Bantu/Senegal haplotype. The remaining 6 of individuals presented other, less
frequent combination of haplotypes.
The present allele distribution varies from the distribution for the autochthonous Portuguese
population reported by Lavinha et al., 1992 (42.4% Bantu alleles, 36.4% Benim alleles and 21.2%
Senegal alleles). Considering the parental origin of each child, the number of haplotypes was also
compared to Lavinha’s report, and the data summarized in Table III.3.
CHAPTER III ~ RESULTS AND DISCUSSION
Part 1: Genetic Characterization
40
Table III.2.: SNP profile used for β-globin cluster haplotype reconstruction of the 22 new samples. For
each SNP, both alleles were considered: “-/-“ denotes homozygosity for the allele without the recognition
sequence; “+/+” denotes homozygosity for the allele with the recognition sequence; “-/+” indicates the presence
of both alleles
Sample rs7482144 rs2070972 rs968857 Haplotype
008 -/- +/+ -/- Bantu/Bantu
027 -/- -/+ -/+ Bantu/Benim
028 -/- +/+ -/- Bantu/Bantu
029 -/+ -/+ -/+ ND
030 -/- -/- +/+ Benim/Benim
031 -/- +/+ -/- Bantu/Bantu
032 -/- +/+ -/- Bantu/Bantu
033 -/- +/+ -/- Bantu/Bantu
046 -/- +/+ -/- Bantu/Bantu
047 -/- +/+ -/- Bantu/Bantu
055 -/- +/+ -/- Bantu/Bantu
056 -/- +/+ -/- Bantu/Bantu
057 -/+ +/+ -/+ Senegal/Bantu
058 -/- +/+ -/- Bantu/Bantu
059 -/- +/+ -/- Bantu/Bantu
060 -/- +/+ -/- Bantu/Bantu
061 -/- -/+ -/+ Bantu/Benim
062 +/+ +/+ +/+ Senegal/Senegal
063 -/- -/+ -/+ Bantu/Benim
064 +/+ +/+ +/+ Senegal/Senegal
065 -/- +/+ -/- Bantu/Bantu
066 -/- +/+ -/- Bantu/Bantu
ND – not determined
Table III.3.: Comparison between haplotype distributions obtained in the current study and reported by
Lavinha et al., 1992. Only the 3 main geographical origins and the 3 major haplotypes were taken into account
for this comparison. Atypical haplotypes were not considered for presentation. The number of alleles per
geographical origin is presented in the last column of the table for both studies
Senegal Benim Bantu Allele number
Current
study
Lavinha et
al. 1992
Current
study
Lavinha et
al. 1992
Current
study
Lavinha et
al. 1992
Current
study
Lavinha et
al. 1992
Cape
Verde 66.7% 81.8% - 18.2% 16.7% - 12 11
Guinea-
Bissau 93.8% 50.0% 12.5% 25.0% - - 16 4
S.
Tomé - - 52.9% 26.7% 41.2% 73.3% 17 15
Angola 1.2% - 4.9% 4.5% 92.7% 95.5% 82 44
Haplotype distribution was different among studies, with the closest similarity found in Angola
haplotypes. Curiously this similarity occurs even though in the present study the number of alleles
with Angola origin was almost double the number of such alleles in Lavinha’s study. The number of
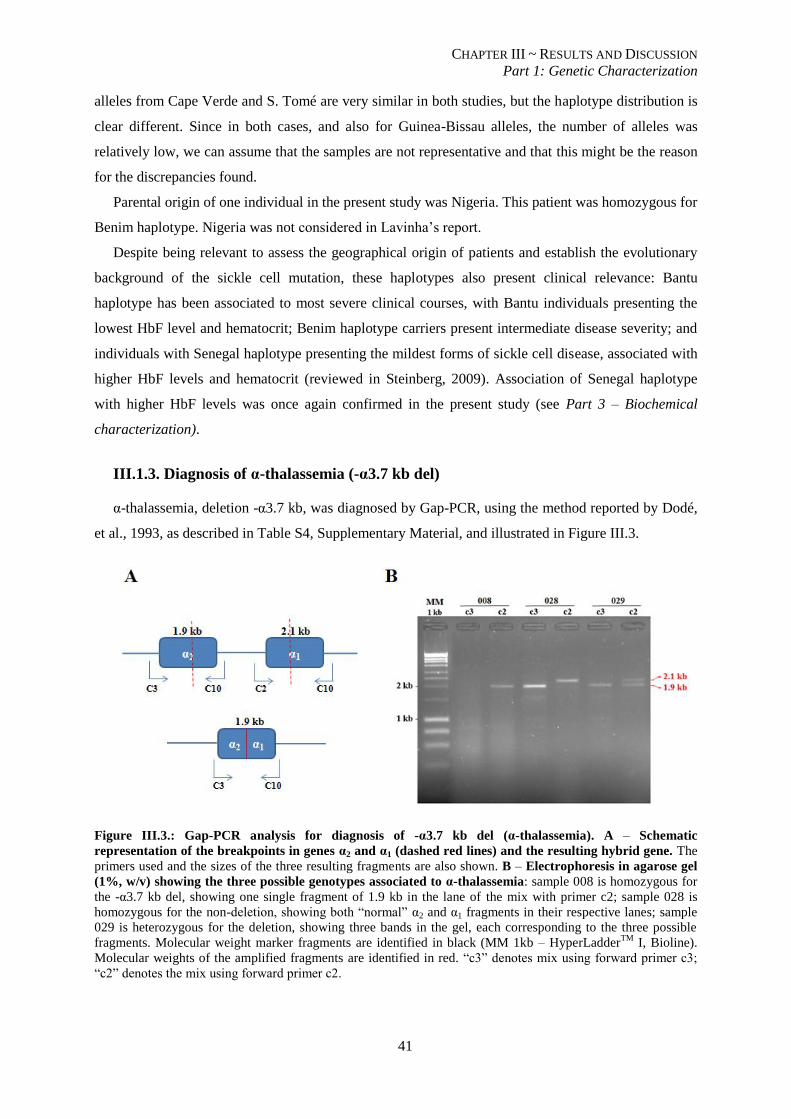
CHAPTER III ~ RESULTS AND DISCUSSION
Part 1: Genetic Characterization
41
alleles from Cape Verde and S. Tomé are very similar in both studies, but the haplotype distribution is
clear different. Since in both cases, and also for Guinea-Bissau alleles, the number of alleles was
relatively low, we can assume that the samples are not representative and that this might be the reason
for the discrepancies found.
Parental origin of one individual in the present study was Nigeria. This patient was homozygous for
Benim haplotype. Nigeria was not considered in Lavinha’s report.
Despite being relevant to assess the geographical origin of patients and establish the evolutionary
background of the sickle cell mutation, these haplotypes also present clinical relevance: Bantu
haplotype has been associated to most severe clinical courses, with Bantu individuals presenting the
lowest HbF level and hematocrit; Benim haplotype carriers present intermediate disease severity; and
individuals with Senegal haplotype presenting the mildest forms of sickle cell disease, associated with
higher HbF levels and hematocrit (reviewed in Steinberg, 2009). Association of Senegal haplotype
with higher HbF levels was once again confirmed in the present study (see Part 3 – Biochemical
characterization).
III.1.3. Diagnosis of α-thalassemia (-α3.7 kb del)
α-thalassemia, deletion -α3.7 kb, was diagnosed by Gap-PCR, using the method reported by Dodé,
et al., 1993, as described in Table S4, Supplementary Material, and illustrated in Figure III.3.
Figure III.3.: Gap-PCR analysis for diagnosis of -α3.7 kb del (α-thalassemia). A – Schematic
representation of the breakpoints in genes α2 and α1 (dashed red lines) and the resulting hybrid gene. The
primers used and the sizes of the three resulting fragments are also shown. B – Electrophoresis in agarose gel
(1%, w/v) showing the three possible genotypes associated to α-thalassemia: sample 008 is homozygous for
the -α3.7 kb del, showing one single fragment of 1.9 kb in the lane of the mix with primer c2; sample 028 is
homozygous for the non-deletion, showing both “normal” α2 and α1 fragments in their respective lanes; sample
029 is heterozygous for the deletion, showing three bands in the gel, each corresponding to the three possible
fragments. Molecular weight marker fragments are identified in black (MM 1kb – HyperLadderTM
I, Bioline).
Molecular weights of the amplified fragments are identified in red. “c3” denotes mix using forward primer c3;
“c2” denotes the mix using forward primer c2.
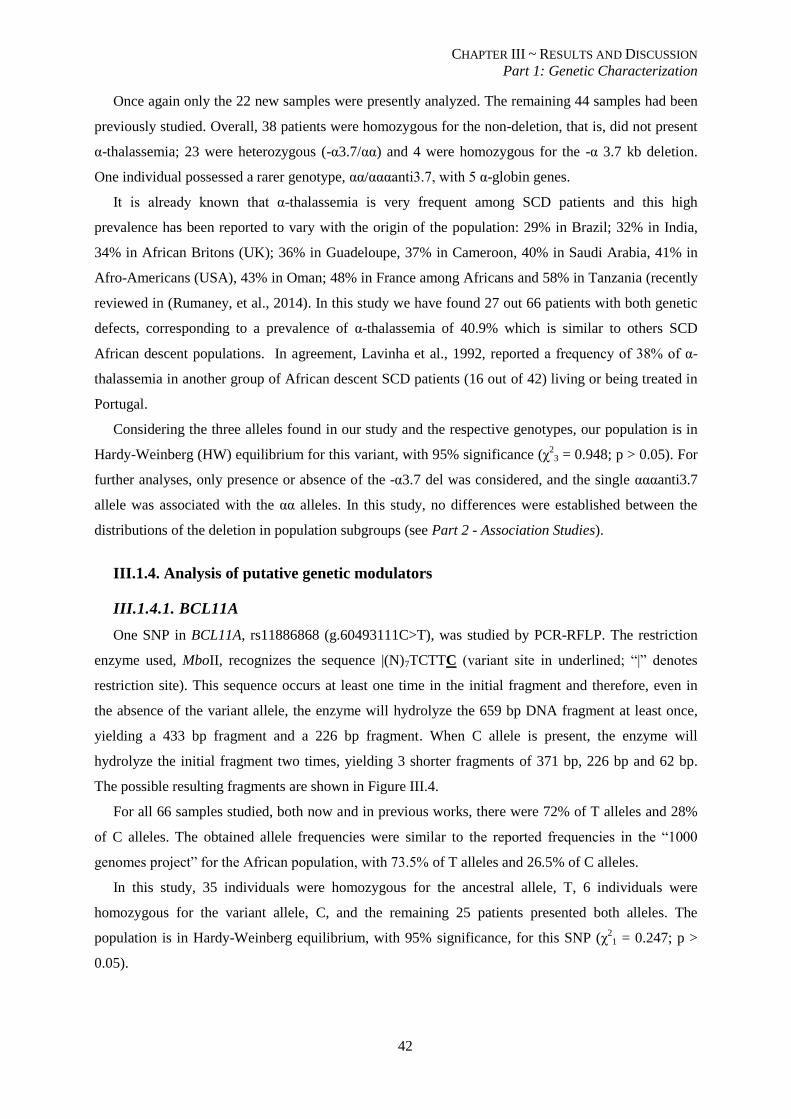
CHAPTER III ~ RESULTS AND DISCUSSION
Part 1: Genetic Characterization
42
Once again only the 22 new samples were presently analyzed. The remaining 44 samples had been
previously studied. Overall, 38 patients were homozygous for the non-deletion, that is, did not present
α-thalassemia; 23 were heterozygous (-α3.7/αα) and 4 were homozygous for the -α 3.7 kb deletion.
One individual possessed a rarer genotype, αα/αααanti3.7, with 5 α-globin genes.
It is already known that α-thalassemia is very frequent among SCD patients and this high
prevalence has been reported to vary with the origin of the population: 29% in Brazil; 32% in India,
34% in African Britons (UK); 36% in Guadeloupe, 37% in Cameroon, 40% in Saudi Arabia, 41% in
Afro-Americans (USA), 43% in Oman; 48% in France among Africans and 58% in Tanzania (recently
reviewed in (Rumaney, et al., 2014). In this study we have found 27 out 66 patients with both genetic
defects, corresponding to a prevalence of α-thalassemia of 40.9% which is similar to others SCD
African descent populations. In agreement, Lavinha et al., 1992, reported a frequency of 38% of α-
thalassemia in another group of African descent SCD patients (16 out of 42) living or being treated in
Portugal.
Considering the three alleles found in our study and the respective genotypes, our population is in
Hardy-Weinberg (HW) equilibrium for this variant, with 95% significance (χ2
3 = 0.948; p > 0.05). For
further analyses, only presence or absence of the -α3.7 del was considered, and the single αααanti3.7
allele was associated with the αα alleles. In this study, no differences were established between the
distributions of the deletion in population subgroups (see Part 2 - Association Studies).
III.1.4. Analysis of putative genetic modulators
III.1.4.1. BCL11A
One SNP in BCL11A, rs11886868 (g.60493111C>T), was studied by PCR-RFLP. The restriction
enzyme used, MboII, recognizes the sequence |(N)7TCTTC (variant site in underlined; “|” denotes
restriction site). This sequence occurs at least one time in the initial fragment and therefore, even in
the absence of the variant allele, the enzyme will hydrolyze the 659 bp DNA fragment at least once,
yielding a 433 bp fragment and a 226 bp fragment. When C allele is present, the enzyme will
hydrolyze the initial fragment two times, yielding 3 shorter fragments of 371 bp, 226 bp and 62 bp.
The possible resulting fragments are shown in Figure III.4.
For all 66 samples studied, both now and in previous works, there were 72% of T alleles and 28%
of C alleles. The obtained allele frequencies were similar to the reported frequencies in the “1000
genomes project” for the African population, with 73.5% of T alleles and 26.5% of C alleles.
In this study, 35 individuals were homozygous for the ancestral allele, T, 6 individuals were
homozygous for the variant allele, C, and the remaining 25 patients presented both alleles. The
population is in Hardy-Weinberg equilibrium, with 95% significance, for this SNP (χ21 = 0.247; p >
0.05).
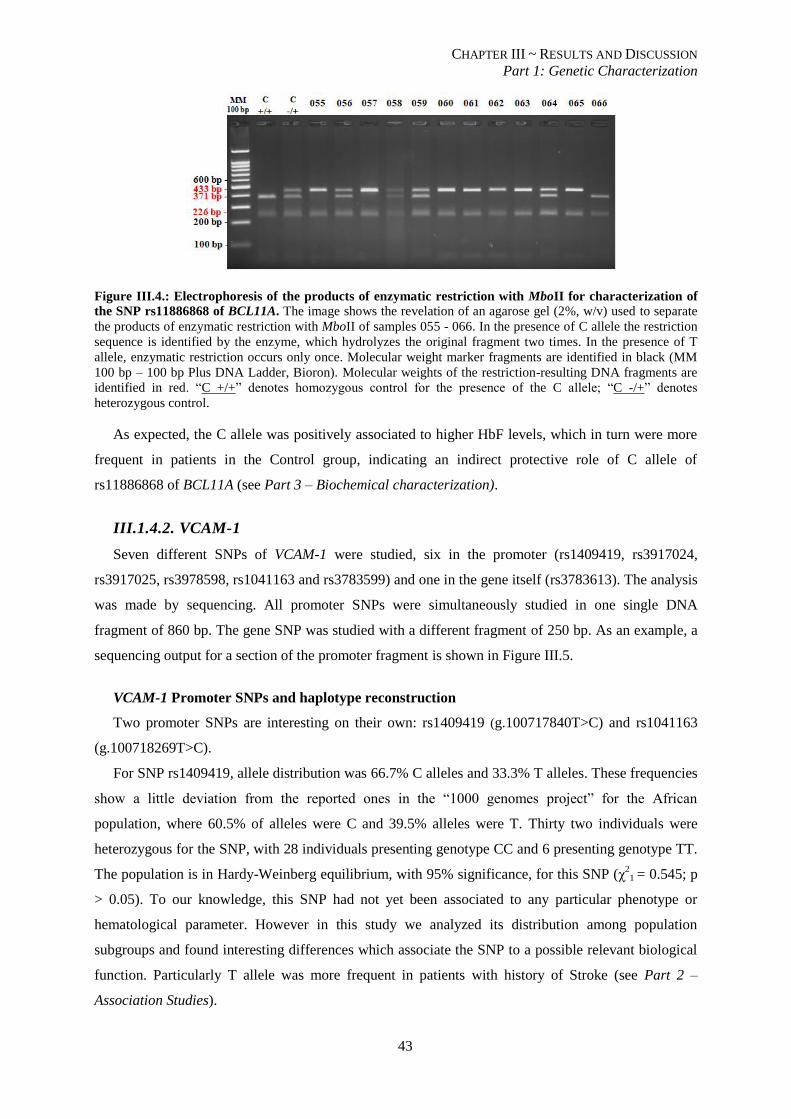
CHAPTER III ~ RESULTS AND DISCUSSION
Part 1: Genetic Characterization
43
Figure III.4.: Electrophoresis of the products of enzymatic restriction with MboII for characterization of
the SNP rs11886868 of BCL11A. The image shows the revelation of an agarose gel (2%, w/v) used to separate
the products of enzymatic restriction with MboII of samples 055 - 066. In the presence of C allele the restriction
sequence is identified by the enzyme, which hydrolyzes the original fragment two times. In the presence of T
allele, enzymatic restriction occurs only once. Molecular weight marker fragments are identified in black (MM
100 bp – 100 bp Plus DNA Ladder, Bioron). Molecular weights of the restriction-resulting DNA fragments are
identified in red. “C +/+” denotes homozygous control for the presence of the C allele; “C -/+” denotes
heterozygous control.
As expected, the C allele was positively associated to higher HbF levels, which in turn were more
frequent in patients in the Control group, indicating an indirect protective role of C allele of
rs11886868 of BCL11A (see Part 3 – Biochemical characterization).
III.1.4.2. VCAM-1
Seven different SNPs of VCAM-1 were studied, six in the promoter (rs1409419, rs3917024,
rs3917025, rs3978598, rs1041163 and rs3783599) and one in the gene itself (rs3783613). The analysis
was made by sequencing. All promoter SNPs were simultaneously studied in one single DNA
fragment of 860 bp. The gene SNP was studied with a different fragment of 250 bp. As an example, a
sequencing output for a section of the promoter fragment is shown in Figure III.5.
VCAM-1 Promoter SNPs and haplotype reconstruction
Two promoter SNPs are interesting on their own: rs1409419 (g.100717840T>C) and rs1041163
(g.100718269T>C).
For SNP rs1409419, allele distribution was 66.7% C alleles and 33.3% T alleles. These frequencies
show a little deviation from the reported ones in the “1000 genomes project” for the African
population, where 60.5% of alleles were C and 39.5% alleles were T. Thirty two individuals were
heterozygous for the SNP, with 28 individuals presenting genotype CC and 6 presenting genotype TT.
The population is in Hardy-Weinberg equilibrium, with 95% significance, for this SNP (χ2
1 = 0.545; p
> 0.05). To our knowledge, this SNP had not yet been associated to any particular phenotype or
hematological parameter. However in this study we analyzed its distribution among population
subgroups and found interesting differences which associate the SNP to a possible relevant biological
function. Particularly T allele was more frequent in patients with history of Stroke (see Part 2 –
Association Studies).
CHAPTER III ~ RESULTS AND DISCUSSION
Part 1: Genetic Characterization
44
Figure III.5.: Automated sequencing output of a fragment of the promoter of VCAM-1. The image shows
three of the six SNPs studied in the promoter of VCAM-1, analyzed simultaneously in one single fragment. Only
two sections of the sequence obtained are presented. Since each SNP is simultaneously studied for both alleles,
whenever one nucleotide (A, T, G, C) is identified, the individual has that nucleotide in homozygosity
(rs1409419). When “N” appears, the nucleotide in each allele is different, and the individual shows
heterozygosity in that genomic location (rs3917024). If a deletion occurs in heterozygosity, there is a shift in the
open reading frame of one of the alleles, leading to mismatched sequences in both alleles (rs3917025 and
forward).
For SNP rs1041163, 75% of the obtained alleles were contained the T nucleotide and the remaining
25% contained the C nucleotide. Once again, this represents a deviation from the reported frequencies
of 81.6% T alleles and 18.4% C alleles. Genotypically, 37 individuals were homozygous for the
ancestral T allele, with only 4 presenting homozygosity for the variant C allele. The remaining 25
individuals were heterozygous for the SNP. The population is in Hardy-Weinberg equilibrium, with
95% significance, for this SNP (χ21 = 0.007; p > 0.05). Despite previous observations of a possible
association with stroke, in the present study this SNP showed no distribution differences among
groups (see Part 2 – Association Studies).
These two SNPs, along with the remaining four SNPs in the promoter of VCAM-1, also in Hardy-
Weinberg Equilibrium (data not shown), were used for haplotype reconstruction using PHASE
software. Seven different haplotypes were generated and are presented, along with the respective
frequency in the population of study, in Table III.4.
The most frequent haplotypes obtained were, in decreasing order, haplotypes #1, #7, #3 and #4.
Interestingly, haplotype #1 does not contain a single genetic variation (minor alleles) which means that
the combination of all ancestral alleles of the analyzed SNPs is the most frequent combination of
alleles in this population. Haplotype #7 contained only the variant T allele of rs1409419, sharing the
frequency of this allele in the population of study. It should therefore be noted that this variant occurs
alone in the present population, ie, this T allele does not occur in combination with any other minor
alleles of this set of SNPs. Haplotype #1 and #7 vary only in the respective alleles of rs1409419 so the
associations found resemble the above mentioned for this SNP.
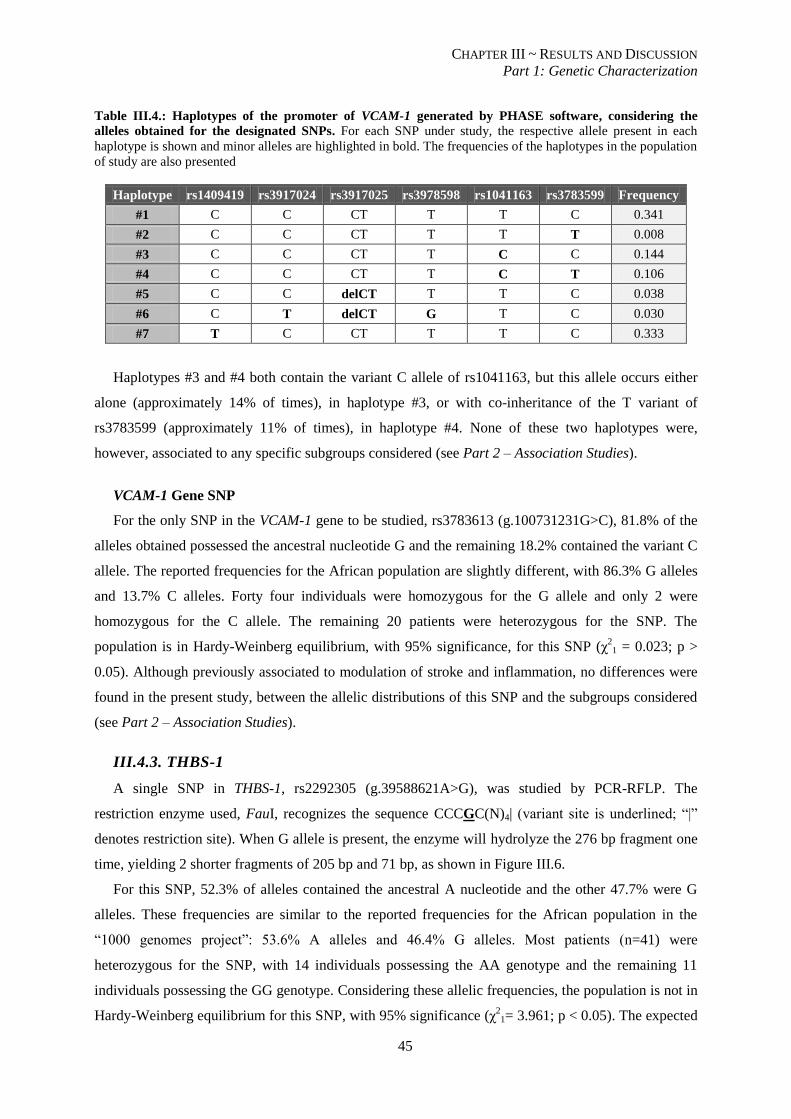
CHAPTER III ~ RESULTS AND DISCUSSION
Part 1: Genetic Characterization
45
Table III.4.: Haplotypes of the promoter of VCAM-1 generated by PHASE software, considering the
alleles obtained for the designated SNPs. For each SNP under study, the respective allele present in each
haplotype is shown and minor alleles are highlighted in bold. The frequencies of the haplotypes in the population
of study are also presented
Haplotype rs1409419 rs3917024 rs3917025 rs3978598 rs1041163 rs3783599 Frequency
#1 C C CT T T C 0.341
#2 C C CT T T T 0.008
#3 C C CT T C C 0.144
#4 C C CT T C T 0.106
#5 C C delCT T T C 0.038
#6 C T delCT G T C 0.030
#7 T C CT T T C 0.333
Haplotypes #3 and #4 both contain the variant C allele of rs1041163, but this allele occurs either
alone (approximately 14% of times), in haplotype #3, or with co-inheritance of the T variant of
rs3783599 (approximately 11% of times), in haplotype #4. None of these two haplotypes were,
however, associated to any specific subgroups considered (see Part 2 – Association Studies).
VCAM-1 Gene SNP
For the only SNP in the VCAM-1 gene to be studied, rs3783613 (g.100731231G>C), 81.8% of the
alleles obtained possessed the ancestral nucleotide G and the remaining 18.2% contained the variant C
allele. The reported frequencies for the African population are slightly different, with 86.3% G alleles
and 13.7% C alleles. Forty four individuals were homozygous for the G allele and only 2 were
homozygous for the C allele. The remaining 20 patients were heterozygous for the SNP. The
population is in Hardy-Weinberg equilibrium, with 95% significance, for this SNP (χ21 = 0.023; p >
0.05). Although previously associated to modulation of stroke and inflammation, no differences were
found in the present study, between the allelic distributions of this SNP and the subgroups considered
(see Part 2 – Association Studies).
III.4.3. THBS-1
A single SNP in THBS-1, rs2292305 (g.39588621A>G), was studied by PCR-RFLP. The
restriction enzyme used, FauI, recognizes the sequence CCCGC(N)4| (variant site is underlined; “|”
denotes restriction site). When G allele is present, the enzyme will hydrolyze the 276 bp fragment one
time, yielding 2 shorter fragments of 205 bp and 71 bp, as shown in Figure III.6.
For this SNP, 52.3% of alleles contained the ancestral A nucleotide and the other 47.7% were G
alleles. These frequencies are similar to the reported frequencies for the African population in the
“1000 genomes project”: 53.6% A alleles and 46.4% G alleles. Most patients (n=41) were
heterozygous for the SNP, with 14 individuals possessing the AA genotype and the remaining 11
individuals possessing the GG genotype. Considering these allelic frequencies, the population is not in
Hardy-Weinberg equilibrium for this SNP, with 95% significance (χ21= 3.961; p < 0.05). The expected
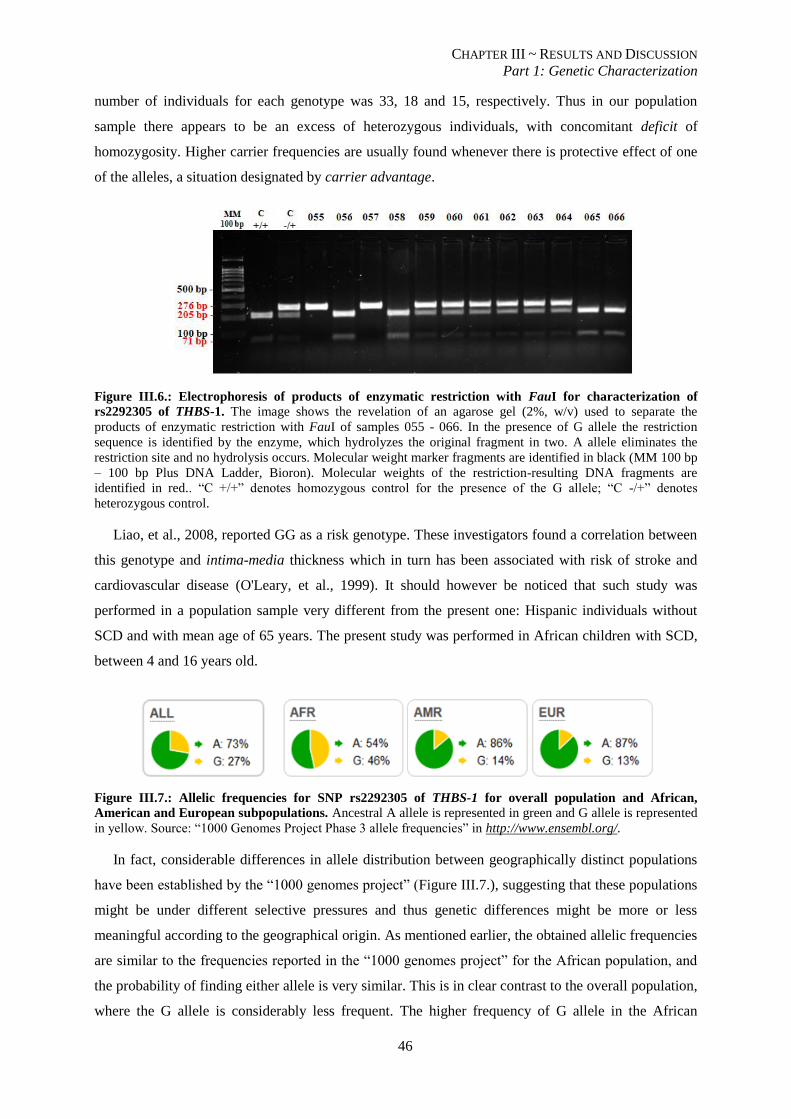
CHAPTER III ~ RESULTS AND DISCUSSION
Part 1: Genetic Characterization
46
number of individuals for each genotype was 33, 18 and 15, respectively. Thus in our population
sample there appears to be an excess of heterozygous individuals, with concomitant deficit of
homozygosity. Higher carrier frequencies are usually found whenever there is protective effect of one
of the alleles, a situation designated by carrier advantage.
Figure III.6.: Electrophoresis of products of enzymatic restriction with FauI for characterization of
rs2292305 of THBS-1. The image shows the revelation of an agarose gel (2%, w/v) used to separate the
products of enzymatic restriction with FauI of samples 055 - 066. In the presence of G allele the restriction
sequence is identified by the enzyme, which hydrolyzes the original fragment in two. A allele eliminates the
restriction site and no hydrolysis occurs. Molecular weight marker fragments are identified in black (MM 100 bp
– 100 bp Plus DNA Ladder, Bioron). Molecular weights of the restriction-resulting DNA fragments are
identified in red.. “C +/+” denotes homozygous control for the presence of the G allele; “C -/+” denotes
heterozygous control.
Liao, et al., 2008, reported GG as a risk genotype. These investigators found a correlation between
this genotype and intima-media thickness which in turn has been associated with risk of stroke and
cardiovascular disease (O'Leary, et al., 1999). It should however be noticed that such study was
performed in a population sample very different from the present one: Hispanic individuals without
SCD and with mean age of 65 years. The present study was performed in African children with SCD,
between 4 and 16 years old.
Figure III.7.: Allelic frequencies for SNP rs2292305 of THBS-1 for overall population and African,
American and European subpopulations. Ancestral A allele is represented in green and G allele is represented
in yellow. Source: “1000 Genomes Project Phase 3 allele frequencies” in http://www.ensembl.org/.
In fact, considerable differences in allele distribution between geographically distinct populations
have been established by the “1000 genomes project” (Figure III.7.), suggesting that these populations
might be under different selective pressures and thus genetic differences might be more or less
meaningful according to the geographical origin. As mentioned earlier, the obtained allelic frequencies
are similar to the frequencies reported in the “1000 genomes project” for the African population, and
the probability of finding either allele is very similar. This is in clear contrast to the overall population,
where the G allele is considerably less frequent. The higher frequency of G allele in the African
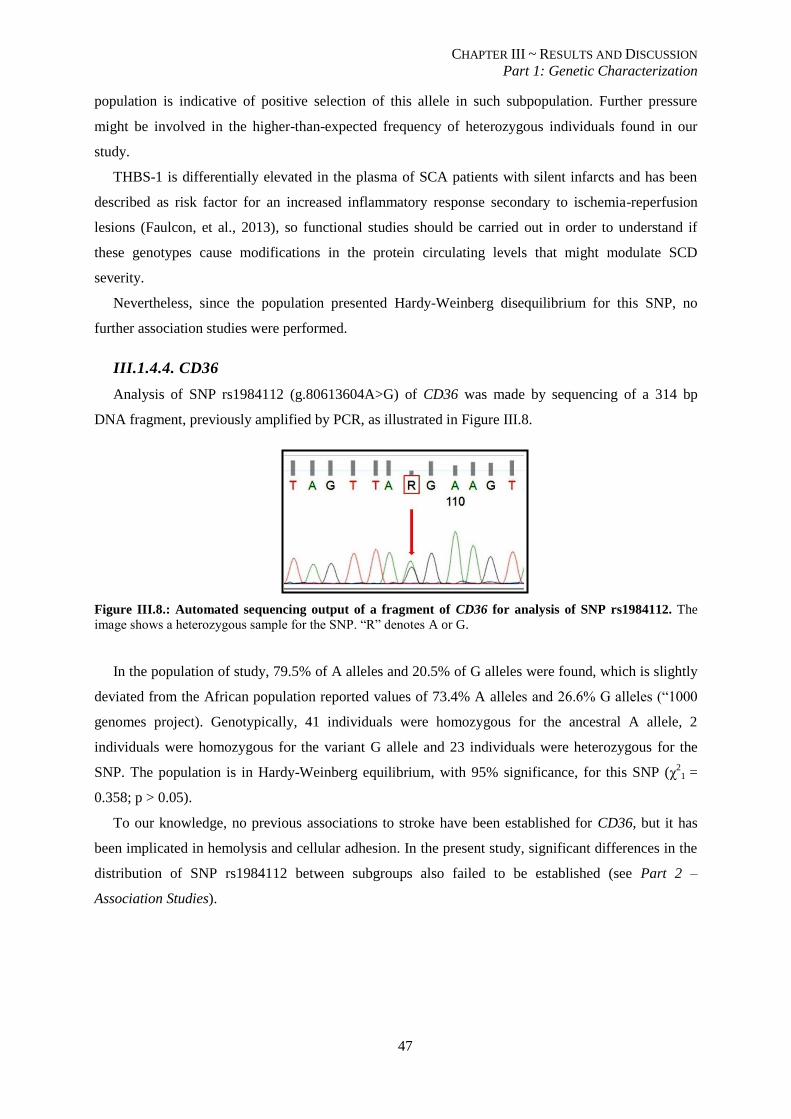
CHAPTER III ~ RESULTS AND DISCUSSION
Part 1: Genetic Characterization
47
population is indicative of positive selection of this allele in such subpopulation. Further pressure
might be involved in the higher-than-expected frequency of heterozygous individuals found in our
study.
THBS-1 is differentially elevated in the plasma of SCA patients with silent infarcts and has been
described as risk factor for an increased inflammatory response secondary to ischemia-reperfusion
lesions (Faulcon, et al., 2013), so functional studies should be carried out in order to understand if
these genotypes cause modifications in the protein circulating levels that might modulate SCD
severity.
Nevertheless, since the population presented Hardy-Weinberg disequilibrium for this SNP, no
further association studies were performed.
III.1.4.4. CD36
Analysis of SNP rs1984112 (g.80613604A>G) of CD36 was made by sequencing of a 314 bp
DNA fragment, previously amplified by PCR, as illustrated in Figure III.8.
Figure III.8.: Automated sequencing output of a fragment of CD36 for analysis of SNP rs1984112. The
image shows a heterozygous sample for the SNP. “R” denotes A or G.
In the population of study, 79.5% of A alleles and 20.5% of G alleles were found, which is slightly
deviated from the African population reported values of 73.4% A alleles and 26.6% G alleles (“1000
genomes project). Genotypically, 41 individuals were homozygous for the ancestral A allele, 2
individuals were homozygous for the variant G allele and 23 individuals were heterozygous for the
SNP. The population is in Hardy-Weinberg equilibrium, with 95% significance, for this SNP (χ21 =
0.358; p > 0.05).
To our knowledge, no previous associations to stroke have been established for CD36, but it has
been implicated in hemolysis and cellular adhesion. In the present study, significant differences in the
distribution of SNP rs1984112 between subgroups also failed to be established (see Part 2 –
Association Studies).
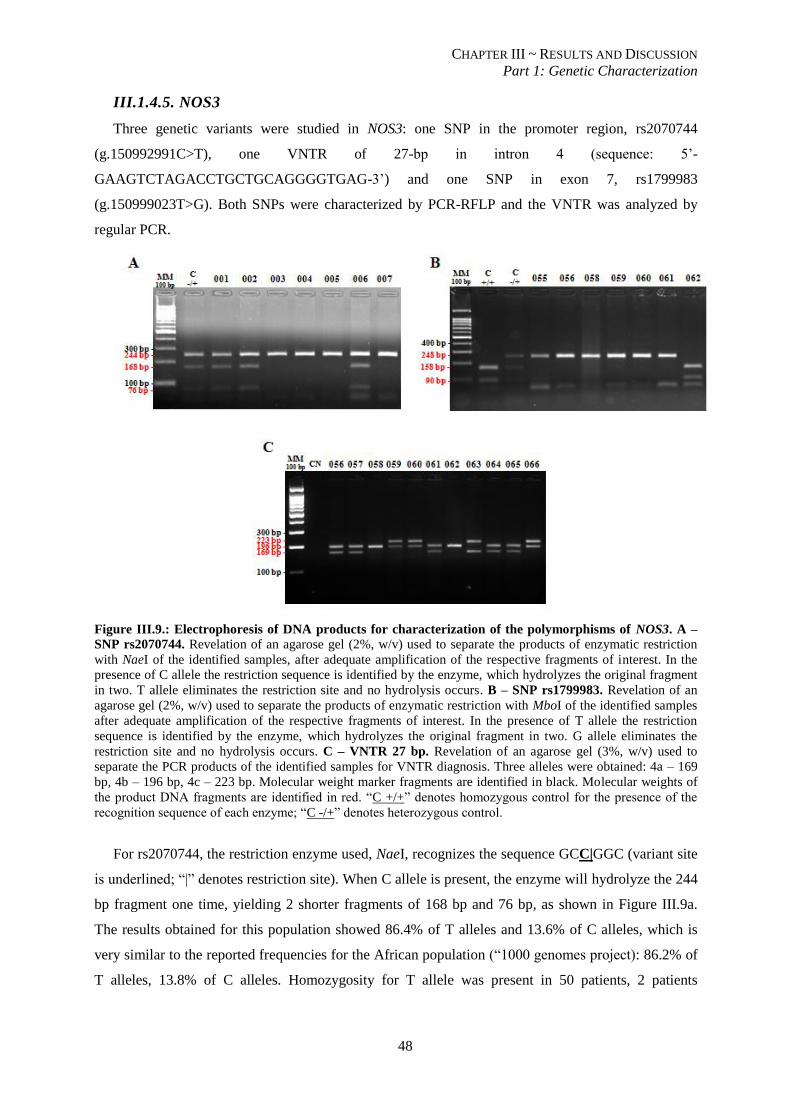
CHAPTER III ~ RESULTS AND DISCUSSION
Part 1: Genetic Characterization
48
III.1.4.5. NOS3
Three genetic variants were studied in NOS3: one SNP in the promoter region, rs2070744
(g.150992991C>T), one VNTR of 27-bp in intron 4 (sequence: 5’-
GAAGTCTAGACCTGCTGCAGGGGTGAG-3’) and one SNP in exon 7, rs1799983
(g.150999023T>G). Both SNPs were characterized by PCR-RFLP and the VNTR was analyzed by
regular PCR.
Figure III.9.: Electrophoresis of DNA products for characterization of the polymorphisms of NOS3. A –
SNP rs2070744. Revelation of an agarose gel (2%, w/v) used to separate the products of enzymatic restriction
with NaeI of the identified samples, after adequate amplification of the respective fragments of interest. In the
presence of C allele the restriction sequence is identified by the enzyme, which hydrolyzes the original fragment
in two. T allele eliminates the restriction site and no hydrolysis occurs. B – SNP rs1799983. Revelation of an
agarose gel (2%, w/v) used to separate the products of enzymatic restriction with MboI of the identified samples
after adequate amplification of the respective fragments of interest. In the presence of T allele the restriction
sequence is identified by the enzyme, which hydrolyzes the original fragment in two. G allele eliminates the
restriction site and no hydrolysis occurs. C – VNTR 27 bp. Revelation of an agarose gel (3%, w/v) used to
separate the PCR products of the identified samples for VNTR diagnosis. Three alleles were obtained: 4a – 169
bp, 4b – 196 bp, 4c – 223 bp. Molecular weight marker fragments are identified in black. Molecular weights of
the product DNA fragments are identified in red. “C +/+” denotes homozygous control for the presence of the
recognition sequence of each enzyme; “C -/+” denotes heterozygous control.
For rs2070744, the restriction enzyme used, NaeI, recognizes the sequence GCC|GGC (variant site
is underlined; “|” denotes restriction site). When C allele is present, the enzyme will hydrolyze the 244
bp fragment one time, yielding 2 shorter fragments of 168 bp and 76 bp, as shown in Figure III.9a.
The results obtained for this population showed 86.4% of T alleles and 13.6% of C alleles, which is
very similar to the reported frequencies for the African population (“1000 genomes project): 86.2% of
T alleles, 13.8% of C alleles. Homozygosity for T allele was present in 50 patients, 2 patients
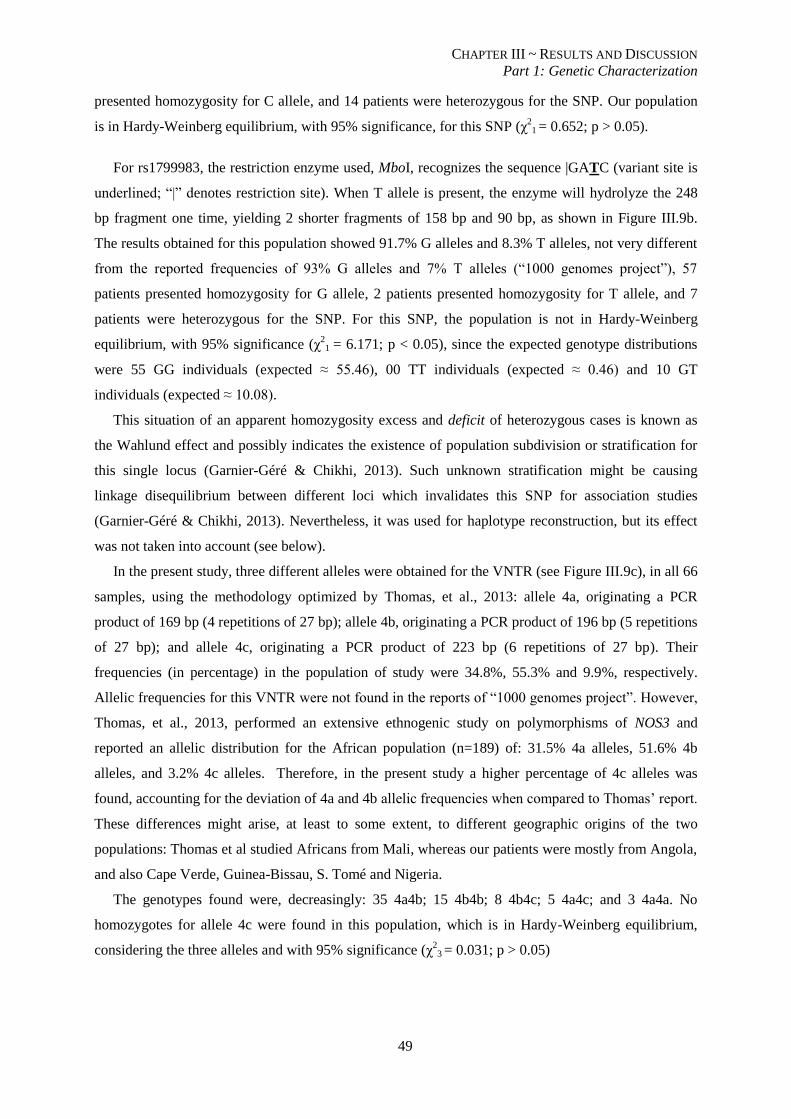
CHAPTER III ~ RESULTS AND DISCUSSION
Part 1: Genetic Characterization
49
presented homozygosity for C allele, and 14 patients were heterozygous for the SNP. Our population
is in Hardy-Weinberg equilibrium, with 95% significance, for this SNP (χ2
1 = 0.652; p > 0.05).
For rs1799983, the restriction enzyme used, MboI, recognizes the sequence |GATC (variant site is
underlined; “|” denotes restriction site). When T allele is present, the enzyme will hydrolyze the 248
bp fragment one time, yielding 2 shorter fragments of 158 bp and 90 bp, as shown in Figure III.9b.
The results obtained for this population showed 91.7% G alleles and 8.3% T alleles, not very different
from the reported frequencies of 93% G alleles and 7% T alleles (“1000 genomes project”), 57
patients presented homozygosity for G allele, 2 patients presented homozygosity for T allele, and 7
patients were heterozygous for the SNP. For this SNP, the population is not in Hardy-Weinberg
equilibrium, with 95% significance (χ21 = 6.171; p < 0.05), since the expected genotype distributions
were 55 GG individuals (expected ≈ 55.46), 00 TT individuals (expected ≈ 0.46) and 10 GT
individuals (expected ≈ 10.08).
This situation of an apparent homozygosity excess and deficit of heterozygous cases is known as
the Wahlund effect and possibly indicates the existence of population subdivision or stratification for
this single locus (Garnier-Géré & Chikhi, 2013). Such unknown stratification might be causing
linkage disequilibrium between different loci which invalidates this SNP for association studies
(Garnier-Géré & Chikhi, 2013). Nevertheless, it was used for haplotype reconstruction, but its effect
was not taken into account (see below).
In the present study, three different alleles were obtained for the VNTR (see Figure III.9c), in all 66
samples, using the methodology optimized by Thomas, et al., 2013: allele 4a, originating a PCR
product of 169 bp (4 repetitions of 27 bp); allele 4b, originating a PCR product of 196 bp (5 repetitions
of 27 bp); and allele 4c, originating a PCR product of 223 bp (6 repetitions of 27 bp). Their
frequencies (in percentage) in the population of study were 34.8%, 55.3% and 9.9%, respectively.
Allelic frequencies for this VNTR were not found in the reports of “1000 genomes project”. However,
Thomas, et al., 2013, performed an extensive ethnogenic study on polymorphisms of NOS3 and
reported an allelic distribution for the African population (n=189) of: 31.5% 4a alleles, 51.6% 4b
alleles, and 3.2% 4c alleles. Therefore, in the present study a higher percentage of 4c alleles was
found, accounting for the deviation of 4a and 4b allelic frequencies when compared to Thomas’ report.
These differences might arise, at least to some extent, to different geographic origins of the two
populations: Thomas et al studied Africans from Mali, whereas our patients were mostly from Angola,
and also Cape Verde, Guinea-Bissau, S. Tomé and Nigeria.
The genotypes found were, decreasingly: 35 4a4b; 15 4b4b; 8 4b4c; 5 4a4c; and 3 4a4a. No
homozygotes for allele 4c were found in this population, which is in Hardy-Weinberg equilibrium,
considering the three alleles and with 95% significance (χ2
3 = 0.031; p > 0.05)
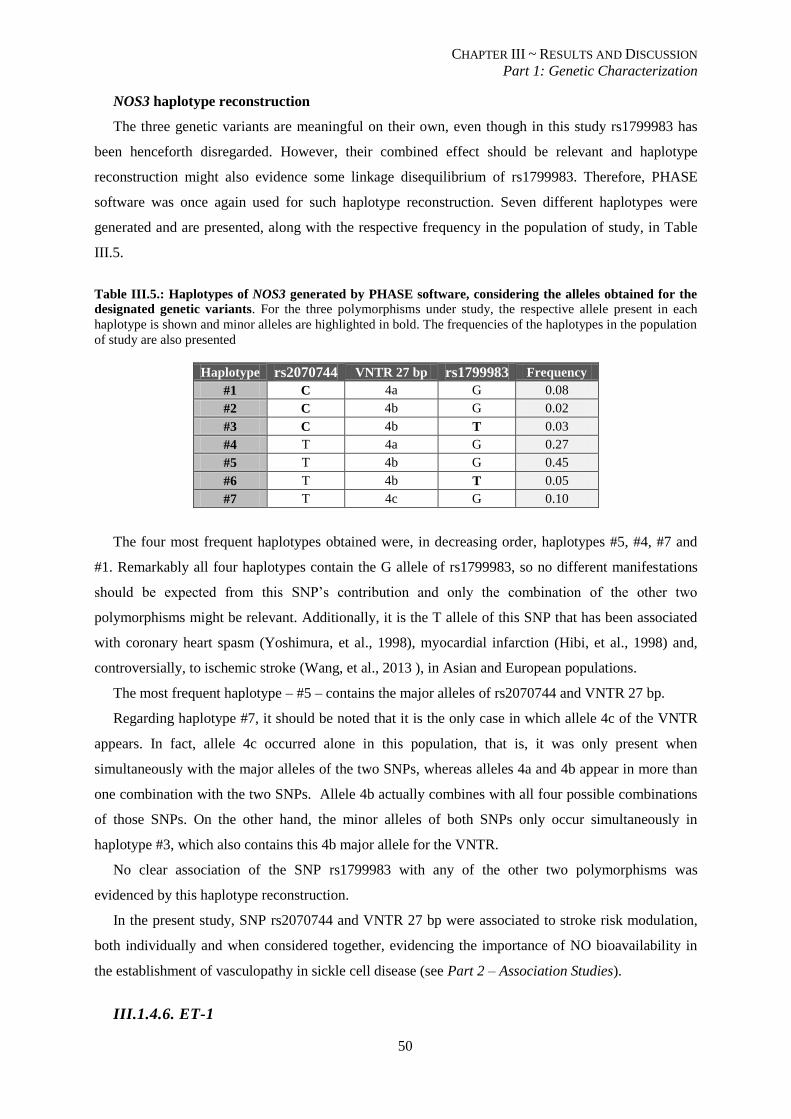
CHAPTER III ~ RESULTS AND DISCUSSION
Part 1: Genetic Characterization
50
NOS3 haplotype reconstruction
The three genetic variants are meaningful on their own, even though in this study rs1799983 has
been henceforth disregarded. However, their combined effect should be relevant and haplotype
reconstruction might also evidence some linkage disequilibrium of rs1799983. Therefore, PHASE
software was once again used for such haplotype reconstruction. Seven different haplotypes were
generated and are presented, along with the respective frequency in the population of study, in Table
III.5.
Table III.5.: Haplotypes of NOS3 generated by PHASE software, considering the alleles obtained for the
designated genetic variants. For the three polymorphisms under study, the respective allele present in each
haplotype is shown and minor alleles are highlighted in bold. The frequencies of the haplotypes in the population
of study are also presented
Haplotype rs2070744 VNTR 27 bp rs1799983 Frequency
#1 C 4a G 0.08
#2 C 4b G 0.02
#3 C 4b T 0.03
#4 T 4a G 0.27
#5 T 4b G 0.45
#6 T 4b T 0.05
#7 T 4c G 0.10
The four most frequent haplotypes obtained were, in decreasing order, haplotypes #5, #4, #7 and
#1. Remarkably all four haplotypes contain the G allele of rs1799983, so no different manifestations
should be expected from this SNP’s contribution and only the combination of the other two
polymorphisms might be relevant. Additionally, it is the T allele of this SNP that has been associated
with coronary heart spasm (Yoshimura, et al., 1998), myocardial infarction (Hibi, et al., 1998) and,
controversially, to ischemic stroke (Wang, et al., 2013 ), in Asian and European populations.
The most frequent haplotype – #5 – contains the major alleles of rs2070744 and VNTR 27 bp.
Regarding haplotype #7, it should be noted that it is the only case in which allele 4c of the VNTR
appears. In fact, allele 4c occurred alone in this population, that is, it was only present when
simultaneously with the major alleles of the two SNPs, whereas alleles 4a and 4b appear in more than
one combination with the two SNPs. Allele 4b actually combines with all four possible combinations
of those SNPs. On the other hand, the minor alleles of both SNPs only occur simultaneously in
haplotype #3, which also contains this 4b major allele for the VNTR.
No clear association of the SNP rs1799983 with any of the other two polymorphisms was
evidenced by this haplotype reconstruction.
In the present study, SNP rs2070744 and VNTR 27 bp were associated to stroke risk modulation,
both individually and when considered together, evidencing the importance of NO bioavailability in
the establishment of vasculopathy in sickle cell disease (see Part 2 – Association Studies).
III.1.4.6. ET-1
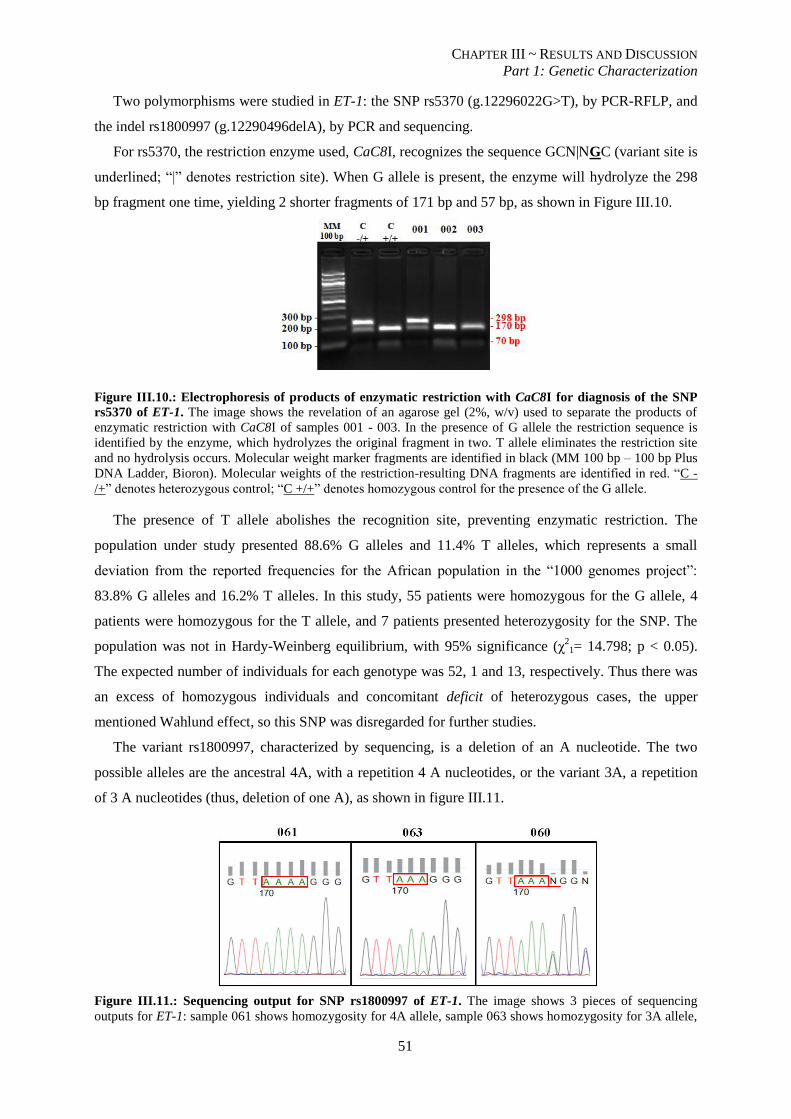
CHAPTER III ~ RESULTS AND DISCUSSION
Part 1: Genetic Characterization
51
Two polymorphisms were studied in ET-1: the SNP rs5370 (g.12296022G>T), by PCR-RFLP, and
the indel rs1800997 (g.12290496delA), by PCR and sequencing.
For rs5370, the restriction enzyme used, CaC8I, recognizes the sequence GCN|NGC (variant site is
underlined; “|” denotes restriction site). When G allele is present, the enzyme will hydrolyze the 298
bp fragment one time, yielding 2 shorter fragments of 171 bp and 57 bp, as shown in Figure III.10.
Figure III.10.: Electrophoresis of products of enzymatic restriction with CaC8I for diagnosis of the SNP
rs5370 of ET-1. The image shows the revelation of an agarose gel (2%, w/v) used to separate the products of
enzymatic restriction with CaC8I of samples 001 - 003. In the presence of G allele the restriction sequence is
identified by the enzyme, which hydrolyzes the original fragment in two. T allele eliminates the restriction site
and no hydrolysis occurs. Molecular weight marker fragments are identified in black (MM 100 bp – 100 bp Plus
DNA Ladder, Bioron). Molecular weights of the restriction-resulting DNA fragments are identified in red. “C -
/+” denotes heterozygous control; “C +/+” denotes homozygous control for the presence of the G allele.
The presence of T allele abolishes the recognition site, preventing enzymatic restriction. The
population under study presented 88.6% G alleles and 11.4% T alleles, which represents a small
deviation from the reported frequencies for the African population in the “1000 genomes project”:
83.8% G alleles and 16.2% T alleles. In this study, 55 patients were homozygous for the G allele, 4
patients were homozygous for the T allele, and 7 patients presented heterozygosity for the SNP. The
population was not in Hardy-Weinberg equilibrium, with 95% significance (χ21= 14.798; p < 0.05).
The expected number of individuals for each genotype was 52, 1 and 13, respectively. Thus there was
an excess of homozygous individuals and concomitant deficit of heterozygous cases, the upper
mentioned Wahlund effect, so this SNP was disregarded for further studies.
The variant rs1800997, characterized by sequencing, is a deletion of an A nucleotide. The two
possible alleles are the ancestral 4A, with a repetition 4 A nucleotides, or the variant 3A, a repetition
of 3 A nucleotides (thus, deletion of one A), as shown in figure III.11.
Figure III.11.: Sequencing output for SNP rs1800997 of ET-1. The image shows 3 pieces of sequencing
outputs for ET-1: sample 061 shows homozygosity for 4A allele, sample 063 shows homozygosity for 3A allele,
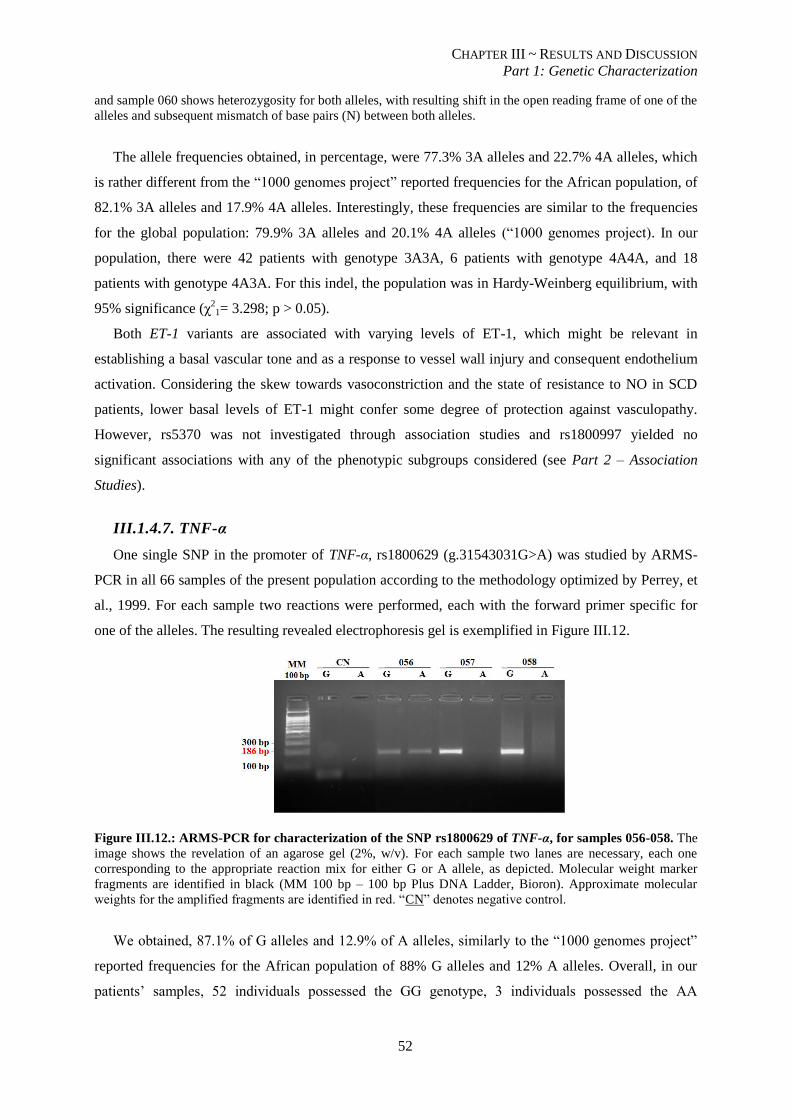
CHAPTER III ~ RESULTS AND DISCUSSION
Part 1: Genetic Characterization
52
and sample 060 shows heterozygosity for both alleles, with resulting shift in the open reading frame of one of the
alleles and subsequent mismatch of base pairs (N) between both alleles.
The allele frequencies obtained, in percentage, were 77.3% 3A alleles and 22.7% 4A alleles, which
is rather different from the “1000 genomes project” reported frequencies for the African population, of
82.1% 3A alleles and 17.9% 4A alleles. Interestingly, these frequencies are similar to the frequencies
for the global population: 79.9% 3A alleles and 20.1% 4A alleles (“1000 genomes project). In our
population, there were 42 patients with genotype 3A3A, 6 patients with genotype 4A4A, and 18
patients with genotype 4A3A. For this indel, the population was in Hardy-Weinberg equilibrium, with
95% significance (χ21= 3.298; p > 0.05).
Both ET-1 variants are associated with varying levels of ET-1, which might be relevant in
establishing a basal vascular tone and as a response to vessel wall injury and consequent endothelium
activation. Considering the skew towards vasoconstriction and the state of resistance to NO in SCD
patients, lower basal levels of ET-1 might confer some degree of protection against vasculopathy.
However, rs5370 was not investigated through association studies and rs1800997 yielded no
significant associations with any of the phenotypic subgroups considered (see Part 2 – Association
Studies).
III.1.4.7. TNF-α
One single SNP in the promoter of TNF-α, rs1800629 (g.31543031G>A) was studied by ARMS-
PCR in all 66 samples of the present population according to the methodology optimized by Perrey, et
al., 1999. For each sample two reactions were performed, each with the forward primer specific for
one of the alleles. The resulting revealed electrophoresis gel is exemplified in Figure III.12.
Figure III.12.: ARMS-PCR for characterization of the SNP rs1800629 of TNF-α, for samples 056-058. The
image shows the revelation of an agarose gel (2%, w/v). For each sample two lanes are necessary, each one
corresponding to the appropriate reaction mix for either G or A allele, as depicted. Molecular weight marker
fragments are identified in black (MM 100 bp – 100 bp Plus DNA Ladder, Bioron). Approximate molecular
weights for the amplified fragments are identified in red. “CN” denotes negative control.
We obtained, 87.1% of G alleles and 12.9% of A alleles, similarly to the “1000 genomes project”
reported frequencies for the African population of 88% G alleles and 12% A alleles. Overall, in our
patients’ samples, 52 individuals possessed the GG genotype, 3 individuals possessed the AA
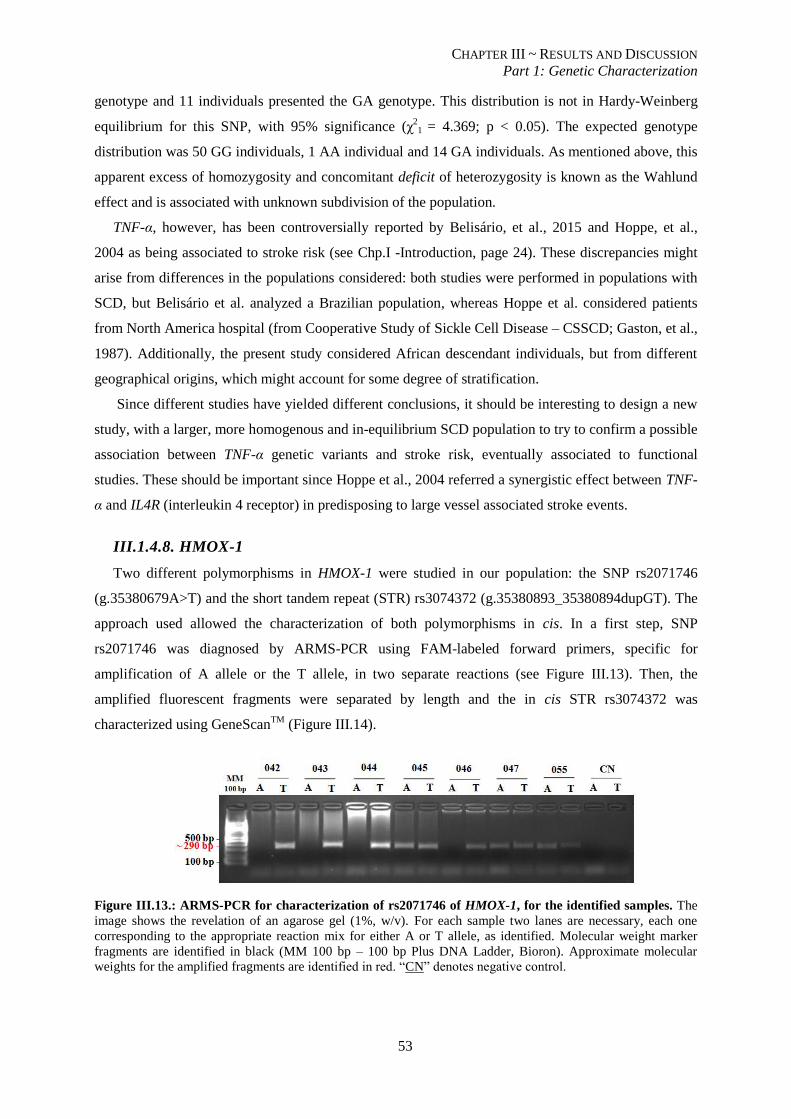
CHAPTER III ~ RESULTS AND DISCUSSION
Part 1: Genetic Characterization
53
genotype and 11 individuals presented the GA genotype. This distribution is not in Hardy-Weinberg
equilibrium for this SNP, with 95% significance (χ2
1 = 4.369; p < 0.05). The expected genotype
distribution was 50 GG individuals, 1 AA individual and 14 GA individuals. As mentioned above, this
apparent excess of homozygosity and concomitant deficit of heterozygosity is known as the Wahlund
effect and is associated with unknown subdivision of the population.
TNF-α, however, has been controversially reported by Belisário, et al., 2015 and Hoppe, et al.,
2004 as being associated to stroke risk (see Chp.I -Introduction, page 24). These discrepancies might
arise from differences in the populations considered: both studies were performed in populations with
SCD, but Belisário et al. analyzed a Brazilian population, whereas Hoppe et al. considered patients
from North America hospital (from Cooperative Study of Sickle Cell Disease – CSSCD; Gaston, et al.,
1987). Additionally, the present study considered African descendant individuals, but from different
geographical origins, which might account for some degree of stratification.
Since different studies have yielded different conclusions, it should be interesting to design a new
study, with a larger, more homogenous and in-equilibrium SCD population to try to confirm a possible
association between TNF-α genetic variants and stroke risk, eventually associated to functional
studies. These should be important since Hoppe et al., 2004 referred a synergistic effect between TNF-
α and IL4R (interleukin 4 receptor) in predisposing to large vessel associated stroke events.
III.1.4.8. HMOX-1
Two different polymorphisms in HMOX-1 were studied in our population: the SNP rs2071746
(g.35380679A>T) and the short tandem repeat (STR) rs3074372 (g.35380893_35380894dupGT). The
approach used allowed the characterization of both polymorphisms in cis. In a first step, SNP
rs2071746 was diagnosed by ARMS-PCR using FAM-labeled forward primers, specific for
amplification of A allele or the T allele, in two separate reactions (see Figure III.13). Then, the
amplified fluorescent fragments were separated by length and the in cis STR rs3074372 was
characterized using GeneScanTM
(Figure III.14).
Figure III.13.: ARMS-PCR for characterization of rs2071746 of HMOX-1, for the identified samples. The
image shows the revelation of an agarose gel (1%, w/v). For each sample two lanes are necessary, each one
corresponding to the appropriate reaction mix for either A or T allele, as identified. Molecular weight marker
fragments are identified in black (MM 100 bp – 100 bp Plus DNA Ladder, Bioron). Approximate molecular
weights for the amplified fragments are identified in red. “CN” denotes negative control.
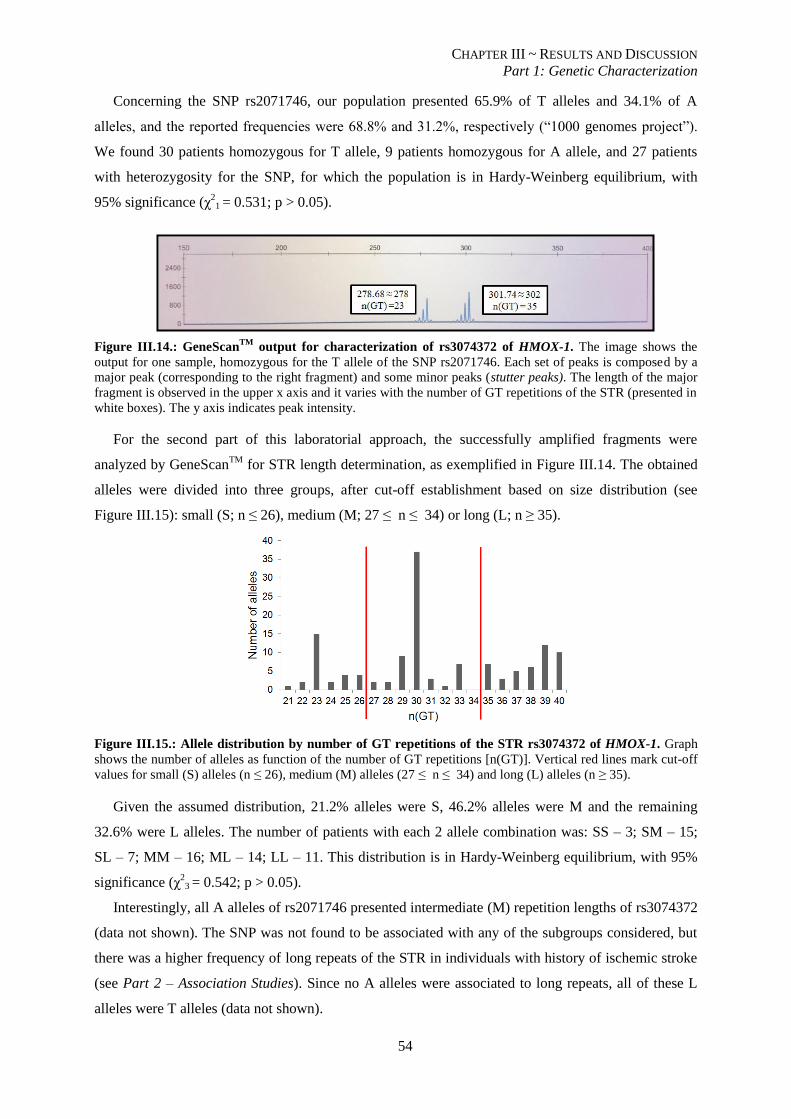
CHAPTER III ~ RESULTS AND DISCUSSION
Part 1: Genetic Characterization
54
Concerning the SNP rs2071746, our population presented 65.9% of T alleles and 34.1% of A
alleles, and the reported frequencies were 68.8% and 31.2%, respectively (“1000 genomes project”).
We found 30 patients homozygous for T allele, 9 patients homozygous for A allele, and 27 patients
with heterozygosity for the SNP, for which the population is in Hardy-Weinberg equilibrium, with
95% significance (χ21 = 0.531; p > 0.05).
Figure III.14.: GeneScanTM
output for characterization of rs3074372 of HMOX-1. The image shows the
output for one sample, homozygous for the T allele of the SNP rs2071746. Each set of peaks is composed by a
major peak (corresponding to the right fragment) and some minor peaks (stutter peaks). The length of the major
fragment is observed in the upper x axis and it varies with the number of GT repetitions of the STR (presented in
white boxes). The y axis indicates peak intensity.
For the second part of this laboratorial approach, the successfully amplified fragments were
analyzed by GeneScanTM
for STR length determination, as exemplified in Figure III.14. The obtained
alleles were divided into three groups, after cut-off establishment based on size distribution (see
Figure III.15): small (S; n ≤ 26), medium (M; 27 ≤ n ≤ 34) or long (L; n ≥ 35).
Figure III.15.: Allele distribution by number of GT repetitions of the STR rs3074372 of HMOX-1. Graph
shows the number of alleles as function of the number of GT repetitions [n(GT)]. Vertical red lines mark cut-off
values for small (S) alleles (n ≤ 26), medium (M) alleles (27 ≤ n ≤ 34) and long (L) alleles (n ≥ 35).
Given the assumed distribution, 21.2% alleles were S, 46.2% alleles were M and the remaining
32.6% were L alleles. The number of patients with each 2 allele combination was: SS – 3; SM – 15;
SL – 7; MM – 16; ML – 14; LL – 11. This distribution is in Hardy-Weinberg equilibrium, with 95%
significance (χ23 = 0.542; p > 0.05).
Interestingly, all A alleles of rs2071746 presented intermediate (M) repetition lengths of rs3074372
(data not shown). The SNP was not found to be associated with any of the subgroups considered, but
there was a higher frequency of long repeats of the STR in individuals with history of ischemic stroke
(see Part 2 – Association Studies). Since no A alleles were associated to long repeats, all of these L
alleles were T alleles (data not shown).
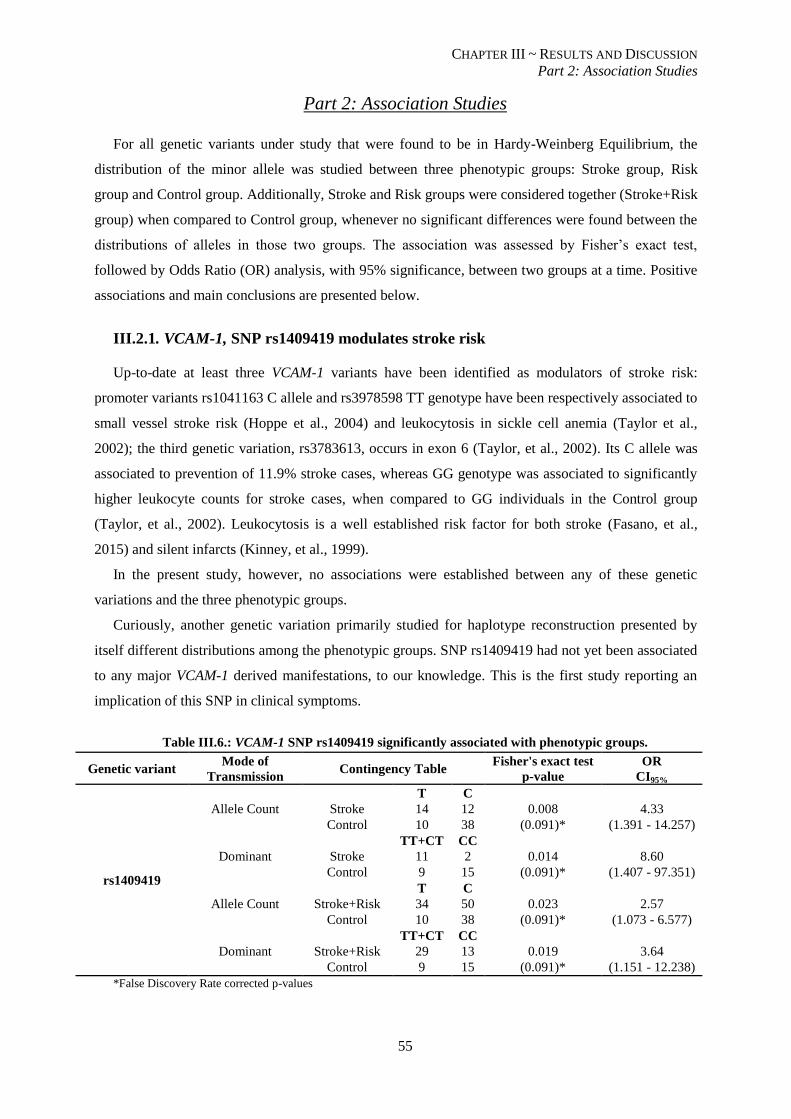
CHAPTER III ~ RESULTS AND DISCUSSION
Part 2: Association Studies
55
Part 2: Association Studies
For all genetic variants under study that were found to be in Hardy-Weinberg Equilibrium, the
distribution of the minor allele was studied between three phenotypic groups: Stroke group, Risk
group and Control group. Additionally, Stroke and Risk groups were considered together (Stroke+Risk
group) when compared to Control group, whenever no significant differences were found between the
distributions of alleles in those two groups. The association was assessed by Fisher’s exact test,
followed by Odds Ratio (OR) analysis, with 95% significance, between two groups at a time. Positive
associations and main conclusions are presented below.
III.2.1. VCAM-1, SNP rs1409419 modulates stroke risk
Up-to-date at least three VCAM-1 variants have been identified as modulators of stroke risk:
promoter variants rs1041163 C allele and rs3978598 TT genotype have been respectively associated to
small vessel stroke risk (Hoppe et al., 2004) and leukocytosis in sickle cell anemia (Taylor et al.,
2002); the third genetic variation, rs3783613, occurs in exon 6 (Taylor, et al., 2002). Its C allele was
associated to prevention of 11.9% stroke cases, whereas GG genotype was associated to significantly
higher leukocyte counts for stroke cases, when compared to GG individuals in the Control group
(Taylor, et al., 2002). Leukocytosis is a well established risk factor for both stroke (Fasano, et al.,
2015) and silent infarcts (Kinney, et al., 1999).
In the present study, however, no associations were established between any of these genetic
variations and the three phenotypic groups.
Curiously, another genetic variation primarily studied for haplotype reconstruction presented by
itself different distributions among the phenotypic groups. SNP rs1409419 had not yet been associated
to any major VCAM-1 derived manifestations, to our knowledge. This is the first study reporting an
implication of this SNP in clinical symptoms.
Table III.6.: VCAM-1 SNP rs1409419 significantly associated with phenotypic groups.
Genetic variant Mode of
Transmission Contingency Table
Fisher's exact test
p-value
OR
CI95%
rs1409419
Allele Count
T C
Stroke 14 12 0.008 4.33
Control 10 38 (0.091)* (1.391 - 14.257)
Dominant
TT+CT CC
Stroke 11 2 0.014 8.60
Control 9 15 (0.091)* (1.407 - 97.351)
Allele Count
T C
Stroke+Risk 34 50 0.023 2.57
Control 10 38 (0.091)* (1.073 - 6.577)
Dominant
TT+CT CC
Stroke+Risk 29 13 0.019 3.64
Control 9 15 (0.091)* (1.151 - 12.238)
*False Discovery Rate corrected p-values
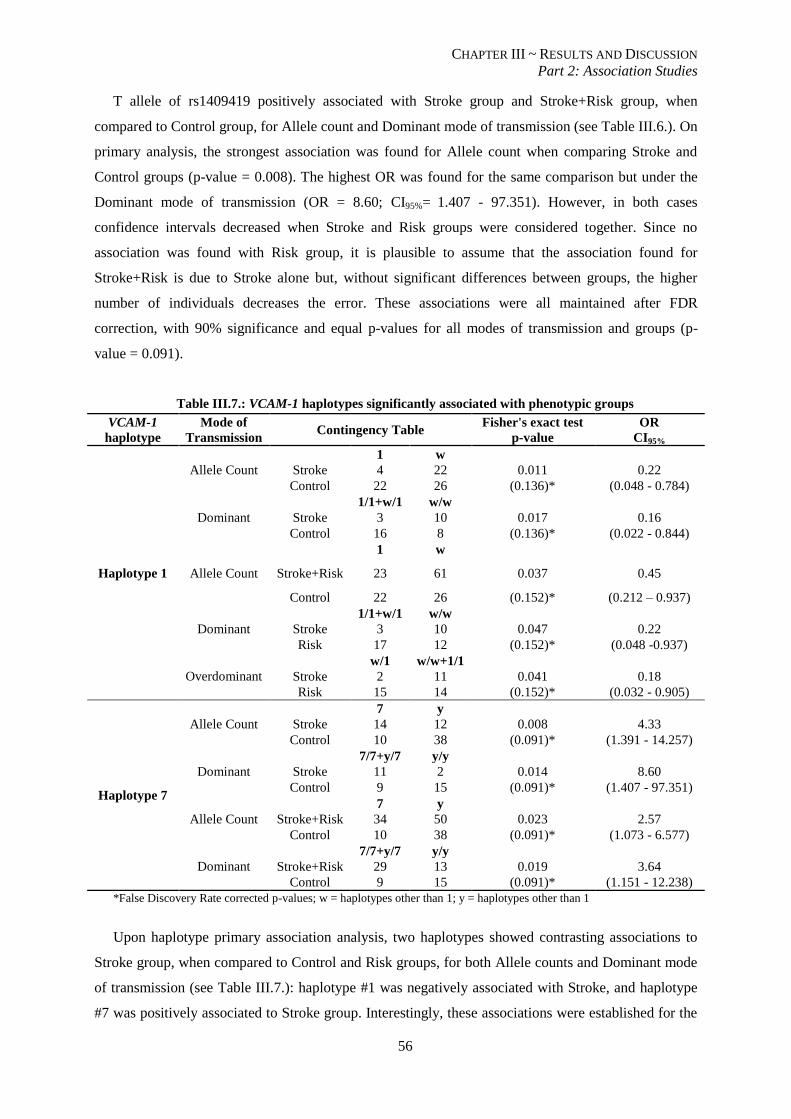
CHAPTER III ~ RESULTS AND DISCUSSION
Part 2: Association Studies
56
T allele of rs1409419 positively associated with Stroke group and Stroke+Risk group, when
compared to Control group, for Allele count and Dominant mode of transmission (see Table III.6.). On
primary analysis, the strongest association was found for Allele count when comparing Stroke and
Control groups (p-value = 0.008). The highest OR was found for the same comparison but under the
Dominant mode of transmission (OR = 8.60; CI95%= 1.407 - 97.351). However, in both cases
confidence intervals decreased when Stroke and Risk groups were considered together. Since no
association was found with Risk group, it is plausible to assume that the association found for
Stroke+Risk is due to Stroke alone but, without significant differences between groups, the higher
number of individuals decreases the error. These associations were all maintained after FDR
correction, with 90% significance and equal p-values for all modes of transmission and groups (p-
value = 0.091).
Table III.7.: VCAM-1 haplotypes significantly associated with phenotypic groups
VCAM-1
haplotype
Mode of
Transmission Contingency Table
Fisher's exact test
p-value
OR
CI95%
Haplotype 1
Allele Count
1 w
Stroke 4 22 0.011 0.22
Control 22 26 (0.136)* (0.048 - 0.784)
Dominant
1/1+w/1 w/w
Stroke 3 10 0.017 0.16
Control 16 8 (0.136)* (0.022 - 0.844)
Allele Count
1 w
Stroke+Risk 23 61 0.037 0.45
Control 22 26 (0.152)* (0.212 – 0.937)
Dominant
1/1+w/1 w/w
Stroke 3 10 0.047 0.22
Risk 17 12 (0.152)* (0.048 -0.937)
Overdominant
w/1 w/w+1/1
Stroke 2 11 0.041 0.18
Risk 15 14 (0.152)* (0.032 - 0.905)
Haplotype 7
Allele Count
7 y
Stroke 14 12 0.008 4.33
Control 10 38 (0.091)* (1.391 - 14.257)
Dominant
7/7+y/7 y/y
Stroke 11 2 0.014 8.60
Control 9 15 (0.091)* (1.407 - 97.351)
Allele Count
7 y
Stroke+Risk 34 50 0.023 2.57
Control 10 38 (0.091)* (1.073 - 6.577)
Dominant
7/7+y/7 y/y
Stroke+Risk 29 13 0.019 3.64
Control 9 15 (0.091)* (1.151 - 12.238)
*False Discovery Rate corrected p-values; w = haplotypes other than 1; y = haplotypes other than 1
Upon haplotype primary association analysis, two haplotypes showed contrasting associations to
Stroke group, when compared to Control and Risk groups, for both Allele counts and Dominant mode
of transmission (see Table III.7.): haplotype #1 was negatively associated with Stroke, and haplotype
#7 was positively associated to Stroke group. Interestingly, these associations were established for the
CHAPTER III ~ RESULTS AND DISCUSSION
Part 2: Association Studies
57
worst case scenario, ie, stroke events, but no association was found when comparing Risk and Control
groups. This could indicate that the presence of haplotype #1 and the absence of haplotype #7 are
protective situations.
On careful analysis, we can conclude that the difference between haplotypes #1 and #7 is solely
due to rs1409419 (see Part 1: Genetic characterization, page 45): haplotype #1 contains the C allele,
whereas haplotype #7 contains the T allele. All the remaining SNPs considered present the major
allele. Therefore the conclusions drawn for rs1409419 alone are the same for haplotype #7.
Interestingly, T allele appears isolated in our population, that is, it is only present when no other
genetic variations considered for haplotype reconstruction are present.
In contrast, haplotype #1 presents the C allele for SNP rs1409419. This wild-type allele is hereby
associated to stroke prevention, since haplotype #1 was negatively associated to Stroke group, on a
primary analysis, for Allele count (p-value: 0.011; OR = 0.22; CI95%= 0.048 - 0.784) and Dominant
mode of transmission (p-value: 0.017; OR = 0.16; CI95%= 0.022 - 0.844). This negative association to
Stroke group implicates a significantly lower number of C alleles in Stroke group, when compared to
Control and Risk groups. The protective role of this C allele, however, was only significant when no
other promoter genetic variants occur, since the remaining haplotypes all possess this C allele, but no
associations were established with any phenotypic groups. Nevertheless, the association found for
haplotype #1 was lost after FDR correction.
Several haplotypes for the promoter of VCAM-1 were profiled in African Americans, which
included this rs1409419 variant, and were shown to be biologically active (Idelman, et al., 2007).
Since no information is available about this particular SNP concerning risk of stroke or other vascular
diseases, these results should be replicated and further analyzed. It should be interesting to perform
functional studies as well, to try to establish a biologic link between this VCAM-1 promoter variant
and vasculopathy.
III.2.2. NOS3 polymorphisms are associated with stroke risk and events
Considering the three phenotypic groups, differences between them were assessed by Fisher’s
exact test and Odds Ratio analysis. Significant associations are shown in Table III.8.
C allele of rs2070744 has been previously associated with a 52% reduction of the NOS3 promoter
activity and coronary spasm in a non-SCD Japanese population (Nakayama, et al., 1999). To our
knowledge, there are no reports of direct influence of this SNP in stroke risk or occurrence. However,
this association with coronary disease evidences a possible role in vasculopathy of small arteries and
might be relevant for small cerebral arteries as well. Additionally, a reduction in promoter activity
leads to lower baseline NO levels, which might be significant in a disease as SCD, already categorized
as presenting NO resistance. As mentioned earlier, this NO resistance leads to an imbalance in
vascular tone, increasing vasoconstriction.
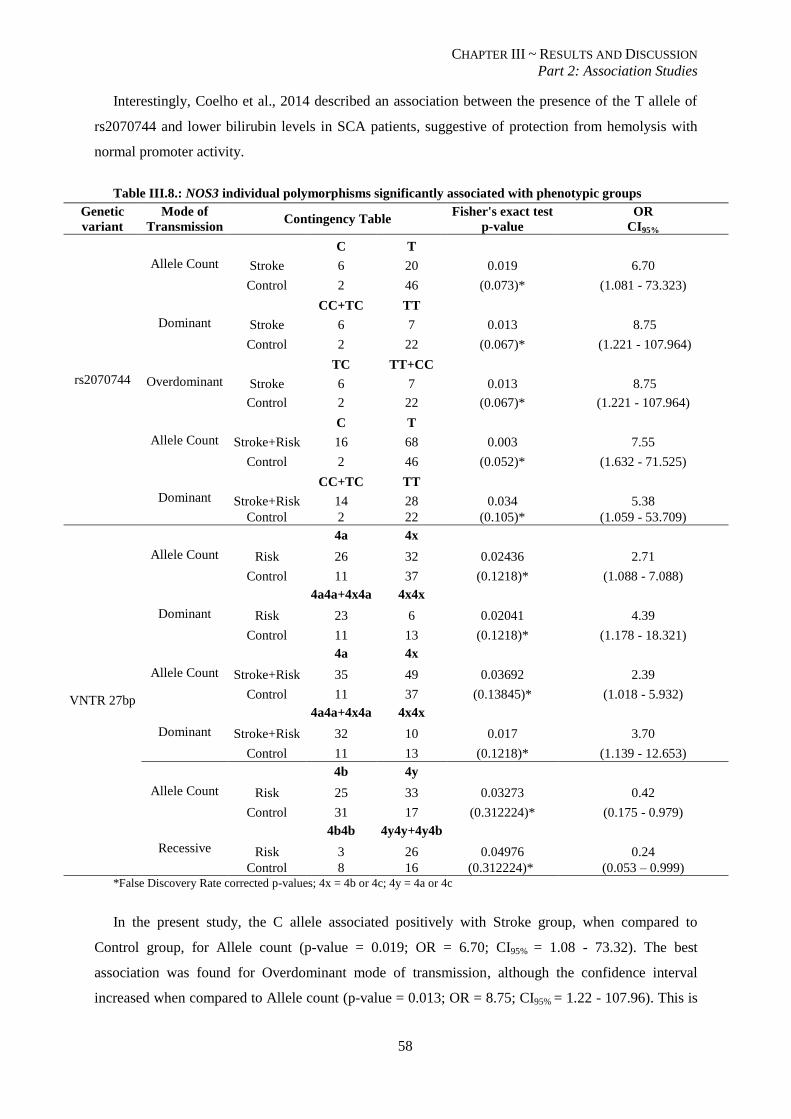
CHAPTER III ~ RESULTS AND DISCUSSION
Part 2: Association Studies
58
Interestingly, Coelho et al., 2014 described an association between the presence of the T allele of
rs2070744 and lower bilirubin levels in SCA patients, suggestive of protection from hemolysis with
normal promoter activity.
Table III.8.: NOS3 individual polymorphisms significantly associated with phenotypic groups
Genetic
variant
Mode of
Transmission Contingency Table
Fisher's exact test
p-value
OR
CI95%
rs2070744
Allele Count C T
Stroke 6 20 0.019 6.70
Control 2 46 (0.073)* (1.081 - 73.323)
Dominant CC+TC TT
Stroke 6 7 0.013 8.75
Control 2 22 (0.067)* (1.221 - 107.964)
Overdominant TC TT+CC
Stroke 6 7 0.013 8.75
Control 2 22 (0.067)* (1.221 - 107.964)
Allele Count C T
Stroke+Risk 16 68 0.003 7.55
Control 2 46 (0.052)* (1.632 - 71.525)
Dominant CC+TC TT
Stroke+Risk 14 28 0.034 5.38
Control 2 22 (0.105)* (1.059 - 53.709)
VNTR 27bp
Allele Count
4a 4x
Risk 26 32 0.02436 2.71
Control 11 37 (0.1218)* (1.088 - 7.088)
Dominant
4a4a+4x4a 4x4x
Risk 23 6 0.02041 4.39
Control 11 13 (0.1218)* (1.178 - 18.321)
Allele Count
4a 4x
Stroke+Risk 35 49 0.03692 2.39
Control 11 37 (0.13845)* (1.018 - 5.932)
Dominant
4a4a+4x4a 4x4x
Stroke+Risk 32 10 0.017 3.70
Control 11 13 (0.1218)* (1.139 - 12.653)
Allele Count
4b 4y
Risk 25 33 0.03273 0.42
Control 31 17 (0.312224)* (0.175 - 0.979)
Recessive
4b4b 4y4y+4y4b
Risk 3 26 0.04976 0.24
Control 8 16 (0.312224)* (0.053 – 0.999) *False Discovery Rate corrected p-values; 4x = 4b or 4c; 4y = 4a or 4c
In the present study, the C allele associated positively with Stroke group, when compared to
Control group, for Allele count (p-value = 0.019; OR = 6.70; CI95% = 1.08 - 73.32). The best
association was found for Overdominant mode of transmission, although the confidence interval
increased when compared to Allele count (p-value = 0.013; OR = 8.75; CI95% = 1.22 - 107.96). This is
CHAPTER III ~ RESULTS AND DISCUSSION
Part 2: Association Studies
59
suggestive of higher standard deviation, which should be expected since the number of genotypes is
half of the number of alleles (lower n increases error). Although these values are similar for Dominant
mode of transmission, no cases of CC genotype were reported in Stroke group and thus no conclusions
can be drawn from this homozygosity effect. For both Allele Counts and Overdominant mode, the
significance was maintained after FDR, with 90% significance (p-values: 0.073 and 0.067,
respectively).
When the distributions of C alleles in Stroke and Risk groups were considered together, a positive
association also appears, when compared to Control group. This event is probably due to Stroke group
alone because no association was found between this C allele and Risk group, when compared to
Stroke group or Control group. Since the number of alleles increases, the obtained values are much
more significant, with lower p-value (0.003) and smaller confidence interval (OR = 7.55; CI95% = 1.63
– 71.52). After FDR, the significance is kept with 90% significance. There is also a positive
association for Stroke and Risk group under a Dominant mode of transmission, but it is lost after FDR.
Since 1999, allele 4a of VNTR 27 bp of NOS3 has been associated with risk for stroke (Akar, et al.,
1999 ). A previous study showed an allele-specific decrease in NO species levels, with the presence of
the 4a allele causing a 20% NO level reduction when compared to the 4b allele (Tsukada, et al., 1998).
Earlier this year, allele 4a was once again associated with a history of cerebral stroke (Tantawy, et al.,
2015). The authors suggested a link between this 4a allele and endothelial dysfunction, hemolysis and
coagulation abnormalities, due to increased levels of LDH and D-dimer in patients with this allele
(Tantawy, et al., 2015).
Primary analysis in the present study revealed an association of the 4a allele with Risk and Stroke
and Risk groups when compared to Control group, for differences in allele counts and for dominant
mode of transmission. Since no association was found between Stroke group and the other two groups,
the positive association primarily found for Stroke and Risk group was probably due to Risk group
alone. However, these associations were lost after FDR correction.
In contrast, a negative association was found between 4b allele and Risk group, when compared to
Control group, for Allele counts and Recessive mode of transmission (see Table III.8.). In both cases,
significant association was lost after FDR correction. Once again these data suggest a tendency, and
should be further explored using a larger sample.
As mentioned earlier, no 4c alleles were found in Stroke group. This seems to be in disagreement
with previous reports of an association of 4c allele with ischemic stroke episodes in African
Americans (Grewal, et al., 2007 ). However, the authors report this association only for stroke
secondary to large atherothrombosis and not for other ischemic stroke etiologies. Along with the
differences in the populations under study, this might justify the discrepancy found.
When both polymorphisms are taken into account together, their possible combined effect in each
group can be assessed. Two haplotypes showed significant association on primary analysis: haplotype
#1, containing the C allele of rs2070744 and the 4a allele of the VNTR, and haplotype 5, containing
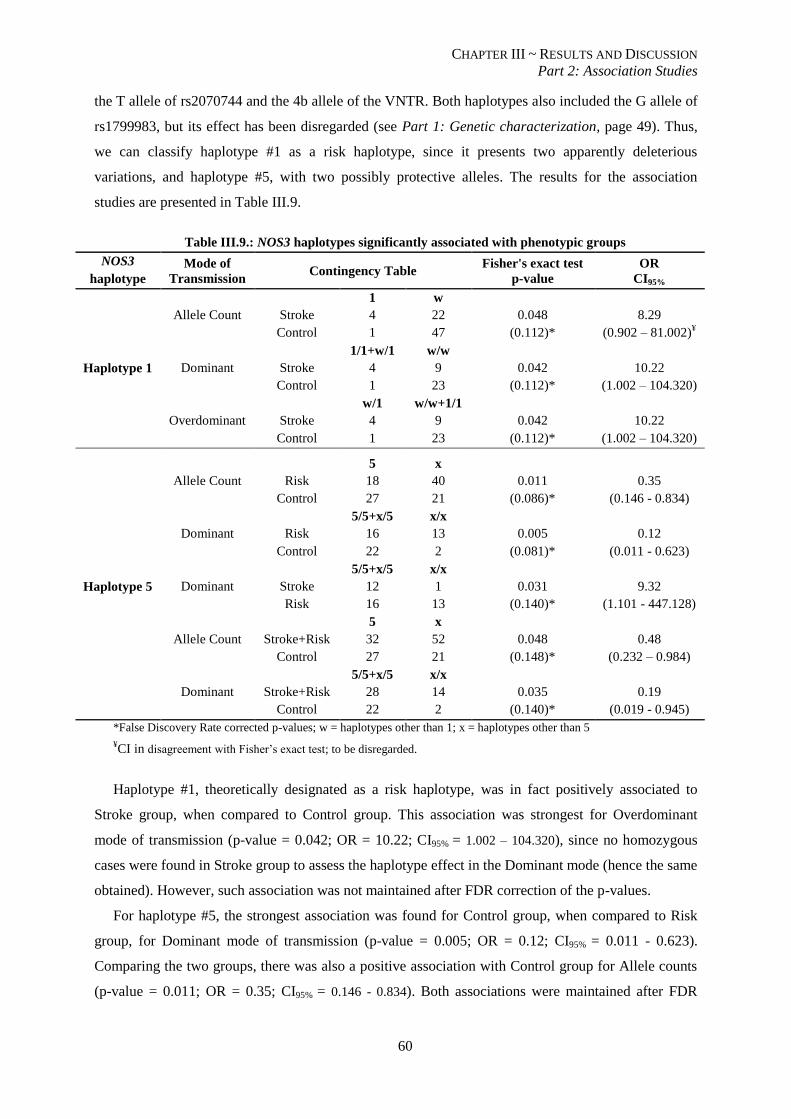
CHAPTER III ~ RESULTS AND DISCUSSION
Part 2: Association Studies
60
the T allele of rs2070744 and the 4b allele of the VNTR. Both haplotypes also included the G allele of
rs1799983, but its effect has been disregarded (see Part 1: Genetic characterization, page 49). Thus,
we can classify haplotype #1 as a risk haplotype, since it presents two apparently deleterious
variations, and haplotype #5, with two possibly protective alleles. The results for the association
studies are presented in Table III.9.
Table III.9.: NOS3 haplotypes significantly associated with phenotypic groups
NOS3
haplotype
Mode of
Transmission Contingency Table
Fisher's exact test
p-value
OR
CI95%
Haplotype 1
Allele Count
1 w
Stroke 4 22 0.048 8.29
Control 1 47 (0.112)* (0.902 – 81.002)¥
Dominant
1/1+w/1 w/w
Stroke 4 9 0.042 10.22
Control 1 23 (0.112)* (1.002 – 104.320)
Overdominant
w/1 w/w+1/1
Stroke 4 9 0.042 10.22
Control 1 23 (0.112)* (1.002 – 104.320)
Haplotype 5
Allele Count
5 x
Risk 18 40 0.011 0.35
Control 27 21 (0.086)* (0.146 - 0.834)
Dominant
5/5+x/5 x/x
Risk 16 13 0.005 0.12
Control 22 2 (0.081)* (0.011 - 0.623)
Dominant
5/5+x/5 x/x
Stroke 12 1 0.031 9.32
Risk 16 13 (0.140)* (1.101 - 447.128)
Allele Count
5 x
Stroke+Risk 32 52 0.048 0.48
Control 27 21 (0.148)* (0.232 – 0.984)
Dominant
5/5+x/5 x/x
Stroke+Risk 28 14 0.035 0.19
Control 22 2 (0.140)* (0.019 - 0.945)
*False Discovery Rate corrected p-values; w = haplotypes other than 1; x = haplotypes other than 5
¥CI in disagreement with Fisher’s exact test; to be disregarded.
Haplotype #1, theoretically designated as a risk haplotype, was in fact positively associated to
Stroke group, when compared to Control group. This association was strongest for Overdominant
mode of transmission (p-value = 0.042; OR = 10.22; CI95% = 1.002 – 104.320), since no homozygous
cases were found in Stroke group to assess the haplotype effect in the Dominant mode (hence the same
obtained). However, such association was not maintained after FDR correction of the p-values.
For haplotype #5, the strongest association was found for Control group, when compared to Risk
group, for Dominant mode of transmission (p-value = 0.005; OR = 0.12; CI95% = 0.011 - 0.623).
Comparing the two groups, there was also a positive association with Control group for Allele counts
(p-value = 0.011; OR = 0.35; CI95% = 0.146 - 0.834). Both associations were maintained after FDR
CHAPTER III ~ RESULTS AND DISCUSSION
Part 2: Association Studies
61
correction, with 90% significance (p-values: 0.081 and 0.086, respectively). However, a positive
association was also found for Stroke group when compared to Risk group, under Dominant mode of
transmission (p-value = 0.031; OR = 9.32; CI95% = 1.101 - 447.128). This association was not kept
after FDR correction, but it still led to two contrasting conclusions: on primary analysis, a positive
association was found for both Control and Stroke groups, when compared to Risk group, under the
Dominant mode of transmission. This significant difference between Stroke group and Risk group
justifies the decreased association with Control group when compared to Stroke+Risk group, for
Allele count and Dominant mode, prior to FDR correction.
Interestingly, the combined effects of rs2070744 and VNTR 27 bp had already been studied by
Wang, et al., 2002. They concluded that the intron 4 of NOS3 gene coordinated with the promoter,
regulating transcription in a haplotype-specific manner. The authors showed that in the absence of any
repeat in intron 4, the T allele in the promoter had a 1.6-fold higher transcription rate than the C allele,
as previously shown by Nakayama, et al., 1999. However, when the 4b allele (5 repeats) was present,
the T allele transcription efficiency had a 35% decrease. In contrast, the presence of the 4b allele in
intron 4 simultaneously with the C allele in the promoter increased transcription efficiency about
288% of the original level. The 4a allele (4 repeats) had similar effects but at a lesser extent (Wang, et
al., 2002).
Thus this dual positive outcome found in haplotype #5 might be the result of two contrasting
effects of the two polymorphisms: a lower transcription efficiency caused by the presence of allele 4b
in intron 4 and the lower hemolytic rate caused by the presence of the T allele in the promoter.
In conclusion, our population showed a significant difference in the distribution of the C allele of
rs2070744 between Stroke and Control groups and between Stroke and Risk group and Control group,
suggesting that the presence of this allele is enough to increase the probability of stroke events. This
effect might be associated with an increased rate of hemolysis and lower baseline NO levels leading to
vasoconstriction episodes and possibly small arteries spasm. Should this mechanism be true, it could
be an additional contribution to the model proposed by Stockman, et al., 1972 (see Chp.I –
Introduction, page 14) for small vessel obstruction, causing vasculopathy of large vessels, not because
of sickle cell entrapment but as a consequence of small arteries spasm.
Allele 4a of the 27 bp VNTR in intron 4 appears to be implicated with stroke risk while allele 4b
has a protective tendency, when considered individually. However these findings should be further
explored in a larger sample in order to be confirmed.
Joint effects, as assessed by haplotype analysis, were confusing and require further investigation,
especially at the functional level to try to understand how individual SNPs might interact with each
other and influence the phenotypic outcome.
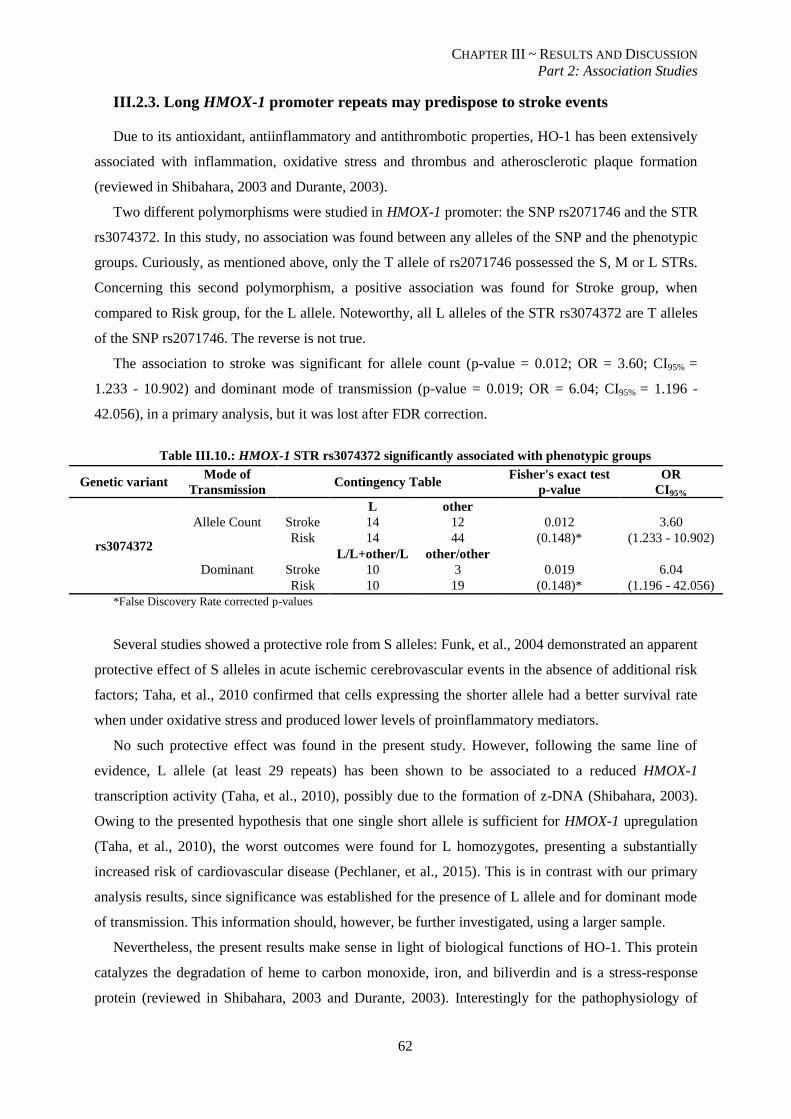
CHAPTER III ~ RESULTS AND DISCUSSION
Part 2: Association Studies
62
III.2.3. Long HMOX-1 promoter repeats may predispose to stroke events
Due to its antioxidant, antiinflammatory and antithrombotic properties, HO-1 has been extensively
associated with inflammation, oxidative stress and thrombus and atherosclerotic plaque formation
(reviewed in Shibahara, 2003 and Durante, 2003).
Two different polymorphisms were studied in HMOX-1 promoter: the SNP rs2071746 and the STR
rs3074372. In this study, no association was found between any alleles of the SNP and the phenotypic
groups. Curiously, as mentioned above, only the T allele of rs2071746 possessed the S, M or L STRs.
Concerning this second polymorphism, a positive association was found for Stroke group, when
compared to Risk group, for the L allele. Noteworthy, all L alleles of the STR rs3074372 are T alleles
of the SNP rs2071746. The reverse is not true.
The association to stroke was significant for allele count (p-value = 0.012; OR = 3.60; CI95% =
1.233 - 10.902) and dominant mode of transmission (p-value = 0.019; OR = 6.04; CI95% = 1.196 -
42.056), in a primary analysis, but it was lost after FDR correction.
Table III.10.: HMOX-1 STR rs3074372 significantly associated with phenotypic groups
Genetic variant Mode of
Transmission Contingency Table
Fisher's exact test
p-value
OR
CI95%
rs3074372
Allele Count
L other
Stroke 14 12 0.012 3.60
Risk 14 44 (0.148)* (1.233 - 10.902)
Dominant
L/L+other/L other/other
Stroke 10 3 0.019 6.04
Risk 10 19 (0.148)* (1.196 - 42.056)
*False Discovery Rate corrected p-values
Several studies showed a protective role from S alleles: Funk, et al., 2004 demonstrated an apparent
protective effect of S alleles in acute ischemic cerebrovascular events in the absence of additional risk
factors; Taha, et al., 2010 confirmed that cells expressing the shorter allele had a better survival rate
when under oxidative stress and produced lower levels of proinflammatory mediators.
No such protective effect was found in the present study. However, following the same line of
evidence, L allele (at least 29 repeats) has been shown to be associated to a reduced HMOX-1
transcription activity (Taha, et al., 2010), possibly due to the formation of z-DNA (Shibahara, 2003).
Owing to the presented hypothesis that one single short allele is sufficient for HMOX-1 upregulation
(Taha, et al., 2010), the worst outcomes were found for L homozygotes, presenting a substantially
increased risk of cardiovascular disease (Pechlaner, et al., 2015). This is in contrast with our primary
analysis results, since significance was established for the presence of L allele and for dominant mode
of transmission. This information should, however, be further investigated, using a larger sample.
Nevertheless, the present results make sense in light of biological functions of HO-1. This protein
catalyzes the degradation of heme to carbon monoxide, iron, and biliverdin and is a stress-response
protein (reviewed in Shibahara, 2003 and Durante, 2003). Interestingly for the pathophysiology of
CHAPTER III ~ RESULTS AND DISCUSSION
Part 2: Association Studies
63
stroke, HO-1 has been shown to block the growth and proliferation of vascular smooth muscle cells
via multiples mechanisms (see Durante, 2003), removes free heme preventing NO scavenging, and
releases carbon monoxide, also a vasodilator. HMOX-1 has been reported to be upregulated in several
experimental models of brain damage and Beschorner, et al., 2000 proposed a mechanism by which
production of CO after induction of HMOX-1 would prevent progression of ischemic events secondary
to microthrombi formation or vasospasm. Therefore, if the promoter of HMOX-1 is less actively
transcribed, due to the presence of this highly repetitive L allele, a diminished protective capacity
should be expected.
III.2.4. Other putative disease modulator genes were not associated to stroke risk or
protection
Despite the biological relevance in the pathophysiology of vasculopathy of all the molecules whose
genes were analyzed, the remaining polymorphisms could not be associated to either stroke risk or
protection in the present study. Some of these genes, namely CD36 and ET-1 have not been directly
implicated in the establishment of cerebral infarctive events, but are known to play an important role
in the vascular environment. CD36 variants have also been associated to higher reticulocyte counts
(Coelho, et al., 2014) and thus appear to relate to hemolysis. Since stroke has been proposed to be a
consequence of higher hemolytic rates in SCD patients, a possible link between CD36 variants and
stroke risk should be further assessed. ET-1 has been extensively implicated in vascular disease
(Abraham & Dashwood, 2008) and in SCD-related vascular wall remodeling secondary to sickle RBC
injury (reviewed in Switzer, et al., 2006), so it is reasonable to expect that ET-1 variants that decrease
ET-1 circulating levels could confer some degree of protection of stroke. One such variant, rs5370,
was not in Hardy-Weinberg equilibrium (see Part 1: Genetic characterization, page 51), and was not
submitted to association studies, so no conclusions could be drawn. For rs1800997, no significant
associations were found. Nonetheless, further studies should be performed to assess the protective
potential of these variants in the establishment of vasculopathy and stroke events.
As mentioned earlier, α-thalassemia and HPFH are the two best studied modulators of the severity
of SCD symptoms. Co-inheritance of α-thalassemia has been reported as protecting against stroke
(reviewed in Steinberg, 2009 and Thein, 2013) but no such findings were obtained in the present
study. Coelho et al., 2014 showed a decrease in reticulocytosis and bilirubin levels in the presence of
the -α3.7kb
deletion which is in concordance with Kato, et al., 2007, who associated the α-thalassemia
trait to a shift from the hemolysis-endothelial dysfunction subphenotype to the viscosity vaso-
occlusive subphenotype. Given our contrasting results with previous reports, further studies should be
conducted, for example to try to evaluate if the presence of the deletion in homozygosity or
heterozygosity could render different outcomes or if the observed disparities could be partially
explained by patient’s ages.

CHAPTER III ~ RESULTS AND DISCUSSION
Part 2: Association Studies
64
HPFH is mainly resultant from SNPs in the beta-globin cluster (associated to Senegal and Arab-
Indian haplotypes, T allele of rs7482144) and in BCL11A gene, C allele of rs11886868. No significant
differences were found between the distributions of such alleles and the three phenotypic groups, in
the present study, which leads to the conclusion that no direct associations could be established
between these genetic variants and the risk or protection of stroke. However, these genes were
associated to high HbF levels which, in turn, were associated to stroke protection (see below).
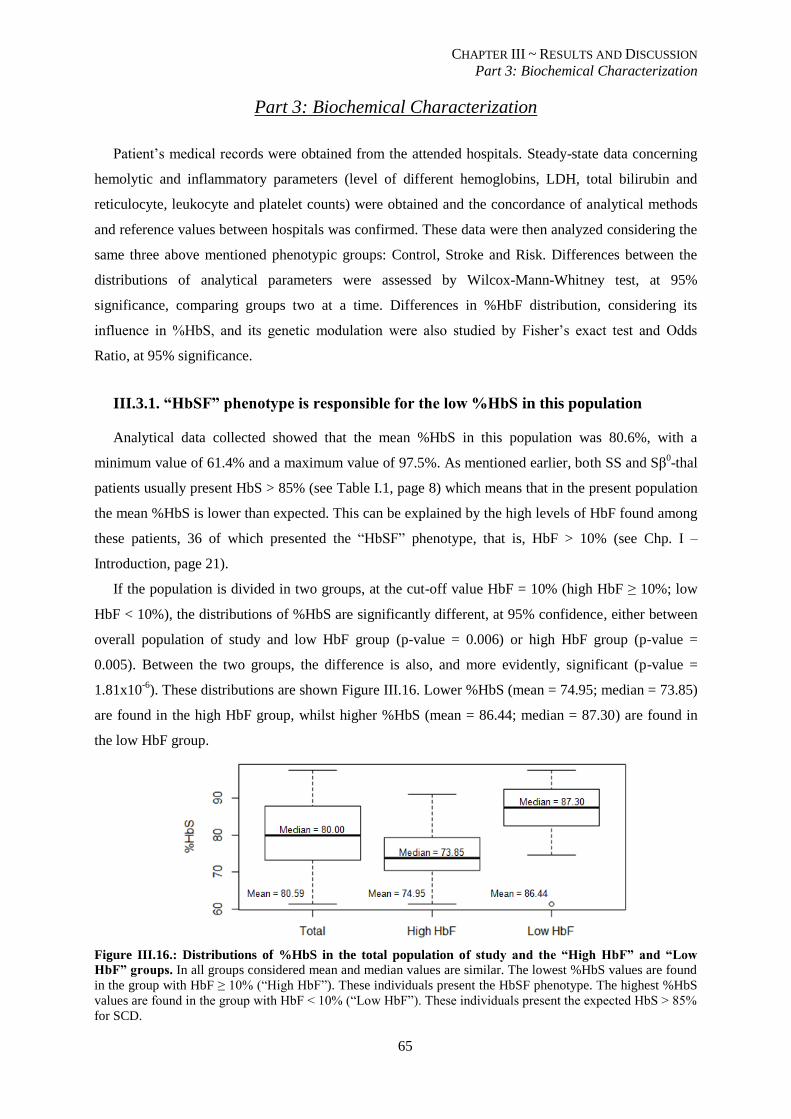
CHAPTER III ~ RESULTS AND DISCUSSION
Part 3: Biochemical Characterization
65
Part 3: Biochemical Characterization
Patient’s medical records were obtained from the attended hospitals. Steady-state data concerning
hemolytic and inflammatory parameters (level of different hemoglobins, LDH, total bilirubin and
reticulocyte, leukocyte and platelet counts) were obtained and the concordance of analytical methods
and reference values between hospitals was confirmed. These data were then analyzed considering the
same three above mentioned phenotypic groups: Control, Stroke and Risk. Differences between the
distributions of analytical parameters were assessed by Wilcox-Mann-Whitney test, at 95%
significance, comparing groups two at a time. Differences in %HbF distribution, considering its
influence in %HbS, and its genetic modulation were also studied by Fisher’s exact test and Odds
Ratio, at 95% significance.
III.3.1. “HbSF” phenotype is responsible for the low %HbS in this population
Analytical data collected showed that the mean %HbS in this population was 80.6%, with a
minimum value of 61.4% and a maximum value of 97.5%. As mentioned earlier, both SS and Sβ0-thal
patients usually present HbS > 85% (see Table I.1, page 8) which means that in the present population
the mean %HbS is lower than expected. This can be explained by the high levels of HbF found among
these patients, 36 of which presented the “HbSF” phenotype, that is, HbF > 10% (see Chp. I –
Introduction, page 21).
If the population is divided in two groups, at the cut-off value HbF = 10% (high HbF ≥ 10%; low
HbF < 10%), the distributions of %HbS are significantly different, at 95% confidence, either between
overall population of study and low HbF group (p-value = 0.006) or high HbF group (p-value =
0.005). Between the two groups, the difference is also, and more evidently, significant (p-value =
1.81x10⁻⁶
). These distributions are shown Figure III.16. Lower %HbS (mean = 74.95; median = 73.85)
are found in the high HbF group, whilst higher %HbS (mean = 86.44; median = 87.30) are found in
the low HbF group.
Figure III.16.: Distributions of %HbS in the total population of study and the “High HbF” and “Low
HbF” groups. In all groups considered mean and median values are similar. The lowest %HbS values are found
in the group with HbF ≥ 10% (“High HbF”). These individuals present the HbSF phenotype. The highest %HbS
values are found in the group with HbF < 10% (“Low HbF”). These individuals present the expected HbS > 85%
for SCD.
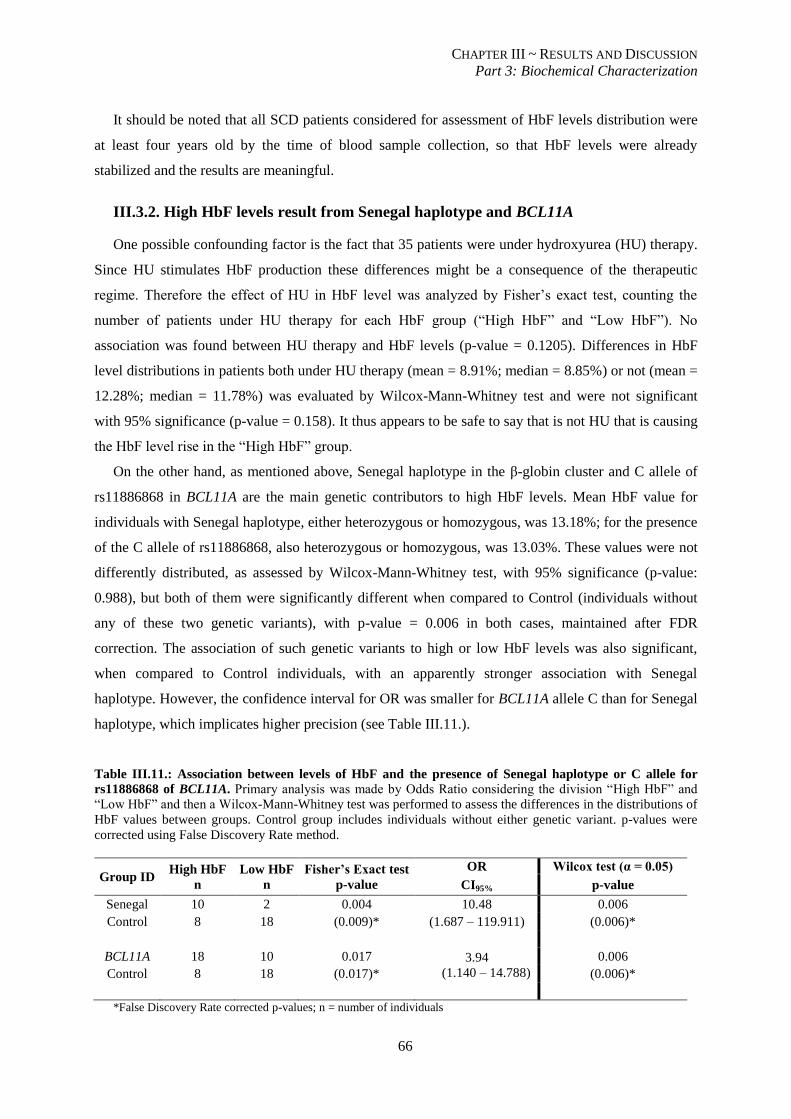
CHAPTER III ~ RESULTS AND DISCUSSION
Part 3: Biochemical Characterization
66
It should be noted that all SCD patients considered for assessment of HbF levels distribution were
at least four years old by the time of blood sample collection, so that HbF levels were already
stabilized and the results are meaningful.
III.3.2. High HbF levels result from Senegal haplotype and BCL11A
One possible confounding factor is the fact that 35 patients were under hydroxyurea (HU) therapy.
Since HU stimulates HbF production these differences might be a consequence of the therapeutic
regime. Therefore the effect of HU in HbF level was analyzed by Fisher’s exact test, counting the
number of patients under HU therapy for each HbF group (“High HbF” and “Low HbF”). No
association was found between HU therapy and HbF levels (p-value = 0.1205). Differences in HbF
level distributions in patients both under HU therapy (mean = 8.91%; median = 8.85%) or not (mean =
12.28%; median = 11.78%) was evaluated by Wilcox-Mann-Whitney test and were not significant
with 95% significance (p-value = 0.158). It thus appears to be safe to say that is not HU that is causing
the HbF level rise in the “High HbF” group.
On the other hand, as mentioned above, Senegal haplotype in the β-globin cluster and C allele of
rs11886868 in BCL11A are the main genetic contributors to high HbF levels. Mean HbF value for
individuals with Senegal haplotype, either heterozygous or homozygous, was 13.18%; for the presence
of the C allele of rs11886868, also heterozygous or homozygous, was 13.03%. These values were not
differently distributed, as assessed by Wilcox-Mann-Whitney test, with 95% significance (p-value:
0.988), but both of them were significantly different when compared to Control (individuals without
any of these two genetic variants), with p-value = 0.006 in both cases, maintained after FDR
correction. The association of such genetic variants to high or low HbF levels was also significant,
when compared to Control individuals, with an apparently stronger association with Senegal
haplotype. However, the confidence interval for OR was smaller for BCL11A allele C than for Senegal
haplotype, which implicates higher precision (see Table III.11.).
Table III.11.: Association between levels of HbF and the presence of Senegal haplotype or C allele for
rs11886868 of BCL11A. Primary analysis was made by Odds Ratio considering the division “High HbF” and
“Low HbF” and then a Wilcox-Mann-Whitney test was performed to assess the differences in the distributions of
HbF values between groups. Control group includes individuals without either genetic variant. p-values were
corrected using False Discovery Rate method.
Group ID High HbF
n
Low HbF
n
Fisher’s Exact test
p-value
OR Wilcox test (α = 0.05)
CI95% p-value
Senegal 10 2 0.004 10.48 0.006
Control 8 18 (0.009)* (1.687 – 119.911) (0.006)*
BCL11A 18 10 0.017 3.94
(1.140 – 14.788)
0.006
Control 8 18 (0.017)* (0.006)*
*False Discovery Rate corrected p-values; n = number of individuals
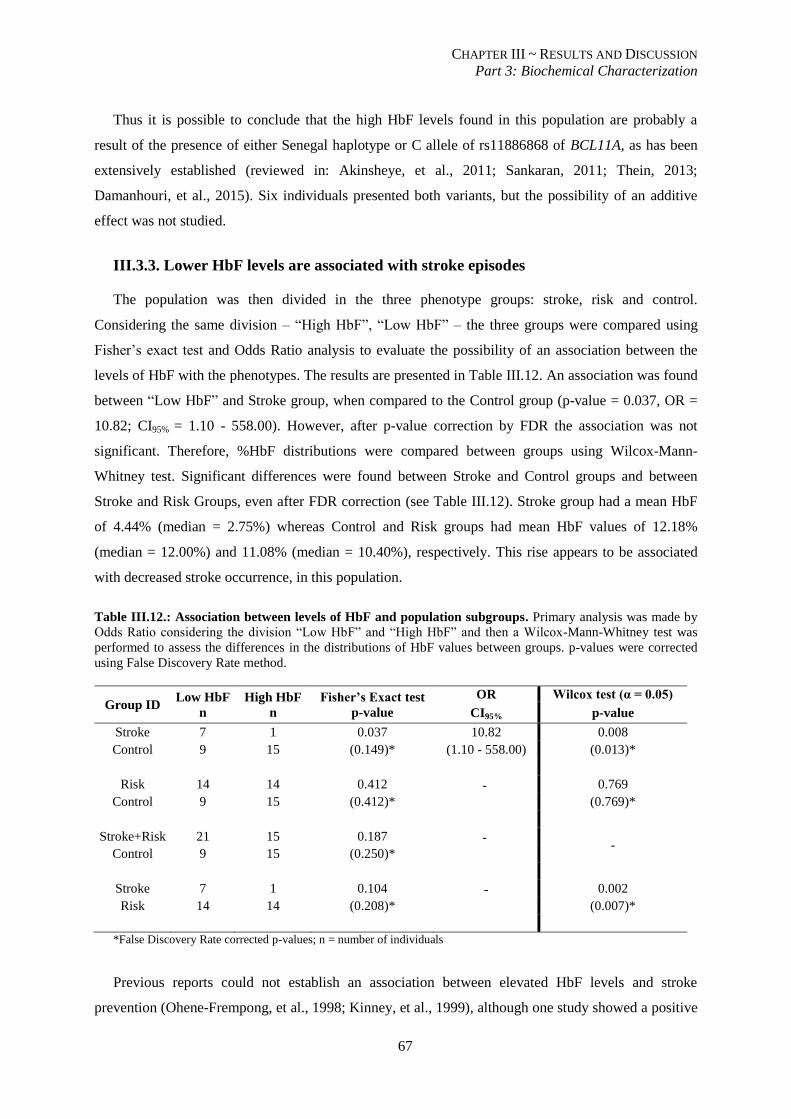
CHAPTER III ~ RESULTS AND DISCUSSION
Part 3: Biochemical Characterization
67
Thus it is possible to conclude that the high HbF levels found in this population are probably a
result of the presence of either Senegal haplotype or C allele of rs11886868 of BCL11A, as has been
extensively established (reviewed in: Akinsheye, et al., 2011; Sankaran, 2011; Thein, 2013;
Damanhouri, et al., 2015). Six individuals presented both variants, but the possibility of an additive
effect was not studied.
III.3.3. Lower HbF levels are associated with stroke episodes
The population was then divided in the three phenotype groups: stroke, risk and control.
Considering the same division – “High HbF”, “Low HbF” – the three groups were compared using
Fisher’s exact test and Odds Ratio analysis to evaluate the possibility of an association between the
levels of HbF with the phenotypes. The results are presented in Table III.12. An association was found
between “Low HbF” and Stroke group, when compared to the Control group (p-value = 0.037, OR =
10.82; CI95% = 1.10 - 558.00). However, after p-value correction by FDR the association was not
significant. Therefore, %HbF distributions were compared between groups using Wilcox-Mann-
Whitney test. Significant differences were found between Stroke and Control groups and between
Stroke and Risk Groups, even after FDR correction (see Table III.12). Stroke group had a mean HbF
of 4.44% (median = 2.75%) whereas Control and Risk groups had mean HbF values of 12.18%
(median = 12.00%) and 11.08% (median = 10.40%), respectively. This rise appears to be associated
with decreased stroke occurrence, in this population.
Table III.12.: Association between levels of HbF and population subgroups. Primary analysis was made by
Odds Ratio considering the division “Low HbF” and “High HbF” and then a Wilcox-Mann-Whitney test was
performed to assess the differences in the distributions of HbF values between groups. p-values were corrected
using False Discovery Rate method.
Group ID Low HbF
n
High HbF
n
Fisher’s Exact test
p-value
OR Wilcox test (α = 0.05)
CI95% p-value
Stroke 7 1 0.037 10.82 0.008
Control 9 15 (0.149)* (1.10 - 558.00) (0.013)*
Risk 14 14 0.412 -
0.769
Control 9 15 (0.412)* (0.769)*
Stroke+Risk 21 15 0.187 -
-
Control 9 15 (0.250)*
Stroke 7 1 0.104 -
0.002
Risk 14 14 (0.208)* (0.007)*
*False Discovery Rate corrected p-values; n = number of individuals
Previous reports could not establish an association between elevated HbF levels and stroke
prevention (Ohene-Frempong, et al., 1998; Kinney, et al., 1999), although one study showed a positive
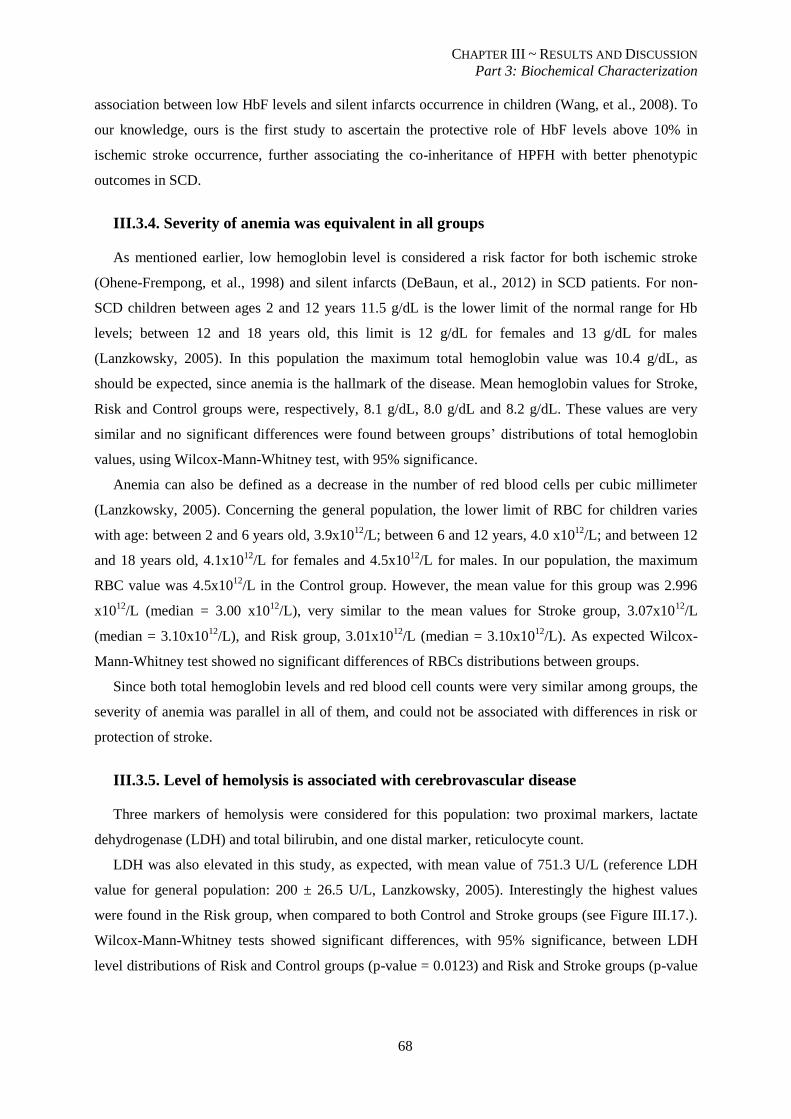
CHAPTER III ~ RESULTS AND DISCUSSION
Part 3: Biochemical Characterization
68
association between low HbF levels and silent infarcts occurrence in children (Wang, et al., 2008). To
our knowledge, ours is the first study to ascertain the protective role of HbF levels above 10% in
ischemic stroke occurrence, further associating the co-inheritance of HPFH with better phenotypic
outcomes in SCD.
III.3.4. Severity of anemia was equivalent in all groups
As mentioned earlier, low hemoglobin level is considered a risk factor for both ischemic stroke
(Ohene-Frempong, et al., 1998) and silent infarcts (DeBaun, et al., 2012) in SCD patients. For non-
SCD children between ages 2 and 12 years 11.5 g/dL is the lower limit of the normal range for Hb
levels; between 12 and 18 years old, this limit is 12 g/dL for females and 13 g/dL for males
(Lanzkowsky, 2005). In this population the maximum total hemoglobin value was 10.4 g/dL, as
should be expected, since anemia is the hallmark of the disease. Mean hemoglobin values for Stroke,
Risk and Control groups were, respectively, 8.1 g/dL, 8.0 g/dL and 8.2 g/dL. These values are very
similar and no significant differences were found between groups’ distributions of total hemoglobin
values, using Wilcox-Mann-Whitney test, with 95% significance.
Anemia can also be defined as a decrease in the number of red blood cells per cubic millimeter
(Lanzkowsky, 2005). Concerning the general population, the lower limit of RBC for children varies
with age: between 2 and 6 years old, 3.9x10¹²
/L; between 6 and 12 years, 4.0 x10¹²
/L; and between 12
and 18 years old, 4.1x10¹²
/L for females and 4.5x10¹²
/L for males. In our population, the maximum
RBC value was 4.5x10¹²
/L in the Control group. However, the mean value for this group was 2.996
x1012
/L (median = 3.00 x10¹²
/L), very similar to the mean values for Stroke group, 3.07x10¹²
/L
(median = 3.10x10¹²
/L), and Risk group, 3.01x10¹²
/L (median = 3.10x10¹²
/L). As expected Wilcox-
Mann-Whitney test showed no significant differences of RBCs distributions between groups.
Since both total hemoglobin levels and red blood cell counts were very similar among groups, the
severity of anemia was parallel in all of them, and could not be associated with differences in risk or
protection of stroke.
III.3.5. Level of hemolysis is associated with cerebrovascular disease
Three markers of hemolysis were considered for this population: two proximal markers, lactate
dehydrogenase (LDH) and total bilirubin, and one distal marker, reticulocyte count.
LDH was also elevated in this study, as expected, with mean value of 751.3 U/L (reference LDH
value for general population: 200 ± 26.5 U/L, Lanzkowsky, 2005). Interestingly the highest values
were found in the Risk group, when compared to both Control and Stroke groups (see Figure III.17.).
Wilcox-Mann-Whitney tests showed significant differences, with 95% significance, between LDH
level distributions of Risk and Control groups (p-value = 0.0123) and Risk and Stroke groups (p-value
CHAPTER III ~ RESULTS AND DISCUSSION
Part 3: Biochemical Characterization
69
= 0.0262). However, only the difference between Risk and Control groups’ distribution sustained
significance, with 95% significance, after FDR correction (p-value = 0.0493).
Kato, et al., 2006 demonstrated that in patients with SCD at steady state, 71% of total LDH was
composed of isoenzymes LDH-1 and LDH-2, consistent with red blood cell origin after intravascular
hemolysis. They proposed that LDH elevation might operate as an indirect marker of HED
subphenotype. Actually, in another study that same year, Kato et al. showed an association between
concurrent cerebrovascular disease and pulmonary hypertension with most severe hemolysis, as
indicated by very high levels of LDH at steady state (Kato, et al., 2006b). Additionally, O'Driscoll, et
al., 2008 showed a significant correlation between serum LDH-1 levels and TAMMV, suggesting once
again that hemolysis might be underlying mechanism responsible for development cerebrovascular
disease. A possible explanation (as mentioned in Chp. I – Introduction, pages 11-12) is NO depletion,
due to hemolysis. LDH has been associated with the level of NO consumption activity and blood
plasma and with endothelial-derived adhesion molecules, markers of endothelial activation, normally
repressed by NO (Kato, et al., 2006).
Figure III.17.: Distributions of LDH values in the 3 phenotype groups. The three boxplots presented
show a clear difference in the distributions of LDH values in Risk group when compared to Stroke or Control
groups. Risk group values are considerably higher. Mean and median values are similar for Control and Stroke
groups, although the latter presents a less dispersed distribution.
As far as we know, no reports of LDH association with overt stroke occurrence were found in SCD
populations. Overall, the results obtained in this study are in accordance with previous reports of an
association between serum LDH levels and cerebrovascular disease, with endothelial dysfunction and
high TCD velocities, well-established risk factors for overt stroke events. These findings are
suggestive of an association between proximal hemolysis markers and the early stages of vasculopaty.
Considering the whole population under study, mean value of total bilirubin was 3.078 mg/dL
(reference values for overall population used in HDE/CHLC: 0.2 – 1.2 mg/dL). No significant
differences were found between the distributions and median values of total bilirubin among groups,
although Stroke group present a slightly higher mean (3.546 mg/dL) than Risk and Control groups
(2.966 mg/dL and 2.957 mg/dL respectively).
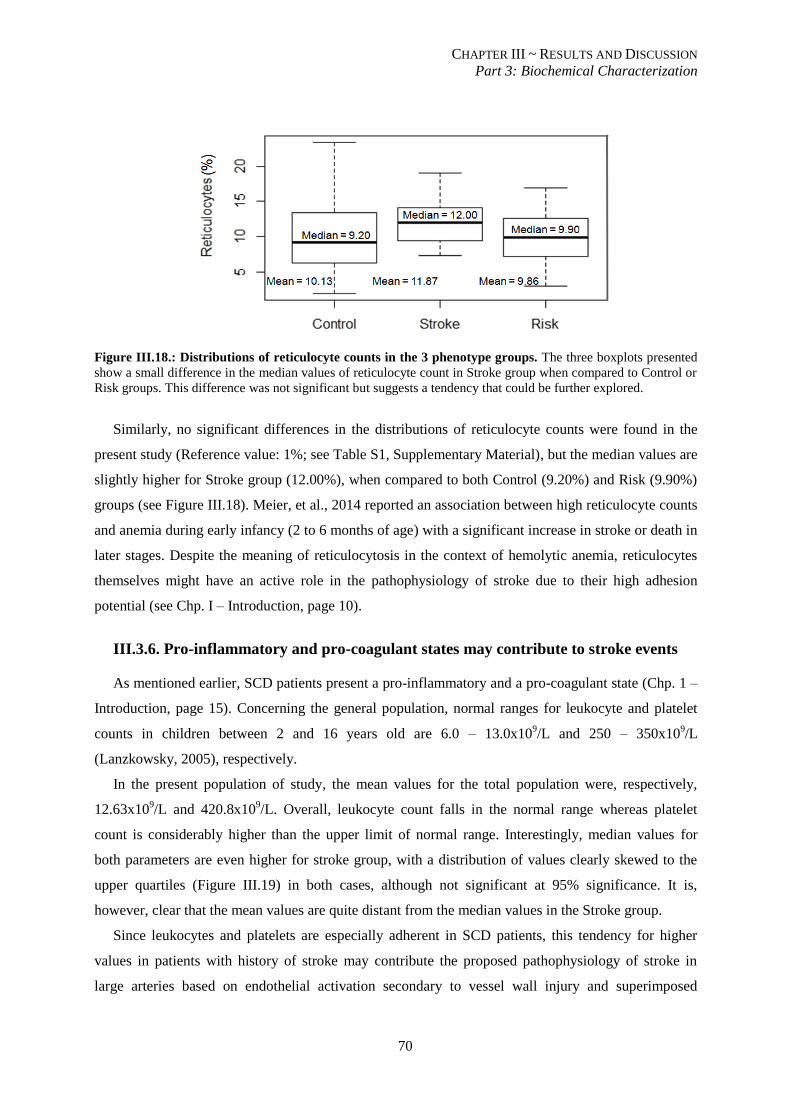
CHAPTER III ~ RESULTS AND DISCUSSION
Part 3: Biochemical Characterization
70
Figure III.18.: Distributions of reticulocyte counts in the 3 phenotype groups. The three boxplots presented
show a small difference in the median values of reticulocyte count in Stroke group when compared to Control or
Risk groups. This difference was not significant but suggests a tendency that could be further explored.
Similarly, no significant differences in the distributions of reticulocyte counts were found in the
present study (Reference value: 1%; see Table S1, Supplementary Material), but the median values are
slightly higher for Stroke group (12.00%), when compared to both Control (9.20%) and Risk (9.90%)
groups (see Figure III.18). Meier, et al., 2014 reported an association between high reticulocyte counts
and anemia during early infancy (2 to 6 months of age) with a significant increase in stroke or death in
later stages. Despite the meaning of reticulocytosis in the context of hemolytic anemia, reticulocytes
themselves might have an active role in the pathophysiology of stroke due to their high adhesion
potential (see Chp. I – Introduction, page 10).
III.3.6. Pro-inflammatory and pro-coagulant states may contribute to stroke events
As mentioned earlier, SCD patients present a pro-inflammatory and a pro-coagulant state (Chp. 1 –
Introduction, page 15). Concerning the general population, normal ranges for leukocyte and platelet
counts in children between 2 and 16 years old are 6.0 – 13.0x10⁹/L and 250 – 350x10
9/L
(Lanzkowsky, 2005), respectively.
In the present population of study, the mean values for the total population were, respectively,
12.63x10⁹/L and 420.8x10
9/L. Overall, leukocyte count falls in the normal range whereas platelet
count is considerably higher than the upper limit of normal range. Interestingly, median values for
both parameters are even higher for stroke group, with a distribution of values clearly skewed to the
upper quartiles (Figure III.19) in both cases, although not significant at 95% significance. It is,
however, clear that the mean values are quite distant from the median values in the Stroke group.
Since leukocytes and platelets are especially adherent in SCD patients, this tendency for higher
values in patients with history of stroke may contribute the proposed pathophysiology of stroke in
large arteries based on endothelial activation secondary to vessel wall injury and superimposed
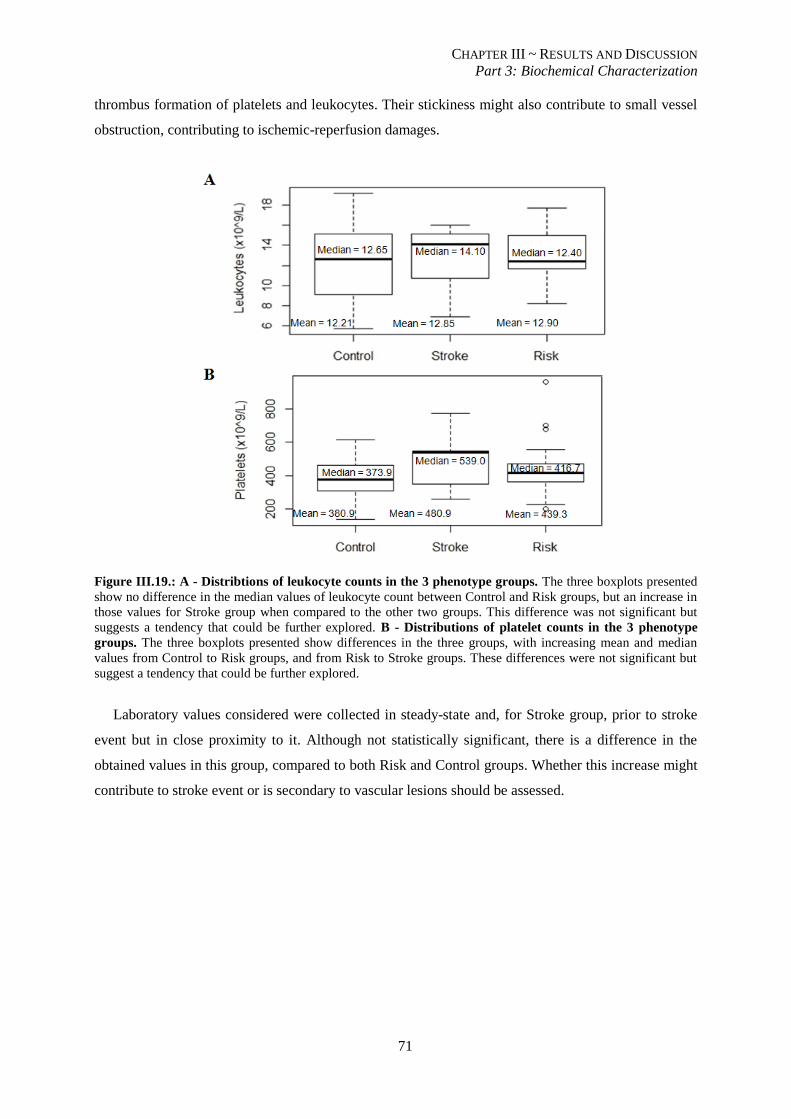
CHAPTER III ~ RESULTS AND DISCUSSION
Part 3: Biochemical Characterization
71
thrombus formation of platelets and leukocytes. Their stickiness might also contribute to small vessel
obstruction, contributing to ischemic-reperfusion damages.
Figure III.19.: A - Distribtions of leukocyte counts in the 3 phenotype groups. The three boxplots presented
show no difference in the median values of leukocyte count between Control and Risk groups, but an increase in
those values for Stroke group when compared to the other two groups. This difference was not significant but
suggests a tendency that could be further explored. B - Distributions of platelet counts in the 3 phenotype
groups. The three boxplots presented show differences in the three groups, with increasing mean and median
values from Control to Risk groups, and from Risk to Stroke groups. These differences were not significant but
suggest a tendency that could be further explored.
Laboratory values considered were collected in steady-state and, for Stroke group, prior to stroke
event but in close proximity to it. Although not statistically significant, there is a difference in the
obtained values in this group, compared to both Risk and Control groups. Whether this increase might
contribute to stroke event or is secondary to vascular lesions should be assessed.
CONCLUDING REMARKS
AND FUTURE PERSPECTIVES
72
CONCLUDING REMARKS
The present study evaluated 66 children, between 4 and 16 years old, with sickle cell disease for
the presence of 23 genetic variants in 12 genes. These included the co-inheritance of α-thalassemia
and hereditary persistence of fetal hemoglobin, two well-established modulators of the severity of the
disease. Eight of the genes studied were disease modulator candidates, chosen due to their role in
vascular cell adhesion, vascular tonus and inflammation, all of which have been suggested as
intervening factors for the development of vasculopathy in SCD.
Our population presented Hardy-Weinberg disequilibrium in four polymorphisms: rs2292305 of
THBS-1, which presented excess heterozygosity, probably as a result of carrier advantage in these
patients; and rs1799983 of NOS3, rs5370 of ET-1 and rs1800629 of TNF-α, all of which presented
excess homozygosity. This is known as the Wahlund effect and is thought to occur due to unknown
population stratification. These genetic variants were disregarded for the remaining analyses.
In the present study, most of the genetic variants found to be in Hardy-Weinberg equilibrium were
not associated to stroke risk or prevention, including co-inheritance of α-thalassemia and VCAM-1
SNPs, both in the promoter and in the gene, which have been implicated as risk modifier variants in
previous studies. However, VCAM-1 T allele of rs1409419, NOS3 C allele of rs2070744, 4a allele of
VNTR 27 bp, and HMOX-1 L allele of rs30774372 showed a potential role in modifying stroke risk.
To our knowledge, VCAM-1 T allele of rs1409419 has not yet been studied, either for implications
in stroke risk or through functional studies to assess its biological function. In the present study, it was
positively associated to stroke risk when compared to control individuals, but further studies should be
performed to confirm this result and to try to associate it with a biological role of this variant.
Haplotype-associated analyses showed that in the absence of other genetic modifications studied in the
promoter, T allele relates to stroke events and C allele was more frequent in Control subjects.
eNOS has been extensively implicated in vasculopathy and stroke due to its biological role.
Production of NO is of major importance to maintain a correct vascular tonus, which in SCD is
skewed towards vasoconstriction, as a result of a net resistance to NO. Therefore, genetic variants in
NOS3 that further decrease basal NO levels can be very deleterious in SCD patients. C allele of
rs2070744 and 4a allele of VNTR 27 bp are associated to lower NO levels and have been implicated in
the development of vasculopathy and stroke. In our study, these findings were once again confirmed,
by their higher incidence in patients with history of or at risk for stroke. Haplotype #1, containing C
and 4a alleles, respectively, was considered a risk haplotype. Haplotype #5, containing T and 4b
alleles, respectively, was contradictory associated to both Control and Stroke groups, when compared
to Risk. These findings might be the result of a dual effect of said haplotype, since it contains one
genetic variant that has been associated to lower transcription efficiency and one genetic variant
CONCLUDING REMARKS
AND FUTURE PERSPECTIVES
73
previously associated to a lower hemolytic rate. Nevertheless, this study reinforced the relevance of
NO bioavailability in modulating the severity of clinical manifestations of SCD.
As such, a possible explanation for the association to stroke of HMOX-1 L allele of rs30774372 is
also a decreased rate of transcription of the gene that leads to lower circulating HO-1. Without this
enzyme, free heme is not removed and further scavenges NO molecules. Also, CO is not produced and
cannot aid in vasodilation. So HMOX-1 variants might also influence NO bioavailability, further
decreasing NO levels and contributing to the vasoconstriction skew.
Of the utmost importance, this was the first study, to our knowledge, to evidence a protective role
of HbF in stroke occurrence. The population under study presented significantly different levels of
HbF, the lower of which were associated to individuals with a history of stroke. The rise of HbF levels
found in 36 patients was essentially due to either Senegal haplotype in the β-globin cluster or the
presence of C allele of rs11886868 of BCL11A.
This study also contributed to the line of evidence that stroke is a consequence of the hemolysis-
endothelial-dysfunction subphenotype of SCD. Significantly higher LDH levels were associated to
Risk group, which means that this proximal hemolytic marker was closely related with establishment
of vasculopathy, as assessed by high cerebral blood flow velocities on TCD screening and the
presence of silent cerebral infarcts on cerebral MRI. These associations have been previously reported
and were once again confirmed.
Although the distributions were not significantly distinct, median values showed a clear tendency
to higher reticulocyte, leukocyte and platelet counts in Stroke group, when compared to both Risk and
Control groups. Since all of these circulating cells have been implicated in the pathophysiology of
vasculopathy and stroke, this tendency should not be overlooked. It would be very interesting to
further investigate this line of evidence, with a higher number of children and more careful analytical
data collection.
Should these last two findings be confirmed, a temporal line for the establishment of
cerebrovascular accidents could be drawn: a proximal marker of hemolysis, LDH, is implicated in the
development of cerebral vasculopathy, suggesting an early influence of the hemolytic rate in the
primordial stages of vessel damage. With chronic hemolysis, high reticulocyte formation occurs and
thus this distal marker of hemolysis appears correlated to the final outcome of vasculopathy: ischemic
cerebrovascular accidents. The proinflammatory and procoagulant state of these patients is also
essential to such outcome, and in this study, we showed that there are tendentiously higher counts of
leukocytes and platelets in more severe cases of cerebral vasculopathy.
CONCLUDING REMARKS
AND FUTURE PERSPECTIVES
74
FUTURE PERSPECTIVES
In the present study several promising conclusions were drawn, considering the influences of
genetic, biochemical and hematological parameters in one of the most devastating outcomes of sickle
cell disease: ischemic stroke in pediatric ages. However, a lot remains to be explained and explored.
Much of the gathered information throughout this study can be further and more deeply and
accurately analyzed. Every conclusion should be replicated and supported by functional studies of the
genetic variants studied. More careful data collection from hospitals should be obtained and
extensively treated. Studies should also be designed to try to establish an association between the
biochemical findings and the genetic variants proposed. If these patients present reticulocytosis,
leukocytosis and thrombocytosis, in addition to higher expression of adhesion molecules, genetic
variants in such molecules could modulate these cell adhesion strengths. Additionally, some of those
genetic variants have been associated to different hemolytic rates and should thus be further explored,
in order to try to assess causality. Due to a lack of time such careful analysis was not performed.
Despite growing evidences, the pathophysiology of cerebral vasculopathy and stroke secondary to
SCD is still unclear. Contradictory findings also delay the unequivocal determination of risk factors,
whether genetic, biochemical or environmental.
It has been extensively shown that the geographical background exerts a very significant role in
selecting genetic variants. This leads to relevant genetic discrepancies between the diverse SCD
populations that are continuously studied and undermines possible conclusions, since they are not
prone to replication in other studies. These population differences should be carefully assessed in
order to eliminate possible confounding factors or, conversely, to establish different protective features
characteristic to each particular population or subgroup.
A long way is yet to be roamed in order to fully comprehend such a complex disease as sickle cell
anemia and why it presents so differently between patients. The genetic background of each individual
certainly contributes to such heterogeneity, but is not the sole influence. Nevertheless, should specific
genetic variants be unequivocally associated to particular sickle cell disease subphenotypes, it would
be easier to timely establish preventive procedures or to select more targeted therapies, ultimately
contributing to a global life improvement of these patients.
LITERATURE CITED
75
LITERATURE CITED
Abraham, D. & Dashwood, M., 2008. Endothelin - role in vascular disease. Rheumatology (Oxford), 47
Suppl 5: v23 - 24.
Adams, R. J., 2007. Big strokes in small people. 64(11): 1567 - 1574.
Akar, N. et al., 1999 . Endothelial nitric oxide synthase intron 4, 27 bp repeat polymorphism in Turkish
patients with deep vein thrombosis and cerebrovascular accidents. Thrombosis Research, 94(1): 63 - 64.
Akinsheye, I. et al., 2011. Fetal hemoglobin in sickle cell anemia. Blood, 118(1): 19 – 27.
Alves, J. et al., 2010. Analysis of malaria associated genetic traits in Cabo Verde, a melting pot of
European and sub Saharan settlers. Blood Cells Mol Dis. , 44(1): 62 - 68.
Antonarakis, S. E., Kazazian, H. H. & Orkin, S. H., 1985. DNA polymorphism and molecular pathology
of the human globin gene clusters. Hum Genet., 69: 1 - 14.
Asbeutah, A. et al., 2014. Transcranial doppler and brain MRI in children with sickle cell disease and
high hemoglobin F levels. Pediatr Blood Cancer., 61: 25 - 28.
Bean, C. J. et al., 2012. Heme oxygenase-1 gene promoter polymorphism is associated with reduced
incidence of acute chest syndrome among children with sickle cell disease. Blood, 120(18): 3822 - 3828.
Belisário, A. R. et al., 2015. Association of alpha-thalassemia, TNF-alpha (-308G>A) and VCAM-1
(c.1238G>C) gene polymorphisms with cerebrovascular disease in a newborn cohort of 411 children with
sickle cell anemia. Blood Cells Mol Dis., 54(1): 44 - 50.
Beschorner, R. et al., 2000. Long-term expression of heme oxygenase-1 (HO-1, HSP-32) following
focal cerebral infarctions and traumatic brain injury in humans.. Acta Neuropathol, 100(4): 377 - 384.
Cajado, C. et al., 2011. TNF-alpha and IL-8: serum levels and gene polymorphisms (-308G>A and -
251A>T) are associated with classical biomarkers and medical history in children with sickle cell anemia..
Cytokine, 56(2): 312 - 317.
Cao, A. & Galanello, R., 2010. Beta-thalassemia. Genet Med., 12(2): 61 - 76.
Casella, J. et al., 2010. Design of the silent cerebral infarct transfusion (SIT) trial. Pediatr Hematol
Oncol , 27(2): 69 - 89.
Chen, H., Lowrey, C. H. & Stamatoyannopoulos, G., 1997. Analysis of enhancer function of the HS-40
core sequence of the human alpha-globin cluster. Nucleic Acids Res., 25(14): 2917 - 2922..
Coelho, A. et al., 2014. Genetic variation in CD36, HBA, NOS3 and VCAM1 is associated with chronic
haemolysis level in sickle cell anaemia: a longitudinal study. Eur J Haematol , 92(3): 237 - 243.
Cooke, G. E., Doshi, A. & Binkley, P. F., 2007. Endothelial nitric oxide synthase gene: prospects for
treatment of heart disease. Pharmacogenomics, 8(12): 1723 - 1734.
Cooke, G. E., Doshi, A. & Binkley, P. F., 2007. Endothelial nitric oxide synthase gene: prospects for
treatment of heart disease.. Pharmacogenomics, 8(12): 1723 - 1734.
Cybulsky, M. I. et al., 1991. Gene structure, chromosomal location, and basis for alternative mRNA
splicing of the human VCAM1 gene. PNAS, 88(17): 7859 – 7863.
Damanhouri, G. A. et al., 2015. Clinical biomarkers in sickle cell disease. Saudi J Biol Sci, 22: 24 - 31.
LITERATURE CITED
76
DeBaun, M. R. et al., 2012. Silent cerebral infarcts: a review on a prevalent and progressive cause of
neurologic injury. 119(20): 4587 - 4596.
Dodé, C., Krishnamoorthy, R., Lamb, J. & Rochette, J., 1993. Rapid analysis of -alpha 3.7 thalassaemia
and alpha alpha alpha anti 3.7 triplication by enzymatic amplification analysis.. Br J Haematol., 83(1):105 -
111.
Domingos, I. F. et al., 2014. Influence of beta-S haplotype and alpha-thalassemia in stroke development
in a Brazilian population with sickle cell anemia. Ann Hemtol., 93: 1123 - 1129.
Durante, W., 2003. Heme oxygenase-1 in growth control and its clinical application to vascular disease.
J Cell Physiol, 195(3): 373 - 382.
Fasano, R. M., Meier, E. R. & Hulbert, M. L., 2015. Cerebral vasculopathy in children with sickle cell
anemia. Blood Cells Mol Dis., 54: 17 - 25.
Faulcon, L. M. et al., 2013. Thrombospondin-1 and L-selectin are associated with silent cerebral infarct
in children with sickle cell anaemia.. Br J Haematol., 162(3): 421 - 424.
Ferreira, A. et al., 2011. Sickle hemoglobin confers tolerance to Plasmodium infection. Cell, 145: 398 –
409.
Flanagan, J. M. et al., 2011. Genetic predictors for stroke in children with sickle cell anemia. Blood,
117(24): 6681 - 6684.
Fredenburgh, L. E., Perrella, M. A. & Mitsialis, S. A., 2007. The role of heme oxygenase-1 in
pulmonary disease. Am J Respir Cell Mol Biol., 36(2): 158 - 165.
Funk, M. et al., 2004. The effect of a promoter polymorphism in the heme oxygenase-1 gene on the risk
of ischaemic cerebrovascular events: the influence of other vascular risk factors.. Thromb Res., 113(3-4):
217 - 223.
Garnier-Géré, P. & Chikhi, L., 2013. Population Subdivision, Hardy–Weinberg Equilibrium and the
Wahlund Effect.. eLS.
Gaston, M. et al., 1987. Recruitment in the Cooperative Study of Sickle Cell Disease (CSSCD). Control
Clin Trials., 8(4 Suppl): 131S - 140S.
Gee, B. E. & Platt, O. S., 1995. Sickle reticulocytes adhere to VCAM-1.. Blood, pp. 85(1): 268 - 274.
Grewal, R. P. et al., 2007 . The intron 4c allele of the NOS3 gene is associated with ischemic stroke in
African Americans. BMC Med Genet., 8: 76 - 80.
Hajeer, A. H. & Hutchinson, I. V., 2000 . TNF-alpha gene polymorphism: clinical and biological
implications.. Microsc Res Tech. , 50(3): 216 - 228.
Hibi, K. et al., 1998. Endothelial nitric oxide synthase gene polymorphism and acute myocardial
infarction.. Hypertension, 32(3): 521 - 526.
Higgs, D. R. et al., 2005. Understanding alpha-globin gene regulation: aiming to improve the
management of thalassemia. Ann N Y Acad Sci., Vol. 1054: 92–102.
Higgs, D. R. & Gibbons, R. J., 2010. The molecular basis of alpha-thalassemia: A model for
understanding human molecular genetics. Hematol. Oncol. Clin. N. Am., 24: 1033 – 1054.
LITERATURE CITED
77
Hoppe, C. et al., 2004. Gene interactions and stroke risk in children with sickle cell anemia.. Blood,
103(6): 2391 - 2396.
Hoppe, C. et al., 2007. Confirmation of an association between the TNF(-308) promoter polymorphism
and stroke risk in children with sickle cell anemia. Stroke, Vol. 38(8): 2241 - 2246.
Idelman, G. et al., 2007. Functional profiling of uncommon VCAM1 promoter polymorphisms
prevalent in African American populations.. Hum Mutat., 28(8): 824 - 829.
Jaffe, E., Bornstein, P. & Disteche, C. M., 1990. Mapping of the thrombospondin gene to human
chromosome 15 and mouse chromosome 2 by in situ hybridization. Genomics, Vol. 7(1): 123 - 126.
Kassim, A. A. & DeBaun, M. R., 2013. Sickle cell disease, vasculopathy and therapeutics. Annu Rev
Med., Vol. 64: 451 - 466.
Kato, G. J., Gladwin, M. T. & Steinberg, M. H., 2007. Deconstructing sickle cell disease: Reappraisal of
the role of hemolysis in the development of clinical subphenotypes. Blood Rev., Vol. 21(1): 37 - 47.
Kato, G. J. et al., 2006b. Cerebrovascular disease associated with sickle cell pulmonary hypertension..
Am J Hematol., 81(7): 503 - 510.
Kato, G. J. et al., 2006. Lactate dehydrogenase as a biomarker of hemolysis-associated nitric oxide
resistance, priapism, leg ulceration, pulmonary hypertension, and death in patients with sickle cell disease.
107(6): 2279 - 2285 .
Kelm, M., Preik-Steinhoff, H., Preik, M. & Strauer, B. E., 1999. Serum nitrite sensitively reflects
endothelial NO formation in human forearm vasculature: evidence for biochemical assessment of the
endothelial L-arginine-NO pathway. Cardiovasc Res., Vol. 41(3): 765 - 772.
Kimpara, T. et al., 1997. Microsatellite polymorphism in the human heme oxygenase-1 gene promoter
and its application in association studies with Alzheimer and Parkinson disease. Hum Genet. , 100(1): 145 -
147..
Kinney, T. R. et al., 1999. Silent Cerebral Infarcts in Sickle Cell Anemia: A Risk Factor Analysis.
Pediatrics. , 103(3): 640 - 645.
Kumar, V., Abbas, A. K. & Aster, J. C., 2013. Chapter 11 - Hematopoietic and Lymphoid Systems. In:
Robbins Basic Pathology. 9th ed. s.l.:Elsevier, Canada, 407 - 425.
Lanzkowsky, P., 2005. Manual of Pediatric Hematology and Oncology. 4th Ed. ed. s.l.:Elsevier
Academic Press.
Lavinha, J. et al., 1992. Importation route of the sickle cell trait into Portugal: contribution of molecular
epidemiology. Hum Biol., 64(6): 891 - 901.
Liao, Y. C. et al., 2008. Segment-specific genetic effects on carotid intima-media thickness: the
Northern Manhattan study. Stroke, 39(12): 3159 - 3165.
Liu, Z. et al., 2015. Thrombospondin-1 (TSP1) Contributes to the Development of Vascular
Inflammation by Regulating Monocytic Cell Motility in Mouse Models of Abdominal Aortic Aneurysm..
Circ Res. , ii: CIRCRESAHA.114.305262.
Martins, M. C. et al., 1993. Hereditary anaemias in Portugal: epidemiology, public health significance,
and control. J Med Genet., 30(3): 235–239.
LITERATURE CITED
78
Meier, E., Wright, E. C. & Miller, J. L., 2014. Reticulocytosis and anemia are associated with an
increased risk of death and stroke in the newborn cohort of the Cooperative Study of Sickle Cell Disease.
Am J Hematol , 89(9): 904 - 906.
Miranda, A. et al., 2013. Estudo Bioquímico de Portadores de Hemoglobinopatias. INSA - artigos
breves, 6: 16 - 18.
Nakayama, M. et al., 1999. T-786-->C mutation in the 5'-flanking region of the endothelial nitric oxide
synthase gene is associated with coronary spasm.. Circulation, 99(22): 2864 - 2870.
Nelson, D. L. & Cox, M. M., 2005. Lehninger Principles of Biochemistry. 4th ed. s.l.:s.n.
Netter, F. H., 2006. Atlas of Human Anatomy. 4th Ed. ed. s.l.:Saunders - Elsevier.
Nussbaum, R. L., McInnes, R. R. & Willard, H. F., 2007. Chapter 11 - Principles of Molecular Disease:
Lessons from Hemoglobinopathies. In: Thompson & Thompson Genetics in Medicine. 7th ed. s.l.:Saunders
(Elsevier), Canada, 323 - 342.
Nussbaum, R. L., McInnes, R. R. & Willard, H. F., 2007. Chapter 11 - Principles of Molecular Disease:
Lessons from Hemoglobinopathies. In: Thompson & Thompson Genetics in Medicine. 7th ed. s.l.:Saunders
(Elsevier), Canada, 323 - 342.
Odièvre, M. H. et al., 2008. Modulation of erythroid adhesion receptor expression by hydroxyurea in
children. Haematologica, 93(4): 502 - 510.
O'Driscoll, S., Height, S. E., Dick, M. C. & C., R. D., 2008. Serum lactate dehydrogenase activity as a
biomarker in children with sickle cell disease.. Br J Haematol, 140(2): 206 - 209.
Ohene-Frempong, K. et al., 1998. Cerebrovascular accidents in sickle cell disease: rates and risk factors.
Blood, Vol. 91(1): 288 - 294.
O'Leary, D. H. et al., 1999. Carotid-artery intima and media thickness as a risk factor for myocardial
infarction and stroke in older adults. Cardiovascular Health Study Collaborative Research Group. N Engl J
Med, 340(1): 14 - 22.
Pagnier, J. et al., 1984. Evidence for the multicentric origin of the sickle cell hemoglobin gene in Africa.
PNAS, 81: 1771-1773.
Pechlaner, R. et al., 2015. Heme oxygenase-1 gene promoter microsatellite polymorphism is associated
with progressive atherosclerosis and incident cardiovascular disease. Arterioscler Thromb Vasc Biol.,
35(1): 229 - 236.
Perrey, C. et al., 1999. ARMS-PCR methodologies to determine IL-10, TNF-alpha, TNF-beta and TGF-
beta 1 gene polymorphisms. Transpl Immunol., 7(2): 127 - 128..
Rać, M. E., Safranow, K. & Poncyljusz, W., 2007 . Molecular basis of human CD36 gene mutations.
Mol Med., 13(5-6): 288 - 296.
Rajput, C. et al., 2006. Endothelin-1 gene variants and levels associate with adaptation to hypobaric
hypoxia in high-altitude natives. Biochem Biophys Res Commun, 341(4): 1218 - 1224.
Razin, S. et al., 2012. Domains of alpha and beta-globin genes in the context of the structural-functional
organization of the eukaryotic genome. Biochemistry (Mosc)., 77(13): 1409 - 1423..
LITERATURE CITED
79
Rumaney, M. B. et al., 2014. The co-inheritance of alpha-thalassemia and sickle cell anemia is
associated with better hematological indices and lower consultations rate in Cameroonian patients and
could improve their survival.. PLoS One, 9(6): e100516.
Sankaran, V. G., 2011. Targeted therapeutic strategies for fetal hemoglobin induction. Hematology Am
Soc Hematol Educ Program., 2011: 459 - 465.
Schnog, J. B. et al., 2004. Sickle Cell Disease; a general overview. Neth J Med., 62(10): 364 - 374.
Shibahara, S., 2003. The heme oxygenase dilemma in cellular homeostasis: new insights for the
feedback regulation of heme catabolism.. Tohoku J Exp Med., 200(4):167 - 186.
Stamatoyannopoulos, G., 2005. Control of globin gene expression during development and erythroid
differentiation. Exp Hematol, 33: 259 – 271.
Steinberg, M. H., 1984. Review: the sickle hemoglobinopathies--genetic analyses of common
phenocopies and new molecular approaches to treatment. Am J Med Sci., 288(4): 169 - 174.
Steinberg, M. H., 2009. Genetic Etiologies for Phenotypic Diversity in Sickle Cell Anemia.
ScientificWorldJournal, Vol. 9: 46 - 67.
Stockman, J. A., Nigro, M. A., Mishkin, M. M. & Oski, F. A., 1972. Occlusion of large cerebral vessels
in sickle-cell anemia. N Engl J Med., 287(17): 846 - 849.
Swerlick, R. A. et al., 1993. Alpha 4 beta 1-integrin expression on sickle reticulocytes: vascular cell
adhesion molecule-1-dependent binding to endothelium.. Blood, 82(6): 1891 - 1899.
Switzer, J. A., Hess, D. C., Nichols, F. T. & Adams, R. J., 2006. Pathophysiology and treatment of
stroke in sickle-cell disease: present and future. Lancet Neurol., Vol. 5: 501 - 512.
Taha, H. et al., 2010. Role of heme oxygenase-1 in human endothelial cells: lesson from the promoter
allelic variants.. Arterioscler Thromb Vasc Biol., 30(8): 1634 - 1641.
Tantawy, A. A., Adly, A. A., Ismail, E. A. & Aly, S. H., 2015. Endothelial nitric oxide synthase gene
intron 4 VNTR polymorphism in sickle cell disease: relation to vasculopathy and disease severity.. Pediatr
Blood Cancer, 62(3): 389 - 394.
Tao, H. M. & Chen, G. Z., 2009. Endothelial NO synthase gene polymorphisms and risk of ischemic
stroke: a meta-analysis. Neurosci Res, 64(3): 311 - 316.
Taylor, J. G. et al., 2002. Variants in the VCAM1 gene and risk for symptomatic stroke in sickle cell
disease. Blood, 100(13): 4303 - 4309.
Thangarajh, M. et al., 2012. Magnetic resonance angiography-defined intracranial vasculopathy is
associated with silent cerebral infarcts and glucose-6-phosphate dehydrogenase mutation in children with
sickle cell anaemia. Br J Haematol., 159(3): 352 - 359.
Thein, S. L., 2013. Genetic associaton studies in beta-hemoglobinopathies.. Hematology Am Soc
Hematol Educ Program., 2013: 354 - 361.
Thomas, B. N. et al., 2013. Extensive Ethnogenomic Diversity of Endothelial Nitric Oxide Synthase
(eNOS) Polymorphisms. Gene Regul Syst Bio., 7: 1 – 10 .
Tsukada, T. et al., 1998. Evidence of association of the ecNOS gene polymorphism with plasma NO
metabolite levels in humans.. Biochem Biophys Res Commun, 245(1):190-193.
LITERATURE CITED
80
Uda, M. et al., 2008. Genome-wide association study shows BCL11A associated with persistent fetal
hemoglobin and amelioration of the phenotype of beta-thalassemia. PNAS, 105(5): 1620 - 1625.
van der Land, V. et al., 2013. Markers of endothelial dysfunction differ between subphenotypes in
children with sickle cell disease. Thromb Res., 132(6): 712 - 717.
Verduzco, L. A. & Nathan, D. G., 2009. Sickle cell disease and stroke. Blood, 114(15): 5117 - 5125.
Wang, J., Dudley, D. & Wang, X. L., 2002. Haplotype-specific effects on endothelial NO synthase
promoter efficiency: modifiable by cigarette smoking.. Arterioscler Thromb Vasc Biol., 22(5): e1 - e4.
Wang, M., Jiang, X., Wu, W. & Zhang, D., 2013 . Association of G894T polymorphism in endothelial
nitric oxide synthase gene with the risk of ischemic stroke: A meta-analysis. Biomed Rep., 1(1): 144 - 150.
Wang, W. C. et al., 2008. MRI abnormalities of the brain in one-year-old children with sickle cell
anemia. Pediatr Blood Cancer, 51: 643 – 646.
Wang, X. L. & Wang, J., 2000. Endothelial nitric oxide synthase gene sequence variations and vascular
disease.. Mol Genet Metab., 70(4): 241 - 251.
Weatheral, D. J. & Clegg, J. B., 1976. Molecular genetics of human hemoglobin. Annu Rev Genet., 10:
156 - 178.
Yoshimura, M. et al., 1998. A missense Glu298Asp variant in the endothelial nitric oxide synthase gene
is associated with coronary spasm in the Japanese.. Hum Genet, 103(1): 65 - 69.

i
SUPPLEMENTAL
MATERIAL

SUPPLEMENTAL MATERIAL
ii
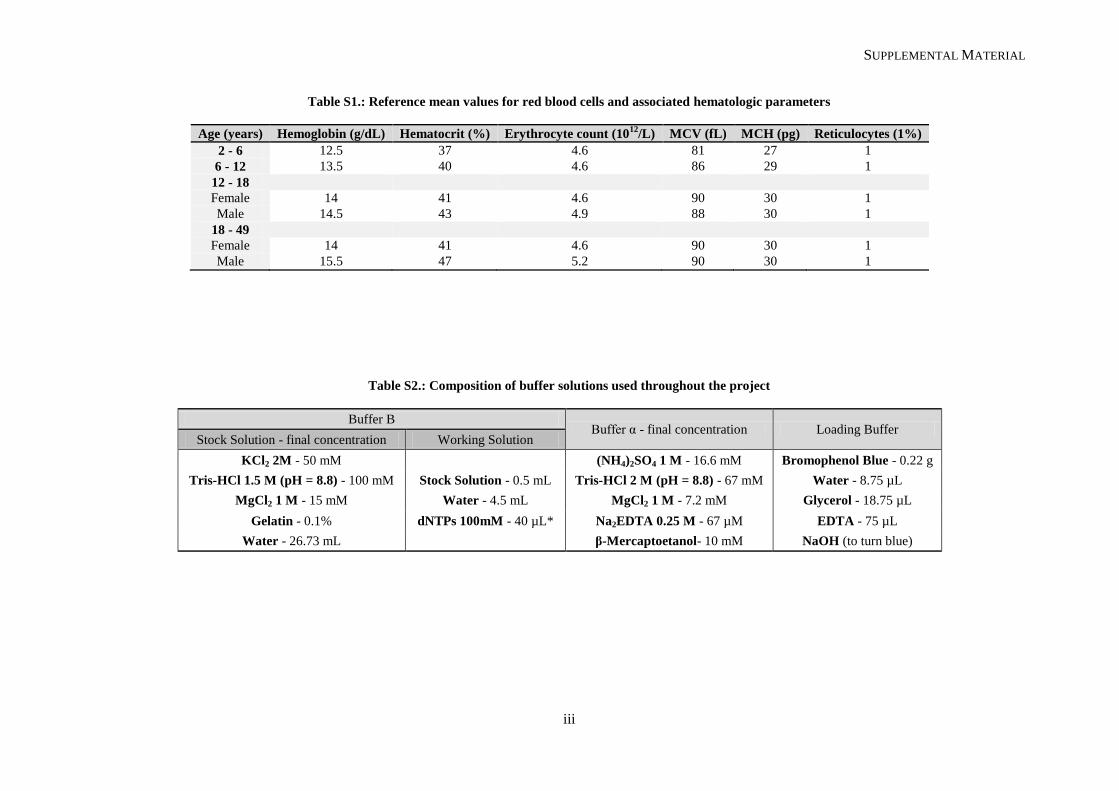
SUPPLEMENTAL MATERIAL
iii
Table S1.: Reference mean values for red blood cells and associated hematologic parameters
Age (years) Hemoglobin (g/dL) Hematocrit (%) Erythrocyte count (1012
/L) MCV (fL) MCH (pg) Reticulocytes (1%)
2 - 6 12.5 37 4.6 81 27 1
6 - 12 13.5 40 4.6 86 29 1
12 - 18
Female 14 41 4.6 90 30 1
Male 14.5 43 4.9 88 30 1
18 - 49
Female 14 41 4.6 90 30 1
Male 15.5 47 5.2 90 30 1
Table S2.: Composition of buffer solutions used throughout the project
Buffer B Buffer α - final concentration Loading Buffer
Stock Solution - final concentration Working Solution
KCl2 2M - 50 mM
(NH4)2SO4 1 M - 16.6 mM Bromophenol Blue - 0.22 g
Tris-HCl 1.5 M (pH = 8.8) - 100 mM Stock Solution - 0.5 mL Tris-HCl 2 M (pH = 8.8) - 67 mM Water - 8.75 µL
MgCl2 1 M - 15 mM Water - 4.5 mL MgCl2 1 M - 7.2 mM Glycerol - 18.75 µL
Gelatin - 0.1% dNTPs 100mM - 40 µL* Na2EDTA 0.25 M - 67 µM EDTA - 75 µL
Water - 26.73 mL
β-Mercaptoetanol- 10 mM NaOH (to turn blue)
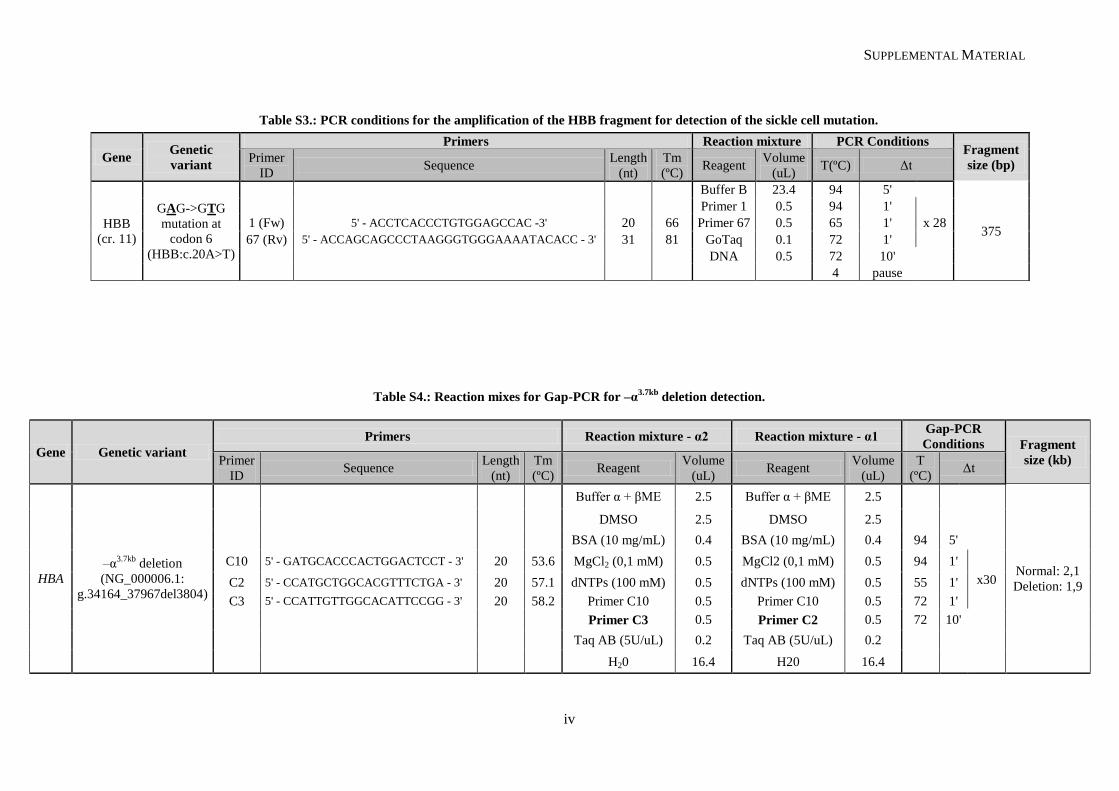
SUPPLEMENTAL MATERIAL
iv
Table S3.: PCR conditions for the amplification of the HBB fragment for detection of the sickle cell mutation.
Table S4.: Reaction mixes for Gap-PCR for –α3.7kb
deletion detection.
Gene Genetic
variant
Primers Reaction mixture PCR Conditions Fragment
size (bp) Primer
ID Sequence
Length
(nt)
Tm
(ºC) Reagent
Volume
(uL) T(ºC) Δt
HBB
(cr. 11)
GAG->GTG
mutation at
codon 6
(HBB:c.20A>T)
Buffer B 23.4 94 5'
375
Primer 1 0.5 94 1'
x 28 1 (Fw) 5' - ACCTCACCCTGTGGAGCCAC -3' 20 66 Primer 67 0.5 65 1'
67 (Rv) 5' - ACCAGCAGCCCTAAGGGTGGGAAAATACACC - 3' 31 81 GoTaq 0.1 72 1'
DNA 0.5 72 10'
4 pause
Gene Genetic variant
Primers Reaction mixture - α2 Reaction mixture - α1 Gap-PCR
Conditions Fragment
size (kb) Primer
ID Sequence
Length
(nt)
Tm
(ºC) Reagent
Volume
(uL) Reagent
Volume
(uL)
T
(ºC) Δt
HBA
–α3.7kb
deletion
(NG_000006.1:
g.34164_37967del3804)
Buffer α + βME 2.5 Buffer α + βME 2.5
Normal: 2,1
Deletion: 1,9
DMSO 2.5 DMSO 2.5
BSA (10 mg/mL) 0.4 BSA (10 mg/mL) 0.4 94 5'
C10 5' - GATGCACCCACTGGACTCCT - 3' 20 53.6 MgCl2 (0,1 mM) 0.5 MgCl2 (0,1 mM) 0.5 94 1'
x30 C2 5' - CCATGCTGGCACGTTTCTGA - 3' 20 57.1 dNTPs (100 mM) 0.5 dNTPs (100 mM) 0.5 55 1'
C3 5' - CCATTGTTGGCACATTCCGG - 3' 20 58.2 Primer C10 0.5 Primer C10 0.5 72 1'
Primer C3 0.5 Primer C2 0.5 72 10'
Taq AB (5U/uL) 0.2 Taq AB (5U/uL) 0.2
H20 16.4 H20 16.4
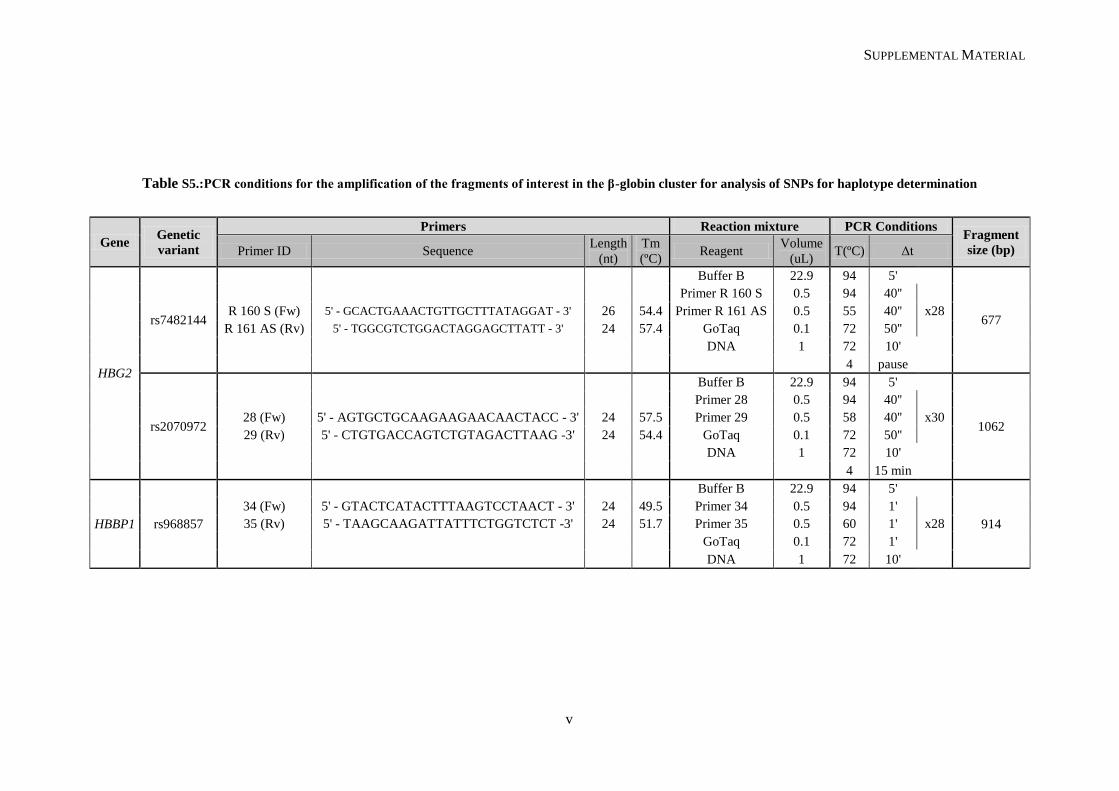
SUPPLEMENTAL MATERIAL
v
Table S5.:PCR conditions for the amplification of the fragments of interest in the β-globin cluster for analysis of SNPs for haplotype determination
Gene Genetic
variant
Primers Reaction mixture PCR Conditions Fragment
size (bp) Primer ID Sequence Length
(nt)
Tm
(ºC) Reagent
Volume
(uL) T(ºC) Δt
HBG2
rs7482144
Buffer B 22.9 94 5'
677
Primer R 160 S 0.5 94 40''
x28 R 160 S (Fw) 5' - GCACTGAAACTGTTGCTTTATAGGAT - 3' 26 54.4 Primer R 161 AS 0.5 55 40''
R 161 AS (Rv) 5' - TGGCGTCTGGACTAGGAGCTTATT - 3' 24 57.4 GoTaq 0.1 72 50''
DNA 1 72 10'
4 pause
rs2070972
Buffer B 22.9 94 5'
1062
Primer 28 0.5 94 40''
x30 28 (Fw) 5' - AGTGCTGCAAGAAGAACAACTACC - 3' 24 57.5 Primer 29 0.5 58 40''
29 (Rv) 5' - CTGTGACCAGTCTGTAGACTTAAG -3' 24 54.4 GoTaq 0.1 72 50''
DNA 1 72 10'
4 15 min
HBBP1 rs968857
Buffer B 22.9 94 5'
914
34 (Fw) 5' - GTACTCATACTTTAAGTCCTAACT - 3' 24 49.5 Primer 34 0.5 94 1'
x28 35 (Rv) 5' - TAAGCAAGATTATTTCTGGTCTCT -3' 24 51.7 Primer 35 0.5 60 1'
GoTaq 0.1 72 1'
DNA 1 72 10'
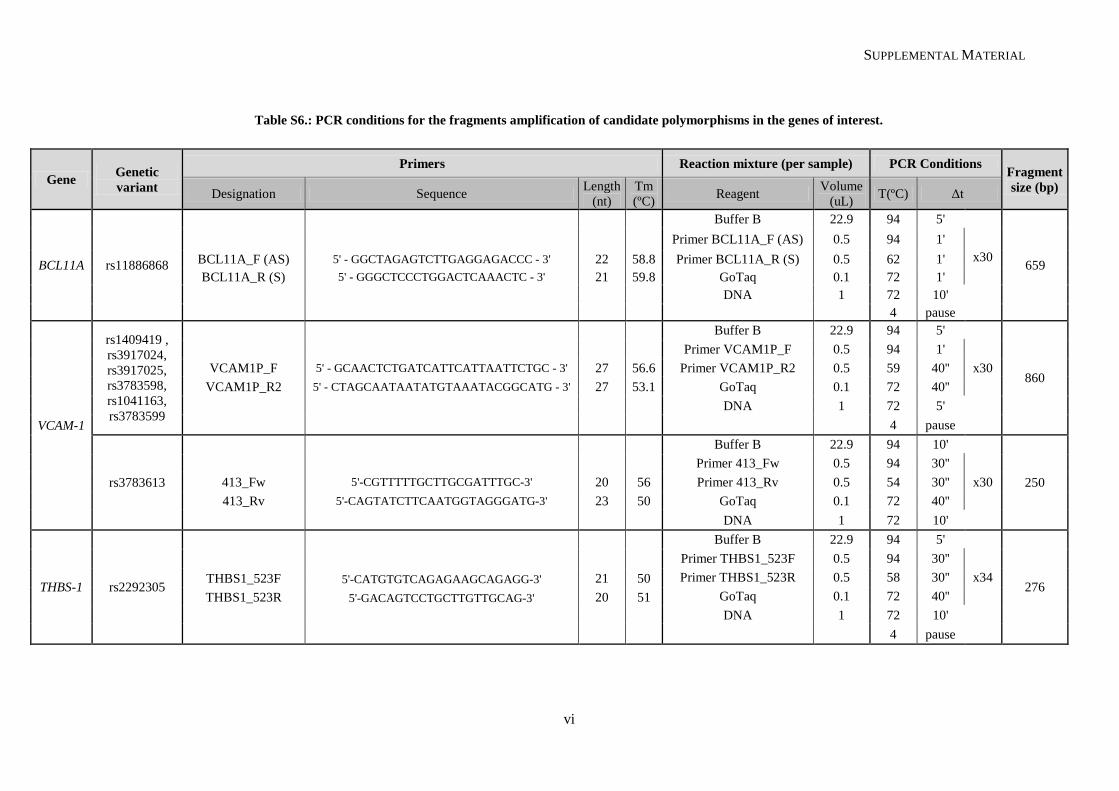
SUPPLEMENTAL MATERIAL
vi
Table S6.: PCR conditions for the fragments amplification of candidate polymorphisms in the genes of interest.
Gene Genetic
variant
Primers Reaction mixture (per sample) PCR Conditions Fragment
size (bp) Designation Sequence
Length
(nt)
Tm
(ºC) Reagent
Volume
(uL) T(ºC) Δt
BCL11A rs11886868
Buffer B 22.9 94 5'
659
Primer BCL11A_F (AS) 0.5 94 1'
x30 BCL11A_F (AS) 5' - GGCTAGAGTCTTGAGGAGACCC - 3' 22 58.8 Primer BCL11A_R (S) 0.5 62 1'
BCL11A_R (S) 5' - GGGCTCCCTGGACTCAAACTC - 3' 21 59.8 GoTaq 0.1 72 1'
DNA 1 72 10'
4 pause
VCAM-1
rs1409419 ,
rs3917024,
rs3917025,
rs3783598,
rs1041163,
rs3783599
Buffer B 22.9 94 5'
860
Primer VCAM1P_F 0.5 94 1'
x30 VCAM1P_F 5' - GCAACTCTGATCATTCATTAATTCTGC - 3' 27 56.6 Primer VCAM1P_R2 0.5 59 40''
VCAM1P_R2 5' - CTAGCAATAATATGTAAATACGGCATG - 3' 27 53.1 GoTaq 0.1 72 40''
DNA 1 72 5'
4 pause
rs3783613
Buffer B 22.9 94 10'
250
Primer 413_Fw 0.5 94 30''
x30 413_Fw 5'-CGTTTTTGCTTGCGATTTGC-3' 20 56 Primer 413_Rv 0.5 54 30''
413_Rv 5'-CAGTATCTTCAATGGTAGGGATG-3' 23 50 GoTaq 0.1 72 40''
DNA 1 72 10'
THBS-1 rs2292305
Buffer B 22.9 94 5'
276
Primer THBS1_523F 0.5 94 30''
x34 THBS1_523F 5'-CATGTGTCAGAGAAGCAGAGG-3' 21 50 Primer THBS1_523R 0.5 58 30''
THBS1_523R 5'-GACAGTCCTGCTTGTTGCAG-3' 20 51 GoTaq 0.1 72 40''
DNA 1 72 10'
4 pause
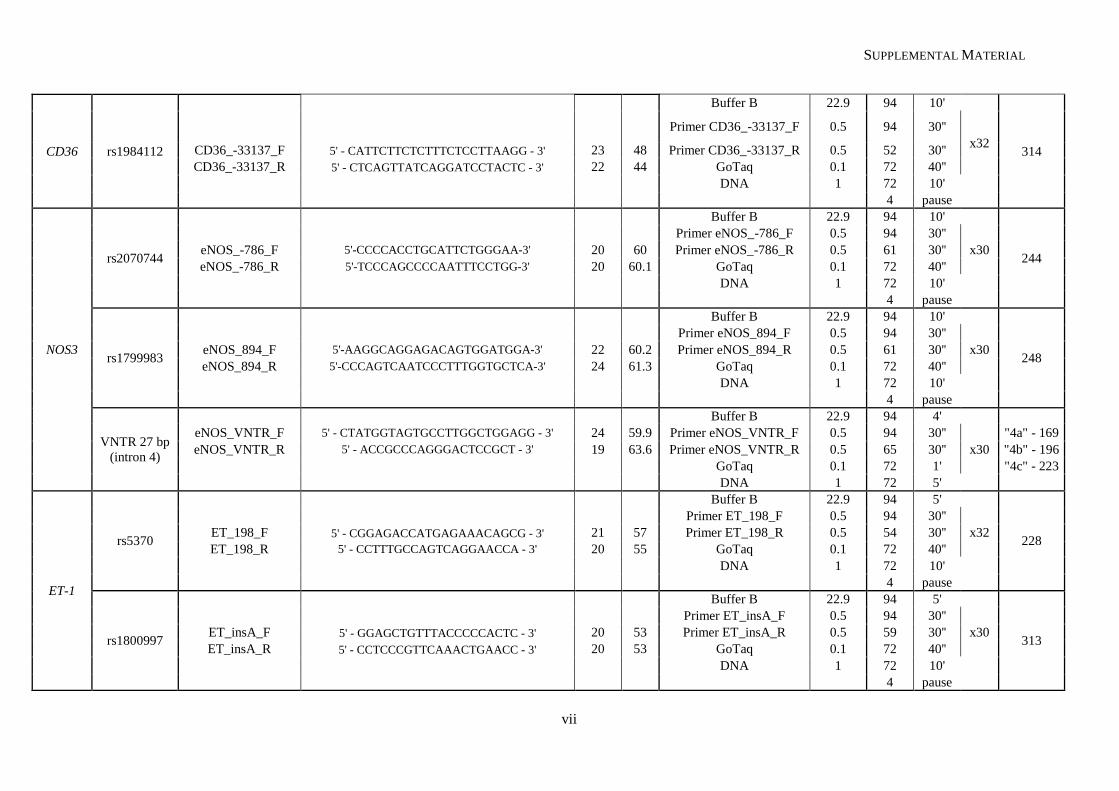
SUPPLEMENTAL MATERIAL
vii
CD36 rs1984112
Buffer B 22.9 94 10'
314
Primer CD36_-33137_F 0.5 94 30''
x32 CD36_-33137_F 5' - CATTCTTCTCTTTCTCCTTAAGG - 3' 23 48 Primer CD36_-33137_R 0.5 52 30''
CD36_-33137_R 5' - CTCAGTTATCAGGATCCTACTC - 3' 22 44 GoTaq 0.1 72 40''
DNA 1 72 10'
4 pause
NOS3
rs2070744
Buffer B 22.9 94 10'
244
Primer eNOS_-786_F 0.5 94 30''
x30 eNOS_-786_F 5'-CCCCACCTGCATTCTGGGAA-3' 20 60 Primer eNOS_-786_R 0.5 61 30''
eNOS_-786_R 5'-TCCCAGCCCCAATTTCCTGG-3' 20 60.1 GoTaq 0.1 72 40''
DNA 1 72 10'
4 pause
rs1799983
Buffer B 22.9 94 10'
248
Primer eNOS_894_F 0.5 94 30''
x30 eNOS_894_F 5'-AAGGCAGGAGACAGTGGATGGA-3' 22 60.2 Primer eNOS_894_R 0.5 61 30''
eNOS_894_R 5'-CCCAGTCAATCCCTTTGGTGCTCA-3' 24 61.3 GoTaq 0.1 72 40''
DNA 1 72 10'
4 pause
VNTR 27 bp
(intron 4)
Buffer B 22.9 94 4'
eNOS_VNTR_F 5' - CTATGGTAGTGCCTTGGCTGGAGG - 3' 24 59.9 Primer eNOS_VNTR_F 0.5 94 30''
x30
"4a" - 169
eNOS_VNTR_R 5' - ACCGCCCAGGGACTCCGCT - 3' 19 63.6 Primer eNOS_VNTR_R 0.5 65 30'' "4b" - 196
GoTaq 0.1 72 1' "4c" - 223
DNA 1 72 5'
ET-1
rs5370
Buffer B 22.9 94 5'
228
Primer ET_198_F 0.5 94 30''
x32 ET_198_F 5' - CGGAGACCATGAGAAACAGCG - 3' 21 57 Primer ET_198_R 0.5 54 30''
ET_198_R 5' - CCTTTGCCAGTCAGGAACCA - 3' 20 55 GoTaq 0.1 72 40''
DNA 1 72 10'
4 pause
rs1800997
Buffer B 22.9 94 5'
313
Primer ET_insA_F 0.5 94 30''
x30 ET_insA_F 5' - GGAGCTGTTTACCCCCACTC - 3' 20 53 Primer ET_insA_R 0.5 59 30''
ET_insA_R 5' - CCTCCCGTTCAAACTGAACC - 3' 20 53 GoTaq 0.1 72 40''
DNA 1 72 10'
4 pause
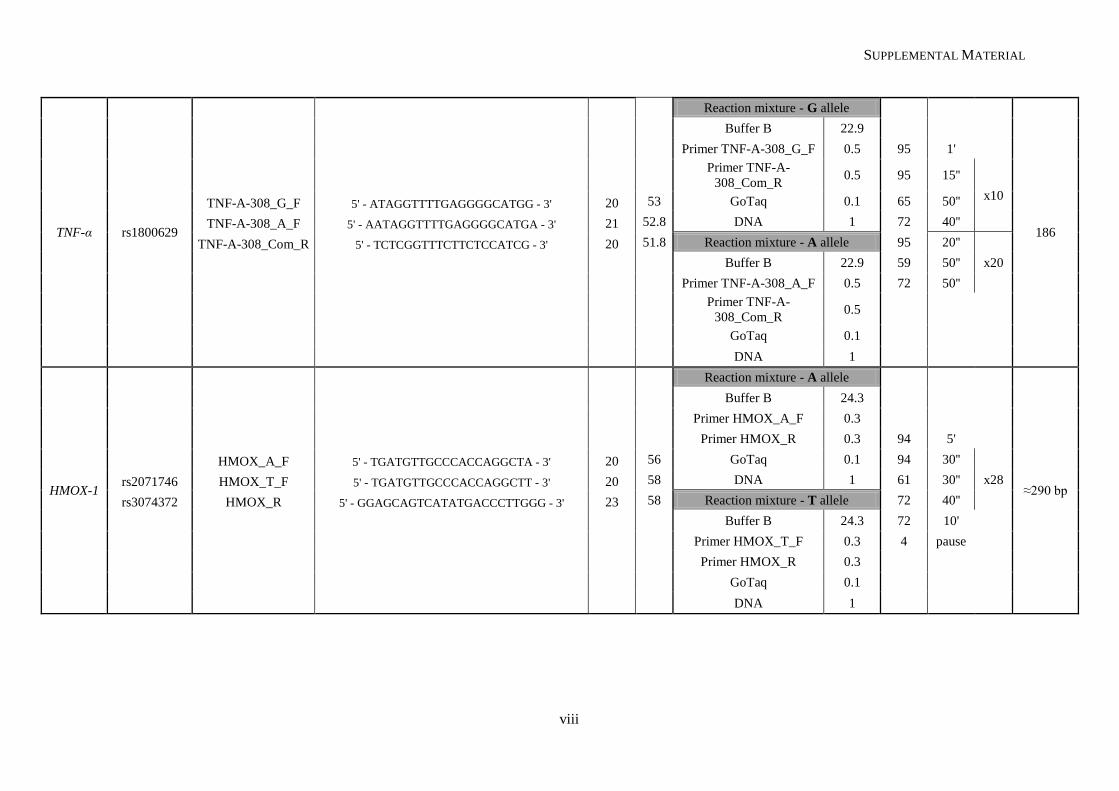
SUPPLEMENTAL MATERIAL
viii
TNF-α rs1800629
Reaction mixture - G allele
186
Buffer B 22.9
Primer TNF-A-308_G_F 0.5 95 1'
Primer TNF-A-
308_Com_R 0.5 95 15''
x10 TNF-A-308_G_F 5' - ATAGGTTTTGAGGGGCATGG - 3' 20 53 GoTaq 0.1 65 50''
TNF-A-308_A_F 5' - AATAGGTTTTGAGGGGCATGA - 3' 21 52.8 DNA 1 72 40''
TNF-A-308_Com_R 5' - TCTCGGTTTCTTCTCCATCG - 3' 20 51.8 Reaction mixture - A allele 95 20''
x20
Buffer B 22.9 59 50''
Primer TNF-A-308_A_F 0.5 72 50''
Primer TNF-A-
308_Com_R 0.5
GoTaq 0.1
DNA 1
HMOX-1
Reaction mixture - A allele
≈290 bp
Buffer B 24.3
Primer HMOX_A_F 0.3
Primer HMOX_R 0.3 94 5'
HMOX_A_F 5' - TGATGTTGCCCACCAGGCTA - 3' 20 56 GoTaq 0.1 94 30''
x28 rs2071746 HMOX_T_F 5' - TGATGTTGCCCACCAGGCTT - 3' 20 58 DNA 1 61 30''
rs3074372 HMOX_R 5' - GGAGCAGTCATATGACCCTTGGG - 3' 23 58 Reaction mixture - T allele 72 40''
Buffer B 24.3 72 10'
Primer HMOX_T_F 0.3 4 pause
Primer HMOX_R 0.3
GoTaq 0.1
DNA 1
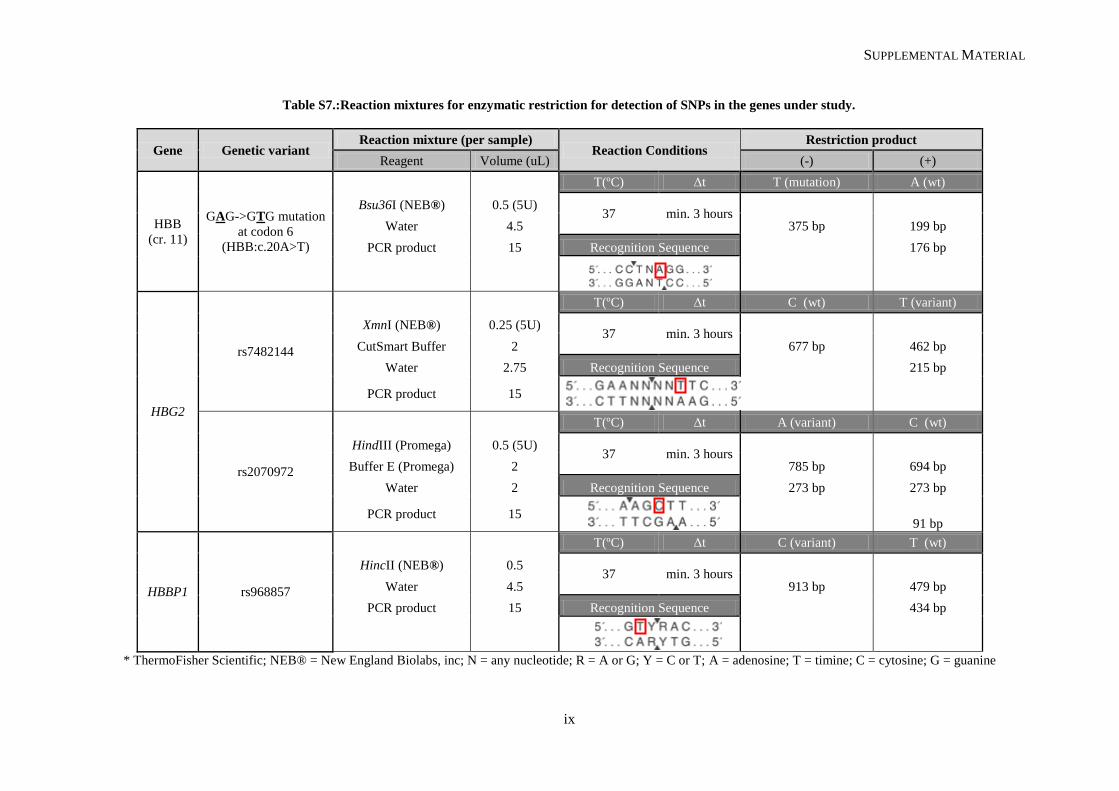
SUPPLEMENTAL MATERIAL
ix
Table S7.:Reaction mixtures for enzymatic restriction for detection of SNPs in the genes under study.
Gene Genetic variant Reaction mixture (per sample)
Reaction Conditions Restriction product
Reagent Volume (uL) (-) (+)
HBB
(cr. 11)
GAG->GTG mutation
at codon 6
(HBB:c.20A>T)
T(ºC) Δt T (mutation) A (wt)
Bsu36I (NEB®) 0.5 (5U) 37 min. 3 hours
Water 4.5 375 bp 199 bp
PCR product 15 Recognition Sequence
176 bp
HBG2
rs7482144
T(ºC) Δt C (wt) T (variant)
XmnI (NEB®) 0.25 (5U) 37 min. 3 hours
CutSmart Buffer 2 677 bp 462 bp
Water 2.75 Recognition Sequence
215 bp
PCR product 15
rs2070972
T(ºC) Δt A (variant) C (wt)
HindIII (Promega) 0.5 (5U) 37 min. 3 hours
Buffer E (Promega) 2 785 bp 694 bp
Water 2 Recognition Sequence 273 bp 273 bp
PCR product 15
91 bp
HBBP1 rs968857
T(ºC) Δt C (variant) T (wt)
HincII (NEB®) 0.5 37 min. 3 hours
Water 4.5 913 bp 479 bp
PCR product 15 Recognition Sequence
434 bp
* ThermoFisher Scientific; NEB® = New England Biolabs, inc; N = any nucleotide; R = A or G; Y = C or T; A = adenosine; T = timine; C = cytosine; G = guanine
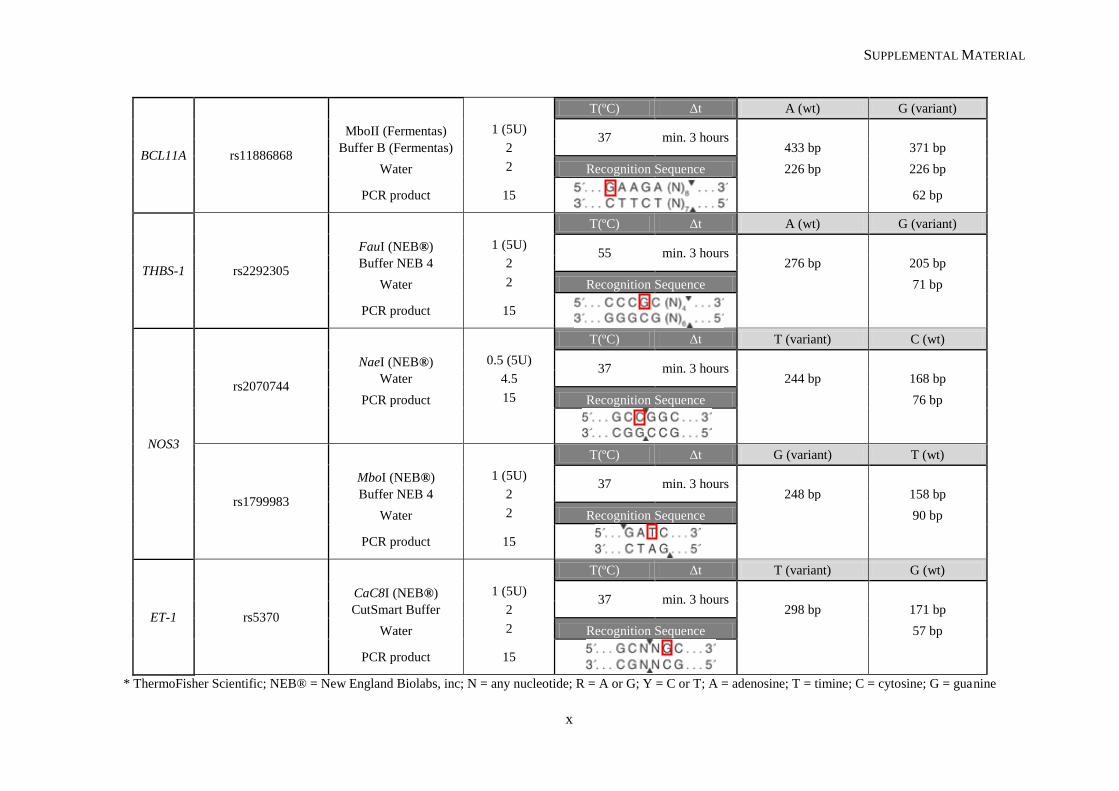
SUPPLEMENTAL MATERIAL
x
BCL11A rs11886868
T(ºC) Δt A (wt) G (variant)
MboII (Fermentas) 1 (5U) 37 min. 3 hours
Buffer B (Fermentas) 2 433 bp 371 bp
Water 2 Recognition Sequence 226 bp 226 bp
PCR product 15
62 bp
THBS-1 rs2292305
T(ºC) Δt A (wt) G (variant)
FauI (NEB®) 1 (5U) 55 min. 3 hours
Buffer NEB 4 2 276 bp 205 bp
Water 2 Recognition Sequence
71 bp
PCR product 15
NOS3
rs2070744
T(ºC) Δt T (variant) C (wt)
NaeI (NEB®) 0.5 (5U) 37 min. 3 hours
Water 4.5 244 bp 168 bp
PCR product 15 Recognition Sequence
76 bp
rs1799983
T(ºC) Δt G (variant) T (wt)
MboI (NEB®) 1 (5U) 37 min. 3 hours
Buffer NEB 4 2 248 bp 158 bp
Water 2 Recognition Sequence
90 bp
PCR product 15
ET-1 rs5370
T(ºC) Δt T (variant) G (wt)
CaC8I (NEB®) 1 (5U) 37 min. 3 hours
CutSmart Buffer 2 298 bp 171 bp
Water 2 Recognition Sequence
57 bp
PCR product 15
* ThermoFisher Scientific; NEB® = New England Biolabs, inc; N = any nucleotide; R = A or G; Y = C or T; A = adenosine; T = timine; C = cytosine; G = guanine


![Prenatal Screening for Co-Inheritance of Sickle Cell ... · Sickle cell anemia and β-thalassemia are genetic disorders caused by different genetic mutations [11]. Therefore, patients](https://static.fdocument.org/doc/165x107/5f5a186f300c56026200ab34/prenatal-screening-for-co-inheritance-of-sickle-cell-sickle-cell-anemia-and.jpg)