PREVALENCE OF THE ΒETA-S GENE AND SICKLE CELL DISEASE IN INDIA
See discussions, stats, and author profiles for this publication at: https://www.researchgate.net/publication/350074916
Associations between TGF-β1 Levels and Markers of Hemolysis,
Inflammation, and Tissue Remodeling in Pediatric Sickle Cell Patients
Article in Mediators of Inflammation · March 2021
DOI: 10.1155/2021/4651891
CITATIONS
0READS
18
14 authors, including:
Some of the authors of this publication are also working on these related projects:
l Implantação de protocolo de atendimento e acompanhamento de pacientes sépticos graves do Sul da Bahia com associação a análise do genótipo e à novos
biomarcadores View project
Laboratory diagnosis of parasitic diseases View project
Rayra Pereira Santiago
INSTITUTO GONÇALO MONIZ
47 PUBLICATIONS 167 CITATIONS
SEE PROFILE
Magda O Seixas Carvalho
Universidade Federal da Bahia
25 PUBLICATIONS 202 CITATIONS
SEE PROFILE
Setondji Cocou Modeste Alexandre Yahouedehou
Instituto Gonçalo Moniz
29 PUBLICATIONS 52 CITATIONS
SEE PROFILE
Isa Lyra
Universidade Federal da Bahia
26 PUBLICATIONS 370 CITATIONS
SEE PROFILE
All content following this page was uploaded by Caroline da Guarda on 15 March 2021.
The user has requested enhancement of the downloaded file.
Research ArticleAssociations between TGF-β1 Levels and Markers of Hemolysis,Inflammation, and Tissue Remodeling in Pediatric SickleCell Patients
Rayra P. Santiago ,1,2 Magda O. S. Carvalho,3 Camylla V. B. Figueiredo ,1,2
Luciana M. Fiuza ,1,2 Rodrigo M. Oliveira ,1,2 Sètondji C. M. A. Yahouédéhou ,1,2
Valma M. L. Nascimento,4 Isa M. Lyra,3,4 Théo Araujo-Santos ,1 Nívea F. Luz ,1
Milena M. Aleluia ,5 Caroline C. Guarda ,1,2 Valéria M. Borges ,1
and Marilda S. Goncalves 1,2
1Instituto Gonçalo Moniz, Fundação Oswaldo Cruz, 40.296-710 Salvador, Brazil2Universidade Federal da Bahia, 40.170-110 Salvador, Brazil3Hospital Universitário Professor Edgard Santos, Universidade Federal da Bahia, 40110-060 Salvador, Brazil4Fundação de Hematologia e Hemoterapia do Estado da Bahia, 40286-240 Salvador, Brazil5Departamento de Ciências Biológicas, Universidade Estadual de Santa Cruz, 45.662-900 Ilhéus, Brazil
Correspondence should be addressed to Marilda S. Goncalves; [email protected]
Received 9 June 2020; Accepted 1 March 2021; Published 15 March 2021
Academic Editor: Daniela Caccamo
Copyright © 2021 Rayra P. Santiago et al. This is an open access article distributed under the Creative Commons AttributionLicense, which permits unrestricted use, distribution, and reproduction in any medium, provided the original work isproperly cited.
Transforming growth factor beta (TGF-β) is a cytokine with important involvement in biological processes related to the pathogenesisof sickle cell disease (SCD), including endothelial and vascular dysfunction, inflammation, and hematopoietic homeostasis. This studyis aimed at investigating associations between levels of TGF-β1 and classical laboratory biomarkers and inflammatory mediators, aswell as the tissue inhibitor of metalloproteases-1 (TIMP-1) and matrix metalloproteinase-9 (MMP-9), in pediatric patients (n = 123)with SCD in steady state: 84 with sickle cell anemia (HbSS) and 39 with hemoglobin SC disease (HbSC). A healthy control (HC) groupof 59 individuals was also included. Hematological and biochemical analyses were carried out using electronic methods. TGF-β1,TIMP-1, and MMP-9 plasma quantifications were performed by ELISA. TGF-β1 plasma levels were higher in HbSS individualsthan in HbSC and HC. In individuals with HbSS, TGF-β1 levels were positively correlated with red blood cells, hemoglobin,hematocrit, platelets, and TIMP-1. In addition, HbSS individuals with TGF-β1 levels above the median (≥72.29 ng/mL) alsopresented increased monocyte counts and decreased albumin levels. In patients with HbSC, TGF-β1 levels were positivelycorrelated with leukocytes, eosinophils, lymphocytes, monocytes, and platelets, as well as levels of TIMP-1, VLDL-C, triglycerides,heme, and AST. Additionally, HbSC individuals with TGF-β1 levels above the median (≥47.80 ng/mL) presented increasedleukocyte and platelet counts, as well as increased levels of triglycerides, VLDL-C, MMP-9, and TIMP-1, and decreased HDL-C.Our findings suggest that TGF-β1 may play important roles in vascular remodeling, vasculopathy, angiogenesis, and inflammationin pediatric patients with SCD.
1. Introduction
Sickle cell disease (SCD) is a group of disorders character-ized by the presence of the hemoglobin variant S (HbS).Sickle cell anemia (SCA), the most severe type of SCD,
represents homozygosity in the inheritance of the betaallele S (HbSS). Hemoglobin SC disease (HbSC) is charac-terized by the association of HbS with another hemoglobinvariant, hemoglobin C (HbC), and is considered a milderphenotype of SCD [1–4].
HindawiMediators of InflammationVolume 2021, Article ID 4651891, 10 pageshttps://doi.org/10.1155/2021/4651891
Individuals with SCD exhibit an acute and chronicinflammatory status associated with recurrent infectionsand increased leukocyte counts, as well as the activation ofleukocytes, red blood cells, reticulocytes, and endothelialcells. These individuals often experience clinical eventsrelated to vascular dysfunction, such as priapism, pulmonaryhypertension, vasoocclusive crisis (VOC), and stroke [5, 6].
Vascular dysfunction is a common feature in SCD, mainlycaused by nitric oxide (NO) imbalance in association withchronic hemolysis [5, 7]. During intravascular hemolysis, freehemoglobin and heme react with NO, causing the degradationof this free radical. Thehemolytic process also induces the releaseof arginase,which consumes arginine, themain substrate forNOproduction. These events result in reactive oxygen and nitrogenspecies (ROS and RNS) production, which contribute to celldamage and vascular dysfunctionbywayof nitrosative stress [6].
The chronic inflammatory status observed in SCD has alsobeen linked to increased levels of inflammatory cytokines, suchas interleukin- (IL-) 1, tumor necrosis factor-alpha (TNF-α),and endothelin-1, which are produced by activated endothelialcells [8]. SCA patients have been described to present increasedplasma levels of TNF-α, IL-8, and prostaglandin E2 (PGE2) [9].In addition, transforming growth factor beta 1 (TGF-β1), IL-17, and IL-18 are capable of activating the vascular endothe-lium [8, 10]. In SCD, patterns of cytokine production varyduring steady and crisis state [11], suggesting that the inflam-matory response is capable of modulating clinical events.
TGF-β is a pleiotropic family of cytokines produced bymany cell types, such as immune cells (T cells and macro-phages), tumor cells, and stromal cells. These growth factorshave been implicated in the regulation of cell growth, prolifer-ation, differentiation, adhesion, and migration, as well as Th17response polarization, ROS production, and apoptosis [12–16].In the context of SCD, TGF-β is involved in several processes,including wound healing/ulceration, proliferative vasculopa-thy, inflammation, immune response, and ROS production[10, 17], all of which have been linked to clinical events.
TGF-β can upregulate the expression and activity ofmatrix metalloproteinases 9 (MMP-9), as well as its antago-nist, tissue inhibitor of metalloproteases-1 (TIMP-1) [18,19]. MMP-9, a zinc-dependent endopeptidase that acts inthe extracellular matrix, promotes tissue remodeling inresponse to physiological and pathological conditions [18–21] Additionally, MMP-9 can also activate cytokine and che-mokine production and is a regulator of inflammation andimmunity [10]. Interplay between TIMP-1 and MMP-9 isinvolved in angiogenesis, cell growth, and apoptosis [22, 23].
Considering the immunomodulatory role of TGF-βtogether with the plethora of effects exerted by this superfam-ily, we hypothesized that TGF-β1 may play a key role in thepathogenesis of SCD. Hence, we sought to investigateassociations between plasma levels of TGF-β1 and classicallaboratory biomarkers, as well as TIMP-1 and MMP-9, inindividuals with HbSS and HbSC.
2. Material and Methods
2.1. Subjects. Pediatric patients with SCD (n = 123) wererecruited from the Bahia State Hematology and Hemother-
apy Foundation (HEMOBA), located in Salvador, Brazil. Ofthese, 84 were HbSS and 39 were HbSC; 37 (44.04%) and19 (48.71%) were female, respectively. All individuals werein steady-state, signifying the absence of acute events in thethree months prior to inclusion, and none were undergoinghydroxyurea therapy. The mean age of patients with HbSSandHbSCwas 8:76 ± 3:78 and 10:72 ± 4:24 years, respectively.
A healthy control (HC) group consisting of 59 individ-uals was included, 30 (50.85%) of whom were female, withmean age of 8:38 ± 3:50 years. These individuals wererecruited from the Laboratory of Clinical and ToxicologicalAnalysis, College of Pharmaceutical Sciences, Federal Uni-versity of Bahia (LACTFAR-UFBA).
This research protocol was approved by the institutionalresearch board of the Gonçalo Moniz Institute (protocolnumber: 0016.0.225.000-09) and was conducted in accor-dance with the 1964 Declaration of Helsinki and its subse-quent revisions. All individuals were informed regardingthe purpose and procedures of this study, and informed writ-ten consent was obtained from each patient’s legal guardian.
2.2. Hematological and Biochemical Parameters. Hematolog-ical parameters were quantified using a Coulter Count T-890electronic cell counter (Coulter Corporation, Hialeah, Flor-ida, USA). Reticulocytes were counted after staining supravi-tally with brilliant cresyl blue dye. Hemoglobin profiles andfetal hemoglobin (HbF) levels were determined by high-performance liquid chromatography using an HPLC/Var-iant-II hemoglobin testing system (Bio-Rad, Hercules,California, USA).
Biochemical parameters were measured using an auto-mated A25 chemistry analyzer (Biosystems S.A., Barcelona,Catalunya, Spain). Serum ferritin was measured by immuno-assay using an Access® 2 immunoassay system (BeckmanCoulter Inc., Pasadena, California, USA). In addition, alpha1 antitrypsin (AAT) levels were determined using anIMMAGE® Immunochemistry System (Beckman CoulterInc., Pasadena, California, USA). Total systemic free hemewas measured in plasma samples using the QuantiChromHeme Assay Kit (BioAssay Systems, Hayward, California,USA) following the manufacturer’s protocol.
Laboratory analysis was performed at the Laboratory ofGenetic Investigation and Translational Hematology at theGonçalo Moniz Institute-FIOCRUZ (LIGHT-IGM/FIO-CRUZ) and at LACTFAR-UFBA.
2.3. TGF-β1, TIMP-1, and MMP-9 Plasma Measurement.TGF-β1, TIMP-1, and MMP-9 plasma levels were measuredby ELISA (R&D Systems, Minneapolis, Minnesota, USA) inaccordance with the manufacturer’s protocol.
2.4. Statistical Analysis. All analyses were performed usingthe Statistical Package for the Social Sciences (SPSS) software,version 20.0 (IBM, Armonk, New York, USA) and GraphPadPrism version 6.0 (GraphPad Software, San Diego, Califor-nia, USA), which was also used for graph assembly. Signifi-cance was considered when p < 0:05. Variable values weresummarized as means. To perform comparisons amongSCD phenotypes, subgroups of individuals were formed
2 Mediators of Inflammation
according to TGF-β1 median values. The Shapiro-Wilk testwas used to determine the distribution of quantitativevariables. Depending on distribution, comparisons of twonumerical variables were performed using the independent
t-test and Mann–Whitney U test. Ordinary one-wayANOVA or Kruskal-Wallis test was performed to comparethree numerical variables depending on distribution. Spear-man’s rank correlation coefficient or Pearson’s correlation
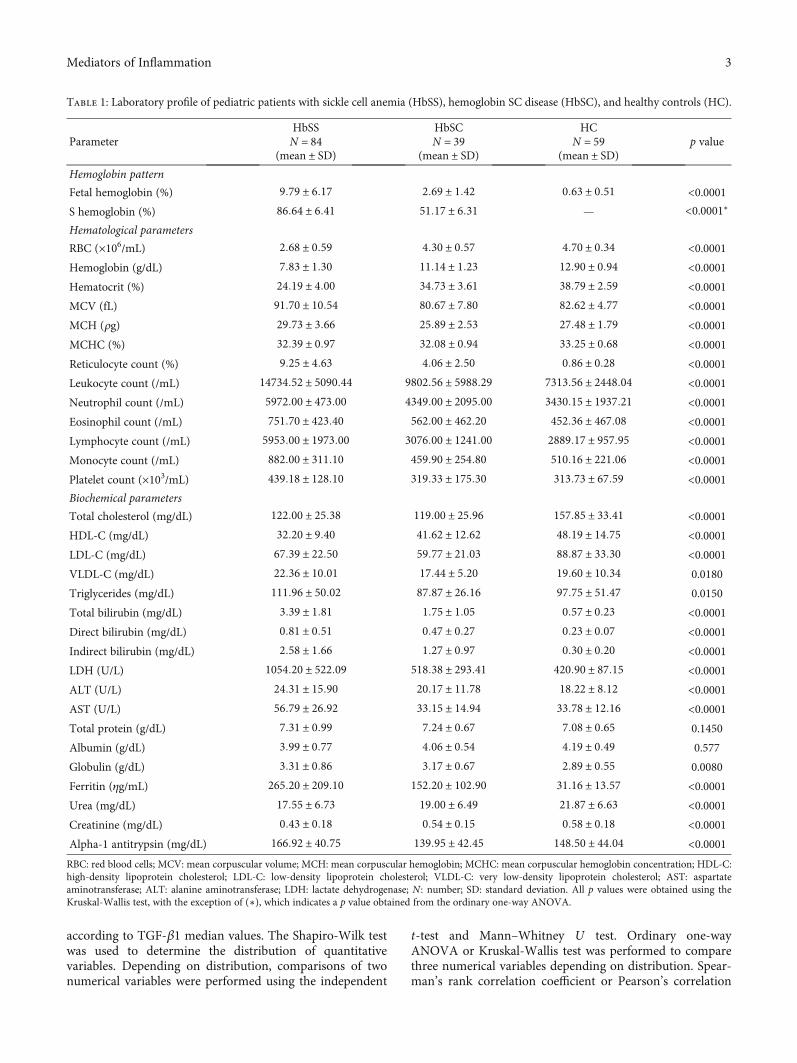
Table 1: Laboratory profile of pediatric patients with sickle cell anemia (HbSS), hemoglobin SC disease (HbSC), and healthy controls (HC).
ParameterHbSSN = 84
(mean ± SD)
HbSCN = 39
(mean ± SD)
HCN = 59
(mean ± SD)p value
Hemoglobin pattern
Fetal hemoglobin (%) 9:79 ± 6:17 2:69 ± 1:42 0:63 ± 0:51 <0.0001S hemoglobin (%) 86:64 ± 6:41 51:17 ± 6:31 — <0.0001∗
Hematological parameters
RBC (×106/mL) 2:68 ± 0:59 4:30 ± 0:57 4:70 ± 0:34 <0.0001Hemoglobin (g/dL) 7:83 ± 1:30 11:14 ± 1:23 12:90 ± 0:94 <0.0001Hematocrit (%) 24:19 ± 4:00 34:73 ± 3:61 38:79 ± 2:59 <0.0001MCV (fL) 91:70 ± 10:54 80:67 ± 7:80 82:62 ± 4:77 <0.0001MCH (ρg) 29:73 ± 3:66 25:89 ± 2:53 27:48 ± 1:79 <0.0001MCHC (%) 32:39 ± 0:97 32:08 ± 0:94 33:25 ± 0:68 <0.0001Reticulocyte count (%) 9:25 ± 4:63 4:06 ± 2:50 0:86 ± 0:28 <0.0001Leukocyte count (/mL) 14734:52 ± 5090:44 9802:56 ± 5988:29 7313:56 ± 2448:04 <0.0001Neutrophil count (/mL) 5972:00 ± 473:00 4349:00 ± 2095:00 3430:15 ± 1937:21 <0.0001Eosinophil count (/mL) 751:70 ± 423:40 562:00 ± 462:20 452:36 ± 467:08 <0.0001Lymphocyte count (/mL) 5953:00 ± 1973:00 3076:00 ± 1241:00 2889:17 ± 957:95 <0.0001Monocyte count (/mL) 882:00 ± 311:10 459:90 ± 254:80 510:16 ± 221:06 <0.0001Platelet count (×103/mL) 439:18 ± 128:10 319:33 ± 175:30 313:73 ± 67:59 <0.0001Biochemical parameters
Total cholesterol (mg/dL) 122:00 ± 25:38 119:00 ± 25:96 157:85 ± 33:41 <0.0001HDL-C (mg/dL) 32:20 ± 9:40 41:62 ± 12:62 48:19 ± 14:75 <0.0001LDL-C (mg/dL) 67:39 ± 22:50 59:77 ± 21:03 88:87 ± 33:30 <0.0001VLDL-C (mg/dL) 22:36 ± 10:01 17:44 ± 5:20 19:60 ± 10:34 0.0180
Triglycerides (mg/dL) 111:96 ± 50:02 87:87 ± 26:16 97:75 ± 51:47 0.0150
Total bilirubin (mg/dL) 3:39 ± 1:81 1:75 ± 1:05 0:57 ± 0:23 <0.0001Direct bilirubin (mg/dL) 0:81 ± 0:51 0:47 ± 0:27 0:23 ± 0:07 <0.0001Indirect bilirubin (mg/dL) 2:58 ± 1:66 1:27 ± 0:97 0:30 ± 0:20 <0.0001LDH (U/L) 1054:20 ± 522:09 518:38 ± 293:41 420:90 ± 87:15 <0.0001ALT (U/L) 24:31 ± 15:90 20:17 ± 11:78 18:22 ± 8:12 <0.0001AST (U/L) 56:79 ± 26:92 33:15 ± 14:94 33:78 ± 12:16 <0.0001Total protein (g/dL) 7:31 ± 0:99 7:24 ± 0:67 7:08 ± 0:65 0.1450
Albumin (g/dL) 3:99 ± 0:77 4:06 ± 0:54 4:19 ± 0:49 0.577
Globulin (g/dL) 3:31 ± 0:86 3:17 ± 0:67 2:89 ± 0:55 0.0080
Ferritin (ηg/mL) 265:20 ± 209:10 152:20 ± 102:90 31:16 ± 13:57 <0.0001Urea (mg/dL) 17:55 ± 6:73 19:00 ± 6:49 21:87 ± 6:63 <0.0001Creatinine (mg/dL) 0:43 ± 0:18 0:54 ± 0:15 0:58 ± 0:18 <0.0001Alpha-1 antitrypsin (mg/dL) 166:92 ± 40:75 139:95 ± 42:45 148:50 ± 44:04 <0.0001RBC: red blood cells; MCV: mean corpuscular volume; MCH: mean corpuscular hemoglobin; MCHC: mean corpuscular hemoglobin concentration; HDL-C:high-density lipoprotein cholesterol; LDL-C: low-density lipoprotein cholesterol; VLDL-C: very low-density lipoprotein cholesterol; AST: aspartateaminotransferase; ALT: alanine aminotransferase; LDH: lactate dehydrogenase; N : number; SD: standard deviation. All p values were obtained using theKruskal-Wallis test, with the exception of (∗), which indicates a p value obtained from the ordinary one-way ANOVA.
3Mediators of Inflammation
coefficient were used to measure the strength of linear rela-tionships between paired variables.
3. Results
3.1. Hematological and Biochemical Laboratory Parameters.Table 1 lists the hematological and biochemical laboratoryparameters of the investigated HbSS, HbSC, and HCindividuals. Comparisons among the hematological and bio-chemical parameters in these individuals revealed statisticallysignificant differences in hemolytic and inflammatorymarkers, leukocyte counts, as well as biomarkers of lipidand iron metabolism, and hepatic and renal function.
In comparison to individuals with HbSC and HC, patientswith HbSS presented significantly decreased red blood cell(RBC) counts and hemoglobin (Hb), hematocrit (Ht), high-density lipoprotein cholesterol (HDL-C), urea, and creatininelevels, in addition to increased mean corpuscular volume(MCV), mean corpuscular hemoglobin (MCH), mean corpus-cular hemoglobin concentration (MCHC), total bilirubin,indirect bilirubin, direct bilirubin, lactate dehydrogenase(LDH), fetal hemoglobin (HbF), iron, very low-density lipo-protein cholesterol (VLDL-C), triglyceride, aspartate amino-transferase (AST), alanine aminotransferase (ALT), alpha 1antitrypsin (AAT) and ferritin levels, as well as counts of retic-ulocytes, leukocytes, neutrophils, eosinophils, lymphocytes,monocytes, and platelets.
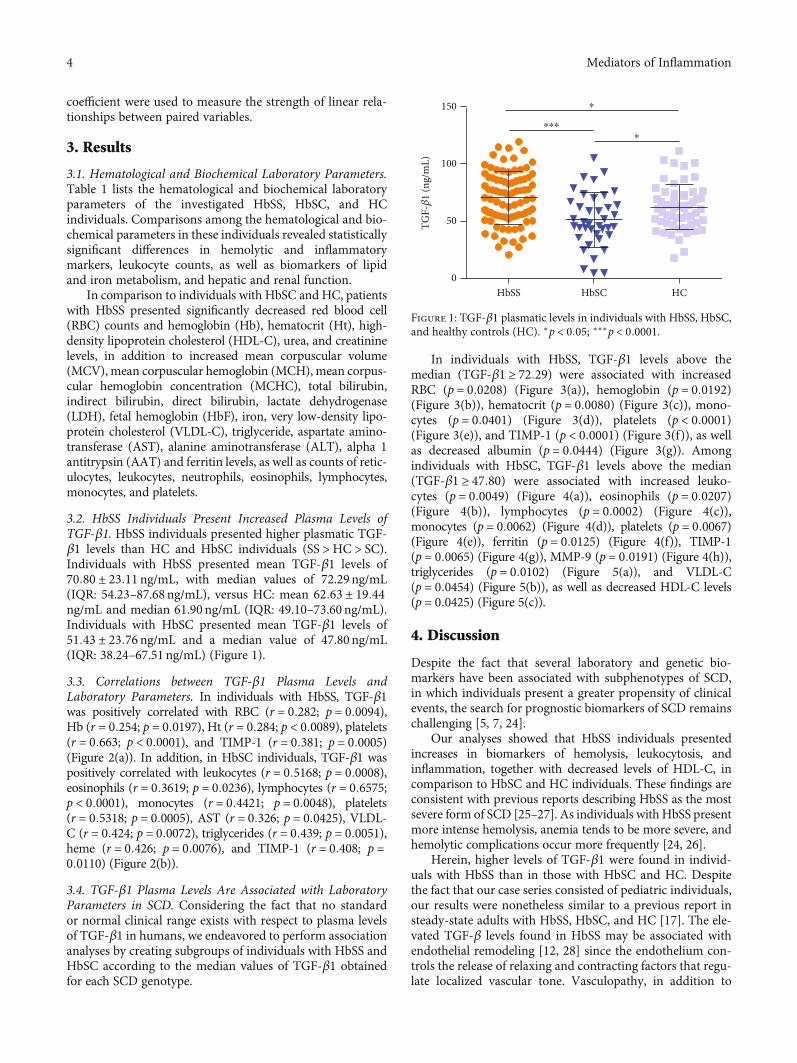
3.2. HbSS Individuals Present Increased Plasma Levels ofTGF-β1. HbSS individuals presented higher plasmatic TGF-β1 levels than HC and HbSC individuals (SS > HC > SC).Individuals with HbSS presented mean TGF-β1 levels of70:80 ± 23:11 ng/mL, with median values of 72.29 ng/mL(IQR: 54.23–87.68 ng/mL), versus HC: mean 62:63 ± 19:44ng/mL and median 61.90 ng/mL (IQR: 49.10–73.60 ng/mL).Individuals with HbSC presented mean TGF-β1 levels of51:43 ± 23:76 ng/mL and a median value of 47.80 ng/mL(IQR: 38.24–67.51 ng/mL) (Figure 1).
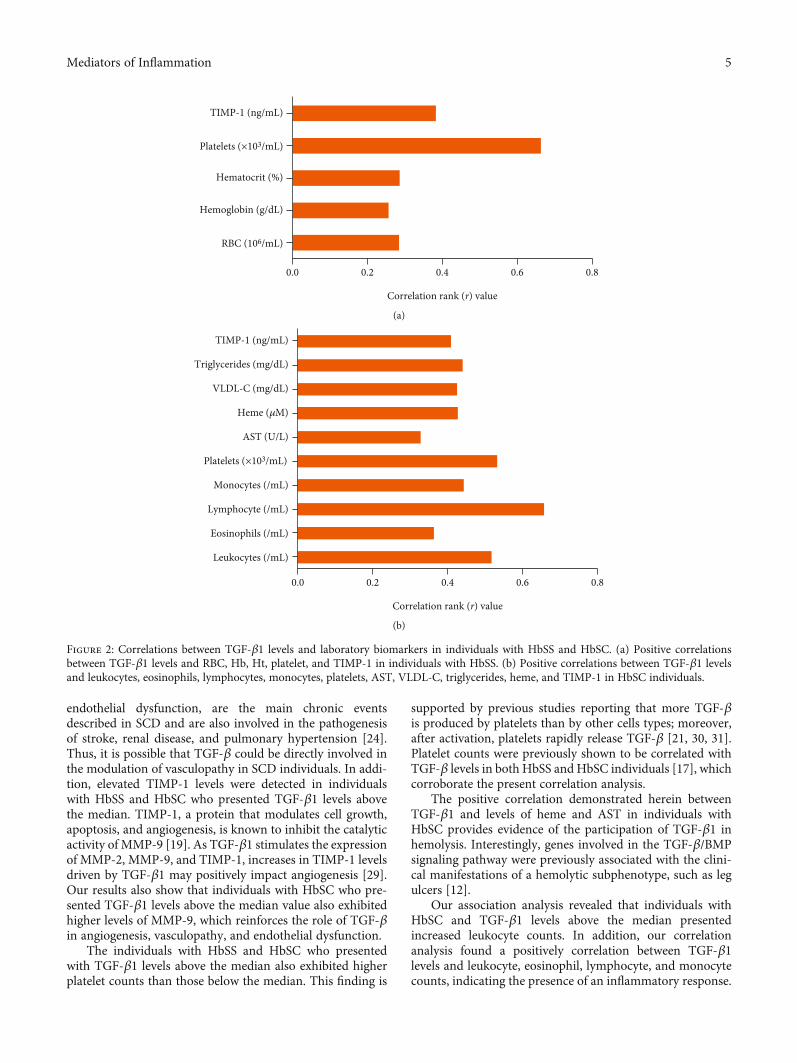
3.3. Correlations between TGF-β1 Plasma Levels andLaboratory Parameters. In individuals with HbSS, TGF-β1was positively correlated with RBC (r = 0:282; p = 0:0094),Hb (r = 0:254; p = 0:0197), Ht (r = 0:284; p < 0:0089), platelets(r = 0:663; p < 0:0001), and TIMP-1 (r = 0:381; p = 0:0005)(Figure 2(a)). In addition, in HbSC individuals, TGF-β1 waspositively correlated with leukocytes (r = 0:5168; p = 0:0008),eosinophils (r = 0:3619; p = 0:0236), lymphocytes (r = 0:6575;p < 0:0001), monocytes (r = 0:4421; p = 0:0048), platelets(r = 0:5318; p = 0:0005), AST (r = 0:326; p = 0:0425), VLDL-C (r = 0:424; p = 0:0072), triglycerides (r = 0:439; p = 0:0051),heme (r = 0:426; p = 0:0076), and TIMP-1 (r = 0:408; p =0:0110) (Figure 2(b)).
3.4. TGF-β1 Plasma Levels Are Associated with LaboratoryParameters in SCD. Considering the fact that no standardor normal clinical range exists with respect to plasma levelsof TGF-β1 in humans, we endeavored to perform associationanalyses by creating subgroups of individuals with HbSS andHbSC according to the median values of TGF-β1 obtainedfor each SCD genotype.
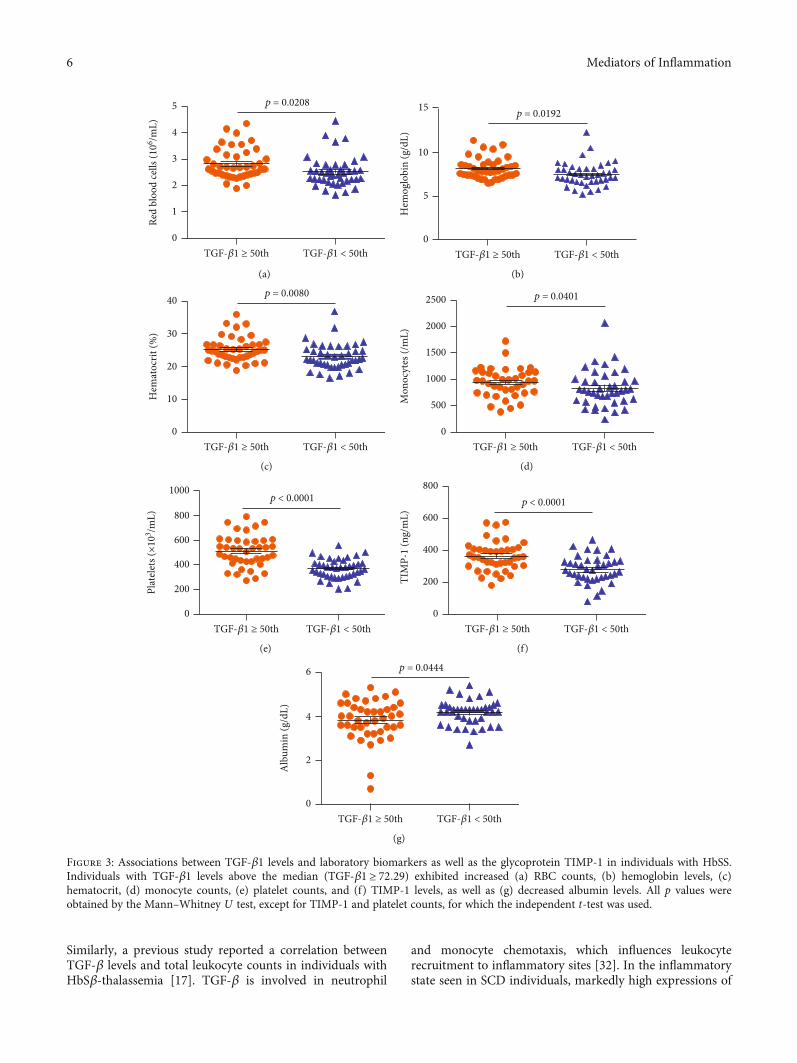
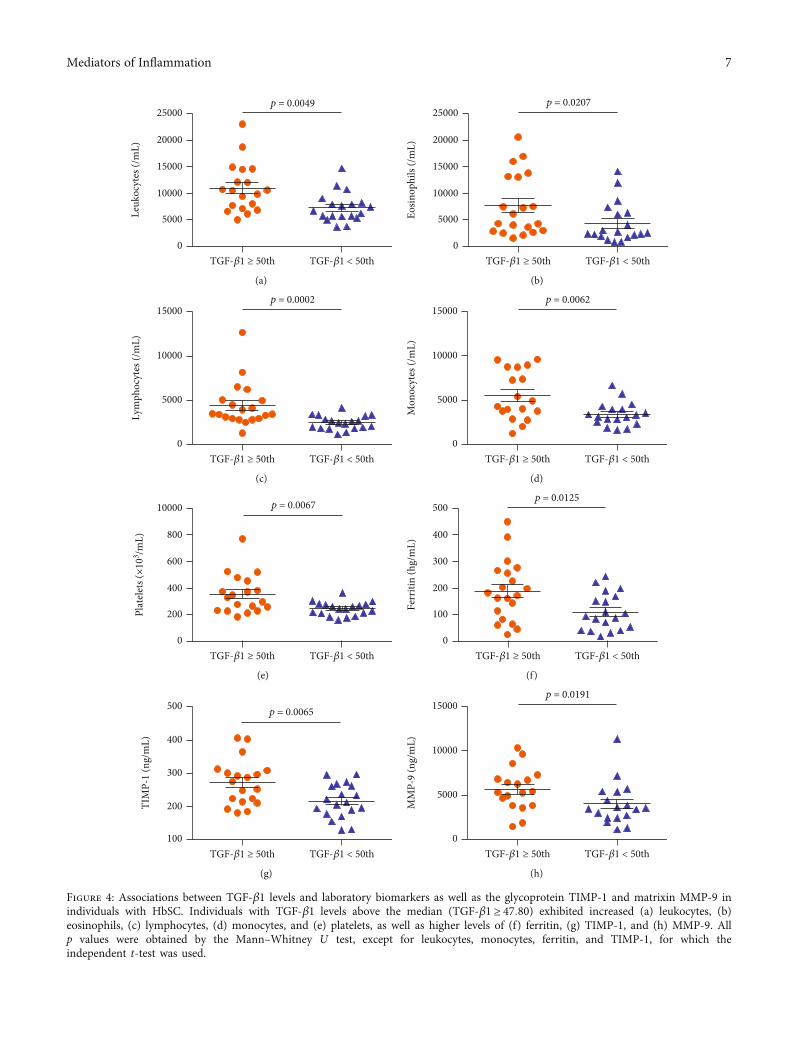
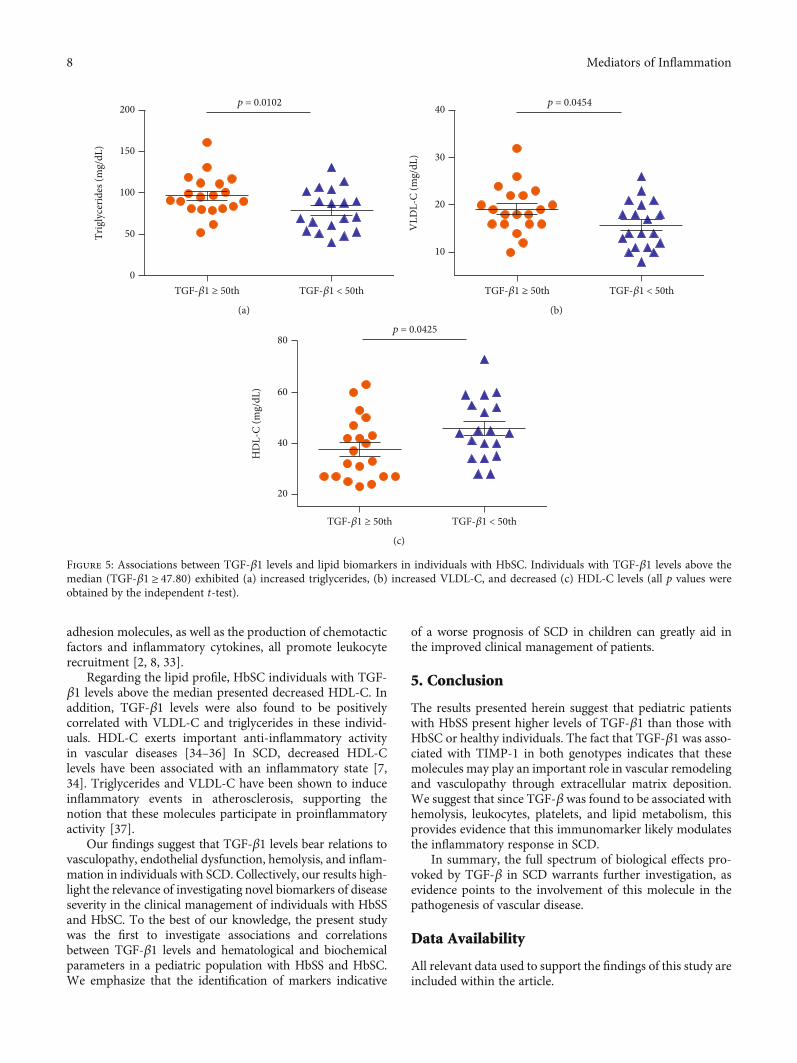
In individuals with HbSS, TGF-β1 levels above themedian (TGF‐β1 ≥ 72:29) were associated with increasedRBC (p = 0:0208) (Figure 3(a)), hemoglobin (p = 0:0192)(Figure 3(b)), hematocrit (p = 0:0080) (Figure 3(c)), mono-cytes (p = 0:0401) (Figure 3(d)), platelets (p < 0:0001)(Figure 3(e)), and TIMP-1 (p < 0:0001) (Figure 3(f)), as wellas decreased albumin (p = 0:0444) (Figure 3(g)). Amongindividuals with HbSC, TGF-β1 levels above the median(TGF‐β1 ≥ 47:80) were associated with increased leuko-cytes (p = 0:0049) (Figure 4(a)), eosinophils (p = 0:0207)(Figure 4(b)), lymphocytes (p = 0:0002) (Figure 4(c)),monocytes (p = 0:0062) (Figure 4(d)), platelets (p = 0:0067)(Figure 4(e)), ferritin (p = 0:0125) (Figure 4(f)), TIMP-1(p = 0:0065) (Figure 4(g)), MMP-9 (p = 0:0191) (Figure 4(h)),triglycerides (p = 0:0102) (Figure 5(a)), and VLDL-C(p = 0:0454) (Figure 5(b)), as well as decreased HDL-C levels(p = 0:0425) (Figure 5(c)).
4. Discussion
Despite the fact that several laboratory and genetic bio-markers have been associated with subphenotypes of SCD,in which individuals present a greater propensity of clinicalevents, the search for prognostic biomarkers of SCD remainschallenging [5, 7, 24].
Our analyses showed that HbSS individuals presentedincreases in biomarkers of hemolysis, leukocytosis, andinflammation, together with decreased levels of HDL-C, incomparison to HbSC and HC individuals. These findings areconsistent with previous reports describing HbSS as the mostsevere form of SCD [25–27]. As individuals with HbSS presentmore intense hemolysis, anemia tends to be more severe, andhemolytic complications occur more frequently [24, 26].
Herein, higher levels of TGF-β1 were found in individ-uals with HbSS than in those with HbSC and HC. Despitethe fact that our case series consisted of pediatric individuals,our results were nonetheless similar to a previous report insteady-state adults with HbSS, HbSC, and HC [17]. The ele-vated TGF-β levels found in HbSS may be associated withendothelial remodeling [12, 28] since the endothelium con-trols the release of relaxing and contracting factors that regu-late localized vascular tone. Vasculopathy, in addition to
TGF-𝛽
1 (n
g/m
L)
HbSS HbSC HC0
50
100
150 ⁎
⁎⁎⁎⁎
Figure 1: TGF-β1 plasmatic levels in individuals with HbSS, HbSC,and healthy controls (HC). ∗p < 0:05; ∗∗∗p < 0:0001.
4 Mediators of Inflammation
endothelial dysfunction, are the main chronic eventsdescribed in SCD and are also involved in the pathogenesisof stroke, renal disease, and pulmonary hypertension [24].Thus, it is possible that TGF-β could be directly involved inthe modulation of vasculopathy in SCD individuals. In addi-tion, elevated TIMP-1 levels were detected in individualswith HbSS and HbSC who presented TGF-β1 levels abovethe median. TIMP-1, a protein that modulates cell growth,apoptosis, and angiogenesis, is known to inhibit the catalyticactivity of MMP-9 [19]. As TGF-β1 stimulates the expressionof MMP-2, MMP-9, and TIMP-1, increases in TIMP-1 levelsdriven by TGF-β1 may positively impact angiogenesis [29].Our results also show that individuals with HbSC who pre-sented TGF-β1 levels above the median value also exhibitedhigher levels of MMP-9, which reinforces the role of TGF-βin angiogenesis, vasculopathy, and endothelial dysfunction.
The individuals with HbSS and HbSC who presentedwith TGF-β1 levels above the median also exhibited higherplatelet counts than those below the median. This finding is
supported by previous studies reporting that more TGF-βis produced by platelets than by other cells types; moreover,after activation, platelets rapidly release TGF-β [21, 30, 31].Platelet counts were previously shown to be correlated withTGF-β levels in both HbSS and HbSC individuals [17], whichcorroborate the present correlation analysis.
The positive correlation demonstrated herein betweenTGF-β1 and levels of heme and AST in individuals withHbSC provides evidence of the participation of TGF-β1 inhemolysis. Interestingly, genes involved in the TGF-β/BMPsignaling pathway were previously associated with the clini-cal manifestations of a hemolytic subphenotype, such as legulcers [12].
Our association analysis revealed that individuals withHbSC and TGF-β1 levels above the median presentedincreased leukocyte counts. In addition, our correlationanalysis found a positively correlation between TGF-β1levels and leukocyte, eosinophil, lymphocyte, and monocytecounts, indicating the presence of an inflammatory response.
Correlation rank (r) value
0.0 0.2 0.4 0.6 0.8
RBC (106/mL)
Hemoglobin (g/dL)
Hematocrit (%)
Platelets (×103/mL)
TIMP-1 (ng/mL)
(a)
Correlation rank (r) value
0.0 0.2 0.4 0.6 0.8
Leukocytes (/mL)
Lymphocyte (/mL)
Monocytes (/mL)
Triglycerides (mg/dL)
TIMP-1 (ng/mL)
VLDL-C (mg/dL)
Heme (𝜇M)
AST (U/L)
Eosinophils (/mL)
(b)
Figure 2: Correlations between TGF-β1 levels and laboratory biomarkers in individuals with HbSS and HbSC. (a) Positive correlationsbetween TGF-β1 levels and RBC, Hb, Ht, platelet, and TIMP-1 in individuals with HbSS. (b) Positive correlations between TGF-β1 levelsand leukocytes, eosinophils, lymphocytes, monocytes, platelets, AST, VLDL-C, triglycerides, heme, and TIMP-1 in HbSC individuals.
5Mediators of Inflammation
Similarly, a previous study reported a correlation betweenTGF-β levels and total leukocyte counts in individuals withHbSβ-thalassemia [17]. TGF-β is involved in neutrophil
and monocyte chemotaxis, which influences leukocyterecruitment to inflammatory sites [32]. In the inflammatorystate seen in SCD individuals, markedly high expressions of
TGF-𝛽1 ≥ 50th TGF-𝛽1 < 50th0
1
2
3
4
5 p = 0.0208
Red
bloo
d ce
lls (1
06 /mL)
(a)
TGF-𝛽1 ≥ 50th TGF-𝛽1 < 50th0
5
10
15p = 0.0192
Hem
oglo
bin
(g/d
L)
(b)
TGF-𝛽1 ≥ 50th TGF-𝛽1 < 50th0
10
20
30
40p = 0.0080
Hem
atoc
rit (%
)
(c)
TGF-𝛽1 ≥ 50th TGF-𝛽1 < 50th0
500
1000
1500
2000
2500 p = 0.0401
Mon
ocyt
es (/
mL)
(d)
TGF-𝛽1 ≥ 50th TGF-𝛽1 < 50th0
200
400
600
800
1000p < 0.0001
(e)
TGF-𝛽1 ≥ 50th TGF-𝛽1 < 50th0
200
400
600
800p < 0.0001
TIM
P-1
(ng/
mL)
(f)
TGF-𝛽1 ≥ 50th TGF-𝛽1 < 50th0
2
4
6 p = 0.0444
Alb
umin
(g/d
L)
(g)
Figure 3: Associations between TGF-β1 levels and laboratory biomarkers as well as the glycoprotein TIMP-1 in individuals with HbSS.Individuals with TGF-β1 levels above the median (TGF‐β1 ≥ 72:29) exhibited increased (a) RBC counts, (b) hemoglobin levels, (c)hematocrit, (d) monocyte counts, (e) platelet counts, and (f) TIMP-1 levels, as well as (g) decreased albumin levels. All p values wereobtained by the Mann–Whitney U test, except for TIMP-1 and platelet counts, for which the independent t-test was used.
6 Mediators of Inflammation
TGF-𝛽1 ≥ 50th TGF-𝛽1 < 50th0
5000
15000
25000p = 0.0049
Leuk
ocyt
es (/
mL)
20000
10000
(a)
TGF-𝛽1 ≥ 50th TGF-𝛽1 < 50th0
5000
15000
25000p = 0.0207
Eosin
ophi
ls (/
mL)
20000
10000
(b)
TGF-𝛽1 ≥ 50th TGF-𝛽1 < 50th0
10000
15000p = 0.0002
Lym
phoc
ytes
(/m
L)
5000
(c)
TGF-𝛽1 ≥ 50th TGF-𝛽1 < 50th0
10000
15000p = 0.0062
Mon
ocyt
es (/
mL)
5000
(d)
TGF-𝛽1 ≥ 50th TGF-𝛽1 < 50th0
200
600
10000 p = 0.0067
800
400
(e)
TGF-𝛽1 ≥ 50th TGF-𝛽1 < 50th0
100
300
500p = 0.0125
Ferr
itin
(hg/
mL)
400
200
(f)
TGF-𝛽1 ≥ 50th TGF-𝛽1 < 50th100
300
500p = 0.0065
TIM
P-1
(ng/
mL) 400
200
(g)
TGF-𝛽1 ≥ 50th TGF-𝛽1 < 50th0
10000
15000p = 0.0191
MM
P-9
(ng/
mL)
5000
(h)
Figure 4: Associations between TGF-β1 levels and laboratory biomarkers as well as the glycoprotein TIMP-1 and matrixin MMP-9 inindividuals with HbSC. Individuals with TGF-β1 levels above the median (TGF‐β1 ≥ 47:80) exhibited increased (a) leukocytes, (b)eosinophils, (c) lymphocytes, (d) monocytes, and (e) platelets, as well as higher levels of (f) ferritin, (g) TIMP-1, and (h) MMP-9. Allp values were obtained by the Mann–Whitney U test, except for leukocytes, monocytes, ferritin, and TIMP-1, for which theindependent t-test was used.
7Mediators of Inflammation
adhesion molecules, as well as the production of chemotacticfactors and inflammatory cytokines, all promote leukocyterecruitment [2, 8, 33].
Regarding the lipid profile, HbSC individuals with TGF-β1 levels above the median presented decreased HDL-C. Inaddition, TGF-β1 levels were also found to be positivelycorrelated with VLDL-C and triglycerides in these individ-uals. HDL-C exerts important anti-inflammatory activityin vascular diseases [34–36] In SCD, decreased HDL-Clevels have been associated with an inflammatory state [7,34]. Triglycerides and VLDL-C have been shown to induceinflammatory events in atherosclerosis, supporting thenotion that these molecules participate in proinflammatoryactivity [37].
Our findings suggest that TGF-β1 levels bear relations tovasculopathy, endothelial dysfunction, hemolysis, and inflam-mation in individuals with SCD. Collectively, our results high-light the relevance of investigating novel biomarkers of diseaseseverity in the clinical management of individuals with HbSSand HbSC. To the best of our knowledge, the present studywas the first to investigate associations and correlationsbetween TGF-β1 levels and hematological and biochemicalparameters in a pediatric population with HbSS and HbSC.We emphasize that the identification of markers indicative
of a worse prognosis of SCD in children can greatly aid inthe improved clinical management of patients.
5. Conclusion
The results presented herein suggest that pediatric patientswith HbSS present higher levels of TGF-β1 than those withHbSC or healthy individuals. The fact that TGF-β1 was asso-ciated with TIMP-1 in both genotypes indicates that thesemolecules may play an important role in vascular remodelingand vasculopathy through extracellular matrix deposition.We suggest that since TGF-β was found to be associated withhemolysis, leukocytes, platelets, and lipid metabolism, thisprovides evidence that this immunomarker likely modulatesthe inflammatory response in SCD.
In summary, the full spectrum of biological effects pro-voked by TGF-β in SCD warrants further investigation, asevidence points to the involvement of this molecule in thepathogenesis of vascular disease.
Data Availability
All relevant data used to support the findings of this study areincluded within the article.
0
50
100
150
200Tr
igly
cerid
es (m
g/dL
)p = 0.0102
TGF-𝛽1 ≥ 50th TGF-𝛽1 < 50th
(a)
10
20
30
40
VLD
L-C
(mg/
dL)
p = 0.0454
TGF-𝛽1 ≥ 50th TGF-𝛽1 < 50th
(b)
20
40
60
80
HD
L-C
(mg/
dL)
p = 0.0425
TGF-𝛽1 ≥ 50th TGF-𝛽1 < 50th
(c)
Figure 5: Associations between TGF-β1 levels and lipid biomarkers in individuals with HbSC. Individuals with TGF-β1 levels above themedian (TGF‐β1 ≥ 47:80) exhibited (a) increased triglycerides, (b) increased VLDL-C, and decreased (c) HDL-C levels (all p values wereobtained by the independent t-test).
8 Mediators of Inflammation
Disclosure
The sponsors of this study, who played no role in gathering,analyzing, or interpreting the data presented herein, are pub-lic organizations whose role is to support science in general.
Conflicts of Interest
The authors declare that there is no conflict of interestregarding the publication of this paper.
Authors’ Contributions
Rayra P. Santiago and Magda O. S. Carvalho contributedequally to this study.
Acknowledgments
We would like to thank all the SCA individuals who agreed toparticipate in our research protocol. We also thank the staff ofthe Bahia State Hematology and Hemotherapy Foundation(HEMOBA) for their assistance with sample collection andfor caring for SCD individuals. The authors are grateful toAndris K.Walter for the English revision andmanuscript copy-editing services. This study was financed in part by the Coorde-nação de Aperfeiçoamento de Pessoal de Nível Superior-Brasil(CAPES), Finance Code 001 (RPS and SCMAY). Our workwas also supported by the Fundação de Amparo à Pesquisado Estado da Bahia (FAPESB SUS0034/2013 and 8133/2014)through a grant to MSG.
References
[1] D. C. Rees, S. L. Thein, A. Osei et al., “The clinical significanceof K-Cl cotransport activity in red cells of patients with HbSCdisease,” Haematologica, vol. 100, no. 5, pp. 595–600, 2015.
[2] G. J. Kato, F. B. Piel, C. D. Reid et al., “Sickle cell disease,”Nature Reviews Disease Primers, vol. 4, no. 1, article 18010,2018.
[3] R. P. Santiago, C. Vieira, C. S. A. Adanho et al., “Laboratoryand genetic biomarkers associated with cerebral blood flowvelocity in hemoglobin SC disease,” Disease Markers,vol. 2017, Article ID 6359871, 11 pages, 2017.
[4] C. C. da Guarda, S. C. M. A. Yahouédéhou, R. P. Santiago et al.,“Sickle cell disease: a distinction of two most frequent geno-types (HbSS and HbSC),” PLoS One, vol. 15, no. 1,pp. e0228399–e0228399, 2020.
[5] G. J. Kato, M. T. Gladwin, and M. H. Steinberg, “Deconstruct-ing sickle cell disease: reappraisal of the role of hemolysis in thedevelopment of clinical subphenotypes,” Blood Reviews,vol. 21, no. 1, pp. 37–47, 2007.
[6] M. H. Steinberg, “Genetic etiologies for phenotypic diversity insickle cell anemia,” ScientificWorldJournal, vol. 9, pp. 46–67,2009.
[7] M. M. Aleluia, C. C. da Guarda, R. P. Santiago et al., “Associ-ation of classical markers and establishment of the dyslipid-emic sub-phenotype of sickle cell anemia,” Lipids in Healthand Disease, vol. 16, no. 1, p. 74, 2017.
[8] C. C. D. Guarda, R. P. Santiago, L. M. Fiuza et al., “Heme-mediated cell activation: the inflammatory puzzle of sickle cell
anemia,” Expert Review of Hematology, vol. 10, no. 6, pp. 533–541, 2017.
[9] C. Lanaro, C. F. Franco-Penteado, D. M. Albuqueque, S. T. O.Saad, N. Conran, and F. F. Costa, “Altered levels of cytokinesand inflammatory mediators in plasma and leukocytes ofsickle cell anemia patients and effects of hydroxyurea therapy,”Journal of Leukocyte Biology, vol. 85, no. 2, pp. 235–242, 2009.
[10] W. Vilas-Boas, B. A. Veloso Cerqueira, C. V. B. Figueiredoet al., “Association of homocysteine and inflammatory-related molecules in sickle cell anemia,” Hematology, vol. 21,no. 2, pp. 126–131, 2015.
[11] M. O. S. Carvalho, T. Araujo-Santos, J. H. O. Reis et al.,“Inflammatory mediators in sickle cell anaemia highlight thedifference between steady state and crisis in paediatricpatients,” British Journal of Haematology, vol. 182, no. 6,pp. 933–936, 2018.
[12] V. G. Nolan, A. Adewoye, C. Baldwin et al., “Sickle cell legulcers: associations with haemolysis and SNPs in Klotho,TEK and genes of the TGF-beta/BMP pathway,” British Jour-nal of Haematology, vol. 133, no. 5, pp. 570–578, 2006.
[13] L. Attisano and J. L. Wrana, “Signal transduction by the TGF-beta superfamily,” Science, vol. 296, no. 5573, pp. 1646-1647,2002.
[14] K. Miyazono, K. Kusanagi, and H. Inoue, “Divergence andconvergence of TGF-beta/BMP signaling,” Journal of CellularPhysiology, vol. 187, no. 3, pp. 265–276, 2001.
[15] F. N. Ziyadeh, “Mediators of diabetic renal disease: the case forTGF-? as the major mediator,” J Am Soc Nephrol, vol. 15,no. 90010, pp. 55S–557, 2004.
[16] A. Moustakas, K. Pardali, A. Gaal, and C. H. Heldin, “Mecha-nisms of TGF-beta signaling in regulation of cell growth anddifferentiation,” Immunology Letters, vol. 82, no. 1-2, pp. 85–91, 2002.
[17] L. . S. Torres, J. V. Okumura, D. G. H. . Silva et al., “Plasmalevels of TGF-β1 in homeostasis of the inflammation in sicklecell disease,” Cytokine, vol. 80, pp. 18–25, 2016.
[18] H.-L. Hsieh, H. H. Wang, W. B. Wu, P. J. Chu, and C. M.Yang, “Transforming growth factor-β1 induces matrixmetalloproteinase-9 and cell migration in astrocytes: rolesof ROS-dependent ERK- and JNK-NF-κB pathways,” Jour-nal of Neuroinflammation, vol. 7, no. 1, pp. 88–88, 2010.
[19] H.-J. Kwak, M. J. Park, H. Cho et al., “Transforming growthfactor-β1 induces tissue inhibitor of metalloproteinase-1expression via activation of extracellular signal-regulatedkinase and Sp1 in human fibrosarcoma cells,” Molecular Can-cer Research, vol. 4, no. 3, pp. 209–220, 2006.
[20] R. Khokha, A. Murthy, and A. Weiss, “Metalloproteinases andtheir natural inhibitors in inflammation and immunity,”Nature Reviews. Immunology, vol. 13, no. 9, pp. 649–665, 2013.
[21] P. Seizer and A. E. May, “Platelets and matrix metalloprotein-ases,” Thrombosis and Haemostasis, vol. 110, no. 5, pp. 903–909, 2013.
[22] S.-A. Park,M. J. Kim, S. Y. Park et al., “TIMP-1mediates TGF-β-dependent crosstalk between hepatic stellate and cancer cells viaFAK signaling,” Scientific Reports, vol. 5, no. 1, p. 16492, 2015.
[23] S.-K. Leivonen, K. Lazaridis, J. Decock, A. Chantry, D. R.Edwards, and V. M. Kähäri, “TGF-β-elicited induction of tis-sue inhibitor of metalloproteinases (TIMP)-3 expression infibroblasts involves complex interplay between Smad3, p38α,and ERK1/2,” PLoS One, vol. 8, no. 2, pp. e57474–e57474,2013.
9Mediators of Inflammation
[24] D. C. Rees and J. S. Gibson, “Biomarkers in sickle cell disease,”British Journal of Haematology, vol. 156, no. 4, pp. 433–445,2012.
[25] M. H. Steinberg and G. P. Rodgers, “Pathophysiology of sicklecell disease: role of cellular and genetic modifiers,” Seminars inHematology, vol. 38, no. 4, pp. 299–306, 2001.
[26] R. L. Nagel, M. E. Fabry, and M. H. Steinberg, “The paradox ofhemoglobin SC disease,” Blood Reviews, vol. 17, no. 3, pp. 167–178, 2003.
[27] F. Lionnet, N. Hammoudi, K. S. Stojanovic et al., “Hemoglobinsickle cell disease complications: a clinical study of 179 cases,”Haematologica, vol. 97, no. 8, pp. 1136–1141, 2012.
[28] J. E. Brittain and L. V. Parise, “Cytokines and plasma factors insickle cell disease,” Current Opinion in Hematology, vol. 14,no. 5, pp. 438–443, 2007.
[29] I. Pantsulaia, S. Trofimov, E. Kobyliansky, and G. Livshits,“Heritability of circulating growth factors involved in theangiogenesis in healthy human population,” Cytokine,vol. 27, no. 6, pp. 152–158, 2004.
[30] R. K. Assoian, A. Komoriya, C. A. Meyers, D. M. Miller, andM. B. Sporn, “Transforming growth factor-beta in humanplatelets. Identification of a major storage site, purification,and characterization,” The Journal of Biological Chemistry,vol. 258, no. 11, pp. 7155–7160, 1983.
[31] J. Ahamed, N. Burg, K. Yoshinaga, C. A. Janczak, D. B. Rifkin,and B. S. Coller, “In vitro and in vivo evidence for shear-induced activation of latent transforming growth factor-beta1,” Blood, vol. 112, no. 9, pp. 3650–3660, 2008.
[32] N. G. Frangogiannis, “The role of transforming growth factor(TGF)-β in the infarcted myocardium,” Journal of ThoracicDisease, vol. 9, Supplement 1, pp. S52–S63, 2017.
[33] P. Sundd, M. T. Gladwin, and E. M. Novelli, “Pathophysiologyof sickle cell disease,” Annual Review of Pathology: Mecha-nisms of Disease, vol. 14, no. 1, pp. 263–292, 2019.
[34] M. O. Seixas, L. C. Rocha, M. B. Carvalho et al., “Levels ofhigh-density lipoprotein cholesterol (HDL-C) among childrenwith steady-state sickle cell disease,” Lipids in Health and Dis-ease, vol. 9, no. 1, p. 91, 2010.
[35] R. K. Ephraim, P. Adu, E. Ake et al., “Normal non-HDL cho-lesterol, low total cholesterol, and HDL cholesterol levels insickle cell disease patients in the steady state: a case-controlstudy of Tema Metropolis,” Journal of Lipids, vol. 2016, ArticleID 7650530, 5 pages, 2016.
[36] C. C. da Guarda, S. C. M. A. Yahouédéhou, R. P. Santiago et al.,“Investigation of lipid profile and clinical manifestations inSCA children,” Disease Markers, vol. 2020, Article ID8842362, 10 pages, 2020.
[37] F. K. Welty, “How do elevated triglycerides and low HDL-cholesterol affect inflammation and atherothrombosis?,” Cur-rent Cardiology Reports, vol. 15, no. 9, pp. 400–400, 2013.
10 Mediators of Inflammation
View publication statsView publication stats


![Biochimica et Biophysica Acta - COnnecting REpositories · chronic and acute airway inflammation [2,3]. In this regard, especially terpenoids,likethe monoterpene oxide1,8-cineol](https://static.fdocument.org/doc/165x107/5f0a739a7e708231d42bb33b/biochimica-et-biophysica-acta-connecting-repositories-chronic-and-acute-airway.jpg)