The Hospital for Sick Children Technology Assessment at ...
311
The Hospital for Sick Children Technology Assessment at SickKids (TASK) FULL REPORT THE ECONOMIC EVALUATION OF EARLY INTERVENTION WITH ANTI-TUMOR NECROSIS FACTOR-α TREATMENTS IN PEDIATRIC CROHN’S DISEASE Authors: Naazish S. Bashir, MSc, MBA, PhD Research Fellow, Child Health Evaluative Sciences, The Hospital for Sick Children, Toronto, Canada Thomas D. Walters, MD, MSc Staff Physician, Gastroenterology, Hepatology and Nutrition, The Hospital for Sick Children, Toronto, Canada Anne M. Griffiths, MD Staff Physician, Gastroenterology, Hepatology and Nutrition, The Hospital for Sick Children, Toronto, Canada Shinya Ito, MD Head, Division of Clinical Pharmacology & Toxicology, The Hospital for Sick Children, Toronto, Canada Professor, Faculty of Medicine, The University of Toronto, Toronto, Canada Wendy J. Ungar, MSc, PhD Senior Scientist, Child Health Evaluative Sciences, The Hospital for Sick Children, Toronto, Canada Professor, Institute of Health Policy, Management and Evaluation, University of Toronto, Toronto, Canada Report No. 2019-01 Date: February 26, 2019
Transcript of The Hospital for Sick Children Technology Assessment at ...
The Hospital for Sick Children Technology Assessment at SickKids (TASK)
FULL REPORT
THE ECONOMIC EVALUATION OF EARLY INTERVENTION WITH ANTI-TUMOR NECROSIS FACTOR-α TREATMENTS IN PEDIATRIC CROHN’S DISEASE
Authors:
Naazish S. Bashir, MSc, MBA, PhD
Research Fellow, Child Health Evaluative Sciences, The Hospital for Sick Children, Toronto, Canada
Thomas D. Walters, MD, MSc Staff Physician, Gastroenterology, Hepatology and Nutrition, The Hospital for Sick Children, Toronto,
Canada
Anne M. Griffiths, MD Staff Physician, Gastroenterology, Hepatology and Nutrition, The Hospital for Sick Children, Toronto,
Canada
Shinya Ito, MD Head, Division of Clinical Pharmacology & Toxicology, The Hospital for Sick Children, Toronto, Canada
Professor, Faculty of Medicine, The University of Toronto, Toronto, Canada
Wendy J. Ungar, MSc, PhD Senior Scientist, Child Health Evaluative Sciences, The Hospital for Sick Children, Toronto, Canada Professor, Institute of Health Policy, Management and Evaluation, University of Toronto, Toronto,
Canada
Report No. 2019-01
Date: February 26, 2019
Acknowledgements
This research was generously supported by the Hospital for Sick Children Restracomp Doctoral
Scholarship, the University of Toronto, Institute of Health Policy, Management and Evaluation
Graduate Fellowship, Eugene Vayda Award, Dr. Robert Duff Barron Graduate Scholarship in
Public Health Policy Award, Doctoral Completion Award, the IHPME Travel Award, the
Canadian Federation of University Women (CFUW) Dr. Alice B. Wilson Award, the Canadian
Institutes of Health Research (CIHR) operating grant (#137137) to W. Ungar, the Ontario
Ministry of Health Drug Innovation Fund Grant No. 2010-001, the CIHR Travel Award, and the
Genome Canada Conference Travel Award.
Thanks to the RISK Cohort Study in Crohn’s Disease Consortium for the use of the RISK-
PROKIIDS dataset. Thanks to Dr. Mary-Ellen Hogan, Mr. Austin Nam, Dr. Petros Pechlivanoglou,
Dr. Peter Austin, Dr. Jan Barnsley and Dr. Eleanor Pullenayegum for their help and suggestions
in tackling this project. Thanks also to Dr. David Naimark, Dr. Lusine Abrahamyan, Dr. Beate
Sander, Dr. Walter Wodchis, Dr. Wanrudee Isaranuwatchai, Dr. Murray Krahn, Dr. Myla Moretti,
and Ms. Kate Tsiplova for their insight.
List of Abbreviations
5-ASA 5-aminosalicylic acid
6-MP 6-mercaptopurine
ADA Adalimumab
AZA Azathioprine
CAD Canadian dollar
CADTH Canadian Agency for Drugs and Technologies in Health
CD Crohn’s Disease
CDHTA Crohn’s Disease Health Technology Assessment
CEA Cost-effectiveness analysis
CDN Canadian
CI Confidence interval
CIHI Canadian Institute of Health Information
CMG Case Mix Group
CS Corticosteroids
CUA Cost-utility analysis
EN Enteral nutrition
HRQoL Health-related quality of life
g Gram
HTA Health technology assessment
HR Hazard ratio
IBD Inflammatory bowel disease
ICER Incremental cost-effectiveness ratio
ICUR Incremental cost-utility ratio

IFX Infliximab
IM Immunomodulator
ISPOR International Society For Pharmacoeconomics and Outcomes Research
MOHLTC Ontario Ministry of Health and Long-Term Care
kcal Calorie
kg Kilogram
mg Milligram
MTA Material transfer agreement
MTX Methotrexate
NICE National Institute for Health and Care Excellence (United Kingdom)
OCCI Ontario Case Costing Initiative
OR Odds ratio
PCDAI Pediatric Crohn’s Disease Activity Index
PGA Physician Global Assessment
QALY Quality-adjusted life year
RCT Randomized controlled trial
SD Standard Deviation
SOC Standard of Care
TNF Tumor necrosis factor
UC Ulcerative colitis
UK United Kingdom
USA or US United States of America
wPCDAI Weighted Pediatric Crohn’s Disease Activity Index
WTP Willingness to pay
Table of Contents
Executive Summary ........................................................................................................................ xx
Acknowledgements .......................................................................................................................... ii
Table of Contents ............................................................................................................................. v
List of Tables .................................................................................................................................... x
List of Figures ................................................................................................................................. xv
List of Appendices ....................................................................................................................... xviii
List of Abbreviations ....................................................................................................................... iii
Introduction ............................................................................................................................... 1
1.1 Overview ............................................................................................................................. 1
1.2 Background Information ..................................................................................................... 6
1.2.1 Crohn’s Disease ....................................................................................................... 6
1.3 Anti-TNF-α Interventions and How They Might Work ........................................................ 7
1.4 Clinical Efficacy of Anti-TNF-α Treatments in Pediatric Crohn’s Disease ........................... 8
1.4.1 Studies and Reviews of the Clinical Efficacy of Anti-TNF-α Treatments ................. 8
1.5 Economic Evaluations and Health Technology Assessments of Anti-TNF-α Treatments in Crohn’s Disease ............................................................................................................. 13
1.6 Treatment Pathway in Crohn’s Disease ............................................................................ 18
1.7 Theoretical Framework ..................................................................................................... 19
1.8 The Problem ...................................................................................................................... 23
1.9 Primary Objective ............................................................................................................. 23
1.10 Secondary Objective ......................................................................................................... 24
1.11 Research Design ................................................................................................................ 25
Methods ................................................................................................................................... 27
vi
2.1 Overview of Methods and Study Design .......................................................................... 27
2.2 The Pediatric Crohn’s Disease Cohort............................................................................... 29
2.2.1 The RISK-PROKIIDS Study Data ............................................................................. 29
2.2.1.1 Inclusion Criteria ..................................................................................... 30
2.2.2 Data Extraction and Patient Characteristics from the RISK-PROKIIDS Study ....... 32
2.2.2.1 Assigning Visit Dates ............................................................................... 32
2.2.2.2 Determining Patient Health State .......................................................... 34
2.2.2.2.1 The Weighted Pediatric Crohn’s Disease Activity Index and the Physician
Global Assessment ..................................................................................................... 35
2.2.2.3 Treatment Determination ...................................................................... 38
2.2.2.4 Extracting Patient Characteristics and Covariate Data .......................... 41
2.2.2.4.1 Summarizing Patient Characteristics ................................................ 42
2.3 Handling Missing Data ...................................................................................................... 43
2.3.1 Imputation of Missing Albumin Data .................................................................... 43
2.3.2 Handling Imputed Data ......................................................................................... 45
2.4 Propensity Score Analysis ................................................................................................. 46
2.4.1 Propensity Score Matching ................................................................................... 49
2.4.2 Propensity Score Weighting .................................................................................. 50
2.4.3 Propensity Score Analysis with Sub-classification ................................................ 50
2.4.4 Covariate Balancing Propensity Score (CBPS) Method ......................................... 50
2.4.5 Balance Diagnostics on the Propensity Score Methods ....................................... 51
2.4.5.1 Propensity Score Analysis Plots .............................................................. 51
2.4.6 Choosing an Appropriate Propensity Score Analysis Method and Exporting Matched Datasets ................................................................................................. 52
vii
2.5 Cost-effectiveness Analysis ............................................................................................... 54
2.5.1 Target Population ................................................................................................. 54
2.5.2 Comparators ......................................................................................................... 54
2.5.3 Perspectives .......................................................................................................... 55
2.5.4 Clinical Outcomes ................................................................................................. 56
2.5.5 Time Horizon ......................................................................................................... 56
2.5.6 The Crohn’s Disease Cost-effectiveness Model .................................................... 56
2.5.6.1 Health State Transition Model ............................................................... 57
2.5.6.2 Cycle Length ............................................................................................ 63
2.5.6.3 Transition Probabilities ........................................................................... 63
2.5.6.4 Discount Rate.......................................................................................... 67
2.5.7 Costing .................................................................................................................. 67
2.5.7.1 Direct Costs ............................................................................................. 68
2.5.7.1.1 Costs of Treatments ......................................................................... 68
2.5.7.1.2 Cost of Medical Procedures .............................................................. 84
2.5.7.2 Indirect Costs .......................................................................................... 88
2.5.7.3 Cost Valuation ........................................................................................ 90
2.5.8 Model Assumptions .............................................................................................. 90
2.5.9 Model Validation and Calibration ......................................................................... 92
2.5.10 Incremental Cost-effectiveness Analysis .............................................................. 93
2.5.11 Uncertainty Analysis ............................................................................................. 93
2.5.11.1 Structural Uncertainty ............................................................................ 94
2.5.11.2 Parameter Uncertainty ........................................................................... 95
2.5.11.3 Scenario Analysis .................................................................................... 96
viii
2.6 Data Management ............................................................................................................ 97
2.7 Ethics ................................................................................................................................. 98
Results ...................................................................................................................................... 99
3.1 Overview of Results .......................................................................................................... 99
3.2 Characteristics of the Unadjusted Patient Population ................................................... 100
3.3 Imputation of Missing Data ............................................................................................ 111
3.4 Propensity Score Analysis ............................................................................................... 112
3.4.1 Propensity Score Matching ................................................................................. 113
3.4.2 Propensity Score Weighting ................................................................................ 114
3.4.3 Covariate Balancing Propensity Score (CBPS) Method ....................................... 114
3.4.4 Propensity Score Analysis with Sub-classification .............................................. 115
3.4.5 Balance Diagnostics on the Propensity Score Methods ..................................... 116
3.4.6 Choosing the Optimal Propensity Score Analysis Method ................................. 121
3.5 Characteristics and Clinical Outcomes of the Adjusted RISK-PROKIIDS Patient Population ....................................................................................................................... 122
3.6 Treatment Patterns in the Adjusted Patient Population ................................................ 132
3.7 Cost-effectiveness Analysis ............................................................................................. 143
3.7.1 Cost-effectiveness in the Healthcare Public Payer Reference (Base) Case ........ 143
3.7.2 Cost-effectiveness with the Societal Payer Perspective Reference (Base) Case 150
3.7.3 Additional Cost-effectiveness Analysis ............................................................... 155
3.7.4 Comparison of Cost-effectiveness Analyses with Different Matched Datasets . 161
3.7.5 Uncertainty Analysis ........................................................................................... 165
3.7.5.1 Structural and Methodological Uncertainty ......................................... 165
3.7.5.2 Parameter uncertainty ......................................................................... 171
3.7.5.3 Scenario Analysis .................................................................................. 172
ix
3.7.6 Validation and Calibration of the Cost-effectiveness Model .............................. 178
3.7.7 Microsimulations and Sampling in the Cost-effectiveness Model ..................... 182
3.7.8 Summary of Cost-effectiveness Analysis ............................................................ 185
Discussion ............................................................................................................................... 186
4.1 Overview .......................................................................................................................... 186
4.2 The Cost-Effectiveness of Early Anti-TNF-αTreatment in Pediatric Crohn’s Disease and Related Research ............................................................................................................ 187
4.3 The Societal and Public Health Care Payer Perspectives ................................................. 192
4.4 Biologics Drug Policy ....................................................................................................... 194
4.5 Strengths and Limitations ............................................................................................... 195
4.5.1 Strengths of the Study ........................................................................................... 195
4.5.2 Limitations of the Study ......................................................................................... 198
4.6. Generalizability of the Study ........................................................................................... 201
4.7 Implications for Stakeholders .......................................................................................... 203
4.7.1. Implications for Clinical Practice ........................................................................... 203
4.7.2 Implications for Policy ............................................................................................ 206
4.7.3. Implications for Manufacturers ............................................................................ 209
4.7.4. Implications for Patients and Caregivers .............................................................. 210
4.7.5. Implications for Researchers ................................................................................ 210
4.8 Biosimilars and Other New Biologic Market Entrants ..................................................... 216
4.9 Future Research ............................................................................................................... 218
4.10 Conclusion ...................................................................................................................... 221
Appendices .................................................................................................................................. 224
References .................................................................................................................................. 272
x
List of Tables
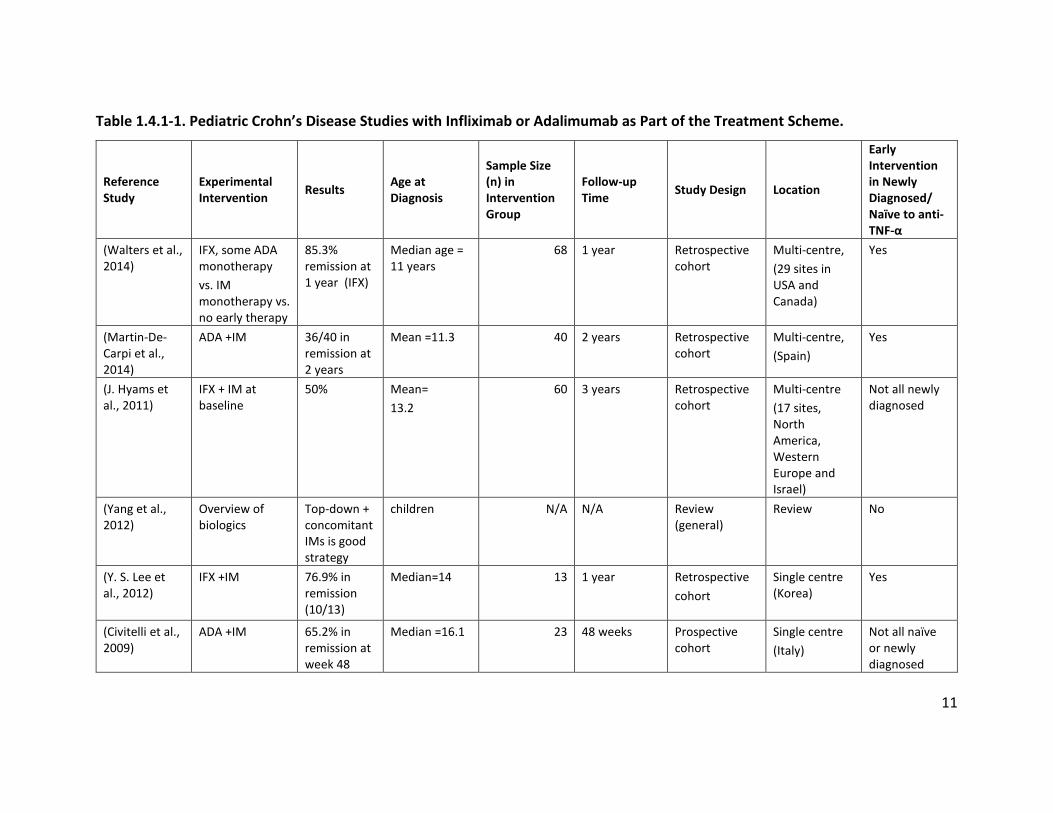
Table 1.4.1-1. Pediatric Crohn’s Disease Studies with Infliximab or Adalimumab as Part of the Treatment Scheme. ........................................................................................................... 11
Table 1.5-1. Economic Evaluations in Crohn’s Disease. ................................................................ 16
Table 2.2.1.1-1. Inclusion Criteria for Crohn’s Disease Subjects from RISK-PROKIIDS Data Set. . 31
Table 2.2.2.1-1. Visit Time Point Assignment and Corresponding Weeks in the RISK-PROKIIDS Study......................................................................................................................................... 34
Table 2.2.2.2.1-1. The Weighted PCDAI Scoring System. ............................................................. 37
Table 2.2.2.2.1-2. The Number of Subjects at Each Visit Month with Undeterminable Health States. ....................................................................................................................................... 38
Table 2.2.2.3-1. Drug Classes and Generic Drug Names That Were Used in the RISK-PROKIIDS Study......................................................................................................................................... 40
Table 2.2.2.4-1. Patient Characteristics Extracted from the RISK-PROKIIDS data. ....................... 42
Table 2.4.1-1. Nearest neighbour matching specifications. ......................................................... 49
Table 2.5.6.3-1. Transition Probabilities for Health State Transitions Based on the RISK-PROKIIDS Study. ....................................................................................................................... 65
Table 2.5.6.3-2. Transition Probabilities Used in the Cost-Effective Analysis. ............................. 66
Table 2.5.7-1. Costs Associated with Crohn’s Disease Health States. .......................................... 68
Table 2.5.7.1.1-1. Costs and Doses of Anti-TNF-α Treatments. ................................................... 72
Table 2.5.7.1.1-2. Costs and Doses of Immunomodulators. ........................................................ 74
Table 2.5.7.1.1-3. Costs and Doses of Corticosteroids. ................................................................ 76
Table 2.5.7.1.1-4. Costs and Doses of Antibiotics. ........................................................................ 79
Table 2.5.7.1.1-5. Costs and Doses of Oral 5-ASA Drugs. ............................................................. 81
Table 2.5.7.1.1-6. Cost and Dose of Enteral Nutrition Brands. ..................................................... 83
Table 2.5.7.1.2-1. Medical Procedure Costs for CD Patients. ....................................................... 86
Table 2.5.7.1.2-2. Costs for Adverse Events of Special Interest and Surgical Complications. ...... 87
xi
Table 2.5.7.1.2-3. Infusion Clinic Costs. ........................................................................................ 88
Table 2.5.7.2-1. Caregiver loss of productivity. ............................................................................ 89
Table 3.2-1. Patient Characteristics in the Unadjusted RISK-PROKIIDS Comparator Groups. ... 103
Table 3.2-2. The Ethnic Origins of the Unadjusted RISK-PROKIIDS Comparator Groups. .......... 104
Table 3.2-3. Disease Characteristics at Diagnosis in Unadjusted RISK-PROKIIDS Comparator Groups. ................................................................................................................................... 105
Table 3.2-4. The Steroid-related Health State at 6, 12, 18, 24, 30, and 36 Months Post-diagnosis in the Unadjusted RISK-PROKIIDS Comparator Groups. ........................................ 106
Table 3.4.4-1. The Number of Patients per Treatment Group and the Number of Imbalanced Covariates with the Subclassification Propensity Score Analysis Method. ........................... 115
Table 3.4.5-1. Balance diagnostics with the Nearest Neighbour Matching, Weighting and Covariate Balance Propensity Score Analysis Methods. ........................................................ 118
Table 3.5-1. Patient Characteristics in the Adjusted RISK-PROKIIDS Comparator Groups. ........ 126
Table 3.5-2. The Ethnic Origins of the Adjusted RISK-PROKIIDS Comparator Groups. .............. 127
Table 3.5-3. Disease Characteristics at Diagnosis in Adjusted RISK-PROKIIDS Comparator Groups. ................................................................................................................................... 128
Table 3.5-4. The Steroid-related Health State at 6, 12, 18, 24, 30, and 36 Months Post-diagnosis in the Adjusted RISK-PROKIIDS Comparator Groups. ............................................ 129
Table 3.7.1-1. Cost-effectiveness Analysis Results Summary from a Health Care Payer Perspective. ............................................................................................................................ 146
Table 3.7.2-2. Cost-effectiveness Analysis Results Summary from a Societal Perspective. ....... 152
Table 3.7.3-1. Cost-effectiveness Analysis Results Summary from a Public Health Care Payer Perspective Using Remission as the Outcome. ...................................................................... 157
Table 3.7.3-2. Cost-effectiveness Analysis Results Summary from a Societal Payer Perspective Using Remission as the Outcome. ...................................................................... 158
Table 3.7.4-1. Summary Results of the Cost-effectiveness Analysis from a Public Health Care Payer Perspective Using Remission as the Outcome with Imputed RISK-PROKIIDS Datasets. ................................................................................................................................. 163
Table 3.7.5.1-1. Sensitivity Analysis of Cost-effectiveness Results Summary from a Public Health Care Payer Perspective with Different Discount Rates. ............................................. 167
xii
Table 3.7.5.1-2. Sensitivity Analysis of Cost-effectiveness Results Summary from a Societal Perspective with Different Discount Rates. ........................................................................... 168
Table 3.7.5.1-3. Sensitivity Analysis of Cost-effectiveness Results Summary from a Public Health Care Payer Perspective Using Remission as the Outcome with Different Discount Rates. ...................................................................................................................................... 169
Table 3.7.5.1-4. Sensitivity Analysis of Cost-effectiveness Results Summary from a Societal Payer Perspective Using Remission as the Outcome with Different Discount Rates. ........... 170
Table 3.7.5.3-1. The Impact on the Incremental Cost-effectiveness Ratio Following a Reduction in the Price of Infliximab. ...................................................................................... 175
Table 3.7.5.3-2. The Impact on the Incremental Cost-effectiveness Ratio With Changes to the Rate of Escalation to Anti-TNF-α Treatment in the Standard Care Group. ..................... 176
Table 3.7.6-1. Validation of the Cost-effectiveness Model with Internal Parameters. .............. 180
Table 3.7.6-2. Validation of the Cost-effectiveness Model with the External Parameter of Percent of Subjects in Remission at One Year. ...................................................................... 181
Table A6-1. Spearman’s correlation between PGA and wPCDAI in 710 RISK-PROKIIDS CD subjects. ................................................................................................................................. 230
Table A8-1. The probability of switching to an anti-TNF-α treatment each week for the standard care group over three years. .................................................................................. 232
Table A9-1. Canadian age-adjusted all causes mortality for 1 to18 years of age. ..................... 233
Table A10-1. The proportion of subjects in each comparator group on a particular class of drug in each week for three years. ........................................................................................ 234
Table A11-1. The weighted average cost of immunomodulators per week and per weight for the standard care comparator group. ................................................................................... 241
Table A11-2. The weighted average cost of immunomodulators per week and per weight for the early anti-TNF-α intervention comparator group............................................................ 241
Table A12-1. The weighted average cost of corticosteroids per week and per weight for the standard care comparator group. .......................................................................................... 243
Table A12-2. The weighted average cost of corticosteroids per week and per weight for the early anti-TNF-α intervention comparator group. ................................................................. 244
Table A13-1. The weighted average cost of antibiotics per week and per weight for the standard care and early anti-TNF-α intervention comparator groups. ................................. 245
xiii
Table A14-1. The weighted average cost of oral 5-ASA’s per week and per weight for the standard care and early anti-TNF-α intervention comparator groups. ................................. 246
Table A15-1. The age-dependent mean weekly cost of enteral nutrition supplements for males. ..................................................................................................................................... 247
Table A15-2. The age-dependent mean weekly cost of enteral nutrition supplements for females. .................................................................................................................................. 248
Table A19-1. Balance diagnostics for nearest neighbour matching with 1:1 ratio of treatment:control propensity score analysis method on the individual ten imputed data sets. ........................................................................................................................................ 253
Table A19-2. Balance diagnostics for nearest neighbour matching with 1:2 ratio of treatment:control propensity score analysis method on the individual ten imputed data sets. ........................................................................................................................................ 254
Table A19-3. Balance diagnostics for nearest neighbour matching with 1:3 ratio of treatment:control propensity score analysis method on the individual ten imputed data sets. ........................................................................................................................................ 255
Table A19-4. Balance diagnostics for nearest neighbour matching with 1:1 ratio of treatment:control: and caliper of 0.2 propensity score analysis method on the individual ten imputed data sets. ........................................................................................................... 256
Table A19-5. Balance diagnostics for nearest neighbour matching with 1:2 ratio of treatment:control: and caliper of 0.2 propensity score analysis method on the individual ten imputed data sets. ........................................................................................................... 257
Table A19-6. Balance diagnostics for nearest neighbour matching with 1:3 ratio of treatment:control: and caliper of 0.2 propensity score analysis method on the individual ten imputed data sets. ........................................................................................................... 258
Table A19-7. Balance diagnostics for the inverse weighting on the propensity score propensity score analysis method on the individual ten imputed data sets. ........................ 259
Table A19-8. Balance diagnostics for the covariate balance propensity score analysis method on the individual ten imputed data sets. ............................................................................... 260
Table A19-9. Balance diagnostics for the subclassification propensity score analysis method on the individual ten imputed data sets. ............................................................................... 261
Table A20-1. All treatment class combination used in the RISK-PROKIIDS CD patients over three years in the Standard Care Step-up group and the Early anti-TNF-α........................... 263
xiv
Table A21-1. Weekly Transition Probabilities for the “Active Disease” to “Medical Remission” Health States Derived from the Ten RISK-PROKIIDS Matched Imputed Datasets over Three years for the Standard Care Comparator Group. ................................. 265
Table A21-2. Weekly Transition Probabilities for the “Active Disease” to “Medical Remission” Health States Derived from the Ten RISK-PROKIIDS Matched Imputed Datasets over Three years for the Early anti-TNF-α Comparator Group. .............................. 266
Table A21-3. Weekly Transition Probabilities for the Continued “Medical Remission” Health State Derived from the Ten RISK-PROKIIDS Matched Imputed Datasets over Three years for the Standard Care Comparator Group. ............................................................................ 267
Table A21-4. Weekly Transition Probabilities for the Continued “Medical Remission” Health State Derived from the Ten RISK-PROKIIDS Matched Imputed Datasets over Three years for the Early anti-TNF-α Comparator Group. ......................................................................... 268
Table A21-5. Weekly Transition Probabilities for the “Active Disease” to “Active Disease Requiring Surgery or Hospitalization” State Derived from the Ten RISK-PROKIIDS Matched Imputed Datasets over Three years for the Standard Care and Early anti-TNF-α Comparator Groups. .............................................................................................................. 269
Table A21-6. Weekly Transition Probabilities for the “Surgical Remission” to “Active Disease” State Derived from the Ten RISK-PROKIIDS Matched Imputed Datasets over Three years for the Standard Care and Early anti-TNF-α Comparator Groups. .................... 270
xv
List of Figures
Figure 1.7-1. The Crohn’s Disease Health Technology Assessment (CDHTA) Theoretical Framework. .............................................................................................................................. 22
Figure 2.1-1. Process flow of data analysis. .................................................................................. 28
Figure 2.4-1. Summary Flow Process of Propensity Score Analysis Methods and Process. ......... 48
Figure 2.5.6.1-1 The Health State Transition Diagram for Crohn’s Disease. ................................ 61
Figure 2.5.6.1-2. Pathways From Each Health State in the Crohn’s Disease Cost-Effectiveness Model. ...................................................................................................................................... 62
Figure 3.2-1. Density Plot of Albumin levels (g/dL) at Diagnosis in the Unadjusted RISK-PROKIIDS Crohn’s Disease Population. .................................................................................. 108
Figure 3.2-2. Density Plots of Age (years) at Diagnosis in the Unadjusted RISK-PROKIIDS Population. ............................................................................................................................. 109
Figure 3.2-3. Density Plots of Height Z-score (HtDx) at Diagnosis in the Unadjusted RISK-PROKIIDS Crohn’s Disease Population. ................................................................................. 110
Figure 3.4.5-1. Jitter Plot Showing the Distribution of the Propensity Score Among Unmatched and Matched Subjects. ....................................................................................... 119
Figure 3.4.5-2. Representative Love Plot Showing Covariate Balance Following Propensity Score Matching. ..................................................................................................................... 120
Figure 3.5-1. Comparison Between Early anti-TNF-α Intervention and Step-up Groups in the Percentage of People in Remission and Steroid-free Remission at the End of Years 1, 2, and 3. ...................................................................................................................................... 131
Figure 3.6-1. The Change in Treatment Over Three Years in the Early anti-TNF-α Intervention Group. ............................................................................................................... 134
Figure 3.6-2. The Change in Treatment Over Three Years in the Standard Care (step-up) Group. .................................................................................................................................... 135
Figure 3.6-3. Drug Treatment Combinations in the RISK-PROKIIDS Comparator Groups 13 Weeks After Diagnosis. .......................................................................................................... 138
Figure 3.6-4. Drug Treatment Combinations in the RISK-PROKIIDS Comparator Groups 26 Weeks After Diagnosis. .......................................................................................................... 139
xvi
Figure 3.6-5. Drug Treatment Combinations in the RISK-PROKIIDS Comparator Groups 52 Weeks After Diagnosis. .......................................................................................................... 140
Figure 3.6-6. Drug Treatment Combinations in the RISK-PROKIIDS Comparator Groups 105 Weeks After Diagnosis. .......................................................................................................... 141
Figure 3.6-7. Drug Treatment Combinations in the RISK-PROKIIDS Comparator Groups 156 Weeks After Diagnosis. .......................................................................................................... 142
Figure 3.7.1-1. Incremental Cost-effectiveness Scatter Plot of the Probabilistic (2-D) Cost-effectiveness Analysis of Early anti-TNF-α Intervention vs. Standard Care from a Public Healthcare Perspective. ......................................................................................................... 147
Figure 3.7.1-2. Incremental Cost-effectiveness Scatter Plot of the One Dimensional Microsimulation Cost-effectiveness Analysis of Early anti-TNF-α Intervention vs. Standard Care from a Public Healthcare Perspective. .......................................................................... 148
Figure 3.7.1-3. Cost-effectiveness Acceptability Curve of the Probabilistic (2-D) Cost-effectiveness Analysis of Early anti-TNF-α Intervention vs. Standard Care from a Public Healthcare Perspective. ......................................................................................................... 149
Figure 3.7.2-1. Incremental Cost-effectiveness Scatter Plot of the Probabilistic (2-D) Cost-effectiveness Analysis of Early anti-TNF-α Intervention vs. Standard Care from a Societal Perspective. ............................................................................................................................ 153
Figure 3.7.2-2. Cost-effectiveness Acceptability Curve of the Probabilistic (2-D) Cost-effectiveness Analysis of Early anti-TNF-α Intervention vs. Standard Care from a Societal Perspective. ............................................................................................................................ 154
Figure 3.7.3-1. Incremental Cost-effectiveness Scatter Plot of the Probabilistic (2-D) Cost-effectiveness Analysis of Early anti-TNF-α Intervention vs. Standard Care from a Societal Perspective with Medical Remission with or without Steroids as the Effect Measure. ........ 159
Figure 3.7.3-2. Cost-effectiveness Acceptability Curve of the Probabilistic (2-D) Cost-effectiveness Analysis of Early anti-TNF-α Intervention vs. Standard Care from a Societal Perspective with Medical Remission With or Without Steroids as the Effect Measure. ...... 160
Figure 3.7.5.3-1. Tornado Diagram Showing the Impact on the ICER when Changing the Cost of Infliximab, the Cost of Immunomodulators and the Rate of Escalating to anti-TNF-α Treatment in the Standard Care (Step-Up) Group. ................................................................ 177
Figure 3.7.7-1. The number of 1st order microsimulation trials and the variation in the ICER value. ...................................................................................................................................... 183
Figure 3.7.7-2. The Number of Second Order Samples Used for the Probabilistic Analysis and the Variation in the ICER in the 2-D microsimulation. ........................................................... 184
xvii
Figure A16-1. Distribution of Albumin (g/d/L) in the 10 imputed data sets (red lines) compared to the original distribution (blue line) among the 573 RISK-PROKIIDS subjects. . 249
Figure A16-2. Strip plot showing the distribution of the imputed (red) values among the sample values (blue) for each of ten imputed data sets. ...................................................... 250
Figure A17-1. Propensity scores densities in early anti-TNF-α intervention (treated) and standard care (untreated) samples in the unadjusted RISK-PROKIIDS Patient Population... 251
Figure A18-1. Quantile-quantile plots of covariates in unadjusted and adjusted populations. 252
Figure A22-1. Comparison of Anti-TNF-α Use Between Canadian and U.S. Crohn’s Disease Patients in the Standard Care Step-Up Group from the RISK-PROKIIDS Study Over Three Years. ...................................................................................................................................... 271
xviii
List of Appendices
Appendix 1. Methods for Scoping Literature Review for Pediatric Clinical Studies with Anti-TNF-α Treatments as First Line Therapy in Crohn’s Disease.................................................. 224
Appendix 2. Methods for Scoping Literature Review for Health Technology Assessments of anti-TNF-α Treatments in Pediatric Crohn’s Disease ............................................................. 226
Appendix 3. North American Pediatric Inflammatory Bowel Disease Clinical Centres of the RISK-PROKIIDS Study. ............................................................................................................. 227
Appendix 4. Included Subjects from the RISK-PROKIIDS Study. ................................................. 228
Appendix 5. wPCDAI Perirectal Disease Scoring Assignment Scheme. ...................................... 229
Appendix 6. Spearman’s Correlation Between PGA and wPCDAI in RISK-PROKIIDS Subjects. .. 230
Appendix 7. Formulas to Convert Probabilities from One Cycle Length to Another ................. 231
Appendix 8. Probabilities of Switching to an Anti-TNF-α Treatment Each Week for the Standard Care Group Over Three Years. ................................................................................ 232
Appendix 9. All Causes Mortality Table For Ages 1-18 Years. .................................................... 233
Appendix 10. The Proportion of Subjects on Each Drug Class Per Week. .................................. 234
Appendix 11. The Weighted Average Cost of Immunomodulators Per Week and Per Weight. 241
Appendix 12. The Weighted Average Cost of Corticosteroids Per Week and Per Weight. ........ 243
Appendix 13. The Weighted Average Cost of Antibiotics Per Week and Per Weight. ............... 245
Appendix 14. The Weighted Average Cost of Oral 5-Aminosalicylates Per Week and Per Weight. ................................................................................................................................... 246
Appendix 15. The Mean Cost Per Week for Enteral Nutrition Supplements. ............................ 247
Appendix 16. Distribution of Imputed of Albumin. .................................................................... 249
Appendix 17. Propensity Score Differences in Unadjusted CD RISK-PROKIIDS Patient Population. ............................................................................................................................. 251
Appendix 18. Quantile-quantile Plots Showing Covariate Balance. ........................................... 252
Appendix 19. Balance diagnostics for Propensity Score Analysis Methods on the Ten Imputed RISK-PROKIIDS Data Sets ......................................................................................... 253
xix
Appendix 20. Treatment Class Combinations Over Three Years in the RISK-PROKIIDS Comparator Groups. .............................................................................................................. 263
Appendix 21. Transition Probabilities for Each of the Ten Matched RISK-PROKIIDS Datasets. . 265
Appendix 22. Anti-TNF-α Use Over Three Years in Canadian and U.S. Patients in the RISK-PROKIIDS Study ...................................................................................................................... 271
xx
Executive Summary
BACKGROUND: Crohn’s disease is a chronic disorder in which sections of the gastrointestinal
tract become inflamed and ulcerated through an abnormal immune response. Costly anti-TNF-α
treatments are indicated only after other treatments have not worked. However, anti-TNF-α
treatments have been proposed as first line therapy due to their effectiveness.
OBJECTIVE: The primary objective was to assess the incremental cost-effectiveness of early
intervention with anti-TNF-α treatment vs. conventional step-up strategy at improving the
number of steroid-free remission weeks gained from public healthcare payer and societal
perspectives.
METHODS: A two-dimensional probabilistic microsimulation Markov model with seven health
states was constructed for children with moderate to severe Crohn’s disease. Newly-diagnosed
children with Crohn’s disease aged 4-17 years who received anti-TNF-α treatment and other
concomitant treatments, such as steroids and immunomodulators, within the first three
months of diagnosis were compared to children with newly-diagnosed Crohn’s disease who
received standard care of steroids and/or immunomodulators with the possibility of anti-TNF-α
treatment only after three months of diagnosis. The outcome measure was weeks in steroid-
free remission. The time horizon was three years. A scenario analysis examined variation in
costs of anti-TNF-α treatment. A North American multi-centre, observational study of children
with Crohn’s disease provided input into clinical outcomes and health care resource use. To
reduce selection bias, propensity score analysis was used.
RESULT: From a public healthcare payer perspective, early intervention with anti-TNF-α
treatment was more costly with an incremental cost of $31,112 (95% CI: 2,939, 91,715) and
more effective with 11.3 more weeks in steroid-free remission (95% CI: 10.6, 11.6) compared to
standard care, resulting in an incremental cost per steroid-free remission week gained of
$2,756. From a societal perspective, the incremental cost per steroid-free remission week
gained for early anti-TNF-α treatment was $2,968.
xxi
CONCLUSION: While unknown, if a willingness-to-pay threshold was assumed to be $2,500 per
week in steroid-free remission, early intervention with anti-TNF-α would not be cost-effective.
However, there is considerable uncertainty in the incremental cost-effectiveness ratio and
many patients escalate to anti-TNF-α eventually. Therefore, restrictive policies on anti-TNF-α
treatment access for pediatric Crohn’s patients may want to be re-visited by decision makers.
Key words: cost-effectiveness analysis, pediatric Crohn’s disease, anti-TNF-α, infliximab

1
Introduction
1.1 Overview
Crohn’s disease (CD) is a chronic gastrointestinal disorder affecting children and adults, in which
sections of the gastrointestinal tract become inflamed and ulcerated through an abnormal
response of the body’s immune system (Crohn’s and Colitis Foundation of Canada, 2012).
Symptoms and signs of chronic inflammation in CD include abdominal pain, diarrhea, weight
loss, vitamin deficiencies and growth retardation (in children) (Crohn’s and Colitis Foundation of
Canada, 2012). Canada has among the highest prevalence (1:150) and incidence of people with
Crohn’s Disease (CD) and Ulcerative Colitis (UC), collectively called Inflammatory Bowel Disease
(IBD), in the world (Crohn’s and Colitis Foundation of Canada, 2012). In Canada, the prevalence
of CD is greater than UC for children under the age of 19 and varies from province to province
(Crohn’s and Colitis Foundation of Canada, 2012). For reasons unknown, the incidence of IBD
among children, particularly for those under 10, is on the rise, but there is a lack of studies on
treatment for children particularly randomized controlled trials (Benchimol et al., 2017;
Benchimol et al., 2009; E I Benchimol et al., 2014; Eric I Benchimol et al., 2014; Crohn’s and
Colitis Foundation of Canada, 2012). Currently, an estimated 3,900 Canadian children have CD
(Benchimol et al., 2017; Benchimol et al., 2009; Crohn’s and Colitis Foundation of Canada,
2012). There are approximately 200 new cases of pediatric CD in Ontario per year with an
incidence rate of 5.48 per 100,000 children of males and females ranging from 6 months to 17
years of age (Benchimol et al., 2017; Benchimol et al., 2009). The economic burden of IBD
overall is estimated at $11,900 per person per year with an estimated annual cost-of-illness in
Canada exceeding $70 million (Crohn’s and Colitis Foundation of Canada, 2012; Rocchi et al.,
2012). These costs include not only health care resource use, but loss of productivity in parents
and caregivers. People with CD have approximately 20% higher direct medical costs than those
with UC (Crohn’s and Colitis Foundation of Canada, 2012). There is a keen interest to introduce
effective treatment as early as possible and to maintain remission for as long as possible
because of the lifelong burden of disease and its sustained impact on quality-of-life for children
and their families.
2
The traditional treatment of pediatric CD has involved a step-wise approach, or “step-up”
strategy, involving several classes of drugs such as corticosteroids, immunomodulators and
tumour necrosis factor alpha antagonist (anti-TNF-α) biologics. In Canada and the US, based on
clinical practice guidelines, remission is typically induced in newly diagnosed CD pediatric
patients using oral corticosteroids or exclusive enteral nutrition (Cincinnati Children's Hospital
Medical Center, 2007; Sadowski et al., 2009). For treatment maintenance, immunomodulators
(IM), such as the thiopurine-based azathioprine and 6-mercaptopurine, or methotrexate, can
then be introduced to maintain a sustained remission and to reduce the need for further
steroids which exert deleterious effects on growth. Children who do not respond adequately to
IMs or who cannot tolerate them may subsequently be prescribed anti-TNF-α drugs such as
infliximab (Remicade®) or adalimumab (Humira®).
There is interest in using anti-TNF-α agents earlier in the care pathway to avoid a prolonged
period of exacerbated disease before reaching remission (Jean Frederic Colombel et al., 2010)
(Petar Mamula & Kelsen, 2012; Rogler, 2013; Yang, Alex, & Catto-Smith, 2012). A recent
observational cohort study by Walters, et al., (2014) showed 85% of children with CD achieved
steroid-free clinical remission defined by Pediatric Crohn’s Disease Activity Index (PCDAI) at 12
months if they received early treatment with anti-TNFα drugs compared to 60% of children
receiving early IM therapy (Walters et al., 2014). Another observational study in pediatric CD
showed sustained effectiveness of infliximab in children and adolescents with luminal CD with
enhanced linear growth, particularly when therapy is initiated within the first 18 months of
diagnosed disease (P. C. Church et al., 2014). While these studies suggest that anti-TNFα drugs
are better at achieving remission than traditional therapies, the tradeoff is that they are more
than ten times the cost of existing treatment (up to $50,000 per year). An increased risk of
neoplasia, particularly lymphomas, has thus far been associated only with thiopurine use alone
or in combination with anti-TNF-α, and not with anti-TNF-α monotherapy (Jeffrey S Hyams et
al., 2017). Nevertheless, many parents are doubtful that the biologics are without risk (Assasi
et al., 2009). Currently the Ontario Ministry of Health and Long Term Care (MOHLTC) covers the
treatment of infliximab for approved individuals through the Exceptional Access Program.
3
Patients are eligible to receive infliximab if they demonstrate an intolerance or
unresponsiveness to immunomodulators, or if they have perianal fistulizing disease.
To date, a randomized controlled trial (RCT) examining an anti-TNF-α treatment administered
within three months after initial corticosteroid remission (early introduction of anti-TNF-α)
compared to a step-up strategy (previously standard care) with the later introduction of anti-
TNF-α treatment following immunomodulator treatment has not been completed in newly
diagnosed children with CD. However an RCT using infliximab as first-line (top-down) therapy in
naïve pediatric CD patients has been started (Cozijnsen, van Pieterson, Samsom, Escher, & de
Ridder, 2016). A recent RCT in adult CD patients examining the early intervention with three
induction doses of anti-TNF-α followed by thiopurine monotherapy (“top-down” approach)
showed a greater proportion of patients (60.0%) in remission at week 26 compared to the
standard care (“step-up”) group (35.9%) (Geert D'Haens et al., 2008), and, more importantly,
greater likelihood of sustained mucosal healing (Baert et al., 2010). Another similar trial in adult
CD patients showed similar remission rates among early intervention and step-up comparator
groups at 24 months, but a lower adverse event rate in the early anti-TNF-α intervention group
(Khanna et al., 2015). A review of predominantly adult studies has concluded that there is
insufficient evidence to warrant a change in treatment practices from the traditional “step-up”
standard to a “top-down” approach with an early intervention of anti-TNF-α treatments
(Spurio, 2012). A more recent review concluded that early combination therapy of biologics and
immunomodulators was found to be effective at improving patient outcomes, but early
biologics monotherapy did not have a clear benefit over step-up therapy (Tsui & Huynh, 2018).
Evidence supporting a top-down approach with biologics in pediatric CD populations was also
inconclusive (Tsui & Huynh, 2018). The review also concluded that cost-benefit analyses found
that top-down therapy merited further investigation (Tsui & Huynh, 2018). Hence the debate
between “top-down” and “step-up” approaches with anti-TNF-α treatments persists. In the
absence of pediatric RCT data in newly diagnosed children (as opposed to refractory pediatric
patients) with CD, observational data from a large North American registry of pediatric CD
patients (the RISK-PROKIIDS observational cohort) may shed light on the effectiveness of the
4
early introduction of anti-TNF-α treatments in children newly diagnosed with moderate-to-
severe CD.
From an economic perspective, a recent systematic review of cost studies, economic
evaluations and reviews of economic evaluations comparing the treatment of biological
therapies to standard care in moderate to severe CD in adults (and one pediatric study) found
that biological treatments were cost-effective and reduced health care resource use compared
to standard therapy in certain situations such as for luminal CD when used as induction
treatment followed by episodic treatment as opposed to maintenance therapy (Derek H Tang,
Amanda R Harrington, Jeannie K Lee, Mark Lin, & Edward P Armstrong, 2013). The only
economic evaluation of biological treatments in pediatric CD taking a public payer perspective
found that scheduled maintenance therapy with 5 mg/kg of infliximab was cost-effective
(assuming a £30,000 per QALY willingness-to-pay threshold) compared to standard care in
refractory pediatric CD patients (Punekar, Sunderland, Hawkins, & Lindsay, 2010). More
favourable incremental cost-utility ratios (ICURs) or incremental cost-effectiveness ratios
(ICERs) may be expected in pediatric CD when a societal perspective is taken. This is because a
societal perspective will take into account caregiver costs such as productivity loss. In addition,
the pediatric clinical effectiveness of treatments, the pediatric pattern of disease and the
pediatric pattern of health care resource use may be different in children than adults (W. J.
Ungar, 2010).
To our knowledge there are no economic evaluations comparing the early use of anti-TNF-α
treatments to the traditional “step-up” strategy (prior standard care) in pediatric CD. Punekar’s
et al., economic evaluation examining the use of anti-TNF-α treatments in pediatric CD only
looked at infliximab maintenance treatment in non-newly-diagnosed pediatric CD patients
(Punekar et al., 2010). While the patient-level cost-of-illness of CD has been studied in adults
(Crohn’s and Colitis Foundation of Canada, 2012; Rocchi et al., 2012), there have been no
studies across the full severity spectrum in children with CD. Current clinical practice guidelines
and drug re-imbursement policies are not aligned with an early or first line introduction of anti-
TNF-α treatments for moderate-to-severe pediatric CD. Depending on the clinical effectiveness
5
and economic effectiveness of the early introduction of anti-TNF-α treatments in pediatric CD,
policies and clinical practice guidelines may need to be revisited as standard care evolves.
Of particular importance to the pediatric population is the need for access to safe and effective
medications for CD including anti-TNFα drugs through drug benefit programs. Currently drug
benefit programs vary widely across Canada with respect to eligibility, program characteristics,
cost-sharing arrangements, pediatric drugs listed on formularies and the extent of off-label use
(Pandolfini & Bonati, 2005; W. J. Ungar & Witkos, 2005). The need to create policies that
provide equitable access to necessary medications in a manner that is affordable to families has
been voiced as a priority by Crohn’s and Colitis Canada (Crohn’s and Colitis Foundation of
Canada, 2012). Such policies require evidence from high quality economic evaluations. The
need for comparative effectiveness studies of treatments for pediatric IBD has also been stated
as a research priority in the US and Canada (Denson et al., 2013; Whicher, Chalkidou, Dhalla,
Levin, & Tunis, 2009). Research is needed to furnish much needed evidence to inform clinical
and policy decision-makers regarding the optimal placement of anti-TNFα drugs in the
management of pediatric CD. In children with Crohn’s disease, there are limited clinical
effectiveness studies of anti-TNF-α treatments in refractory patients and only emerging
observational data in newly-diagnosed CD patients (see Table 1.4.1-1). Additional evidence in
newly-diagnosed children is emerging and funding decisions pertaining to the use of anti-TNF-α
treatments in children with CD may need to be re-evaluated considering emerging data and the
lack of economic evaluations in pediatric CD in Canada.
The common thread among reviews examining the cost-effectiveness of anti-TNF-α treatments
for CD is that to date cost-effectiveness assessments for biological treatments in CD have
limitations and need to consider: a) various payer and other stakeholder perspectives and b)
limitations in clinical data (National Institute of Health and Care Excellence, 2010; Odes, 2008;
Park & Bass, 2011). Particularly for pediatric disease a societal perspective is important since
the loss of productivity and costs to caregivers needs to be taken into account and may affect
the cost-effectiveness of a treatment compared to a single payer perspective. This study aims
6
to perform an economic evaluation of the early anti-TNF-α treatment in pediatric CD by taking
provincial and societal perspectives.
1.2 Background Information
1.2.1 Crohn’s Disease
The inflammation along the GI tract in CD is increasingly recognized as chronic and progressive,
leading to structuring and penetrating complications. The clinical course is, however, variable,
influenced in part by the anatomic location within the bowel (Crohn’s and Colitis Foundation of
Canada, 2012; G. R. Lichtenstein, Hanauer, Sandborn, & Practice Parameters Committee of
American College of, 2009). There is no known cure or cause for Crohn’s Disease.
Degree of inflammatory activity in pediatric CD is classified by the PCDAI, with a score equal to
or greater than 30 points generally signifying activity of at least moderate severity, and a score
<10 as quiescent disease (Sadowski et al., 2009). Children with IBD can differ in their incidence
and health care resource depending on their age at diagnosis (Eric I Benchimol et al., 2014).
Children in Ontario less than 5 years old at diagnosis had a 6.2% yearly increase in the incidence
of Crohn’s disease between 1994 and 2009 while children aged 6-9 at diagnosis had a 7.4%
yearly increase in incidence and children between 10-17 years had a 1.9% yearly increase in
incidence between 1994 and 2009 in Ontario (Eric I Benchimol et al., 2014). The peak age of
onset of CD overall is in the second half of the second decade and within the third decade of
life. Despite the apparent current greater percentage increases in incidence among very young
children, the majority of pediatric CD still occurs in adolescence (Benchimol et al., 2017). For
females less than 6 years with CD, there was a lower rate of IBD-specific outpatient visits (OR,
0.70; 95% CI, 0.50 to 0.98) compared to females greater than 6 years of age. This was not
present for males less than 6 years with CD for IBD-specific visits (OR, 1.00; 95% CI, 0.81 to 1.24)
when compared to males greater than 6 years (Eric I Benchimol et al., 2014). For males and
females 6 to 9.9 years, IBD-specific outpatient visits were more frequent in CD patients, but not
in UC patients compared to other age groups. In patients with CD, the hazard of hospitalization
7
was lower for females diagnosed at less than 6 years (HR, 0.56; 95% CI, 0.37 to 0.85; P = .006),
but not at 6 to 9.9 years (HR, 0.85; 95% CI, 0.69 to 1.06; P = .15) compared to females greater
than 10 years. There was no difference in males diagnosed at less than 6 years (HR, 1.07; 95%
CI, 0.81 to 1.41; P = .65) or at 6 to 9.9 years (HR, 1.02; 95% CI, 0.85 to 1.22; P= .86), compared
with males diagnosed at 10 years. Within three years of diagnosis there was a 9.6%, 5.1% and
14.7% risk of intestinal resection in those diagnosed with CD between less than 6, 6-9.9, and
greater than 10 years of age respectively (Eric I Benchimol et al., 2014). The risk of surgery is
known to be associated with location of CD, i.e. most commonly undertaken in the setting of
isolated terminal ileitis, a form that is not recognized in the youngest children (Eric I Benchimol
et al., 2014). Similarly, there were lower emergency department visits and hospitalizations in
younger age groups (Eric I Benchimol et al., 2014). Possible reasons for these variations could
be the desire to avoid surgery in younger children, who typically have colonic disease not
amenable to resection with re-anastomosis, or the inability for children to verbalize more
urgent care needs (Eric I Benchimol et al., 2014).
1.3 Anti-TNF-α Interventions and How They Might Work
The pro-inflammatory TNF-α cytokine plays a major role in regulating the innate immune
system and in Th1 and Th17 adaptive immune responses (Peake et al., 2013). Patients with CD
have elevated levels of TNF-α in inflamed tissue (Braegger, Nicholls, Murch, MacDonald, &
Stephens, 1992). Anti-TNF-α antibodies are thought to neutralize the inflammatory activity of
TNF-α. The precise mechanism of action of anti-TNF-α therapies remains unclear but multiple
target pathways are postulated such as blocking receptor binding and binding to
transmembrane TNF thus restricting activity (Peake et al., 2013). Anti-TNF-α treatments have
shown efficacy in inducing and maintaining clinical remission in patients who have failed
conventional therapies in several adult randomized controlled trials (Jean–Frédéric Colombel
et al., 2007; Feagan et al., 2008; Ford et al., 2011; Hanauer et al., 2002; Hanauer et al., 2006;
Peyrin-Biroulet et al., 2008; Present et al., 1999; Rutgeerts et al., 1999; Rutgeerts et al., 2006;
Sandborn, Feagan, et al., 2007; Sandborn, Rutgeerts, et al., 2007; Sands et al., 2004; Schreiber
et al., 2007; Spurio, 2012; Targan et al., 1997), and have also shown to improve mucosal healing
8
which can reduce complications and the need for surgical intervention (Feagan et al., 2008;
Ford et al., 2011; Gary R Lichtenstein, Yan, Bala, Blank, & Sands, 2005; Rutgeerts et al., 2006).
Current anti-TNF-α treatments such as infliximab and adalimumab are given, respectively, by
infusion and subcutaneous injection.
1.4 Clinical Efficacy of Anti-TNF-α Treatments in Pediatric Crohn’s Disease
A preliminary scoping literature review was conducted to identify any clinical studies using anti-
TNF-α treatments introduced early in the treatment paradigm, as first line therapy, in children
with CD (see Appendix 1 for details on literature search methods). The clinical studies
examining anti-TNF-α use pediatric CD and that are most relevant to this thesis research were
reviewed and summarized in Table 1.4.1-1. Based on the search results, there is a great paucity
of clinical studies, and particularly randomized controlled trials, examining the induction and
maintenance of anti-TNF-α treatments without the use of concomitant therapies. Most papers
were retrospective chart reviews. Table 1.4.1-1 also shows that there is a large variation in the
sample size and treatment regimen of subjects. The scoping review of the clinical literature
identified gaps in the literature identifying the limited number of studies examining the efficacy
of anti-TNF-α treatments in children and lack of randomized controlled trials in newly-
diagnosed CD children. The scoping review identified that a systematic review of RCTs and a
meta-analysis of anti-TNF-α interventions in children with CD is not currently possible due to
the lack of studies. The Cochrane Registry of Controlled Trials and ClinTrials.gov have not listed
any new prospective trials that examine the first line (top-down) use of anti-TNF-α treatments
in children newly diagnosed and non-refractory with Crohn’s disease except for a top-down
infliximab multicenter pediatric study which is currently recruiting patients (Cozijnsen et al.,
2016).
1.4.1 Studies and Reviews of the Clinical Efficacy of Anti-TNF-α Treatments
A Cochrane systematic review by Behm and Bickston (2008), reviewed evidence for the
effectiveness of TNF-α blocking agents in the maintenance of remission in adult patients with
9
Crohn’s disease (Behm & Bickston, 2008). They concluded that infliximab 5mg/kg or 10 mg/kg,
given every 8 weeks, is effective for the maintenance of remission and maintenance of fistula
healing in patients who have responded to infliximab induction therapy. Adalimumab 40 mg
weekly or every other week is effective for the maintenance of remission in patients who have
responded to adalimumab induction therapy. Certolizumab pegol 400mg every 4 weeks is
effective for the maintenance of remission in patients who have responded to certolizumab
induction therapy. No comparative trials have evaluated the relative efficacy of these agents
and rates and types of adverse events among anti-TNF-α agents were similar compared with
placebo (Behm & Bickston, 2008). However the Cochrane reviewers also concluded that the
study size and duration generally were insufficient to allow for adequate assessment of serious
adverse events associated with long-term use (Behm & Bickston, 2008). As the use of anti-TNF-
α treatments is relatively recent compared to corticosteroid and immunomodulator
treatments, most patients in these studies who were prescribed anti-TNF-α treatments were
refractory to other treatments. The labels for these treatments also state that they are
indicated for moderate-to-severe patients who have not responded well to other treatments.
A recent scoping review conducted by other researchers examining a reversal of the current
treatment paradigm (“top-down” vs. standard “step-up” treatment) was conducted in 2012
(Spurio, 2012). That review, using predominantly adult studies, concluded that at that time
there was insufficient evidence to warrant a change in treatment practices. Since then another
review has made similar conclusions (Tsui & Huynh, 2018). While a comparator RCT comparing
anti-TNF-α treatments to immunomodulators has not been conducted in newly-diagnosed,
naïve pediatric CD patients who have not previously been treated, an open-label RCT in
pediatric CD patients of anti-TNF-α therapy (infliximab) and concomitant IM in pediatric CD
patients who had been started on immunomodulators and an induction treatment of infliximab
showed that a greater percentage of pediatric patients achieved a clinical response and clinical
remission at week 54 with a maintenance treatment schedule of 5mg/kg infliximab every 8
weeks compared to a 5 mg/kg infliximab treatment every 12 weeks (J. Hyams et al., 2007).
When compared to a similar trial with adults in which adults received 5mg/kg every 8 weeks as
10
maintenance treatment (Hanauer et al., 2002), it was observed that children had better
response rates than adults generally attributed to the much shorter duration of CD prior to
infliximab initiation (Spurio, 2012). In all RCTs prior to 2002 reviewed by Hanauer (2002) of
anti-TNF therapy in CD, response rates decrease the longer the duration of disease (Hanauer
SB, 2002). An open label induction trial of adalimumab followed by dose-ranging maintenance
in children with active CD despite conventional therapies showed that 33.5% were in remission
at week 26 with a similar safety profile as in adult studies (Jeffrey S Hyams et al., 2012). Most
recently, an open-label RCT comparing maintenance infliximab monotherapy to maintenance
combination therapy of infliximab and immunomodulators in children with CD previously
refractory to non-biologic treatment showed that there was no significance difference in PCDAI
scores among groups treated with maintenance monotherapy or combination therapy (Kierkuś
et al., 2015). In the absence of pediatric RCT data in newly diagnosed children (as opposed to
pediatric patients with unsatisfactory response to prior corticosteroids and
immunomodulators) with CD, observational data from a large North American registry of
pediatric CD patients (the RISK-PROKIIDS observational cohort) may shed light on the
effectiveness of the early introduction of anti-TNF-α treatments in children newly diagnosed
with moderate-to-severe CD.
11
Table 1.4.1-1. Pediatric Crohn’s Disease Studies with Infliximab or Adalimumab as Part of the Treatment Scheme.
Reference Study
Experimental Intervention Results Age at
Diagnosis
Sample Size (n) in Intervention Group
Follow-up Time Study Design Location
Early Intervention in Newly Diagnosed/ Naïve to anti-TNF-α
(Walters et al., 2014)
IFX, some ADA monotherapy vs. IM monotherapy vs. no early therapy
85.3% remission at 1 year (IFX)
Median age = 11 years
68 1 year Retrospective cohort
Multi-centre, (29 sites in USA and Canada)
Yes
(Martin-De-Carpi et al., 2014)
ADA +IM 36/40 in remission at 2 years
Mean =11.3 40 2 years Retrospective cohort
Multi-centre, (Spain)
Yes
(J. Hyams et al., 2011)
IFX + IM at baseline
50% Mean= 13.2
60 3 years Retrospective cohort
Multi-centre (17 sites, North America, Western Europe and Israel)
Not all newly diagnosed
(Yang et al., 2012)
Overview of biologics
Top-down + concomitant IMs is good strategy
children N/A N/A Review (general)
Review No
(Y. S. Lee et al., 2012)
IFX +IM 76.9% in remission (10/13)
Median=14 13 1 year Retrospective cohort
Single centre (Korea)
Yes
(Civitelli et al., 2009)
ADA +IM 65.2% in remission at week 48
Median =16.1 23 48 weeks Prospective cohort
Single centre (Italy)
Not all naïve or newly diagnosed
12
Reference Study
Experimental Intervention Results Age at
Diagnosis
Sample Size (n) in Intervention Group
Follow-up Time Study Design Location
Early Intervention in Newly Diagnosed/ Naïve to anti-TNF-α
(Assa et al., 2013)
IFX or ADA + concomitant medications
56% in remission at follow-up
Mean= 13.4
101 Median = 15 months
Retrospective Multi-centre (3 sites in Israel)
Not all newly diagnosed
Navas-Lopez et al, 2013.
ADA + IM/CS 100% in remission at 12 weeks
Mean = 10.6 16 12 weeks Retrospective Observational
Single centre, (Spain)
Not all newly diagnosed
(Grossi et al., 2014)
IFX + IM or IFX monotherapy
0.4 chance of being on IFX at 5 years with no IM at start
Mean = 11.8 503 Up to 10 years Retrospective (from registry)
Multi-centre (28 sites in US and Canada)
Not all newly diagnosed
(Gouldthorpe, Catto-Smith, Alex, & Simpson, 2013).
IFX + IM 60% at week 178 (3/5 still on IFX)
65% <16 years 71 178 weeks Retrospective observational
Single centre (Australia)
Not all newly diagnosed
Abbreviations: IFX=infliximab; ADA= adalimumab; IM=immunomodulator; SOC=standard of care)
13
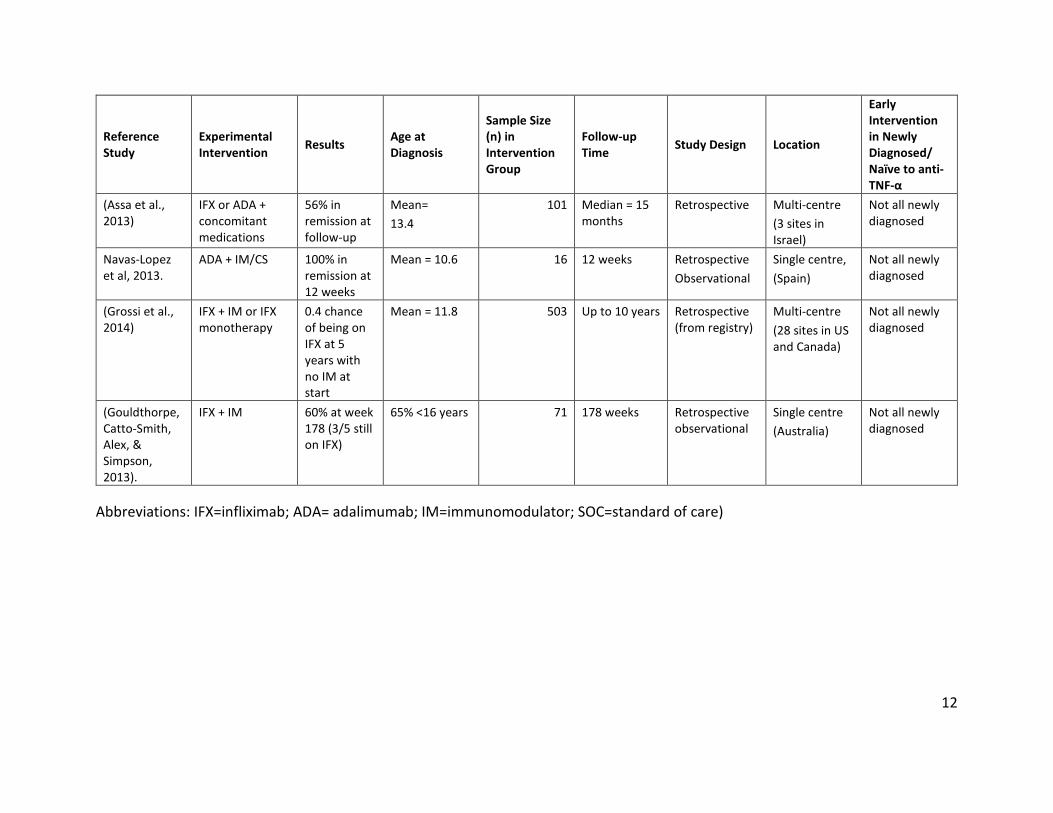
1.5 Economic Evaluations and Health Technology Assessments of Anti-TNF-α Treatments in Crohn’s Disease
A scoping literature review was also conducted to search for cost-effectiveness, cost-utility or
cost-benefit analyses of any anti-TNF-α treatments in children with CD (see Appendix 2 for
search methods). The ten most relevant publications are summarized in Table 1.5-1. There
were five cost-utility analyses (CUAs), three cost-effectiveness analyses (CEAs), one costing
analysis and one health-related quality of life (HRQoL) analysis. None of the studies included
exclusively newly diagnosed patients or patients naïve to anti-TNF-α treatments and all the
studies listed investigated patients with moderate-to-severe CD. All the studies had different
time horizons and none took a multiple payer perspective. The clinical effectiveness outcomes
of each economic evaluation were modeled based on the results of one clinical trial. Many
studies did not take into account the switching of treatments in the case of adverse events in
their models which is common practice in CD management.
Two studies had a Canadian context and two studies considered pediatric health utilities for
Quality Adjusted Life Years (QALYs) and assessment of child health-related quality of life. No
cost-utility analysis in studies of pediatric subjects used child-specific health utilities as none
have been determined for children with CD as yet. In the absence of child utilities, health
utilities were derived from one major study or adaptations of this study which established
utilities for CD health states in adults using the Standard Gamble and Time Trade Off techniques
(Gregor et al., 1997). Utilities for a “non-responder” state in Punekar et al., (2010) were based
on expert opinion (Punekar et al., 2010). Punekar et al. (2010) performed the only economic
evaluation examining infliximab in pediatric CD. Punekar et al., found that scheduled
maintenance therapy with 5 mg/kg of infliximab was cost-effective (assuming a £30,000 per
QALY) compared to standard care in refractory pediatric CD patients and that infliximab was
cost effective at £14,607 per quality-adjusted life year (QALY) gained with a 0.55 QALY gain in
the UK over a 5-year time horizon in patients refractory to conventional treatments, but they
14
did not include infliximab in the standard care strategy (Punekar et al., 2010). They also ignored
the disutility and costs related to adverse event and infection management.
Assasi et al., (2009) and Blackhouse et al., (2012) examined the cost-effectiveness of infliximab
or adalimumab compared to non-anti-TNFα usual care in refractory adult CD patients over a
five-year time horizon from a Canadian payer perspective (Assasi et al., 2009; Blackhouse et al.,
2012a). They found that the cost per QALY gained for infliximab therapy compared with usual
care was $222,955 with a 0.166 QALY gain. Marchetti et al., (2013) conducted a cost-
effectiveness analysis with a 5-year time horizon comparing the early introduction of infliximab
for induction to standard care in newly-diagnosed adult CD patients (Marchetti, Liberato, Di
Sabatino, & Corazza, 2013). They incorporated switching of treatments but only included
episodic infliximab treatment. They found a 0.14 QALY gain with the early introduction of
infliximab and a cost savings of €773 (Marchetti et al., 2013). Their Italian drug costs were also
likely to be significantly less than Canadian costs. The variation in cost-effectiveness
conclusions in the studies reviewed revealed that model design, anti-TNF-α treatment cost, and
frequency of treatment can all impact the results of cost-effectiveness analyses. These results
confirm the need for comprehensive economic evaluations in children with Crohn’s disease.
Tang et al., conducted a systematic review of cost studies, economic evaluations and reviews of
economic evaluations examining the treatment of biological therapies compared to standard
care in moderate to severe CD in adults (only one pediatric study) (Derek H Tang et al., 2013).
Tang et al., found that biological treatments were cost-effective compared to standard therapy
in certain situations such as for luminal CD when used as induction treatment followed by
episodic treatment as opposed to maintenance therapy and that biological treatments did
reduce health care resource utilization (Derek H Tang et al., 2013).
In 2009, the Canadian Agency for Drugs and Technologies in Health (CADTH) issued a
comprehensive report evaluating biological treatments for inflammatory bowel disease in
adults (Assasi et al., 2009). The CADTH report made a number of key points. Although infliximab
and adalimumab have been shown to provide clinical benefit, the costs associated with these
15
treatments could be perceived as high. The CADTH report determined, using a five year time
horizon, the base case costs of usual care, adalimumab and infliximab to be $17,107, $45,480
and $54,084 and infliximab. Usual care provided 2.555 QALYs while adalimumab provided 2.701
QALYs and infliximab provided 2.721 QALYs. The incremental cost-utility ratio (ICUR) for
infliximab compared to usual care was $222,955 and the ICUR for adalimumab compared to
usual care was $193,305 (Assasi et al., 2009). Based on incremental cost-utility findings from
these primary economic evaluations, the use of adalimumab and infliximab for the treatment of
IBD may not be perceived to be a cost-effective use of health care resources. Compared to
usual care, anti-TNF-α drugs are unlikely to be cost-effective in adult Crohn’s disease unless
society is willing to pay more than $208,000 for a healthy year of life (QALY). In adult ulcerative
colitis, a treatment strategy based on 5mg/kg of infliximab and adalimumab is unlikely to be
cost-effective compared to usual care unless society is willing to pay more than $370,000 for a
QALY.
Since the CADTH primary economic analyses adopted a public health care payer perspective,
indirect costs, such as loss of productivity, were not considered. If a societal perspective was
taken and indirect costs, important to parents and families, were considered, then the cost per
QALY of the anti-TNFs may be more favourable. To address the limited perspective pointed out
in the CADTH report, this research intends to take a societal perspective as well as a public
payer perspective in order to provide a comprehensive examination of indirect costs involved in
anti-TNF-α treatment for children. Funding decisions may require more clinical and economic
evidence. The CADTH report stated that there are a limited number of long-term randomized
controlled trials demonstrating clinical-effectiveness, safety, and cost-effectiveness of anti-TNF-
α drugs in adults (Assasi et al., 2009).
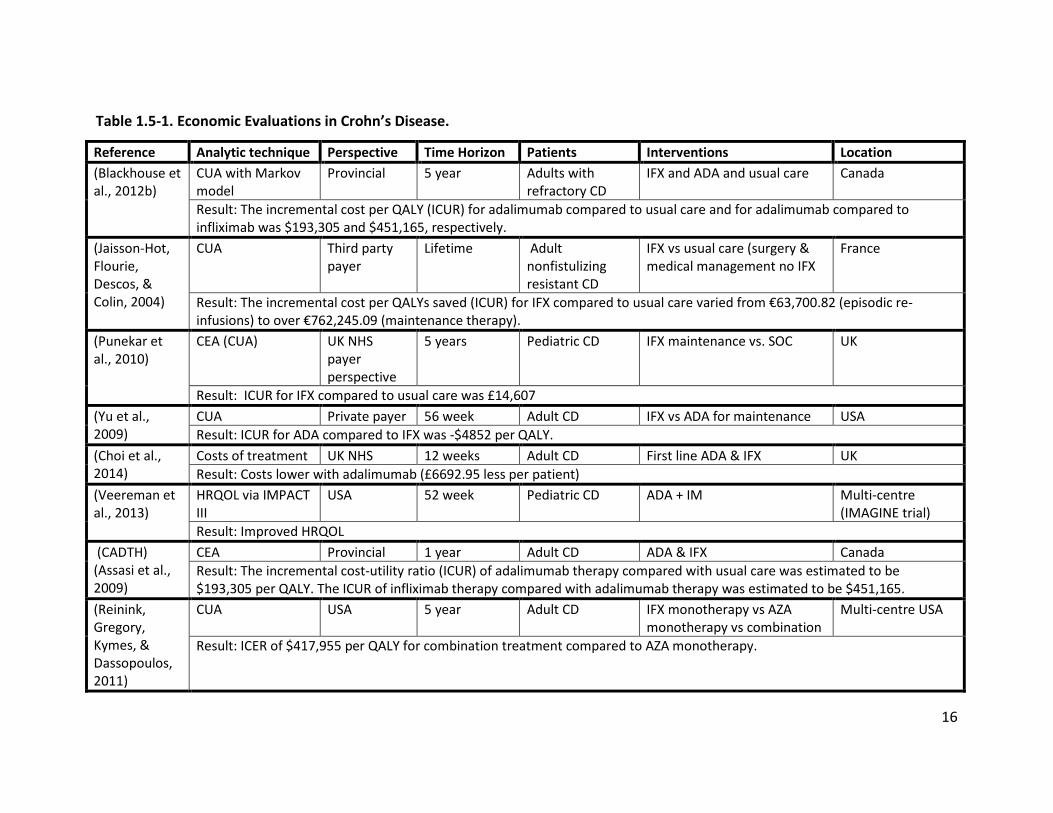
16
Table 1.5-1. Economic Evaluations in Crohn’s Disease.
Reference Analytic technique Perspective Time Horizon Patients Interventions Location (Blackhouse et al., 2012b)
CUA with Markov model
Provincial 5 year Adults with refractory CD
IFX and ADA and usual care Canada
Result: The incremental cost per QALY (ICUR) for adalimumab compared to usual care and for adalimumab compared to infliximab was $193,305 and $451,165, respectively.
(Jaisson-Hot, Flourie, Descos, & Colin, 2004)
CUA Third party payer
Lifetime Adult nonfistulizing resistant CD
IFX vs usual care (surgery & medical management no IFX
France
Result: The incremental cost per QALYs saved (ICUR) for IFX compared to usual care varied from €63,700.82 (episodic re-infusions) to over €762,245.09 (maintenance therapy).
(Punekar et al., 2010)
CEA (CUA) UK NHS payer perspective
5 years Pediatric CD IFX maintenance vs. SOC UK
Result: ICUR for IFX compared to usual care was £14,607 (Yu et al., 2009)
CUA Private payer 56 week Adult CD IFX vs ADA for maintenance USA Result: ICUR for ADA compared to IFX was -$4852 per QALY.
(Choi et al., 2014)
Costs of treatment UK NHS 12 weeks Adult CD First line ADA & IFX UK Result: Costs lower with adalimumab (£6692.95 less per patient)
(Veereman et al., 2013)
HRQOL via IMPACT III
USA 52 week Pediatric CD ADA + IM Multi-centre (IMAGINE trial)
Result: Improved HRQOL (CADTH) (Assasi et al., 2009)
CEA Provincial 1 year Adult CD ADA & IFX Canada Result: The incremental cost-utility ratio (ICUR) of adalimumab therapy compared with usual care was estimated to be $193,305 per QALY. The ICUR of infliximab therapy compared with adalimumab therapy was estimated to be $451,165.
(Reinink, Gregory, Kymes, & Dassopoulos, 2011)
CUA USA 5 year Adult CD IFX monotherapy vs AZA monotherapy vs combination
Multi-centre USA
Result: ICER of $417,955 per QALY for combination treatment compared to AZA monotherapy.
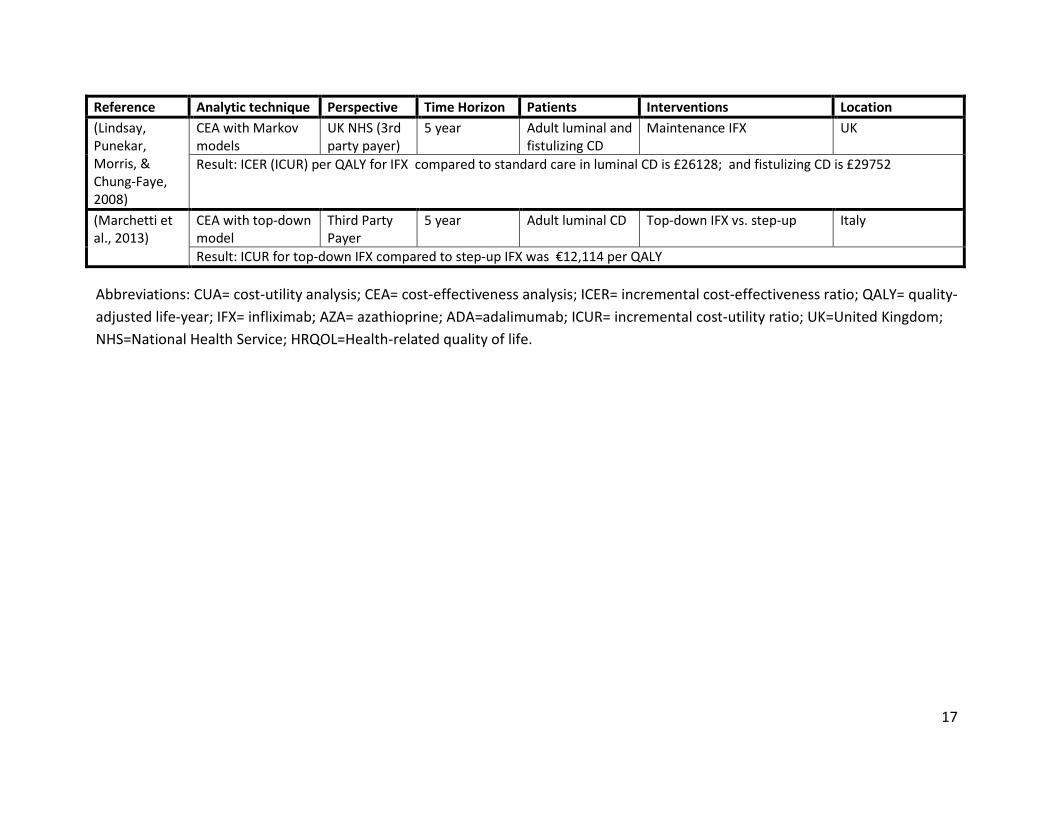
17
Reference Analytic technique Perspective Time Horizon Patients Interventions Location (Lindsay, Punekar, Morris, & Chung-Faye, 2008)
CEA with Markov models
UK NHS (3rd party payer)
5 year Adult luminal and fistulizing CD
Maintenance IFX UK
Result: ICER (ICUR) per QALY for IFX compared to standard care in luminal CD is £26128; and fistulizing CD is £29752
(Marchetti et al., 2013)
CEA with top-down model
Third Party Payer
5 year Adult luminal CD Top-down IFX vs. step-up Italy
Result: ICUR for top-down IFX compared to step-up IFX was €12,114 per QALY
Abbreviations: CUA= cost-utility analysis; CEA= cost-effectiveness analysis; ICER= incremental cost-effectiveness ratio; QALY= quality-adjusted life-year; IFX= infliximab; AZA= azathioprine; ADA=adalimumab; ICUR= incremental cost-utility ratio; UK=United Kingdom; NHS=National Health Service; HRQOL=Health-related quality of life.
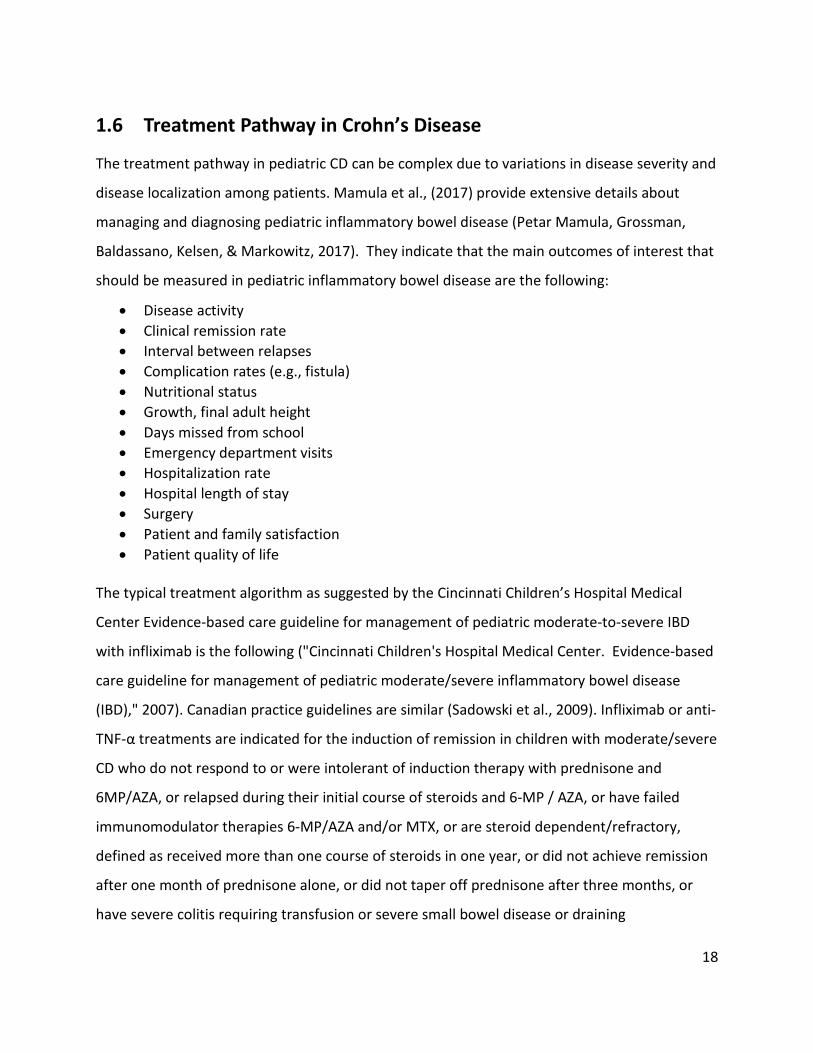
18
1.6 Treatment Pathway in Crohn’s Disease
The treatment pathway in pediatric CD can be complex due to variations in disease severity and
disease localization among patients. Mamula et al., (2017) provide extensive details about
managing and diagnosing pediatric inflammatory bowel disease (Petar Mamula, Grossman,
Baldassano, Kelsen, & Markowitz, 2017). They indicate that the main outcomes of interest that
should be measured in pediatric inflammatory bowel disease are the following:
• Disease activity • Clinical remission rate • Interval between relapses • Complication rates (e.g., fistula) • Nutritional status • Growth, final adult height • Days missed from school • Emergency department visits • Hospitalization rate • Hospital length of stay • Surgery • Patient and family satisfaction • Patient quality of life
The typical treatment algorithm as suggested by the Cincinnati Children’s Hospital Medical
Center Evidence-based care guideline for management of pediatric moderate-to-severe IBD
with infliximab is the following ("Cincinnati Children's Hospital Medical Center. Evidence-based
care guideline for management of pediatric moderate/severe inflammatory bowel disease
(IBD)," 2007). Canadian practice guidelines are similar (Sadowski et al., 2009). Infliximab or anti-
TNF-α treatments are indicated for the induction of remission in children with moderate/severe
CD who do not respond to or were intolerant of induction therapy with prednisone and
6MP/AZA, or relapsed during their initial course of steroids and 6-MP / AZA, or have failed
immunomodulator therapies 6-MP/AZA and/or MTX, or are steroid dependent/refractory,
defined as received more than one course of steroids in one year, or did not achieve remission
after one month of prednisone alone, or did not taper off prednisone after three months, or
have severe colitis requiring transfusion or severe small bowel disease or draining
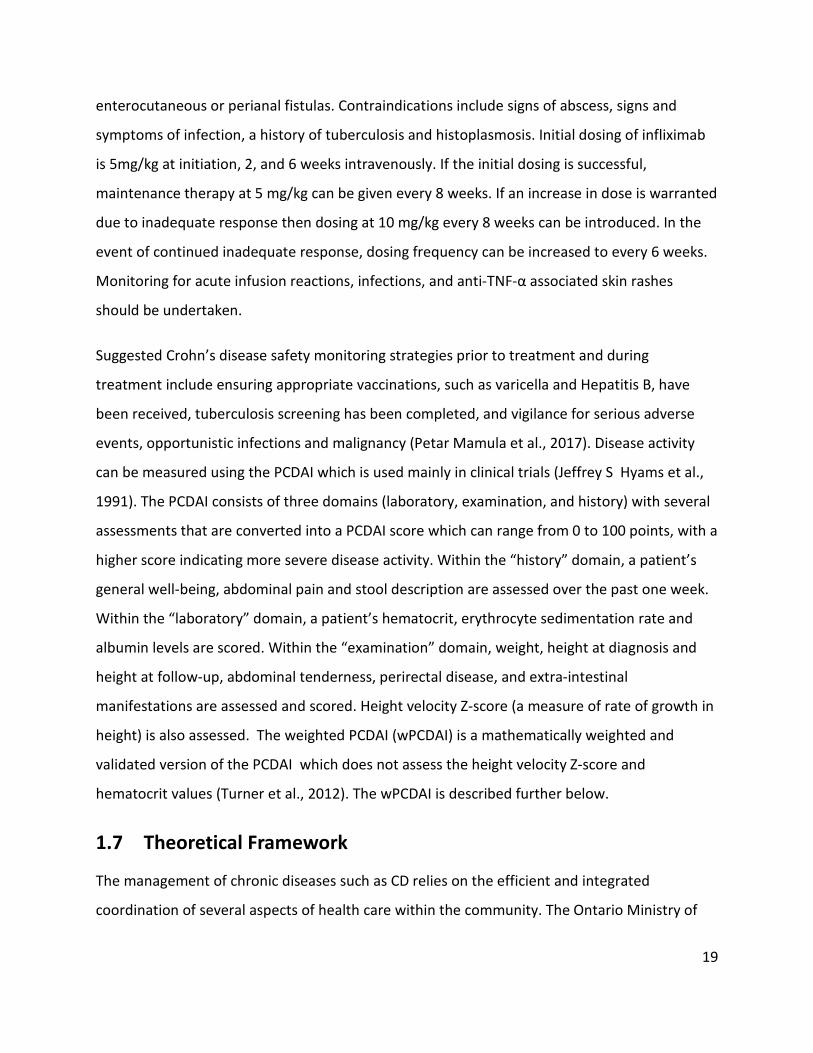
19
enterocutaneous or perianal fistulas. Contraindications include signs of abscess, signs and
symptoms of infection, a history of tuberculosis and histoplasmosis. Initial dosing of infliximab
is 5mg/kg at initiation, 2, and 6 weeks intravenously. If the initial dosing is successful,
maintenance therapy at 5 mg/kg can be given every 8 weeks. If an increase in dose is warranted
due to inadequate response then dosing at 10 mg/kg every 8 weeks can be introduced. In the
event of continued inadequate response, dosing frequency can be increased to every 6 weeks.
Monitoring for acute infusion reactions, infections, and anti-TNF-α associated skin rashes
should be undertaken.
Suggested Crohn’s disease safety monitoring strategies prior to treatment and during
treatment include ensuring appropriate vaccinations, such as varicella and Hepatitis B, have
been received, tuberculosis screening has been completed, and vigilance for serious adverse
events, opportunistic infections and malignancy (Petar Mamula et al., 2017). Disease activity
can be measured using the PCDAI which is used mainly in clinical trials (Jeffrey S Hyams et al.,
1991). The PCDAI consists of three domains (laboratory, examination, and history) with several
assessments that are converted into a PCDAI score which can range from 0 to 100 points, with a
higher score indicating more severe disease activity. Within the “history” domain, a patient’s
general well-being, abdominal pain and stool description are assessed over the past one week.
Within the “laboratory” domain, a patient’s hematocrit, erythrocyte sedimentation rate and
albumin levels are scored. Within the “examination” domain, weight, height at diagnosis and
height at follow-up, abdominal tenderness, perirectal disease, and extra-intestinal
manifestations are assessed and scored. Height velocity Z-score (a measure of rate of growth in
height) is also assessed. The weighted PCDAI (wPCDAI) is a mathematically weighted and
validated version of the PCDAI which does not assess the height velocity Z-score and
hematocrit values (Turner et al., 2012). The wPCDAI is described further below.
1.7 Theoretical Framework
The management of chronic diseases such as CD relies on the efficient and integrated
coordination of several aspects of health care within the community. The Ontario Ministry of

20
Health and Long-Term Care (MOHLTC) has developed a policy framework to guide the redesign
of health care practices and systems to improve chronic disease prevention and management
(Ontario Ministry of Health and Long-Term Care, 2007). This framework has been adapted from
frameworks presented by Barr et al., 2003 and emphasizes interconnected and mutually
dependent elements such as personal skills and self-management support, delivery system
design, healthy public policy, provider decision support, and information systems that are
essential to good care and improved chronic care delivery (Barr et al., 2003).
Tugwell et al., (1985), developed a framework for the critical appraisal of need, benefits and
costs of health interventions that describes a way of assembling the specific subset of health
information that is most likely to tell us how to reduce the burden of both morbidity and
mortality (Tugwell, Bennett, Sackett, & Haynes, 1985). The loop depicts how the flow of
information such as the burden of illness, disease etiology, community effectiveness of
treatments, the efficiency of treatments as they relate to costs and effectiveness, the synthesis,
implementation and monitoring of programs and the reassessment of burden of illness feeds
into subsequent parts of the loop and is an iterative and continuous process to reduce the
burden of illness.
The Crohn’s Disease Health Technology Assessment (CDHTA) Framework is developed here to
guide the economic evaluation from a societal perspective in this research. The CDHTA
framework is a simplification and adaptation of the MOHLTC and Tugwell models as it applies to
Crohn’s disease management (Figure 1.7-1). The framework merges some of the integrative
elements of the MOHLTC framework in chronic disease and the dynamic aspect of Tugwell’s
details about efficiency and impacts on burden of illness. In the CDHTA framework, four basic
domains of pediatric CD management are listed: Cost, Quality of Life, Clinical Management and
Policy. Each of these domains can impact each other. For example, health policy elements such
as drug coverage policies affect the degree of payers’ and patients’ costs and may influence the
choice of treatment in clinical management. The choice of treatment can in turn affect the
quality of life of a patient. Quality of life may be improved through better disease management
or diminished as a consequence of increased adverse events. The quality of life domain can
21
impact clinical management and cost because a lower quality of life can increase the need for
more effective and safer clinical management which may in turn affect costs through the
procurement of additional health care resources. Each domain in the framework has elements
feeding into it as illustrated by the colour-coded bubbles around each domain. Information
from each of these bubbles must be taken into account when performing an economic
evaluation as it can either influence cost, effectiveness or the probability of reaching a clinical
outcome. The Cost, Quality of Life and Clinical Management aspects of the framework inform
the inputs of the economic evaluation while the output of the economic evaluation such as a
cost-effectiveness analysis or a cost-utility analysis can serve to provide evidence to elicit
change in the Policy aspect of the framework.
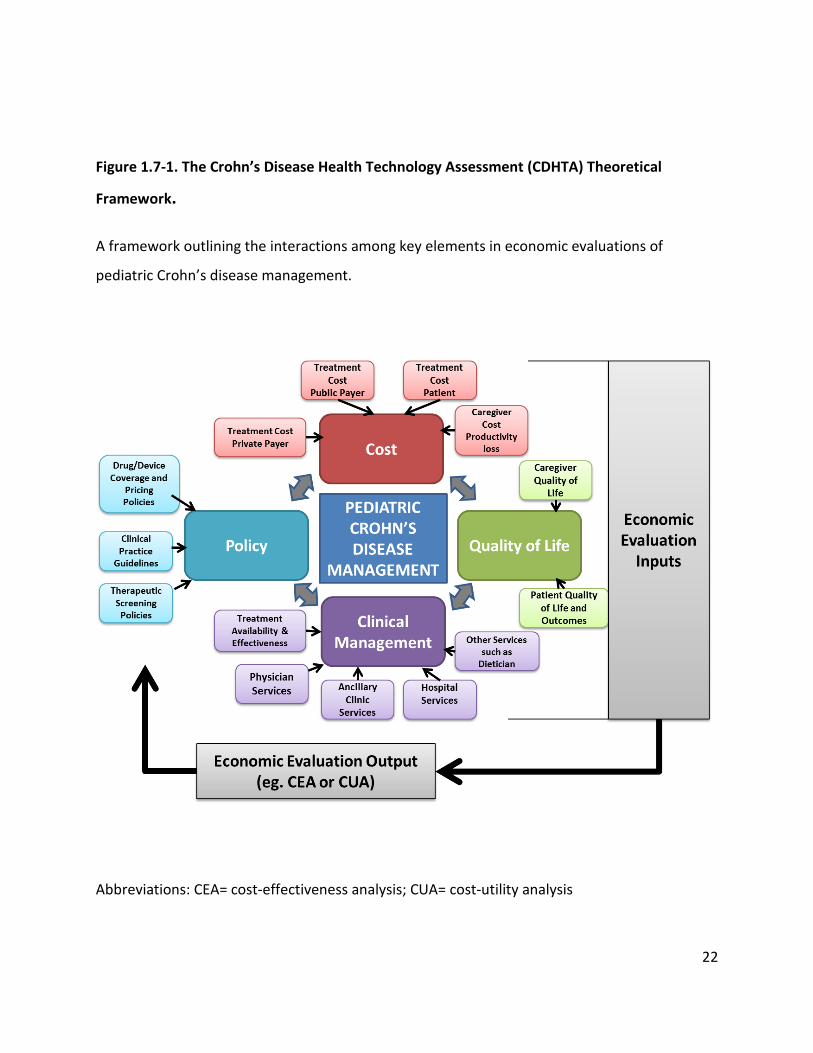
22
Figure 1.7-1. The Crohn’s Disease Health Technology Assessment (CDHTA) Theoretical
Framework.
A framework outlining the interactions among key elements in economic evaluations of
pediatric Crohn’s disease management.
Abbreviations: CEA= cost-effectiveness analysis; CUA= cost-utility analysis

23
1.8 The Problem
There is a lack of economic evaluations of the early introduction of anti-TNF-α treatments in
children with CD. To effectively manage CD in children, policies to facilitate ready access to the
treatments that provide the greatest value in the form of clinical effectiveness and cost-
effectiveness need to consider the chronic nature of the disease and its effect on patients and
their caregivers. Hence, health technology assessments that consider societal perspectives and
caregiver burden as well as single-payer perspectives would be beneficial in informing policies
as they related to CD management.
1.9 Primary Objective
The primary objective of this study will be to determine the incremental cost-effectiveness of
early intervention with anti-TNF-α treatment with or without concomitant immunomodulators
and with or without steroid induction (top-down approach) compared to the conventional step-
up strategy consisting of corticosteroid (or enteral nutrition) induction followed by
maintenance treatment with immunomodulators and the introduction of anti-TNF-α treatment
after 3 months in moderate-to-severe pediatric CD over a three-year time horizon. For the
purposes of this model, early introduction of infliximab will be defined as the introduction of
infliximab within the first three months of diagnosis with or without the use of concomitant
immunomodulators. Clinical outcomes of interest will be the time in steroid-free remission per
patient (steroid-free remission weeks), and the time in sustained steroid-free remission. The
time in sustained steroid-free remission can be divided into 6-month semester intervals as
sustained remission is defined as a minimum of 6 months or greater in remission. Adverse
events of special interest (such as severe adverse events or antibody reactions to treatment)
within the three year time period of the study will also be considered.
Question 1. The primary research question is, what is the incremental cost of early intervention
with anti-TNF-α treatments compared to a step-up strategy of treatment (conventional
standard care) per remission week gained over a three-year period than in children with newly-
diagnosed moderate-to-severe Crohn’s disease?
24
To further clarify, the treatment comparator groups are:
1. Early intervention (top-down) with anti-TNF-α: An induction phase of anti-TNF-α, and/or
corticosteroids, and/or enteral nutrition, with or without concomitant immunomodulators
administered within three months of diagnosis followed by a maintenance phase of anti-TNF-α
treatment with or without concomitant immunomodulators. Potential dose escalation and
switching of medications within a drug class are included.
2. Step up strategy (traditional standard care): An induction phase of enteral nutrition or
corticosteroids with or without concomitant immunomodulators administered within three
months of diagnosis followed by a maintenance phase with immunomodulators and followed
by anti-TNF-α treatment (with or without concomitant immunomodulators) only after three
months of diagnosis or later if deemed necessary. Potential dose escalation and switching of
medications within a drug class are included.
1.10 Secondary Objective
Randomized controlled studies in pediatric disease are rare and often absent. As such, clinical
research in children often relies on observational studies which can use patient-level data. The
impact of using patient-level data to inform a cost-effectiveness analysis is understudied. A
secondary objective of this study will be to explore methods of propensity score analysis and
dataset adjustment prior to propensity analysis, such as imputation of missing data from
patient-level data, and examine their effect and feasibility within the context of conducting an
economic evaluation. Propensity score analysis is a series of methods to facilitate the
comparison of treatment and control groups in an observational study through the reduction of
selection bias as would be seen in a randomized controlled trial. Choosing an appropriate
method of propensity score analysis is often based on the choice of the researcher and the
nature of the study data. Multiple methods of propensity score analysis have not been
previously compared in the same set of pediatric CD observational data. Given the lack of RCTs
and the more common occurrence of observational studies in child health, determining optimal
25
methods of propensity scoring for the creation of comparator groups is an important
consideration for using observational data in pediatric economic evaluations.
Question 2. The secondary research question is, can methods of propensity score analysis, or
the method of dataset adjustment prior to propensity score analysis, affect the feasibility of
analysis or the result when conducting a cost-effectiveness analysis undertaken with pediatric
patient-level data in moderate-to-severe Crohn’s Disease?
1.11 Research Design
To provide background information and establish the status of current research in the clinical
effectiveness and cost-effectiveness of anti-TNF-α treatments in pediatric Crohn’s disease, the
research began with a scoping literature review for clinical studies and economic evaluation
studies related to the use of anti-TNF-α treatments in pediatric Crohn’s disease.
For the primary objective, a cost-effectiveness analysis (CEA) will assess the economic benefit of
early treatment (introduced within the first 3 months of diagnosis) with anti-TNF-α drugs with
or without concomitant immunomodulators compared to a step up strategy (prior standard
care) consisting of no early therapy with anti-TNF-α agents and where anti-TNF-α treatments
are only introduced after three months of diagnosis if needed. The CEA will be conducted from
an Ontario healthcare public payer perspective and a societal perspective, and will be
conducted using observational patient-level data from the RISK-PROKIIDS study. The RISK-
PROKIIDS study, which started in 2008, is a prospective, ongoing multi-centre North American
observational cohort study with 1136 children enrolled presenting with untreated, newly
diagnosed CD. The data from the RISK-PROKIIDS study will be analyzed retrospectively. As a
pragmatic, observational study, children in the RISK-PROKIIDS study were treated according to
recommended guidelines at the discretion of the treating physicians, providing high external
validity. Comparator groups will be created through propensity score analysis. Optimal methods
of propensity score analysis and data compilation for this study will be determined to address
the secondary objective of this research. A health state diagram will be created to outline the
pathways of Crohn’s disease management. The CEA will assess costs and resource use in the

26
management of pediatric CD. Standard methods for economic evaluation will be followed
(Canadian Agency for Drugs and Technologies in Health (CADTH), 2017; Drummond, Sculpher,
Torrance, O'Brien, & Stoddart, 2005) and appropriate ethics review boards have approved this
research. The following chapters provide details on the methodology of the cost-effectiveness
analysis and related model inputs. The potential impact of the cost-effectiveness analysis
results on the policies and practices surrounding anti-TNF-α use for the clinical management of
pediatric CD will be discussed.
27
Methods
2.1 Overview of Methods and Study Design
With the aim of finding information on clinical studies and health technology assessments
conducted with anti-TNF-α treatments in children with Crohn’s disease (CD), a scoping
literature review for pediatric clinical studies with anti-TNF-α treatments as first line therapy in
Crohn’s disease, and scoping literature review for health technology assessments of anti-TNF-α
treatments in pediatric Crohn’s disease were conducted. The methodological approaches for
the scoping literature reviews are described in Appendix 1 and Appendix 2. The scoping
literature reviews revealed that there were no clinical studies in pediatric Crohn’s patients
where anti-TNF-α treatments were used as first line therapy, and no health technology
assessments where anti-TNF-α used as a first line therapy was compared to standard care in
children with CD. Hence, an economic evaluation of early intervention with anti-TNF-α
treatment in pediatric CD was undertaken.
The primary goal of this study is a cost-effectiveness analysis of the early intervention with anti-
TNF-α in children with moderate-to-severe Crohn’s disease. Several steps were required to
reach this goal. The steps in determining the incremental cost-effectiveness ratio of early
intervention with anti-TNF-α in pediatric Crohn’s disease were as follows: 1) assembling a data
set of subjects representative of the pediatric Crohn’s disease patient population; 2) extracting
relevant data from the data set and identifying gaps in the data set; 3) impute missing data; 4)
using propensity score analysis to create a data set with two equivalent comparator groups
that, similarly to a randomized clinical trial, tries to minimize selection bias between the
comparator groups; 5) conduct a cost-effectiveness analysis; and 6) report the results of the
cost-effectiveness analysis. A diagram showing the overall process followed in this study is
shown in Figure 2.1-1.
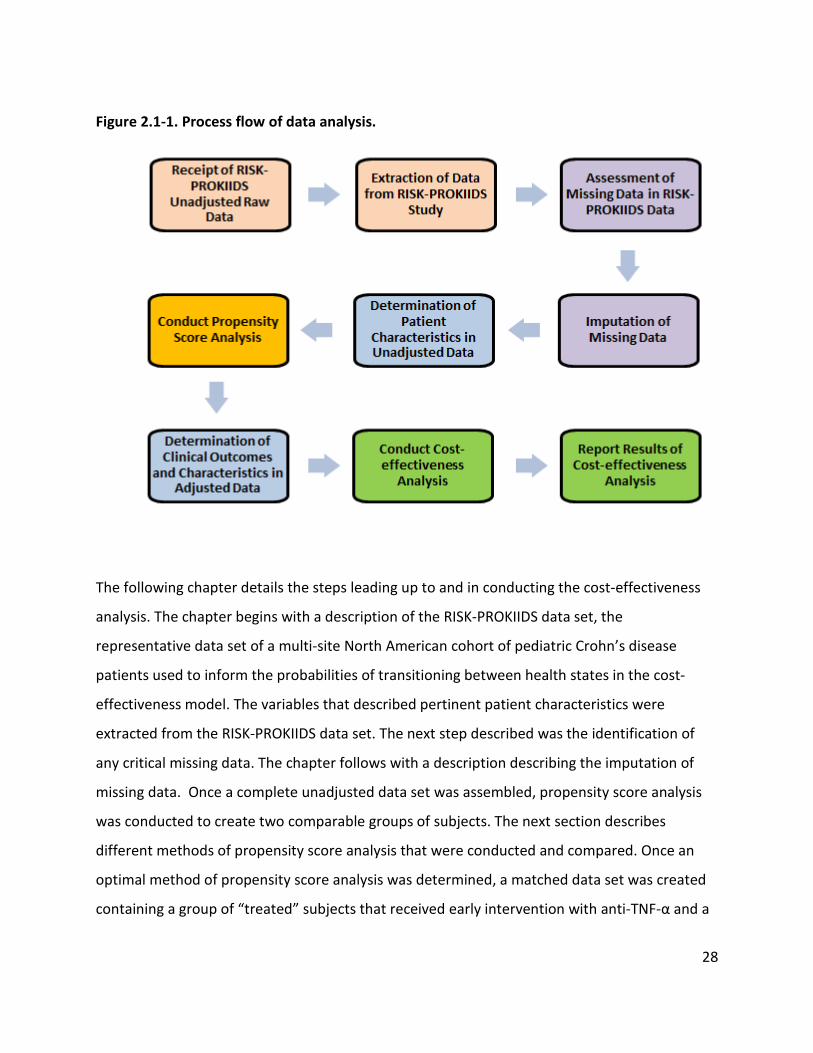
28
Figure 2.1-1. Process flow of data analysis.
The following chapter details the steps leading up to and in conducting the cost-effectiveness
analysis. The chapter begins with a description of the RISK-PROKIIDS data set, the
representative data set of a multi-site North American cohort of pediatric Crohn’s disease
patients used to inform the probabilities of transitioning between health states in the cost-
effectiveness model. The variables that described pertinent patient characteristics were
extracted from the RISK-PROKIIDS data set. The next step described was the identification of
any critical missing data. The chapter follows with a description describing the imputation of
missing data. Once a complete unadjusted data set was assembled, propensity score analysis
was conducted to create two comparable groups of subjects. The next section describes
different methods of propensity score analysis that were conducted and compared. Once an
optimal method of propensity score analysis was determined, a matched data set was created
containing a group of “treated” subjects that received early intervention with anti-TNF-α and a
29
group of “control” subjects that received standard care. Following the establishment of two
matched comparator groups, the methods and details of the cost-effectiveness analysis are
described.
2.2 The Pediatric Crohn’s Disease Cohort
This study intends to compare early intervention with anti-TNF-α. Previously, anti-TNF-α has
only been used in patients refractory to other treatments, therefore there are no published
clinical trials in pediatric Crohn’s patients with an early anti-TNF-α treatment arm. Due to the
absence of a randomized clinical trial with children diagnosed with Crohn’s disease and treated
with anti-TNF-α without previous treatment with other medications, an observational study of
pediatric CD patients, analyzed retrospectively was used to obtain patient-level data on newly
diagnosed CD patients. This study was entitled the RISK-PROKIIDS study.
2.2.1 The RISK-PROKIIDS Study Data
The RISK-PROKIIDS study, which started in 2008, is an ongoing, prospective, North American
multi-centre observational cohort study with 1136 children enrolled presenting with untreated,
newly diagnosed inflammatory CD (https://prokiids.com/RISK_Public.html). Children with
structuring or penetrating complications already present at diagnosis were excluded. The
children were enrolled at 28 centres across North America, including three Canadian sites (see
Appendix 3 for the location of the clinical sites).
The objective of the RISK-PROKIIDS study was to identify significant genetic, immune and
microbial factors that accurately predict the risk of disease progression from inflammatory to
stricturing and/or penetrating disease. As a pragmatic, observational study, children were
treated according to recommended guidelines at the discretion of the treating physicians,
providing high external validity. The RISK-PROKIIDS study provided a cohort of newly diagnosed
CD pediatric patients with at least a three year follow-up. Patient characteristics such as age,
sex, ethnic origin, disease severity, clinical chemistry values, physician assessments of health
state and treatments were captured over time. The broad RISK-PROKIIDS study data of Crohn’s
disease were used to extract a subset of subjects that met the inclusion criteria required to
30
inform clinical information for the economic evaluation. The main information required to help
populate the cost-effectiveness model was the treatments taken by each patient, and the
health state or disease state of each subject over three years. For the purposes of the economic
evaluation, health state refers to whether the subject was in a state of active disease
(experiencing a disease flare-up), or remission. The health state at diagnosis, and at regular
intervals over a three-year period needed to be determined, particularly since CD is
characterized by periods of active disease and periods of clinical remission. In parallel to
determining the health states of an individual, the medication or treatments and dose that the
individual has been prescribed needed to be determined.
Since the RISK-PROKIIDS data, analyzed retrospectively, was being used as the primary data
source to inform the transition probabilities in the cost-effectiveness model, a propensity score
analysis was conducted to determine the propensity of an individual to be assigned to the
“treatment” group or the “standard care” group. The propensity score analysis would result in
creating relatively equivalent comparator groups that should minimize any potential selection
bias in assigning treatment that may have occurred in the RISK-PROKIIKDS study. To assign a
propensity score to an individual, covariates that may influence the tendency to assign an
individual to a particular treatment group must be built into the propensity score regression
equation. These covariates, such as age, sex, and disease severity, etc., and assessed at the time
of diagnosis also needed to be extracted from the RISK-PROKIIDS data. Details about the
covariates are outlined below.
2.2.1.1 Inclusion Criteria
The RISK-PROKIIDS data set contained 1136 subjects with Crohn’s disease. The criteria listed in
Table 2.2.1.1-1 were used to include subjects for the economic evaluation. Based on the
inclusion criteria, 573 subjects were included in a data set that was then used to extract patient
characteristics at diagnosis, health state information over three years and treatment
information.
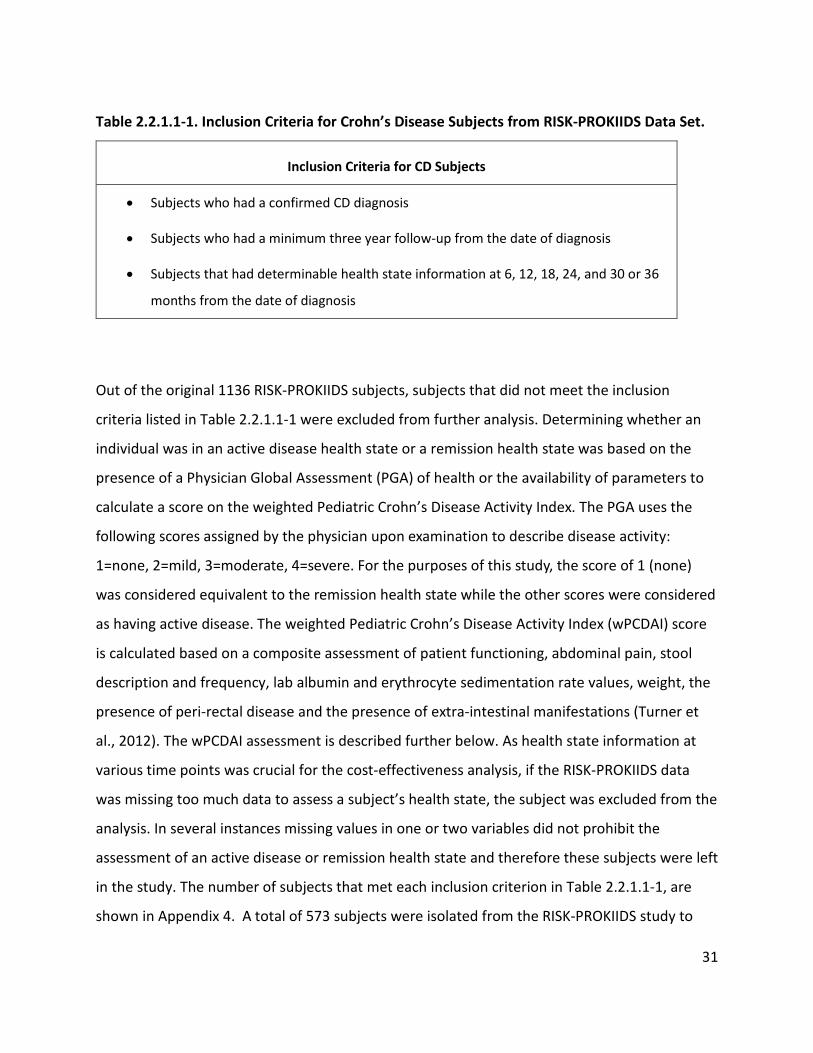
31
Table 2.2.1.1-1. Inclusion Criteria for Crohn’s Disease Subjects from RISK-PROKIIDS Data Set.
Inclusion Criteria for CD Subjects
• Subjects who had a confirmed CD diagnosis
• Subjects who had a minimum three year follow-up from the date of diagnosis
• Subjects that had determinable health state information at 6, 12, 18, 24, and 30 or 36
months from the date of diagnosis
Out of the original 1136 RISK-PROKIIDS subjects, subjects that did not meet the inclusion
criteria listed in Table 2.2.1.1-1 were excluded from further analysis. Determining whether an
individual was in an active disease health state or a remission health state was based on the
presence of a Physician Global Assessment (PGA) of health or the availability of parameters to
calculate a score on the weighted Pediatric Crohn’s Disease Activity Index. The PGA uses the
following scores assigned by the physician upon examination to describe disease activity:
1=none, 2=mild, 3=moderate, 4=severe. For the purposes of this study, the score of 1 (none)
was considered equivalent to the remission health state while the other scores were considered
as having active disease. The weighted Pediatric Crohn’s Disease Activity Index (wPCDAI) score
is calculated based on a composite assessment of patient functioning, abdominal pain, stool
description and frequency, lab albumin and erythrocyte sedimentation rate values, weight, the
presence of peri-rectal disease and the presence of extra-intestinal manifestations (Turner et
al., 2012). The wPCDAI assessment is described further below. As health state information at
various time points was crucial for the cost-effectiveness analysis, if the RISK-PROKIIDS data
was missing too much data to assess a subject’s health state, the subject was excluded from the
analysis. In several instances missing values in one or two variables did not prohibit the
assessment of an active disease or remission health state and therefore these subjects were left
in the study. The number of subjects that met each inclusion criterion in Table 2.2.1.1-1, are
shown in Appendix 4. A total of 573 subjects were isolated from the RISK-PROKIIDS study to
32
include for further analysis. The data from a small number of subjects still contained a small
amount missing data, but imputation of the missing allowed inclusion of those subjects in the
analysis. The handling and imputation of missing data are described in sections below.
2.2.2 Data Extraction and Patient Characteristics from the RISK-PROKIIDS Study
The following subsections describe the information extracted from the RISK-PROKIIDS data to
compile an unadjusted raw data set of pertinent variables and fitting within certain inclusion
parameters that were used to ultimately inform the cost-effectiveness model. The four types of
data required to be extracted from the RISK-PROKIIDS study are:
• data to inform when patient information was collected such as patient visits over three
years
• data about a subject’s health status or health state over time
• data about treatments received over time
• data with respect to patient characteristics at diagnosis to describe the patient
population and serve as covariates in the propensity score model
The next subsections describe the data extraction within these categories from the RISK-
PROKIIDS study.
2.2.2.1 Assigning Visit Dates
To track disease and treatment course over three years since diagnosis, the dates that patient
information was collected needed to be extracted and assigned to comparable time intervals
for each patient. As RISK-PROKIIDS was an observational study, visit dates were not at regular
intervals. In addition, complete data were not available for each visit and were considered
missing at random. Visits ranged from one follow-up visit to twelve follow-up visits over a
period of four years. The number of weeks elapsed since diagnosis was used to assign a visit
time point to each visit according to Table 2.2.2.1-1. Time points were assigned every 6 months
33
(“semester”) until 48 months. The weeks included in each time point were the assigned time
point + 3 months. In instances where there was more than one study visit per 6-month interval,
only the data from the visit closest to the actual six month interval was retained. Where two
visits were relatively equidistant from the midpoint of the semester, the information from the
later visit was kept as representative of that semester’s visit.
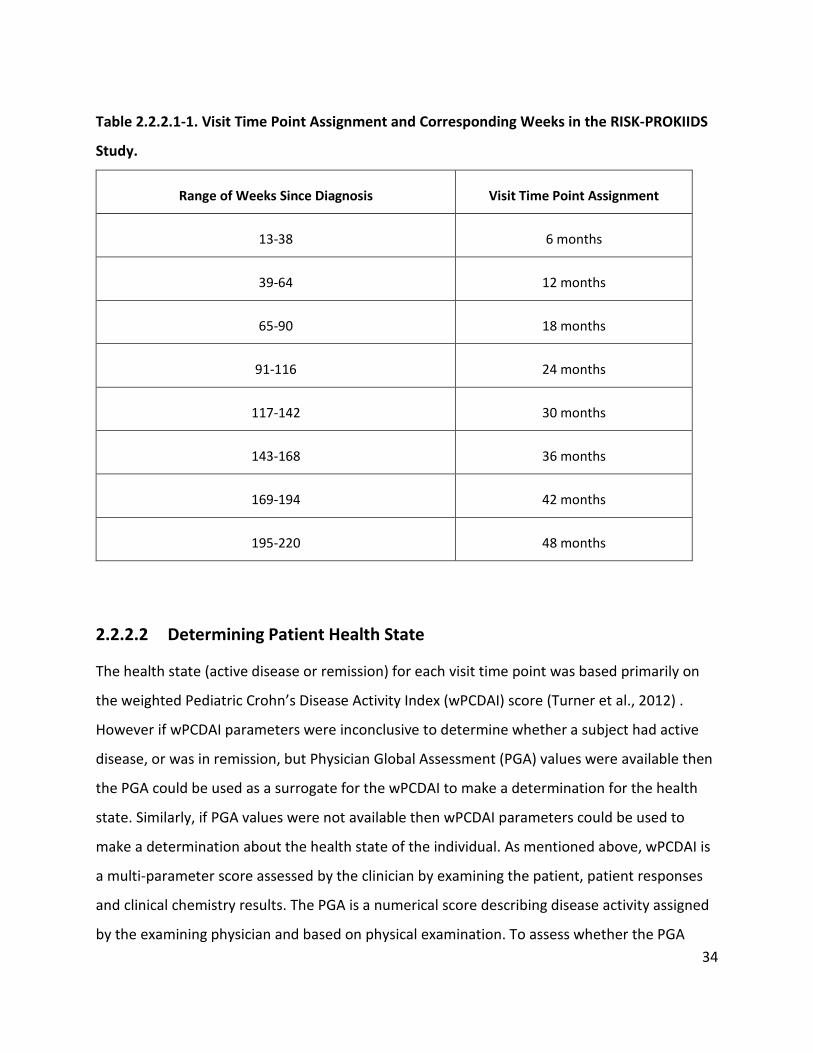
34
Table 2.2.2.1-1. Visit Time Point Assignment and Corresponding Weeks in the RISK-PROKIIDS
Study.
Range of Weeks Since Diagnosis Visit Time Point Assignment
13-38 6 months
39-64 12 months
65-90 18 months
91-116 24 months
117-142 30 months
143-168 36 months
169-194 42 months
195-220 48 months
2.2.2.2 Determining Patient Health State
The health state (active disease or remission) for each visit time point was based primarily on
the weighted Pediatric Crohn’s Disease Activity Index (wPCDAI) score (Turner et al., 2012) .
However if wPCDAI parameters were inconclusive to determine whether a subject had active
disease, or was in remission, but Physician Global Assessment (PGA) values were available then
the PGA could be used as a surrogate for the wPCDAI to make a determination for the health
state. Similarly, if PGA values were not available then wPCDAI parameters could be used to
make a determination about the health state of the individual. As mentioned above, wPCDAI is
a multi-parameter score assessed by the clinician by examining the patient, patient responses
and clinical chemistry results. The PGA is a numerical score describing disease activity assigned
by the examining physician and based on physical examination. To assess whether the PGA
35
could be used as surrogate for the wPCDAI in determining health state, a Spearmann’s
correlation analysis was conducted. The wPCDAI scoring methods and the number of patients
which had their health state assessed via the PGA are described below.
2.2.2.2.1 The Weighted Pediatric Crohn’s Disease Activity Index and the Physician Global Assessment
The weighted Pediatric Crohn’s Disease Activity Index (wPCDAI) score was used to determine
the health state of the subjects at each time point where possible (Turner et al., 2012). The
scoring system is shown in Table 2.2.2.2.1-1.
Six fields were used to describe perirectal disease: 1) drainage, 2) active fistula, 3) indolent
fistula, 4) fissure, 5) inflamed tags, and 6) asymptomatic tags. Where there were missing values
in any of these perirectal disease parameters, an assumed perirectal score was assigned
according to the convention listed in Appendix 5.
Scores from each individual wPCDAI parameter were added to produce a wPCDAI score. For the
purposes of the health state assessment, individuals with scores < 12.5 were considered as in
“remission” while subjects with scores >12.5 were considered as having “active” disease.
Several subjects had missing values within each wPCDAI parameter at various time points so a
complete wPCDAI score could not be calculated precisely. Appendix 4 lists the number of
subjects out of the 573 at each time point with undeterminable health states. However since
the classification of “active disease” comprised all subjects not in remission for the purposes of
this study, a precise score reflective of disease severity was not necessary and an active disease
state could be inferred if a score of 12.5 on the wPCDAI was already achieved without missing
values. Where an “active” or “remission” determination could not be made through the wPCDAI
at a time point, the Physician Global Assessment (PGA) of health was used to represent the
health state.
The PGA uses the following scores to describe disease activity: 1=none, 2=mild, 3=moderate,
4=severe. For the purposes of this study, the score of 1 (none) was considered equivalent to the
36
remission health state while the other scores were considered as having active disease. Since
the wPCDAI is a more comprehensive determination of health, it was chosen as the primary
measure of health state. The PGA is based on the physician’s determination of a patient’s health
and may not necessarily take into account lab values or other test results and therefore was
used as the “fallback” assessment of health state. Where a determination of health state could
not be made at a particular time point, the previous time point was carried over for one
semester (see Appendix 4 for the number of subjects where health states were carried over).
No subjects had a health state missing for greater than one consecutive semester and therefore
a health state only needed to be carried over once. Whether a subject was refractory within the
first three months of treatment could not be determined because this state was not captured
for the majority of subjects.
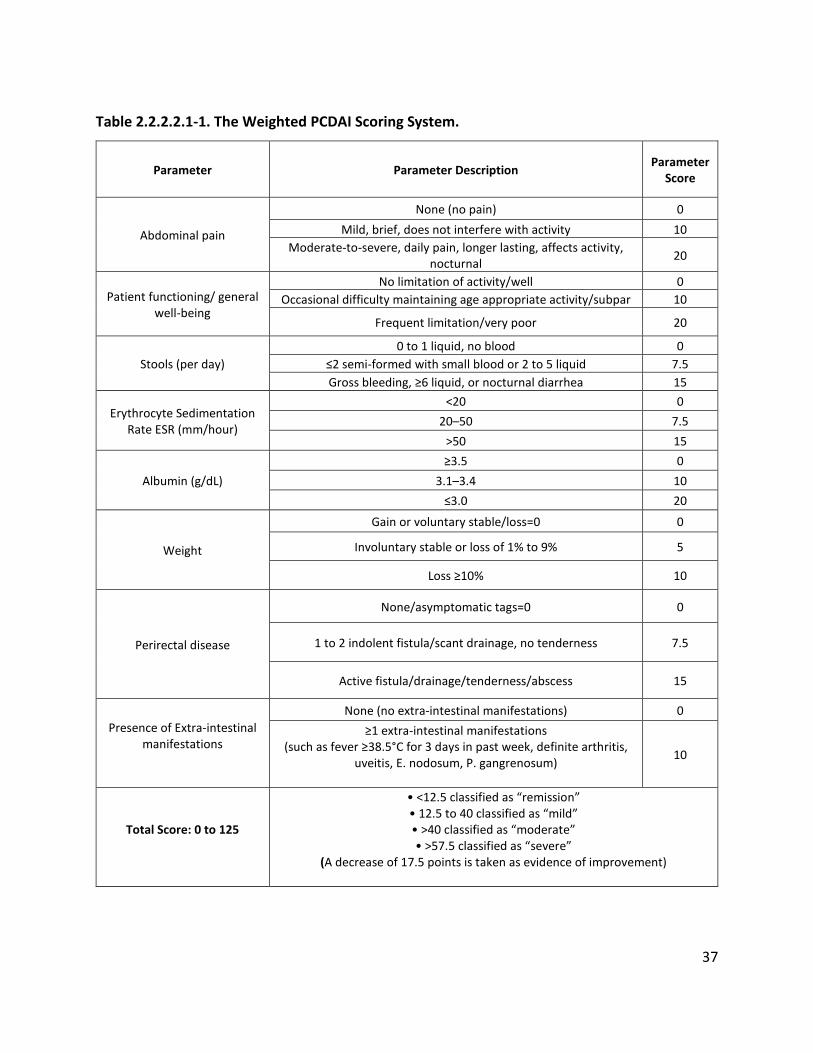
37
Table 2.2.2.2.1-1. The Weighted PCDAI Scoring System.
Parameter Parameter Description Parameter Score
Abdominal pain
None (no pain) 0 Mild, brief, does not interfere with activity 10
Moderate-to-severe, daily pain, longer lasting, affects activity, nocturnal 20
Patient functioning/ general well-being
No limitation of activity/well 0 Occasional difficulty maintaining age appropriate activity/subpar 10
Frequent limitation/very poor 20
Stools (per day) 0 to 1 liquid, no blood 0
≤2 semi-formed with small blood or 2 to 5 liquid 7.5 Gross bleeding, ≥6 liquid, or nocturnal diarrhea 15
Erythrocyte Sedimentation Rate ESR (mm/hour)
<20 0 20–50 7.5
>50 15
Albumin (g/dL) ≥3.5 0
3.1–3.4 10 ≤3.0 20
Weight
Gain or voluntary stable/loss=0 0
Involuntary stable or loss of 1% to 9% 5
Loss ≥10% 10
Perirectal disease
None/asymptomatic tags=0 0
1 to 2 indolent fistula/scant drainage, no tenderness 7.5
Active fistula/drainage/tenderness/abscess 15
Presence of Extra-intestinal manifestations
None (no extra-intestinal manifestations) 0 ≥1 extra-intestinal manifestations
(such as fever ≥38.5°C for 3 days in past week, definite arthritis, uveitis, E. nodosum, P. gangrenosum)
10
Total Score: 0 to 125
• <12.5 classified as “remission” • 12.5 to 40 classified as “mild” • >40 classified as “moderate” • >57.5 classified as “severe”
(A decrease of 17.5 points is taken as evidence of improvement)
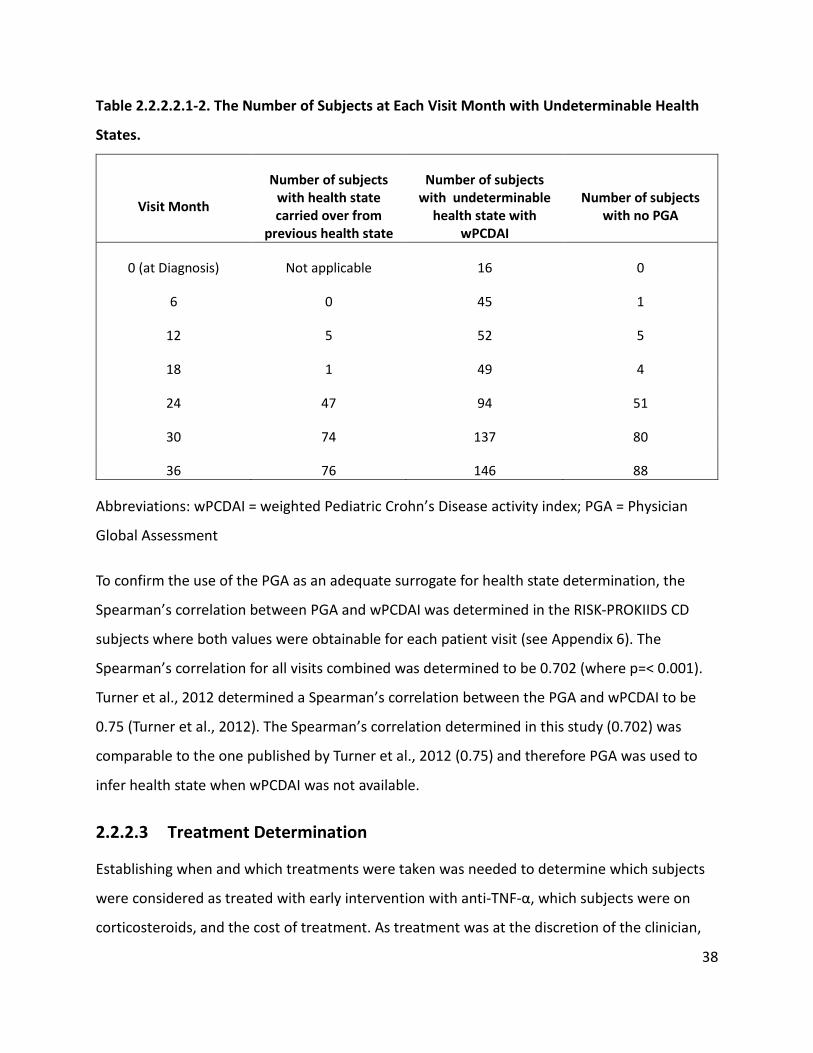
38
Table 2.2.2.2.1-2. The Number of Subjects at Each Visit Month with Undeterminable Health
States.
Visit Month
Number of subjects with health state carried over from
previous health state
Number of subjects with undeterminable
health state with wPCDAI
Number of subjects with no PGA
0 (at Diagnosis) Not applicable 16 0
6 0 45 1
12 5 52 5
18 1 49 4
24 47 94 51
30 74 137 80
36 76 146 88
Abbreviations: wPCDAI = weighted Pediatric Crohn’s Disease activity index; PGA = Physician
Global Assessment
To confirm the use of the PGA as an adequate surrogate for health state determination, the
Spearman’s correlation between PGA and wPCDAI was determined in the RISK-PROKIIDS CD
subjects where both values were obtainable for each patient visit (see Appendix 6). The
Spearman’s correlation for all visits combined was determined to be 0.702 (where p=< 0.001).
Turner et al., 2012 determined a Spearman’s correlation between the PGA and wPCDAI to be
0.75 (Turner et al., 2012). The Spearman’s correlation determined in this study (0.702) was
comparable to the one published by Turner et al., 2012 (0.75) and therefore PGA was used to
infer health state when wPCDAI was not available.
2.2.2.3 Treatment Determination
Establishing when and which treatments were taken was needed to determine which subjects
were considered as treated with early intervention with anti-TNF-α, which subjects were on
corticosteroids, and the cost of treatment. As treatment was at the discretion of the clinician,
39
each subject could have received a variety of treatments over the course of the study. The start
and stop date was recorded in the RISK-PROKIIDS database. The treatments were grouped into
the following classes of treatments: biologics, corticosteroids, oral 5-ASA, immunomodulators,
antibiotics and enteric nutrition. Concomitant treatments could also have been received. The
class of drug received within the first three months of diagnosis was determined for each
subject.
In the RISK-PROKIIDS study, while health-related information was recorded based on visits,
treatments received were recorded with start and stop dates. Dose was rarely recorded,
therefore the RISK-PROKIIDS data was not used as a resource for dose information. Dose
information was estimated based on clinical practice guidelines. In the event that a treatment
start date was not recorded or indicated that treatment was started before the diagnosis date,
it was assumed that the diagnosis date was the start date. In the event that a stop date was not
recorded, it was assumed that the treatment continued until the subject’s last visit date
included in this study and possibly beyond. Each treatment used in the RISK-PROKIIDS study
was grouped into its drug class (see Table 2.2.2.3-1). As the primary clinical endpoint in the
cost-effectiveness analysis was designated to be time in corticosteroid-free remission, the
treatment state of each subject as it related to corticosteroid use and the duration of treatment
with corticosteroids were determined for the duration of the study. Specific treatment used
and treatment class used per patient were extracted from the RISK-PROKIIDS study.
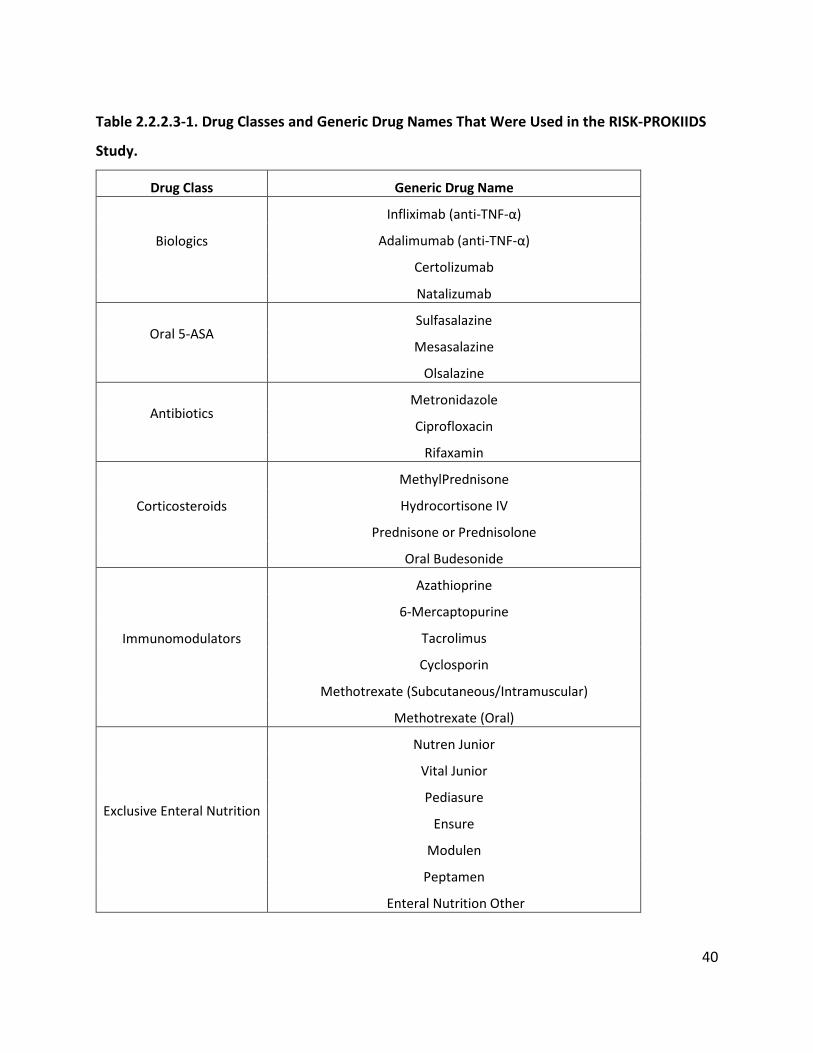
40
Table 2.2.2.3-1. Drug Classes and Generic Drug Names That Were Used in the RISK-PROKIIDS
Study.
Drug Class Generic Drug Name
Biologics
Infliximab (anti-TNF-α)
Adalimumab (anti-TNF-α)
Certolizumab
Natalizumab
Oral 5-ASA
Sulfasalazine
Mesasalazine
Olsalazine
Antibiotics
Metronidazole
Ciprofloxacin
Rifaxamin
Corticosteroids
MethylPrednisone
Hydrocortisone IV
Prednisone or Prednisolone
Oral Budesonide
Immunomodulators
Azathioprine
6-Mercaptopurine
Tacrolimus
Cyclosporin
Methotrexate (Subcutaneous/Intramuscular)
Methotrexate (Oral)
Exclusive Enteral Nutrition
Nutren Junior
Vital Junior
Pediasure
Ensure
Modulen
Peptamen
Enteral Nutrition Other
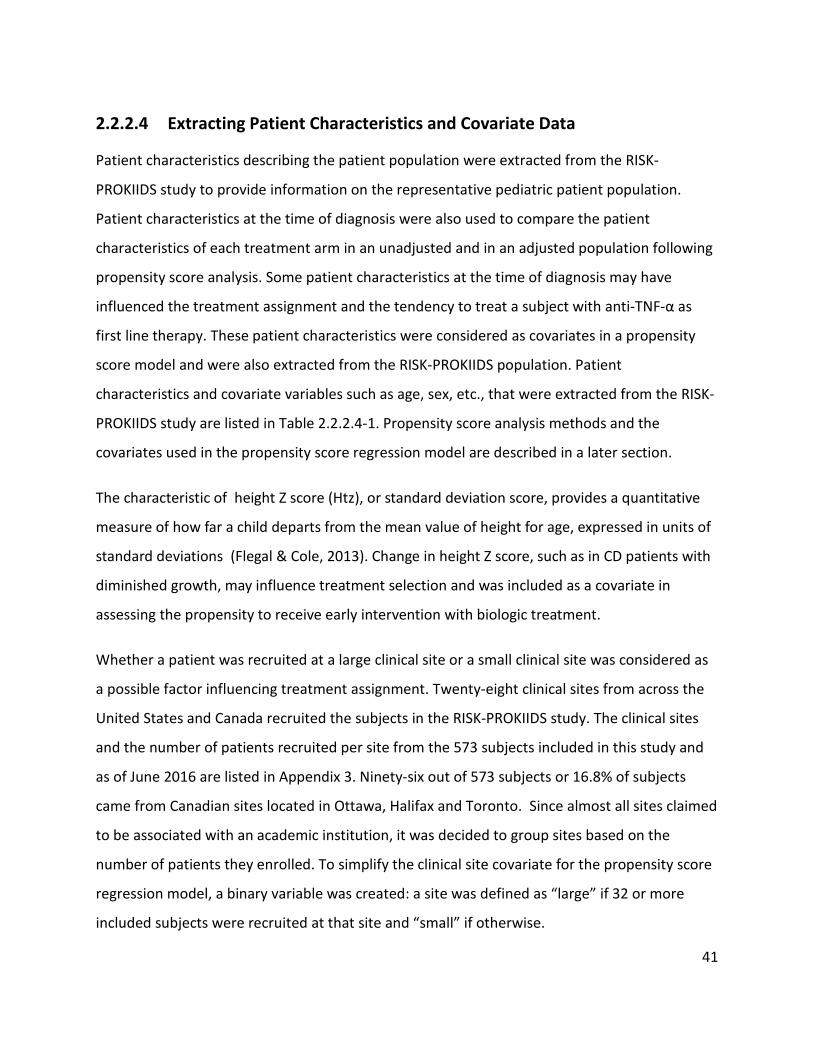
41
2.2.2.4 Extracting Patient Characteristics and Covariate Data
Patient characteristics describing the patient population were extracted from the RISK-
PROKIIDS study to provide information on the representative pediatric patient population.
Patient characteristics at the time of diagnosis were also used to compare the patient
characteristics of each treatment arm in an unadjusted and in an adjusted population following
propensity score analysis. Some patient characteristics at the time of diagnosis may have
influenced the treatment assignment and the tendency to treat a subject with anti-TNF-α as
first line therapy. These patient characteristics were considered as covariates in a propensity
score model and were also extracted from the RISK-PROKIIDS population. Patient
characteristics and covariate variables such as age, sex, etc., that were extracted from the RISK-
PROKIIDS study are listed in Table 2.2.2.4-1. Propensity score analysis methods and the
covariates used in the propensity score regression model are described in a later section.
The characteristic of height Z score (Htz), or standard deviation score, provides a quantitative
measure of how far a child departs from the mean value of height for age, expressed in units of
standard deviations (Flegal & Cole, 2013). Change in height Z score, such as in CD patients with
diminished growth, may influence treatment selection and was included as a covariate in
assessing the propensity to receive early intervention with biologic treatment.
Whether a patient was recruited at a large clinical site or a small clinical site was considered as
a possible factor influencing treatment assignment. Twenty-eight clinical sites from across the
United States and Canada recruited the subjects in the RISK-PROKIIDS study. The clinical sites
and the number of patients recruited per site from the 573 subjects included in this study and
as of June 2016 are listed in Appendix 3. Ninety-six out of 573 subjects or 16.8% of subjects
came from Canadian sites located in Ottawa, Halifax and Toronto. Since almost all sites claimed
to be associated with an academic institution, it was decided to group sites based on the
number of patients they enrolled. To simplify the clinical site covariate for the propensity score
regression model, a binary variable was created: a site was defined as “large” if 32 or more
included subjects were recruited at that site and “small” if otherwise.
42
Table 2.2.2.4-1. Patient Characteristics Extracted from the RISK-PROKIIDS data.
Patient Characteristic at Diagnosis
Variable Type Variable used as Covariate in Propensity Score Analysis
Sex Binary Yes Age at Diagnosis Continuous Yes
Family History of IBD Categorical Yes Jewish Origin Categorical Yes
Hispanic Origin Categorical Yes African Origin Categorical Yes
Ethnicity Categorical No Disease Activity at Diagnosis
Based on Physician Global Assessment
Categorical Yes
Disease Location Categorical Yes Presence of Peri-anal disease Binary Yes
Height Z score Continuous Yes Albumin Value Continuous Yes
Steroid Related Health State at Diagnosis
Categorical Yes
Recruited at Large Clinical Site (>31 patients)
Binary Yes
2.2.2.4.1 Summarizing Patient Characteristics
Patient characteristics at diagnosis (listed in Table 2.2.2.4-1) of the 573 RISK-PROKIIDS subjects
were compared between unadjusted groups of those who received biologics within the first
three months of diagnosis and those that did not. R software v. 3.4.0 (2017-04-21) with the
Table One package (v. 0.8.1) was used to create a table of baseline characteristics (Yoshida,
Bohn, & Yoshida, 2017). Chi-squared tests, t-tests, and Kruskal-Wallis Rank Sum Test were used
for comparisons between groups depending on the nature of the variables (Yoshida et al.,
2017).
43
Once all relevant patient characteristics were extracted from the RISK-PROKIIDS study, an
assessment of missing data within these variable fields ensued.
2.3 Handling Missing Data
The RISK-PROKIIDS study contained several fields with missing data. As stated previously, in
instances where there was too much missing data for a subject’s health state to be ascertained,
the subject was excluded. Where missing data prohibited the assessment of health state with
the wPCDAI, the PGA acted as a surrogate for health state assessment. Where missing data did
not inhibit a health state to be assessed, it was ignored. Where missing data required making
assumptions such as in the assignment of peri-rectal scores for calculating the wPCDAI, a
scoring scheme was devised to show how judgements were made when scoring was assigned.
Where missing data was absent in the RISK-PROKIIDS data such as treatment dose information,
clinical practice guidelines were used. A situation where surrogates for missing data could not
be used, was if missing values occurred at diagnosis and would be used in further analysis such
as propensity score analysis. This situation occurred with missing values for albumin at
diagnosis (baseline). The options for handling the missing albumin data were to either exclude
these subjects or impute missing values since albumin was a continuous variable and the
amount of missing data was small and it appeared that the data was missing at random.
Excluding the subjects would have reduced the sample size further. The explanation of the
imputation of missing albumin is discussed further below. Loss to follow-up was recorded in the
RISK-PROKIIDS study and none of the subjects in the unadjusted data set had any loss to follow-
up.
2.3.1 Imputation of Missing Albumin Data
Among the 573 eligible subjects included in the unadjusted data set, 64 subjects had missing
values for albumin at diagnosis (baseline, Visit 0). Seven of 131 (5.3%) of subjects with missing
baseline albumin values had early intervention with biologics (treated group) and 57/442
(12.9%) did not receive early intervention (control group). Imputation is suggested when
missing values are less than ten percent of the total values and that missing values are
44
considered missing at random (Bennett, 2001). In this case, it was assumed that data were
missing at random and therefore imputation of the missing values was conducted. To confirm
that albumin data were missing at random, the equality of covariances in groups with identical
missing patterns was tested and to determine whether the data were missing completely at
random (MissMech R package v.1.0.2), (Jamshidian, Jalal, & Jansen, 2014). The test concluded
that normality in the data was rejected at the 0.05 significance level and non-parametric testing
concluded that there was not sufficient evidence to reject that the data was missing completely
at random at the 0.05 significance level. Hence it was assumed that the data were missing at
random.
Multivariate imputation by chained equations (MICE) was conducted using the MICE R package
v. 2.25, 2015 (Buuren & Groothuis-Oudshoorn, 2011). MICE imputation operates under the
assumption that data are missing at random (Schafer & Graham, 2002). In the MICE procedure
a series of regression models were run such that each variable with missing data was modeled
according to other variables in the data (Azur, Stuart, Frangakis, & Leaf, 2011) and it is
suggested that ten cycles or iterations are sufficient (Buuren & Groothuis-Oudshoorn, 2011;
Raghunathan, Solenberger, & Van Hoewyk, 2002). The “mice” function was used to conduct the
imputations. The predictive mean matching method was specified as the method for
imputation as the data to impute was numerical and it is recommended to be a good overall
imputation method (Buuren & Groothuis-Oudshoorn, 2011). Ten iteration cycles were specified
and ten imputations were specified to reduce simulation error. The seed was arbitrarily set to
1. Strip plots were prepared to show the distribution of the imputed values among the
observed values in each of the ten datasets. A density plot of each imputed dataset was plotted
for albumin. The density plots showed the albumin distribution for each dataset plotted against
the original dataset with missing values. Each of the ten imputed datasets was extracted using
the “complete” function in the MICE R package. Once the datasets were extracted each data set
could be used individually or merged in further analysis. The next section describes how the
data sets were manipulated so that their data could ultimately be used in the cost-effectiveness
analysis.
45
2.3.2 Handling Imputed Data
The steps leading up to the economic evaluation involved preparing a data set with comparable
treatment arms to be used to inform transition probabilities to use in the cost-effectiveness
analysis. So far unadjusted data was extracted from the RISK-PROKIIDS data, and missing data
was imputed creating ten complete datasets each with a different set of imputed values for
albumin at baseline. The next step in preparing the unadjusted data was to create an adjusted
matched data set with a “treatment” arm and “control” arm of subjects with comparable
characteristics similar to a randomized clinical trial. The method to create the comparable
adjusted data set for retrospective observational data was propensity score analysis. Propensity
score analysis creates an adjusted data set with subjects of similar characteristics having a
similar propensity to be assigned to a treatment group or control group. To move forward with
the propensity score analysis and subsequent cost-effectiveness analysis, one adjusted data set
needed to be created from the ten imputed data sets. The following section explains the
rationale in handling the ten imputed sets and the options for choosing one complete data set
representative of the RISK-PROKIIDS population.
Mitra and Reiter suggest that propensity score analysis with imputed datasets can be
approached in two ways—the “Within” method and the “Across” methods (Mitra & Reiter,
2016) (Pan & Bai, 2015). The “Within” method calculates propensity scores on each imputed
dataset separately (Mitra & Reiter, 2016). The “Across” method averages out the propensity
score for each subject from each imputed dataset and then uses that averaged propensity score
to create a matched population (Mitra & Reiter, 2016). Mitra and Reiter (2016) ran several
simulations of treatment assignment regression models comparing both methods and
determined that when treatment assignment depends on both a covariate with missing data
and a covariate without missing data that the Across method has a slightly smaller bias than the
Within method, but that the variance of the Within method is smaller than the Across method.
They also established that each method produced slightly different point estimates and
suggested that depending on the data, both methods could work equally well to reduce bias or
one method may be dominant over the other (Mitra & Reiter, 2016). While it was suggested
46
that the Across method could produce a greater reduction in bias, there was not a unequivocal
recommendation on which method to choose in proceeding with propensity score analysis.
Hence, both the Across and Within methods were tested in the following propensity score
analysis.
To create one dataset to represent the Across method, the ten imputed albumin values were
averaged for each subject with missing albumin values. Since only the albumin covariate had
missing values, averaging the albumin values prior to calculating a propensity score was
tantamount to averaging the propensity scores for those subjects. The datasets from the
imputation process in the R package were exported into MS Excel using the “write.csv” function
to calculate the mean albumin values and the dataset with averaged albumin values was then
re-imported into R software (using the “read.csv” function) for propensity score analysis. Owing
to the ambiguity around choosing between the Across and Within methods, both methods
were used in subsequent propensity score analysis. However, since the Across method
produced one data set up front, as opposed to ten, it was chosen as the primary method to
inform probabilities in the cost-effectiveness analysis. Any recommendations between the
“Across” and “Within” methods for the purposes of a propensity score analysis followed by a
cost-effectiveness analysis have not been documented in the literature.
A secondary goal of this research is to examine the different methods of propensity score
analysis for the purposes of refining a data set to inform the transition probabilities in a cost-
effectiveness model. The next section describes the methods of propensity score analysis.
2.4 Propensity Score Analysis
Propensity score analysis is an approach to reduce selection bias when comparing treatment
groups in studies that were not conducted as randomized controlled trials. Since the RISK-
PROKIIDS study is an observational study, being analyzed retrospectively in which treatment
was up to the clinicians and not according to a set protocol, propensity score analysis was
conducted to create comparators for the economic evaluation. The propensity score is the
conditional probability of a study participant receiving treatment given observed covariates and
47
as such is a balancing score representing a vector of covariates (Guo & Fraser, 2014;
Rosenbaum & Rubin, 1983). A logistic regression was conducted with the dependent variable
being the log odds of receiving treatment. To optimize propensity score analysis, various types
of propensity score analysis approaches and subsequent balance diagnostics on the covariates
of the propensity score model were conducted in R (v. 3.4.0).
Regardless of approach, the following covariates were considered relevant for the for
propensity score regression model as they may have influenced treatment selection: age at
diagnosis, sex, disease activity at diagnosis based on PGA, African heritage, disease location,
presence of peri-anal disease, height z-score, steroid-related health state at diagnosis, albumin
values, and whether the subject was recruited at a large clinical site (>31 patients). The
propensity score regression model was as follows where e(x) is the conditional probability of
receiving the early anti-TNF-α treatment.
e(x)= β0+ βageXage + βsex Xsex+ βdisease severity at diagnosis(PGA) Xdisease severity at diagnosis(PGA) + βAfrican
heritageXAfrican heritage + βdisease localization Xdisease localization + βpresence of peri-anal diseaseXpresence of peri-
anal disease+ βheight-zscoreXheight-zscore + βAlbuminvaluesXAlbuminvalues + βsteroid-related health stateXsteroid-
related health state + βclinical site sizeXclinical site size
It was assumed that there were no interactions among the baseline covariates. Four types of
propensity score analyses were conducted: propensity score matching, propensity score
weighting, stratification (sub-classification), and covariate balance propensity score (CBPS).
Each is discussed in greater detail below. Exact matching was also attempted but no exact
matches on all covariates could be achieved. Following the propensity score methods, balance
diagnostics were used to assess the quality of the propensity score methods in creating
balanced data sets. A description of the balance diagnostics follows the descriptions of each
propensity score method below.
A summary diagram of the propensity score methods and process is shown in Figure 2.4-1.
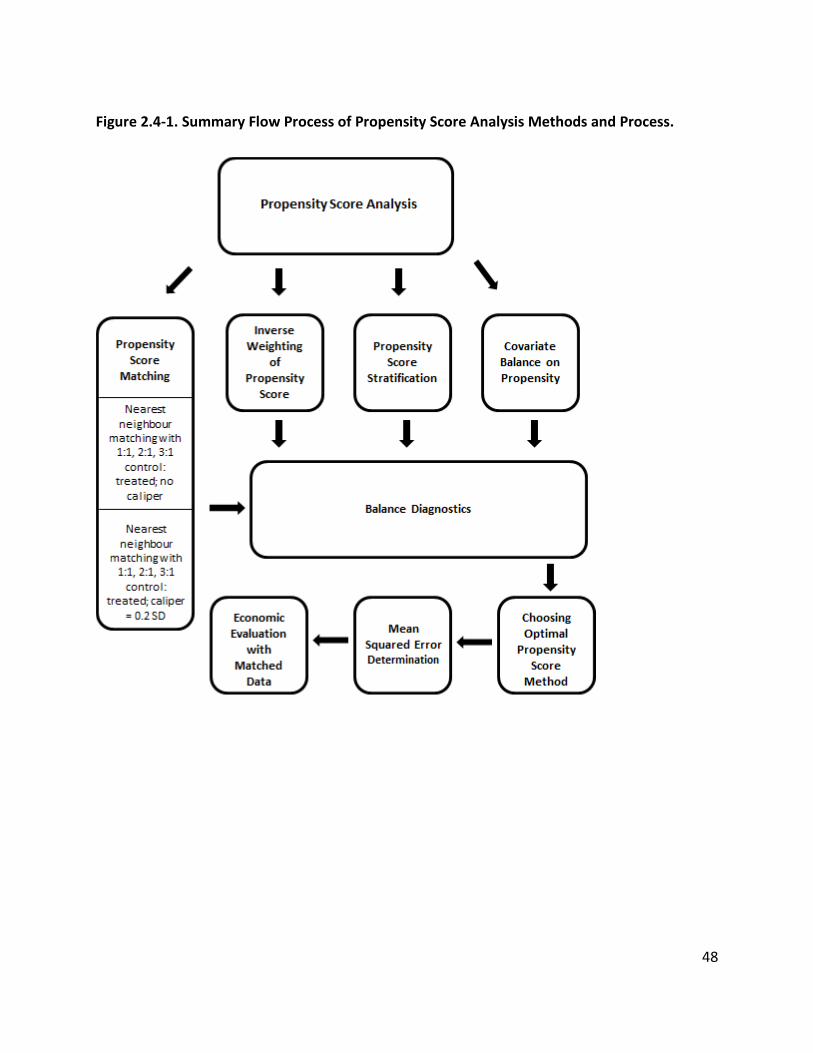
48
Figure 2.4-1. Summary Flow Process of Propensity Score Analysis Methods and Process.
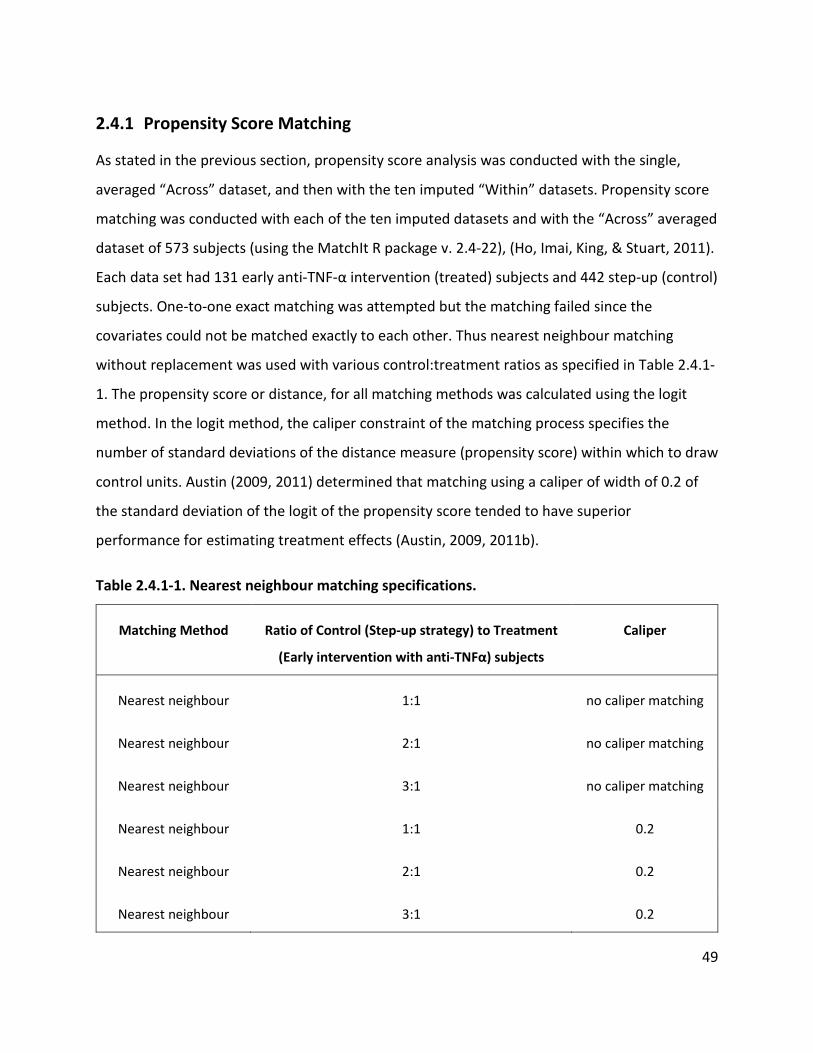
49
2.4.1 Propensity Score Matching
As stated in the previous section, propensity score analysis was conducted with the single,
averaged “Across” dataset, and then with the ten imputed “Within” datasets. Propensity score
matching was conducted with each of the ten imputed datasets and with the “Across” averaged
dataset of 573 subjects (using the MatchIt R package v. 2.4-22), (Ho, Imai, King, & Stuart, 2011).
Each data set had 131 early anti-TNF-α intervention (treated) subjects and 442 step-up (control)
subjects. One-to-one exact matching was attempted but the matching failed since the
covariates could not be matched exactly to each other. Thus nearest neighbour matching
without replacement was used with various control:treatment ratios as specified in Table 2.4.1-
1. The propensity score or distance, for all matching methods was calculated using the logit
method. In the logit method, the caliper constraint of the matching process specifies the
number of standard deviations of the distance measure (propensity score) within which to draw
control units. Austin (2009, 2011) determined that matching using a caliper of width of 0.2 of
the standard deviation of the logit of the propensity score tended to have superior
performance for estimating treatment effects (Austin, 2009, 2011b).
Table 2.4.1-1. Nearest neighbour matching specifications.
Matching Method Ratio of Control (Step-up strategy) to Treatment
(Early intervention with anti-TNFα) subjects
Caliper
Nearest neighbour 1:1 no caliper matching
Nearest neighbour 2:1 no caliper matching
Nearest neighbour 3:1 no caliper matching
Nearest neighbour 1:1 0.2
Nearest neighbour 2:1 0.2
Nearest neighbour 3:1 0.2
50
2.4.2 Propensity Score Weighting
Propensity score weighting technique was conducted based on the method described by Austin
(2011a) using the R Cobalt package version 1.3.1 (Greifer). Propensity score weighting uses the
inverse of probability of treatment assignments as a weight in a multivariate outcome analysis
(Guo & Fraser, 2014). A logistic regression to generate propensity scores was run within the
package. The average treatment effect for the treated was the average effect of treatment on
those subjects who ultimately received the treatment (Austin, 2011a). The inverse probability
of treatment weights (wi) were defined by:
wi = (Zi/ei + (1-Zi/1-ei),
where Zi was a binary variable indicating whether or not the ith subject was treated with early
anti-TNF-α, and ei denotes the propensity score for the ith subject.
2.4.3 Propensity Score Analysis with Sub-classification
In this approach, the estimated propensity score was used to stratify subjects into homogenous
subclasses, with similar propensity scores. Each subclass consisted of relatively the same
number of subjects (Guo & Fraser, 2014). Propensity score analysis with subclassification was
conducted with the MatchIt R package v. 2.4-22, 2017-02-22, (Ho et al., 2011) by specifying
that four subclasses on the propensity score would be created. Cochran (1968) and later
Rosenbaum and Rubin (1983) demonstrated that stratifying on the quintiles of a continuous
confounding variable eliminated approximately 90% of the bias due to that variable (Cochran
WG, 1968; Rosenbaum & Rubin, 1983). However due to the large number of covariates, four
subclasses were chosen to make the calculations less cumbersome computationally.
2.4.4 Covariate Balancing Propensity Score (CBPS) Method
The “CBPS” function in the CBPS R package v. 0.13, 2016-12-27 was used to implement the
CBPS method. In this approach the propensity score is estimated such that it maximizes the
51
resulting covariate balance as well as the prediction of treatment assignment and thus
mitigates the potential regression model misspecification (Imai & Ratkovic, 2014) (Fong,
Ratkovic, & Imai, 2014).
2.4.5 Balance Diagnostics on the Propensity Score Methods
An appropriate propensity score model achieves balance among the covariates in the control
and treated groups. Good balance is achieved when mean standardized differences are below
0.1 and variance ratios are closest to 1 (Austin, 2009). Standardized differences are determined
using means and variances from treated and control continuous covariates, and from
prevalence for binary covariates (Austin, 2011a). The standardized difference compares the
difference in means in units of the pooled standard deviation and as such allows different
samples sizes and units to be compared (Austin, 2011a). Covariate balance for each method of
propensity score analysis was assessed using the cobalt package v. 1.3.1 in R v. 3.4.0 (Greifer,
2016). A mean standardized difference of 0.1 and a variance ratio of 1.5 were set as thresholds
to assess balance for each covariate. The propensity score methods which indicated the
greatest degree of balance and included the most covariates with mean standardized
differences below 0.1 and variance ratios closest to 1 were chosen as the candidate methods
for creating a dataset representative of the RISK-PROKIIDS data set and to inform parameters in
the economic evaluation.
2.4.5.1 Propensity Score Analysis Plots
To support the balance determinations and to show balance graphically between covariates in
the unadjusted and matched treatment groups, Quantile-quantile plots (Q-Q plots) and jitter
plots were created using the MatchIt R package v. 2.4-22, 2017-02-22 (Ho et al., 2011). A Love
plot showing balance before and after propensity score analysis was created in the cobalt
package v. 1.3.1 in R v. 3.4.0 (Greifer, 2016). Since balance results were similar for the ten
imputed databases, the plots were created using an arbitrarily chosen imputed data set (data
set 4) as an example.
52
2.4.6 Choosing an Appropriate Propensity Score Analysis Method and Exporting Matched Datasets
While the CBPS method and the weighting method showed good balance among the covariates,
technical limitations with the CBPS R package v. 0.13, 2016-12-27 (Imai & Ratkovic, 2014), and R
Cobalt package version 1.3.1 (Greifer) did not facilitate the extraction of the matched data sets.
Both the 2:1 and 3:1 ratio of control to treated subjects nearest neighbour matched data sets
with a caliper of (0.2) showed comparable balance among covariates. One to one or two to one
control to treated subject ratios are recommended when comparing many to one matching as
they tend to reduce mean squared error (MSE) in the treatment effect (Austin, 2010). A 2:1
control to treated ratio nearest neighbour matching method with a caliper of 0.2 was chosen as
the preferred propensity score method to create a matched data set to inform the parameters
of the economic evaluation.
A common method of determining the treatment effect in a clinical study is to use a regression
model with relevant covariates. A reasonably fitted model would have a small mean squared
error. To confirm a more predictive model fit, the mean squared error was compared between
the 2:1 and 3:1 ratios of control to treated subjects for the nearest neighbour matching method
with a caliper of 0.2. The MSE was determined for the treatment effect using the “Across” data
sets. The “Across” data set with a 3:1 ratio of control to treated subjects had 293 control
subjects and 123 treated subjects. The “Across” data set with a 2:1 ratio of control to treated
subjects had 237 control subjects and 123 treated subjects. To determine the MSE on a
treatment effect, a logistic regression was performed using the number of steroid-free
semesters over three years as the outcome measure when comparing the treatment groups of
early intervention with biologics and step-up treatment and relevant covariates. The logistic
regression equation was the following:
Number of steroid-free semesters ~ β0 + βEarly biologic interventionXEarly biologic intervention +βageXage
+ βsex Xsex+ βdisease severity at diagnosis(PGA) Xdisease severity at diagnosis(PGA) + βAfrican heritageXAfrican
heritage + βdisease localization Xdisease localization + βpresence of peri-anal diseaseXpresence of peri-anal disease+
53
βheight-zscoreXheight-zscore + βAlbuminvaluesXAlbuminvalues + βsteroid-related health stateXsteroid-related health
state + βclinical site sizeXclinical site size + βImmunomodulators within first 3monthsXImmunomodulators within first
3months + β5ASA within first 3monthsX5ASA within first 3months + βSteroids within first 3monthsXSteroids within first
3months + βAntibiotics within first 3monthsXAntibiotics within first 3months + βEnteral nutrition within first
3monthsXEnteral nutrition within first 3months
The MSE using the matched data set from the 2:1 control to treatment ratio, nearest neighbour
matching with a caliper of 0.2 was 2.66. The MSE using the matched data set from the 3:1
control to treatment ratio, nearest neighbour matching with a caliper of 0.2 was 2.77.
Therefore, a final data set with a 2:1 control to treatment ratio and a nearest neighbour
matching process with a caliper of (0.2) was selected.
The primary goal of this study was to perform an economic evaluation comparing early
intervention with anti-TNFα to standard care. Only one data set would be required to inform
the parameters for the economic evaluation model. Ten imputed data sets were generated and
an eleventh was created using the average of the imputed values. Since the eleventh data set,
(the “Across” data set), reflected an average of the ten others, it was used to form the basis of
the propensity score analysis and subsequently inform the parameters for the economic
evaluation model. Any variations in the economic evaluation that may have arisen as a result of
using the other ten imputed datasets (the “Within” approach) were described in a later section
as part of a sensitivity analysis examining structural uncertainty. The 2:1 control to treatment
ratio nearest neighbour matched data set with a caliper of 0.2 created from the “Across” data
set was chosen to inform parameters for the economic evaluation. This matched data set
containing 360 total subjects with 237 standard care subjects (control) and 123 early biologic
intervention (treatment) subjects was extracted from the R software into an Excel file so that
clinical outcomes and transition probabilities between health states could be determined. Prior
to data set extraction, baseline patient characteristics and descriptive statistics for this matched
data set were determined using the R software v. 3.4.0 (2017-04-21) with the Table One
package (v. 0.8.1) (Yoshida et al., 2017). From this point forward, the adjusted, matched data
54
set of 360 subjects was used as the representative patient population of pediatric Crohn’s
disease patients. This population of 360 subjects served to inform some health-related
transition probabilities in the following cost-effective analysis.
2.5 Cost-effectiveness Analysis
Thus far, all data analysis has served to extract and prepare data so that it, along with
information from the scientific literature, can be used to inform inputs in a cost-effectiveness
analysis. The primary goal of this research was to perform a cost-effectiveness analysis
comparing early intervention with anti-TNF-α in pediatric Crohn’s disease patients to standard
care. Specifically, the incremental cost per corticosteroid-free weeks in remission for pediatric
moderate-to-severe Crohn’s disease patients treated with anti-TNF-α within the first three
months of diagnosis compared to standard care (which allowed the option of treatment with
anti-TNF- α after three months of diagnosis) over three years. The following sections will
describe the inputs and parameters for the cost-effectiveness analysis. The target population,
comparators, perspectives, clinical outcomes, time horizon, model details, costing details, cost-
effectiveness analysis methods and uncertainty analysis will be described in the following
sections.
2.5.1 Target Population
The target patient population was newly-diagnosed children, between the ages of 4 to 17 years,
with moderate-to-severe Crohn’s Disease.
2.5.2 Comparators
The intervention, or investigational treatment group, was defined as receiving anti-TNF-α
biologics within the first 3 months of diagnosis (early intervention) with or without other
concomitant drugs. The control group was defined as those subjects that did not receive anti-
TNF-α biologics within the first 3 months of diagnosis (standard care) but received other classes
of treatment. The standard care group could have received biologics after 3 months of
diagnosis reflecting a step-up approach to biologic treatment. Currently, there is no standard
55
definition of “early intervention”, and three months was an arbitrary designation based on the
typical time to assess induction of treatment. Alternate definitions of early interventions were
not modeled due to a lack of data.
The main anti-TNF-α biologic treatments used in this study are infliximab and adalimumab. The
recommended dose of infliximab for pediatric patients (≥ 9 years of age) with moderately to
severely active Crohn’s disease is 5 mg/kg given as an induction regimen at 0, 2 and 6 weeks
followed by a maintenance regimen of 5 mg/kg every 8 weeks (Remicade® product monograph,
(Janssen Inc., 2018)). Infliximab is typically indicated for the reduction of signs and symptoms
and induction and maintenance of clinical remission in pediatric patients with moderately to
severely active Crohn’s disease who have had an inadequate response to conventional therapy
(corticosteroid and/or aminosalicylate and/or an immunosuppressant). The recommended
adalimumab induction dose regimen for pediatric patients with severely active Crohn’s disease
and moderately active Crohn’s disease with no response to conventional therapy is 160 mg at
Week 0, followed by 80 mg at Week 2 administered by subcutaneous injection. The
recommended adalimumab maintenance dose regimen is 20 mg every other week beginning at
Week 4 (Humira® product monograph, (Abbvie Corporation, 2018)). The three month time
point is approximately the time a response to induction therapy is expected in Crohn’s disease
(Siegel, 2010). Other treatments, described previously in the section about treatment
determination from the RISK-PROKIIDS study, include corticosteroids, immunomodulators, 5-
aminosalicylates, antibiotics, and enteral nutrition which may be used with or without the
biologics.
2.5.3 Perspectives
A health care payer and societal payer perspectives were taken for the cost-effectiveness
analyses. Specifically, an Ontario public health care system was chosen to represent the health
care payer. Due to recent changes in pediatric drug coverage in Ontario, it was assumed that all
treatment costs were paid for by the public healthcare payer (Ontario Ministry of Health and
Long-Term Care, 2018c). The societal payer perspective includes all public health care sector
56
costs and caregiver loss of productivity costs. The microsimulation model was run separately for
each perspective following adjustment to the appropriate variables.
2.5.4 Clinical Outcomes
Time (measured in weeks) in steroid-free remission was chosen as the primary clinical outcome.
The outcome is a composite of two factors—whether the subject was on steroids and their
health state. The number of steroid-free remission semesters for each subject during the three
years of the study was counted. The greatest number of consecutive steroid-free remission
semesters was also assessed for each subject over the 36 months. The number of subjects in
steroid-free remission from each intervention arm was assessed at 12, 24 and 36 months. The
number of steroid-free remission weeks was determined by the number of weeks in medical
remission minus the number of medical remission weeks on steroids.
2.5.5 Time Horizon
While the RISK-PROKIIDS study is an ongoing study that started in 2008 with ongoing follow-up
beyond three years, there are a limited number of subjects that had a comprehensive three
year follow-up period that received anti-TNF-α treatments. The RISK-PROKIIDS study had only a
limited number of subjects that experienced an early anti-TNF-α treatment regime, particularly
since it is considered “off-label” use, and each of those subjects had a limited amount of follow-
up time to inform the cost-effectiveness analysis. A time horizon longer than three years would
have introduced increased uncertainty in the model and would have to be based on studies
with non-naïve pediatric and adult CD studies with limited long-term follow-up. Therefore, the
time horizon for the cost-effectiveness analysis (CEA) was three years.
2.5.6 The Crohn’s Disease Cost-effectiveness Model
Crohn’s disease is a chronic disease characterized by recurring periods of active disease flare-
ups and relatively asymptomatic times of remission (Crohn’s and Colitis Foundation of Canada,
2012). Once diagnosed, patients with moderate-to-severe Crohn’s disease are prescribed
medication whether they are in a state of active disease or in remission. Treatment regimens
57
are tailored according to the disease state and are designed to induce a response to treatment
and remission when in active phase (the induction phase of treatment), and stave off relapse
when in remission and once symptoms have subsided (the maintenance phase of treatment) (F.
Ruemmele et al., 2014), (Petar Mamula, Markowitz, Baldassano, Grossman, & Kelsen, 2008). A
subject may enter the maintenance phase of drug treatment with active disease if they have
completed the treatment course of the induction phase but have some symptoms remaining
that still need to be resolved. Some Crohn’s disease patients require hospitalization or surgery
when experiencing bouts of severe disease and some, on rare occasions can experience serious
adverse events during treatment. Hence, an appropriate cost-effectiveness model of Crohn’s
disease was needed to take into account the various health states, events, outcomes and costs
of pediatric CD patients. A health state transition (Markov) model was created to model the
possible health states experienced by CD patients and is described below.
2.5.6.1 Health State Transition Model
A health state transition (Markov) model was created to model seven health states experienced
by Crohn’s disease patients: 1) active disease, 2) active disease experiencing adverse events of
special interest, 3) active disease requiring surgery or hospitalization, 4) medical remission, 5)
surgical remission, 6) surgical complications and 7) death (see Figure 2.5.6.1-1 for the health
state transition diagram). The arrows in the diagram indicate the direction of moving from state
to state from one cycle to another. Curved arrows indicate remaining in the same state from
one cycle to the next.
The health state of “Active Disease” in moderate-to-severe CD was defined as the state of
having active disease flare-up with a wPCDAI score of greater than or equal to 12.5 or a
Physician Global Assessment score of greater than 1. It was assumed that people started in the
state of Active Disease at the beginning of the microsimulation and entered the induction phase
of treatment. Within the Active Disease state, a patient received treatment and relevant
treatment costs were assigned while in this state. From the Active Disease state, in the next
cycle, a person could remain in active disease, or enter the “Medical Remission” state, enter the
“Active disease with adverse events” stage, or enter the “Active disease requiring surgery or

58
hospitalization” state. Costs associated with treatment and medical visits were assigned to the
Active Disease health state. Costs associated with the induction phase and maintenance phase
of treatment were assigned to the Active Disease phase if a subject exhibited an active disease
state symptomatically.
“Medical Remission” was defined as a state remission state with a wPCDAI of 12.5 or less and a
PGA of 1. The time spent in the Medical Remission and whether an individual was on
corticosteroids while in medical remission informed the primary effectiveness outcome. As CD
required maintenance phase treatment, patients in Medical Remission still incurred treatment
drug costs and follow-up physician visits. Once in medical remission, a person could remain in
medical remission or relapse back into Active Disease. Maintenance phase costs of treatment
were assigned to the medical remission state.
From the state of Active Disease a person could experience an Adverse Event of Special
Interest. The state of Adverse Events of Special Interest described a state where treatment
could result in possible treatment-related events of particular concern such as serious infection,
cancer or an antibody reaction. The type of adverse event experienced was tracked within the
model. Once the adverse event of special interest was resolved or addressed, the patient
returned to the Active Disease state. Costs related to the treatment of these adverse events
were assigned to this health state.
As a result of very severe active disease, a patient may require surgery or hospitalization and
enter the state of Active Disease requiring Surgery/Hospitalization. Costs associated with the
Active Disease requiring Surgery/Hospitalization included hospitalization costs, and surgery
costs. Following surgery, a person entered the state of Surgical Remission or Surgical
Complications.
Surgical Remission was defined as remission achieved through surgery and not as a result of
drug treatment. The state of Surgical Remission had remission phase drug treatment costs
assigned to it similar to medical remission, however, time in surgical remission was not included
as time in remission for the purposes of calculating the primary outcome. Patients could remain
59
in surgical remission or relapse into active disease. If a subject entered into Surgical Remission
then relapsed into Active Disease and subsequently went into remission from drug treatment,
the subject would enter the Medical Remission state and their time in Medical Remission was
counted toward the primary outcome.
Following surgery, a person may have experienced post-surgical complications and entered the
state of Surgical Complications. Within this health state the cost of treating the surgical
complications were assigned. Sepsis was considered the major surgical complication following
surgery (Blackburn et al., 2014; J. F. Colombel et al., 2004). Hospitalization and treatment costs
associated with sepsis were assigned to this health state. Patients were limited to remain in the
surgical complication health state a maximum of four weeks to reflect average treatment time
for this health state.
All states eventually went to the Death state as this was the absorbing state. However since CD
does not impact pediatric life expectancy, it was not expected that many individuals would end
up in the death state during the time horizon of this model (Bitton, Vutcovici, Sewitch, Suissa, &
Brassard, 2016; De Ridder et al., 2014)). It was assumed that no costs were associated with the
Death state in this model.
An incremental cost-effectiveness analysis (CEA) was undertaken using individual-level
microsimulation in a health state transition (Markov) model. Individual-level microsimulation
was chosen to account for the heterogeneity and variation in baseline characteristics and
disease progression over time and possible changing risk among the patient population. A
model was constructed using TreeAgePro software version 2018 release 1.0 (Williamstown,
Massachusetts).
Within the seven health states described above, certain features of Crohn’s disease treatment
were modelled to provide a comprehensive view of the possible disease pathways experienced
by children with CD. A more comprehensive pathway of the Crohn’s disease model from one
health state to the others (health states are shown at either end) is shown in Figure 2.5.6.1-2.
The induction phase of treatment, which has a more aggressive treatment regimen, the
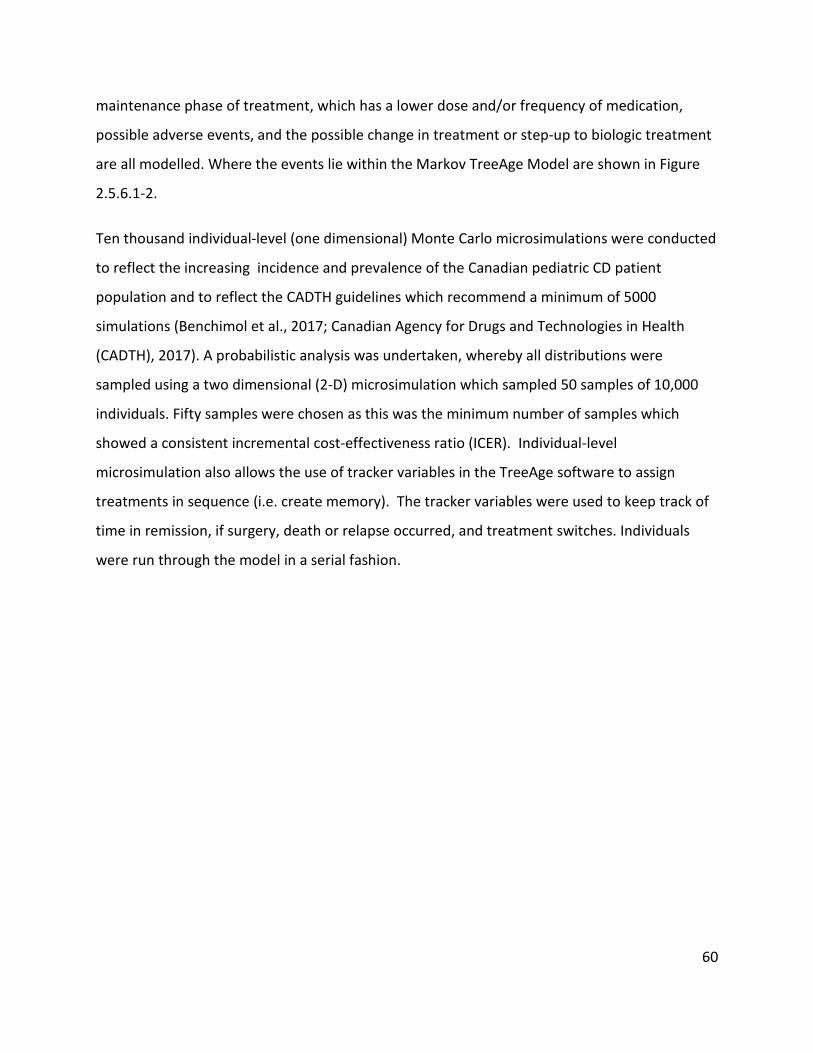
60
maintenance phase of treatment, which has a lower dose and/or frequency of medication,
possible adverse events, and the possible change in treatment or step-up to biologic treatment
are all modelled. Where the events lie within the Markov TreeAge Model are shown in Figure
2.5.6.1-2.
Ten thousand individual-level (one dimensional) Monte Carlo microsimulations were conducted
to reflect the increasing incidence and prevalence of the Canadian pediatric CD patient
population and to reflect the CADTH guidelines which recommend a minimum of 5000
simulations (Benchimol et al., 2017; Canadian Agency for Drugs and Technologies in Health
(CADTH), 2017). A probabilistic analysis was undertaken, whereby all distributions were
sampled using a two dimensional (2-D) microsimulation which sampled 50 samples of 10,000
individuals. Fifty samples were chosen as this was the minimum number of samples which
showed a consistent incremental cost-effectiveness ratio (ICER). Individual-level
microsimulation also allows the use of tracker variables in the TreeAge software to assign
treatments in sequence (i.e. create memory). The tracker variables were used to keep track of
time in remission, if surgery, death or relapse occurred, and treatment switches. Individuals
were run through the model in a serial fashion.
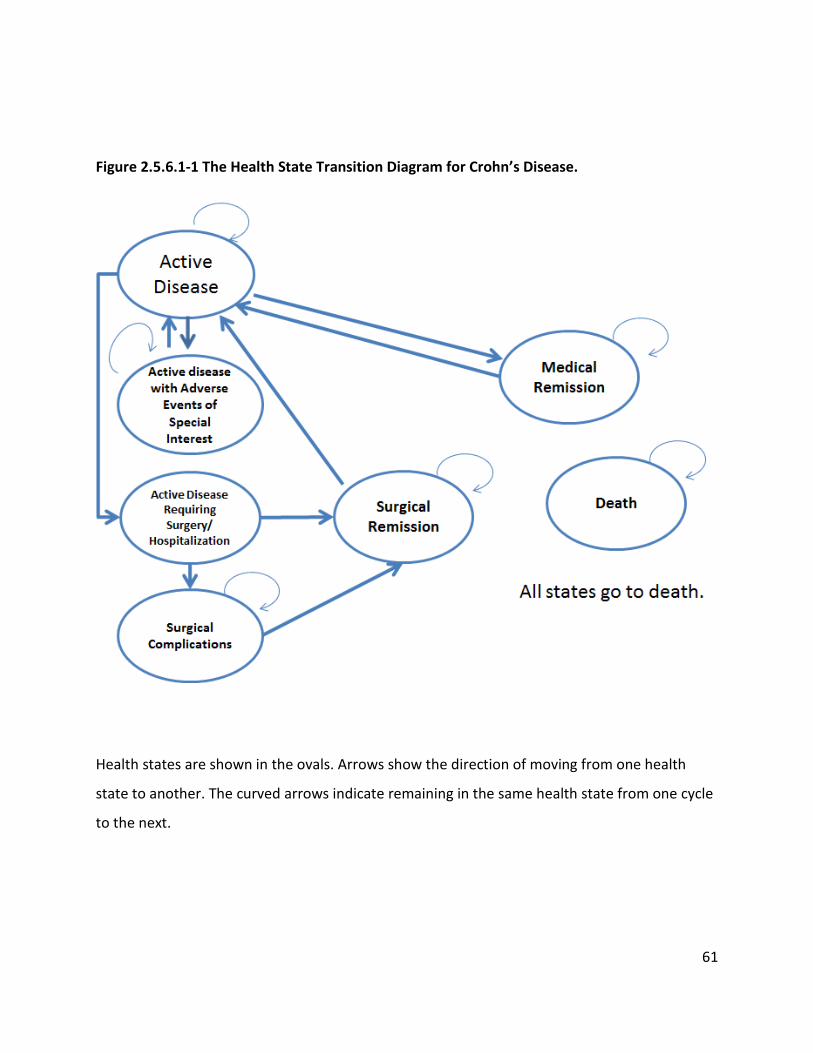
61
Figure 2.5.6.1-1 The Health State Transition Diagram for Crohn’s Disease.
Health states are shown in the ovals. Arrows show the direction of moving from one health
state to another. The curved arrows indicate remaining in the same health state from one cycle
to the next.
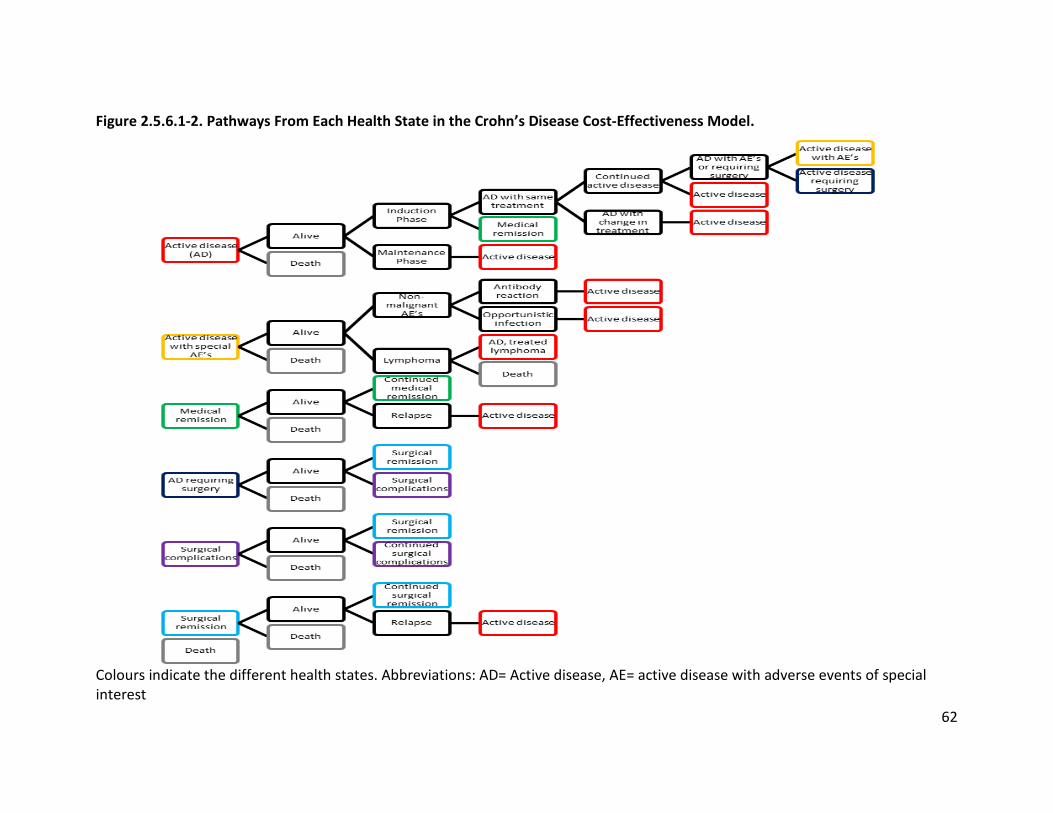
62
Figure 2.5.6.1-2. Pathways From Each Health State in the Crohn’s Disease Cost-Effectiveness Model.
Colours indicate the different health states. Abbreviations: AD= Active disease, AE= active disease with adverse events of special interest
63
2.5.6.2 Cycle Length
Best practices guidelines suggest that cycle lengths should be short enough that an event
occurs at most once per cycle, and short enough to represent the frequency of clinical events
and interventions (Siebert et al., 2012). The surgery/hospitalization state averages a few days
before transitioning to another health state and thus represents the shortest health state. The
transition between active disease and remission may also be short (based on expert opinion
discussion with Dr. A. Griffiths and Dr. T. Walters). A one week cycle length was chosen for the
cost-effectiveness analysis to reflect the shortest possible time for transitioning between health
states. (Siebert et al., 2012) Health states in the RISK-PROKIIDS were only recorded at
approximately six month intervals so transition probabilities were adjusted for the one week
cycle length (Siebert et al., 2012). The equations used to convert six month probabilities to
weekly probabilities are shown in Appendix 7.
2.5.6.3 Transition Probabilities
Transition probabilities were determined using data from the representative propensity
matched data set by counting the number of subjects in a comparator group undergoing a
particular health transition. Health states were observed at six-month intervals. Transition
probabilities were converted to rates and then weekly probabilities to accommodate the
chosen one-week cycle length. The following parameters were informed by the representative
propensity score matched data set from the RISK-PROKIIDS study:
• the probability of transitioning from active disease to medical remission
• the probability of transitioning from active disease to active disease requiring surgery or
hospitalization
• the probability of continued medical remission
• the probability of transitioning from surgical remission to active disease
64
Complementary probabilities such as the probability of remaining in surgical remission were
calculated automatically by the Tree Age 2018 v.1.0 decision modelling software as all branches
in the cost-effectiveness model were binary (Figure 2.5.6.1-2). It was assumed that following
surgery that an individual automatically transitioned into surgical remission until the possibility
of surgical complications or relapse into active disease. It was also assumed that all subjects
started in the active disease phase when entering the Markov model. All other transition
probabilities were extracted from relevant literature. Adverse event occurrence was not
captured in the RISK-PROKIIDS study and therefore the probability of adverse events occurring
was derived from the literature. Transition probabilities are listed in Tables 2.5.6.3-1 and Table
2.5.6.3-2. Where standard deviations or standard errors could not be determined, a 20%
standard deviation was used for probabilities. The changing probability of switching treatment
to an anti-TNF-α treatment from week to week during the course of the three year time horizon
was based on the RISK-PROKIIDS study, was assigned a fixed distribution, and is shown in
Appendix 8. Distributions for the probability of taking a particular medication or being in a
health state were sampled every cycle. The probability of death on anti-TNF-α or other
treatments was assumed to be the same as the probability of death from all causes since there
was not definite evidence to suggest otherwise for pediatric CD subjects (Bitton et al., 2016; De
Ridder et al., 2014).
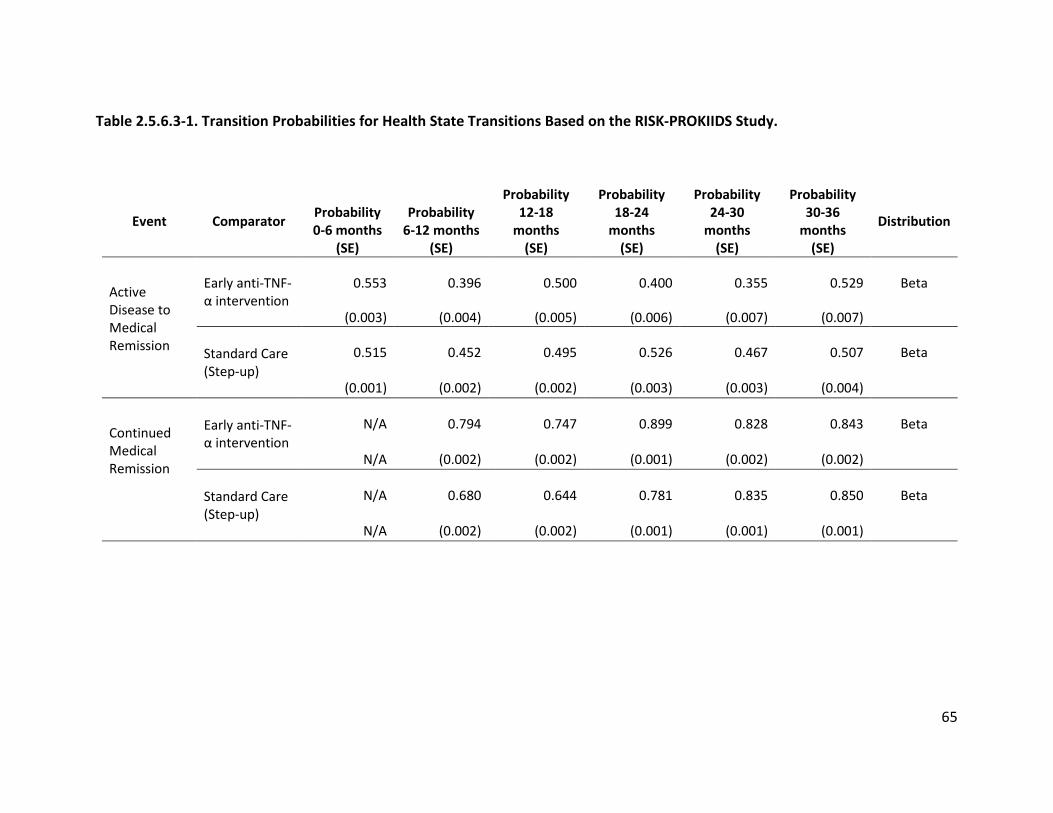
65
Table 2.5.6.3-1. Transition Probabilities for Health State Transitions Based on the RISK-PROKIIDS Study.
Event Comparator Probability 0-6 months
(SE)
Probability 6-12 months
(SE)
Probability 12-18
months (SE)
Probability 18-24
months (SE)
Probability 24-30
months (SE)
Probability 30-36
months (SE)
Distribution
Active Disease to Medical Remission
Early anti-TNF-α intervention
0.553 0.396 0.500 0.400 0.355 0.529 Beta
(0.003) (0.004) (0.005) (0.006) (0.007) (0.007)
Standard Care (Step-up)
0.515 0.452 0.495 0.526 0.467 0.507 Beta
(0.001) (0.002) (0.002) (0.003) (0.003) (0.004)
Continued Medical Remission
Early anti-TNF-α intervention
N/A 0.794 0.747 0.899 0.828 0.843 Beta
N/A (0.002) (0.002) (0.001) (0.002) (0.002)
Standard Care (Step-up)
N/A 0.680 0.644 0.781 0.835 0.850 Beta
N/A (0.002) (0.002) (0.001) (0.001) (0.001)
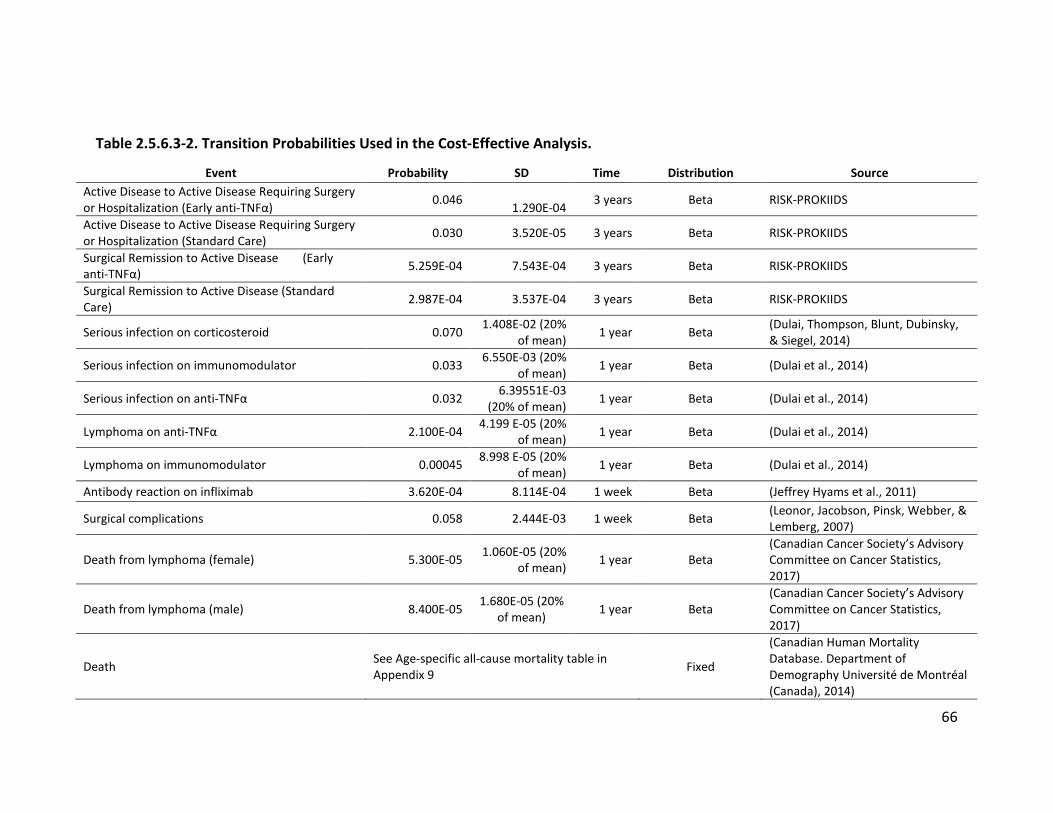
66
Table 2.5.6.3-2. Transition Probabilities Used in the Cost-Effective Analysis.
Event Probability SD Time Distribution Source Active Disease to Active Disease Requiring Surgery or Hospitalization (Early anti-TNFα) 0.046 1.290E-04 3 years Beta RISK-PROKIIDS
Active Disease to Active Disease Requiring Surgery or Hospitalization (Standard Care) 0.030 3.520E-05 3 years Beta RISK-PROKIIDS
Surgical Remission to Active Disease (Early anti-TNFα) 5.259E-04 7.543E-04 3 years Beta RISK-PROKIIDS
Surgical Remission to Active Disease (Standard Care) 2.987E-04 3.537E-04 3 years Beta RISK-PROKIIDS
Serious infection on corticosteroid 0.070 1.408E-02 (20% of mean) 1 year Beta (Dulai, Thompson, Blunt, Dubinsky,
& Siegel, 2014)
Serious infection on immunomodulator 0.033 6.550E-03 (20% of mean) 1 year Beta (Dulai et al., 2014)
Serious infection on anti-TNFα 0.032 6.39551E-03 (20% of mean) 1 year Beta (Dulai et al., 2014)
Lymphoma on anti-TNFα 2.100E-04 4.199 E-05 (20% of mean) 1 year Beta (Dulai et al., 2014)
Lymphoma on immunomodulator 0.00045 8.998 E-05 (20% of mean) 1 year Beta (Dulai et al., 2014)
Antibody reaction on infliximab 3.620E-04 8.114E-04 1 week Beta (Jeffrey Hyams et al., 2011)
Surgical complications 0.058 2.444E-03 1 week Beta (Leonor, Jacobson, Pinsk, Webber, & Lemberg, 2007)
Death from lymphoma (female) 5.300E-05 1.060E-05 (20% of mean) 1 year Beta
(Canadian Cancer Society’s Advisory Committee on Cancer Statistics, 2017)
Death from lymphoma (male) 8.400E-05 1.680E-05 (20% of mean) 1 year Beta
(Canadian Cancer Society’s Advisory Committee on Cancer Statistics, 2017)
Death See Age-specific all-cause mortality table in Appendix 9 Fixed
(Canadian Human Mortality Database. Department of Demography Université de Montréal (Canada), 2014)
67
2.5.6.4 Discount Rate
A 1.5% base case discount rate was chosen to reflect guidelines released by CADTH (Canadian
Agency for Drugs and Technologies in Health (CADTH), 2017).
2.5.7 Costing
The cost-effectiveness analysis assessed costs and resource use in the management of pediatric
CD. From a health care public payer perspective, costing measured direct costs and resource
use for items associated with two broad categories: (i) treatment costs including medications
and medical visits, and (ii) treatment of drug and disease-related adverse events and
complications. From a societal perspective, in addition to all costs assigned to the health care
public payer perspective, such as treatment costs, costs related to caregiver productivity losses
were included. Standard methods for economic evaluation were followed (Canadian Agency for
Drugs and Technologies in Health (CADTH), 2017; Drummond et al., 2005). All treatment prices,
service fees and procedural costs were based on 2017 prices and costs and if necessary, and
unless otherwise specified, costs were adjusted to 2017 Canadian dollars using the Canadian
Consumer Price Index for health and personal care (Statistics Canada, 2015). The treatment
patterns of the RISK-PROKIIDS population informed the cost of treatment over time for each
comparator group and the probability of changing treatments. Due to the chronic nature of CD,
patients required treatment and medical services in active and remission phases of disease
albeit to different degrees. Hence, CD patients incurred costs in all health states except for
Death. Costs associated with the CD health states are outlined in Table 2.5.7-1. Details about
the costing of each cost category are specified in the following subsections.
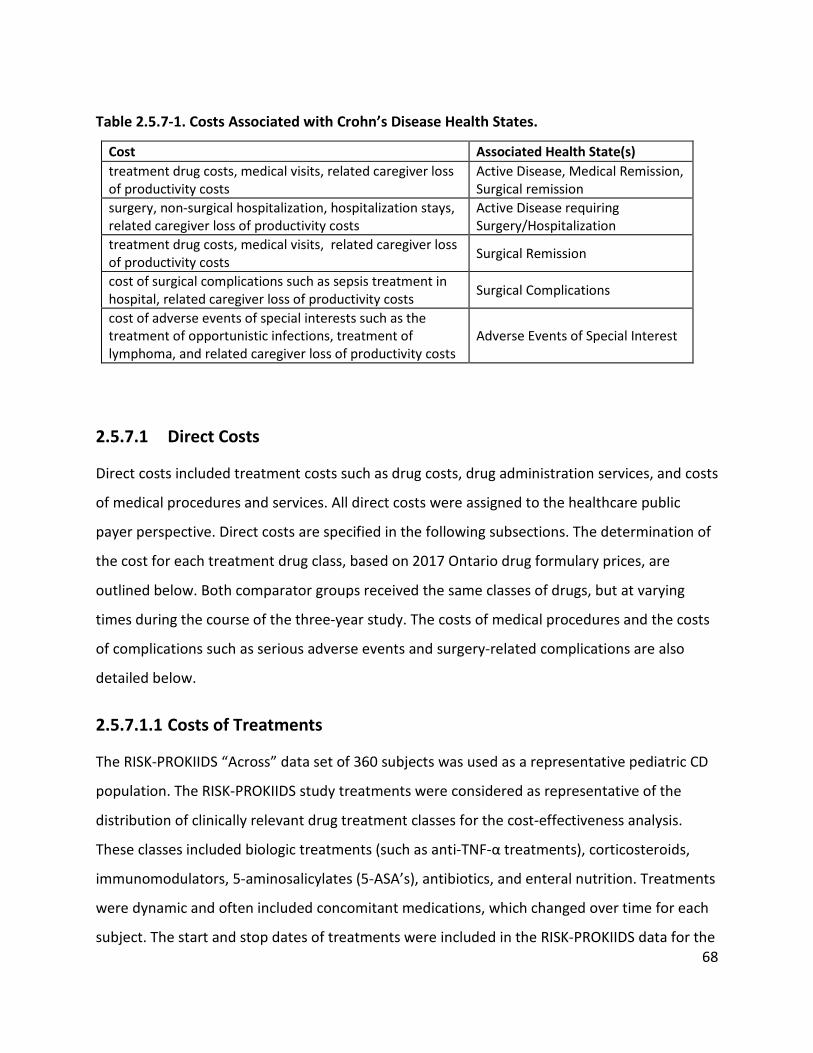
68
Table 2.5.7-1. Costs Associated with Crohn’s Disease Health States.
Cost Associated Health State(s) treatment drug costs, medical visits, related caregiver loss of productivity costs
Active Disease, Medical Remission, Surgical remission
surgery, non-surgical hospitalization, hospitalization stays, related caregiver loss of productivity costs
Active Disease requiring Surgery/Hospitalization
treatment drug costs, medical visits, related caregiver loss of productivity costs Surgical Remission
cost of surgical complications such as sepsis treatment in hospital, related caregiver loss of productivity costs Surgical Complications
cost of adverse events of special interests such as the treatment of opportunistic infections, treatment of lymphoma, and related caregiver loss of productivity costs
Adverse Events of Special Interest
2.5.7.1 Direct Costs
Direct costs included treatment costs such as drug costs, drug administration services, and costs
of medical procedures and services. All direct costs were assigned to the healthcare public
payer perspective. Direct costs are specified in the following subsections. The determination of
the cost for each treatment drug class, based on 2017 Ontario drug formulary prices, are
outlined below. Both comparator groups received the same classes of drugs, but at varying
times during the course of the three-year study. The costs of medical procedures and the costs
of complications such as serious adverse events and surgery-related complications are also
detailed below.
2.5.7.1.1 Costs of Treatments
The RISK-PROKIIDS “Across” data set of 360 subjects was used as a representative pediatric CD
population. The RISK-PROKIIDS study treatments were considered as representative of the
distribution of clinically relevant drug treatment classes for the cost-effectiveness analysis.
These classes included biologic treatments (such as anti-TNF-α treatments), corticosteroids,
immunomodulators, 5-aminosalicylates (5-ASA’s), antibiotics, and enteral nutrition. Treatments
were dynamic and often included concomitant medications, which changed over time for each
subject. The start and stop dates of treatments were included in the RISK-PROKIIDS data for the
69
three-year follow-up period. In instances where a stop date of treatment was not recorded it
was assumed that the treatment continued until at least the end of the follow-up period.
Within each class of treatment several possible drugs could have been prescribed to an
individual. The proportion of subjects on each drug within a class during the course of three
years for each comparator group is detailed in Appendix 10. The proportions of subjects in each
drug class per week over a three-year period were used to calculate the weighted average
utilization per drug class per week for each comparator group. The six month mean of the
weighted average utilization per week per drug class was used in the cost-effectiveness model
to inform drug treatment costs.
Doses were calculated based on weight or body surface area depending on the drug. Weight
fluctuations were not captured throughout the three years for RISK-PROKIIDS subjects so
standard growth charts were used to estimate mean sex specific and age-related weights
(Kuczmarski et al., 2000). Similarly, body surface area estimates were estimated using the same
growth charts. These growth charts were also referenced by the Sick Kids Guidelines for caloric
energy requirements for enteral nutrition (Aquilina et al., 2007). Where doses were based on
weight, costs were calculated in one kilogram intervals. The proportion of subjects that
switched to an anti-TNF-α treatment informed the probability of treatment escalation to a
biologic (see Appendix 10). Doses were rarely recorded in the RISK-PROKIIDS dataset, therefore
dosing according to standard clinical practice was used in cost estimates (see Table 2.5.7.1.1-1,
Table 2.5.7.1.1-2, Table 2.5.7.1.1-3, Table 2.5.7.1.1-4, Table 2.5.7.1.1-5, and Table 2.5.7.1.1-6
for recommended clinical practice dosing references for each drug class). Doses that were
recorded in the RISK-PROKIIDS data reflected standard doses. If a dose range was
recommended, the largest dose in the range was used to calculate the dose. The number of
tablets required to fill that dose were calculated and costed for each weight.
In the CEA model, the probability of drug treatment in each cycle was calculated based on the
binary condition of being on particular drug class during each cycle over the course of three
years based on the RISK-PROKIIDS study data.
70
Costs for each medication class were calculated by multiplying the dosage regimen by a unit
price. Unit prices were obtained from the Ontario Drug Formulary on a per tablet basis and a
per vial basis for intravenous medications. For immunomodulators, corticosteroids, antibiotics,
5-aminosalicylates, and enteral nutrition products, within each class of drug, the price of each
class of drug was calculated as the weighted average price of each drug within that class.
Details are described in the subsections describing the costs of each drug class.
The total cost of drug treatment per cycle was based on the following formula:
Where CS = corticosteroids, IM = immunomodulators, Anti = antibiotics, 5-ASA = Oral 5-ASA, EN
= enteral nutrition, IFX = infliximab, ADA = adalimumab, p = probability (0 or 1), c = cost
Σ drug costij = (pCS x cCS)ij + (pIM x cIM)ij + (pAnti x cAnti)ij + (p5-ASA x c5-ASA) ij + (pEN x cEN) ij
+ (pIFX x cIFX) ij + (pADA x cADA) ij
For the ith patient, jth week
The proportions of subjects taking each drug class for each comparator group per cycle are
shown in the Appendix 10. All treatment costs were assigned a gamma distribution for the
probability sensitivity analysis (Drummond et al., 2005). Pharmacy dispensing costs were
assumed to be ten dollars per month and were assigned to the health care system. Treatment
costs included infusion clinic costs (where applicable) and were assigned to the public
healthcare payer.
Cost of Anti-TNF-α Biologics
The biologics used in the RISK-PROKIIDS data set were infliximab and adalimumab. The costs
and dose recommendations are shown in Table 2.5.7.1.1-1. A dose escalation or an increase in
treatment frequency for biologics was not recorded in the RISK-PROKIDS data set so dose
increases were not modelled. If a treatment switch between biologics occurred, it was
modelled as a switch from infliximab to adalimumab to reflect switching in the RISK-PROKIIDS

71
study. A gamma distribution was assigned to biologic costs for the probability sensitivity
analysis (Drummond et al., 2005).
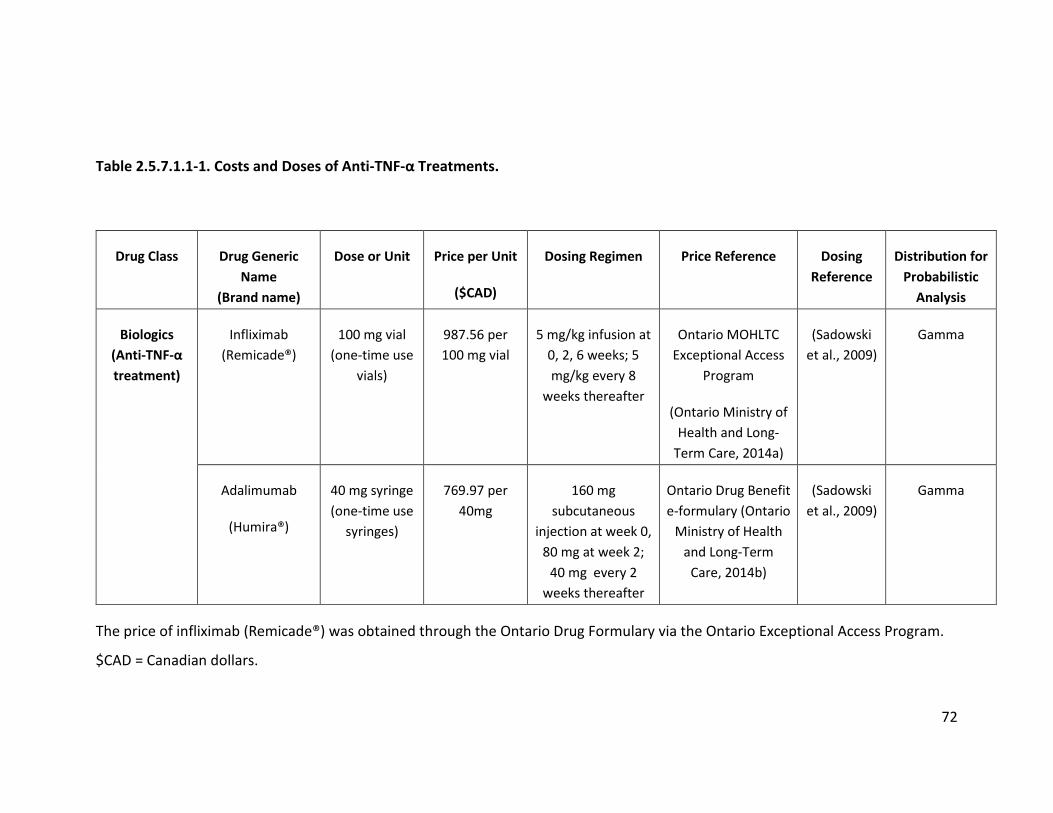
72
Table 2.5.7.1.1-1. Costs and Doses of Anti-TNF-α Treatments.
Drug Class Drug Generic Name
(Brand name)
Dose or Unit Price per Unit
($CAD)
Dosing Regimen Price Reference Dosing Reference
Distribution for Probabilistic
Analysis
Biologics (Anti-TNF-α treatment)
Infliximab (Remicade®)
100 mg vial (one-time use
vials)
987.56 per 100 mg vial
5 mg/kg infusion at 0, 2, 6 weeks; 5 mg/kg every 8
weeks thereafter
Ontario MOHLTC Exceptional Access
Program
(Ontario Ministry of Health and Long-
Term Care, 2014a)
(Sadowski et al., 2009)
Gamma
Adalimumab
(Humira®)
40 mg syringe (one-time use
syringes)
769.97 per 40mg
160 mg subcutaneous
injection at week 0, 80 mg at week 2;
40 mg every 2 weeks thereafter
Ontario Drug Benefit e-formulary (Ontario
Ministry of Health and Long-Term
Care, 2014b)
(Sadowski et al., 2009)
Gamma
The price of infliximab (Remicade®) was obtained through the Ontario Drug Formulary via the Ontario Exceptional Access Program.
$CAD = Canadian dollars.
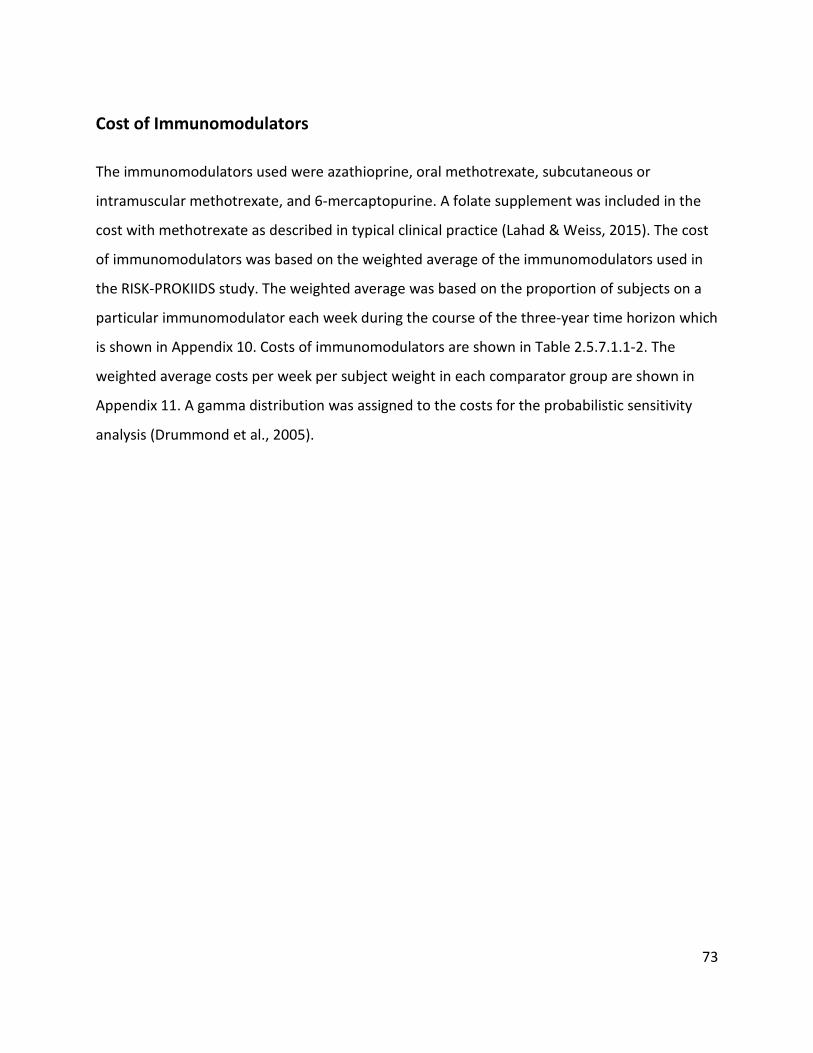
73
Cost of Immunomodulators
The immunomodulators used were azathioprine, oral methotrexate, subcutaneous or
intramuscular methotrexate, and 6-mercaptopurine. A folate supplement was included in the
cost with methotrexate as described in typical clinical practice (Lahad & Weiss, 2015). The cost
of immunomodulators was based on the weighted average of the immunomodulators used in
the RISK-PROKIIDS study. The weighted average was based on the proportion of subjects on a
particular immunomodulator each week during the course of the three-year time horizon which
is shown in Appendix 10. Costs of immunomodulators are shown in Table 2.5.7.1.1-2. The
weighted average costs per week per subject weight in each comparator group are shown in
Appendix 11. A gamma distribution was assigned to the costs for the probabilistic sensitivity
analysis (Drummond et al., 2005).
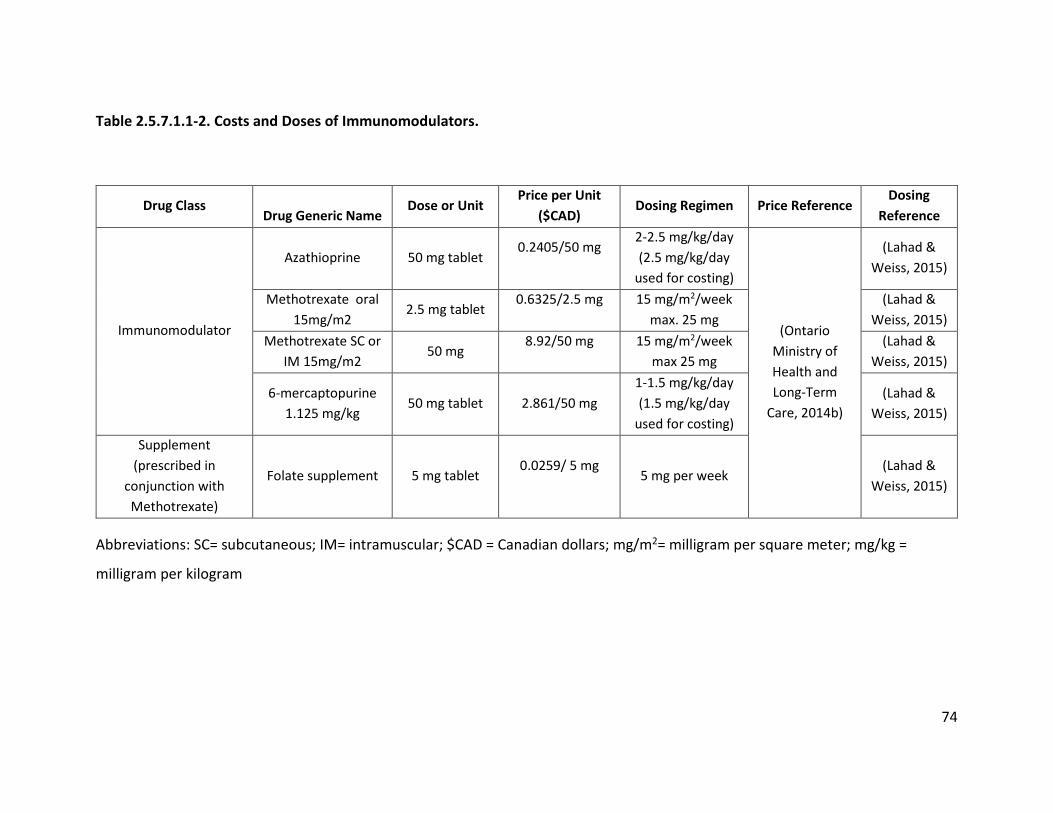
74
Table 2.5.7.1.1-2. Costs and Doses of Immunomodulators.
Drug Class
Drug Generic Name Dose or Unit
Price per Unit ($CAD)
Dosing Regimen Price Reference Dosing
Reference
Immunomodulator
Azathioprine 50 mg tablet 0.2405/50 mg
2-2.5 mg/kg/day (2.5 mg/kg/day
used for costing)
(Ontario Ministry of Health and Long-Term
Care, 2014b)
(Lahad & Weiss, 2015)
Methotrexate oral 15mg/m2
2.5 mg tablet 0.6325/2.5 mg
15 mg/m2/week
max. 25 mg (Lahad &
Weiss, 2015) Methotrexate SC or
IM 15mg/m2 50 mg
8.92/50 mg
15 mg/m2/week max 25 mg
(Lahad & Weiss, 2015)
6-mercaptopurine 1.125 mg/kg
50 mg tablet 2.861/50 mg 1-1.5 mg/kg/day (1.5 mg/kg/day
used for costing)
(Lahad & Weiss, 2015)
Supplement (prescribed in
conjunction with Methotrexate)
Folate supplement 5 mg tablet 0.0259/ 5 mg
5 mg per week
(Lahad & Weiss, 2015)
Abbreviations: SC= subcutaneous; IM= intramuscular; $CAD = Canadian dollars; mg/m2= milligram per square meter; mg/kg =
milligram per kilogram
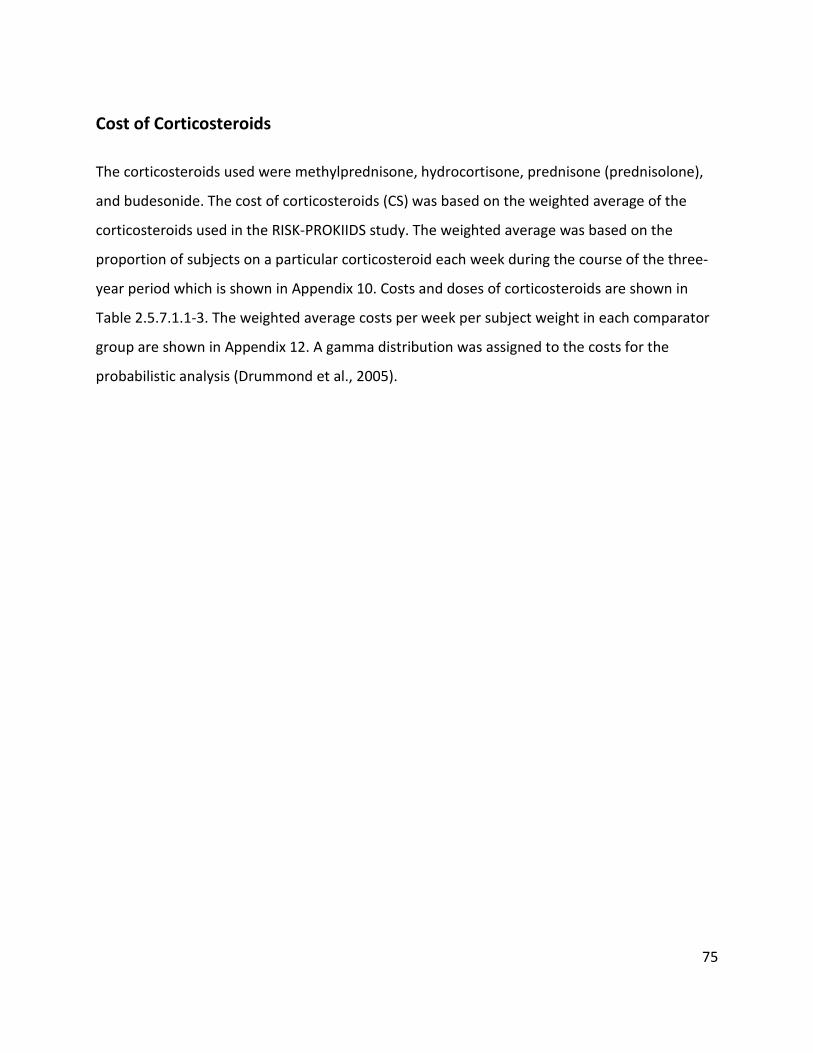
75
Cost of Corticosteroids
The corticosteroids used were methylprednisone, hydrocortisone, prednisone (prednisolone),
and budesonide. The cost of corticosteroids (CS) was based on the weighted average of the
corticosteroids used in the RISK-PROKIIDS study. The weighted average was based on the
proportion of subjects on a particular corticosteroid each week during the course of the three-
year period which is shown in Appendix 10. Costs and doses of corticosteroids are shown in
Table 2.5.7.1.1-3. The weighted average costs per week per subject weight in each comparator
group are shown in Appendix 12. A gamma distribution was assigned to the costs for the
probabilistic analysis (Drummond et al., 2005).
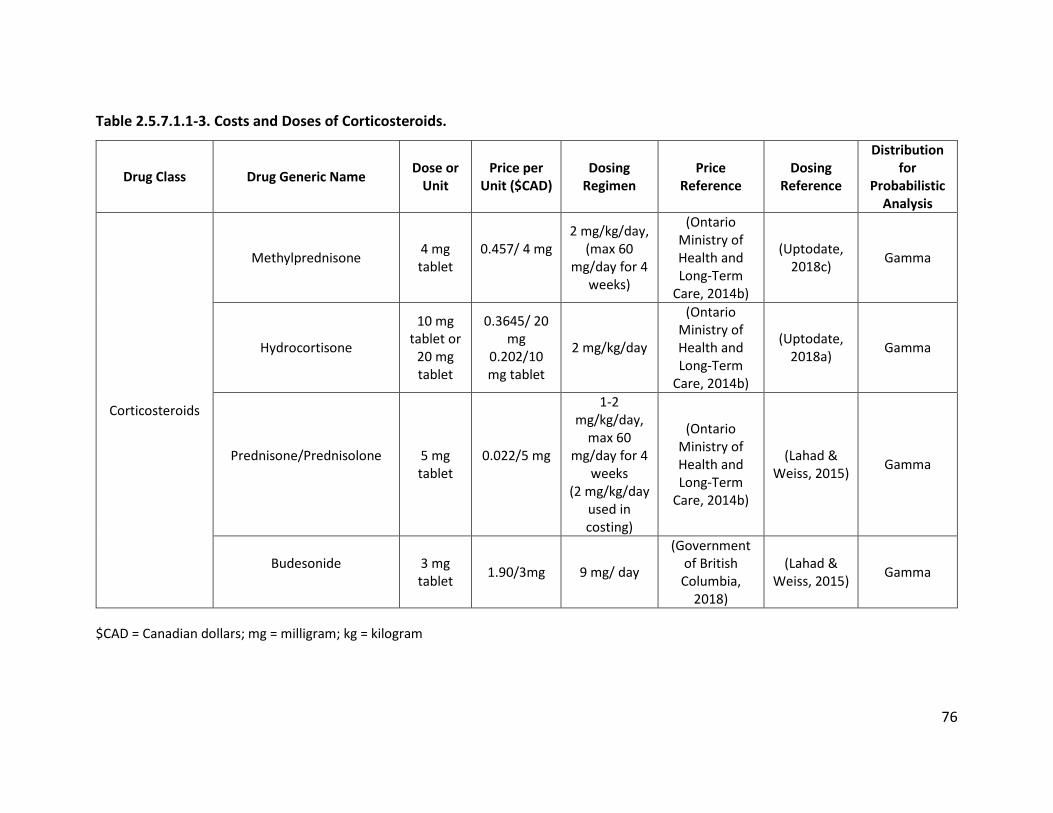
76
Table 2.5.7.1.1-3. Costs and Doses of Corticosteroids.
Drug Class Drug Generic Name Dose or Unit
Price per Unit ($CAD)
Dosing Regimen
Price Reference
Dosing Reference
Distribution for
Probabilistic Analysis
Corticosteroids
Methylprednisone 4 mg tablet
0.457/ 4 mg
2 mg/kg/day, (max 60
mg/day for 4 weeks)
(Ontario Ministry of Health and Long-Term
Care, 2014b)
(Uptodate, 2018c) Gamma
Hydrocortisone
10 mg tablet or
20 mg tablet
0.3645/ 20 mg
0.202/10 mg tablet
2 mg/kg/day
(Ontario Ministry of Health and Long-Term
Care, 2014b)
(Uptodate, 2018a) Gamma
Prednisone/Prednisolone
5 mg tablet
0.022/5 mg
1-2 mg/kg/day,
max 60 mg/day for 4
weeks (2 mg/kg/day
used in costing)
(Ontario Ministry of Health and Long-Term
Care, 2014b)
(Lahad & Weiss, 2015) Gamma
Budesonide
3 mg tablet 1.90/3mg 9 mg/ day
(Government of British Columbia,
2018)
(Lahad & Weiss, 2015) Gamma
$CAD = Canadian dollars; mg = milligram; kg = kilogram
77
Cost of Antibiotics
The antibiotics used in the RISK-PROKIIDS study were ciprofloxacin, rifaxamin, and
metronidazole. The cost of antibiotics did not vary substantially over the course of three years
so the mean cost per week for the three years was estimated based on assumed subject
weight. The proportion of subjects on antibiotics in a particular week was based on the
observed proportion of subjects in the RISK-PROKIIDS study. The cost and dose of antibiotics
used in the RISK-PROKIIDS study are listed in Table 2.5.7.1.1-4. Antibiotics are not part of the
standard treatment for CD but can be prescribed in conjunction with other treatments (Lahad &
Weiss, 2015). Antibiotics were prescribed in the RISK-PROKIIDS study and were thus included in
the model. The weighted average cost of antibiotics for each comparator group is shown in
Appendix 13. A gamma distribution was assigned to the weekly antibiotic costs for the
probability sensitivity analysis (Drummond et al., 2005).

78
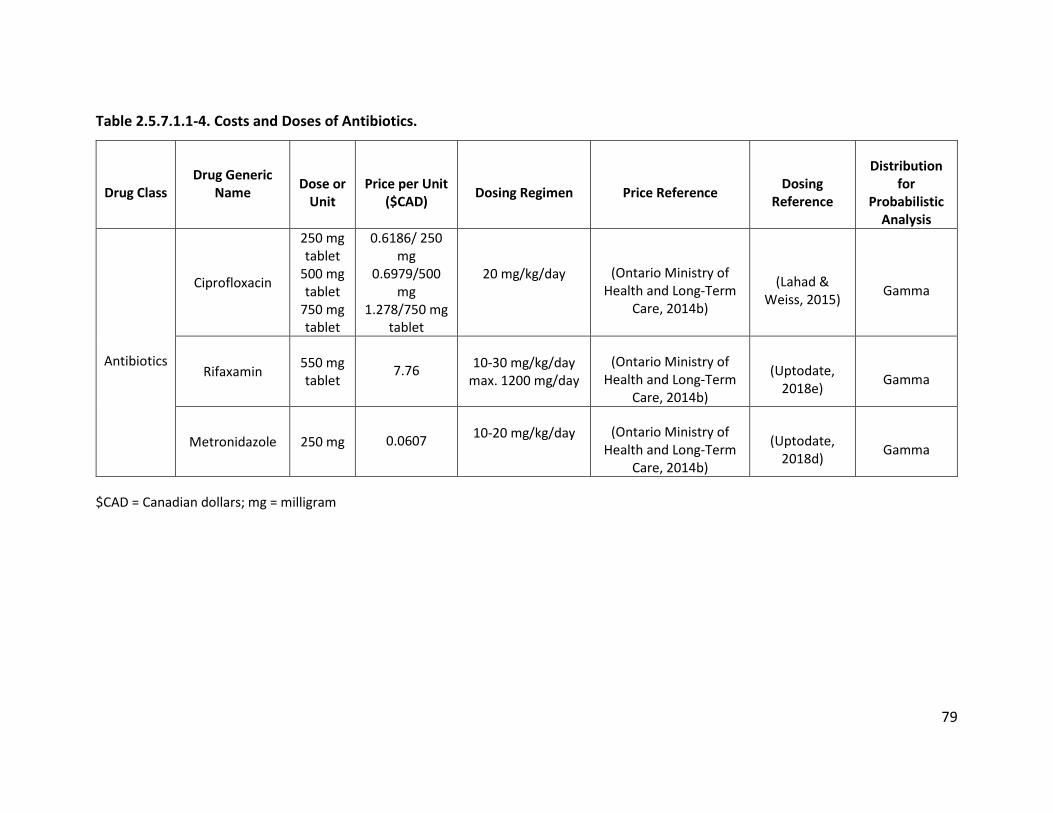
79
Table 2.5.7.1.1-4. Costs and Doses of Antibiotics.
Drug Class Drug Generic
Name
Dose or Unit
Price per Unit ($CAD) Dosing Regimen Price Reference Dosing
Reference
Distribution for
Probabilistic Analysis
Antibiotics
Ciprofloxacin
250 mg tablet
500 mg tablet
750 mg tablet
0.6186/ 250 mg
0.6979/500 mg
1.278/750 mg tablet
20 mg/kg/day
(Ontario Ministry of Health and Long-Term
Care, 2014b)
(Lahad & Weiss, 2015) Gamma
Rifaxamin 550 mg tablet
7.76
10-30 mg/kg/day max. 1200 mg/day
(Ontario Ministry of Health and Long-Term
Care, 2014b)
(Uptodate, 2018e) Gamma
Metronidazole 250 mg 0.0607
10-20 mg/kg/day
(Ontario Ministry of Health and Long-Term
Care, 2014b)
(Uptodate, 2018d) Gamma
$CAD = Canadian dollars; mg = milligram
80
Cost of 5-aminosalicylates
The 5-aminosalicylates (5-ASA’s) used in the RISK-PROKIIDS study were mesalazine,
sulfasalazine, and olsalazine. The cost of oral 5-ASA drugs did not vary substantially over the
course of three years so the mean cost per week for the three years was estimated based on
assumed subject weight. The weighted average of the 5-ASA’s used during the course of the
study was estimated based on the proportion of subjects on 5-ASA’s in a week was based on
the observed proportion of subjects in the RISK-PROKIIDS study. The cost and dose of 5-ASA’s
used in the RISK-PROKIIDS study are listed in Table 2.5.7.1.1-5. 5-ASA’s are not part of the
standard treatment for CD but since they were prescribed in the RISK-PROKIIDS study and often
still prescribed, they were included in the model. The weighted average cost of 5-ASA’s for each
comparator group is shown in Appendix 14. A gamma distribution was assigned to the 5-ASA
costs for the probability sensitivity analysis (Drummond et al., 2005) .
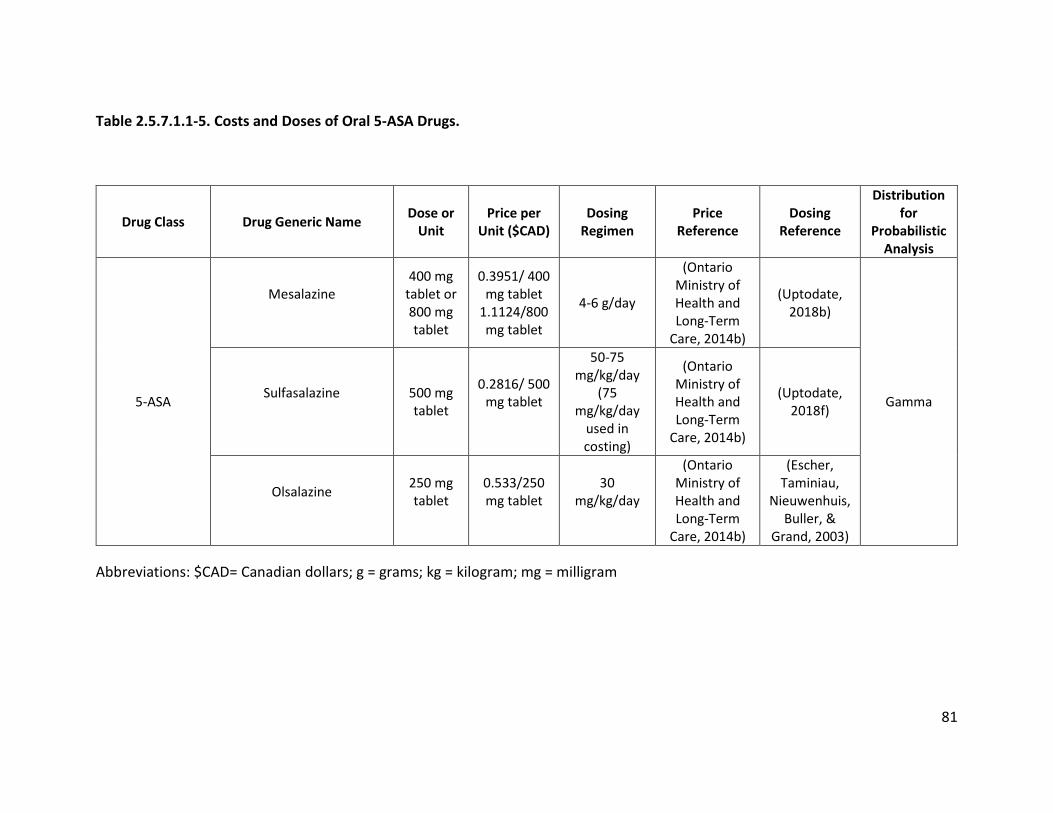
81
Table 2.5.7.1.1-5. Costs and Doses of Oral 5-ASA Drugs.
Drug Class Drug Generic Name Dose or Unit
Price per Unit ($CAD)
Dosing Regimen
Price Reference
Dosing Reference
Distribution for
Probabilistic Analysis
5-ASA
Mesalazine
400 mg tablet or 800 mg tablet
0.3951/ 400 mg tablet
1.1124/800 mg tablet
4-6 g/day
(Ontario Ministry of Health and Long-Term
Care, 2014b)
(Uptodate, 2018b)
Gamma Sulfasalazine
500 mg tablet
0.2816/ 500 mg tablet
50-75 mg/kg/day
(75 mg/kg/day
used in costing)
(Ontario Ministry of Health and Long-Term
Care, 2014b)
(Uptodate, 2018f)
Olsalazine
250 mg tablet
0.533/250 mg tablet
30 mg/kg/day
(Ontario Ministry of Health and Long-Term
Care, 2014b)
(Escher, Taminiau,
Nieuwenhuis, Buller, &
Grand, 2003)
Abbreviations: $CAD= Canadian dollars; g = grams; kg = kilogram; mg = milligram
82
Cost of Enteral Nutrition
Enteral nutrition (EN) estimates were based on estimated energy requirements reflective of a
child’s activity level, sex, weight and age as listed in the Guidelines for the Administration of
Enteral and Parenteral Nutrition in Paediatrics, published by the Hospital for Sick Children
(Aquilina et al., 2007). For the purposes of this analysis, children were assumed to have an
overall sedentary activity level due to their moderate-to-severe CD, and it was assumed that
one unit (250 mL) of enteral nutrition contained 1kcal/mL The minimum number of EN units
and maximum number of EN units were estimated for each sex and for the age ranges of 4-17
years. Several brands of EN were listed in the RISK-PROKIIDS study with varying price ranges as
shown in Table 2.5.7.1.1-6. Using the smallest energy requirement and least expensive brand
of EN and the largest energy requirement and the most expensive brand of EN, the minimum
and maximum possible prices for an EN supplement were calculated. Since actual brands of EN
weren’t always specified in the RISK-PROKIIDS study, mean costs per week of EN per age and
sex were calculated and are listed in Appendix 15. The cost of one enteral feeding pump and
associated apparatus was added and assigned a fixed cost of $1066.58 (The Specialty Food
Shop, 2017) which was assigned to the health care payer.
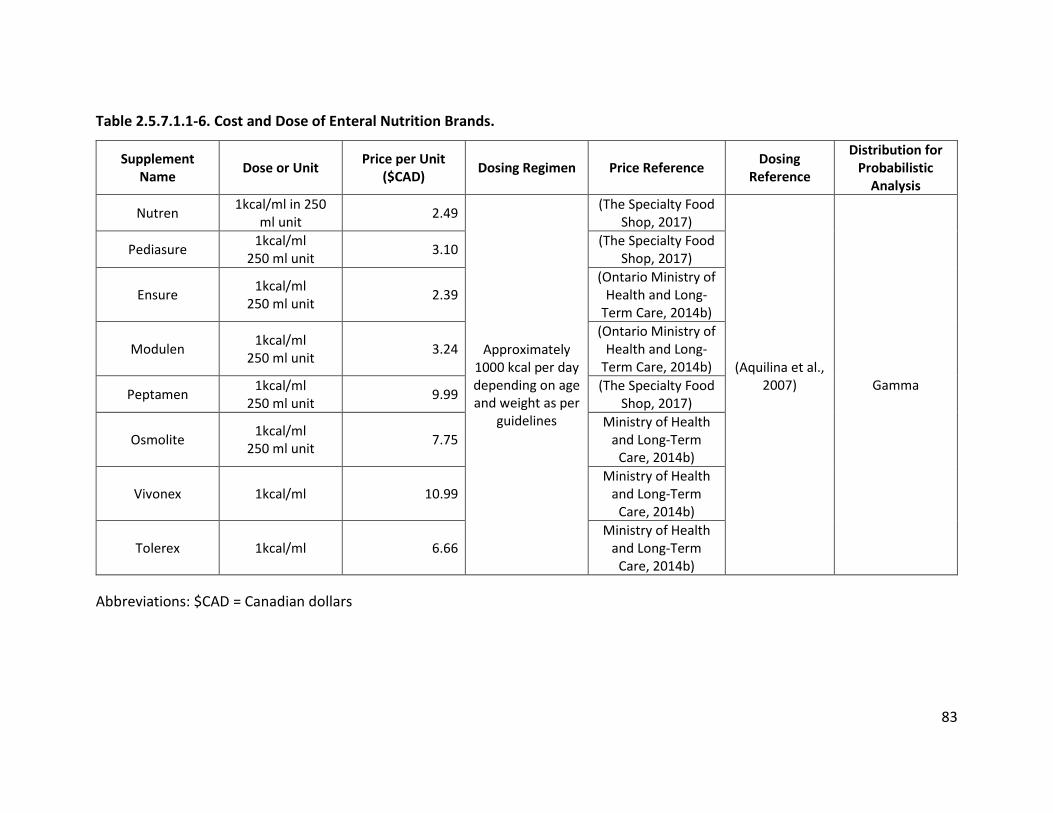
83
Table 2.5.7.1.1-6. Cost and Dose of Enteral Nutrition Brands.
Supplement Name Dose or Unit Price per Unit
($CAD) Dosing Regimen Price Reference Dosing Reference
Distribution for Probabilistic
Analysis
Nutren 1kcal/ml in 250 ml unit 2.49
Approximately 1000 kcal per day depending on age and weight as per
guidelines
(The Specialty Food Shop, 2017)
(Aquilina et al., 2007)
Gamma
Pediasure 1kcal/ml 250 ml unit 3.10 (The Specialty Food
Shop, 2017)
Ensure 1kcal/ml 250 ml unit 2.39
(Ontario Ministry of Health and Long-
Term Care, 2014b)
Modulen 1kcal/ml 250 ml unit 3.24
(Ontario Ministry of Health and Long-
Term Care, 2014b)
Peptamen 1kcal/ml 250 ml unit 9.99 (The Specialty Food
Shop, 2017)
Osmolite 1kcal/ml 250 ml unit 7.75
Ministry of Health and Long-Term
Care, 2014b)
Vivonex 1kcal/ml 10.99 Ministry of Health
and Long-Term Care, 2014b)
Tolerex 1kcal/ml 6.66 Ministry of Health
and Long-Term Care, 2014b)
Abbreviations: $CAD = Canadian dollars
84
2.5.7.1.2 Cost of Medical Procedures
It was assumed that all CD subjects, regardless of comparator group or disease activity,
underwent one tuberculosis (TB) test, one chest x-ray, one colonoscopy and one gastroscopy
upon entry into the model. The cost estimates of these procedures are listed in Table 2.5.7.1.2-
1. Since it was assumed that all CD subjects entered the model with active disease, it was
assumed that they all received an initial gastroenterologist consultation and a subsequent
assessment within a month. If they continued with active disease then they would see the
gastroenterologist at three months, six months and twelve months. Subjects in remission would
see the gastroenterologist every six months. Physician fees were considered fixed based on the
Ontario schedule of benefits.
Hospital inpatient procedures including surgeries were costed using the Ontario Case Costing
Initiative based on the K50.0, K50.1, K50.8, K50.9 ICD-10 codes for Crohn’s disease (Ontario
Case Costing Initiative, 2017; World Health Organization, 2010). Surgical resection was the type
of surgery listed in the RISK-PROKIIDS study and its associated costs were estimated based on
the appropriate procedure code listed in Table 2.5.7.1.2-1. The rates of use for surgery and
hospitalization were based on the rates of use in the RISK-PROKIIDS study. The all ages cost was
listed since data for pediatric patients only were unavailable as they were too few to report.
Opportunistic infections, lymphoma and antibody development in response to anti-TNF-α
treatment were considered possible adverse events of special interest and their costs were
associated with that health state as they are of concern for immunocompromised patients or
have been a concern for those taking immunomodulators or anti-TNF-α treatments. Sepsis was
considered a possible surgical complication. The probabilities and rates of opportunistic
infections, lymphoma, antibody development to anti-TNF-α, and sepsis were based on scientific
literature rates (see references listed in Table 2.5.7.1.2-2). The treatment for an antibody
reaction to infliximab was assumed to be a change in treatment to adalimumab. The costs of
treating lymphoma, opportunistic infections and sepsis were based on estimates from the
85
Ontario Case Costing Initiative using the appropriate case mix groups (CMG) and procedure
codes listed in Table 2.5.7.1.2-2.
The cost of infusion clinics was included in the healthcare public payer perspective. This
included nursing time for the infusion (170 minutes per infusion), the infusion supply cost and
physician services for the attending physician. Clinic costs are listed in Table 2.5.7.1.2-3, and
were assigned a gamma distribution for the probability sensitivity analysis. The mean nursing
wage used in the labour cost was $48.06 + 16. 39 per hour in 2017 dollars which had been
converted from the 2013 nursing wage using the consumer price index for health care services
(Statistics Canada, 2014) (Statistics Canada, 2015). Non-labour infusion supply costs listed in
U.S. dollars were converted to current Canadian dollars using a 1.3 currency conversion rate
(Schmier et al., 2017). The cost of one infusion is approximately $150 which is approximately
15% of the cost of one vial of infliximab.
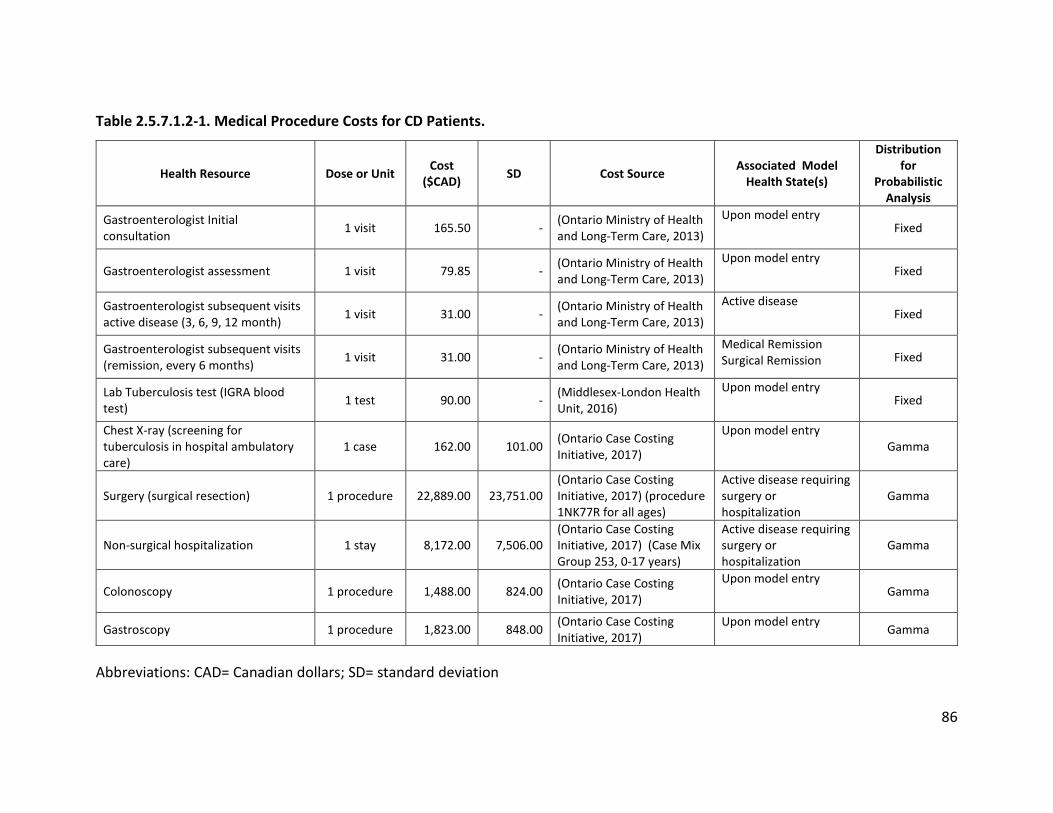
86
Table 2.5.7.1.2-1. Medical Procedure Costs for CD Patients.
Health Resource Dose or Unit Cost ($CAD) SD Cost Source Associated Model
Health State(s)
Distribution for
Probabilistic Analysis
Gastroenterologist Initial consultation 1 visit 165.50 - (Ontario Ministry of Health
and Long-Term Care, 2013)
Upon model entry Fixed
Gastroenterologist assessment 1 visit 79.85 - (Ontario Ministry of Health and Long-Term Care, 2013)
Upon model entry Fixed
Gastroenterologist subsequent visits active disease (3, 6, 9, 12 month) 1 visit 31.00 - (Ontario Ministry of Health
and Long-Term Care, 2013)
Active disease Fixed
Gastroenterologist subsequent visits (remission, every 6 months) 1 visit 31.00 - (Ontario Ministry of Health
and Long-Term Care, 2013)
Medical Remission Surgical Remission Fixed
Lab Tuberculosis test (IGRA blood test) 1 test 90.00 - (Middlesex-London Health
Unit, 2016)
Upon model entry Fixed
Chest X-ray (screening for tuberculosis in hospital ambulatory care)
1 case 162.00 101.00 (Ontario Case Costing Initiative, 2017)
Upon model entry Gamma
Surgery (surgical resection) 1 procedure 22,889.00 23,751.00 (Ontario Case Costing Initiative, 2017) (procedure 1NK77R for all ages)
Active disease requiring surgery or hospitalization
Gamma
Non-surgical hospitalization 1 stay 8,172.00 7,506.00 (Ontario Case Costing Initiative, 2017) (Case Mix Group 253, 0-17 years)
Active disease requiring surgery or hospitalization
Gamma
Colonoscopy 1 procedure 1,488.00 824.00 (Ontario Case Costing Initiative, 2017)
Upon model entry Gamma
Gastroscopy 1 procedure 1,823.00 848.00 (Ontario Case Costing Initiative, 2017)
Upon model entry Gamma
Abbreviations: CAD= Canadian dollars; SD= standard deviation
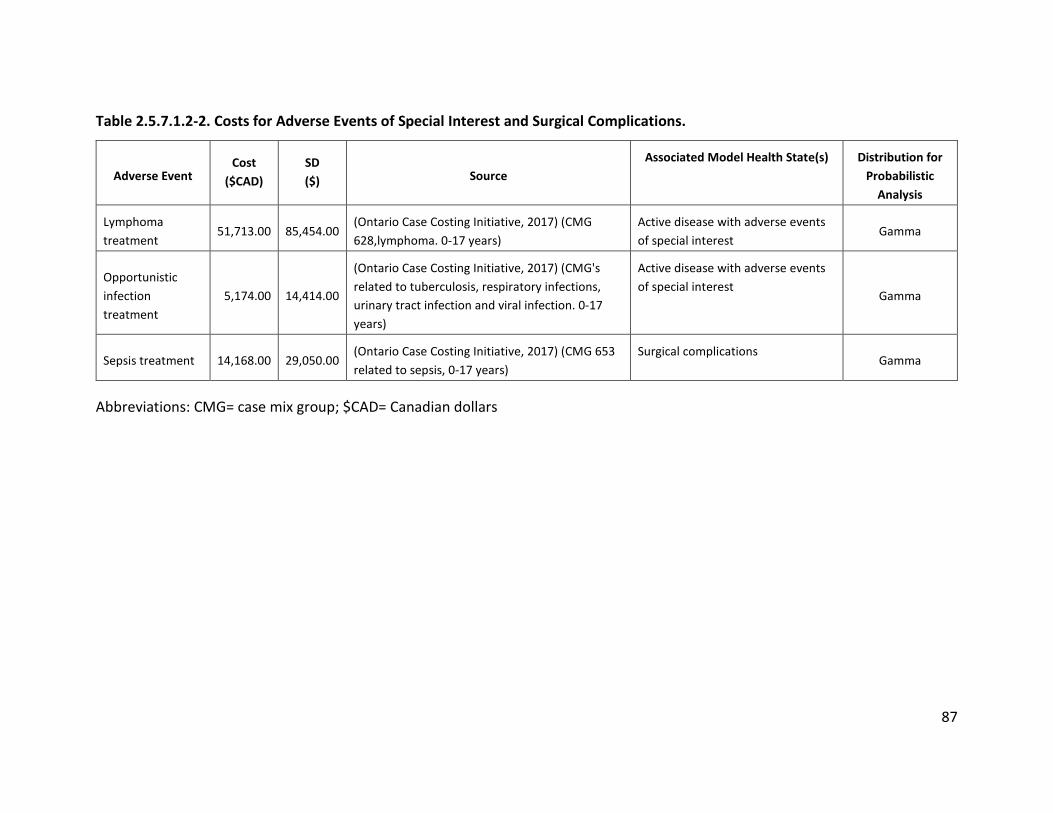
87
Table 2.5.7.1.2-2. Costs for Adverse Events of Special Interest and Surgical Complications.
Adverse Event Cost
($CAD) SD ($) Source
Associated Model Health State(s) Distribution for Probabilistic
Analysis
Lymphoma treatment
51,713.00 85,454.00 (Ontario Case Costing Initiative, 2017) (CMG 628,lymphoma. 0-17 years)
Active disease with adverse events of special interest
Gamma
Opportunistic infection treatment
5,174.00 14,414.00
(Ontario Case Costing Initiative, 2017) (CMG's related to tuberculosis, respiratory infections, urinary tract infection and viral infection. 0-17 years)
Active disease with adverse events of special interest
Gamma
Sepsis treatment 14,168.00 29,050.00 (Ontario Case Costing Initiative, 2017) (CMG 653 related to sepsis, 0-17 years)
Surgical complications Gamma
Abbreviations: CMG= case mix group; $CAD= Canadian dollars
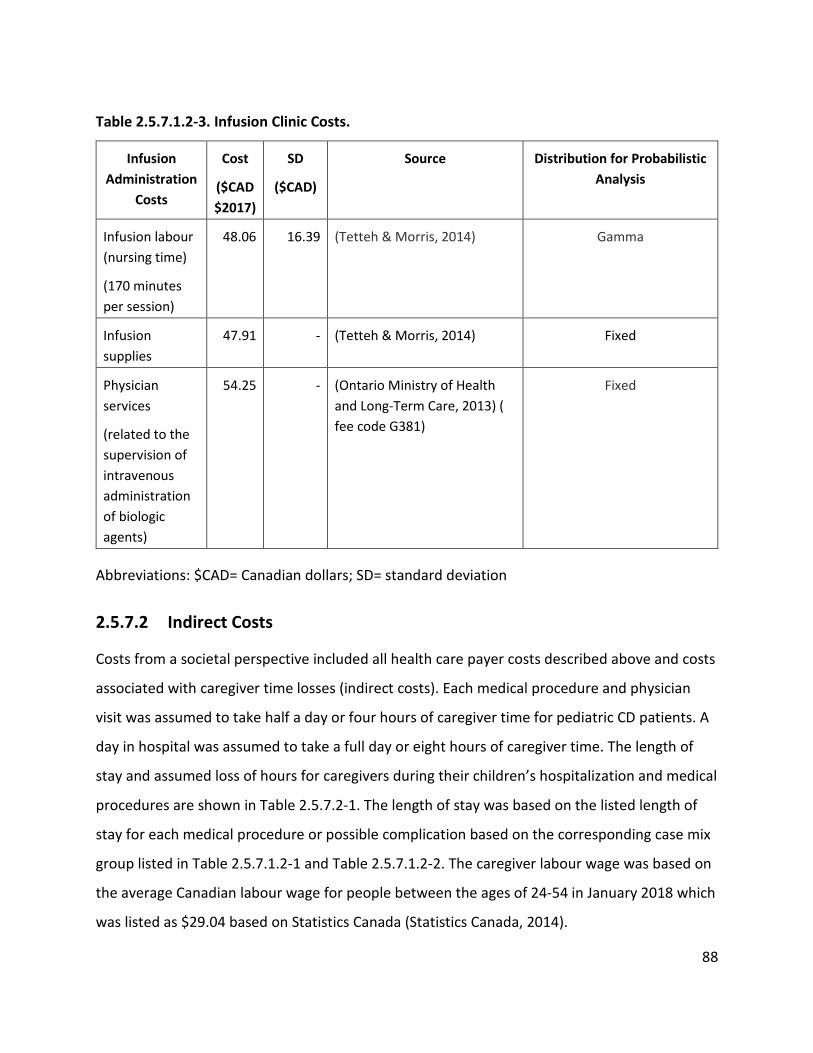
88
Table 2.5.7.1.2-3. Infusion Clinic Costs.
Infusion Administration
Costs
Cost
($CAD $2017)
SD
($CAD)
Source Distribution for Probabilistic Analysis
Infusion labour (nursing time)
(170 minutes per session)
48.06 16.39 (Tetteh & Morris, 2014) Gamma
Infusion supplies
47.91 - (Tetteh & Morris, 2014) Fixed
Physician services
(related to the supervision of intravenous administration of biologic agents)
54.25 - (Ontario Ministry of Health and Long-Term Care, 2013) ( fee code G381)
Fixed
Abbreviations: $CAD= Canadian dollars; SD= standard deviation
2.5.7.2 Indirect Costs
Costs from a societal perspective included all health care payer costs described above and costs
associated with caregiver time losses (indirect costs). Each medical procedure and physician
visit was assumed to take half a day or four hours of caregiver time for pediatric CD patients. A
day in hospital was assumed to take a full day or eight hours of caregiver time. The length of
stay and assumed loss of hours for caregivers during their children’s hospitalization and medical
procedures are shown in Table 2.5.7.2-1. The length of stay was based on the listed length of
stay for each medical procedure or possible complication based on the corresponding case mix
group listed in Table 2.5.7.1.2-1 and Table 2.5.7.1.2-2. The caregiver labour wage was based on
the average Canadian labour wage for people between the ages of 24-54 in January 2018 which
was listed as $29.04 based on Statistics Canada (Statistics Canada, 2014).
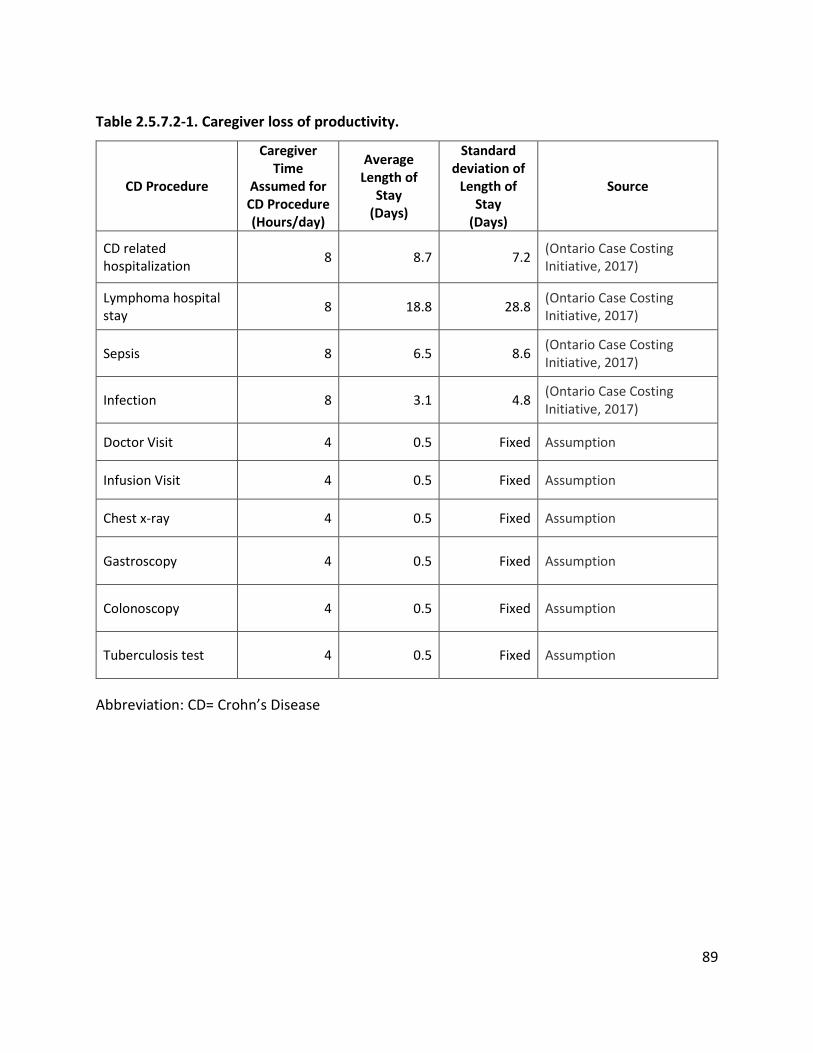
89
Table 2.5.7.2-1. Caregiver loss of productivity.
CD Procedure
Caregiver Time
Assumed for CD Procedure (Hours/day)
Average Length of
Stay (Days)
Standard deviation of
Length of Stay
(Days)
Source
CD related hospitalization 8 8.7 7.2 (Ontario Case Costing
Initiative, 2017)
Lymphoma hospital stay 8 18.8 28.8 (Ontario Case Costing
Initiative, 2017)
Sepsis 8 6.5 8.6 (Ontario Case Costing Initiative, 2017)
Infection 8 3.1 4.8 (Ontario Case Costing Initiative, 2017)
Doctor Visit 4 0.5 Fixed Assumption
Infusion Visit 4 0.5 Fixed Assumption
Chest x-ray 4 0.5 Fixed Assumption
Gastroscopy 4 0.5 Fixed Assumption
Colonoscopy 4 0.5 Fixed Assumption
Tuberculosis test 4 0.5 Fixed Assumption
Abbreviation: CD= Crohn’s Disease
90
2.5.7.3 Cost Valuation
A vector of costs per child over the three-year study time horizon was determined by
multiplying the modeled volume of health care resource use for each item by a corresponding
current Canadian dollar price for items that had a fixed price such as medical visits and medical
procedures. For health care resources that were health state dependent, such as treatments for
adverse events of special interest, costs were sampled per individual from a distribution and
added to the costs per child over the three-year period. Individuals entered the model with a
sampled age and sex which determined their weight during the course of three year study
period. Medication use was determined per week per child based on the probabilities of being
on a particular combination of medications in a particular week over the three-year period and
the age-related weight of the child. Corresponding medication costs per week were sampled
from a distribution where a weighted average price per drug class was calculated or based on a
fixed price for anti-TNF-α treatments. The cost per child for medication use per week based on
their sampled treatment regimen was summed for the three-year period. All parent/caregiver
costs were assigned to the child as the unit of analysis. The mean cost per child was calculated
for each group of 10,000 microsimulations in the two-dimensional microsimulation. Costs were
assigned a gamma distribution unless they were fixed (Drummond et al., 2005). Distributions
for all costs are listed in the tables in previous sections describing each cost. Costs were
assigned to major categories (treatments, and direct health care costs). For the health care
public payer perspective, all costs were allocated to the health care payer except for caregiver
costs. For the societal perspective, health care payer costs were added to caregiver costs. All
costs were adjusted to 2017 Canadian dollars using the Canadian Consumer Price Index for
health and personal care (Statistics Canada, 2015).
2.5.8 Model Assumptions
To clarify the experience of subjects within the cost-effectiveness model the following
assumptions were made regarding the patient population. Treatment paradigms are constantly
evolving for CD patients and treatment choices are often up to the discretion of the physician
and the patient. The treatment pathways outlined in this model are representative of common
91
clinical practice for pediatric CD patients either as recommended by clinical practice guidelines,
and as observed by the RISK-PROKIIDS study (F. Ruemmele et al., 2014; Rufo et al., 2012). The
list of assumptions is as follows:
• It was assumed that all patients were in complete compliance with treatment regimens.
• Due to a lack of indisputable evidence, it was assumed that CD or taking the prescribed
medications did not increase the risk of death in the pediatric patients.
• Within medication classes, costs for steroids, immunomodulators, antibiotics, enteral
nutrition and 5-ASA’s were determined as a weighted average based on RISK-PROKIIDS
use of the drugs. It was assumed that the RISK-PROKIIDS study was representative of the
most common drugs prescribed to pediatric CD patients.
• It was assumed that colonic resection was the most common form of surgery and that
the probability of surgery did not increase within the three-year time horizon regardless
of having a previous surgery as observed in the RISK-PROKIIDS data set.
• It was assumed that immediately following surgery, subjects went into surgical
remission unless they suffered surgical complications and remained in surgical remission
unless they relapsed into active disease.
• It was assumed that post-surgical complications lasted no more than four weeks.
• It was assumed that treating physicians were gastroenterologists for the purposes of
billing fees in Ontario.
• It was assumed that biosimilar anti-TNFα treatments were not used as a substitute for
infliximab or adalimumab. The cost difference with the use of biosimilars was explored
in scenario analyses.
• Since there were only three Canadian sites among the twenty-eight sites in the RISK-
PROKIIDS North American study and differences in practice patterns could not be
92
assessed among the RISK-PROKIIDS subjects, it was assumed that treatment practices
between the United States and Canada did not affect the chance of receiving early anti-
TNFα treatments.
• Trough level testing of drug levels and thiopurine methyltransferase (TPMT) testing
were not included in the model since they are not yet considered standard practice or
entrenched in clinical practice guidelines for pediatric CD treatment.
• Administration costs involved in the filling in paperwork and managing subjects on anti-
TNF-alpha treatments were not considered.
• Various private health insurer costs were not included due to the variation in individual
plans.
• It was assumed that there were no correlations affecting clinical outcomes.
2.5.9 Model Validation and Calibration
The model was internally calibrated using internal outcomes from the RISK-PROKIIDS study due
to a lack of external studies available for calibration. The mean number of steroid-free medical
remission weeks in three years, the mean number of medical remissions weeks in three years
(steroid-free or on steroids), and the number of surgeries in three years from the RISK-
PROKIIDS study were used as calibration targets for the cost-effectiveness model. The model
outputs were compared to the actual values observed in the RISK-PROKIIDS study to calibrate
the model. The model generated similar results as the RISK-PROKIIDS study and did not require
adjustments (see Results section for details). As suggested by ISPOR guidelines, a goodness of
fit test comparing the number of surgeries in the cost-effectiveness model and the RISK-
PROKIIDS population was performed (Eddy et al., 2012). The number of subjects in medical
remission at one year from diagnosis served as an external parameter for model validation. The
number of remissions in the cost-effectiveness model were validated against another small
pediatric observational study which examined the use of infliximab in pediatric CD (Kim, Lee,
Lee, Kim, & Choe, 2011). The number of remissions at one year was also compared to an earlier
93
published study of a portion of the RISK-PROKIIDS subjects examining early intervention with
anti-TNFα treatment (Walters et al., 2014). The percent of pediatric Crohn’s disease surgeries
among CD patients in Ontario in three years (14.7%) which was based on an epidemiological
study also served as an external validation target for the model (Eric I Benchimol et al., 2014).
Due the scarcity of studies examining early anti-TNFα treatment in naïve pediatric CD subjects,
the model could not be validated more extensively. Model performance comparing the model
results to external studies were reported in the Results section.
2.5.10 Incremental Cost-effectiveness Analysis
The cost-effectiveness of early intervention with anti-TNF-α versus standard care was examined
by determining the incremental cost-effectiveness ratio (ICER). The ICER was calculated to be
the difference in cost (∆C) of the two treatment strategies divided by the difference in outcome
(∆E) as measured by weeks in steroid-free medical remission between the two strategies. In the
reference case, the cost and outcomes for each strategy were averaged for 50 samples of
10,000 individual microsimulations. Multiple sampling from each specified distribution was
performed for a probabilistic two-dimensional (2-D) microsimulation for the reference case. A
95% confidence interval for the difference in cost and the difference in steroid-free remission
weeks was determined. The ICER was determined using the model inputs from the “Across”
data set for the reference case. The results of the 2-D microsimulation were presented as
incremental cost effectiveness scatter plots. Cost-effectiveness acceptability curves were also
presented.
2.5.11 Uncertainty Analysis
Uncertainty analysis was conducted to assess the robustness in the cost-effectiveness model.
Parameter uncertainty was defined by uncertainty introduced in model parameter inputs.
Parameter uncertainty was assessed through probabilistic analysis. Structural uncertainty
referred to uncertainty introduced in constructing the model and model structure. Structural
uncertainty in the model was assessed via scenario analysis. Uncertainty in the estimated costs,
outcomes and incremental cost-effectiveness ratio for the early anti-TNF-α intervention and
94
standard care (step-up) treatment strategies was demonstrated with the cost-effectiveness
acceptability curves. Details about the types of uncertainty analyses conducted are described
below.
2.5.11.1 Structural Uncertainty
Structural uncertainty was introduced in the model in two ways: through uncertainty in
estimating the discount rate, and through the different approaches of compiling the imputed
RISK-PROKIIDS datasets to determine health state transition probabilities. In the reference case,
the RISK-PROKIIDS propensity matched dataset was compiled using the “Across” method which
used an averaged propensity scores from ten imputed datasets. This method resulted in certain
health state transition probabilities used as inputs in the cost-effectiveness model. However if
the “Within” approach had been used to determined matched RISK-PROKIIDS datasets,
different transition probabilities may have resulted from the ten imputed datasets thus
introducing structural uncertainty in the model. To examine the structural uncertainty in the
ICER as a result of using different approaches of dataset assembly, the incremental cost of early
anti-TNF-α treatment per additional week in medical remission week compared to standard
care was determined. The results, using transition probabilities obtained with the “Across”
method of dataset assembly and subsequent propensity score matching, were compared to the
results obtained using transition probabilities from the ten “Within” imputed RISK-PROKIIDS
datasets. The probability of transitioning from active disease to medical remission, the
probability of transitioning from active disease to active disease requiring surgery or
hospitalization, the probability of medical remission to continued medical remission, and the
probability of transitioning from surgical remission to active disease were determined
depending on the probabilities calculated from each of the ten imputed data sets (“Within”
data sets) and the aggregate “Across” data set. Weeks in medical remission, irrespective of
steroid use were the outcome determined for this uncertainty analysis to simplify the analysis.
Eleven ICERs determined and compared, one using transition probabilities for each of the ten
“Within” matched datasets and one for the “Across” matched RISK-PROKIIDS dataset.
95
Uncertainty in the discount rate was assessed in a one-way sensitivity analysis using discount
rates of 0% and 3% (as recommended by CADTH guidelines) in the two-dimensional
probabilistic analysis for the three year time horizon (Canadian Agency for Drugs and
Technologies in Health (CADTH), 2017). The incremental cost of early anti-TNF-α treatment per
additional steroid-free remission week compared to the standard care intervention using
discount rates of 0% and 3% from a health care public perspective and a societal perspective
were determined.
2.5.11.2 Parameter Uncertainty
Parameter uncertainty was introduced through the variation in the characteristics and
treatment patterns of the patient population. While certain model parameters were fixed such
as prices for drugs and medical services, individual patient characteristics, disease activity and
treatment patterns resulted in a large variation in costs and resource use. For example, drug
costs within a drug class were calculated based on patient weights, the weighted average of
drug prices within that drug class and the proportion of patients on that drug class at a
particular time in each comparator group. Parameter uncertainty was ascertained by
conducting a probabilistic analysis via a two-dimensional Monte Carlo microsimulation where
all variable distributions were varied simultaneously in the model. The probabilistic analysis was
run with 50 samples of 10,000 trials in the reference case and in the scenario analyses. Fifty
samples were run as this were the minimum number of samples that demonstrated a
consistent ICER. Ten thousand individual-level (one dimensional) Monte Carlo microsimulations
were conducted to exceed the minimum 5,000 simulations recommended by CADTH guidelines
and be representative of the Ontario pediatric population (Benchimol et al., 2017; Canadian
Agency for Drugs and Technologies in Health (CADTH), 2017). As this was a cost-effectiveness
analysis, and not a cost-utility analysis, it was difficult to estimate a willingness-to-pay threshold
for incremental weeks in steroid-free remission since this is unknown. Hence, the effect of the
degree of parameter uncertainty on the ICER could not be ascertained.
Cost-effectiveness acceptability curves (CEACs) illustrated uncertainty in the estimated costs,
outcomes and incremental cost-effectiveness ratio for the early anti-TNF-α intervention and
96
standard care (step-up) treatment strategies from healthcare public payer and societal
perspectives.
2.5.11.3 Scenario Analysis
The RISK-PROKIIDS study population was the main source for inputs related to treatment
patterns in pediatric CD. However, enrollment in the RISK-PROKIIDS study began ten years ago
and the dataset may not necessarily reflect the most recent treatment costs and patterns. Since
infliximab (Remicade®) was the primary anti-TNF-α treatment used in the RISK-PROKIIDS study,
but other versions of anti-TNF-α treatments, such as biosimilars, with different prices have
since entered the market, it was hypothesized that the ICER could be sensitive to the price of
infliximab and the rate of switching to infliximab in the standard care group. Therefore,
scenario analyses were conducted to examine the sensitivity on the ICER to the price of one vial
of infliximab and the rate of switching to anti-TNF-α. The price of one vial of infliximab was
fixed at $987.56 in the reference case probabilistic analysis. However, costing of infliximab
treatment was complex since the number of vials was based on weight (5mg/kg), the cost of
infusion administration was added, and the cost of different dosing regimens depended on
whether the patient was in the induction phase (“active”) or in the maintenance phase of
treatment. A one-way sensitivity analysis was conducted by varying the price of infliximab by a
multiplier as this was the simplest way of changing the cost of the anti-TNF-α. The effect of
varying the price of one vial by 150%, 87.5%, 75%, 62.5%, 50%, 37.5%, and 25% of the reference
case ($987.56) was tested. The range of values were chosen to illustrate the degree of
sensitivity to the price of the anti-TNF-α and include a price which may be reflective of a
biosimilar such as Inflectra® which is approximately 56% of the cost of Remicade® (brand name
infliximab). The one-way sensitivity was restricted to a one-dimensional Monte Carlo analysis
with 10,000 trials in the Tree Age 2018 software (version 1.2).
It was also hypothesized that the rate of switching to anti-TNF-α after three months of
diagnosis for the standard care group could be an uncertain parameter that may affect the
ICER. Therefore, a one-way sensitivity analysis was conducted by varying the probability of
switching to a biologic following the first three months of treatment for the standard care
97
comparator group. Since the RISK-PROKIIDS study represented a unique patient population, and
may not reflect current treatment practices and rates of anti-TNF-α uptake, a one-way
sensitivity analysis was conducted by varying the rate of escalation to anti-TNF-α treatment
after three months post-diagnosis via a multiplier. The probability of switching to an anti TNF-α
treatment was varied to quadruple, three-quarters, half, one-quarter the probability of
switching to the anti TNF-α treatment in the reference case over the three years. A sensitivity
analysis with the probability of not switching to an anti TNF-α in the standard care group was
also conducted.
To assess the sensitivity of the ICER to the price of immunomodulator drug treatment, and
since drug prices and use may vary across provinces, a one-way sensitivity analysis was
conducted comparing the cost of immunomodulators. The cost of immunomodulators was
based on the average cost of the drug class per week, and this average cost was multiplied by a
factor of 2 or a factor of 0.5 in the sensitivity analysis. All scenario analyses were conducted
from the healthcare public payer perspective. A tornado diagram was constructed showing the
results of the three one-way sensitivity analyses.
2.6 Data Management
The study has undergone scientific peer review with reviewers from Child Health Evaluative
Sciences, at the Hospital for Sick Children. A material transfer agreement was executed
between the Hospital for Sick Children and the RISK-PROKIIDS group. The anonymized RISK-
PROKIIDS dataset (containing no personal identifying information) maintained by the Crohn’s
and Colitis Foundation of America Research Network was transferred through secure data
transfer from Dr. T. Walters to Ms. N. Bashir. Data are housed securely on the Sick Kids shared
hospital server with access limited to the research team. Paper documents were stored in
locked cabinets.
The RISK-PROKIIDS data set was transferred in MS Access 2010 and MS Excel 2010 format. The
RISK-PROKIIDS data tables were queried within MS Access to create tables to export into MS
Excel 2010 for further analysis. MS Excel was used to format and arrange tables for export into
98
R software v. 3.4.0 for statistical analysis, imputation of missing data, and propensity score
analysis. Adjusted data sets were imported into MS Excel 2010 for determining transition
probabilities. Probabilities that were obtained from the scientific literature were adjusted to
accommodate a one week cycle length in MS Excel. Probabilities were manually entered into
Tree Age Software v. 2018 for cost-effectiveness analysis.
2.7 Ethics
All study practices were conducted in accordance with the Tri-Council Policy Statement 2.0 on
Research Ethics. The study protocol was reviewed approved by Sick Kids Ethics Review Board
(Dec. 2014, REB file #1000047757) and subsequently, the University of Toronto Ethics Review
Board (Feb. 2015). Ethics approval has been renewed and maintained. Research Ethics training
has been completed by N. Bashir. The dataset was anonymized and de-linked prior to transfer
and no personal identifiers were included. Only data where parents of children participating
have provided informed consent for participation of their children in the RISK-PROKIIDS study
and in RISK ancillary studies were transferred. A waiver for consent was approved by the Sick
Kids Ethics Review Board for the economic evaluation using de-identified patient information.
All personal identifiers were removed prior to data transfer and participants were identified
only by a study ID number. No patients were or will be identified in any reports or publications.
99
Results
3.1 Overview of Results
The following chapter outlines the results from the methodological choices taken in this project
and the cost-effectiveness analysis of early intervention with anti-TNF-α treatment in
moderate-to-severe pediatric Crohn’s disease (CD) compared to standard care. “Early
intervention” was defined as treating with anti-TNF-α medications (infliximab or adalimumab)
within the first three months of diagnosis with or without the use of other concomitant
treatments. “Standard care” was defined as a step-up approach where traditional treatments,
such as corticosteroids and immunomodulators were used following diagnosis with the option
of escalating to anti-TNF-α treatment after three months from diagnosis. To execute the cost-
effectiveness analysis, inputs such as patient characteristics and health state transition
probabilities were derived from the retrospectively analyzed, observational cohort RISK-
PROKIIDS study of North American newly-diagnosed children with CD.
The following chapter describes:
1) the characteristics of the RISK-PROKIIDS unadjusted representative patient population;
2) the identification of missing data in this population and the results of imputing missing
data in this population;
3) the two possible approaches to pool the imputed data as a reference for providing
inputs into the cost-effectiveness model;
4) a comparison of different methods of propensity score analysis in creating a matched
data set of comparator groups and choosing the most appropriate method to create the
matched data set;
5) the cost-effectiveness analysis comparing early anti-TNF-α treatment to standard care in
pediatric CD;
100
6) the uncertainty analysis related to the cost-effectiveness analysis; and
7) the impact on the cost-effectiveness analysis of using two different approaches to
pooling imputed data when assembling the representative patient population which
informs the cost-effectiveness inputs.
3.2 Characteristics of the Unadjusted Patient Population
The RISK-PROKIIDS study, a North American multi-site, observational study, analyzed
retrospectively, of children with inflammatory bowel disease (ulcerative colitis and Crohn’s
disease) provided a subset of newly diagnosed pediatric patients with confirmed moderate-to-
severe CD with at least a three-year follow-up. Included study subjects had determinable
health state information at 6, 12, 18, 24, and 30 or 36 months from the date of diagnosis. Five
hundred and seventy-three (573) CD patients met the inclusion criteria and were isolated from
the RISK-PROKIIDS study. The treatment of each patient was assessed and the 573 subjects
were divided into two comparator groups—the early anti-TNF-α intervention group and the
standard care (step-up) group. There were 131 patients that received early anti-TNF-α
intervention (herein also referred to as the “treated” group), and 442 patients that were
assigned to the standard care group (herein also referred to as the “control” group). Among
573 eligible CD subjects isolated from the RISK-PROKIIDS study, 64 subjects had missing lab
values for albumin at diagnosis (baseline), a variable needed for the propensity matching. Seven
of 131 (5.3%) of subjects with missing baseline Albumin values received early anti-TNF-α
intervention (treated group) and 57/442 (12.9%) received standard care (control group).
Patient characteristics at diagnosis of each comparator group in the unadjusted, RISK-PROKIIDS
extracted population are shown in Table 3.2-1. In the unadjusted population, the mean at
diagnosis in the standard care group was 11.62 years of age and in the early intervention group
the mean age was 12.35 years of age, possibly indicating the preference to use biologic
treatment in older patients. In the standard care group, 19% of patients were from Canadian
sites and in the early anti-TNF-α group, 9.2% of patients were from Canadian sites. Other
patient characteristics such as the proportion of males to females, albumin lab values, height Z-
101
scores, and family history of IBD were similar between the standard care and early anti-TNF-α
groups were similar. The ethnic characteristics of each comparator group in the unadjusted
RISK-PROKIIDS population are shown in Table 3.2-2. Over 70% of patients in both comparator
arms were Caucasian. In the unadjusted population, fewer than 10% of patients in both
comparator groups were of Jewish origin, African origin or Hispanic origin. The disease
characteristics at diagnosis of each comparator group in the unadjusted RISK-PROKIIDS
population are shown in Table 3.2-3. In the early anti-TNF-α group, 38.2% of patients had
perianal disease, 60.3% of patients were assessed as having moderate disease, 21.4% of
patients were assessed as having severe disease and 55.7% of patients had disease in the
ileocolon. Comparatively, in the standard care group, 25.8% of patients had perianal disease,
43.4% of patients were assessed as having moderate disease, 13.8% of patients were assessed
as having severe disease, and 58.4% of patients had disease in the ileocolon. In the early anti-
TNF-α group, 55% of patients were classified as having active disease but were not on steroids
just following diagnosis while 39.6% in the standard care group were classified as having active
disease but were steroid-free after diagnosis. The health states and the steroid status (whether
or not the patient was taking steroids) at 6, 12, 18, 24, and 36 months post diagnosis were
determined for each comparator group in the unadjusted RISK-PROKIIDS population and are
shown in Table 3.2-4. In addition, the number of steroid-free remission semesters (6-month
periods), the number of consecutive steroid-free remission semesters, and the number of days
in hospital and the number of hospitalized patients in 36 months post-diagnosis were
determined for each comparator group in the unadjusted RISK-PROKIIDS population and are
shown in Table 3.2-4. In the unadjusted population, in the early anti-TNF-α group, 54.2% of
patients were in steroid-free remission at 6 months, 61.1% were in steroid-free remission at 1
year, 65.6% were in steroid-free remission at 18 months, 74.8% were in steroid-free remission
at two years and 71.0% were in steroid-free remission at three years. In the unadjusted
population, in the standard care group, 40.0% of patients were in steroid-free remission at 6
months, 56.3% were in steroid-free remission at 1 year, 57.5% were in steroid-free remission at
18 months, 65.6% were in steroid-free remission at two years and 74.9% were in steroid-free
remission at three years. Those in the early anti-TNF-α group, had a mean number of 3.95 days
102
in hospital over three years while the standard care group had a mean number of 3.35 days in
hospital over three years.
Some variables such as age and disease activity at diagnosis did show a statistically significant
difference between comparator groups in the unadjusted population. This suggested that the
comparator groups are not well matched based on their characteristics, and there may be a
possibility of selection bias in treatment allocation given the observational nature of the cohort
study design. To alleviate the potential for selection bias in treatment selection and to compare
groups with similar characteristics similar to a randomized clinical trial, propensity score
analysis was conducted to select comparable groups (described in a later section).
Albumin lab values, age, and height Z-score were the only continuous variables out of all the
variables that were assumed to affect treatment assignment. Being continuous variables, their
distribution pattern could be determined. The distribution of the continuous variables of
“albumin levels”, “age” and “height Z-score” at diagnosis for the 573 patients from the RISK-
PROKIIDS study are shown in the density plots in Figures 3.2-1, 3.2-2 and 3.2-3 respectively. The
plots suggest a normal distribution for these variables.
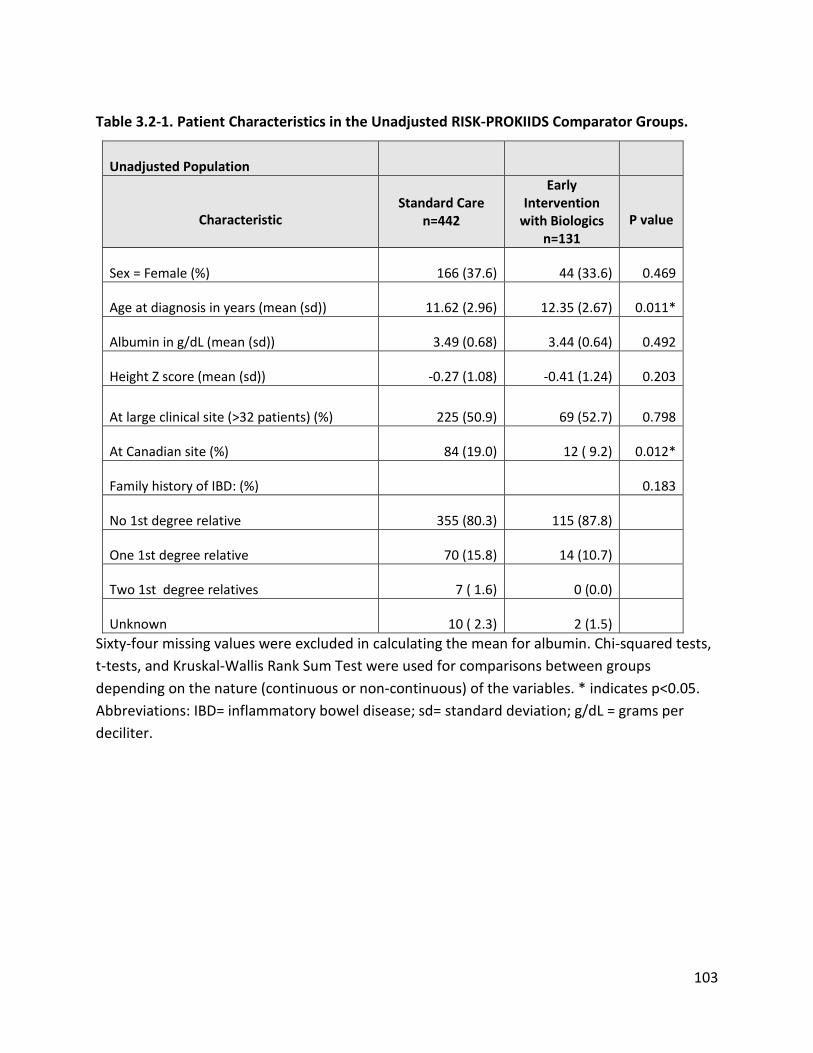
103
Table 3.2-1. Patient Characteristics in the Unadjusted RISK-PROKIIDS Comparator Groups.
Unadjusted Population
Characteristic Standard Care
n=442
Early Intervention
with Biologics n=131
P value
Sex = Female (%) 166 (37.6) 44 (33.6) 0.469
Age at diagnosis in years (mean (sd)) 11.62 (2.96) 12.35 (2.67) 0.011*
Albumin in g/dL (mean (sd)) 3.49 (0.68) 3.44 (0.64) 0.492
Height Z score (mean (sd)) -0.27 (1.08) -0.41 (1.24) 0.203
At large clinical site (>32 patients) (%) 225 (50.9) 69 (52.7) 0.798
At Canadian site (%) 84 (19.0) 12 ( 9.2) 0.012*
Family history of IBD: (%) 0.183
No 1st degree relative 355 (80.3) 115 (87.8)
One 1st degree relative 70 (15.8) 14 (10.7)
Two 1st degree relatives 7 ( 1.6) 0 (0.0)
Unknown 10 ( 2.3) 2 (1.5) Sixty-four missing values were excluded in calculating the mean for albumin. Chi-squared tests, t-tests, and Kruskal-Wallis Rank Sum Test were used for comparisons between groups depending on the nature (continuous or non-continuous) of the variables. * indicates p<0.05. Abbreviations: IBD= inflammatory bowel disease; sd= standard deviation; g/dL = grams per deciliter.
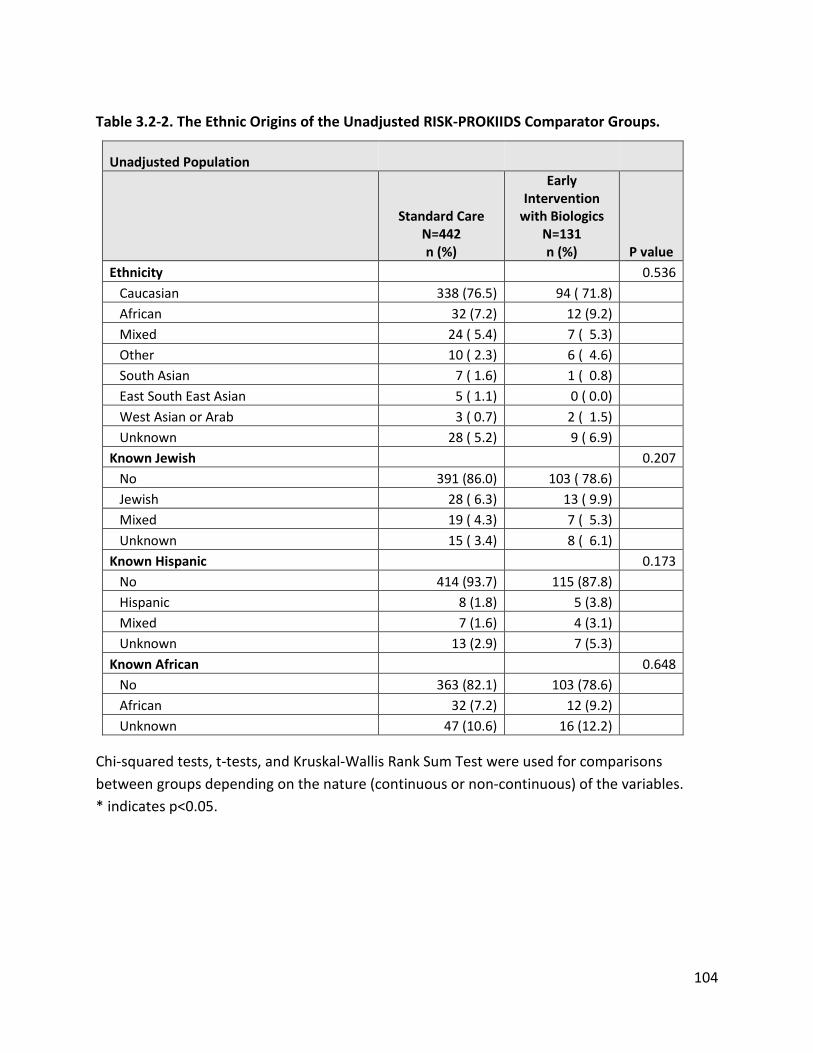
104
Table 3.2-2. The Ethnic Origins of the Unadjusted RISK-PROKIIDS Comparator Groups.
Unadjusted Population
Standard Care N=442 n (%)
Early Intervention
with Biologics N=131 n (%) P value
Ethnicity 0.536 Caucasian 338 (76.5) 94 ( 71.8) African 32 (7.2) 12 (9.2) Mixed 24 ( 5.4) 7 ( 5.3) Other 10 ( 2.3) 6 ( 4.6) South Asian 7 ( 1.6) 1 ( 0.8) East South East Asian 5 ( 1.1) 0 ( 0.0) West Asian or Arab 3 ( 0.7) 2 ( 1.5) Unknown 28 ( 5.2) 9 ( 6.9) Known Jewish 0.207 No 391 (86.0) 103 ( 78.6) Jewish 28 ( 6.3) 13 ( 9.9) Mixed 19 ( 4.3) 7 ( 5.3) Unknown 15 ( 3.4) 8 ( 6.1) Known Hispanic 0.173 No 414 (93.7) 115 (87.8) Hispanic 8 (1.8) 5 (3.8) Mixed 7 (1.6) 4 (3.1) Unknown 13 (2.9) 7 (5.3) Known African 0.648 No 363 (82.1) 103 (78.6) African 32 (7.2) 12 (9.2) Unknown 47 (10.6) 16 (12.2)
Chi-squared tests, t-tests, and Kruskal-Wallis Rank Sum Test were used for comparisons between groups depending on the nature (continuous or non-continuous) of the variables. * indicates p<0.05.
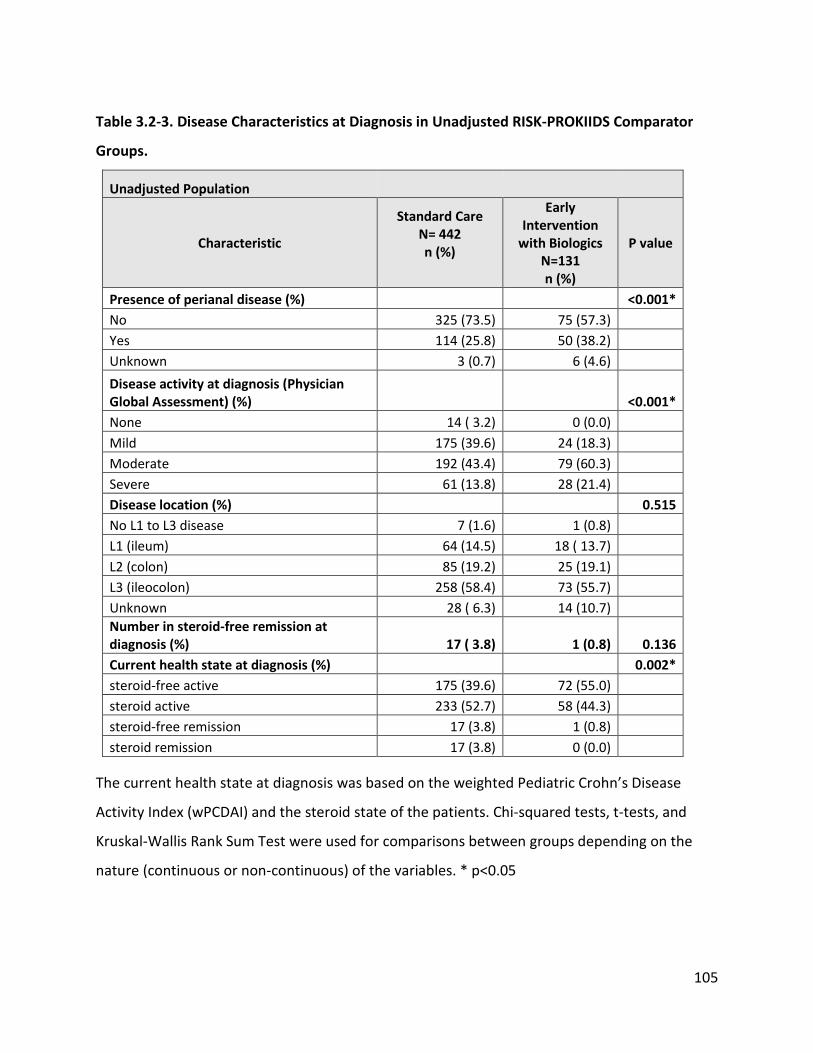
105
Table 3.2-3. Disease Characteristics at Diagnosis in Unadjusted RISK-PROKIIDS Comparator
Groups.
Unadjusted Population
Characteristic
Standard Care N= 442 n (%)
Early Intervention
with Biologics N=131 n (%)
P value
Presence of perianal disease (%) <0.001* No 325 (73.5) 75 (57.3) Yes 114 (25.8) 50 (38.2) Unknown 3 (0.7) 6 (4.6) Disease activity at diagnosis (Physician Global Assessment) (%) <0.001* None 14 ( 3.2) 0 (0.0) Mild 175 (39.6) 24 (18.3) Moderate 192 (43.4) 79 (60.3) Severe 61 (13.8) 28 (21.4) Disease location (%) 0.515 No L1 to L3 disease 7 (1.6) 1 (0.8) L1 (ileum) 64 (14.5) 18 ( 13.7) L2 (colon) 85 (19.2) 25 (19.1) L3 (ileocolon) 258 (58.4) 73 (55.7) Unknown 28 ( 6.3) 14 (10.7) Number in steroid-free remission at diagnosis (%) 17 ( 3.8) 1 (0.8) 0.136 Current health state at diagnosis (%) 0.002* steroid-free active 175 (39.6) 72 (55.0) steroid active 233 (52.7) 58 (44.3) steroid-free remission 17 (3.8) 1 (0.8) steroid remission 17 (3.8) 0 (0.0)
The current health state at diagnosis was based on the weighted Pediatric Crohn’s Disease
Activity Index (wPCDAI) and the steroid state of the patients. Chi-squared tests, t-tests, and
Kruskal-Wallis Rank Sum Test were used for comparisons between groups depending on the
nature (continuous or non-continuous) of the variables. * p<0.05
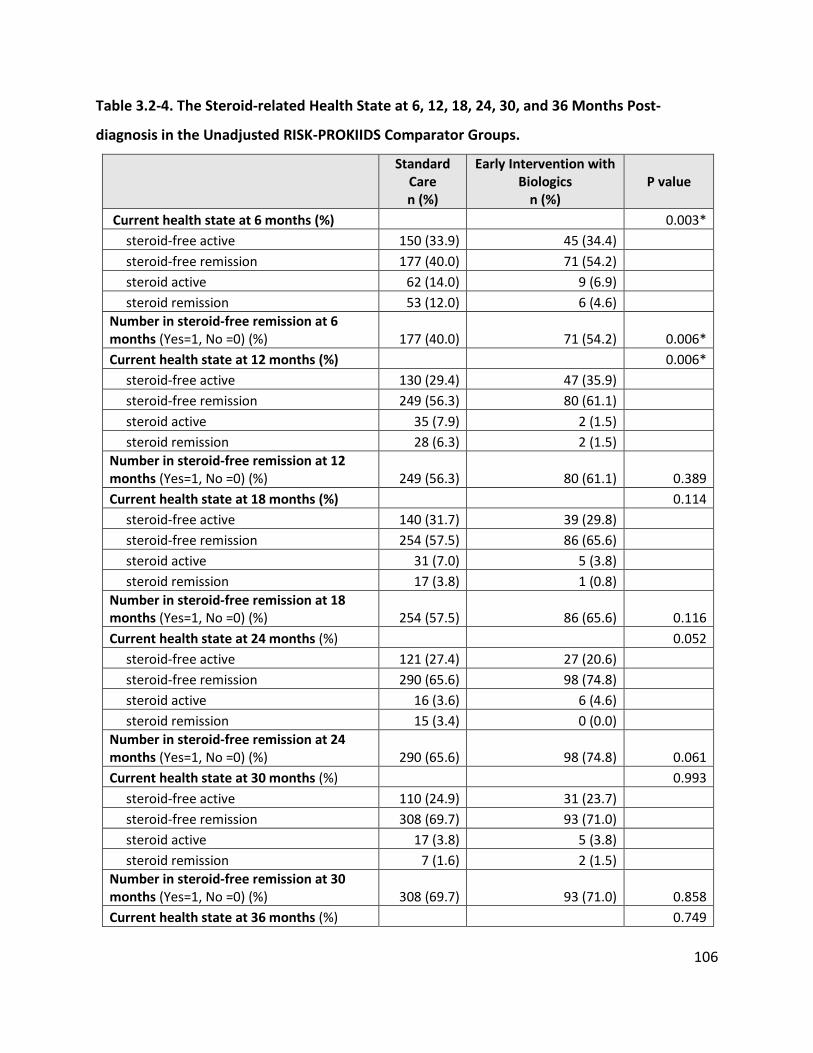
106
Table 3.2-4. The Steroid-related Health State at 6, 12, 18, 24, 30, and 36 Months Post-
diagnosis in the Unadjusted RISK-PROKIIDS Comparator Groups.
Standard Care n (%)
Early Intervention with Biologics
n (%) P value
Current health state at 6 months (%) 0.003* steroid-free active 150 (33.9) 45 (34.4) steroid-free remission 177 (40.0) 71 (54.2) steroid active 62 (14.0) 9 (6.9) steroid remission 53 (12.0) 6 (4.6) Number in steroid-free remission at 6 months (Yes=1, No =0) (%) 177 (40.0) 71 (54.2) 0.006* Current health state at 12 months (%) 0.006* steroid-free active 130 (29.4) 47 (35.9) steroid-free remission 249 (56.3) 80 (61.1) steroid active 35 (7.9) 2 (1.5) steroid remission 28 (6.3) 2 (1.5) Number in steroid-free remission at 12 months (Yes=1, No =0) (%) 249 (56.3) 80 (61.1) 0.389 Current health state at 18 months (%) 0.114 steroid-free active 140 (31.7) 39 (29.8) steroid-free remission 254 (57.5) 86 (65.6) steroid active 31 (7.0) 5 (3.8) steroid remission 17 (3.8) 1 (0.8) Number in steroid-free remission at 18 months (Yes=1, No =0) (%) 254 (57.5) 86 (65.6) 0.116 Current health state at 24 months (%) 0.052 steroid-free active 121 (27.4) 27 (20.6) steroid-free remission 290 (65.6) 98 (74.8) steroid active 16 (3.6) 6 (4.6) steroid remission 15 (3.4) 0 (0.0) Number in steroid-free remission at 24 months (Yes=1, No =0) (%) 290 (65.6) 98 (74.8) 0.061 Current health state at 30 months (%) 0.993 steroid-free active 110 (24.9) 31 (23.7) steroid-free remission 308 (69.7) 93 (71.0) steroid active 17 (3.8) 5 (3.8) steroid remission 7 (1.6) 2 (1.5) Number in steroid-free remission at 30 months (Yes=1, No =0) (%) 308 (69.7) 93 (71.0) 0.858 Current health state at 36 months (%) 0.749
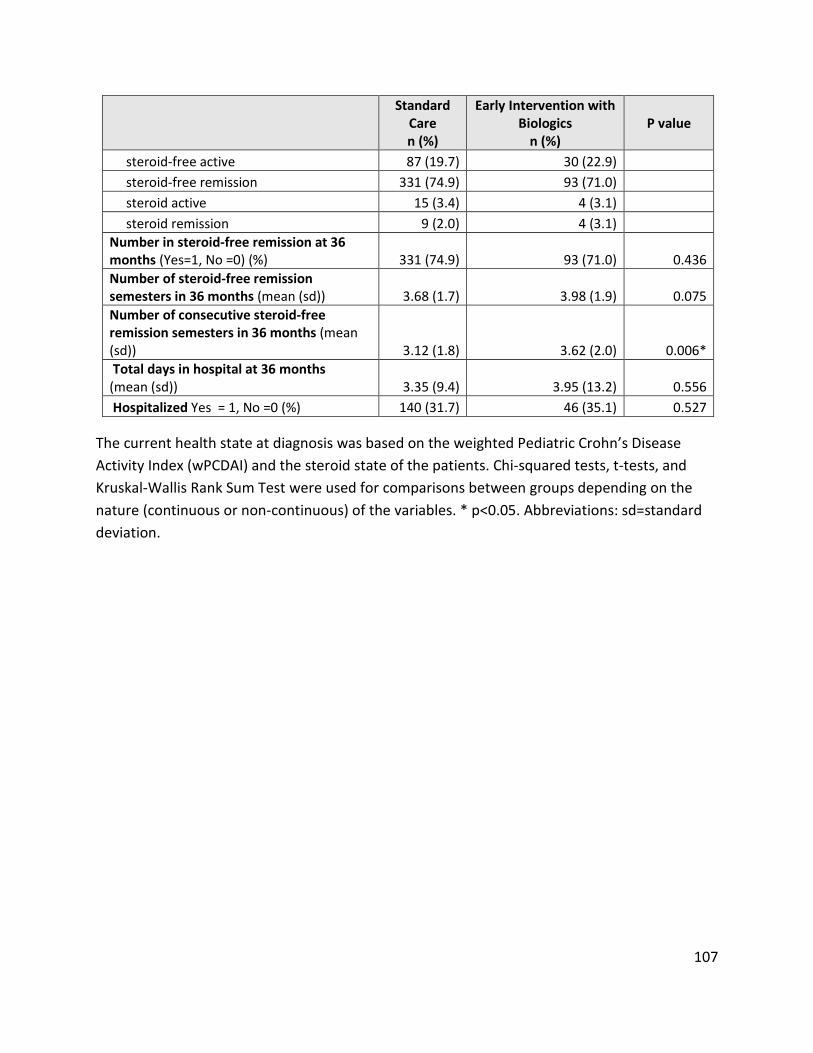
107
Standard Care n (%)
Early Intervention with Biologics
n (%) P value
steroid-free active 87 (19.7) 30 (22.9) steroid-free remission 331 (74.9) 93 (71.0) steroid active 15 (3.4) 4 (3.1) steroid remission 9 (2.0) 4 (3.1) Number in steroid-free remission at 36 months (Yes=1, No =0) (%) 331 (74.9) 93 (71.0) 0.436 Number of steroid-free remission semesters in 36 months (mean (sd)) 3.68 (1.7) 3.98 (1.9) 0.075 Number of consecutive steroid-free remission semesters in 36 months (mean (sd)) 3.12 (1.8) 3.62 (2.0) 0.006* Total days in hospital at 36 months (mean (sd)) 3.35 (9.4) 3.95 (13.2) 0.556 Hospitalized Yes = 1, No =0 (%) 140 (31.7) 46 (35.1) 0.527
The current health state at diagnosis was based on the weighted Pediatric Crohn’s Disease Activity Index (wPCDAI) and the steroid state of the patients. Chi-squared tests, t-tests, and Kruskal-Wallis Rank Sum Test were used for comparisons between groups depending on the nature (continuous or non-continuous) of the variables. * p<0.05. Abbreviations: sd=standard deviation.
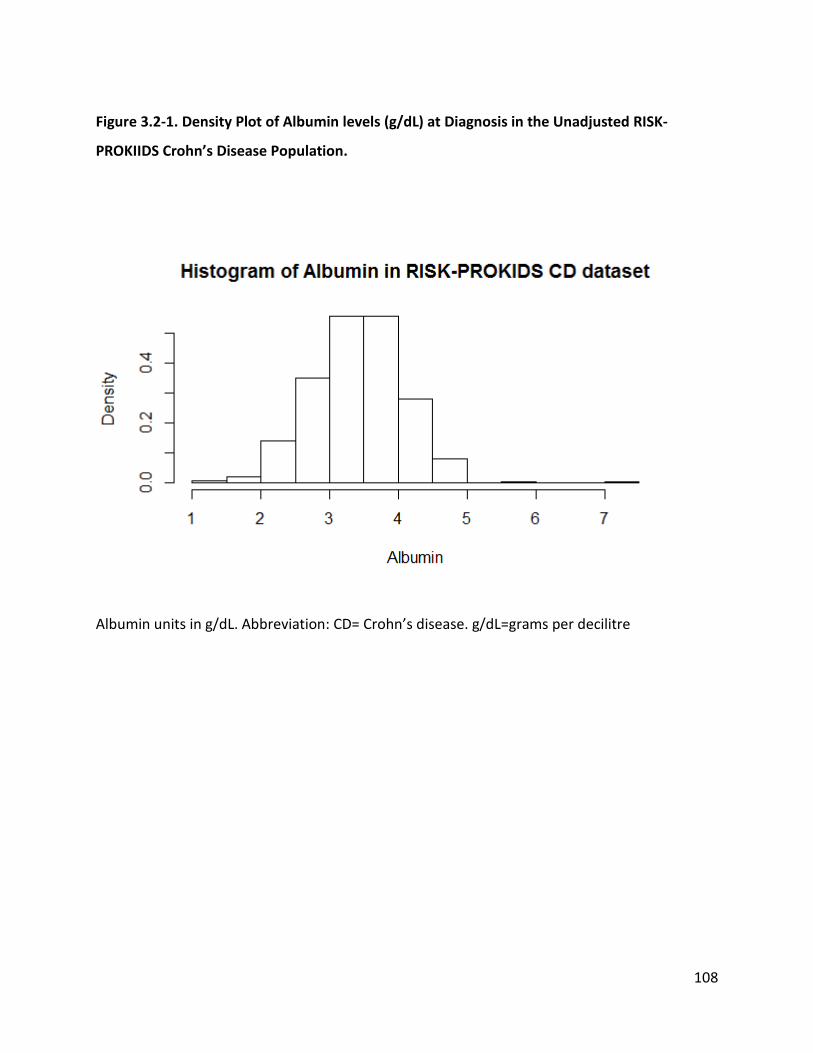
108
Figure 3.2-1. Density Plot of Albumin levels (g/dL) at Diagnosis in the Unadjusted RISK-
PROKIIDS Crohn’s Disease Population.
Albumin units in g/dL. Abbreviation: CD= Crohn’s disease. g/dL=grams per decilitre
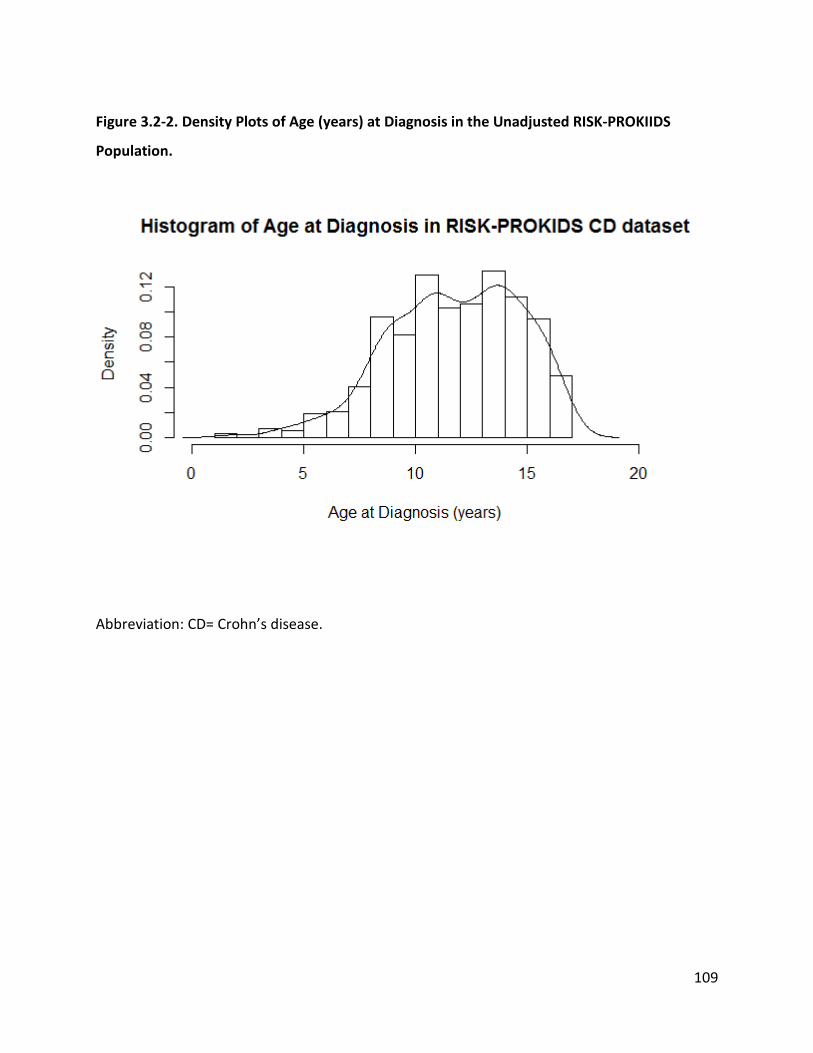
109
Figure 3.2-2. Density Plots of Age (years) at Diagnosis in the Unadjusted RISK-PROKIIDS
Population.
Abbreviation: CD= Crohn’s disease.
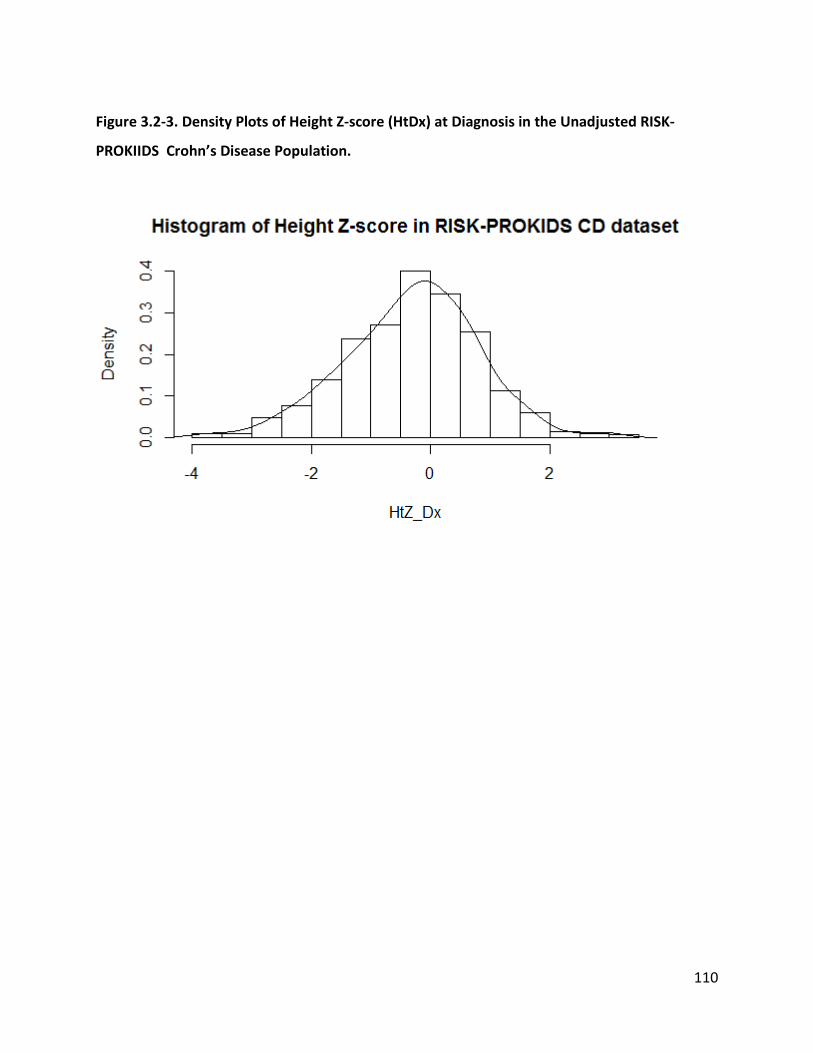
110
Figure 3.2-3. Density Plots of Height Z-score (HtDx) at Diagnosis in the Unadjusted RISK-
PROKIIDS Crohn’s Disease Population.
111
3.3 Imputation of Missing Data
The imputation of missing data from the RISK-PROKIIDS data was conducted to avoid reducing
the potential sample size of the population. Since the missing data was assumed to be missing
at random and that the missing data was from a continuous variable (albumin) with a small
percentage (11%) of missing values at baseline, it was reasonable to proceed with the
imputation of missing data before proceeding with propensity score analysis to create
comparator groups. Sixty-four patients had missing lab values for albumin at diagnosis
(baseline, Visit 0). It was assumed that data were missing at random, and this was tested using
the equality of covariances in groups with identical missing patterns. The test concluded that
normality in the data was rejected at the 0.05 significance level (p=1.33 e-141) and non-
parametric testing concluded that there was not sufficient evidence to reject that the data was
missing completely at random at the 0.05 significance level since p=0.18. Hence, it was
assumed that the data were missing at random. Missing data were therefore imputed. The
imputation alleviated having to exclude the 64 patients with the missing data from the original
unadjusted population and reducing the sample size for the cost-effectiveness analysis.
Multivariate imputation by chained equations (MICE) using the predictive mean matching
method was conducted for ten iterations resulting in ten separate imputed data sets. The
distribution patterns of albumin values in the ten imputed data sets are shown in a density plot
in Appendix 16, Figure A16-1, and the distribution of the imputed values among original values
in each imputed data set is shown in strip plots in Appendix 16, Figure A16-2.
Since ten imputed data sets were created, two options on how to proceed with data sets for
the ensuing propensity analysis and cost-effectiveness analysis were considered. One approach,
the “Within” approach, calculates propensity scores on each imputed dataset separately and
creates ten matched data sets (Mitra & Reiter, 2016). The other approach, the “Across”
approach, averages the propensity score for each subject from each imputed dataset and then
uses that mean propensity score to create one matched population (Mitra & Reiter, 2016).
Since no one approach has been recommended within the context of a cost-effectiveness
112
analysis, both approaches were used for the propensity score analysis. The “Across” method
was the primary approach taken for the determining probability inputs for the cost-
effectiveness analysis since the “Across” approach resulted in one data set serving as the
resource for the cost-effectiveness model inputs. The “Within” approach was also used but only
in a secondary analysis to compare the impact of both approaches on the cost-effectiveness
analysis.
The following section describes the comparison of different methods of propensity score
analysis performed before choosing an optimal propensity score method to create an adjusted,
matched data set of equivalent comparator groups for the cost-effectiveness analysis.
3.4 Propensity Score Analysis
Propensity score analysis was used to reduce selection bias in being assigned a certain
treatment in the RISK-PROKIIDS patient population and was used to create comparator groups
of patients with similar characteristics. The propensity score for each patient was derived from
the propensity score regression model equation which described the conditional probability of
receiving the early anti-TNF-α treatment (see section 2.4 for propensity score regression
equation). The following variables were considered as covariates in the propensity score
regression model since they may have influenced treatment selection:
• age at diagnosis,
• sex,
• disease activity at diagnosis (based on physician global assessment),
• African heritage,
• disease location,
• the presence of peri-anal disease,
• height z-score,
• steroid-related health state at diagnosis,
• albumin values,
• whether the subject was recruited at a large clinical site (>31 patients).
113
The purpose of the propensity score analysis was to create comparator groups of patients with
similarly balanced characteristics. Therefore, it was not necessary to establish whether the
covariates actually had an influence on treatment selection but only that covariates were
balanced among the two comparator groups. The thresholds used to establish good covariate
balance were when covariates achieved mean standardized differences below 0.1 and variance
ratios for continuous variables were closest to 1 (Austin, 2009). The imbalance in propensity
scores between the early anti-TNF-α intervention group and the standard care group in the
unadjusted RISK-PROKIIDS data set is shown graphically in Appendix 17.
Four methods of propensity score analysis were compared to find the optimal method for
adjusting the imputed data sets from the RISK-PROKIIDS CD patient population. The four types
of propensity score analyses conducted were propensity score matching, propensity score
weighting, stratification (sub-classification), and covariate balance propensity score (CBPS). To
choose the optimal method of propensity score analysis, balance diagnostics were performed
for each approach. Balance diagnostics comprised of graphically showing covariate balance and
determining which methods achieved covariate balance through mean standardized differences
below 0.1 and variance ratios close to 1 (and below 1.5) for the continuous variables of age at
diagnosis, albumin and height z-score. The following sections describe the results from the
propensity score analysis methods.
3.4.1 Propensity Score Matching
Nearest neighbour propensity score matching without replacement, using the logit method,
was conducted with each of the ten imputed datasets and with the “Across” averaged dataset
of 573 subjects. Ratios of 1:1, 2:1 and 3:1, standard step-up care (control): early anti-TNF-α
intervention (treatment) patient groups were assembled with and without a caliper constraint
of 0.2 the standard deviation of the logit of the propensity score. The 0.2 caliper constraint
excluded more patients due to tighter matching parameters. Matching results and covariate
balance results for the “Across” data set are shown in Table 3.4.5-1. Matching and covariate
balance results for the ten “Within” data sets are shown in Appendix 19. Matched groups with a
ratio of 1:1 control:treatment subjects and with a 0.2 caliper constraint had 123 patients in
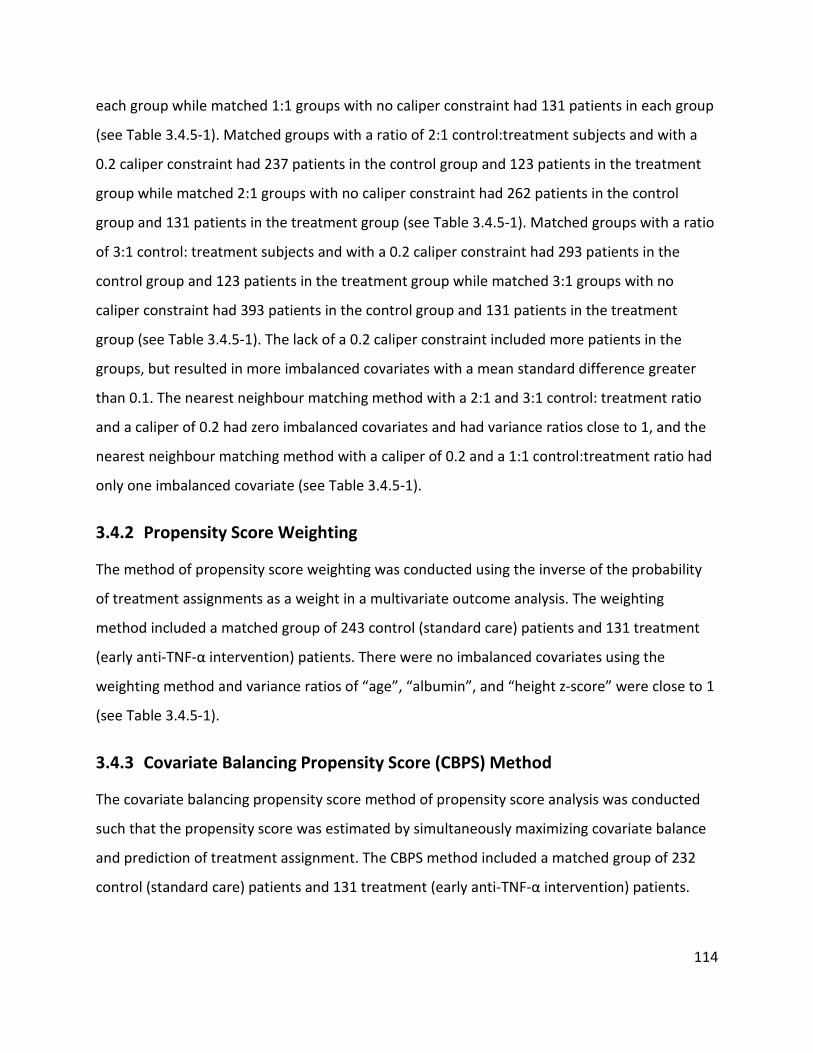
114
each group while matched 1:1 groups with no caliper constraint had 131 patients in each group
(see Table 3.4.5-1). Matched groups with a ratio of 2:1 control:treatment subjects and with a
0.2 caliper constraint had 237 patients in the control group and 123 patients in the treatment
group while matched 2:1 groups with no caliper constraint had 262 patients in the control
group and 131 patients in the treatment group (see Table 3.4.5-1). Matched groups with a ratio
of 3:1 control: treatment subjects and with a 0.2 caliper constraint had 293 patients in the
control group and 123 patients in the treatment group while matched 3:1 groups with no
caliper constraint had 393 patients in the control group and 131 patients in the treatment
group (see Table 3.4.5-1). The lack of a 0.2 caliper constraint included more patients in the
groups, but resulted in more imbalanced covariates with a mean standard difference greater
than 0.1. The nearest neighbour matching method with a 2:1 and 3:1 control: treatment ratio
and a caliper of 0.2 had zero imbalanced covariates and had variance ratios close to 1, and the
nearest neighbour matching method with a caliper of 0.2 and a 1:1 control:treatment ratio had
only one imbalanced covariate (see Table 3.4.5-1).
3.4.2 Propensity Score Weighting
The method of propensity score weighting was conducted using the inverse of the probability
of treatment assignments as a weight in a multivariate outcome analysis. The weighting
method included a matched group of 243 control (standard care) patients and 131 treatment
(early anti-TNF-α intervention) patients. There were no imbalanced covariates using the
weighting method and variance ratios of “age”, “albumin”, and “height z-score” were close to 1
(see Table 3.4.5-1).
3.4.3 Covariate Balancing Propensity Score (CBPS) Method
The covariate balancing propensity score method of propensity score analysis was conducted
such that the propensity score was estimated by simultaneously maximizing covariate balance
and prediction of treatment assignment. The CBPS method included a matched group of 232
control (standard care) patients and 131 treatment (early anti-TNF-α intervention) patients.
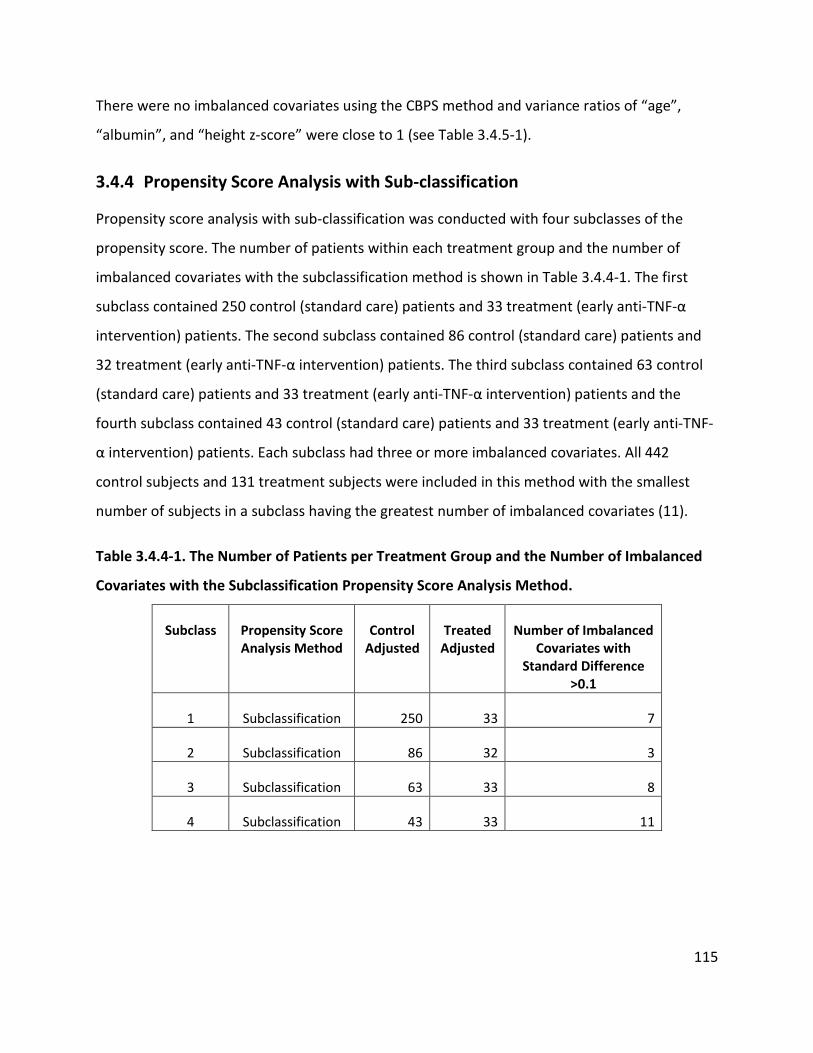
115
There were no imbalanced covariates using the CBPS method and variance ratios of “age”,
“albumin”, and “height z-score” were close to 1 (see Table 3.4.5-1).
3.4.4 Propensity Score Analysis with Sub-classification
Propensity score analysis with sub-classification was conducted with four subclasses of the
propensity score. The number of patients within each treatment group and the number of
imbalanced covariates with the subclassification method is shown in Table 3.4.4-1. The first
subclass contained 250 control (standard care) patients and 33 treatment (early anti-TNF-α
intervention) patients. The second subclass contained 86 control (standard care) patients and
32 treatment (early anti-TNF-α intervention) patients. The third subclass contained 63 control
(standard care) patients and 33 treatment (early anti-TNF-α intervention) patients and the
fourth subclass contained 43 control (standard care) patients and 33 treatment (early anti-TNF-
α intervention) patients. Each subclass had three or more imbalanced covariates. All 442
control subjects and 131 treatment subjects were included in this method with the smallest
number of subjects in a subclass having the greatest number of imbalanced covariates (11).
Table 3.4.4-1. The Number of Patients per Treatment Group and the Number of Imbalanced
Covariates with the Subclassification Propensity Score Analysis Method.
Subclass Propensity Score Analysis Method
Control Adjusted
Treated Adjusted
Number of Imbalanced Covariates with
Standard Difference >0.1
1 Subclassification 250 33 7
2 Subclassification 86 32 3
3 Subclassification 63 33 8
4 Subclassification 43 33 11
116
3.4.5 Balance Diagnostics on the Propensity Score Methods
The mean standardized difference, variance ratios of covariates and the resulting number of
imbalanced covariates were the criteria for diagnosing balance among the different propensity
score methods. A mean standardized difference below 0.1 among covariates of the matched
groups and variance ratios close to 1 for the continuous variables of “albumin”, “age at
diagnosis” and “height Z score” were used as thresholds to measure covariate balance. Mean
standardized differences and variance ratios could only be calculated for continuous variables.
Therefore, being the only continuous variables out of all the propensity score covariates, mean
standardized differences and variance ratios were determined for “albumin”, “age at diagnosis”
and “height Z score”. Covariates that did not meet these thresholds were considered
imbalanced. Variance ratios, and mean standardized differences for the nearest neighbour
matching method using different ratios of standard care to early intervention patients, with and
without a caliper constraint, the propensity score weighting method, and the covariate balance
propensity score method are shown in Table 3.4.5-1 for the imputed data set assembled using
the “Across” method. The number of imbalanced covariates for the nearest neighbour
matching, weighting and covariate balance propensity score methods are shown in Table 3.4.5-
1 and the number of imbalanced covariates for the sub-classification propensity method are
shown in Table 3.4.4-1 (using the “Across” method of data set assembly).
In addition to assessing covariate balance through mean standardized differences and variance
ratios, the efficacy of the propensity score analysis were demonstrated graphically. The
distribution of propensity scores in the unmatched and matched treatment groups are shown
in a Jitter plot (see Figure 3.4.5-1). Quantile-quantile (Q-Q plots) which show the likelihood that
matched covariates from the early anti-TNF-α and standard care populations come from the
same distributions, are shown in Appendix 18, Figure A18-1. Covariate balance was shown
graphically with a “Love” plot, which plotted mean standardized differences for all covariates
before and after propensity score analysis. A “Love” plot for the nearest neighbour matching
technique with a 0.2 caliper constraint and a 2:1 ratio of standard care to early anti-TNF-α using
the “Across” method of assembling the data sets is shown in Figure 3.4.5-2. While the averaged

117
“Across” data set was the primary data set matched here, propensity score balance diagnostics
for each of the ten separately imputed RISK-PROKIIDS data sets with the nearest neighbour
matching technique, weighting method, CBPS method and subclassification method are shown
in Appendix 19.
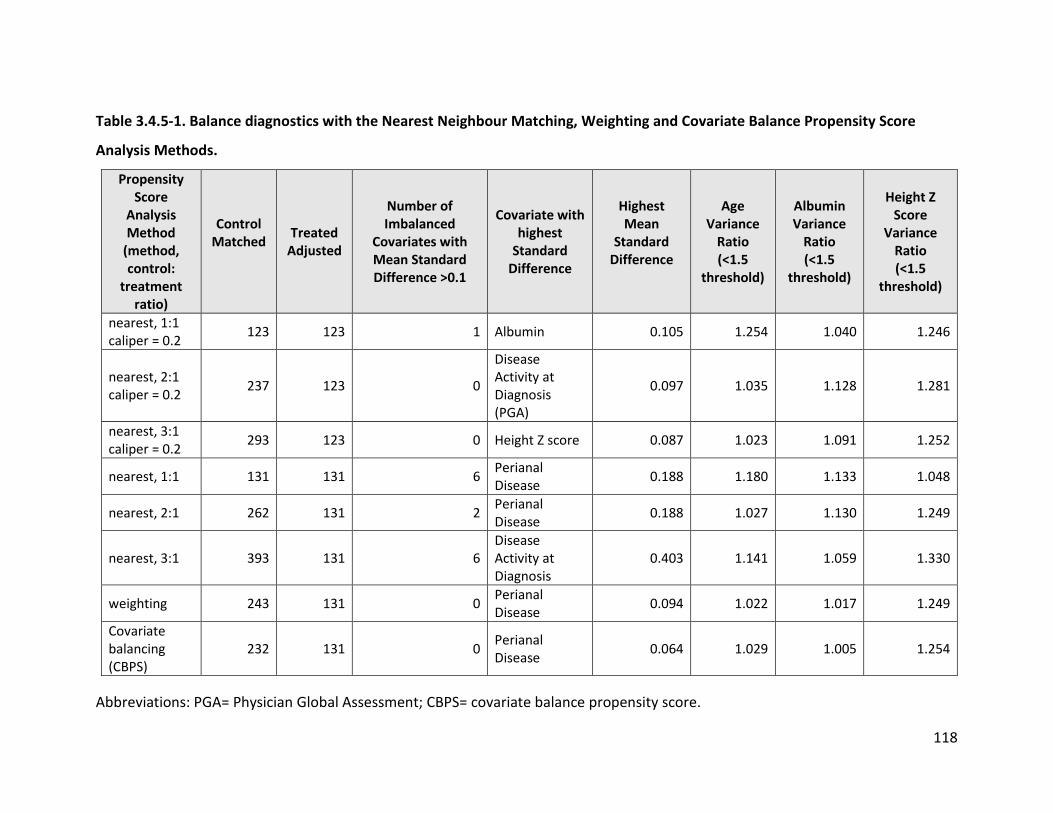
118
Table 3.4.5-1. Balance diagnostics with the Nearest Neighbour Matching, Weighting and Covariate Balance Propensity Score
Analysis Methods.
Propensity Score
Analysis Method
(method, control:
treatment ratio)
Control Matched
Treated Adjusted
Number of Imbalanced
Covariates with Mean Standard Difference >0.1
Covariate with highest
Standard Difference
Highest Mean
Standard Difference
Age Variance
Ratio (<1.5
threshold)
Albumin Variance
Ratio (<1.5
threshold)
Height Z Score
Variance Ratio (<1.5
threshold)
nearest, 1:1 caliper = 0.2 123 123 1 Albumin 0.105 1.254 1.040 1.246
nearest, 2:1 caliper = 0.2 237 123 0
Disease Activity at Diagnosis (PGA)
0.097 1.035 1.128 1.281
nearest, 3:1 caliper = 0.2 293 123 0 Height Z score 0.087 1.023 1.091 1.252
nearest, 1:1 131 131 6 Perianal Disease 0.188 1.180 1.133 1.048
nearest, 2:1 262 131 2 Perianal Disease 0.188 1.027 1.130 1.249
nearest, 3:1 393 131 6 Disease Activity at Diagnosis
0.403 1.141 1.059 1.330
weighting 243 131 0 Perianal Disease 0.094 1.022 1.017 1.249
Covariate balancing (CBPS)
232 131 0 Perianal Disease 0.064 1.029 1.005 1.254
Abbreviations: PGA= Physician Global Assessment; CBPS= covariate balance propensity score.
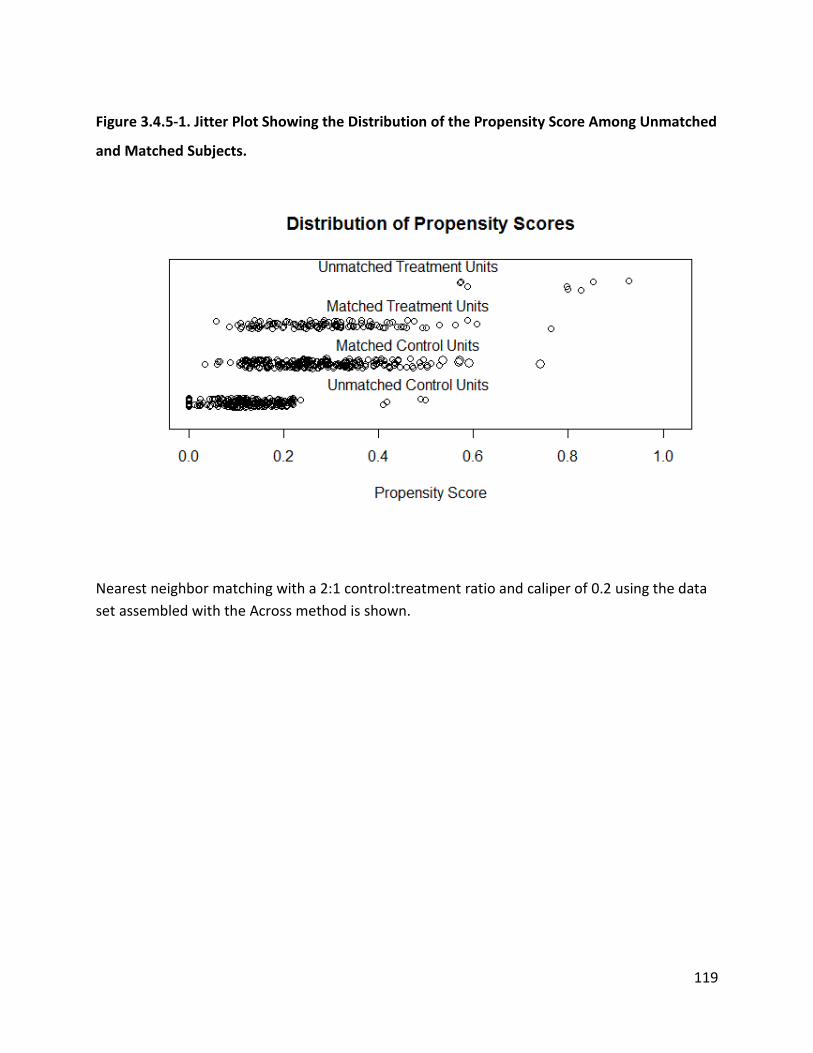
119
Figure 3.4.5-1. Jitter Plot Showing the Distribution of the Propensity Score Among Unmatched
and Matched Subjects.
Nearest neighbor matching with a 2:1 control:treatment ratio and caliper of 0.2 using the data set assembled with the Across method is shown.
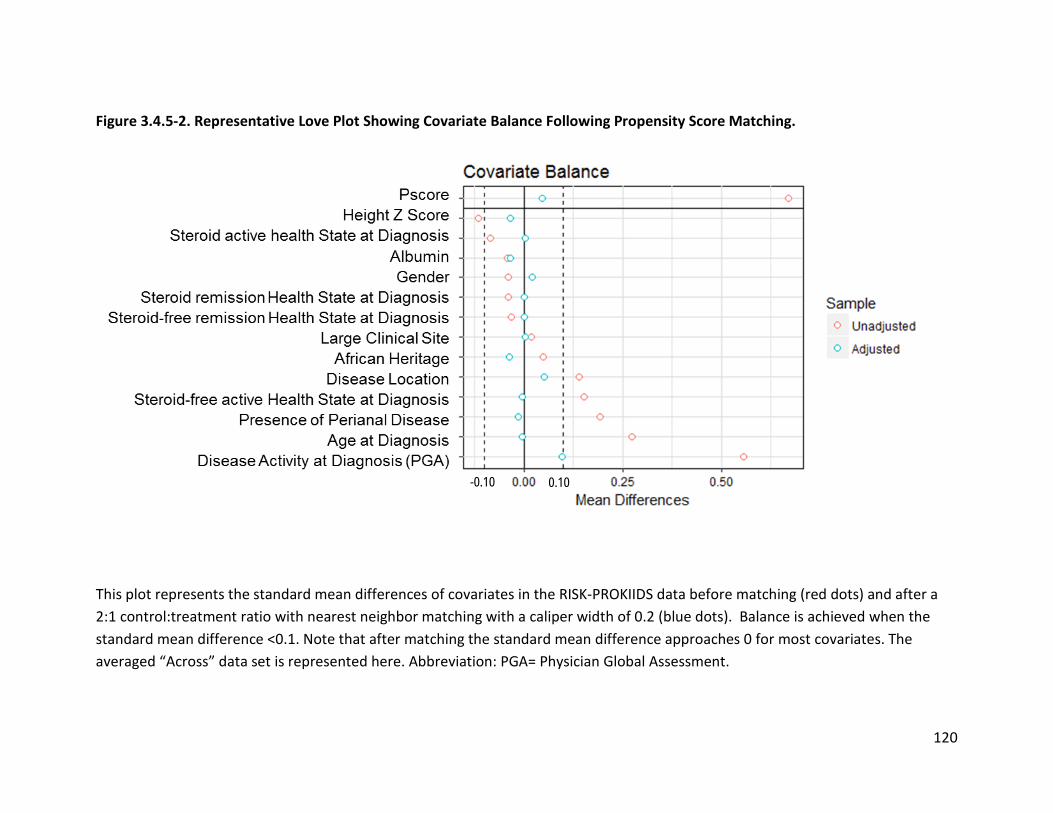
120
Figure 3.4.5-2. Representative Love Plot Showing Covariate Balance Following Propensity Score Matching.
This plot represents the standard mean differences of covariates in the RISK-PROKIIDS data before matching (red dots) and after a 2:1 control:treatment ratio with nearest neighbor matching with a caliper width of 0.2 (blue dots). Balance is achieved when the standard mean difference <0.1. Note that after matching the standard mean difference approaches 0 for most covariates. The averaged “Across” data set is represented here. Abbreviation: PGA= Physician Global Assessment.
-0.10 0.10
121
3.4.6 Choosing the Optimal Propensity Score Analysis Method
The results in Tables 3.4.5-1 and Table 3.4.4-1 show that there are differences in covariate
balance among the different propensity score methods and suggest that when choosing a
propensity score analysis method, that several methods should be considered to find the
method that offers the greatest covariate balance for a particular set of data rather than
arbitrarily choosing one method. The propensity score methods with the greatest degree of
balance included those with the most covariates with mean standardized differences below 0.1
and variance ratios closest to 1. As shown in Table 3.4.5-1, the weighting method, CBPS method
and the nearest neighbour matching method using a caliper constraint of 0.2 and using a 2:1 or
3:1 ratio of standard care to early anti-TNF-α intervention patients did not have any imbalanced
covariates and had variance ratios close to one. Therefore, all these propensity score analysis
methods would be appropriate for creating a dataset representative of the RISK-PROKIIDS
population.
The weighting and CBPS methods had technical limitations within their R software packages so
that the matched data sets could not simply be extracted into other software programs such as
Microsoft Excel for further determination of transition probabilities for the cost-effectiveness
analysis model. Therefore, the 2:1 control to treatment ratio nearest neighbour matched data
set with a caliper of 0.2 created from the “Across” data set was chosen to inform parameters
for the economic evaluation. This matched data set containing 360 total subjects with 237
standard care subjects (control) and 123 early anti-TNF-α intervention (treatment) subjects.
When choosing among many-to-one ratios for propensity score analysis, lower ratios are
suggested (Austin, 2010) since they tend to reduce mean square error in the treatment effect.
Therefore, the 2:1 control to treatment ratio method was chosen over the 3:1 control to
treatment ratio technique even though both showed balance in their covariates. To confirm any
difference in treatment effect mean square error, the mean square error of the logistic
regression equation with the “number of steroid-free remission semesters” as the treatment
effect and “early anti-TNF-α intervention” as the treatment variable was examined. Covariates
in the regression equation were: “age”, “sex”, “disease severity at diagnosis”, “African
122
heritage”, “disease location”, “presence of perianal disease”, “height z score”, “albumin
values”, “steroid-related health state at diagnosis”, “large clinical site”, and “receiving
concomitant classes of drugs” (see section 2.4.6 for the regression equation). The mean square
error of the regression equation using the matched data set from the 2:1 control to treatment
ratio, nearest neighbour matching with a caliper of 0.2 was 2.66. The mean square error using
the matched data set from the 3:1 control to treatment ratio, nearest neighbour matching with
a caliper of 0.2 was 2.77. Therefore, it was confirmed that the 2:1 standard care to early anti-
TNF-α ratio did have a slightly smaller mean square error. Henceforth, using the “Across”
method in assembling imputed data, the nearest neighbour matching with a caliper of 0.2 in a
2:1 control (standard care) to treatment (early anti-TNF-α intervention) was chosen as the
propensity score method for creating an adjusted dataset representative of the RISK-PROKIIDS
patient population and to inform transition probabilities and clinical outcomes in the cost-
effectiveness analysis. The characteristics of the adjusted RISK-PROKIIDS CD patient population
are described in the next section.
3.5 Characteristics and Clinical Outcomes of the Adjusted RISK-PROKIIDS Patient Population
Propensity score matching was performed on the unadjusted RISK-PROKIIDS CD pediatric
patient data to create comparable standard care and early anti-TNF-α comparator groups for
the economic evaluation. The characteristics and treatment patterns of the adjusted, matched
comparator groups are described in this section. Patient characteristics at diagnosis are listed
in Table 3.5-1. The ethnic characteristics of each comparator group in the adjusted RISK-
PROKIIDS population are shown in Table 3.5-2. In the adjusted population, the mean at
diagnosis in the standard care group was 12.27 years of age and in the early intervention group
the mean age was 12.28 years of age. In the standard care group, 24.1 % of patients were from
Canadian sites and in the early anti-TNF-α group, 9.8% of patients were from Canadian sites.
Other patient characteristics such as the proportion of males to females, albumin lab values,
height Z-scores, and family history of IBD were similar between the standard care and early
anti-TNF-α groups. Over 70% of patients in both comparator arms were Caucasian. In the
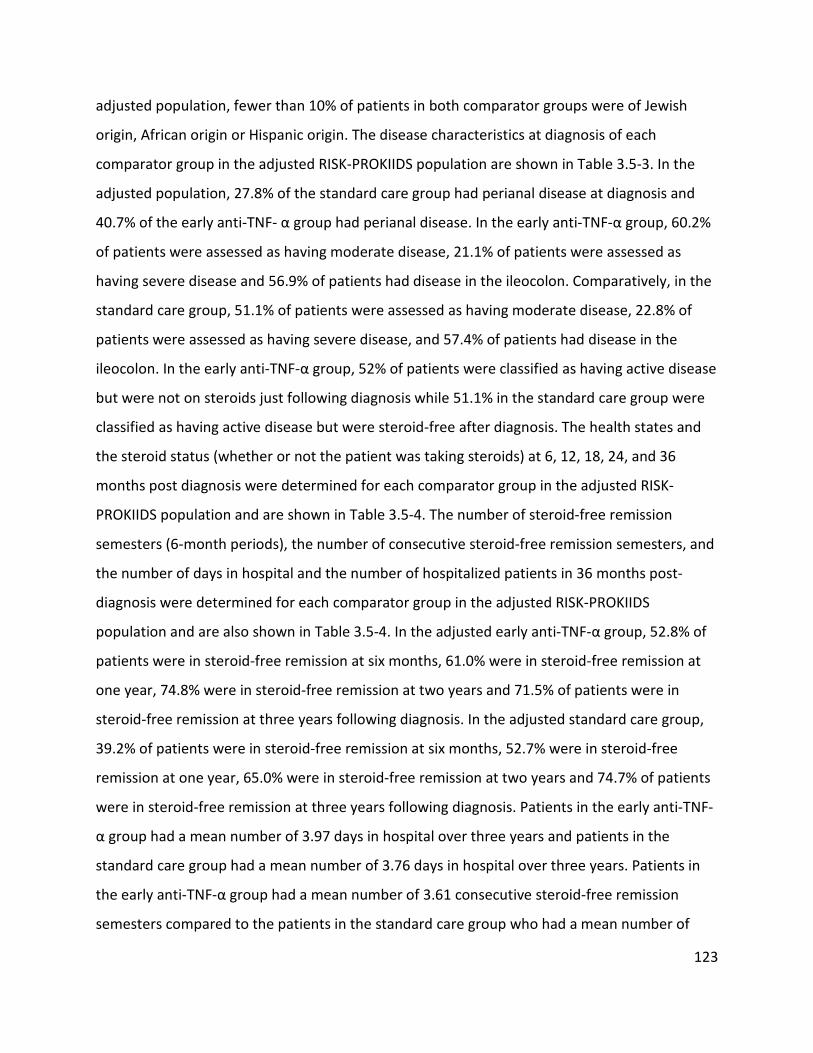
123
adjusted population, fewer than 10% of patients in both comparator groups were of Jewish
origin, African origin or Hispanic origin. The disease characteristics at diagnosis of each
comparator group in the adjusted RISK-PROKIIDS population are shown in Table 3.5-3. In the
adjusted population, 27.8% of the standard care group had perianal disease at diagnosis and
40.7% of the early anti-TNF- α group had perianal disease. In the early anti-TNF-α group, 60.2%
of patients were assessed as having moderate disease, 21.1% of patients were assessed as
having severe disease and 56.9% of patients had disease in the ileocolon. Comparatively, in the
standard care group, 51.1% of patients were assessed as having moderate disease, 22.8% of
patients were assessed as having severe disease, and 57.4% of patients had disease in the
ileocolon. In the early anti-TNF-α group, 52% of patients were classified as having active disease
but were not on steroids just following diagnosis while 51.1% in the standard care group were
classified as having active disease but were steroid-free after diagnosis. The health states and
the steroid status (whether or not the patient was taking steroids) at 6, 12, 18, 24, and 36
months post diagnosis were determined for each comparator group in the adjusted RISK-
PROKIIDS population and are shown in Table 3.5-4. The number of steroid-free remission
semesters (6-month periods), the number of consecutive steroid-free remission semesters, and
the number of days in hospital and the number of hospitalized patients in 36 months post-
diagnosis were determined for each comparator group in the adjusted RISK-PROKIIDS
population and are also shown in Table 3.5-4. In the adjusted early anti-TNF-α group, 52.8% of
patients were in steroid-free remission at six months, 61.0% were in steroid-free remission at
one year, 74.8% were in steroid-free remission at two years and 71.5% of patients were in
steroid-free remission at three years following diagnosis. In the adjusted standard care group,
39.2% of patients were in steroid-free remission at six months, 52.7% were in steroid-free
remission at one year, 65.0% were in steroid-free remission at two years and 74.7% of patients
were in steroid-free remission at three years following diagnosis. Patients in the early anti-TNF-
α group had a mean number of 3.97 days in hospital over three years and patients in the
standard care group had a mean number of 3.76 days in hospital over three years. Patients in
the early anti-TNF-α group had a mean number of 3.61 consecutive steroid-free remission
semesters compared to the patients in the standard care group who had a mean number of
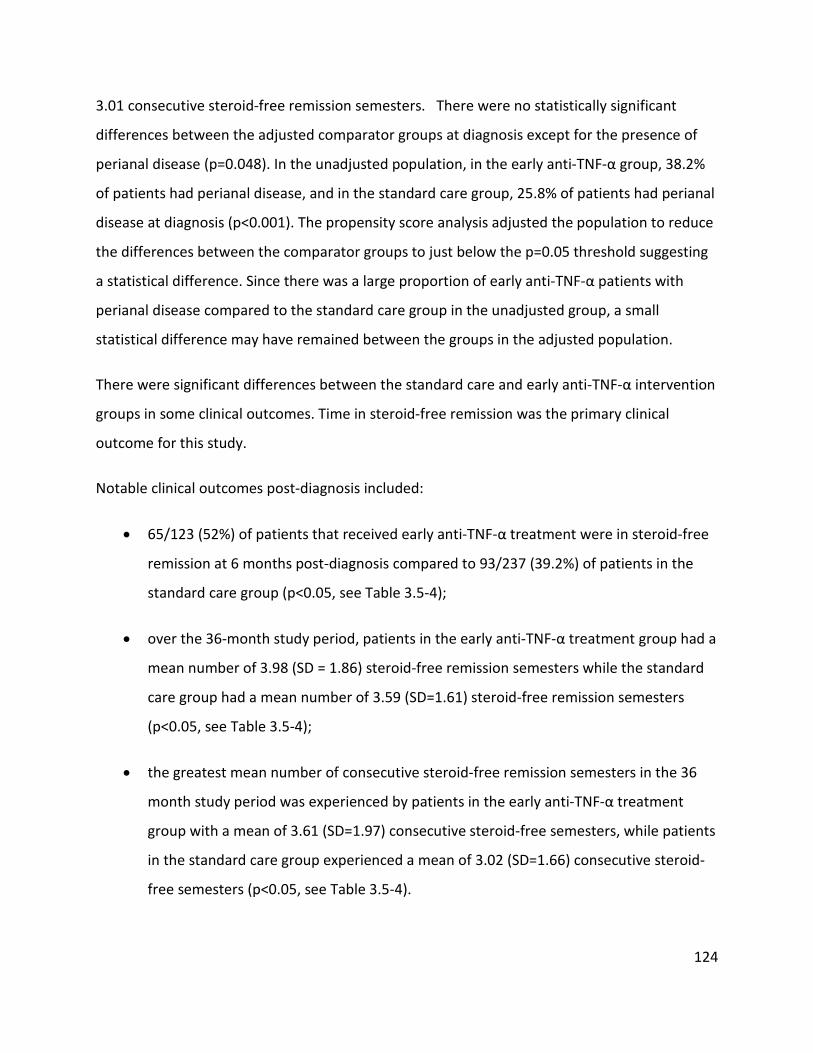
124
3.01 consecutive steroid-free remission semesters. There were no statistically significant
differences between the adjusted comparator groups at diagnosis except for the presence of
perianal disease (p=0.048). In the unadjusted population, in the early anti-TNF-α group, 38.2%
of patients had perianal disease, and in the standard care group, 25.8% of patients had perianal
disease at diagnosis (p<0.001). The propensity score analysis adjusted the population to reduce
the differences between the comparator groups to just below the p=0.05 threshold suggesting
a statistical difference. Since there was a large proportion of early anti-TNF-α patients with
perianal disease compared to the standard care group in the unadjusted group, a small
statistical difference may have remained between the groups in the adjusted population.
There were significant differences between the standard care and early anti-TNF-α intervention
groups in some clinical outcomes. Time in steroid-free remission was the primary clinical
outcome for this study.
Notable clinical outcomes post-diagnosis included:
• 65/123 (52%) of patients that received early anti-TNF-α treatment were in steroid-free
remission at 6 months post-diagnosis compared to 93/237 (39.2%) of patients in the
standard care group (p<0.05, see Table 3.5-4);
• over the 36-month study period, patients in the early anti-TNF-α treatment group had a
mean number of 3.98 (SD = 1.86) steroid-free remission semesters while the standard
care group had a mean number of 3.59 (SD=1.61) steroid-free remission semesters
(p<0.05, see Table 3.5-4);
• the greatest mean number of consecutive steroid-free remission semesters in the 36
month study period was experienced by patients in the early anti-TNF-α treatment
group with a mean of 3.61 (SD=1.97) consecutive steroid-free semesters, while patients
in the standard care group experienced a mean of 3.02 (SD=1.66) consecutive steroid-
free semesters (p<0.05, see Table 3.5-4).
125
There were no statistically significant differences between the early anti-TNF-α treatment
group and the standard care (step up) group for any other post-diagnostic clinical outcome
including the number of hospitalizations or number of patients in steroid-free remission at
other time points over the 36-month study period (see Table 3.5-4). The percentage of patients
in the early anti-TNF-α treatment group and the standard care (step up) group in steroid-free
remission and in remission (in the absence or presence of steroids) at the end of years 1, 2, and
3 is shown in Figure 3.5-1 and appears similar between the groups. The number of steroid-free
remission semesters was converted into steroid-free remission weeks for the purposes of the
cost-effectiveness Markov model and its one-week cycle length. To provide an accurate
representation of the clinical outcomes and costs of patients in each treatment group, in
addition to time in steroid-free remission, time in remission and treatment patterns with
concomitant medications were also assessed. Treatment patterns of the comparator groups are
shown in the following section.
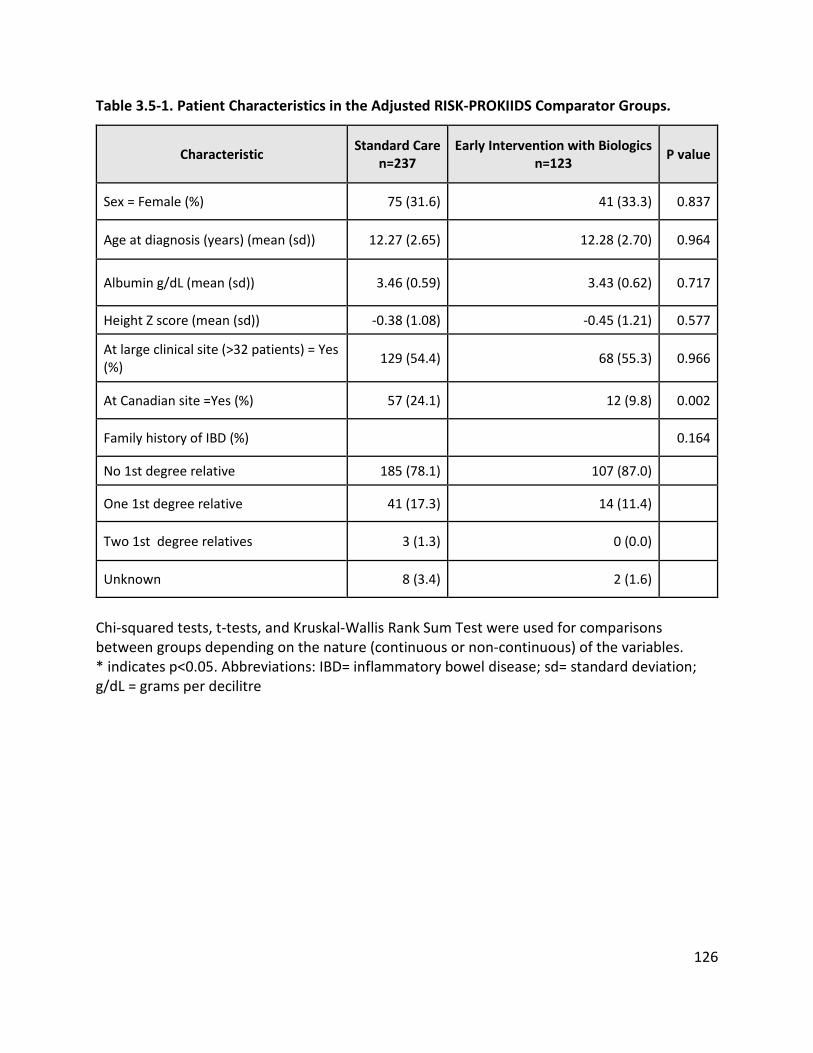
126
Table 3.5-1. Patient Characteristics in the Adjusted RISK-PROKIIDS Comparator Groups.
Characteristic Standard Care n=237
Early Intervention with Biologics n=123 P value
Sex = Female (%) 75 (31.6) 41 (33.3) 0.837
Age at diagnosis (years) (mean (sd)) 12.27 (2.65) 12.28 (2.70) 0.964
Albumin g/dL (mean (sd)) 3.46 (0.59) 3.43 (0.62) 0.717
Height Z score (mean (sd)) -0.38 (1.08) -0.45 (1.21) 0.577
At large clinical site (>32 patients) = Yes (%) 129 (54.4) 68 (55.3) 0.966
At Canadian site =Yes (%) 57 (24.1) 12 (9.8) 0.002
Family history of IBD (%) 0.164
No 1st degree relative 185 (78.1) 107 (87.0)
One 1st degree relative 41 (17.3) 14 (11.4)
Two 1st degree relatives 3 (1.3) 0 (0.0)
Unknown 8 (3.4) 2 (1.6)
Chi-squared tests, t-tests, and Kruskal-Wallis Rank Sum Test were used for comparisons between groups depending on the nature (continuous or non-continuous) of the variables. * indicates p<0.05. Abbreviations: IBD= inflammatory bowel disease; sd= standard deviation; g/dL = grams per decilitre
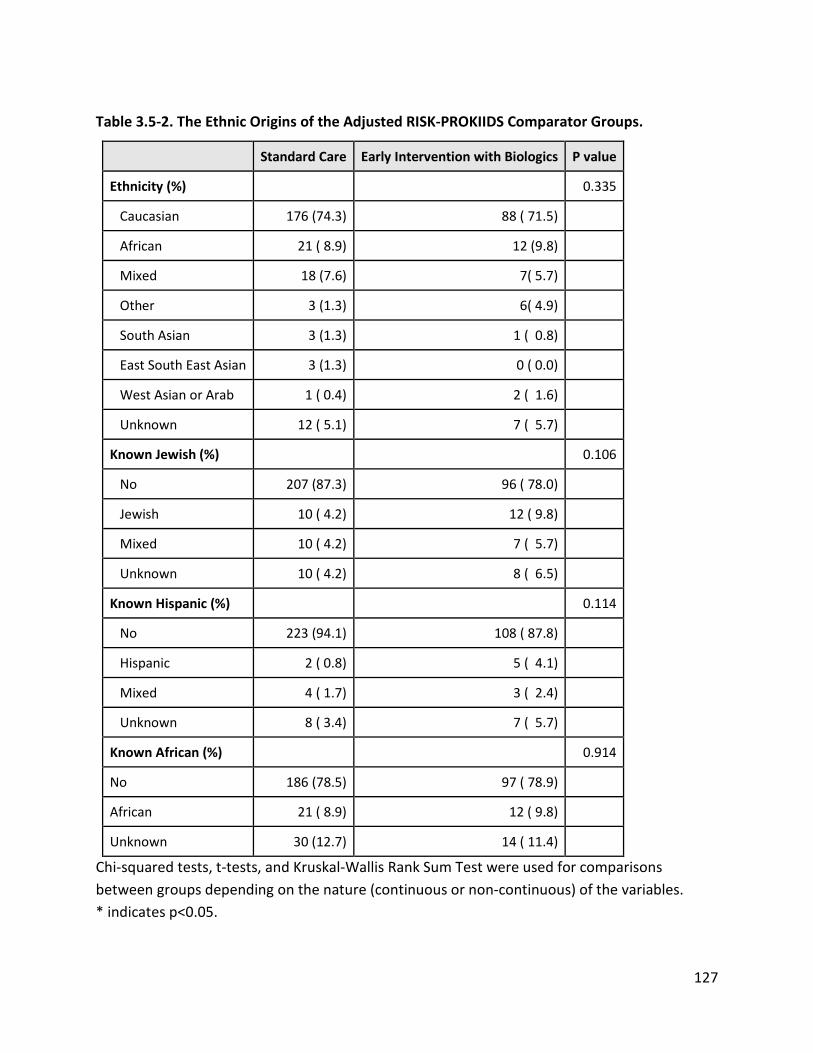
127
Table 3.5-2. The Ethnic Origins of the Adjusted RISK-PROKIIDS Comparator Groups.
Standard Care Early Intervention with Biologics P value
Ethnicity (%) 0.335
Caucasian 176 (74.3) 88 ( 71.5)
African 21 ( 8.9) 12 (9.8)
Mixed 18 (7.6) 7( 5.7)
Other 3 (1.3) 6( 4.9)
South Asian 3 (1.3) 1 ( 0.8)
East South East Asian 3 (1.3) 0 ( 0.0)
West Asian or Arab 1 ( 0.4) 2 ( 1.6)
Unknown 12 ( 5.1) 7 ( 5.7)
Known Jewish (%) 0.106
No 207 (87.3) 96 ( 78.0)
Jewish 10 ( 4.2) 12 ( 9.8)
Mixed 10 ( 4.2) 7 ( 5.7)
Unknown 10 ( 4.2) 8 ( 6.5)
Known Hispanic (%) 0.114
No 223 (94.1) 108 ( 87.8)
Hispanic 2 ( 0.8) 5 ( 4.1)
Mixed 4 ( 1.7) 3 ( 2.4)
Unknown 8 ( 3.4) 7 ( 5.7)
Known African (%) 0.914
No 186 (78.5) 97 ( 78.9)
African 21 ( 8.9) 12 ( 9.8)
Unknown 30 (12.7) 14 ( 11.4)
Chi-squared tests, t-tests, and Kruskal-Wallis Rank Sum Test were used for comparisons between groups depending on the nature (continuous or non-continuous) of the variables. * indicates p<0.05.
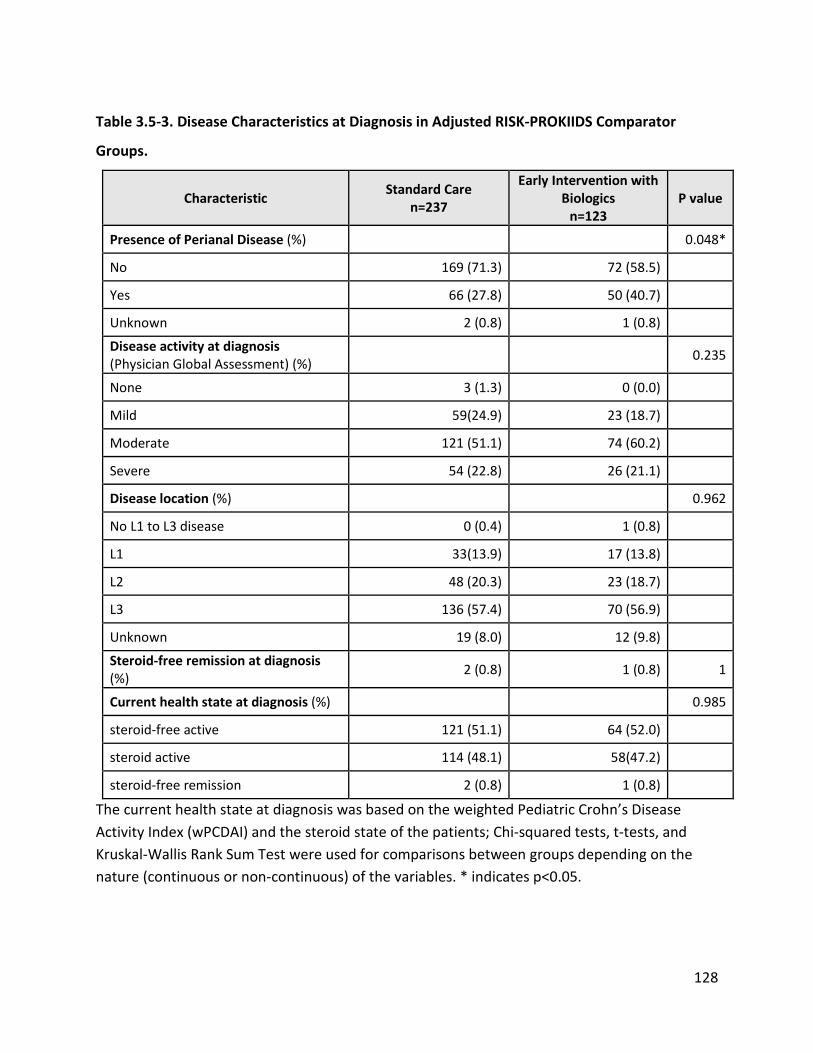
128
Table 3.5-3. Disease Characteristics at Diagnosis in Adjusted RISK-PROKIIDS Comparator
Groups.
Characteristic Standard Care n=237
Early Intervention with Biologics
n=123 P value
Presence of Perianal Disease (%) 0.048*
No 169 (71.3) 72 (58.5)
Yes 66 (27.8) 50 (40.7)
Unknown 2 (0.8) 1 (0.8)
Disease activity at diagnosis (Physician Global Assessment) (%) 0.235
None 3 (1.3) 0 (0.0)
Mild 59(24.9) 23 (18.7)
Moderate 121 (51.1) 74 (60.2)
Severe 54 (22.8) 26 (21.1)
Disease location (%) 0.962
No L1 to L3 disease 0 (0.4) 1 (0.8)
L1 33(13.9) 17 (13.8)
L2 48 (20.3) 23 (18.7)
L3 136 (57.4) 70 (56.9)
Unknown 19 (8.0) 12 (9.8)
Steroid-free remission at diagnosis (%) 2 (0.8) 1 (0.8) 1
Current health state at diagnosis (%) 0.985
steroid-free active 121 (51.1) 64 (52.0)
steroid active 114 (48.1) 58(47.2)
steroid-free remission 2 (0.8) 1 (0.8)
The current health state at diagnosis was based on the weighted Pediatric Crohn’s Disease Activity Index (wPCDAI) and the steroid state of the patients; Chi-squared tests, t-tests, and Kruskal-Wallis Rank Sum Test were used for comparisons between groups depending on the nature (continuous or non-continuous) of the variables. * indicates p<0.05.
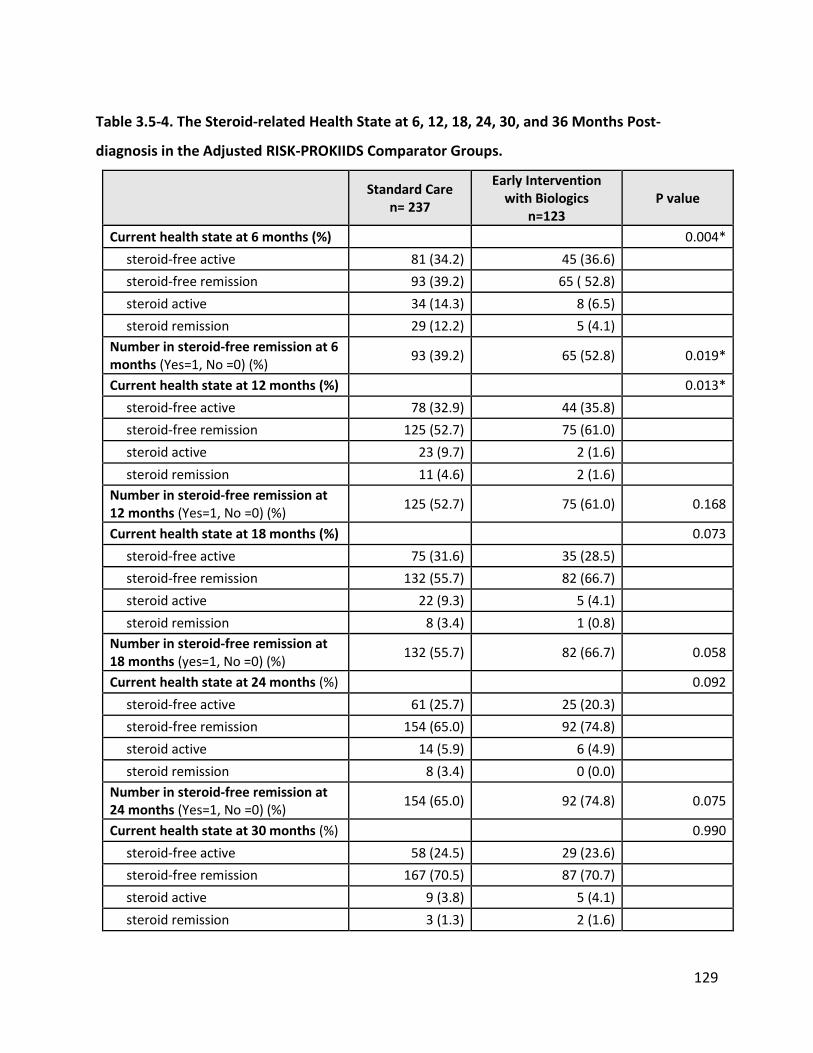
129
Table 3.5-4. The Steroid-related Health State at 6, 12, 18, 24, 30, and 36 Months Post-
diagnosis in the Adjusted RISK-PROKIIDS Comparator Groups.
Standard Care n= 237
Early Intervention with Biologics
n=123 P value
Current health state at 6 months (%) 0.004* steroid-free active 81 (34.2) 45 (36.6) steroid-free remission 93 (39.2) 65 ( 52.8) steroid active 34 (14.3) 8 (6.5) steroid remission 29 (12.2) 5 (4.1) Number in steroid-free remission at 6 months (Yes=1, No =0) (%) 93 (39.2) 65 (52.8) 0.019*
Current health state at 12 months (%) 0.013* steroid-free active 78 (32.9) 44 (35.8) steroid-free remission 125 (52.7) 75 (61.0) steroid active 23 (9.7) 2 (1.6) steroid remission 11 (4.6) 2 (1.6) Number in steroid-free remission at 12 months (Yes=1, No =0) (%) 125 (52.7) 75 (61.0) 0.168
Current health state at 18 months (%) 0.073 steroid-free active 75 (31.6) 35 (28.5) steroid-free remission 132 (55.7) 82 (66.7) steroid active 22 (9.3) 5 (4.1) steroid remission 8 (3.4) 1 (0.8) Number in steroid-free remission at 18 months (yes=1, No =0) (%) 132 (55.7) 82 (66.7) 0.058
Current health state at 24 months (%) 0.092 steroid-free active 61 (25.7) 25 (20.3) steroid-free remission 154 (65.0) 92 (74.8) steroid active 14 (5.9) 6 (4.9) steroid remission 8 (3.4) 0 (0.0) Number in steroid-free remission at 24 months (Yes=1, No =0) (%) 154 (65.0) 92 (74.8) 0.075
Current health state at 30 months (%) 0.990 steroid-free active 58 (24.5) 29 (23.6) steroid-free remission 167 (70.5) 87 (70.7) steroid active 9 (3.8) 5 (4.1) steroid remission 3 (1.3) 2 (1.6)
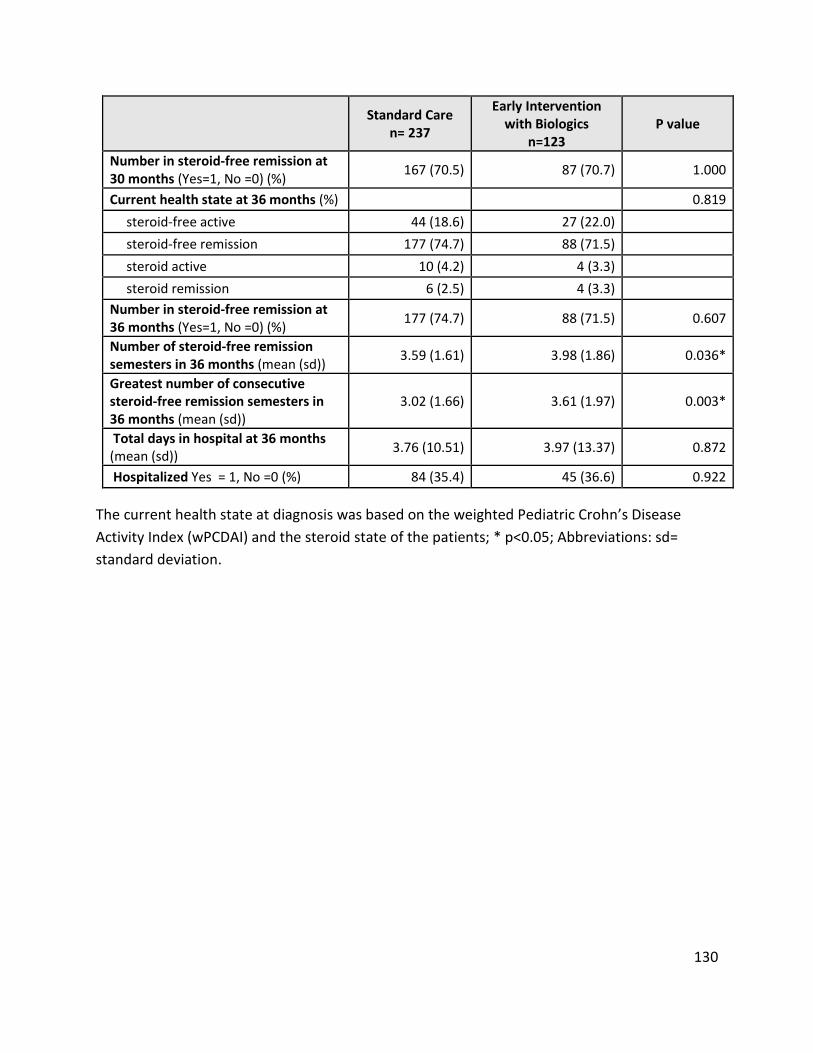
130
Standard Care n= 237
Early Intervention with Biologics
n=123 P value
Number in steroid-free remission at 30 months (Yes=1, No =0) (%) 167 (70.5) 87 (70.7) 1.000
Current health state at 36 months (%) 0.819 steroid-free active 44 (18.6) 27 (22.0) steroid-free remission 177 (74.7) 88 (71.5) steroid active 10 (4.2) 4 (3.3) steroid remission 6 (2.5) 4 (3.3) Number in steroid-free remission at 36 months (Yes=1, No =0) (%) 177 (74.7) 88 (71.5) 0.607
Number of steroid-free remission semesters in 36 months (mean (sd)) 3.59 (1.61) 3.98 (1.86) 0.036*
Greatest number of consecutive steroid-free remission semesters in 36 months (mean (sd))
3.02 (1.66) 3.61 (1.97) 0.003*
Total days in hospital at 36 months (mean (sd)) 3.76 (10.51) 3.97 (13.37) 0.872
Hospitalized Yes = 1, No =0 (%) 84 (35.4) 45 (36.6) 0.922
The current health state at diagnosis was based on the weighted Pediatric Crohn’s Disease Activity Index (wPCDAI) and the steroid state of the patients; * p<0.05; Abbreviations: sd= standard deviation.
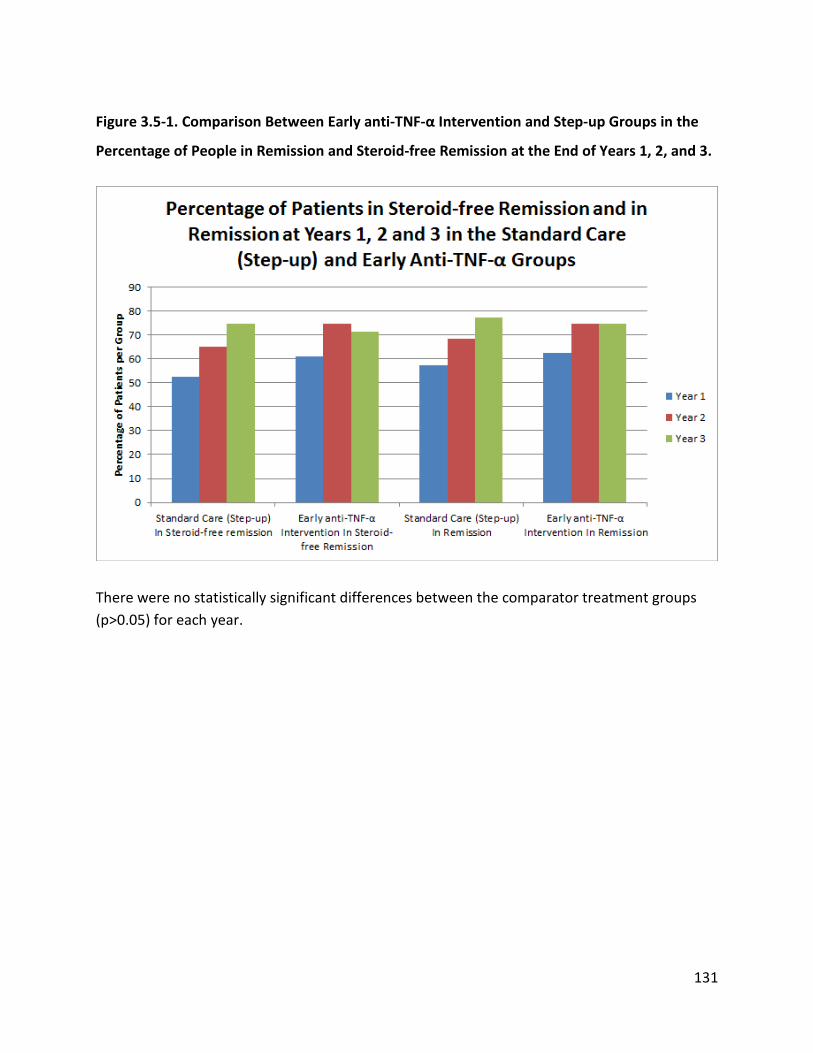
131
Figure 3.5-1. Comparison Between Early anti-TNF-α Intervention and Step-up Groups in the
Percentage of People in Remission and Steroid-free Remission at the End of Years 1, 2, and 3.
There were no statistically significant differences between the comparator treatment groups (p>0.05) for each year.
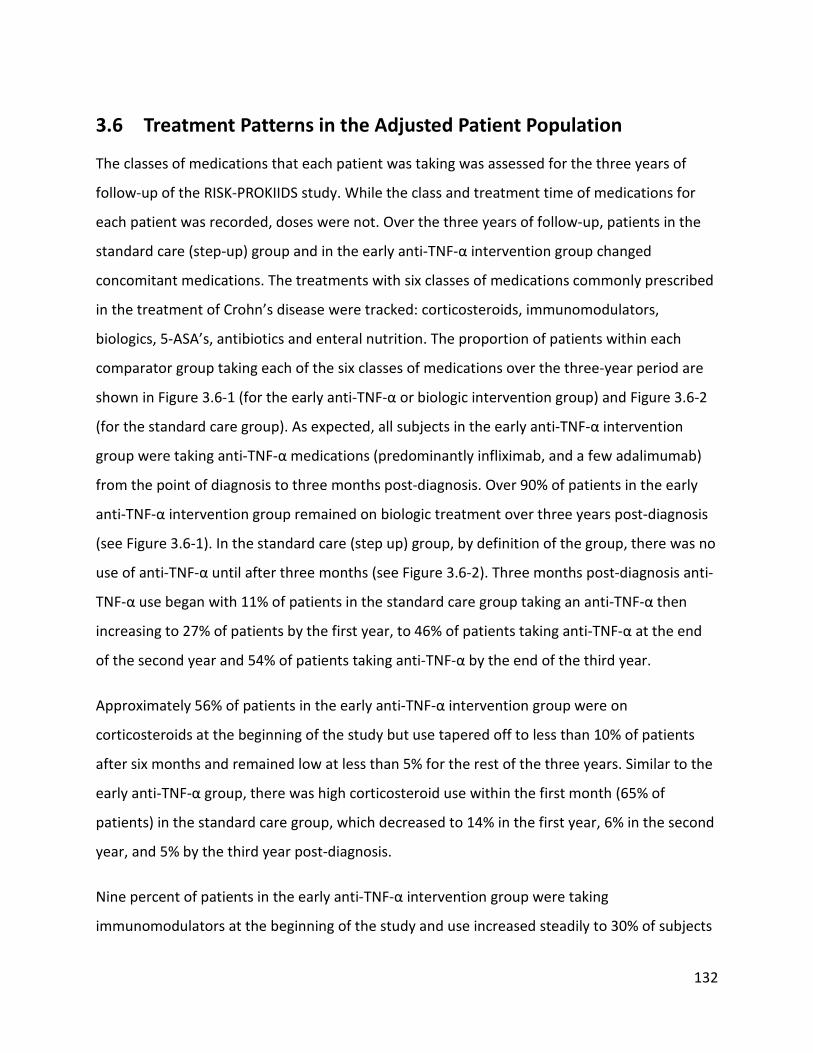
132
3.6 Treatment Patterns in the Adjusted Patient Population
The classes of medications that each patient was taking was assessed for the three years of
follow-up of the RISK-PROKIIDS study. While the class and treatment time of medications for
each patient was recorded, doses were not. Over the three years of follow-up, patients in the
standard care (step-up) group and in the early anti-TNF-α intervention group changed
concomitant medications. The treatments with six classes of medications commonly prescribed
in the treatment of Crohn’s disease were tracked: corticosteroids, immunomodulators,
biologics, 5-ASA’s, antibiotics and enteral nutrition. The proportion of patients within each
comparator group taking each of the six classes of medications over the three-year period are
shown in Figure 3.6-1 (for the early anti-TNF-α or biologic intervention group) and Figure 3.6-2
(for the standard care group). As expected, all subjects in the early anti-TNF-α intervention
group were taking anti-TNF-α medications (predominantly infliximab, and a few adalimumab)
from the point of diagnosis to three months post-diagnosis. Over 90% of patients in the early
anti-TNF-α intervention group remained on biologic treatment over three years post-diagnosis
(see Figure 3.6-1). In the standard care (step up) group, by definition of the group, there was no
use of anti-TNF-α until after three months (see Figure 3.6-2). Three months post-diagnosis anti-
TNF-α use began with 11% of patients in the standard care group taking an anti-TNF-α then
increasing to 27% of patients by the first year, to 46% of patients taking anti-TNF-α at the end
of the second year and 54% of patients taking anti-TNF-α by the end of the third year.
Approximately 56% of patients in the early anti-TNF-α intervention group were on
corticosteroids at the beginning of the study but use tapered off to less than 10% of patients
after six months and remained low at less than 5% for the rest of the three years. Similar to the
early anti-TNF-α group, there was high corticosteroid use within the first month (65% of
patients) in the standard care group, which decreased to 14% in the first year, 6% in the second
year, and 5% by the third year post-diagnosis.
Nine percent of patients in the early anti-TNF-α intervention group were taking
immunomodulators at the beginning of the study and use increased steadily to 30% of subjects
133
by nine months and 39% by three years. In the standard care group, as expected
immunomodulator use was higher than in the early anti-TNF-α group with 59% of patients on
immunomodulators at the end of the first year, and decreasing only slightly to 54% of patients
taking immunomodulators by the end of the third year after diagnosis.
Enteral nutrition use in the early anti-TNF-α intervention group started at 2% of patients at the
beginning of the study but by the end of three years, no patients in this group were using
enteral nutrition as a form of treatment. Enteral nutrition use started with 7% of patients using
enteral nutrition in the first month decreasing to 2% by the end of the third year.
Forty-one percent of patients in the early anti-TNF-α intervention group were taking antibiotics
at the beginning of the study and use of antibiotics decreased to 20% by 3 months and to 5% by
three years. Antibiotic use in the standard care group started with 27% of patients on
antibiotics in the first month after diagnosis and decreased to 14% of patients taking antibiotics
by the end of the third year following diagnosis.
The use of 5-ASAs remained fairly constant from 15% of patients in the early anti-TNF-α
intervention group to 10% at three years. There was a much greater percentage of patients on
5-ASAs in the standard care group than the early anti-TNF-α group throughout the three years
of the study with 34% of patients on 5-ASA in the first month after diagnosis and 27% of
patients on 5-ASAs at the end of three years after diagnosis.
The differences in drug use between the early anti-TNF-α group and the standard care (step
up) group was reflected in the difference in drug costs between the two comparator groups in
the cost-effectiveness analysis. The proportion of patients on a particular drug class informed
the total cost of drugs for each comparator group at a given time.
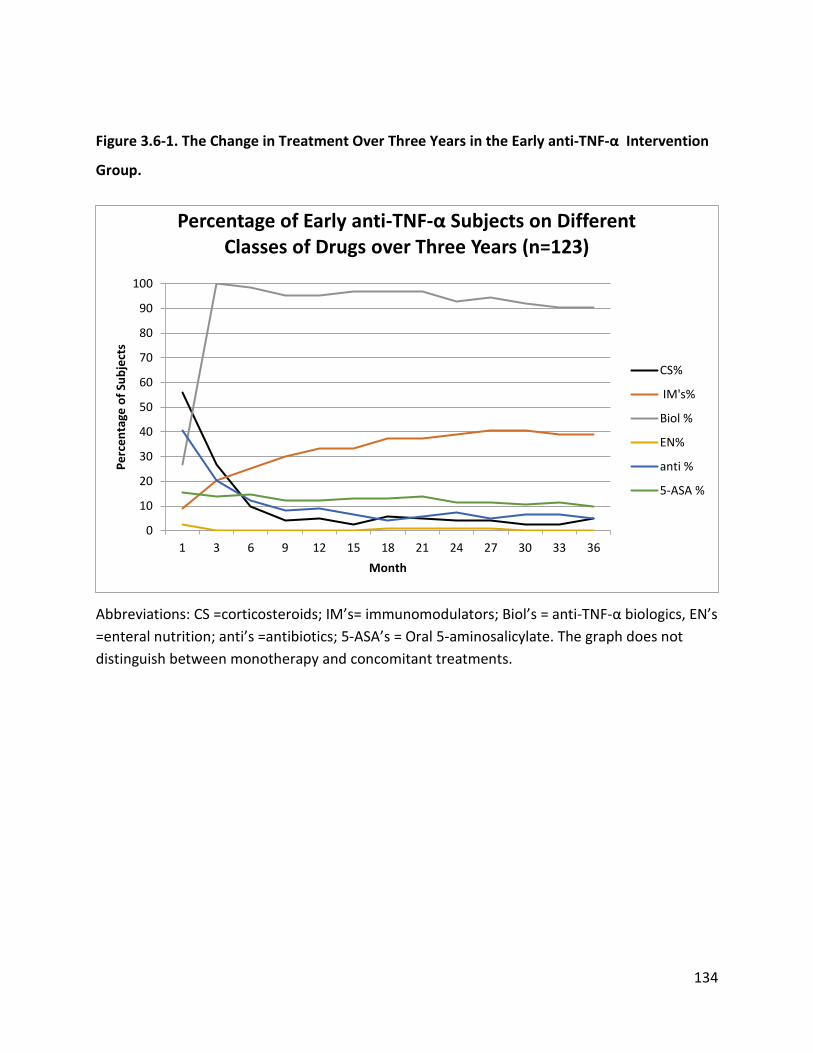
134
Figure 3.6-1. The Change in Treatment Over Three Years in the Early anti-TNF-α Intervention
Group.
Abbreviations: CS =corticosteroids; IM’s= immunomodulators; Biol’s = anti-TNF-α biologics, EN’s =enteral nutrition; anti’s =antibiotics; 5-ASA’s = Oral 5-aminosalicylate. The graph does not distinguish between monotherapy and concomitant treatments.
0
10
20
30
40
50
60
70
80
90
100
1 3 6 9 12 15 18 21 24 27 30 33 36
Perc
enta
ge o
f Sub
ject
s
Month
Percentage of Early anti-TNF-α Subjects on Different Classes of Drugs over Three Years (n=123)
CS%
IM's%
Biol %
EN%
anti %
5-ASA %
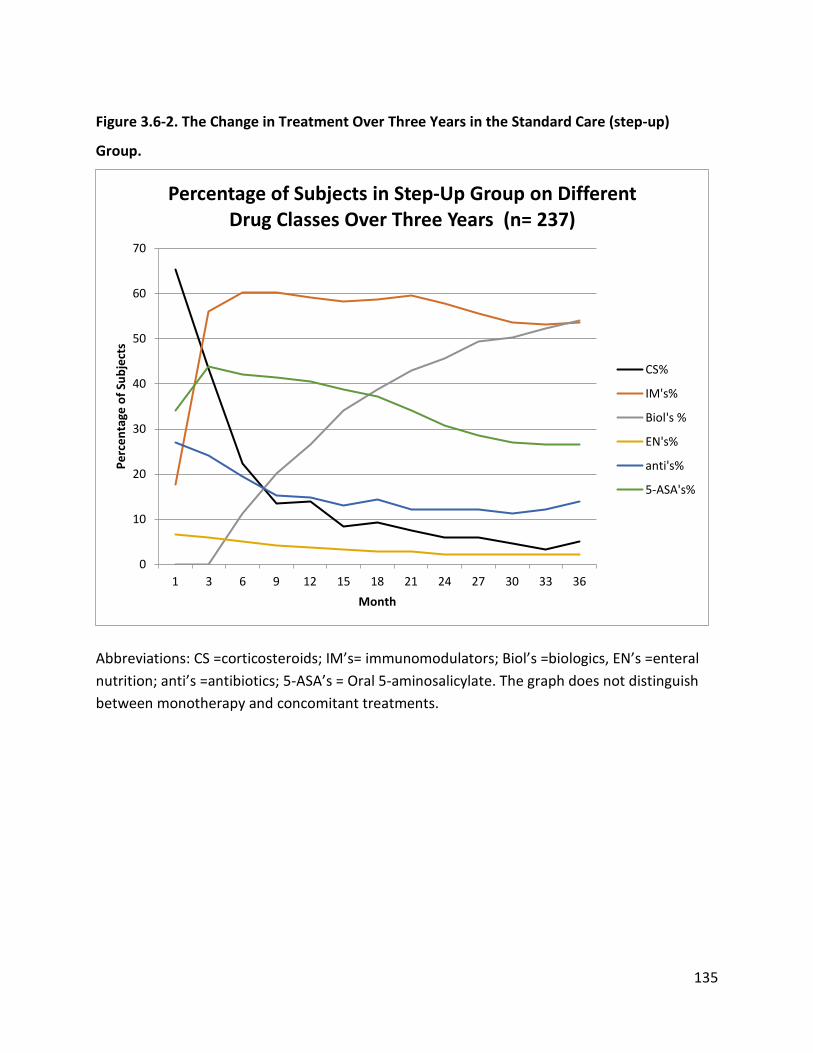
135
Figure 3.6-2. The Change in Treatment Over Three Years in the Standard Care (step-up)
Group.
Abbreviations: CS =corticosteroids; IM’s= immunomodulators; Biol’s =biologics, EN’s =enteral nutrition; anti’s =antibiotics; 5-ASA’s = Oral 5-aminosalicylate. The graph does not distinguish between monotherapy and concomitant treatments.
0
10
20
30
40
50
60
70
1 3 6 9 12 15 18 21 24 27 30 33 36
Perc
enta
ge o
f Sub
ject
s
Month
Percentage of Subjects in Step-Up Group on Different Drug Classes Over Three Years (n= 237)
CS%
IM's%
Biol's %
EN's%
anti's%
5-ASA's%
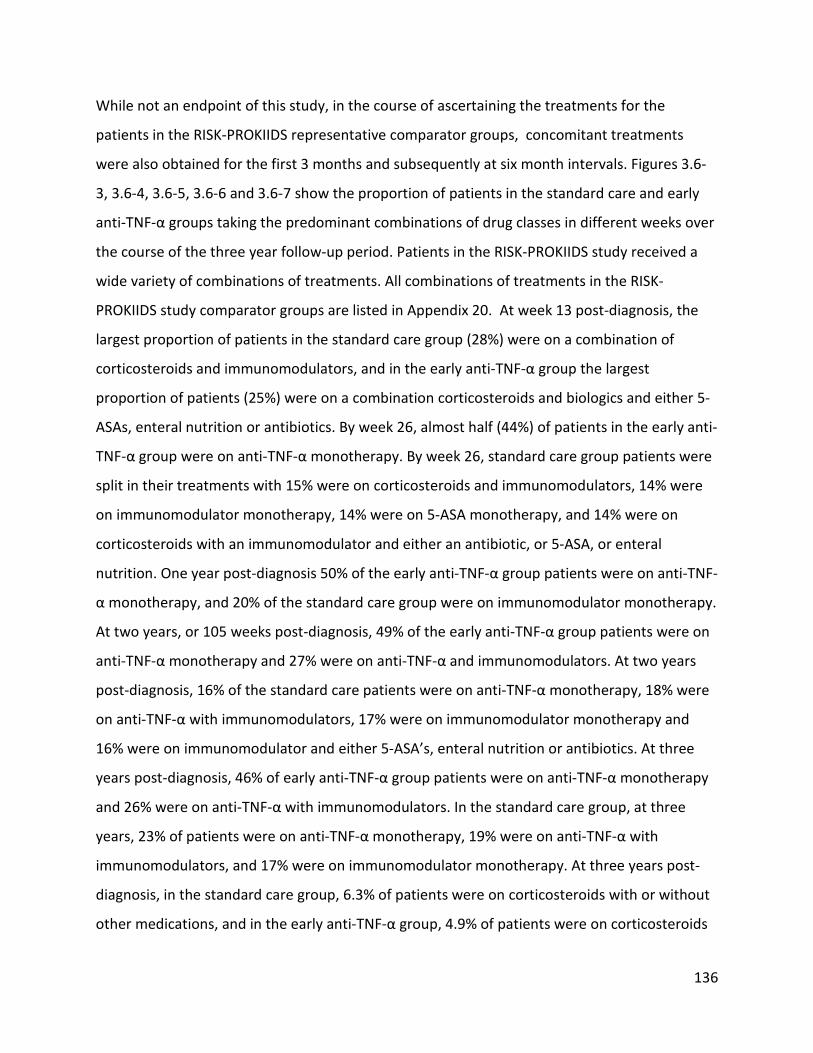
136
While not an endpoint of this study, in the course of ascertaining the treatments for the
patients in the RISK-PROKIIDS representative comparator groups, concomitant treatments
were also obtained for the first 3 months and subsequently at six month intervals. Figures 3.6-
3, 3.6-4, 3.6-5, 3.6-6 and 3.6-7 show the proportion of patients in the standard care and early
anti-TNF-α groups taking the predominant combinations of drug classes in different weeks over
the course of the three year follow-up period. Patients in the RISK-PROKIIDS study received a
wide variety of combinations of treatments. All combinations of treatments in the RISK-
PROKIIDS study comparator groups are listed in Appendix 20. At week 13 post-diagnosis, the
largest proportion of patients in the standard care group (28%) were on a combination of
corticosteroids and immunomodulators, and in the early anti-TNF-α group the largest
proportion of patients (25%) were on a combination corticosteroids and biologics and either 5-
ASAs, enteral nutrition or antibiotics. By week 26, almost half (44%) of patients in the early anti-
TNF-α group were on anti-TNF-α monotherapy. By week 26, standard care group patients were
split in their treatments with 15% were on corticosteroids and immunomodulators, 14% were
on immunomodulator monotherapy, 14% were on 5-ASA monotherapy, and 14% were on
corticosteroids with an immunomodulator and either an antibiotic, or 5-ASA, or enteral
nutrition. One year post-diagnosis 50% of the early anti-TNF-α group patients were on anti-TNF-
α monotherapy, and 20% of the standard care group were on immunomodulator monotherapy.
At two years, or 105 weeks post-diagnosis, 49% of the early anti-TNF-α group patients were on
anti-TNF-α monotherapy and 27% were on anti-TNF-α and immunomodulators. At two years
post-diagnosis, 16% of the standard care patients were on anti-TNF-α monotherapy, 18% were
on anti-TNF-α with immunomodulators, 17% were on immunomodulator monotherapy and
16% were on immunomodulator and either 5-ASA’s, enteral nutrition or antibiotics. At three
years post-diagnosis, 46% of early anti-TNF-α group patients were on anti-TNF-α monotherapy
and 26% were on anti-TNF-α with immunomodulators. In the standard care group, at three
years, 23% of patients were on anti-TNF-α monotherapy, 19% were on anti-TNF-α with
immunomodulators, and 17% were on immunomodulator monotherapy. At three years post-
diagnosis, in the standard care group, 6.3% of patients were on corticosteroids with or without
other medications, and in the early anti-TNF-α group, 4.9% of patients were on corticosteroids
137
with or without other medications. This suggests a slightly decreased use of steroids in the early
anti-TNF-α intervention group.
Overall, these results show that anti-TNF-α monotherapy was preferred in the RISK-PROKIIDS
patients over anti-TNF-α combination therapy. In the standard care group, immunomodulator
monotherapy is slightly preferred over immunomodulator combination therapy. The results
also show that treatment among RISK-PROKIIDS patients is quite varied with over twenty
combinations of treatments at any given time and as a result, drug costs for each comparator
group were also quite varied. Over time, treatment combinations were expected to change to
reflect the difference between induction therapy to induce remission and then maintenance
therapy to maintain remission. The cost-effectiveness analysis, presented in the next section,
accounted for changes in treatments over time.
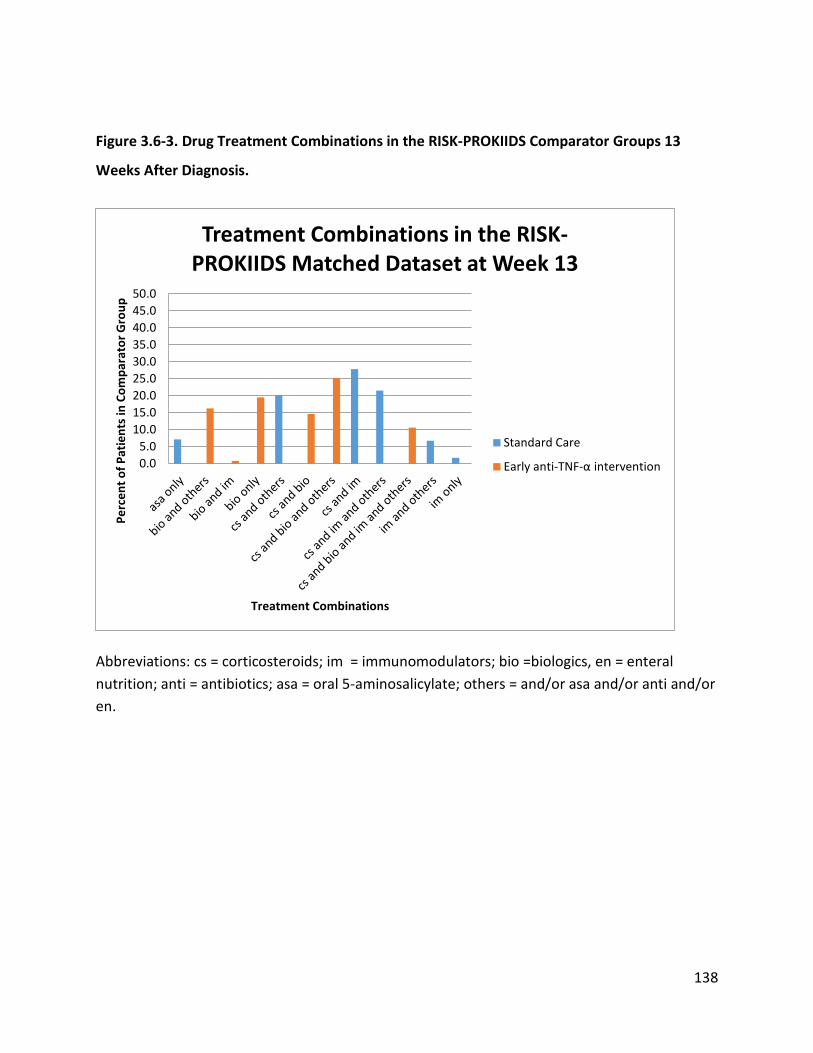
138
Figure 3.6-3. Drug Treatment Combinations in the RISK-PROKIIDS Comparator Groups 13
Weeks After Diagnosis.
Abbreviations: cs = corticosteroids; im = immunomodulators; bio =biologics, en = enteral nutrition; anti = antibiotics; asa = oral 5-aminosalicylate; others = and/or asa and/or anti and/or en.
0.05.0
10.015.020.025.030.035.040.045.050.0
Perc
ent o
f Pat
ient
s in
Com
para
tor G
roup
Treatment Combinations
Treatment Combinations in the RISK-PROKIIDS Matched Dataset at Week 13
Standard Care
Early anti-TNF-α intervention
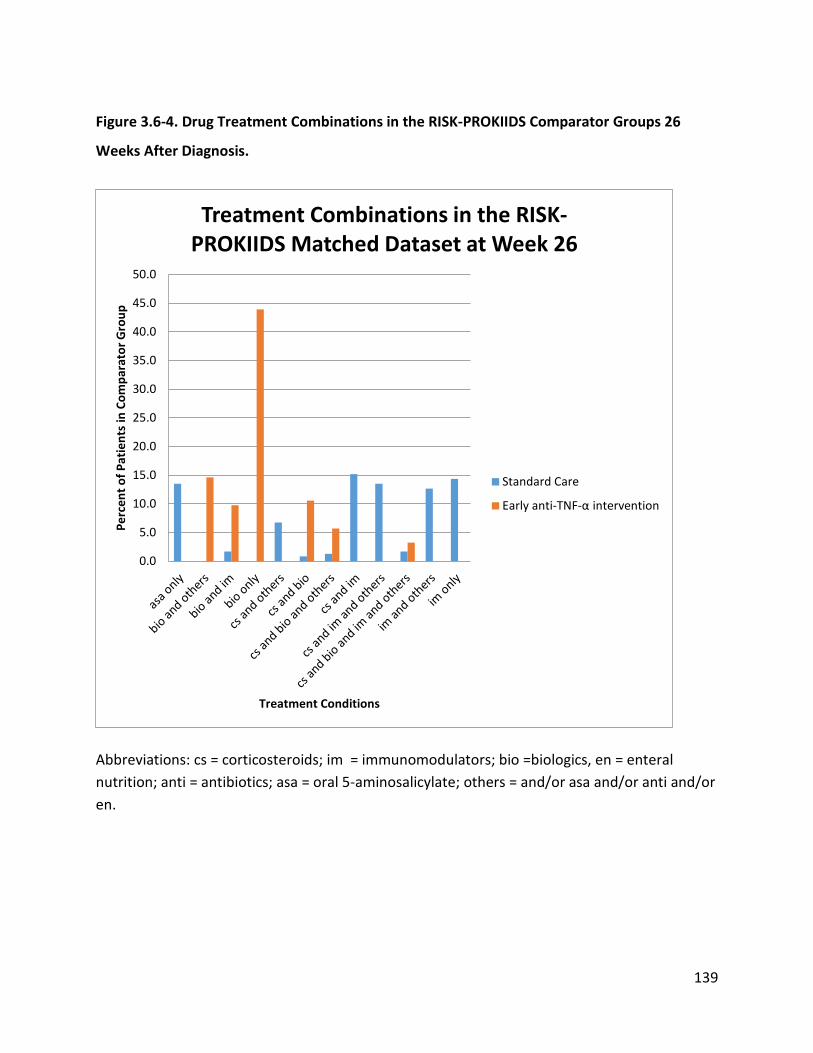
139
Figure 3.6-4. Drug Treatment Combinations in the RISK-PROKIIDS Comparator Groups 26
Weeks After Diagnosis.
Abbreviations: cs = corticosteroids; im = immunomodulators; bio =biologics, en = enteral nutrition; anti = antibiotics; asa = oral 5-aminosalicylate; others = and/or asa and/or anti and/or en.
0.0
5.0
10.0
15.0
20.0
25.0
30.0
35.0
40.0
45.0
50.0
Perc
ent o
f Pat
ient
s in
Com
para
tor G
roup
Treatment Conditions
Treatment Combinations in the RISK-PROKIIDS Matched Dataset at Week 26
Standard Care
Early anti-TNF-α intervention
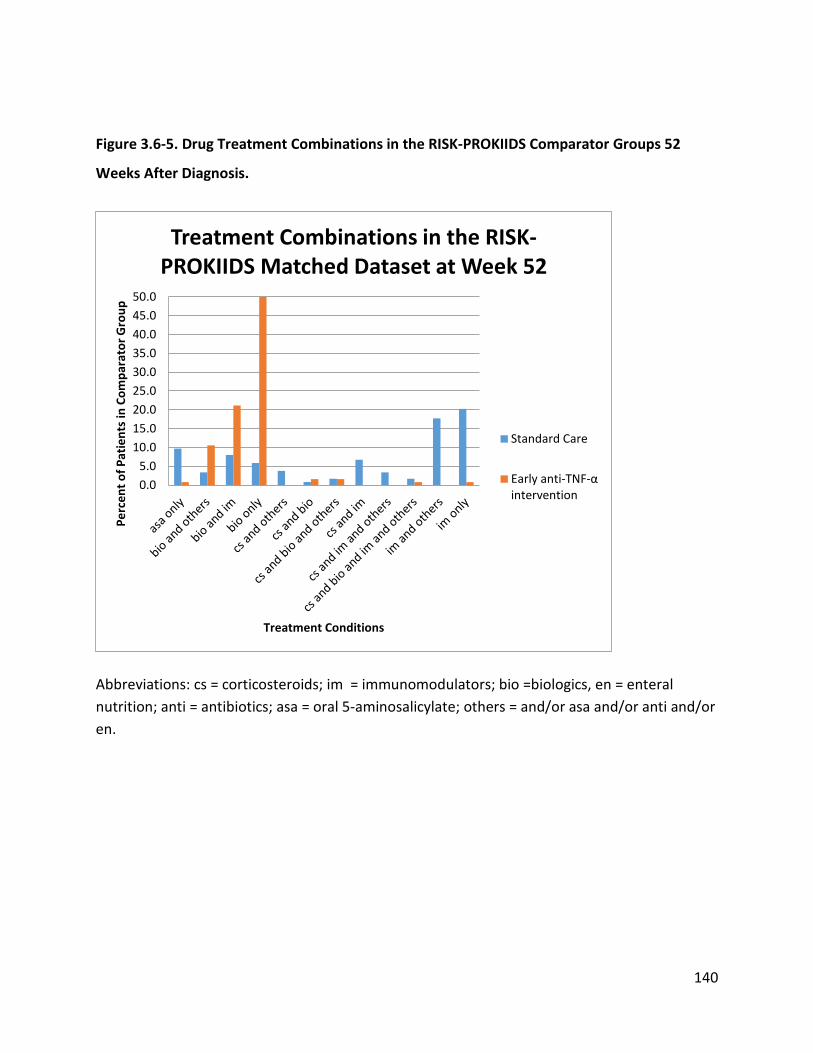
140
Figure 3.6-5. Drug Treatment Combinations in the RISK-PROKIIDS Comparator Groups 52
Weeks After Diagnosis.
Abbreviations: cs = corticosteroids; im = immunomodulators; bio =biologics, en = enteral nutrition; anti = antibiotics; asa = oral 5-aminosalicylate; others = and/or asa and/or anti and/or en.
0.05.0
10.015.020.025.030.035.040.045.050.0
Perc
ent o
f Pat
ient
s in
Com
para
tor G
roup
Treatment Conditions
Treatment Combinations in the RISK-PROKIIDS Matched Dataset at Week 52
Standard Care
Early anti-TNF-α intervention
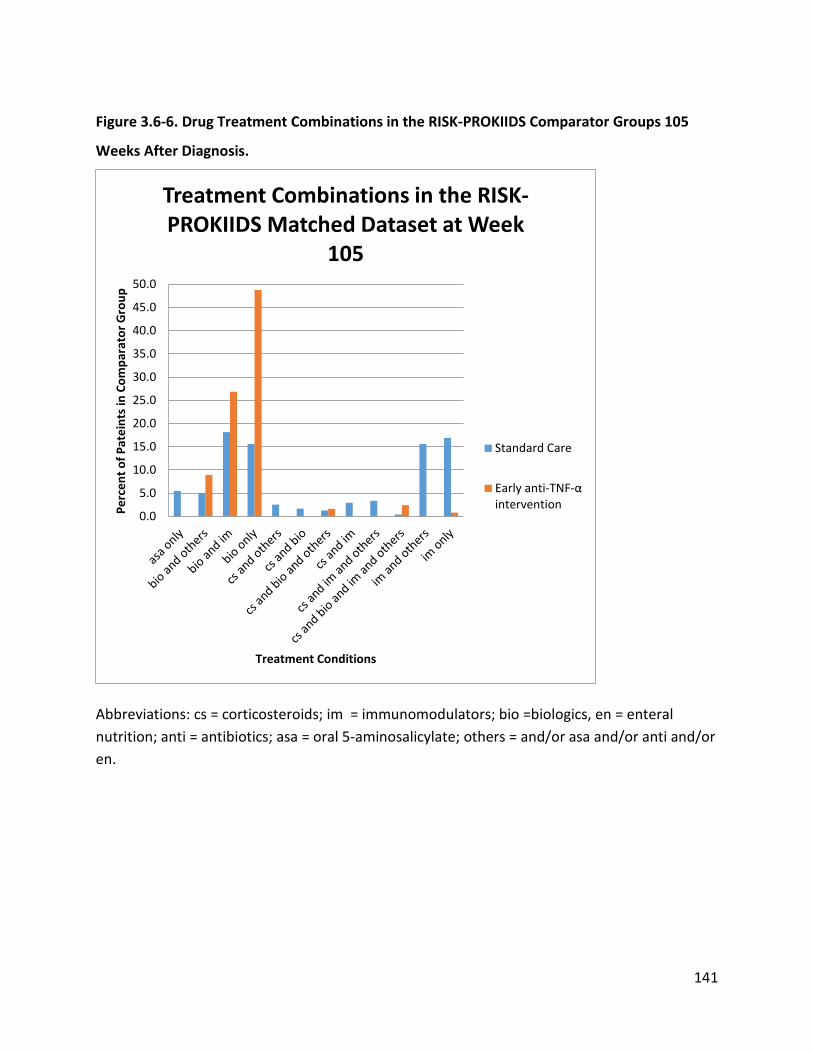
141
Figure 3.6-6. Drug Treatment Combinations in the RISK-PROKIIDS Comparator Groups 105
Weeks After Diagnosis.
Abbreviations: cs = corticosteroids; im = immunomodulators; bio =biologics, en = enteral nutrition; anti = antibiotics; asa = oral 5-aminosalicylate; others = and/or asa and/or anti and/or en.
0.0
5.0
10.0
15.0
20.0
25.0
30.0
35.0
40.0
45.0
50.0
Perc
ent o
f Pat
eint
s in
Com
para
tor G
roup
Treatment Conditions
Treatment Combinations in the RISK-PROKIIDS Matched Dataset at Week
105
Standard Care
Early anti-TNF-α intervention
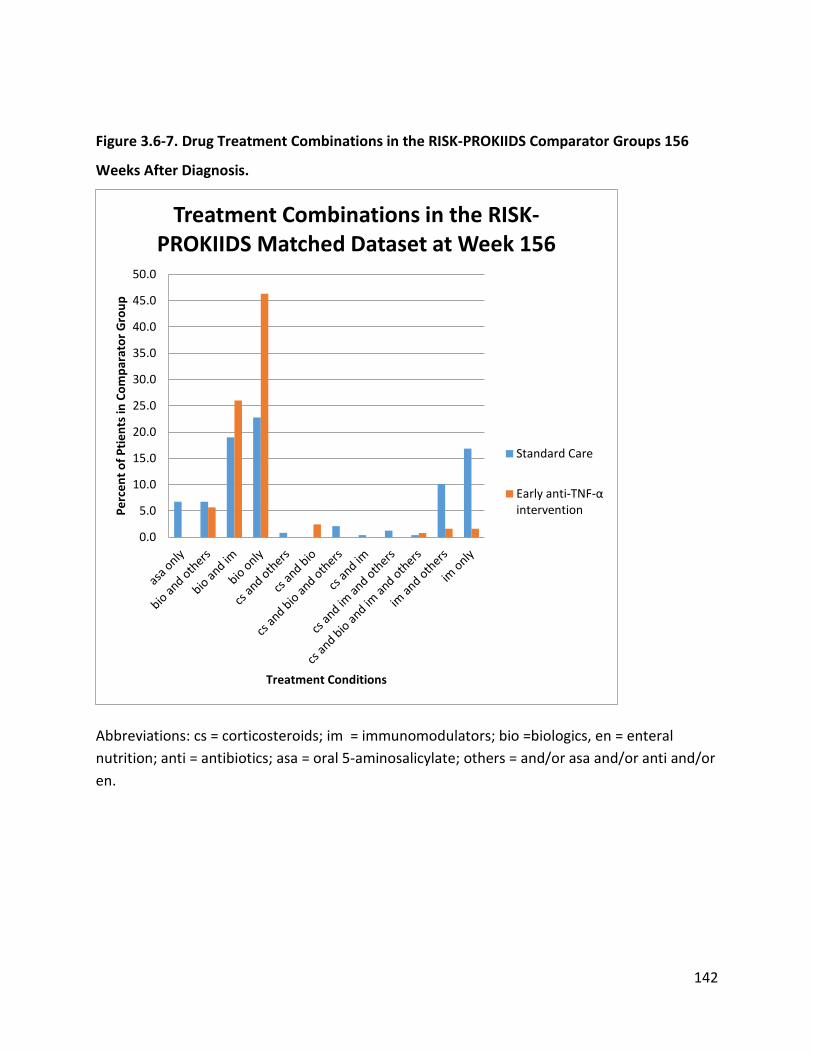
142
Figure 3.6-7. Drug Treatment Combinations in the RISK-PROKIIDS Comparator Groups 156
Weeks After Diagnosis.
Abbreviations: cs = corticosteroids; im = immunomodulators; bio =biologics, en = enteral nutrition; anti = antibiotics; asa = oral 5-aminosalicylate; others = and/or asa and/or anti and/or en.
0.0
5.0
10.0
15.0
20.0
25.0
30.0
35.0
40.0
45.0
50.0
Perc
ent o
f Ptie
nts i
n Co
mpa
rato
r Gro
up
Treatment Conditions
Treatment Combinations in the RISK-PROKIIDS Matched Dataset at Week 156
Standard Care
Early anti-TNF-α intervention

143
3.7 Cost-effectiveness Analysis
The goal of the work so far was to prepare inputs to inform the cost-effectiveness analysis of
early intervention (intervention within the first three months of diagnosis) with anti-TNF-α
compared to standard step-up care where anti-TNF-α can be introduced only after the first
three months of diagnosis in newly diagnosed pediatric patients with moderate to severe
Crohn’s disease. Where patient level data was needed to inform transition probabilities or
costs, the propensity score matched RISK-PROKIIDS data set (assembled using the Across
method) was used for the results shown below.
Using a Markov two-dimensional microsimulation model, which modeled the movement of
Crohn’s disease patients between states of remission and active disease, the incremental cost
per week in steroid-free remission of early anti-TNF-α intervention was determined. The
incremental cost per additional week in steroid-free medical remission was the representative
incremental cost effectiveness ratio (ICER) for the primary cost-effectiveness analysis.
Healthcare public payer, and societal perspectives were examined and are described below. In
addition to determining the incremental cost per additional week in steroid-free medical
remission, the incremental cost per additional week in medical remission irrespective of steroid
use was also determined as a secondary analysis.
3.7.1 Cost-effectiveness in the Healthcare Public Payer Reference (Base) Case
The Ontario public health care system was used to represent the health care public payer. A
discount rate of 1.5% and a three-year time horizon were used for the reference case. The
seven health states of “active disease”, “active disease experiencing adverse events of special
interest”, “active disease requiring surgery or hospitalization”, “medical remission”, “surgical
remission”, “surgical complications” and “death” were modelled in the Markov microsimulation
model (see Figure 2.5.6.1-1 for the health state transition diagram). The number of weeks (or
cycles) in medical remission without taking corticosteroids was the primary effectiveness
outcome. Costs and outcomes for the early anti-TNF-α treatment and standard care treatment
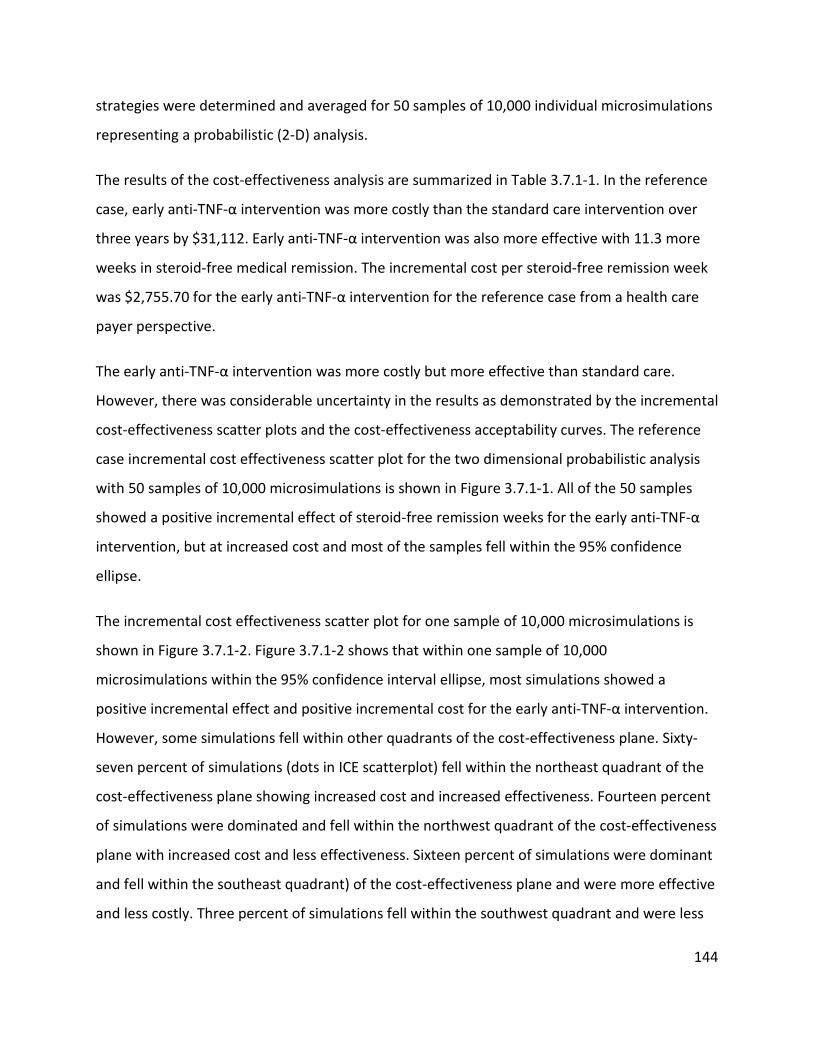
144
strategies were determined and averaged for 50 samples of 10,000 individual microsimulations
representing a probabilistic (2-D) analysis.
The results of the cost-effectiveness analysis are summarized in Table 3.7.1-1. In the reference
case, early anti-TNF-α intervention was more costly than the standard care intervention over
three years by $31,112. Early anti-TNF-α intervention was also more effective with 11.3 more
weeks in steroid-free medical remission. The incremental cost per steroid-free remission week
was $2,755.70 for the early anti-TNF-α intervention for the reference case from a health care
payer perspective.
The early anti-TNF-α intervention was more costly but more effective than standard care.
However, there was considerable uncertainty in the results as demonstrated by the incremental
cost-effectiveness scatter plots and the cost-effectiveness acceptability curves. The reference
case incremental cost effectiveness scatter plot for the two dimensional probabilistic analysis
with 50 samples of 10,000 microsimulations is shown in Figure 3.7.1-1. All of the 50 samples
showed a positive incremental effect of steroid-free remission weeks for the early anti-TNF-α
intervention, but at increased cost and most of the samples fell within the 95% confidence
ellipse.
The incremental cost effectiveness scatter plot for one sample of 10,000 microsimulations is
shown in Figure 3.7.1-2. Figure 3.7.1-2 shows that within one sample of 10,000
microsimulations within the 95% confidence interval ellipse, most simulations showed a
positive incremental effect and positive incremental cost for the early anti-TNF-α intervention.
However, some simulations fell within other quadrants of the cost-effectiveness plane. Sixty-
seven percent of simulations (dots in ICE scatterplot) fell within the northeast quadrant of the
cost-effectiveness plane showing increased cost and increased effectiveness. Fourteen percent
of simulations were dominated and fell within the northwest quadrant of the cost-effectiveness
plane with increased cost and less effectiveness. Sixteen percent of simulations were dominant
and fell within the southeast quadrant) of the cost-effectiveness plane and were more effective
and less costly. Three percent of simulations fell within the southwest quadrant and were less

145
costly and less effective. The scattering of simulations in all quadrants from the one-
dimensional microsimulation indicates that there is uncertainty within the results. For this
particular sample, of 10,000 microsimulations, the incremental cost for early anti-TNF-α
intervention was $30,448 (95%CI -36708, 117,265), the incremental effect was 11.19 (95%CI -
31.04, 47.97) steroid-free remission weeks, and the incremental cost-effectiveness ratio was
$2,720 per additional week in steroid-free remission.
The use of tracker variables in the microsimulation model allowed the tracking of individuals as
they went through the model and allowed the determination of how many individuals
experienced various events such as surgery, death, and adverse events. The wide confidence
interval for the incremental cost in Table 3.7.1-1 reflects the large range of costs incurred by
individuals in each comparator arm. Higher costs were accrued by individuals that experienced
surgeries, or multiple adverse events in either comparator group.
The cost-effectiveness acceptability curve from the 2-D microsimulation for the reference case
from a health care payer perspective is shown in Figure 3.7.1-3. These curves, reflective of
uncertainty in the ICER, represent the proportion of microsimulations wherein each strategy is
cost-effective (the dollar value of effectiveness exceeds the costs) over a range of willingness-
to-pay thresholds. The curve shows that the standard care intervention was cost-effective
below a willingness-to-pay threshold of $2,000 per week in steroid-free remission, but above
this threshold, the early anti-TNF-α intervention does become cost-effective in some iterations.
At a willingness-to-pay threshold of approximately $3,500 per week in steroid-free remission,
neither strategy is dominant over the other as both strategies are cost-effective 50% of the
time. Above a willingness to pay threshold of $3,500, the early anti-TNF-α intervention
becomes cost-effective an increasing number of times compared to the standard care strategy.
Above a willingness-to-pay of $6,000 per week in steroid-free remission, the early anti-TNF-α
intervention becomes the dominant cost-effective strategy.
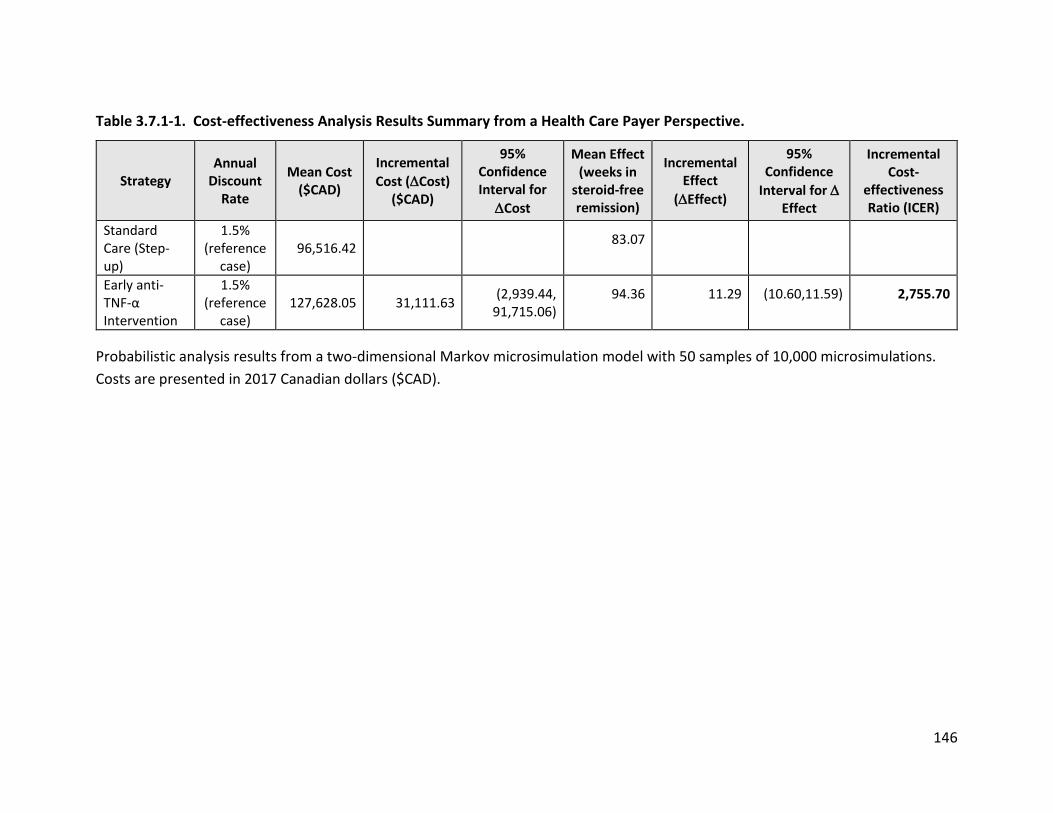
146
Table 3.7.1-1. Cost-effectiveness Analysis Results Summary from a Health Care Payer Perspective.
Strategy Annual
Discount Rate
Mean Cost ($CAD)
Incremental Cost (∆Cost)
($CAD)
95% Confidence Interval for
∆Cost
Mean Effect (weeks in
steroid-free remission)
Incremental Effect
(∆Effect)
95% Confidence
Interval for ∆ Effect
Incremental Cost-
effectiveness Ratio (ICER)
Standard Care (Step-up)
1.5% (reference
case)
96,516.42
83.07
Early anti-TNF-α Intervention
1.5% (reference
case)
127,628.05
31,111.63
(2,939.44, 91,715.06)
94.36
11.29
(10.60,11.59)
2,755.70
Probabilistic analysis results from a two-dimensional Markov microsimulation model with 50 samples of 10,000 microsimulations. Costs are presented in 2017 Canadian dollars ($CAD).
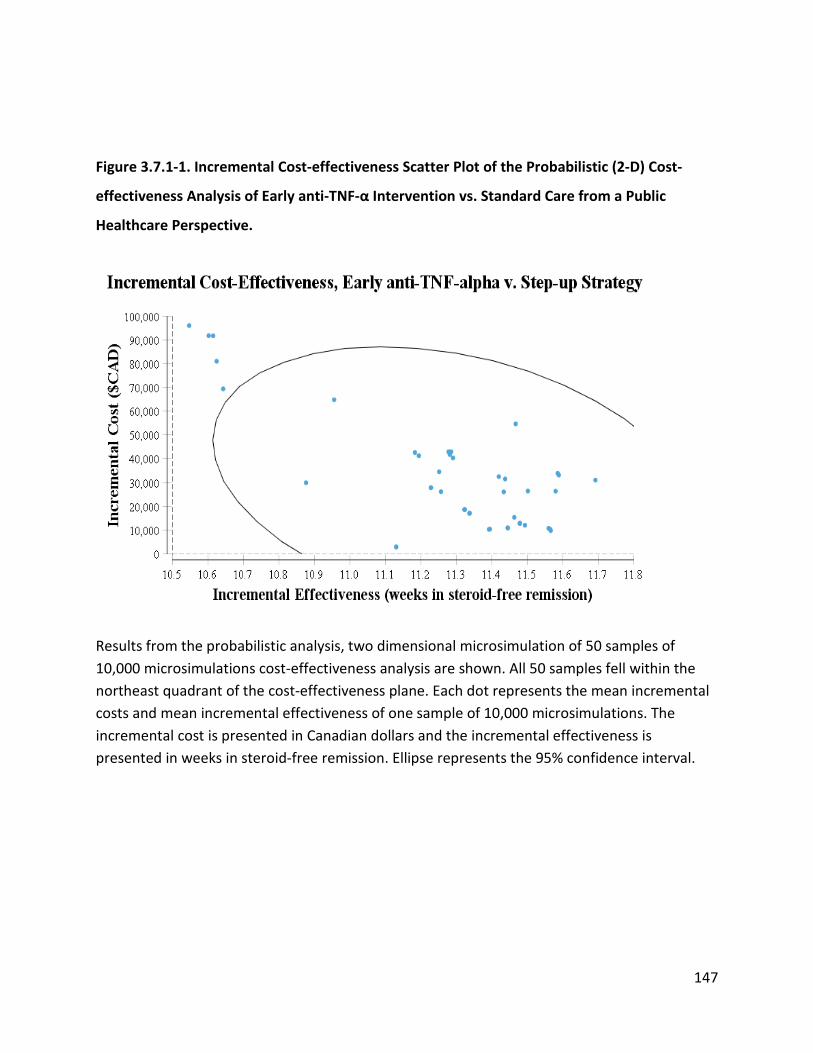
147
Figure 3.7.1-1. Incremental Cost-effectiveness Scatter Plot of the Probabilistic (2-D) Cost-
effectiveness Analysis of Early anti-TNF-α Intervention vs. Standard Care from a Public
Healthcare Perspective.
Results from the probabilistic analysis, two dimensional microsimulation of 50 samples of 10,000 microsimulations cost-effectiveness analysis are shown. All 50 samples fell within the northeast quadrant of the cost-effectiveness plane. Each dot represents the mean incremental costs and mean incremental effectiveness of one sample of 10,000 microsimulations. The incremental cost is presented in Canadian dollars and the incremental effectiveness is presented in weeks in steroid-free remission. Ellipse represents the 95% confidence interval.
148
Figure 3.7.1-2. Incremental Cost-effectiveness Scatter Plot of the One Dimensional
Microsimulation Cost-effectiveness Analysis of Early anti-TNF-α Intervention vs. Standard
Care from a Public Healthcare Perspective.
Results from the one dimensional Markov microsimulation with 10,000 microsimulations cost-effectiveness analysis are shown. Each dot represents the incremental cost and incremental effectiveness of one microsimulation. The incremental cost is presented in Canadian dollars and the incremental effectiveness is presented in weeks in steroid-free remission. The partially visible ellipse represents 95% confidence interval.
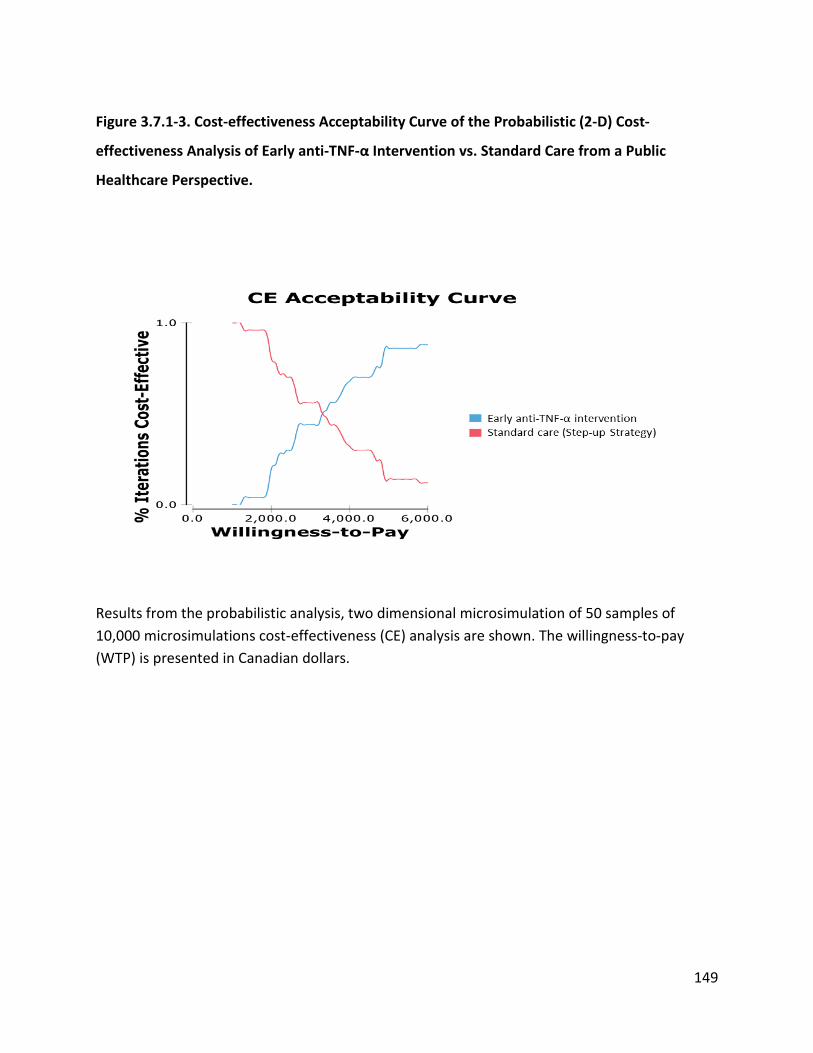
149
Figure 3.7.1-3. Cost-effectiveness Acceptability Curve of the Probabilistic (2-D) Cost-
effectiveness Analysis of Early anti-TNF-α Intervention vs. Standard Care from a Public
Healthcare Perspective.
Results from the probabilistic analysis, two dimensional microsimulation of 50 samples of 10,000 microsimulations cost-effectiveness (CE) analysis are shown. The willingness-to-pay (WTP) is presented in Canadian dollars.
150
3.7.2 Cost-effectiveness with the Societal Payer Perspective Reference (Base) Case
The cost-effectiveness analysis from the societal perspective was identical to the health care
public payer perspective except for the addition of costs associated with caregiver time losses
required for the care of their children afflicted with Crohn’s disease. Therefore, the incremental
cost-effectiveness ratio from the societal perspective is slightly higher than that of the
healthcare public payer perspective. Similar to the healthcare perspective, a discount rate of
1.5%, and a three-year time horizon were used for the reference case from the societal
perspective.
The results of the cost-effectiveness analysis from a societal perspective are summarized in
Table 3.7.2-1. In the reference case, early anti-TNF-α intervention was more costly over the
standard care intervention over three years by $33,509. Early anti-TNF-α intervention was also
more effective with 11.3 more weeks in steroid-free medical remission. The incremental cost
per additional steroid-free remission week was $2,968 for the early anti-TNF-α intervention for
the reference case from a societal payer perspective. The societal perspective had the same
outcome measures and only a marginal increase in cost than the healthcare public payer
perspective, and, as a result, the early anti-TNF-α intervention had a similar ICER from a societal
perspective.
As with the healthcare public payer perspective, the early anti-TNF-α intervention from a
societal perspective was more costly but more effective than standard care. However, there
was considerable uncertainty in the results. The reference case incremental cost effectiveness
scatter plot for the two dimensional probabilistic analysis with 50 samples of 10,000
microsimulations is shown in Figure 3.7.2-1. All of the samples showed a positive incremental
effect of steroid-free remission weeks for the early anti-TNF-α intervention, but at increased
cost. Ninety percent of the samples fell within the 95% confidence ellipse.
The cost-effectiveness acceptability curve from the 2-D microsimulation for the reference case
from a societal perspective is shown in Figure 3.7.2-2. The curve shows that the standard care
151
intervention was cost-effective below a willingness-to-pay threshold of $4,000 per week in
steroid-free remission, but above this threshold, the early anti-TNF-α intervention does become
cost-effective in some iterations. At a willingness-to-pay threshold of approximately $5,000 per
week in steroid-free remission, neither strategy is dominant over the other as both strategies
are cost-effective 50% of the time. Above a willingness to pay threshold of $8,000, the early
anti-TNF-α intervention becomes cost-effective an increasing number of times compared to the
standard care strategy. Above a willingness-to-pay of $10,000 per week in steroid-free
remission, the early anti-TNF-α intervention becomes the dominant cost-effective strategy.
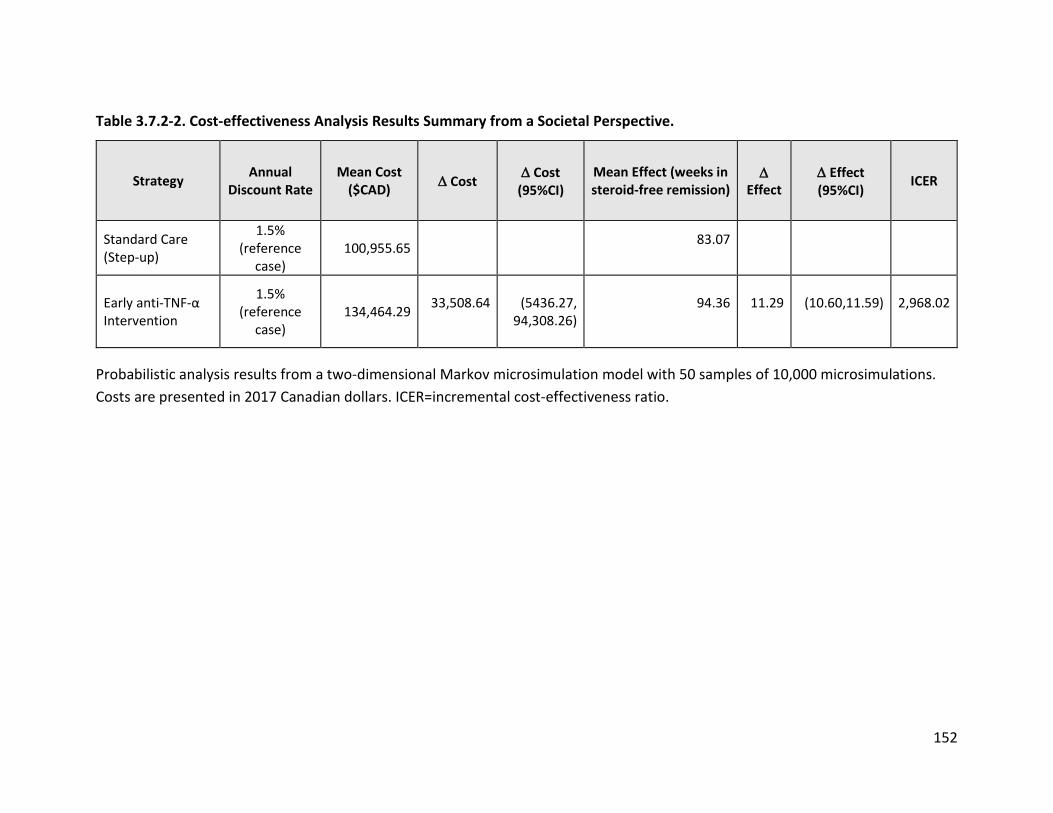
152
Table 3.7.2-2. Cost-effectiveness Analysis Results Summary from a Societal Perspective.
Strategy Annual Discount Rate
Mean Cost ($CAD) ∆ Cost ∆ Cost
(95%CI) Mean Effect (weeks in steroid-free remission)
∆ Effect
∆ Effect (95%CI)
ICER
Standard Care (Step-up)
1.5% (reference
case)
100,955.65
83.07
Early anti-TNF-α Intervention
1.5% (reference
case)
134,464.29
33,508.64
(5436.27, 94,308.26)
94.36
11.29
(10.60,11.59)
2,968.02
Probabilistic analysis results from a two-dimensional Markov microsimulation model with 50 samples of 10,000 microsimulations. Costs are presented in 2017 Canadian dollars. ICER=incremental cost-effectiveness ratio.
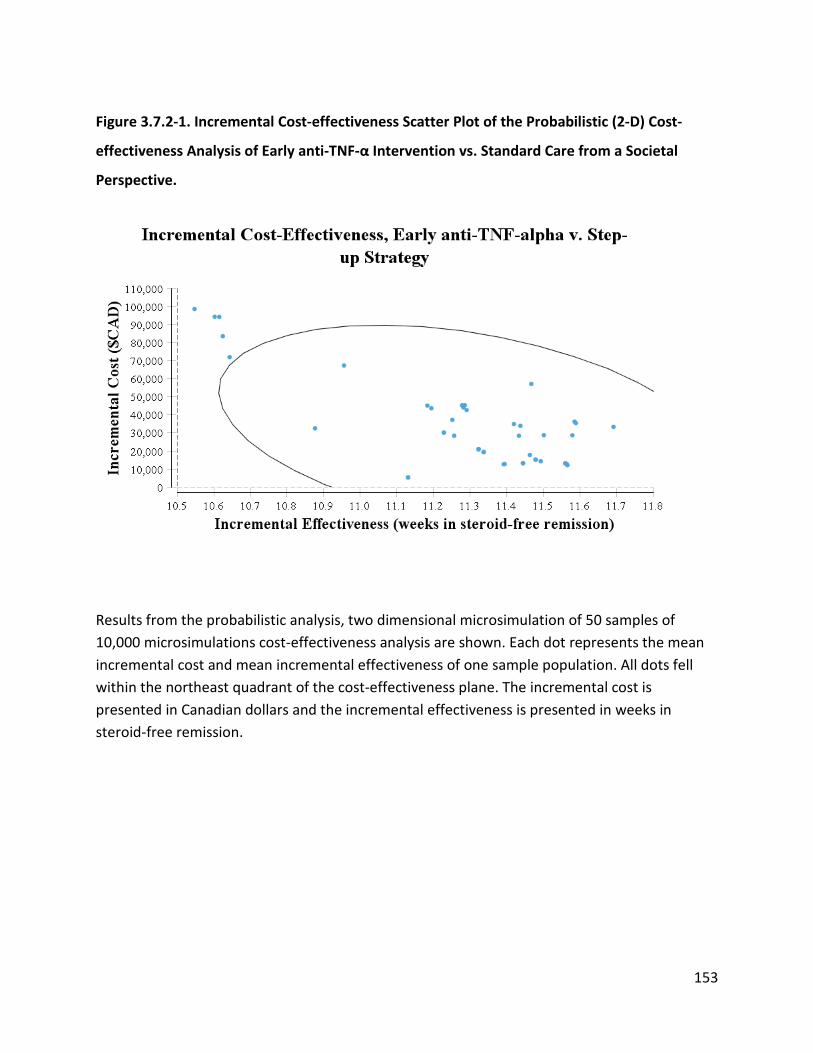
153
Figure 3.7.2-1. Incremental Cost-effectiveness Scatter Plot of the Probabilistic (2-D) Cost-
effectiveness Analysis of Early anti-TNF-α Intervention vs. Standard Care from a Societal
Perspective.
Results from the probabilistic analysis, two dimensional microsimulation of 50 samples of 10,000 microsimulations cost-effectiveness analysis are shown. Each dot represents the mean incremental cost and mean incremental effectiveness of one sample population. All dots fell within the northeast quadrant of the cost-effectiveness plane. The incremental cost is presented in Canadian dollars and the incremental effectiveness is presented in weeks in steroid-free remission.
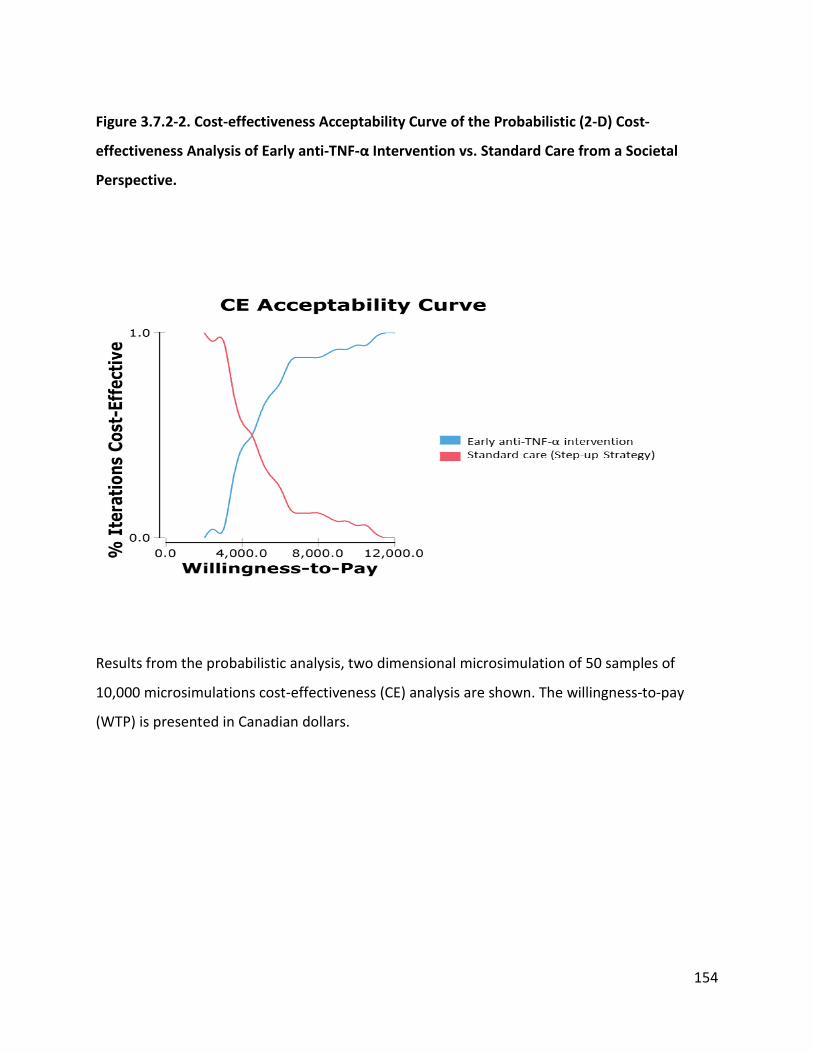
154
Figure 3.7.2-2. Cost-effectiveness Acceptability Curve of the Probabilistic (2-D) Cost-
effectiveness Analysis of Early anti-TNF-α Intervention vs. Standard Care from a Societal
Perspective.
Results from the probabilistic analysis, two dimensional microsimulation of 50 samples of
10,000 microsimulations cost-effectiveness (CE) analysis are shown. The willingness-to-pay
(WTP) is presented in Canadian dollars.
155
3.7.3 Additional Cost-effectiveness Analysis
In addition to conducting a cost-effectiveness analysis of early intervention with anti-TNF-α
compared to standard step-up care where the outcome measure was weeks in steroid-free
medical remission, the cost-effectiveness model was run comparing the two strategies using
the outcome measure of weeks in medical remission irrespective of steroid use as a secondary
analysis. All model inputs were identical to the previous analysis except that all weeks in
medical remission were counted and not just the ones without steroid-use. The incremental
cost of early intervention with anti-TNF-α per week in medical remission was determined.
Similar to the above analysis, the “Across” method of imputed data set assembly was used in
the preparation of the matched RISK-PROKIIDS data set. Summary results of the cost-
effectiveness analysis from a healthcare public payer perspective using a reference case
discounting rate of 1.5% is shown in Table 3.7.3-1.
In the reference case, early anti-TNF-α intervention was more costly than the standard care
intervention over three years by $31,112. Early anti-TNF-α intervention was also more effective
with an additional 6.65 weeks in medical remission. The incremental cost per additional
medical remission week was $4,679 for the early anti-TNF-α intervention from a health care
payer perspective. The ICER was higher when remission weeks were considered as the
effectiveness measure because the difference between the early anti-TNF-α intervention and
the standard care strategy was smaller when total remission weeks were considered. This
suggests that the early anti-TNF-α intervention may be more favorable for the pediatric
population since steroid use is of particular concern.
The summary results of the cost-effectiveness analysis with weeks in remission as the
effectiveness measure with or without steroids, from a societal perspective, including caregiver
productivity losses (similar to the previous societal cost-effectiveness analysis), are shown in
Table 3.7.3-2. The incremental cost-effectiveness scatter plot for the societal perspective and
the cost-effectiveness acceptability curve are shown in Figures 3.7.3-1 and Figure 3.7.3-2. The
patterns for the incremental cost-effective scatter plot and the cost-effectiveness acceptability
156
curve were similar to those of the plots with steroid-free remission weeks as the effect
measure.
In addition to comparing the ICERs without steroids and irrespective of steroid use in remission,
the additional cost-effectiveness analysis was used to compare the difference in the ICER
between the model using transition probabilities from the RISK-PROKIIDS matched data
assembled using the “Across” method with data assembled using the “Within” approach.
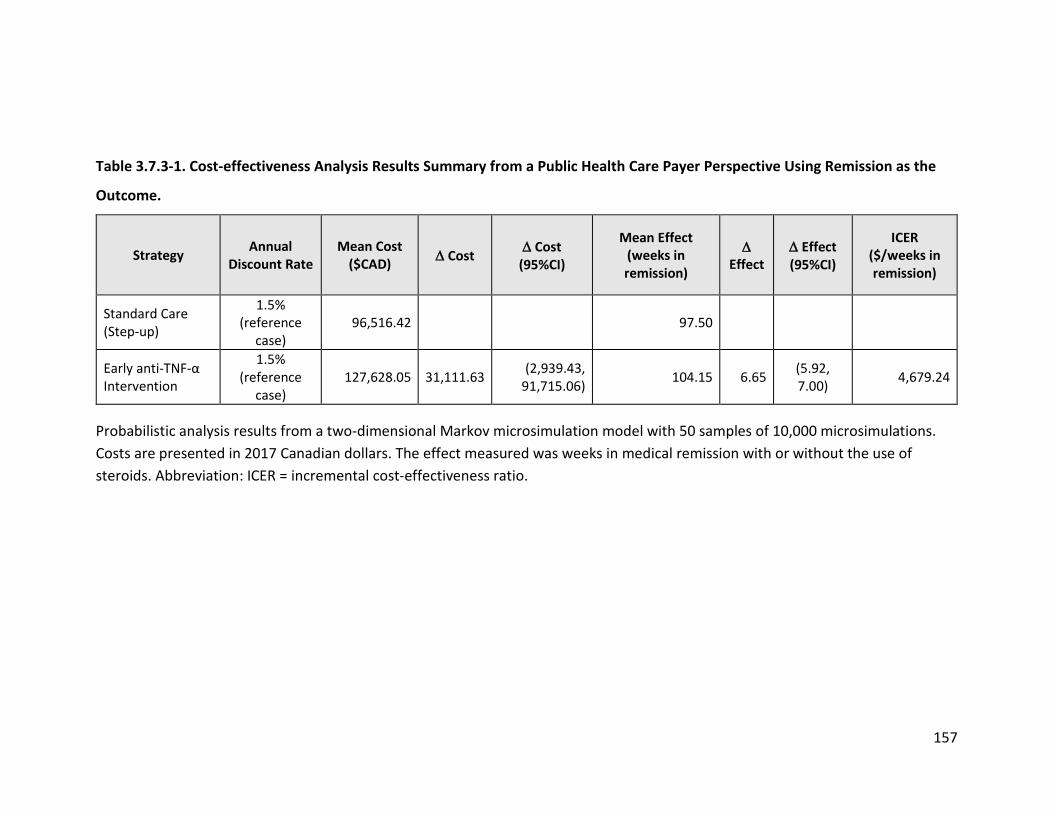
157
Table 3.7.3-1. Cost-effectiveness Analysis Results Summary from a Public Health Care Payer Perspective Using Remission as the
Outcome.
Strategy Annual Discount Rate
Mean Cost ($CAD) ∆ Cost ∆ Cost
(95%CI)
Mean Effect (weeks in remission)
∆ Effect
∆ Effect (95%CI)
ICER ($/weeks in remission)
Standard Care (Step-up)
1.5% (reference
case) 96,516.42 97.50
Early anti-TNF-α Intervention
1.5% (reference
case) 127,628.05 31,111.63 (2,939.43,
91,715.06) 104.15 6.65 (5.92, 7.00) 4,679.24
Probabilistic analysis results from a two-dimensional Markov microsimulation model with 50 samples of 10,000 microsimulations. Costs are presented in 2017 Canadian dollars. The effect measured was weeks in medical remission with or without the use of steroids. Abbreviation: ICER = incremental cost-effectiveness ratio.
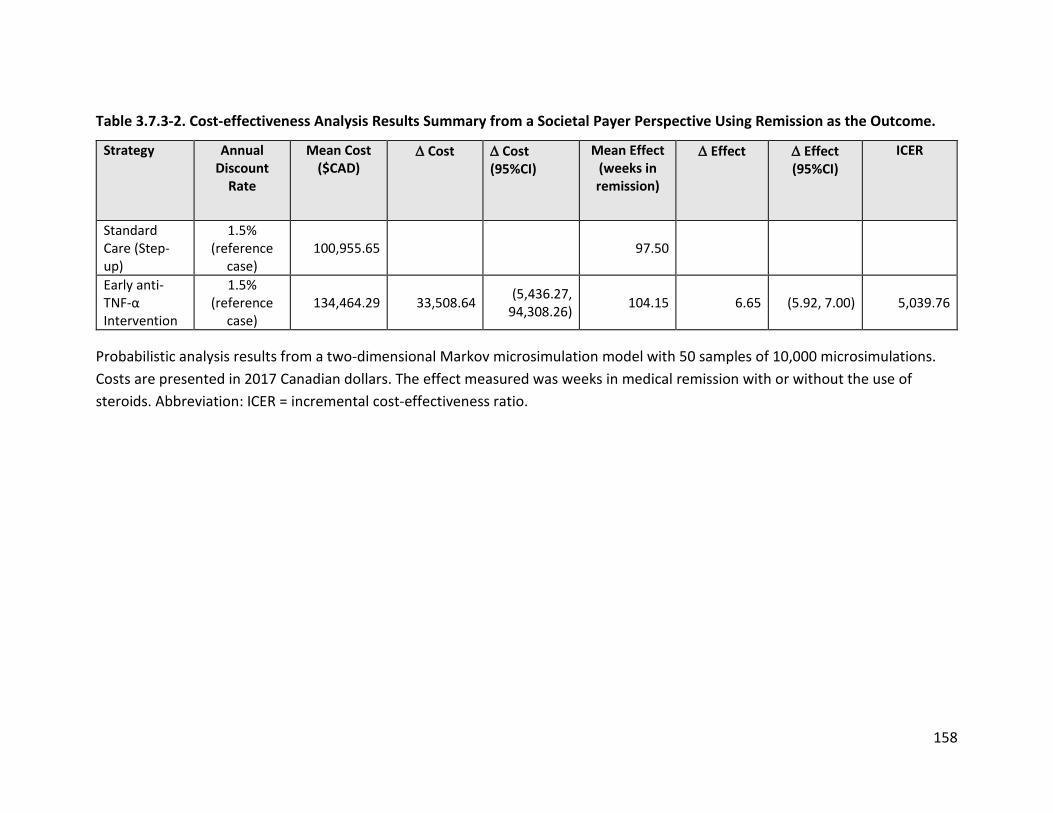
158
Table 3.7.3-2. Cost-effectiveness Analysis Results Summary from a Societal Payer Perspective Using Remission as the Outcome.
Strategy Annual Discount
Rate
Mean Cost ($CAD)
∆ Cost ∆ Cost (95%CI)
Mean Effect (weeks in remission)
∆ Effect ∆ Effect (95%CI)
ICER
Standard Care (Step-up)
1.5% (reference
case) 100,955.65 97.50
Early anti-TNF-α Intervention
1.5% (reference
case) 134,464.29 33,508.64 (5,436.27,
94,308.26) 104.15 6.65 (5.92, 7.00) 5,039.76
Probabilistic analysis results from a two-dimensional Markov microsimulation model with 50 samples of 10,000 microsimulations. Costs are presented in 2017 Canadian dollars. The effect measured was weeks in medical remission with or without the use of steroids. Abbreviation: ICER = incremental cost-effectiveness ratio.
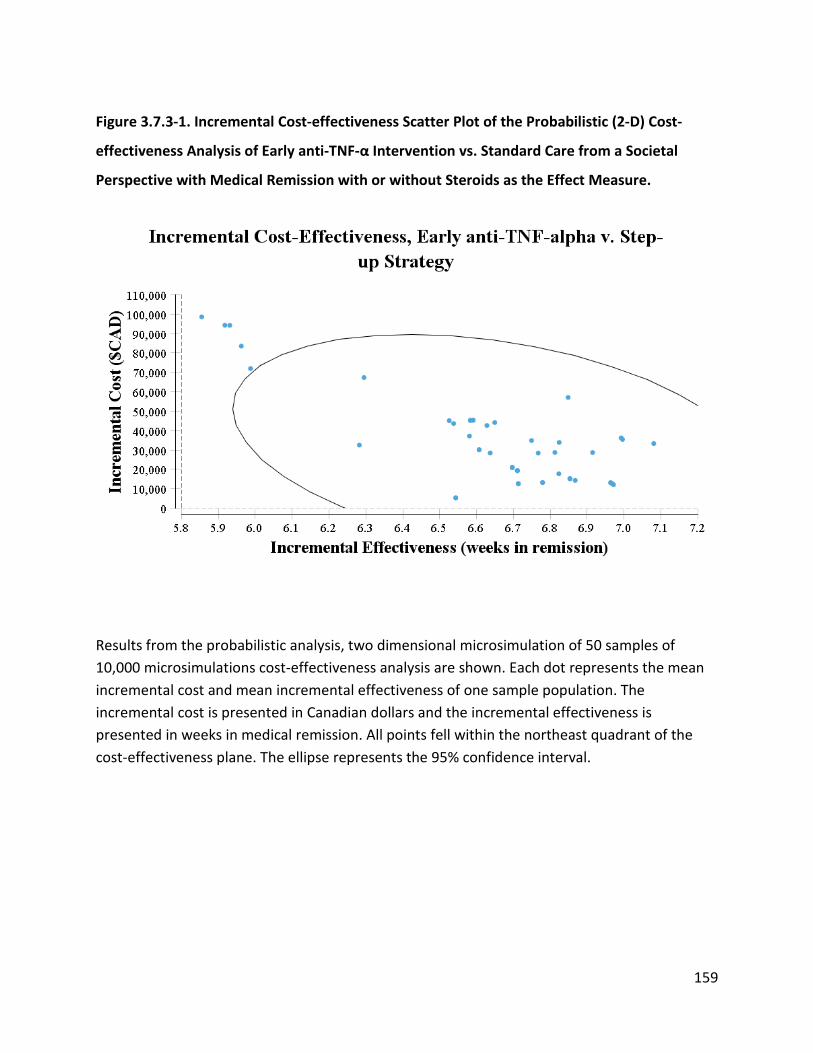
159
Figure 3.7.3-1. Incremental Cost-effectiveness Scatter Plot of the Probabilistic (2-D) Cost-
effectiveness Analysis of Early anti-TNF-α Intervention vs. Standard Care from a Societal
Perspective with Medical Remission with or without Steroids as the Effect Measure.
Results from the probabilistic analysis, two dimensional microsimulation of 50 samples of 10,000 microsimulations cost-effectiveness analysis are shown. Each dot represents the mean incremental cost and mean incremental effectiveness of one sample population. The incremental cost is presented in Canadian dollars and the incremental effectiveness is presented in weeks in medical remission. All points fell within the northeast quadrant of the cost-effectiveness plane. The ellipse represents the 95% confidence interval.
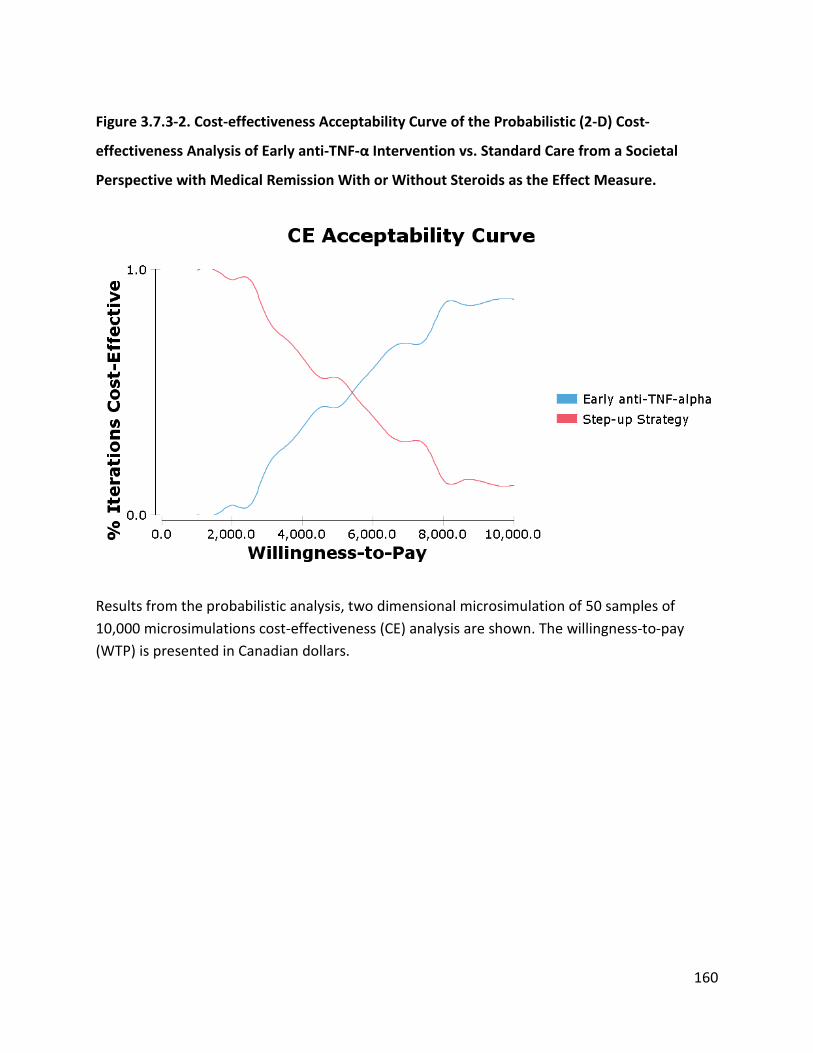
160
Figure 3.7.3-2. Cost-effectiveness Acceptability Curve of the Probabilistic (2-D) Cost-
effectiveness Analysis of Early anti-TNF-α Intervention vs. Standard Care from a Societal
Perspective with Medical Remission With or Without Steroids as the Effect Measure.
Results from the probabilistic analysis, two dimensional microsimulation of 50 samples of 10,000 microsimulations cost-effectiveness (CE) analysis are shown. The willingness-to-pay (WTP) is presented in Canadian dollars.
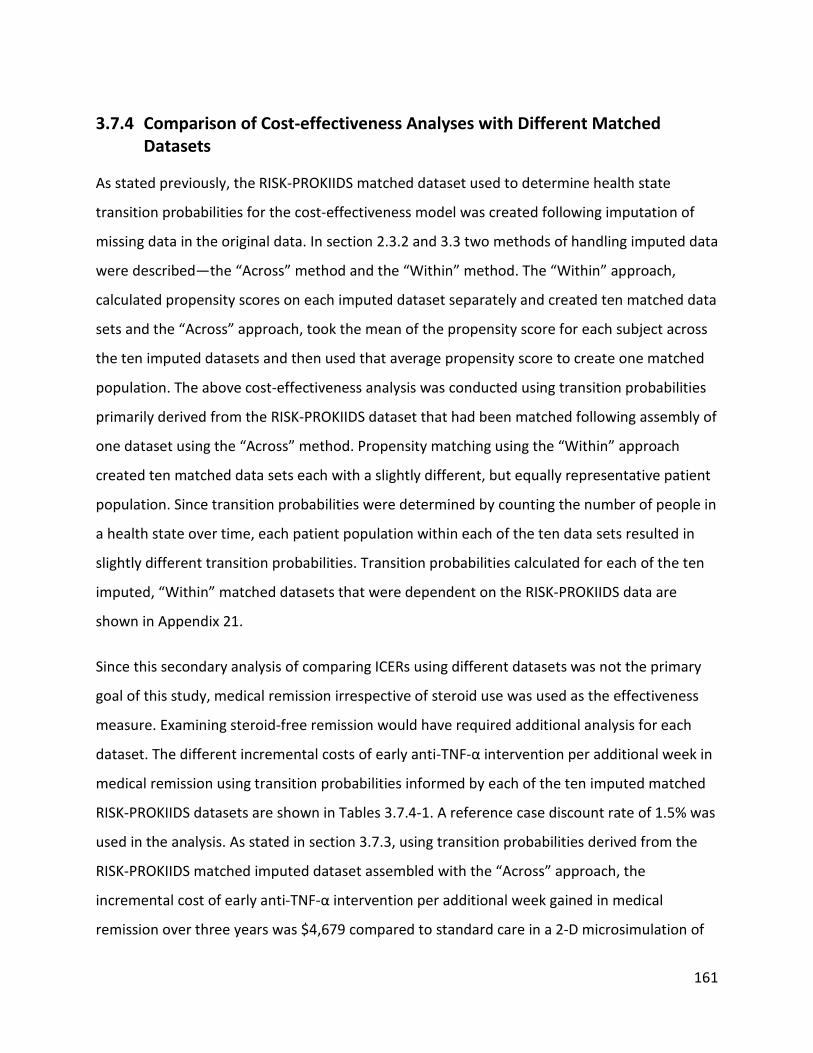
161
3.7.4 Comparison of Cost-effectiveness Analyses with Different Matched Datasets
As stated previously, the RISK-PROKIIDS matched dataset used to determine health state
transition probabilities for the cost-effectiveness model was created following imputation of
missing data in the original data. In section 2.3.2 and 3.3 two methods of handling imputed data
were described—the “Across” method and the “Within” method. The “Within” approach,
calculated propensity scores on each imputed dataset separately and created ten matched data
sets and the “Across” approach, took the mean of the propensity score for each subject across
the ten imputed datasets and then used that average propensity score to create one matched
population. The above cost-effectiveness analysis was conducted using transition probabilities
primarily derived from the RISK-PROKIIDS dataset that had been matched following assembly of
one dataset using the “Across” method. Propensity matching using the “Within” approach
created ten matched data sets each with a slightly different, but equally representative patient
population. Since transition probabilities were determined by counting the number of people in
a health state over time, each patient population within each of the ten data sets resulted in
slightly different transition probabilities. Transition probabilities calculated for each of the ten
imputed, “Within” matched datasets that were dependent on the RISK-PROKIIDS data are
shown in Appendix 21.
Since this secondary analysis of comparing ICERs using different datasets was not the primary
goal of this study, medical remission irrespective of steroid use was used as the effectiveness
measure. Examining steroid-free remission would have required additional analysis for each
dataset. The different incremental costs of early anti-TNF-α intervention per additional week in
medical remission using transition probabilities informed by each of the ten imputed matched
RISK-PROKIIDS datasets are shown in Tables 3.7.4-1. A reference case discount rate of 1.5% was
used in the analysis. As stated in section 3.7.3, using transition probabilities derived from the
RISK-PROKIIDS matched imputed dataset assembled with the “Across” approach, the
incremental cost of early anti-TNF-α intervention per additional week gained in medical
remission over three years was $4,679 compared to standard care in a 2-D microsimulation of
162
50 samples of 10,000 microsimulations. When the 2-D microsimulation cost-effectiveness
analysis was conducted using transition probabilities informed by each imputed dataset
separately, the ICERs of early anti-TNF-α intervention compared to standard care ranged from
$2,236 to $12,464 per additional week gained in medical remission. This represented a wide
range of ICERs and illustrated the structural uncertainty introduced by the imputation of
missing data and subsequent propensity score analysis. The mean ICER from the ten cost-
effectiveness analyses was $5,047 (SD = $2,880) which was similar to the ICER determined using
from the cost-effectiveness analysis informed by RISK-PROKIIDS probabilities assembled from
the averaged “Across” approach ($4,679). The incremental cost per additional week of medical
remission of early anti-TNF-α intervention in the ten cost-effective analyses ranged from
$26,028 [95% CI (-1,937, 85,861)] to $36,301 [95% CI (7,606, 96,938)] and the incremental
effect ranged from 2.91 [95% CI (2.51, 3.13)] to 11.64 [95% CI (11.40, 11.83) to 2.91 (2.51,
3.13)] weeks in medical remission. The confidence interval for the smallest incremental cost
passed through zero suggesting a cost savings. However, all the other confidence intervals are
positive indicating a net cost for 95% of simulations, albeit in a wide range. There is some
overlap between the confidence intervals in incremental cost and incremental effectiveness
among the ten cost-effectiveness analyses. Nevertheless, there appears to be uncertainty in the
model which is discussed further in the next section.
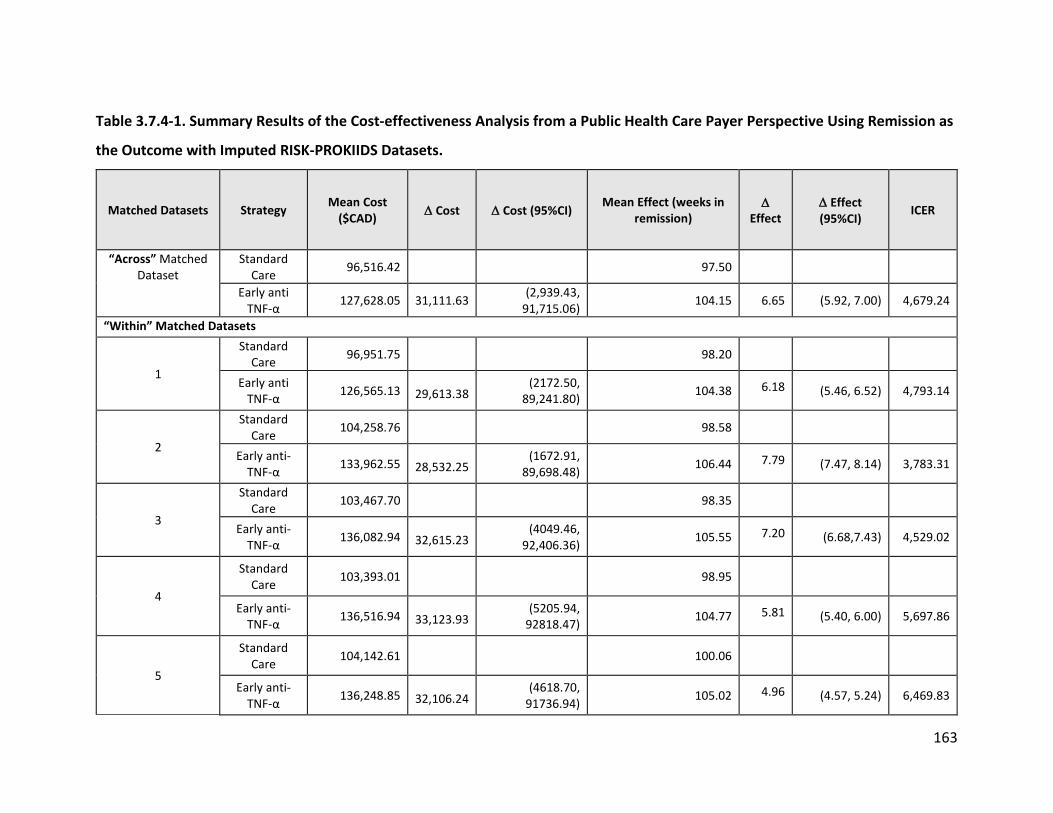
163
Table 3.7.4-1. Summary Results of the Cost-effectiveness Analysis from a Public Health Care Payer Perspective Using Remission as
the Outcome with Imputed RISK-PROKIIDS Datasets.
Matched Datasets Strategy Mean Cost ($CAD) ∆ Cost ∆ Cost (95%CI)
Mean Effect (weeks in remission)
∆ Effect
∆ Effect (95%CI)
ICER
“Across” Matched Dataset
Standard Care 96,516.42 97.50
Early anti TNF-α 127,628.05 31,111.63 (2,939.43,
91,715.06) 104.15 6.65 (5.92, 7.00) 4,679.24
“Within” Matched Datasets
1
Standard Care 96,951.75 98.20
Early anti TNF-α 126,565.13 29,613.38
(2172.50, 89,241.80) 104.38 6.18 (5.46, 6.52) 4,793.14
2
Standard Care 104,258.76 98.58
Early anti-TNF-α 133,962.55 28,532.25
(1672.91, 89,698.48) 106.44 7.79 (7.47, 8.14) 3,783.31
3
Standard Care 103,467.70 98.35
Early anti-TNF-α 136,082.94 32,615.23
(4049.46, 92,406.36) 105.55 7.20 (6.68,7.43) 4,529.02
4
Standard Care 103,393.01
98.95
Early anti-TNF-α 136,516.94 33,123.93
(5205.94, 92818.47) 104.77 5.81 (5.40, 6.00) 5,697.86
5
Standard Care 104,142.61
100.06
Early anti-TNF-α 136,248.85 32,106.24
(4618.70, 91736.94) 105.02 4.96 (4.57, 5.24) 6,469.83
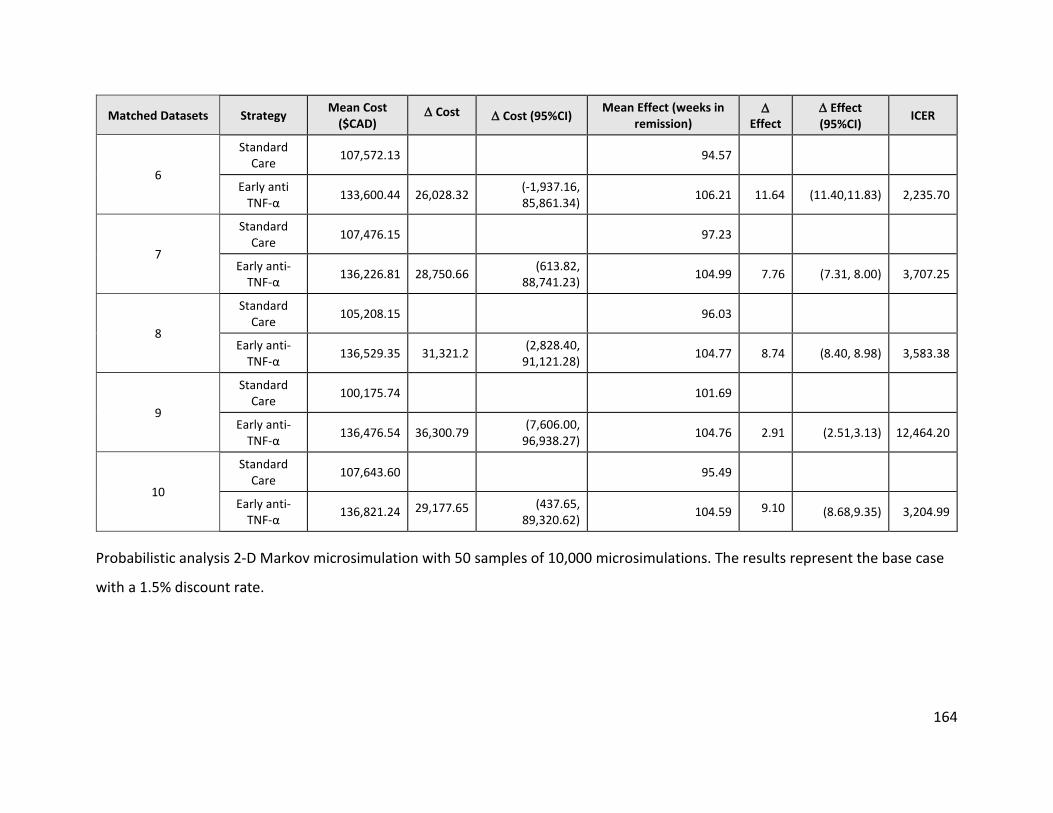
164
Matched Datasets Strategy Mean Cost ($CAD)
∆ Cost ∆ Cost (95%CI) Mean Effect (weeks in
remission) ∆
Effect ∆ Effect (95%CI)
ICER
6
Standard Care 107,572.13 94.57
Early anti TNF-α 133,600.44 26,028.32 (-1,937.16,
85,861.34) 106.21 11.64 (11.40,11.83) 2,235.70
7
Standard Care 107,476.15 97.23
Early anti-TNF-α 136,226.81 28,750.66 (613.82,
88,741.23) 104.99 7.76 (7.31, 8.00) 3,707.25
8
Standard Care 105,208.15 96.03
Early anti-TNF-α 136,529.35 31,321.2 (2,828.40,
91,121.28) 104.77 8.74 (8.40, 8.98) 3,583.38
9
Standard Care 100,175.74 101.69
Early anti-TNF-α 136,476.54 36,300.79 (7,606.00,
96,938.27) 104.76 2.91 (2.51,3.13) 12,464.20
10
Standard Care 107,643.60 95.49
Early anti-TNF-α 136,821.24 29,177.65 (437.65,
89,320.62) 104.59 9.10 (8.68,9.35) 3,204.99
Probabilistic analysis 2-D Markov microsimulation with 50 samples of 10,000 microsimulations. The results represent the base case
with a 1.5% discount rate.
165
3.7.5 Uncertainty Analysis
Uncertainty analysis was conducted to assess the robustness in the cost-effectiveness model.
Parameter uncertainty was assessed through probabilistic analysis. Structural uncertainty in the
model was assessed via scenario analysis. Uncertainty in the estimated costs, outcomes and
incremental cost-effectiveness ratio for the early anti-TNF-α intervention and standard care
(step-up) treatment strategies was demonstrated with the cost-effectiveness acceptability
curves. All types of uncertainty analyses are described below.
3.7.5.1 Structural and Methodological Uncertainty
The cost-effectiveness model used some health state transition probabilities derived from an
imputed and subsequently propensity matched data set. Since two approaches, the “Across”
method and the “Within” method, could be used to assemble the imputed data set for
propensity matching and resultant transition probabilities, choosing one approach over the
other in deriving inputs for the model introduced methodological uncertainty into the model.
The probabilities of transitioning from “active disease” to “medical remission”, “active disease”
to “active disease requiring surgery or hospitalization”, medical remission to medical remission
(continued medical remission), and from “surgical remission” to “active disease”, varied
depending on the probabilities calculated from each of the ten imputed data sets (“Within”
data sets) and the average “Across” data set (see Appendix 21 for transition probabilities from
the “Within” data sets and Tables 2.5.6.3-1 and 2.5.6.3-2 for transition probabilities from the
“Across” data set). The transition probabilities varied among datasets because when matched,
sampling caused each of the ten matched data sets to contain a slightly different mix of
patients and patient experiences. The slight differences in transition probabilities resulted in a
wide range of ICERs. ICERs from the “Within” data sets ranged from $2,236 to $12,464 per
additional week gained in remission and the average ICER from these data sets (calculated by
taking the mean of each individual ICER from each “Within” dataset) was $5,047 (SD = $2,880)
which was similar to the ICER determined using the averaged “Across” approach ($4,679).
When the mean incremental cost was divided by the mean incremental effect of the “Within”
datasets, the ICER was $4,266. The range in ICERs demonstrates the degree of methodological
166
uncertainty introduced by different approaches of assembling imputed data sets and
subsequent propensity score matching using patient-level data. The structural uncertainty was
compared using the incremental cost of an additional week in medical remission irrespective of
steroid use for simplicity when altering model parameters.
Uncertainty in the discount rate was assessed in a sensitivity analysis using discount rates of
0% and 3% as recommended by CADTH guidelines (Canadian Agency for Drugs and
Technologies in Health (CADTH), 2017). The incremental cost of early anti-TNF-α treatment per
additional steroid-free remission week compared to the standard care intervention using
discount rates of 0% and 3% from a health care public perspective and a societal perspective
are shown in Tables 3.7.5.1-1 and 3.7.5.1-2. With a 3% discount rate, the incremental cost per
steroid-free remission week was $2,771 and without discounting it was $2,740 from a public
health care payer perspective. There was very little difference between the ICERs with the
different discounting rates since the time horizon was only three years. With a 3% discount
rate, the incremental cost per steroid-free remission week was $2,982 and without discounting
it was $2,954 from a societal perspective.
The ICER was also determined from a health care payer perspective and a societal perspective
using a 3% discount rate and a 0% discount rate with the outcome of remission irrespective of
steroid use shown in Tables 3.7.5.1-3 and 3.7.5.1-4. With a 3% discount rate, the incremental
cost per remission week was $4,698 and without discounting it was $4,661 per remission week
for the health care payer perspective. With a 3% discount rate, the incremental cost per
remission week was $5,055 and without discounting it was $5,024 per remission week gained
for the societal payer perspective.
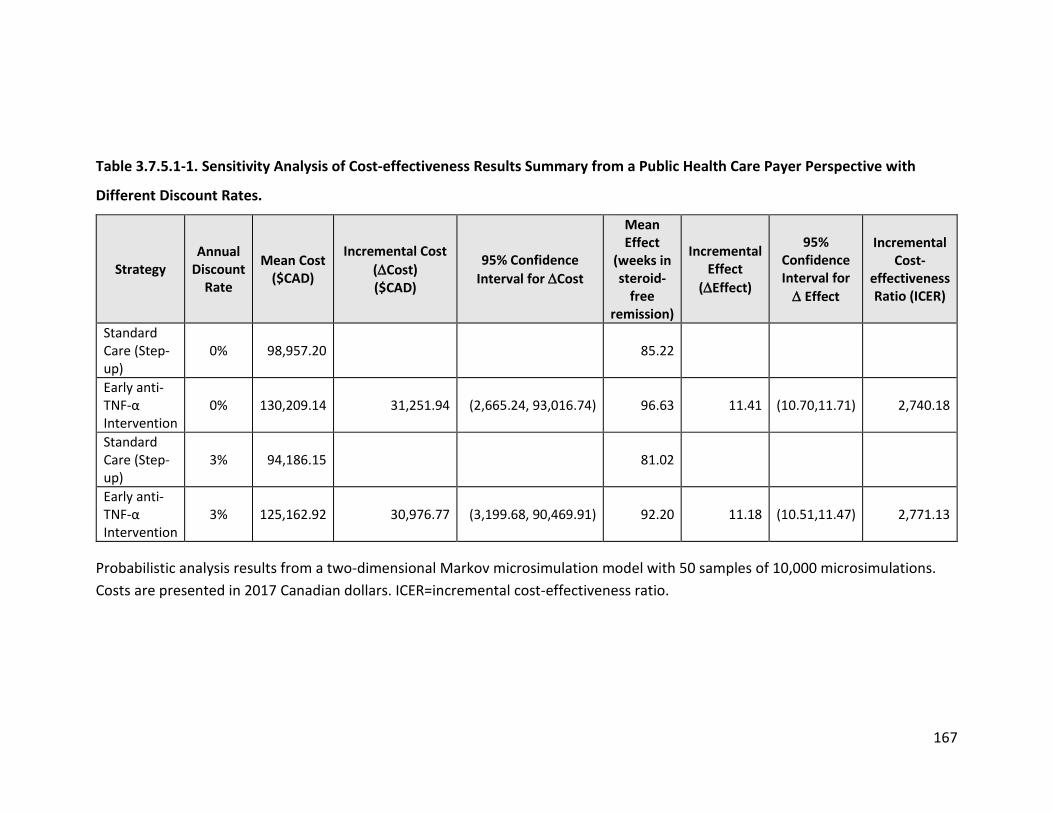
167
Table 3.7.5.1-1. Sensitivity Analysis of Cost-effectiveness Results Summary from a Public Health Care Payer Perspective with
Different Discount Rates.
Strategy Annual
Discount Rate
Mean Cost ($CAD)
Incremental Cost (∆Cost) ($CAD)
95% Confidence Interval for ∆Cost
Mean Effect
(weeks in steroid-
free remission)
Incremental Effect
(∆Effect)
95% Confidence Interval for ∆ Effect
Incremental Cost-
effectiveness Ratio (ICER)
Standard Care (Step-up)
0% 98,957.20 85.22
Early anti-TNF-α Intervention
0% 130,209.14 31,251.94 (2,665.24, 93,016.74) 96.63 11.41 (10.70,11.71) 2,740.18
Standard Care (Step-up)
3% 94,186.15 81.02
Early anti-TNF-α Intervention
3% 125,162.92 30,976.77 (3,199.68, 90,469.91) 92.20 11.18 (10.51,11.47) 2,771.13
Probabilistic analysis results from a two-dimensional Markov microsimulation model with 50 samples of 10,000 microsimulations. Costs are presented in 2017 Canadian dollars. ICER=incremental cost-effectiveness ratio.
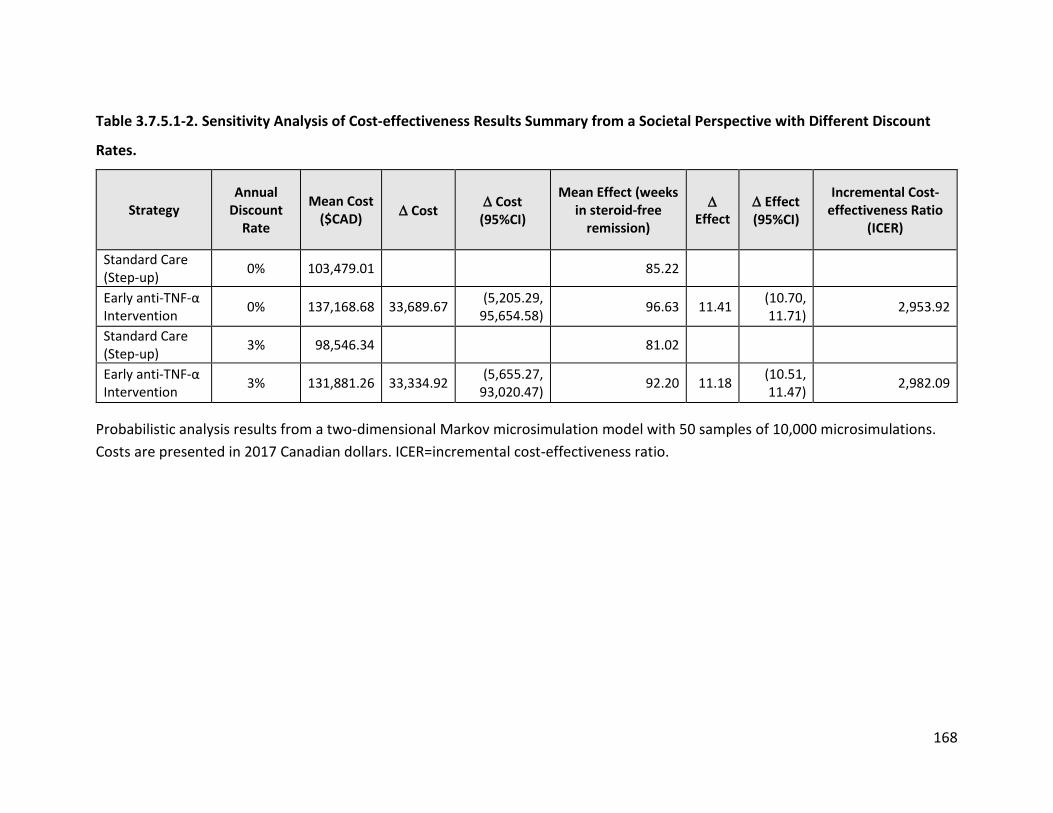
168
Table 3.7.5.1-2. Sensitivity Analysis of Cost-effectiveness Results Summary from a Societal Perspective with Different Discount
Rates.
Strategy Annual
Discount Rate
Mean Cost ($CAD) ∆ Cost ∆ Cost
(95%CI)
Mean Effect (weeks in steroid-free
remission)
∆ Effect
∆ Effect (95%CI)
Incremental Cost-effectiveness Ratio
(ICER)
Standard Care (Step-up) 0% 103,479.01 85.22
Early anti-TNF-α Intervention 0% 137,168.68 33,689.67 (5,205.29,
95,654.58) 96.63 11.41 (10.70, 11.71) 2,953.92
Standard Care (Step-up) 3% 98,546.34 81.02
Early anti-TNF-α Intervention 3% 131,881.26 33,334.92 (5,655.27,
93,020.47) 92.20 11.18 (10.51, 11.47) 2,982.09
Probabilistic analysis results from a two-dimensional Markov microsimulation model with 50 samples of 10,000 microsimulations. Costs are presented in 2017 Canadian dollars. ICER=incremental cost-effectiveness ratio.
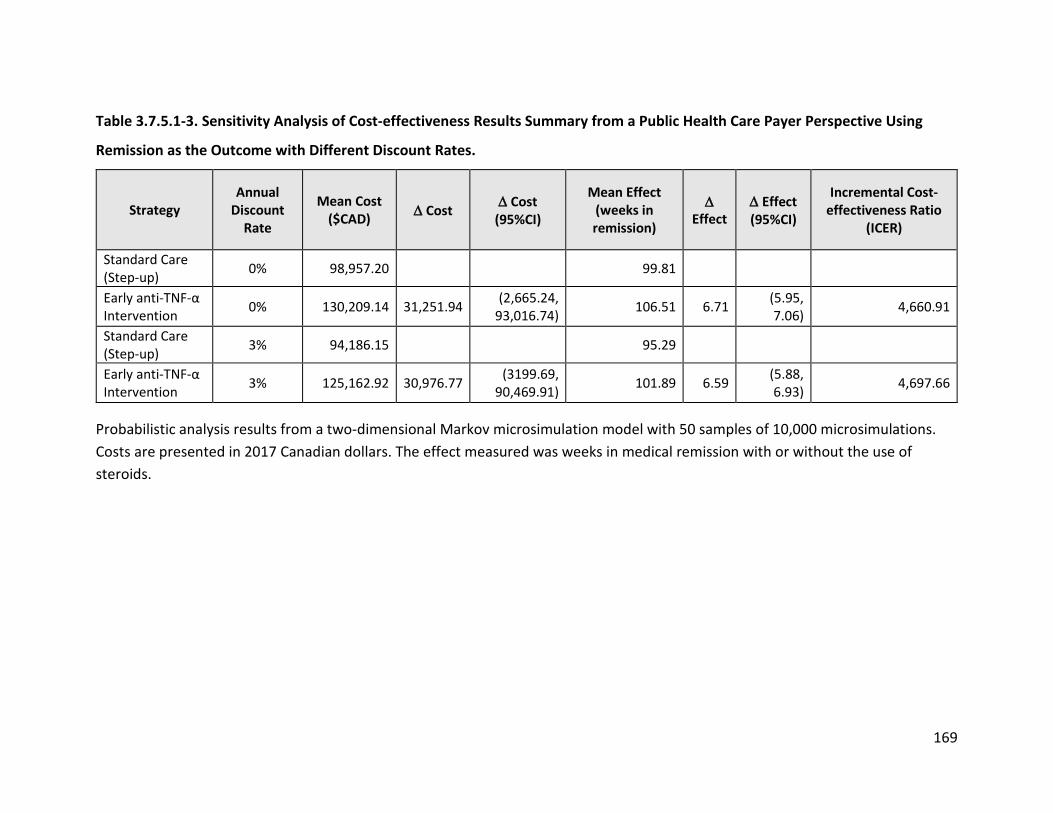
169
Table 3.7.5.1-3. Sensitivity Analysis of Cost-effectiveness Results Summary from a Public Health Care Payer Perspective Using
Remission as the Outcome with Different Discount Rates.
Strategy Annual
Discount Rate
Mean Cost ($CAD) ∆ Cost ∆ Cost
(95%CI)
Mean Effect (weeks in remission)
∆ Effect
∆ Effect (95%CI)
Incremental Cost-effectiveness Ratio
(ICER)
Standard Care (Step-up) 0% 98,957.20 99.81
Early anti-TNF-α Intervention 0% 130,209.14 31,251.94 (2,665.24,
93,016.74) 106.51 6.71 (5.95, 7.06) 4,660.91
Standard Care (Step-up) 3% 94,186.15 95.29
Early anti-TNF-α Intervention 3% 125,162.92 30,976.77 (3199.69,
90,469.91) 101.89 6.59 (5.88, 6.93) 4,697.66
Probabilistic analysis results from a two-dimensional Markov microsimulation model with 50 samples of 10,000 microsimulations. Costs are presented in 2017 Canadian dollars. The effect measured was weeks in medical remission with or without the use of steroids.
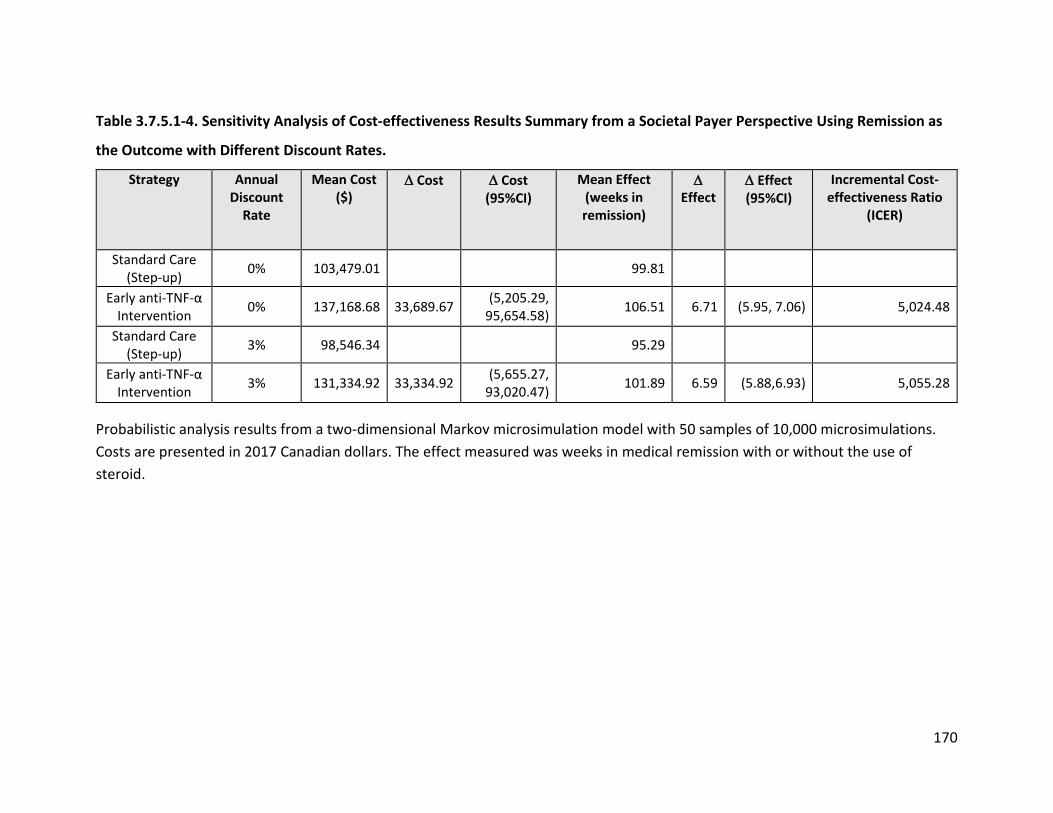
170
Table 3.7.5.1-4. Sensitivity Analysis of Cost-effectiveness Results Summary from a Societal Payer Perspective Using Remission as
the Outcome with Different Discount Rates.
Strategy Annual Discount
Rate
Mean Cost ($)
∆ Cost ∆ Cost (95%CI)
Mean Effect (weeks in remission)
∆ Effect
∆ Effect (95%CI)
Incremental Cost-effectiveness Ratio
(ICER)
Standard Care (Step-up) 0% 103,479.01 99.81
Early anti-TNF-α Intervention 0% 137,168.68 33,689.67 (5,205.29,
95,654.58) 106.51 6.71 (5.95, 7.06) 5,024.48
Standard Care (Step-up) 3% 98,546.34 95.29
Early anti-TNF-α Intervention 3% 131,334.92 33,334.92 (5,655.27,
93,020.47) 101.89 6.59 (5.88,6.93) 5,055.28
Probabilistic analysis results from a two-dimensional Markov microsimulation model with 50 samples of 10,000 microsimulations. Costs are presented in 2017 Canadian dollars. The effect measured was weeks in medical remission with or without the use of steroid.
171
3.7.5.2 Parameter uncertainty
Parameter uncertainty was addressed in the model by running the reference case as a
probabilistic analysis via a two-dimensional Monte Carlo microsimulation. All variable
distributions that were not fixed were varied simultaneously in the model. Considerable
variation in the patient population and treatment patterns within each strategy arm were
addressed through the probabilistic analysis by simultaneously sampling variable distributions.
There was uncertainty surrounding the health state transition probabilities due to patient
variation and the limitation of using one data set. Therefore, a probabilistic approach was taken
and these probabilities were assigned a beta distribution with the distribution being sampled
every cycle for each microsimulation. A deterministic approach would not be amenable to the
multiple sampling. While prices and doses for drugs were fixed, costs varied based on the
weights for which there was a range for a particular age and gender. In addition, costs for each
drug class were averaged among the common drugs used with a wide range of prices. These
parameters introduced uncertainty and therefore sampling from a distribution for each
individual was performed. The reported cost of hospitalization varied considerably based on
Ontario Case Costing Data most likely due to varying lengths of stays and complications,
therefore hospitalization cost was sampled from a distribution each time an individual entered
the hospitalization health state. The probabilistic analysis was run with 50 samples of 10,000
trials in the reference case. The one-dimensional Monte Carlo microsimulation was also run
probabilistically since all variable distributions were varied simultaneously for the 10,000
microsimulations. The incremental cost-effectiveness scatter plot of the one-dimensional
microsimulation showed that the 10,000 ICER points of one population fell within all quadrants
of the cost-effectiveness plane (see Figure 3.7.1-2).
Cost-effectiveness acceptability curves (CEACs) demonstrated uncertainty in the estimated
costs, outcomes and incremental cost-effectiveness ratio for the early anti-TNF-α intervention
and standard care (step-up) treatment strategies. The CEACs from a health care public payer
and societal perspectives are shown in Figure 3.7.1-3 and Figure 3.7.2-2, respectively. The
CEACs show that no one intervention is dominantly cost-effective in a range of willingness to
172
pay between $2,000 and $4,500. Hence, there is uncertainty in the model, and a difficulty in
unequivocally stating that one strategy is more cost-effective than the other strategy.
3.7.5.3 Scenario Analysis
Scenario analyses to examine how the cost of infliximab, the rate at which anti-TNF-α is
adopted in the standard care (step-up group), and the cost of immunomodulators (in
comparison to the cost of infliximab) affect the incremental cost-effectiveness ratio. For the
scenario analyses, two-dimensional microsimulations of 50 samples of 10,000 trials were
conducted using reference case parameters of a 1.5% discount rate, three-year time horizon
and a public health care payer perspective. In each scenario, or one-way sensitivity analysis,
only the parameter of interest was altered prior to running the cost-effectiveness model. The
difference in the ICER between the health care public payer perspective and the societal
perspective was minimal and therefore sensitivity analyses were only performed using the
health care public payer perspective.
It was hypothesized that the cost of anti-TNF-α treatment, particularly the cost of infliximab,
could be a major driver of the uncertainty in the incremental cost-effectiveness ratio (ICER).
Infliximab was the chosen target since it was the predominant anti-TNF-α treatment used in the
RISK-PROKIIDS study. The price of one vial of infliximab was fixed at $987.56 in the reference
case probabilistic analysis. However, costing of infliximab treatment was complex since the
number of vials was based on weight (5mg/kg), the cost of infusion administration was added,
and the cost of different dosing regimens depended on whether the patient was in the
induction phase (“active”) or in the maintenance phase of treatment. A one-way sensitivity
analysis was conducted by varying the price of infliximab by a multiplier. The effect of varying
the price of one vial by 150%, 87.5%, 75%, 62.5%, 50%, 37.5%, and 25% of the reference case
($987.56) was tested. These ranges were used to examine at what range biologic treatment
could potentially be cost-effective. Biosimilar infliximab (Inflectra®) is 53% of the cost of
originator infliximab (Remicade®) in the Ontario Drug Formulary. The results are shown in Table
3.7.5.3-1, and the range in ICERs when altering the price of infliximab is shown in the tornado
diagram (Figure 3.7.5.3-1).
173
To compare the impact of altering the cost of immunomodulators on the ICER with the impact
of altering the cost of infliximab, a one-way sensitivity analysis was conducted to test the effect
of alternative costs of immunomodulators. The cost of immunomodulators was based on the
average cost of the drug class per week, and this average cost was multiplied by a factor of 2 or
a factor of 0.5 in the sensitivity analysis. This range was chosen to reflect the variance in prices
of the different immunomodulators within this drug class and the potential variance in
preference and use. The weighted average cost based on RISK-PROKIIDS use for the class of
immunomodulators (azathioprine, 6-mercaptopurine, and methotrexate) was calculated for a
range of weights per week and hence the range in the sensitivity analysis could account for
variances in the weighted average cost per week of immunomodulators. Since the
determination of treatment cost varied by weight of the patient and varied over time by health
state, using a multiplier was the simplest way of varying the cost. A one-dimensional Monte
Carlo analysis with 10,000 microsimulations was conducted using reference case parameters
from a health care payer public perspective for the one-way sensitivity analysis. When the cost
of immunomodulators was doubled, the incremental cost of early anti-TNF-α treatment
compared to standard care was $2737 per additional steroid-free week in remission and when
the cost of immunomodulators was halved the incremental cost of early anti-TNF-α treatment
compared to standard care was $2712 per additional steroid-free week in remission (see Figure
3.7.5.3-1 for tornado diagram). This indicates that the incremental cost-effectiveness ratio was
not sensitive to the cost of immunomodulators.
It was hypothesized that the rate of escalation to anti-TNF-α treatment in the standard care
group introduced uncertainty in the model since it was based on the RISK-PROKIIDS study and
may not be reflective of more current patient treatment patterns. The proportion of patients
that switched to anti-TNF-α treatment in the standard care group over three years based on the
RISK-PROKIIDS matched population was shown in Figure 3.6-2. The rate of escalation to anti-
TNF-α treatment was not linear and changed over time. A one-way sensitivity analysis was
conducted using reference case parameters with a health care public perspective to examine
the impact on the ICER of varying the rate of escalation to anti-TNF-α treatment after three
174
months post-diagnosis. The probability of being on anti-TNF-α treatment was multiplied by a
factor of the current weekly probability. The factors used to change the probability of
escalation are shown in Table 3.7.5.3-2 and the comparative tornado diagram is shown in
Figure 3.7.5.3-1). As expected, reducing the probability of switching to anti-TNF-α in the
standard care group increased the incremental cost per additional week of steroid-free
remission for the early anti-TNF-α strategy (see Table 3.7.5.3-2). Increasing the probability of
switching to anti-TNF-α four-fold starting at three months and throughout the three years
minimally increased the ICER to $2,750 from $2,720 in a one dimensional microsimulation. As
seen in Figure 3.7.5.3-1 the ICER was most sensitive to the price of infliximab compared to the
probability of escalating to anti-TNF-α and the cost of immunomodulators.
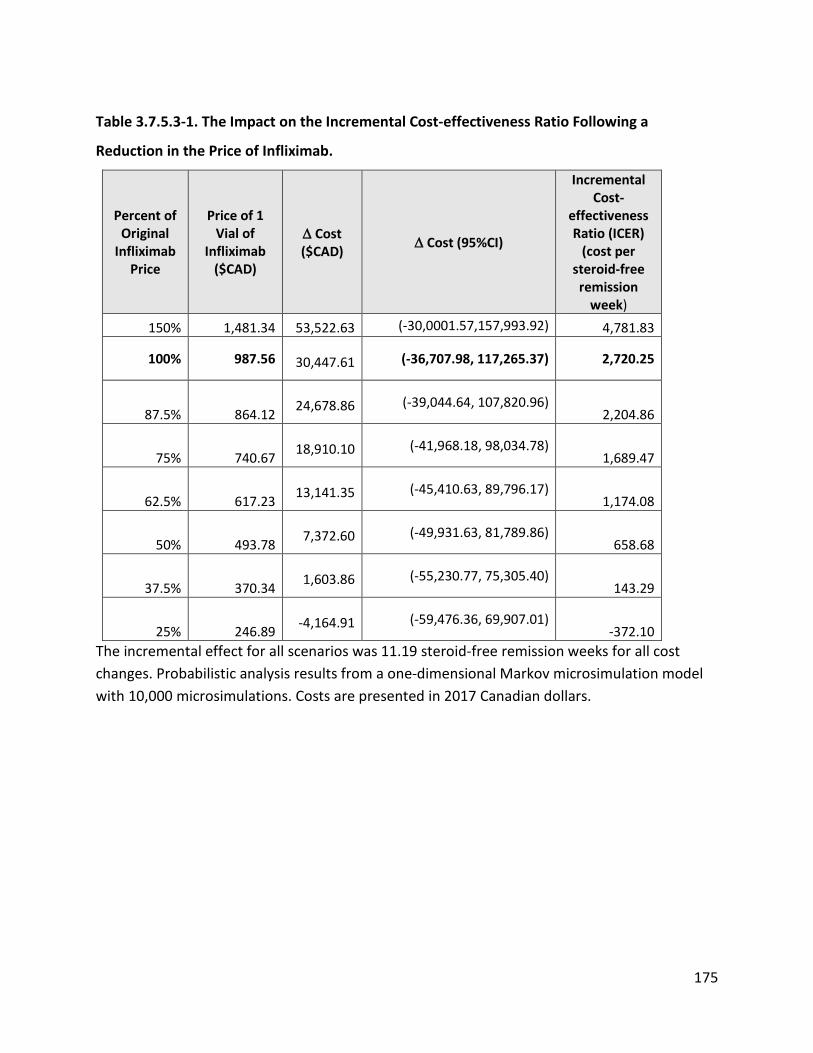
175
Table 3.7.5.3-1. The Impact on the Incremental Cost-effectiveness Ratio Following a
Reduction in the Price of Infliximab.
Percent of Original
Infliximab Price
Price of 1 Vial of
Infliximab ($CAD)
∆ Cost ($CAD) ∆ Cost (95%CI)
Incremental Cost-
effectiveness Ratio (ICER)
(cost per steroid-free remission
week) 150% 1,481.34 53,522.63 (-30,0001.57,157,993.92) 4,781.83
100% 987.56 30,447.61 (-36,707.98, 117,265.37) 2,720.25
87.5% 864.12 24,678.86 (-39,044.64, 107,820.96) 2,204.86
75% 740.67 18,910.10 (-41,968.18, 98,034.78) 1,689.47
62.5% 617.23 13,141.35 (-45,410.63, 89,796.17) 1,174.08
50% 493.78 7,372.60 (-49,931.63, 81,789.86) 658.68
37.5% 370.34 1,603.86 (-55,230.77, 75,305.40) 143.29
25% 246.89 -4,164.91 (-59,476.36, 69,907.01) -372.10
The incremental effect for all scenarios was 11.19 steroid-free remission weeks for all cost changes. Probabilistic analysis results from a one-dimensional Markov microsimulation model with 10,000 microsimulations. Costs are presented in 2017 Canadian dollars.
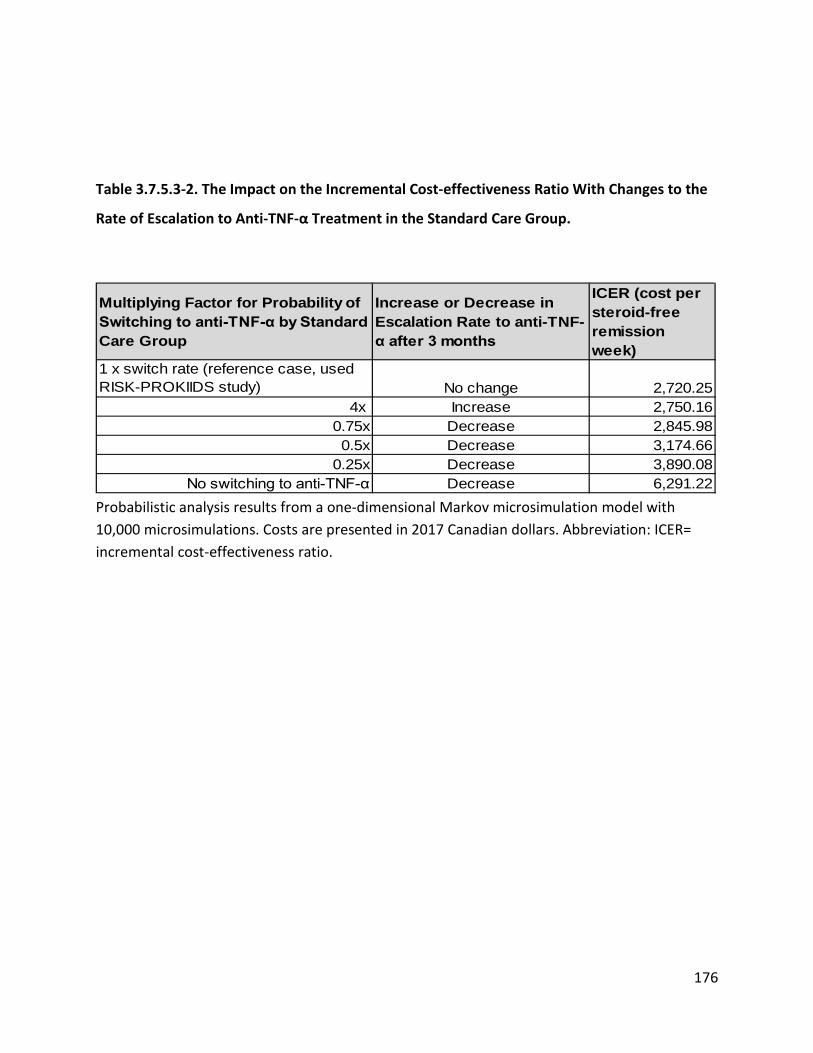
176
Table 3.7.5.3-2. The Impact on the Incremental Cost-effectiveness Ratio With Changes to the
Rate of Escalation to Anti-TNF-α Treatment in the Standard Care Group.
Multiplying Factor for Probability of Switching to anti-TNF-α by Standard Care Group
Increase or Decrease in Escalation Rate to anti-TNF-α after 3 months
ICER (cost per steroid-free remission week)
1 x switch rate (reference case, used RISK-PROKIIDS study) No change 2,720.25
4x Increase 2,750.160.75x Decrease 2,845.980.5x Decrease 3,174.66
0.25x Decrease 3,890.08No switching to anti-TNF-α Decrease 6,291.22
Probabilistic analysis results from a one-dimensional Markov microsimulation model with 10,000 microsimulations. Costs are presented in 2017 Canadian dollars. Abbreviation: ICER= incremental cost-effectiveness ratio.
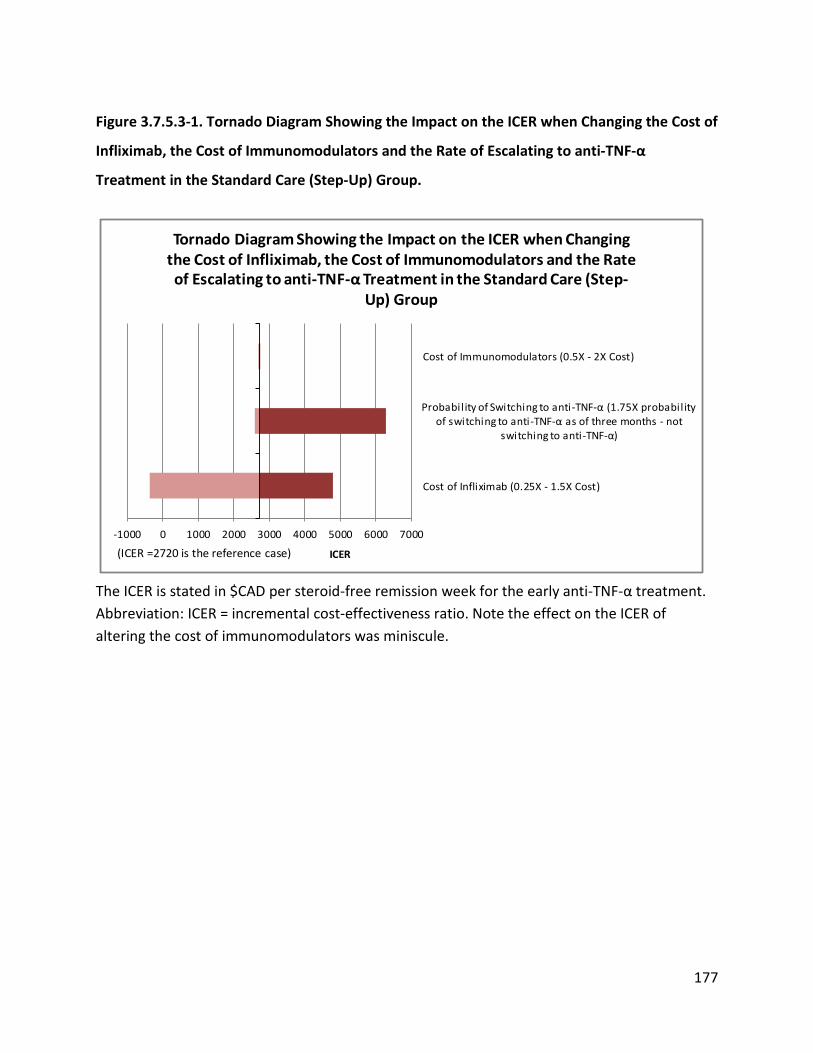
177
Figure 3.7.5.3-1. Tornado Diagram Showing the Impact on the ICER when Changing the Cost of
Infliximab, the Cost of Immunomodulators and the Rate of Escalating to anti-TNF-α
Treatment in the Standard Care (Step-Up) Group.
-1000 0 1000 2000 3000 4000 5000 6000 7000
Cost of Infliximab (0.25X - 1.5X Cost)
Probability of Switching to anti-TNF-α (1.75X probability of switching to anti-TNF-α as of three months - not
switching to anti-TNF-α)
Cost of Immunomodulators (0.5X - 2X Cost)
ICER
Tornado Diagram Showing the Impact on the ICER when Changing the Cost of Infliximab, the Cost of Immunomodulators and the Rate of Escalating to anti-TNF-α Treatment in the Standard Care (Step-
Up) Group
(ICER =2720 is the reference case)
The ICER is stated in $CAD per steroid-free remission week for the early anti-TNF-α treatment. Abbreviation: ICER = incremental cost-effectiveness ratio. Note the effect on the ICER of altering the cost of immunomodulators was miniscule.
178
3.7.6 Validation and Calibration of the Cost-effectiveness Model
The cost-effectiveness model was validated and calibrated as much as possible according to
International Society for Pharmacoeconomics and Outcomes Research (ISPOR) guidelines (Eddy
et al., 2012) considering the lack of external validation and calibration sources with pediatric
data. The mean number of steroid-free medical remission weeks in three years, the mean
number of medical remissions weeks in three years (steroid-free or on steroids), and the
number of surgeries in three years from the RISK-PROKIIDS study were used as calibration
targets for the cost-effectiveness model. The model outputs were compared to the actual
values observed in the RISK-PROKIIDS study to calibrate the model (see Table 3.7.6-1). The
model generated similar results as the RISK-PROKIIDS study and did not require adjustments or
further calibration. The number of surgeries observed in the cost-effectiveness model was
compared to the number of surgeries observed in the RISK-PROKIIDS matched population using
a Chi-squared goodness of fit test and the null hypothesis of the two populations having a
similar distribution was not rejected (p=0.944).
The number of subjects in medical remission at one year from diagnosis served as an external
parameter for model validation. The number of remissions (irrespective of steroid use) in the
cost-effectiveness model were validated against another small pediatric observational study
which examined the use of early intervention with infliximab in pediatric CD (see Table 3.7.6-2)
(Kim et al., 2011), (Y. M. Lee, Kang, Lee, Kim, & Choe, 2015). The Kim et al., 2011 and the Lee et
al., 2015 studies described the same cohort of patients with patients on maintenance infliximab
up to one year. The number of remissions (irrespective of steroid use) at one year in the
present study was also compared to an earlier published study of a portion of the RISK-
PROKIIDS subjects examining early intervention with anti-TNFα treatment (see Table 3.7.6-2)
(Walters et al., 2014). Fifty-two percent of patients in the standard care (step-up) group were in
remission at one year in the present study while 45% of step-up patients were in remission in
the Kim et al, 2011 and Lee et al, 2015 study and 54% were in remission in the Walters et al.,
2014 study. Sixty-six percent of early anti-TNF-α intervention patients were in remission at one
year in the present study and 83% and 85% of early anti-TNF-α intervention patients were in
179
remission in the Kim et al., (2011) and Walters et al., (2014) studies respectively. Sixty-three
percent of patients in the early anti-TNF-α group were in remission in the RISK-PROKIIDS
population. The RISK-PROKIIDS study informed the Walters (2014) study but patients were
allocated differently than in the present study. It is possible that the patients included in the
Walters (2014) study were not all the same patients that were included in our study. The Kim et
al., (2011) study was a small study population with only 18 patients treated with early anti-TNF-
α intervention and 11 patients in the step-up group. Therefore, the percentage of patients in
remission at one year may seem high compared to the results of our model.
The percent of pediatric Crohn’s disease-related surgeries among CD patients in Ontario in
three years (14.7%) based on an epidemiological study also served as an external validation
target for the model (Eric I Benchimol et al., 2014). In the present study, 15.3% (1,527/10,000)
of CD patients across both comparator groups, had surgery within three years. Due the scarcity
of studies examining early anti-TNFα treatment in naïve pediatric CD subjects, the model could
not be validated more extensively. However, the model appeared to have good face validity
based on the limited comparisons conducted and did not require further calibration.
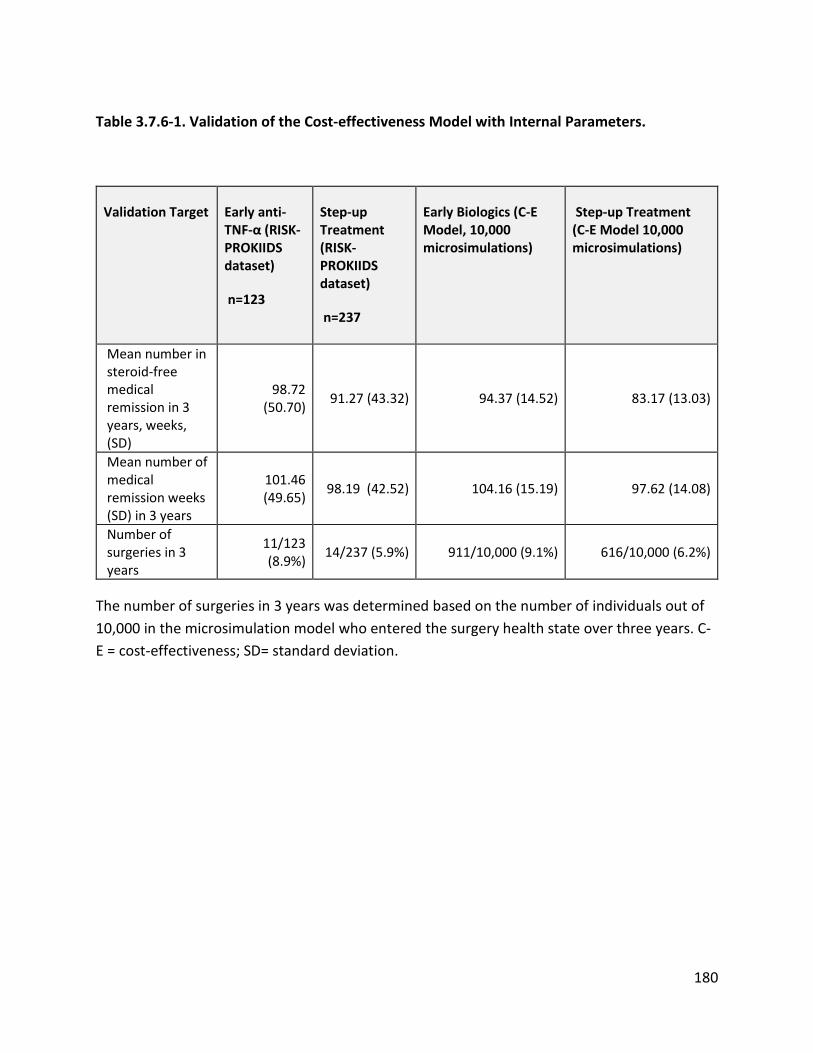
180
Table 3.7.6-1. Validation of the Cost-effectiveness Model with Internal Parameters.
Validation Target Early anti-TNF-α (RISK-PROKIIDS dataset)
n=123
Step-up Treatment (RISK-PROKIIDS dataset)
n=237
Early Biologics (C-E Model, 10,000 microsimulations)
Step-up Treatment (C-E Model 10,000 microsimulations)
Mean number in steroid-free medical remission in 3 years, weeks, (SD)
98.72 (50.70) 91.27 (43.32) 94.37 (14.52) 83.17 (13.03)
Mean number of medical remission weeks (SD) in 3 years
101.46 (49.65) 98.19 (42.52) 104.16 (15.19) 97.62 (14.08)
Number of surgeries in 3 years
11/123 (8.9%) 14/237 (5.9%) 911/10,000 (9.1%) 616/10,000 (6.2%)
The number of surgeries in 3 years was determined based on the number of individuals out of 10,000 in the microsimulation model who entered the surgery health state over three years. C-E = cost-effectiveness; SD= standard deviation.
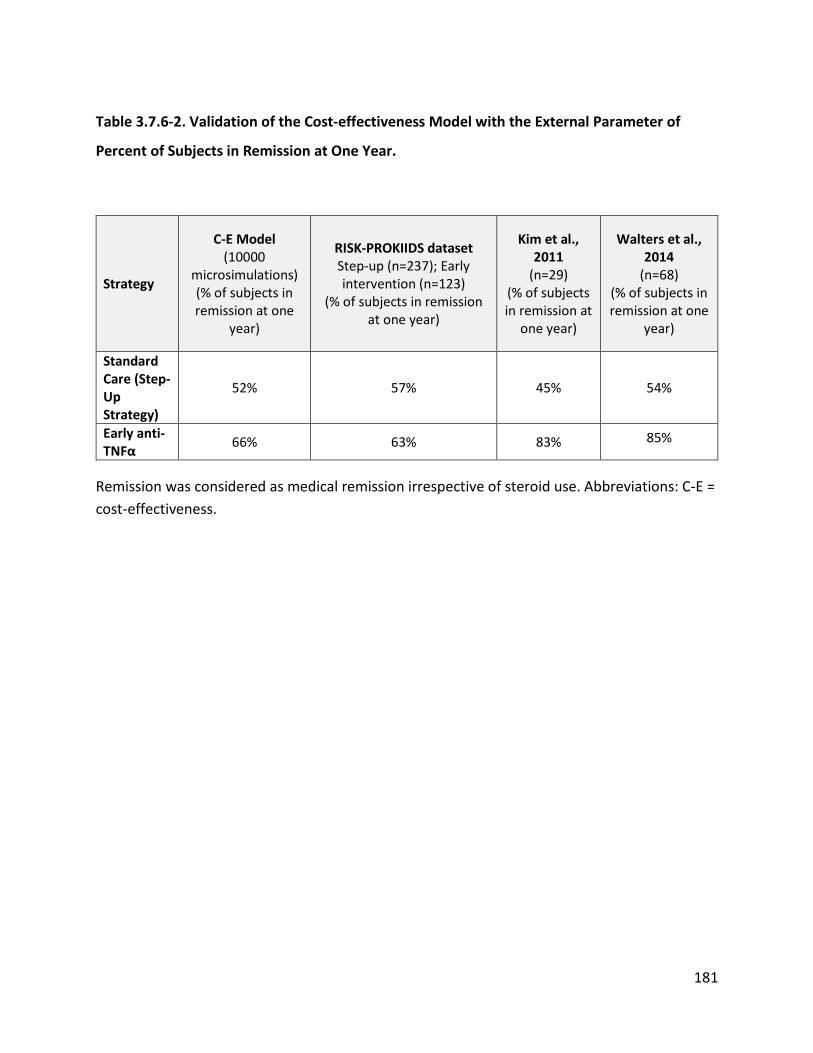
181
Table 3.7.6-2. Validation of the Cost-effectiveness Model with the External Parameter of
Percent of Subjects in Remission at One Year.
Strategy
C-E Model (10000
microsimulations) (% of subjects in remission at one
year)
RISK-PROKIIDS dataset Step-up (n=237); Early intervention (n=123)
(% of subjects in remission at one year)
Kim et al., 2011
(n=29) (% of subjects in remission at
one year)
Walters et al., 2014
(n=68) (% of subjects in remission at one
year)
Standard Care (Step-Up Strategy)
52% 57% 45% 54%
Early anti-TNFα 66% 63% 83% 85%
Remission was considered as medical remission irrespective of steroid use. Abbreviations: C-E = cost-effectiveness.
182
3.7.7 Microsimulations and Sampling in the Cost-effectiveness Model
Ten thousand individual-level (one dimensional) Monte Carlo microsimulations were conducted
to exceed the minimum 5,000 simulations recommended by CADTH guidelines (Benchimol et
al., 2017; Canadian Agency for Drugs and Technologies in Health (CADTH), 2017). To confirm
that 10,000 microsimulations was adequate, the incremental cost-effectiveness ratio (ICER) was
compared with several numbers of microsimulations (see Figure 3.7.7-1). Figure 3.7.7-1 shows
that the ICER value (over three years and with a 1.5% annual discount rate using a health payer
perspective) is similar between 1,000 and 100,000 microsimulations. The graph suggests that
10,000 microsimulations are adequate to yield a robust ICER in the cost-effectiveness model.
The probabilistic analysis was undertaken, whereby all distributions were sampled using a two-
dimensional (2-D) microsimulation which sampled 50 samples of 10,000 individuals. Fifty
samples were chosen as this was the minimum number of samples that showed a consistent
ICER (see Figure 3.7.7-2).
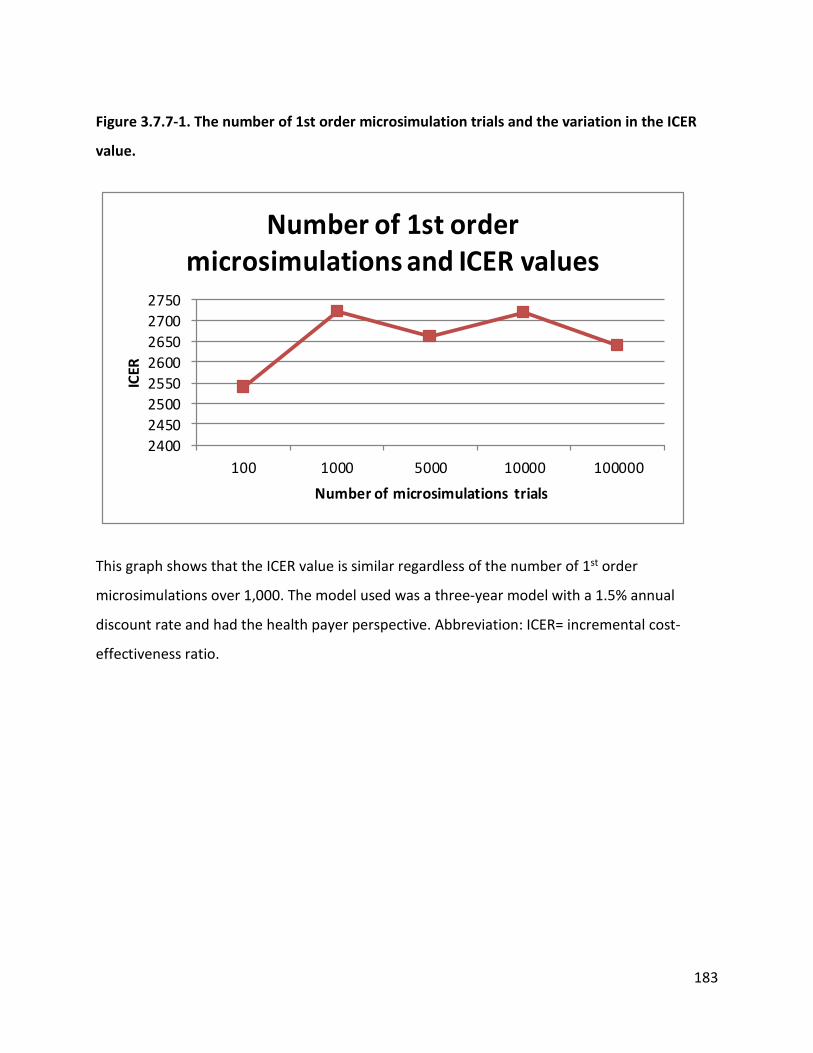
183
Figure 3.7.7-1. The number of 1st order microsimulation trials and the variation in the ICER
value.
24002450250025502600265027002750
100 1000 5000 10000 100000
ICER
Number of microsimulations trials
Number of 1st order microsimulations and ICER values
This graph shows that the ICER value is similar regardless of the number of 1st order
microsimulations over 1,000. The model used was a three-year model with a 1.5% annual
discount rate and had the health payer perspective. Abbreviation: ICER= incremental cost-
effectiveness ratio.
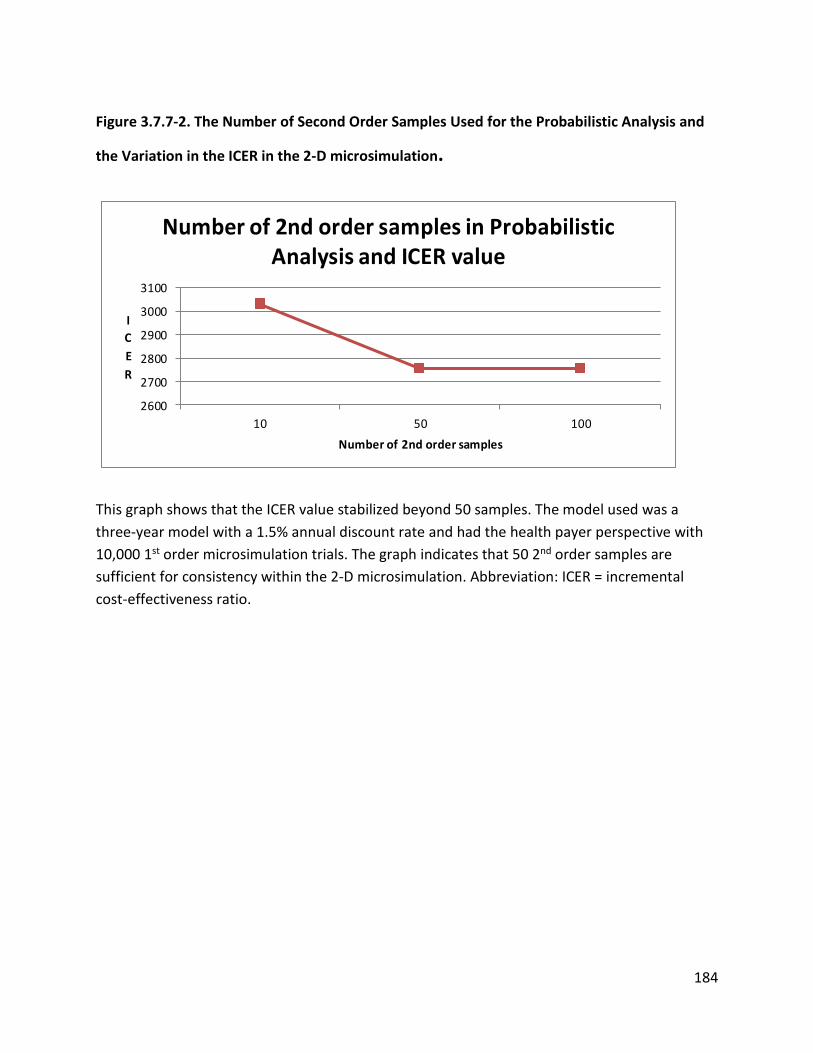
184
Figure 3.7.7-2. The Number of Second Order Samples Used for the Probabilistic Analysis and
the Variation in the ICER in the 2-D microsimulation.
2600
2700
2800
2900
3000
3100
10 50 100
ICER
Number of 2nd order samples
Number of 2nd order samples in Probabilistic Analysis and ICER value
This graph shows that the ICER value stabilized beyond 50 samples. The model used was a three-year model with a 1.5% annual discount rate and had the health payer perspective with 10,000 1st order microsimulation trials. The graph indicates that 50 2nd order samples are sufficient for consistency within the 2-D microsimulation. Abbreviation: ICER = incremental cost-effectiveness ratio.
185
3.7.8 Summary of Cost-effectiveness Analysis
A two-dimensional Markov microsimulation model with incorporated probabilistic analysis was
used to determine the incremental cost-effectiveness of early anti-TNF-α intervention
compared to standard care in moderate to severe pediatric Crohn’s disease patients. The early
anti-TNF-α intervention was more costly but more effective than standard care of step-up
therapy over three years in a population of children with moderate-to-severe Crohn’s disease.
The incremental cost of early anti-TNF-α intervention per additional steroid-free remission
week was $2,756 for the reference case compared to standard care. The incremental cost of
early anti-TNF-α intervention per additional steroid-free remission week was $2,968 for the
reference case from a societal payer perspective compared to standard care. If steroid use was
not taken into account, then the incremental cost of early anti-TNF-α intervention per
additional remission week was $4,679 for the reference case from a health care payer
perspective and $5,040 from a societal perspective. There was uncertainty in the model arising
from the imputation of missing data and propensity score matching of the reference patient
population used to inform health state transition probabilities. The cost-effectiveness model
run using probability inputs from an averaged population of patients was different than the
cost-effectiveness model run with separate imputed datasets and the mean of the mean
incremental cost-effectiveness ratios (using the “Within” datasets) was higher than the
incremental cost-effectiveness ratio from the averaged population. Parameter uncertainty was
due to the large variation in health state transitions and treatment regimens of the patients.
The incremental cost effectiveness ratio was sensitive to the price of infliximab based on a one-
way sensitivity analysis and to the rate at which the standard care group adopted anti-TNF-α
treatment three months after diagnosis.
186
Discussion
4.1 Overview
Since there is a keen interest to introduce effective treatment as early as possible and to
maintain remission for as long as possible, a cost-effectiveness analysis was conducted
comparing early intervention with anti-TNF-α treatment and standard care (step-up treatment)
in children with moderate-to-severe Crohn’s disease from a health care public payer
perspective and a societal perspective. The incremental cost per additional steroid-free
remission week was $2,756 ($CAD) for the early anti-TNF-α intervention for the reference case
from a public health care payer perspective. From a societal perspective, the incremental cost
per additional steroid-free remission week was $2,968 ($CAD) for the early anti-TNF-α
intervention for the reference case. With both perspectives, the early anti-TNF-α intervention
was more costly but more effective than standard care. However, there was considerable
uncertainty in the results as reflected by the cost-effectiveness acceptability curves, which
showed that at a hypothetical willingness-to-pay threshold of approximately $3,500 per week in
steroid-free remission, neither strategy is dominant over the other. An actual willingness-to-pay
threshold on behalf of the health care public payer for a week in steroid-free remission is
unknown.
The following chapter will discuss the results of the cost-effectiveness analysis of early
intervention with anti-TNF-α treatment compared to standard, step-up care in children with
moderate-to-severe Crohn’s disease. The results of this research will be compared to other
economic evaluations of anti-TNF-α treatments in Crohn’s disease. Since economic evaluations
that take a societal perspective are rare but highly relevant to economic evaluations in child
health, the differences in the cost-effectiveness outcomes between the societal and public
health care payer perspectives will be discussed. Following the discussion on perspectives, the
strengths, limitations and generalizability of the study will be discussed.
Based on the Crohn’s Disease health technology assessment theoretical framework presented
in Figure 1.7-1, an economic evaluation may have an impact on clinical practice policies or

187
clinical management practices, and drug coverage and pricing policies. In line with this
framework, the results of the economic evaluation presented here will be discussed in terms of
its potential impact on current clinical practice, and CD treatment coverage policies. How
various stakeholders such as clinicians, policy makers, researchers, manufacturers, patients and
caregivers may use the information of the cost-effectiveness analysis will also be examined.
Since Crohn’s disease treatment is rapidly evolving and recent changes may not have been
incorporated into the present study, a discussion of the impact of biosimilars and new biologic
market entrants and their potential impact on cost-effectiveness of pediatric CD treatments will
be discussed. Finally, future research and concluding remarks will be outlined.
4.2 The Cost-Effectiveness of Early Anti-TNF-αTreatment in Pediatric Crohn’s Disease and Related Research
This study represents the first cost-effectiveness analysis examining early intervention with
anti-TNF-α treatment in treatment-naïve pediatric Crohn’s disease and comparing it to standard
care defined as traditional step-up therapy with biologics. Using anti-TNF-α treatment earlier in
the treatment process in newly-diagnosed pediatric CD patients has been shown to improve
clinical remission outcomes compared to standard care (Walters et al., 2014). Other economic
evaluations examining anti-TNF-α treatments in children with Crohn’s disease conducted
comparisons in children refractory to conventional treatments or used previous or older
versions of standard care comparator arms that did not contain the anti-TNF-α treatment at all
(Punekar et al., 2010; Veereman et al., 2013). This study is novel in that it represents the
current standard care of step-up therapy in which patients can be placed on anti-TNF-α
treatment later in their course of treatment after trying other non-biologic treatments.
Therefore, the main difference to published work is the timing of initiating anti-TNF-α
treatment. The other main difference in this study is the primary clinical outcome of number of
steroid-free remission weeks experienced by patients as compared to the number of patients in
remission at a certain time point (Walters et al., 2014), or quality of life (Assasi et al., 2009;
Blackhouse et al., 2012b; Jaisson-Hot et al., 2004; Punekar et al., 2010; Reinink et al., 2011).
188
Having steroid-free remission weeks as a clinical outcome is particularly relevant for a pediatric
population since steroids have been shown to affect growth and brain development in children
and therefore there is a desire to minimize steroid use (Heuschkel et al., 2008; Mrakotsky,
Watson, Waber, Grand, & Rivkin, 2013). In the cost-effectiveness analysis presented here,
steroid-free remission weeks were used as the effect measure but weeks in remission
irrespective of steroid use were also determined. The incremental effect of early anti-TNF-α
treatment compared to standard step-up care was greater with an outcome of steroid-free
remission weeks (11.3 weeks in steroid-free remission) than weeks in remission irrespective of
steroid use (6.7 more weeks in remission for early anti-TNF-α treatment compared to standard
care), thus making the early anti-TNF-α intervention more advantageous than standard care
when considering that it was more effective at prolonging steroid-free remission. Anti-TNF-α
treatments (infliximab and adalimumab) have been shown to be clinically effective at
maintaining steroid-free remission status at weeks 48-52 in a significantly greater number of
adult CD patients than placebo (Jean–Frédéric Colombel et al., 2007; Hanauer SB, 2002;
Hanauer et al., 2002; Peyrin-Biroulet et al., 2008). Sustained corticosteroid-free remission has
been recommended as a primary clinical outcome for pediatric CD clinical trials (F. M.
Ruemmele et al., 2014). Perhaps it should be considered in future pediatric CD cost-
effectiveness analysis studies as well.
While measuring health-related quality of life is relevant to a pediatric patient population,
preference-based quality of life, i.e. utilities, have not been established in a pediatric Crohn’s
disease population and therefore only surrogate measures such as adult Crohn’s disease
utilities have been used in cost-utility analyses in children (Gregor et al., 1997). Whether the
adult CD utilities are a sufficient representation of child CD utilities remains to be established.
A cost-effectiveness analysis with a specific clinical outcome is difficult to compare to other
economic evaluations with anti-TNF-α treatments since most other economic evaluations in
inflammatory bowel diseases are cost-utility analyses (Jean, Audrey, Beauchemin, &
Consortium, 2018). To compare the results of this cost-effectiveness analysis to other economic
evaluations, one would need to convert steroid-free remission weeks to quality-adjusted life
189
years (QALYs). To do so certain assumptions need to be made in an unvalidated and
hypothetical exercise. In the absence of childhood utilities, if adult CD utilities were used based
on work done by Gregor et al, 1997, then the remission health state would be allocated a value
0.96 based on the time trade off method and 0.88 based on the standard gamble method for
those with moderate CD (Gregor et al., 1997). If it is assumed that a steroid-free remission year
is allocated a utility weight of 0.88-0.96, then a steroid-free remission week could represent
0.017-0.018 QALYs, and the incremental effect (11.29 weeks) of early anti-TNF-α treatment
would be approximately 0.19-0.21 QALYs compared to standard step-up care. Hence an
incremental cost per steroid-free remission week of $2,755.70 for early anti-TNF-α
intervention compared to standard care (step-up therapy) could be roughly translated into an
incremental cost per QALY of $149,266-$162,836 ($CAD) for early anti-TNF-α treatment
compared to standard care (step-up) treatment over three years.
In a review of economic evaluations in adult and pediatric inflammatory bowel disease, Jean et
al., 2018 stated that all studies comparing biologic treatments to standard care in CD resulted in
an ICER above the $100,000 ($CAD)/QALY willingness to pay threshold in the Canadian setting
(Jean et al., 2018). In pediatric economic evaluations reporting QALY’s, adult CD utilities were
used as utility measures in the absence of pediatric CD utilities (Jean et al., 2018). Standard care
in these cases was not defined as step-up treatment with biologics. Recent reviews of cost-
effectiveness studies of biological agents including anti-TNF-α treatments for the treatment of
inflammatory bowel disease showed a wide range of costs per QALYs owing to the diverse
outcomes, treatment paradigms and patient populations (Huoponen & Blom, 2015; Jean et al.,
2018; Pillai, Dusheiko, Burnand, & Pittet, 2017). A systematic review of studies in adults of
biological treatments for inflammatory bowel disease concluded that while biologics improved
outcomes, they were not cost-effective for maintenance therapy (Pillai et al., 2017). Among the
patients refractory to conventional medical treatment, the incremental cost-effectiveness ratio
for biologics compared to conventional, non-biologic medical treatment ranged from
dominance to $CAD 836,064/QALY in 2017 dollars (€549,335 /QALY in 2014 euros) (Huoponen
& Blom, 2015). A European cost-utility analysis comparing first-line infliximab to non-biologic
190
standard care treatment for peri-anal fistulae in adult CD showed an incremental cost per QALY
of $CAD 667,556 in 2017 dollars (€438,617 in 2014 euros) over one year (Arseneau, Cohn,
Cominelli, & Connors Jr, 2001; Huoponen & Blom, 2015). A recent review examining the efficacy
of early anti-TNF-α treatment (also called top-down treatment) vs a step-up strategy for the
treatment of Crohn’s disease concluded that for pediatric patients, a top-down strategy showed
positive clinical outcomes in larger studies but were inconclusive in smaller studies, however
only a small number of studies were reviewed (Tsui & Huynh, 2018). Overall, research and
evidence supporting top-down therapy remain limited in adult and pediatric CD, and further
studies are needed to determine the most appropriate CD patients to receive a top-down
treatment approach (Tsui & Huynh, 2018).
An economic evaluation similar to our analysis is a cost-utility analysis conducted by Marchetti
et al., (2013) (Marchetti et al., 2013). Marchetti et al., conducted a cost-effectiveness study in
newly diagnosed luminal CD adults comparing treatment with infliximab plus azathioprine plus
corticosteroids if necessary at diagnosis (referred to as the top-down strategy in their study) to
treatment with corticosteroids and azathioprine with infliximab only if necessary in refractory
patients (referred to as step-up strategy in their study) over a five year time horizon (as
opposed to a three year time horizon in our study). Many of their model inputs were based on
one randomized clinical trial conducted in adults with newly-diagnosed CD (Geert D'Haens et
al., 2008). They determined that the incremental effect of the top-down strategy was 0.14
QALYs over five years and that their top-down strategy was dominant yielding a cost-savings of
$CAD 1,120 in 2017 dollars (€773 in 2013 euros) compared to their step-up strategy over a five-
year time horizon from the Italian health care payer perspective. Interestingly, effectiveness
results were similar to our study but in the Italian study, cost-savings were observed. In their
study the price of infliximab was lower than in our study by about $245 per vial and their
hospitalization cost due to adverse events was almost ten-fold less in the Italian health
perspective than in our study. The Marchetti et al. analysis was sensitive to the time horizon
with a $CAD 130,431/QALY in 2017 dollars (€90,000/QALY in 2013 euros) for their top-down
strategy after one year, $CAD 43,477/QALY in 2017 dollars (€30,000/QALY in 2013 euros) after
191
two years and a cost-savings only after five years. Their base case discount rate was higher at
3.5% and their relapse rate was also lower than our study (Marchetti et al., 2013).
Another challenge in conducting cost-effectiveness analysis in CD is the fact that the decision-
maker’s willingness to pay (WTP) for an additional week in steroid-free remission is unknown,
and a formal willingness-to-pay threshold for a QALY in Canada has not been published. In the
United Kingdom a willingness to pay threshold of £20,000 - £30,000 has been published and the
United States commonly uses a threshold of $50,000 per QALY (Shiroiwa et al., 2010; Woods,
Revill, Sculpher, & Claxton, 2016). For low to middle income countries, the World Health
Organization (WHO) has suggested a willingness-to-pay threshold of one to three times the
gross domestic product (GDP) per capita per disability-adjusted life-year (DALY) averted, but
this would not apply to Canada since Canada is not considered a low to middle income country
(Woods et al., 2016; World Health Organization (WHO), 2001). Since a true Canadian WTP is
unknown, cost-effectiveness over a range of WTP’s can only be estimated as shown by the cost-
effectiveness acceptability curves.
The cost-effectiveness acceptability curves shown in Figures 3.7.1-3 and 3.7.2-2 demonstrate
the uncertainty of the cost-effectiveness analysis. In Figure 3.7.1-3, for early anti-TNF-α
intervention, there is a 50% or less chance that the additional cost of a week of steroid-free is at
or less than $3,500, and at a threshold of $6,000 per week of steroid-free remission there is
about a 80% or less chance that the additional cost of a week of steroid-free remission is cost-
effective compared to standard step-up care.
The unknowns relative to willingness to pay in Canada for steroid-free remission weeks and the
uncertainty around the ICER makes making a definitive conclusion about cost-effectiveness of
early anti-TNF-α compared to standard care of step-up treatment challenging. However,
decision makers can still find the information of the cost-effectiveness analysis informative in
their decision making process. The cost-effectiveness analysis has shown that the early
intervention with anti-TNF-α is more costly but more effective at increasing steroid-free
remission time compared to standard step-up care. The analysis of treatment patterns in the
192
RISK-PROKIIDS patients showed that while over fifty percent of patients in the standard care
step-up group adopt anti-TNF-α treatment by the end of three years from diagnosis, some
patients are not taking anti-TNF-α, possibly indicating a preference for not taking anti-TNF-α or
indicating that a clinical need for anti-TNF-α was not determined by the physician. Public
decision makers take several aspects of a treatment strategy, such as clinical effectiveness,
cost-effectiveness, patient preferences, ethical and legal considerations, and equity issues into
consideration before making a decision on whether to fund a treatment strategy (Canadian
Agency for Drugs and Technologies in Health (CADTH), 2017; Health Quality Ontario, 2018).
The analysis presented in this research provides information on the cost-effectiveness and the
clinical effectiveness of early anti-TNF-α. The research also showed that not all pediatric
patients with moderate to severe CD adopt an anti-TNF-α strategy within the first three years of
diagnosis. Decision makers also need to be aware that long-term data on the clinical
effectiveness and cost-effectiveness of early anti-TNF-α treatment beyond three years is not
available. Another difference between the cost-effectiveness analysis presented here and other
studies is the incorporation of the societal perspective in the analysis as well as the public
health payer’s perspective.
4.3 The Societal and Public Health Care Payer Perspectives
A common criticism of economic evaluations of biologics in the treatment of inflammatory
bowel disease has been that many of them have taken a health care public payer perspective
and not a societal perspective thus not including all costs such as caregiver costs and loss of
productivity costs related to Crohn’s disease management (Huoponen & Blom, 2015; Pillai et
al., 2017; D H Tang, A R Harrington, J K Lee, M Lin, & E P Armstrong, 2013). A societal
perspective is always recommended for economic evaluations in child health (W. Ungar &
Gerber, 2010) . The cost-effectiveness analysis in this study has taken both a health care public
payer perspective and a societal perspective. However, the differences in the findings were not
substantial. From a public health care payer perspective, the incremental cost per steroid-free
remission week for early anti-TNF-α treatment compared to step-up standard care was $2,756
and from a societal perspective it was $2,968. The difference between the two perspectives
193
was the inclusion of indirect costs (in the form of caregiver loss of productivity costs) in the
societal perspective in addition to the costs incurred by the Ontario health care public payer.
The main reason for the slight difference in outcomes between the different perspectives is due
to the nature of pediatric drug coverage in Ontario and the disproportionate direct cost of
treatment compared to the indirect costs in Crohn’s disease management, particularly if a child
is on anti-TNF-α treatment. Loss of productivity costs are of particular importance since they
account for an overall cost to society due to the illness. Since children are dependent on
caregivers, loss of productivity costs for caregivers of children with CD can be significant over
time since CD is a chronic illness that requires ongoing physician visits, possible infusion clinic
visits and possible hospital stays. Once the child grows to adulthood, his or her own loss of
productivity due to illness would be included in the societal perspective. The time horizon in
our economic evaluation was only three years. Hence the long term loss of productivity cost to
society of caregivers and of CD-afflicted adults was not considered in societal costs. A life time
horizon is suggested for economic evaluations (Canadian Agency for Drugs and Technologies in
Health (CADTH), 2017). A lifetime horizon would allow the inclusion of loss of productivity of
caregivers and afflicted adults over the lifetime of the patient impacting the cost-effectiveness
analysis. However, a three year time horizon was chosen since long-term effects of early anti-
TNF-α are unknown. If early anti-TNF-α were found to reduce productivity loss over the long-
term, the strategy may have been found to be more cost-effective than standard step-up care.
Anti-TNF-α treatment has become the major cost in CD treatment in recent years (van der Valk
et al., 2014). Recently Ontario has introduced provincial public drug coverage for all children
under the age of 25 (Ontario Ministry of Health and Long-Term Care, 2018b). This change may
reduce the role of the private insurance payer for pediatric drug coverage in Ontario until full
public coverage is completely implemented. Therefore, it was assumed that all treatment costs
were attributed to the provincial public payer. While some costs, such as infusion clinic
expenses, may be administered by private clinics, in our study, it was assumed that the Ontario
public payer was responsible for these costs. It is also important to remember that Crohn’s
disease is a chronic disease that requires management in the form of drug treatments and
physician visits during the active phase of the disease and the remission phase of the disease.
194
Hence, during the remission phase of the disease, loss of caregiver productivity is still an issue
albeit less frequent.
4.4 Biologics Drug Policy
Drug coverage for biologics is complex, varies from province to province, and is costly for the
provincial health care systems. Since January 2018, Ontario has implemented comprehensive
drug coverage for children. Quebec has mandated private or public drug coverage for all
residents and other provinces have a mixture of private and public plans depending on age and
financial need (Fiona M. Clement, Lesley J.J. Soril, Herbert Emery, David J.T. Campbell, & Braden
J. Manns, 2016 ). In a recent study of people surveyed in four western provinces, 61.2% (British
Columbia) to 76.4% (Alberta) of people under the age of 65 had private drug coverage
insurance while 18.9 % (British Columbia) to 24.4% (Manitoba) of people with an income of
lower than $30,000 had private insurance (Fiona M. Clement et al., 2016 ). Due to the high
costs of biologic treatments and financial constraints of most families, the burden of paying for
anti-TNF-α treatments falls to the public payer. Anti-TNF-α drugs account for the highest
proportion of public drug spending in Canada at 8.7% (Canadian Institute for Health
Information, 2017). Therefore, ensuring that treatment with anti-TNF-α is done in a medically
and financially responsible way is of particular concern to provincial health ministries.
The current anti-TNF-α treatments (both brand name and biosimilar versions) and newer
biologic treatments have different public coverage rules depending on the province
(Gastrointestinal Society, 2017). For example, naïve CD patients are now forced to start on the
biosimilar version of infliximab, Inflectra® instead of choosing the brand name Remicade® in all
provinces except for Saskatchewan (Gastrointestinal Society, 2017). In Ontario, Remicade® is
not on the Ontario Drug Benefit Formulary and is only available through the Exceptional Access
Program (Ontario Ministry of Health and Long-Term Care, 2018a). Applications to the
Exceptional Access Program are filed by the attending medical practitioner. In addition, with
the newly-elected provincial government, recent changes to the Ontario OHIP+ program have
extended private drug coverage for children who have private insurance plans prior to
195
accessing the publicly funded program. Rapid changes to drug funding programs for children
can create confusion on where to apply for drug coverage for children’s drugs and may create
unnecessary delays. (Ontario Ministry of Health and Long-Term Care, 2016a). Constraints and
delays for patients covered through public payers may delay access to treatments and affect
subsequent clinical outcomes for CD patients (Rumman et al., 2017). Rumman et al., 2017
showed that IBD patients in Ontario with public drug coverage experienced greater delays in
access to anti-TNF-α therapy than privately insured patients, and had a higher rate of
hospitalization and emergency room visits related to IBD. Since many Ontario pediatric CD
patients may now be relying exclusively on the province for their drug coverage, their clinical
outcomes may be negatively affected as well. Research evaluating the new drug program in
Ontario is required to examine whether the OHIP+ program affects timely access to anti-TNF- α
therapy. The changes and uncertainty regarding the OHIP+ program in Ontario and evolving
private and public drug coverage policies could raise access and equity issues with respect to
biologic treatment. Those with private insurance may receive treatment sooner than those who
do not. Those in provinces with established systems and policies in place on how to cover
expensive provinces may receive treatment sooner than those in provinces where changes to
coverage policy are evolving. Nevertheless, our cost-effectiveness model shows that
intervention with anti-TNF-α sooner than later results in a better clinical outcome in the form of
time in steroid-free remission even though it is more costly from a societal and public payer
perspective. Our results did not indicate that hospitalization was reduced with early anti-TNF-α
intervention. Decision makers should be aware that earlier intervention may result in better
clinical outcomes and not create unnecessary delays in treatment due to policy or
administrative issues.
4.5 Strengths and Limitations
4.5.1 Strengths of the Study
There are five main strengths of the cost-effectiveness analysis that was conducted: 1) it is the
first cost-effectiveness analysis in pediatric Crohn’s disease examining early anti-TNF-α
intervention to incorporate a societal perspective; 2) it uses the clinical outcome of steroid-free
196
remission weeks as the effectiveness measure which is particularly relevant to pediatric CD
concerned with growth; 3) it uses a large multi-centre North American observational study to
inform model inputs to increase generalizability; 4) it uses an individual microsimulation model
that incorporates the wide variability in patient characteristics and health experiences; and 5) it
assesses different methods of propensity score analysis and data assembly when dealing with
patient-level data. Each of these strengths will be discussed further below.
This study was the first economic evaluation of early introduction of anti-TNF-α treatments in
pediatric Crohn’s disease that examined the health care public payer and societal perspectives.
The societal payer perspective took into account the economic burden experienced by
caregivers through loss of productivity as a result of managing a child’s Crohn’s disease. It was
important to consider caregiver costs because children are dependent on their caregivers for
support such as time spent in caregiving.
A cost-effectiveness analysis (CEA) was chosen for this economic evaluation as opposed to a
cost-utility analysis (CUA) (the recommended approach) because of the lack of established
childhood health utilities in this patient population. The CEA allowed the comparison to other
studies (see section 4.2) based on clinically relevant outcomes in pediatric CD such as the
effectiveness measure of steroid-free remission weeks, which is of particular concern in
children with CD, since the disease and corticosteroid use can negatively impact their growth.
The study data were drawn from the RISK-PROKIIDS study, a large North American
observational study of newly-diagnosed CD children where patients were treated according to
the physician’s discretion. Hence the data were pragmatic and reflected actual clinical practice
as opposed to the controlled situation in a randomized controlled trial. This increased the
generalizability and external validity of the results as the patient population reflected a diverse
North American population as shown by the patient characteristics. The generalizability of the
results is discussed in more detail in the next section.
Since patients were not treated according to a strict protocol and in a randomized controlled
trial, the possibility of selection bias in treatment selection was not accounted for, thus
197
questioning the comparability and internal validity of the comparator groups without
adjustments for potential bias. The observational database, with patient-level data, provided
another advantage in that it reflected the variation in characteristics, disease and treatments
received in patients as opposed to a clinical trial which can be constrained by a regimented
treatment pattern. The patient-level data informed the microsimulation model which could
accurately account for an individual’s characteristics and their individual experience of going
back and forth between the active disease and remission health states. A cohort model would
not be able to capture all the variation in the patient population compared to the
microsimulation model.
The disadvantage of the observational data is that selection bias may be present such as the
possibility of patients of a particular ethnic background being treated with more aggressive
treatments than other patients despite similar disease severity. By treating all patients in a
similar fashion, and randomizing patients, an RCT would avoid an imbalance in allocation to
treatment group based on patient characteristics. To account for this, propensity score analysis
was used to construct the comparator groups. The strength of propensity score analysis was
that it aided in defining comparator groups in observational data to mimic the randomization of
a randomized controlled trial by choosing patients in treatment and control arms that had the
same propensity to receive each treatment. In preparing data for the cost-effectiveness model,
several propensity score analysis methods were assessed and the method that optimized
balance between the comparator groups was chosen. While unknown at the start of this study,
the presence of missing data in the patient-level data triggered the imputation of missing data
to maintain a large sample population and also highlighted the options of combining imputed
data sets which had not been previously discussed within the context of preparing inputs for a
microsimulation cost-effectiveness model. The study conducted here examined the “Across”
and “Within” methods and highlighted the fact that additional research should be conducted
on this issue.
198
4.5.2 Limitations of the Study
A potential limitation of the study was that the study population may not reflect community or
rural CD patients since all the recruiting sites are in major urban centers. Another limitation of
the RISK-PROKIIDS data source was that it could be skewed towards reflecting U.S. clinical CD
practice as opposed to Canadian practices since most of the sites are in the United States. To
account for this difference Canadian costing was used, and the RISK-PROKIIDS data was mainly
used to inform health state transition probabilities. There was no apparent difference among
the health states of Canadian patients and American study patients, which is discussed in more
detail in the next section.
The study conducted was based on observational data. A limitation of using observational data
was that it had the potential to introduce several sources of bias into the study. The fact that
the study was not blinded and that subjects were treated accorded to the physician’s discretion
could have led to selection bias in which clinicians may have selected certain patients to receive
a particular treatment over others. Selection bias was accounted for through propensity score
analysis. Recall bias on behalf of patients may have been present when relaying disease activity
for assessment of the Pediatric Crohn’s Disease Activity Index and response bias may have been
present on behalf of clinicians who may have reported favourable outcomes in patients treated
more aggressively. However, it was assumed that physical assessment of disease and laboratory
values would support the subjective assessment of disease. Endoscopies were conducted at the
discretion of the physician and therefore physical assessment of disease and mucosal healing
were not part of the assessment of remission in this study. Therefore, internal validity may have
been limited, but pragmatically, endoscopies are not always conducted regularly therefore
supporting the generalizability and external validity of the assessments. The study patients
were a subset of the larger, ongoing, observational RISK-PROKIIDS study which included
patients with ulcerative colitis and Crohn’s disease. Patients included in the economic
evaluation met the study’s inclusion criteria and therefore patients had to have health state
data for a minimum of three years past diagnosis. Loss to follow-up was recorded as part of the
RISK-PROKIIDS data and none of the included patients were recorded as being lost to follow-up.
199
It should also be noted that while the outcome has been presented as weeks in remission.
Outcomes were based on the RISK-PROKIIDS study which only recorded health states every six
months or so. Hence, the health state between the six month study visits was an assumption
which was translated to the weekly cycle of the model. To compensate for the parameter
uncertainty within the six month interval, a probabilistic analysis was conducted using beta
distributions assigned to health state transition probabilities.
The observational nature of the RISK-PROKIIDS study included a wide variety of patients with
various baseline characteristics. To account for the variation in baseline characteristics of
patients among the treatment groups, propensity scoring analysis was used. A limitation of
propensity scoring analysis is that while it can serve to reduce imbalanced allocation within an
observational study, the methodology can reduce the sample size of the comparator groups.
From an unadjusted population of 573 patients, the adjusted population included 360 patients
with 237 in the standard care group and 123 in the early anti-TNF-α intervention group.
Compared to other small pediatric CD studies of fewer than a hundred patients, this study still
maintained a reasonable sample size. An argument could be made that the propensity score
matching process with a resultant 123 patients in the early anti-TNF-α group could have
excluded patients with a high propensity score to be treated (see Figure 3.4.5-1 for unmatched
treatment group) thus creating differential bias. If those patients had shown a greater response
to the anti-TNF-α, the early anti-TNF-α intervention may have shown to be more cost-effective.
However, this does not seem to be the case, since when comparing the proportion of patients
in remission and steroid-free remission between the unadjusted and adjusted populations, the
results are very similar. For example, at one year the proportion of patients in the early anti-
TNF-α group in the unadjusted population (n=131) in steroid free remission was 61.1% and
61.0% in the adjusted population. The differences in proportion of patients in remission and
steroid-free remission between the standard care group and the early anti-TNF-α group in the
adjusted and unadjusted populations were also similar.
Another limitation of this study was that the RISK-PROKIIDS study was originally designed to
investigate the genetic, microbial and environmental impacts on children with CD. As such, the
200
data collected address those questions and not the clinical efficacy or cost-effectiveness of anti-
TNF-α treatments per se. As a result, certain relevant economic inputs such as outpatient
resource use, parental costs or productivity losses, drug dosages, or clinical outcomes such as
mucosal healing, anti-TNF-α trough level results or therapeutic drug monitoring were not
assessed for patients (Al Hadithy et al., 2005; G. D'Haens, 2004; Vande Casteele et al., 2013).
The lack of these data may affect current practice, costing, and clinical effectiveness
assessments and hence may affect the external validity of this study. Similarly, the rapid
evolution of treatments in CD, with the entry of new biologics and biosimilars into the market,
was not included in the study. The study was limited in that it only included the costs of brand
name infliximab and adalimumab because these were the treatments used by the RISK-
PROKIIDS patients. Not including more recently introduced biologic treatments and biosimilars
may have affected the external validity of the study since the variation in current treatment
costs were not taken into account. However, to compensate for this limitation, a scenario
analysis of altering the price of infliximab was conducted.
A criticism of this study may be that for a chronic life-long illness, a 3-year time horizon is too
short and that a life time horizon would be more suitable. However, at the moment, there is
very limited long-term safety and efficacy data beyond three years in newly-diagnosed children
with CD prescribed anti-TNF-α treatments as first line therapy. One argument could be that
adult data could have been used to model outcomes and extrapolate beyond a pediatric time
frame, however, pediatric patients respond differently to anti-TNFα treatments than adults so it
is possible that children who have received infliximab in childhood and graduate to adulthood
may have different outcomes than adult patients thus increasing parameter uncertainty
(Hanauer SB, 2002; Gary R Lichtenstein, 2013). The choice of a 3-year time horizon allowed the
results to be more easily compared to other economic evaluations in pediatric CD (Punekar et
al., 2010) and studies in adult Crohn’s patients (Assasi et al., 2009; Blackhouse et al., 2012a;
Canadian Agency for Drugs and Technologies in Health (CADTH), 2009; Lindsay et al., 2008).
Another challenge in assessing long-term outcomes is the uncertainty in the loss of response to
treatment. Loss of response to anti-TNF-α treatment is a concern and can occur in
201
approximately 30% of patients over time (Gouldthorpe et al., 2013). At this time, it is difficult to
know which patients would lose response and whether their treatment options would be dose
escalation or a switch to another treatment. Since there is considerable uncertainty and a lack
of long-term data, a longer term or lifetime time horizon would not be robust. The effect of
discounting in the long-term model would likely decrease the gap between the clinical
effectiveness of early anti-TNF-α treatment and standard step up care since clinical results
would be realized early in treatment, and more patients in the step-up strategy would be on
anti-TNF-α treatment later on. Hence the early anti-TNF-α may be even less cost-effective over
a longer term.
Another limitation of the study was a lack of balance between the first order and second order
microsimulations due to limitations in computing power. There were 10,000 first order
microsimulations, and 50 second order microsimulations.
4.6. Generalizability of the Study
The RISK-PROKIIDS study, a multi-centre, observational cohort of pediatric Crohn’s disease
patients, analyzed retrospectively, informed the health state transition probabilities and served
as the representative pediatric Crohn’s disease patient population in the cost-effectiveness
study. Patients in the RISK-PROKIIDS study were treated according to the physician’s discretion
and not according to a particular protocol. Hence, treatment of patients was pragmatic and
reflected actual clinical practice as opposed to a randomized clinical trial. This increased the
generalizability and external validity of the results as the results reflected a diverse North
American CD population. The study included 25 sites in the United States and 3 Canadian sites.
All the sites were in major urban centres and almost all of them identified themselves as having
an affiliation with an academic institution. Therefore, while they were scattered across the U.S.
and Canada, they may not reflect the treatment patterns of a rural CD population.
As mentioned in the previous section, from a Canadian perspective, a limitation of the study
could be that since there were fewer Canadian sites, treatment practices could be skewed
towards U.S. clinical practice. Following propensity score matching, 57 out of 237 (24.1%)
202
Canadian patients were in the standard step-up care group, and 12 out of 123 (9.8%) Canadian
patients were in the early anti-TNF-α group. The treatment and health state of the Canadian
patients and their health state did not appear to differ substantially from their American
counterparts. The rate at which Canadian patients adopted anti-TNF-α treatment compared to
their American counterparts in the propensity matched standard care group from the RISK-
PROKIIDS study was similar. After one year, 30% of Canadian CD patients were on anti-TNF-α
and 26% of Americans in the standard care group were on anti-TNF-α, and at three years post-
diagnosis, 63% of the Canadians and 53% of Americans on anti-TNF-α treatment (see Appendix
22).
A recent survey of pediatric IBD clinicians that examined regional differences in anti-TNF-α
practice patterns in children with IBD showed somewhat different results with a median of 36%
of Canadian practitioners treating luminal CD pediatric patients with anti-TNF-α treatment
compared to a median of 50% for U.S. practitioners (Peter C Church et al., 2018). The same
study showed that anti-TNF-α therapy in pediatric IBD patients was more prevalent in North
America compared to Europe and other countries (Peter C Church et al., 2018). Therefore, the
cost-effectiveness analysis presented here would be more applicable to a North American
practice setting. Despite the possibility that Canadian treatment practices may differ slightly
from American treatment practices, the cost-effectiveness analysis could still be applicable to a
Canadian population since treatment costs were based on Canadian costs and Canadian
resource use.
Certain aspects of the cost-effectiveness analysis would be of interest to decision makers in
jurisdictions within Canada and outside of Canada when making funding decisions. The scenario
analysis of the price of infliximab affecting the cost-effectiveness early anti-TNF-α is of
particular interest to decision makers in various jurisdictions. Inflectra®, the biosimilar version
of infliximab, ranges from $CAD 525 in Alberta to $CAD 650 per vial in Saskatchewan. The
scenario analysis showed that at 50% of the price of Remicade®, the cost of an additional week
of steroid-free remission was $CAD 659 which is approximately the cost of an additional dose of
infliximab in Canada. This analysis shows that, depending on the willingness to pay in a
203
particular jurisdiction for an additional week of steroid-free remission, early anti-TNF-α with
biosimilar infliximab may be cost-effective compared to standard step-up care. While infliximab
is indicated in patients refractory to other treatments, the steroid-sparing nature of early anti-
TNF-α therapy as determined by our cost-effectiveness analysis, would be of interest to
European decision makers as there is preference for steroid-sparing treatments in European
guidelines for pediatric CD management and in the United Kingdom, National Institute of
Health and Care Excellence guidelines (National Institute of Health and Care Excellence, 2016)
(F. Ruemmele et al., 2014).
4.7 Implications for Stakeholders
The results of this cost-effectiveness analysis may impact various stakeholders in different ways
depending on their individual mandates. How the various stakeholders, such as clinicians, policy
makers, researchers, manufacturers, patients and caregivers can use the information from the
cost-effectiveness study is discussed below.
4.7.1. Implications for Clinical Practice
The results of the cost-effectiveness analysis comparing early anti-TNF-α treatment to standard,
step-up care have some notable points for the clinical management of Crohn’s disease in
children. Compared to standard step-up care, intervention with anti-TNF-α within the first three
months of diagnosis resulted in: 1) a greater number of steroid-free semesters or weeks in
remission over a three year period; 2) a greater number of consecutive steroid-free remission
semesters over a three year period; and 3) a greater number of patients in steroid-free
remission at six months (see Table 3.5-4).
Interestingly, over three years, the number of people in steroid-free remission at one year, and
at six month intervals thereafter, was not significantly different among the two comparator
groups. This may have been observed because the endpoint of people in remission at a given
point is a snapshot in time and does not account for the individual’s experience and number of
relapses prior to that point. Observations at approximately six month intervals in the RISK-
PROKIIDS data showed that many patients moved frequently and unpredictably between active
204
and remission phases of diseases. Hence, the number of people in steroid-free remission at any
one time could vary. Clinical researchers should be aware that the endpoint of the number of
people in remission at any given time may not be an adequate endpoint on its own to measure
efficacy of anti-TNF-α treatment and that multiple clinical endpoints should be assessed and
reported to avoid reporting bias. In addition, the number of hospitalizations did not differ
significantly between the two comparator groups, which is also seen in some studies (Tsui &
Huynh, 2018). While this cost-effectiveness analysis used time in remission as the outcome
measure, this outcome can also be described as the relapse free rate. Lee et al., showed that
top-down, or early anti-TNF-α intervention had a longer remission period than a step-up
strategy based on relapse free rate over three years in pediatric Crohn’s disease over three
years (Y. M. Lee et al., 2015).
Our results also highlight the difference between remission irrespective of steroid treatment
and steroid-free remission. The cost-effectiveness analyses showed that early anti-TNF-α
treatment had a greater impact on steroid-free remission weeks (11.3 more weeks than
standard care) than simply weeks in remission (6.65 more weeks). This result demonstrates the
reduction in steroid dependency for the early anti-TNF-α treatment, and its steroid-sparing
qualities, compared to standard care and supports the recommendation to incorporate steroid
use in measuring outcomes for children with CD (Griffiths et al., 2005).
The cost-effectiveness analysis conducted here adds to the sparse literature regarding anti-TNF-
α treatment in pediatric CD. The size of the RISK-PROKIIDS study is large compared to other
pediatric studies examining top-down treatments with biologics (Tsui & Huynh, 2018). The time
horizon of three years can be considered a longer term study than most studies that end after a
year (Y. S. Lee et al., 2012).
From a clinical management perspective, our results seem to support the use of anti-TNF-α
treatments within the first three months of diagnosis. However, due to constraints from the
public payers restricting use of anti-TNF-α to those who have had inadequate response to
conventional treatments, it may be difficult to implement such a strategy. The use of anti-TNF-α
205
treatments as first line treatment in pediatric patients is considered off-label use. The positive
clinical outcome of increased weeks in steroid-free remission with early anti-TNF-α treatment
compared to standard step-up care may lead clinicians to increase off label use of anti-TNF-α
earlier in the treatment of pediatric patients.
Since the results of the cost-effectiveness analysis were based primarily on inputs and
experiences of patients in the RISK-PROKIIDS study, there are several rapidly evolving aspects of
clinical practice that were not addressed. These include assessing the outcome of mucosal
healing, dose escalation of infliximab or adalimumab, assessing a patient’s preference for a
particular anti-TNF-α treatment, and therapeutic drug monitoring. These issues were not
incorporated into the cost-effectiveness model because they are not part of current clinical
practice guidelines or they were not recorded in the RISK-PROKIIDS data. In pediatric luminal
CD, early anti-TNF-α intervention was significantly better than traditional step-up treatment at
improving mucosal healing, which is assessed endoscopically, and is being touted as a predictor
of sustained remission (Kang et al., 2016; Nuti et al., 2013). Therapeutic drug monitoring, and
management of loss of response to biologics are also becoming more common in clinical
practice but were not modeled in the cost-effectiveness model since they are newer practices,
not widely accessible for all patients and were not observed in the RISK-PROKIIDS data (Ding,
Hart, & De Cruz, 2016). The anti-TNF-α treatment used in the RISK-PROKIIDS study was
primarily infliximab since it was the first anti-TNF-α available for pediatric CD and some patients
started the study in 2009. Since then, adalimumab, administered by injection, has also become
more prevalent as an anti-TNF-α treatment option. Early use of adalimumab showed positive
clinical outcomes in pediatric CD (Kierkus et al., 2013). With increased treatment and
management options, clinicians need to be aware that treatment is increasingly more
individualized and that initial aggressive therapy, while clinically effective in some patients, may
not be necessary in all patients (J.-F. Colombel, Narula, & Peyrin-Biroulet, 2017; Rogler, 2013;
Torres, Mehandru, Colombel, & Peyrin-Biroulet, 2017).
206
4.7.2 Implications for Policy
The purpose of this study was to provide additional evidence to support policy decision making
regarding the use and timing of anti-TNF-α treatments for the treatment of moderate to severe
pediatric Crohn’s disease. Cost-effectiveness analyses from both the health care public payer
perspective and a societal perspective provide a more comprehensive analysis of the costs and
consequences involved in the management of pediatric CD with anti-TNF-α therapy. Since the
analyses incorporated an Ontario health care public payer perspective, all treatment costs were
assumed to be the responsibility of the public payer, with societal costs incorporating only the
addition of caregiver productivity costs. The incremental cost effectiveness ratios from the
societal perspective and the health care public payer perspectives were very similar, as that the
main driver of costs was the cost of treatment. The cost-effectiveness analyses showed that
early anti-TNF-α treatment was more effective than standard step-up care but more costly and
that there was considerable uncertainty surrounding the ICER. The uncertainty surrounding the
ICER made it difficult to state unequivocally that the early anti-TNF-α strategy was not cost-
effective compared to standard care particularly since the willingness to pay for a week in
steroid-free remission was unknown. The results of the study did suggest that the sooner a
child with moderate to severe CD receives anti-TNF-α treatment, the greater likelihood of
greater time in steroid-free remission over three years. Therefore, policies regarding anti-TNF-α
treatment should ensure that treatment is accessed and administered as quickly as possible
and that administrative delays in processing applications for access are avoided. Currently
observed delays due to public payer involvement in treatment management with biologics
should be addressed to avoid needlessly delaying treatment (Office of the Auditor General of
Ontario, 2017; Rumman et al., 2017; Sher, 2018). In 2016 to 2017, the time between the
Ontario Ministry of Health and Long-term Care receiving requests for coverage for infliximab
and adalimumab to when it replied with its coverage decision averaged approximately seven to
eight weeks (Office of the Auditor General of Ontario, 2017). Therefore, in Ontario, the
implementation of treatment with anti-TNF-α after diagnosis faces an administrative challenge.
207
While the cost-effectiveness analysis suggests that early anti-TNF-α intervention could improve
clinical outcomes, it is unlikely that drug coverage policies will change to allow the use of anti-
TNF-α treatment as first line therapy unless Health Canada approvals are amended to include
first-line treatment use. Currently anti-TNF-α treatment is indicated in patients refractory to
other conventional treatments. Other constraints for anti-TNF-α also exist. In Ontario,
Remicade® is available only through the Exceptional Access Program and is no longer
recommended for anti-TNF-α treatment-naïve patients. In Ontario, public drug coverage for
Inflectra® (biosimilar infliximab) is considered limited use (Ontario Ministry of Health and Long-
Term Care, 2016b). The limited use notes, posted on the Ontario Ministry of Health Long-Term
Care e-formulary (Ontario Ministry of Health and Long-Term Care, 2016b) , do not specify a
patient’s age and state the following: “the limited use is authorized for one year for the
treatment of moderate to severe (luminal) Crohn's Disease in patients who meet the following
criteria:
• HBI (Harvey Bradshaw Index) score greater than or equal to 7; and
• failed to respond to conventional treatment with a corticosteroid equivalent to a daily
dose of prednisone 40mg daily for at least 2 weeks;
• OR the patient is stabilized on corticosteroid but cannot be tapered to a corticosteroid
dose below prednisone 20mg daily or equivalent;
• failed to respond to an immunosuppressive agent (azathioprine, 6-mercaptopurine,
methotrexate, or cyclosporine) tried for at least 3 months (or where the use of
immunosuppressants is contraindicated);
• the recommended dosing regimen is 5mg/kg/dose at 0, 2 and 6 weeks followed by
5mg/kg/dose every 8 weeks. (note: higher doses up to 10mg/kg/dose may be
considered in patients who have failed to respond to lower doses);
• maintenance therapy is funded for patients who meet the Ministry initiation criteria
and whose disease is maintained with a 50% reduction in the Harvey Bradshaw Index
from pre-treatment measurement, AND improvement of symptoms (for example:
absence of bloody diarrhea, weight is stable or increased), AND the use of
208
corticosteroids and/or other immunosuppressive therapy is reduced, being tapered, or
discontinued;
• for funding beyond the second year, the patient must continue to demonstrate benefit
and if unable to be discontinued on corticosteroids, the physician may wish to consider
other funded alternatives;
• the recommended dosing regimen is 5mg/kg/dose every 8 weeks.”
The Harvey Bradshaw Index (HBI) is a Crohn’s disease activity index (Harvey & Bradshaw, 1980).
To ensure that patients receive appropriate and timely treatment, policy makers should ensure
that meeting these conditions is not cumbersome, difficult to achieve, or overly time-
consuming for clinicians, patients and administrators.
The one-way sensitivity analysis showed that a reduction in the price of infliximab could result
in cost-savings. This result corresponds with another economic impact study that examined the
impact of biosimilars on inflammatory bowel disease treatment which found that a price
reduction in anti-TNF-α therapy such as with biosimilars, could result in significant cost-savings
for the Dutch healthcare system (Severs et al., 2016). Policy makers could leverage this
knowledge in negotiating prices with manufacturers to ensure that covered treatments and
corresponding policies are aligned to manage pediatric CD in a clinically effective and cost-
effective manner. Since the budget for Crohn’s disease treatment in Ontario was unknown, the
budget impact of early anti-TNF-α treatment could not be established. In 2016, the class of anti-
TNF-α drugs which are also used to treat rheumatoid arthritis, accounted for the highest
proportion of public drug spending in Canada at over $800 million and the third highest
proportion of Ontario’s public drug expenditure at over $264 million (Canadian Institute for
Health Information, 2017). Remicade® (infliximab) is the fourth costliest drug in Ontario and
comprised 2.4% of the total drug costs in 2015/2016. Early anti-TNF-α treatment could increase
drug costs in Ontario. However, the introduction of biosimilars, which would reduce Remicade®
use, may reduce overall drug costs which could compensate for earlier anti-TNF-α use.
209
4.7.3. Implications for Manufacturers
The cost-effectiveness analysis results could be informative for manufacturers. The one-way
sensitivity analysis examining the cost of infliximab showed that the ICER was sensitive to the
price of infliximab and that a price of 25% of the current price of Remicade® may result in cost
savings with early anti-TNF-α treatment. A cost-saving and clinically effective strategy, i.e. a
dominant strategy would be more amenable to the payer. Knowing the approximate price at
which cost-savings could occur assists manufacturers in pricing their drugs and in negotiations
with the pan-Canadian Pharmaceutical Alliance (pCPA). The pan-Canadian Pharmaceutical
Alliance (pCPA) includes thirteen Canadian provinces and territories and the Federal
Government, and negotiates prices of both generic and brand name drugs for Canadians
(Husereau, Dempster, Blanchard, & Chambers, 2014).
Currently biologic treatments are only recommended for use after an inadequate response to
conventional treatment and are used off-label in pediatric patients because they have not
specifically been approved for a pediatric population by Health Canada. If manufacturers desire
unrestricted access to their pharmaceutical products they would have to provide sufficient
evidence, preferably from randomised clinical trials in children, proving the safety and efficacy
of their products in a particular population such as treatment naïve patients. In addition,
appropriate economic evaluations would have to be performed for inclusion in publicly funded
drug formularies. Our results, based on retrospective observational data, suggest that early
anti-TNF-α treatment may improve time in steroid-free remission in children with moderate to
severe CD, therefore manufacturers of existing or new anti-TNF-α products may want to
consider sponsoring a pediatric randomized clinical trial to support this new indication. A multi-
centre randomized clinical trial in a pediatric CD population has begun examining early
intervention with infliximab, and may provide additional evidence for the support of early anti-
TNF-α intervention in pediatric CD (Cozijnsen et al., 2016).
210
4.7.4. Implications for Patients and Caregivers
Patients and caregivers are interested in receiving appropriate and timely treatments. In
Ontario, out-of-pocket drug expenses may be reduced due to the OHIP+ program which
provides publicly funded drug coverage for drugs on the Ontario Drug Benefit Formulary for
those under the age of 25 and not covered by private plans. In other provinces, a mix of private
and public insurance remains. Safety of biologic treatments is a concern for patients,
particularly the risk of cancer (Norton, Thomas, Lomax, & Dudley-Brown, 2012). However, a
recent study concluded that infliximab exposure did not increase the incidence of malignancy in
pediatric IBD patients (Jeffrey S Hyams et al., 2017). For caregivers and patients, the results of
this study can provide information in their advocacy efforts in conjunction with organizations,
such as Crohn’s and Colitis Canada, with provincial governments in advocating for timely access
to appropriate medications. The results demonstrating that early anti-TNF-α intervention may
provide better clinical outcomes can be used as evidence to support the elimination of delays
and restrictions in getting treatment coverage for initial treatment or adjustments to
treatment. Other concerns for parents include long-term quality of life and disease burden for
their children (Teitelbaum, Rajaraman, Jaeger, Para, & Rakitt, 2013). The decision to start anti-
TNF-α treatment is difficult for parents with children with Crohn’s disease owing to the limited
long-term safety and efficacy data of anti-TNF-α treatment in children (Lipstein et al., 2013).
While still only a three-year study, the results of this study, particularly the positive clinical
outcome of increasing steroid-free remission, add to the body of knowledge related to the
efficacy of early anti-TNF-α treatment which may provide some additional information to
parents faced with the decision of starting anti-TNF-α treatment for their children.
4.7.5. Implications for Researchers
The cost-effectiveness analysis presented here raises some noteworthy issues for researchers in
pediatric IBD and for researchers conducting economic evaluations with patient-level data.
When the cost-effectiveness analyses using an outcome of weeks in steroid-free remission was
compared to the outcome of weeks medical remission irrespective of steroid-use, the results of
the model suggested that the early anti-TNF-α was more steroid sparing than standard step-up
211
care. The outcome of medical remission alone did not expose the added advantage of early
anti-TNF-α treatment particularly in pediatric CD. The steroid sparring nature of early anti-TNF-
α treatment has also been supported in adult CD (D. T. Rubin, Uluscu, & Sederman, 2012) and
in an adolescent case study (Persley, Scherl, & Rubin, 2001). The differences in steroid-related
outcomes in the cost-effectiveness model support the recommendation of using steroid-free
remission as a preferred outcome in pediatric IBD studies (Griffiths et al., 2005). While steroid-
sparing outcomes are preferable in pediatric IBD, a clear, quantified relationship between the
amount of steroid-free remission time and health care cost savings or steroid-free remission
time and increased quality of life has yet to be determined.
The secondary objective of this study was to examine the impact of different methods of
propensity score analysis within the context of a cost-effectiveness analysis. The cost-
effectiveness analysis and the preparation of model inputs provided insight for researchers in
health technology assessment. The pediatric RISK-PROKIIDS study was the primary source for
health state transition probabilities in the Markov model. Since the RISK-PROKIIDS study was an
observational study, analyzed retrospectively, to avoid selection bias, propensity score analysis
was used to create comparator groups. In the absence of a randomized controlled trial,
propensity score analysis allocated individuals to each treatment group based on their
similarities on several covariate characteristics. In the study, it was determined that the
propensity to be assigned a particular treatment may be based on the following variables: age
at diagnosis, sex, disease activity at diagnosis, African heritage, disease location, the presence
of peri-anal disease, height z-score, steroid-related health state at diagnosis, albumin lab
values, and whether the subject was recruited at a large clinical site. When the unadjusted
RISK-PROKIIDS CD study population was assessed, there were 64 patients with missing values
for the continuous variable of albumin. Instead of arbitrarily excluding these patients and
reducing the potential sample size, and since there was a small proportion of patients with
missing values and the missing values were for a continuous variable, imputation was chosen as
a viable option for maintaining these patients as part of the unadjusted study population.
Multivariate imputation by chained equations (MICE) using the predictive mean matching
212
method was conducted for ten iterations resulting in ten separate imputed data sets. Clear
guidance on how to proceed for subsequent propensity score analysis within the context of a
cost-effectiveness analysis was not found among the economic evaluation literature. Typically,
imputed datasets are pooled to present an outcome determined with a regression model
(Buuren & Groothuis-Oudshoorn, 2011; D. B. Rubin, 2004). Rubin’s rules, based on asymptotic
theory on the normal distribution, guide the combination of the separate estimates and
standard errors from each of the imputed datasets into an overall estimate with standard error,
confidence intervals and p-values when pooling the estimates (Buuren & Groothuis-Oudshoorn,
2011). There is uncertainty regarding pooling imputed datasets if parameters do not have a
normal distribution or if the distribution is unknown, such as in estimating propensity scores or
for survival model estimates (Leyrat et al., 2017; White, Royston, & Wood, 2011).
Two approaches were proposed to estimate propensity scores: the “Within” method or the
“Across” method (Mitra & Reiter, 2016). The “Within” method calculates propensity scores on
each imputed dataset separately and creates multiple matched data sets with the intention of
averaging results for the final outcome estimate (Mitra & Reiter, 2016). The “Across” method
averages the propensity score for each subject from each imputed dataset and then uses that
mean propensity score to create one matched population (Mitra & Reiter, 2016). The “Within”
method has also been called the “MIte” method and the “Across” method has also been called
the “MIps” by Leyrat et al., (2017) (Leyrat et al., 2017). While Mitra and Reiter (2016) suggest
using the “Across” method as a default method since it can provide greater bias reductions,
both methods could provide similar point estimates with the “Within” method having a lower
variability (Mitra & Reiter, 2016). Mitra and Reiter (2016) used simulations with complete and
missing data, variance estimates, and mean squared error estimates to compare bias from
actual data between the “Across” and “Within” methods (Mitra & Reiter, 2016). In our cost-
effectiveness analysis mean squared errors were not determined, since complete data without
missing data was not available. Therefore, an assessment of bias could not be determined in
our dataset. Standard deviations between the two methods were determined and discussed
further below. A criticism of the “Across” method is that it doesn’t take into account the
213
variance estimator due to the estimation of the propensity score and the variance of the
imputation of missing data (Leyrat et al., 2017). The “Within” method does account for the
variance in both estimates as it is based on Rubin’s rules (D. B. Rubin, 2004). Mitra and Reiter
(2016) concluded that both methods should be assessed depending on whether missing data is
in one or multiple covariates that influence treatment selection and treatment effect. Leyrat et
al., (2017), concluded that the “Within” method showed greater covariate balance when the
inverse probability of treatment weighting propensity score analysis was performed. While a
comprehensive analysis of combining data following imputation with subsequent propensity
score analysis was not the primary focus of this research, it was determined that data
combination methods could affect cost-effectiveness analysis results. The results of this
research highlight the need for further research and guidance in handling missing data and
propensity score methods within the context of economic evaluations. The differences between
the “Across” and “Within” methods are discussed further below.
This cost-effectiveness study also involved examining different propensity score analysis
methods to create comparator groups from patient-level data within the context of an
economic evaluation. Propensity score methods are often chosen arbitrarily to create
comparator groups from observational data (Austin, 2011a). However, the method which
optimizes covariate balance should be chosen among the various methods available (Austin,
2011a). Since randomized controlled trials are rare in pediatrics and studies often rely on
retrospective, observational data, appropriate propensity score analysis is of particular
relevance to pediatric research. This study examined four methods of propensity score analysis:
propensity score matching, propensity score weighting using the inverse of the probability of
treatment assignments as a weight, the covariate balancing propensity score (CBPS) method,
and propensity score with subclassification. The propensity score methods with the greatest
degree of balance included those with the most covariates with mean standardized differences
below 0.1 and variance ratios closest to 1. The weighting method, the CBPS method and the
nearest neighbour matching method using a caliper constraint of 0.2 and using a 2:1 or 3:1 ratio
of standard care to early anti-TNF-α intervention patients were the optimal methods based on
214
covariate balance. While all these methods met the criteria for acceptable covariate balance,
for the purposes of determining health state probabilities at various time points, separate
matched comparator groups needed to be extracted from the propensity score analysis
software. Therefore, due to the technical ability to extract the full matched dataset with
individual characteristics, the nearest neighbour matching with a caliper of 0.2 in a 2:1 control
(standard care) to treatment (early anti-TNF-α intervention) was chosen as the propensity score
method of choice.
Multiple health state transition probabilities needed to be determined for the Crohn’s disease
Markov model. Transition probabilities were based on the number of individuals in a particular
health state at a given time using the method described in Briggs et al., (2006) (Briggs, Sculpher,
& Claxton, 2006). Using this method, the number of patients in each comparator group in the
adjusted data set was counted. Using the “Across” method of combining data, prior to
propensity score analysis transition probabilities came from one data set. However, when using
the ‘Within” method, ten matched data sets were created. Each matched data set had a slightly
different population of individuals resulting in a slightly different combination of people in each
health state over time. Hence, ten models with ten different sets of health state transition
probabilities were also created. In all, the RISK-PROKIIDS population provided eleven data sets
to inform health state transition probabilities. The eleven data sets resulted in eleven different
point estimates for the incremental cost-effectiveness ratio (ICER). The question arises as to
which data set(s) to use to inform model inputs. If the primary outcome was a treatment effect
for a clinical trial, the mean of the “Within” estimates would be determined thus pooling the
results. However, within the context of a cost-effectiveness analysis there is no clear guidance
on which point estimate would serve as a better representative of the ICER. In this study,
following a two dimensional probabilistic analysis of 50 samples of 10,000 microsimulations,
the mean ICER determined based on the “Across” method of data assembly was $4,818 and the
mean point estimate ICERs based on the “Within” method of data combination ranged from
$2,250 to $12,870 for an additional week of remission with the early anti-TNF-α treatment
compared to standard step-up care. The average of the mean point estimates of the ten ICERs
215
using the “Within” approach was $5,157 which was higher than the point estimate ICER using
the “Across” approach. The standard deviation of the ICER using the “Across” approach was
$3,865 and the pooled standard deviation of the ten datasets using the “Within” method was
$4,366. The standard deviation and the variance of the “Across” method was slightly lower than
the standard deviation and variance of the “Within” method. Mitra and Reiter (2016) found
that the “Within” method had lower variability. It should be noted that the point estimates in
Mitra and Reiter’s study were singular study outcomes. However, the point estimates that were
compared in this cost-effectiveness analysis were incremental cost-effectiveness ratios.
Typically, standard deviations of ICER’s are not reported but confidence intervals for the
incremental costs and incremental effects are reported separately. Nevertheless, these two
methods of data combinations added to the methodological uncertainty in the cost-
effectiveness model. Researchers conducting cost-effectiveness analysis imputing missing data
and then performing propensity score analysis should be aware of the uncertainty and
differences in the ICERs based on different methods of obtaining model inputs. Additional
research needs to be performed to provide guidance on which methods are best suited for
determining health state transition probabilities with patient-level data. Possible suggestions
for additional research could include running simulated cost-effectiveness analyses with
multiple complete data sets. Comparisons of cost-effectiveness analysis results using health
state transition probabilities determined from the complete dataset and health state transition
probabilities determined with imputed data after artificially creating missing data could be used
to determine the differences between the “Across” and “Within” methods of data assembly.
Studies examining how missing data coming from control, or treated, or both groups affects the
outcome of a cost-effectiveness analysis can also be conducted. A minimum number of datasets
to impute and their effect on the ICER should be determined. Comparisons between
determining each health state transition probability using regression modelling as opposed to
counting the number of individuals within a health state over time can also be examined when
missing data in patient-level data are involved.
216
4.8 Biosimilars and Other New Biologic Market Entrants
The biologic treatments for inflammatory bowel disease are rapidly evolving with biosimilars
and new biological drugs entering the market. A discussion on the cost-effectiveness of anti-
TNF-α treatments in Crohn’s disease would be incomplete if it did not mention the impact of
biosimilars on clinical practice and drug policy. Biosimilars or biosimilar biologic drugs are highly
similar to biologic drugs that were already authorized for sale. Biosimilars, or subsequent entry
biologics, are manufactured in living cells and hence not completely identical to their originator
biological drugs but can enter the market following regulatory approval and patent expiry of
the originator biological drug (Health Canada, 2017). Similar to generic drugs, it is expected that
biosimilars would enter the market at a lower price than the originator biologic drug (Canadian
Agency for Drugs and Technologies in Health (CADTH), 2018). In 2016, Inflectra® and Remsima®
, the biosimilar versions of infliximab were approved by Health Canada for inflammatory bowel
disease in adults with moderate to severe disease who have not responded to conventional
treatments such as corticosteroids (Canadian Agency for Drugs and Technologies in Health
(CADTH), 2018; Health Canada, 2016). Currently the price for a 100 mg vial of Inflectra® is $CAD
525, which is 53% of the cost of Remicade® at $CAD 987.56 in Ontario. Based on provincial
formularies, in Canada the price for Remicade® ranged from $CAD 940 to $1036 following
negotiations through the pan-Canadian Pharmaceutical Alliance (Canadian Agency for Drugs
and Technologies in Health (CADTH), 2018). The efficacy of Inflectra® has been demonstrated
in clinical trials (Deiana, Gabbani, & Annese, 2017; Gecse et al., 2015; Jørgensen et al., 2017). In
2018, Health Canada issued a summary basis for the approval of Renflexis®, another infliximab
biosimlar, which specifically included the use of Renflexis® for the treatment of pediatric
patients with moderate to severe Crohn’s disease over the age of nine who have not responded
adequately to conventional treatments (Health Canada, 2018). Currently Renflexis® or
Remsima® are not yet listed on provincial formularies for inflammatory bowel disease.
Other new biologic market entrants for the treatment of inflammatory bowel disease include
Entyvio® (vedolizumab) and Stelara®(ustekinumab). Entyvio®, a biologic treatment targeting
integrin was approved in 2016 for adults with moderate-to-severe Crohn’s disease with an
217
inadequate response to other immunomodulators or other anti-TNF-α treatments (Takeda
Pharmaceutical Company Limited, 2016). Entyvio® is available through the Exceptional Access
Program in Ontario and costs $3,290 for 300 mg (Ontario Ministry of Health and Long-Term
Care, 2018a). In 2016, Stelara® a biologic therapy targeting interleukin 12 (IL-12) and interleukin
23 (IL-23), was approved for adults with moderate-to-severe Crohn’s disease with an
inadequate response to other immunomodulators or other anti-TNF-α treatments. However,
Stelara® is not listed in the Ontario Drug Benefit (ODB) formulary for Crohn’s disease at this
time. All these examples illustrate the rapidly changing treatment options for Crohn’s disease.
However, it is important to note that coverage for these biologics and biosimilars come with
constraints on their use in terms of dosing frequency, no pediatric indications, and the caveat
that they can only be used in patients with inadequate responses to conventional treatments.
Imposing such restrictions which may need to be reconciled on a case by case basis within a
special access program can delay access to these medications (Office of the Auditor General of
Ontario, 2017). Children with IBD, often have different dosing requirements and imposing
restrictions can limit the speed at which clinicians can make adjustments to treatment and also
cause delays in treatment (Sher, 2018). Crohn’s and Colitis Canada, a not-for-profit organization
that raises funds for IBD research and advocates on behalf of IBD patients stated that “Doctors
and their patients must be able to select the treatment option best suited to each patient’s
individual circumstances, without undue interference from government or private payers,” as
part of their position statement on biosimilars. As mentioned previously, IBD patients relying on
public drug plan coverage may experience different clinical outcomes than those on private
drug plans due to delays and restrictions in access to appropriate treatments (Rumman et al.,
2017).
Our results suggest that early anti-TNF-α intervention is clinically more effective with regard to
weeks with steroid-free remission compared to standard step-up care. However, it was more
costly. A one-way sensitivity analysis was conducted to determine the sensitivity of the results
of the cost-effectiveness analysis to the price of infliximab treatment. While our study did not
model the incorporation of biosimilars into the treatment regimen, the sensitivity analysis could
218
serve to simulate the incremental cost per additional steroid-free remission week in the event
that the cost was similar to that of the biosimilar Inflectra® or one that could be introduced at a
lower price. The one-way sensitivity analysis was conducted with the price of infliximab varying
by 150%, 87.5%, 75%, 62.5%, 50%, 37.5%, and 25% of the reference case ($987.56) (see Table
3.7.5.3-1 for ICERs). The incremental cost per additional steroid-free remission week at 50% the
cost of Remicade® (similar to Inflectra®), was $CAD 659 for early anti-TNF-α treatment
compared to standard step-up care. Hypothetically, if infliximab was 25% of its current cost,
early anti-TNF-α treatment would provide a cost savings of $CAD 372 per steroid-free remission
week gained. However, anti-TNF-α treatment is not currently indicated as first line treatment
which would be considered off-label treatment. Over 75% of medicines prescribed to children
are prescribed off-label since a pediatric population is often not specified as a treatment target
in the product monograph due to a lack of safety and efficacy data (Standing Senate Committe
on Social Affairs Science and Technology, 2014). Reimbursement of drugs prescribed for off-
label indications through publicly funded provincial/territorial drug plans may not be consistent
across jurisdictions (Standing Senate Committe on Social Affairs Science and Technology, 2014),
and therefore may cause differences in treatment and access across provinces particularly for
pediatric illness. This may raise concerns about patients getting timely access to appropriate
treatments through public pediatric drug coverage systems such as with the OHIP+ program in
Ontario.
4.9 Future Research
Similar to other cost-effectiveness analyses overall show conflicting results regarding the cost-
effectiveness of anti-TNF-α for the treatment of inflammatory bowel disease, in this study,
there is considerable uncertainty as to whether the early use of anti-TNF-α use is cost-effective
compared to standard, step-up care in pediatric moderate to severe Crohn’s disease
(Huoponen & Blom, 2015; Tsui & Huynh, 2018). With respect to pediatric studies, due to the
lack of randomized controlled trials, small sample sizes in retrospective studies, and a lack of
standardization among studies, the efficacy and cost effectiveness of early anti-TNF-α
treatment remain ambiguous (Tsui & Huynh, 2018). This study showed that while early anti-
219
TNF-α treatment was clinically more effective at increasing the time in steroid-free remission,
the difference compared to standard step-up care was marginal over three years as patients in
the standard care group also experienced weeks in steroid-free remission and several patients
achieved remission in the absence of anti-TNF-α treatment. A concern with early anti-TNF-α
treatment is that it is an aggressive therapy that may not be necessary for all moderate-to-
severe patients (Hanauer, 2005). Determining which patients would be best served with early
anti-TNF-α and which patients would be most responsive to early anti-TNF-α needs to be
defined (Tsui & Huynh, 2018). Research into prognostic Crohn’s disease biomarkers may yield
promise into predicting which patients may require or respond to particular treatments (J. Lee
et al., 2017).
Cost-effectiveness research into therapeutic drug monitoring in conjunction with early anti-
TNF-α is needed to optimize the efficacy and cost-effectiveness of treatment. Therapeutic drug
monitoring through the assessment of drug trough levels and correlating disease symptoms
may also serve to optimize the efficacy of anti-TNF-α treatments on an individual basis
(Casteele et al., 2015; Crowley et al., 2017; Hoekman et al., 2014). Therapeutic drug monitoring
may also be more cost-effective and efficacious in patients who initially lose response to an
anti-TNF-α treatment (Steenholdt et al., 2013).
With increasing calls to personalize treatment, research into appropriate cost-effectiveness
models also needs to be done (Conti, Veenstra, Armstrong, Lesko, & Grosse, 2010). While
clinical efficacy is challenged by relying on large randomized clinical trials to show statistically
significant differences among treatments, individual microsimulation models using patient-level
data may be able to incorporate individualized treatment and patient heterogeneity into cost-
effectiveness studies.
The cost-effectiveness study performed here identified other gaps where research is needed.
The willingness to pay for time is steroid-free remission is unknown. A study examining parents’
preferences for willingness to pay for biologic treatments in Crohn’s disease, similar to that
conducted by Burnett et al., in juvenile idiopathic arthritis may be conducted (Burnett, Ungar,

220
Regier, Feldman, & Miller, 2014). In addition, the health utility of growth restoration as a result
of steroid-free remission in children with Crohn’s disease has not been quantified. The broader
issue of health utilities, or the assignment of quality-adjusted life years to health states in
children with Crohn’s disease is undetermined. The determination of QALYs in pediatric Crohn’s
disease can allow the comparison of Crohn’s disease treatments to treatments for other
diseases. A survey of parent proxies of children or of children with Crohn’s disease assessing
their response to generic quality of life questionnaires designed for determining child health
utilities can be performed (W. J. Ungar, 2010).
Another area of needed research identified by this study is in handling imputed patient-level
data from clinical studies and propensity score analysis within the context of informing
economic evaluations. Simulation studies with different sets of patient level data can be
conducted with and without missing data to examine its impact on the cost-effectiveness
results with different methods of data combinations and different methods of propensity score
analysis. Guidance is needed as to the best practice when conducting economic evaluation with
missing patient-level data.
In summary, this study contributed additional information regarding the cost-effectiveness of
early anti-TNF-α treatment to the limited body of economic evaluations in pediatric Crohn’s
disease. Early anti-TNF-α treatment was more costly but more effective than standard, step-up
care in increasing steroid-free remission weeks in children with moderate to severe Crohn’s
disease. Methodological uncertainty in the model identified that additional research is needed
in how to handle missing patient-level data and choosing propensity score analysis methods
within the context of economic evaluations. Steroid-free remission weeks were used as the
effectiveness measure but if QALYs in pediatric Crohn’s disease had been determined, a cost-
utility analysis could have been conducted and the results could have been compared to other
cost-utility analyses. As treatments become optimized and more personalized, cost-
effectiveness models that incorporate personalized treatments such as therapeutic drug
monitoring and dose adjustment may help to identify the most cost-effective treatment and
monitoring strategies in children with Crohn’s disease over the long term.
221
4.10 Conclusion
The cost-effectiveness of treatment with anti-TNF-α treatment within the first three months of
diagnosis was compared to standard step-up care with the option of anti-TNF-α treatment only
after three months following diagnosis in children with moderate to severe Crohn’s disease.
Concomitant medications such as corticosteroids and immunomodulators were allowed in both
treatment arms. Due to the lack of randomized controlled pediatric studies in newly-diagnosed
patients, the RISK-PROKIIDS study, an observational, North American multi-centre study,
analyzed retrospectively, served as the source of patient health state transition probabilities
and treatment patterns. The results of this research showed that early anti-TNF-α intervention
is more effective but more costly than standard step-up care over three years in children with
moderate to severe Crohn’s disease. A microsimulation cost-effectiveness model showed that
the incremental cost per additional steroid-free remission week was $2,755.70 ($CAD) for the
early anti-TNF-α intervention for the reference case from a public health care payer perspective
and the incremental cost per additional steroid-free remission week was $2,968.02 ($CAD) for
the early anti-TNF-α intervention from a societal perspective. From a public health payer
perspective, the early anti-TNF-α treatment strategy resulted in 11.3 more weeks of steroid-
free medical remission than standard step-up treatment and was $31,112 ($CAD) more costly
over three years. From a societal perspective, early anti-TNF-α treatment was more costly than
the standard care intervention over three years by $33,508.64 ($CAD) and also resulted in 11.3
more weeks of steroid-free remission. There was considerable uncertainty in the model due to
methodological and structural uncertainty and considerable individual variation in disease
characteristics among patients. A willingness to pay for a steroid-free week in remission is
unknown. The improvement on quality of life of being in a health state of steroid-free remission
is also unknown in children with Crohn’s disease. Therefore, there is a need to establish generic
health utilities and a better understanding of willingness to pay for remission in pediatric
Crohn’s disease.
The cost-effectiveness model was sensitive to the price of anti-TNF-α treatment (infliximab)
with early anti-TNF-α treatment having the potential to be the dominant strategy if anti-TNF-α
222
was reduced to 25% of its current price. The cost-effectiveness model also showed that early
anti-TNF-α was more effective at reducing steroid use during remission than standard step-up
care since early anti-TNF-α resulted in 11.3 more steroid-free remission weeks over three years
and 6.65 more remission weeks irrespective of steroid use compared to standard step-up care.
These results suggest that time in steroid-free remission may be a preferred clinical outcome in
pediatric Crohn’s disease.
The process of preparing inputs for the cost-effectiveness model highlighted that when dealing
with patient-level data with missing values, the imputation of missing data, and subsequent
combination of data and propensity score analysis can impact cost-effectiveness results and
introduce methodological uncertainty into the cost-effectiveness model. The incremental cost-
effectiveness ratio of an additional week of remission irrespective of steroid use ranged from
$CAD 2,250 to $CAD 12,870 depending on the method of data assembly following imputation
of missing data. This range suggests that guidelines need to be established on how to handle
patient-level data with missing values that inform a cost-effectiveness model and on how to
report results within the context of an economic evaluation.
The results of the cost-effectiveness model examining early anti-TNF-α treatment for Crohn’s
disease suggest that early anti-TNF-α treatment has potential to improve clinical outcomes in
pediatric Crohn’s disease, but may be a costly strategy unless anti-TNF-α prices come down.
While over fifty percent of patients in the step-up strategy from the RISK-PROKIIDS study were
on anti-TNF-α treatment at three years, some patients entered remission without the need for
anti-TNF-α treatment suggesting that aggressive anti-TNF-α treatment is not necessary for all
patients. With better therapeutic management techniques such as therapeutic drug
monitoring, research into which patients would be better responders, early anti-TNF-α
treatment may be a clinically effective and cost-effective strategy in a subpopulation of
patients. Additional research is required to identify this sub-population. In any case, early anti-
TNF-α intervention was shown to be clinically effective at increasing the steroid-free remission
weeks in children with moderate to severe Crohn’s disease and therefore policies or
223
administrative delays that would delay treatment in patients that could benefit from early
intervention should be adjusted.
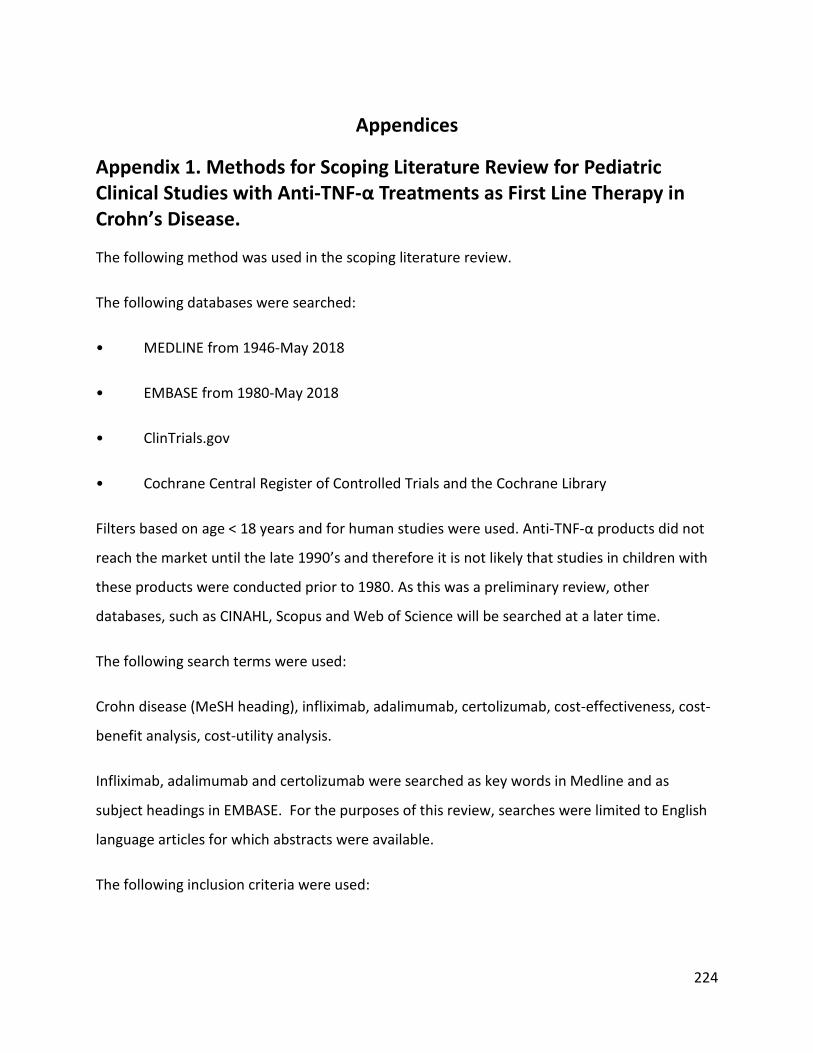
224
Appendices
Appendix 1. Methods for Scoping Literature Review for Pediatric Clinical Studies with Anti-TNF-α Treatments as First Line Therapy in Crohn’s Disease.
The following method was used in the scoping literature review.
The following databases were searched:
• MEDLINE from 1946-May 2018
• EMBASE from 1980-May 2018
• ClinTrials.gov
• Cochrane Central Register of Controlled Trials and the Cochrane Library
Filters based on age < 18 years and for human studies were used. Anti-TNF-α products did not
reach the market until the late 1990’s and therefore it is not likely that studies in children with
these products were conducted prior to 1980. As this was a preliminary review, other
databases, such as CINAHL, Scopus and Web of Science will be searched at a later time.
The following search terms were used:
Crohn disease (MeSH heading), infliximab, adalimumab, certolizumab, cost-effectiveness, cost-
benefit analysis, cost-utility analysis.
Infliximab, adalimumab and certolizumab were searched as key words in Medline and as
subject headings in EMBASE. For the purposes of this review, searches were limited to English
language articles for which abstracts were available.
The following inclusion criteria were used:

225
• Studies where the main focus of the study is to assess the clinical effectiveness of an
anti-TNF-α treatment (infliximab, adalimumab or certolizumab pegol).
• Studies with pediatric patients with moderate-to-severe CD that were not grouped with
another indication such as ulcerative colitis.
• Studies with only pediatric patients or where pediatric data can be segregated from
adult data.
• Studies in which the anti-TNF-α intervention is used alone as first-line therapy and not
concomitantly with other medications in at least one arm of the study.
• Studies can be RCTs, cohort or case-control studies. Where appropriate, studies can be
prospective or retrospective.
• Any doses and routes of administration of the interventions (anti-TNF-α and comparator
interventions)
• All English language abstracts even if the study in another language
• Where the primary outcome is measured in terms of remission and/or Pediatric Crohn’s
Activity Index (PCDAI) score
In EMBASE, when the search terms Crohn disease and infliximab were combined and a filter for
child references was applied, there were 101 search results. Similarly, when adalimumab was
used as a term instead of infliximab, 45 search results were found. Certolizumab produced 1
result. In Medline, a similar search strategy produced 43 results. When the abstracts of all of
these results were reviewed, only 1 result (Walters et al., 2014) met the clinical inclusion
criteria and examined the early intervention of anti-TNF-a treatments in newly diagnosed
children with CD. Subsequently, the inclusion criteria was relaxed to include studies that
examined the effectiveness of infliximab or adalimumab in children with CD that did not have
only monotherapy arms and which had refractory patients as well, as opposed to a study in
newly diagnosed, naïve patients.
226
Appendix 2. Methods for Scoping Literature Review for Health Technology Assessments of anti-TNF-α Treatments in Pediatric Crohn’s Disease
The following method was used in the literature search.
The databases used for the search of clinical studies were also used to search for the economic
evaluations. Health technology assessments in Crohn’s disease were also searched for on
websites of governmental agencies such as Canadian Agency for Drugs and Technology in
Health (CADTH) and National Institute for Health and Care Excellence (NICE).
The following criteria were used as inclusion criteria for cost-effectiveness or cost-utility
analyses:
• Studies that provide economic evaluations of anti-TNF-α treatments in children with
moderate-to-severe Crohn’s disease
• Studies that provide economic evaluation of anti-TNF-α treatments in adults moderate-
to-severe Crohn’s disease (luminal or fistulizing CD is not excluded)
Searches including the terms Crohn disease, infliximab or adalimumab, or certolizumab, and
cost-effectiveness or cost-utility analysis with a filter for child studies yielded no results in
either Medline or EMBASE. Removal of the pediatric filter yielded approximately 33 search
results.
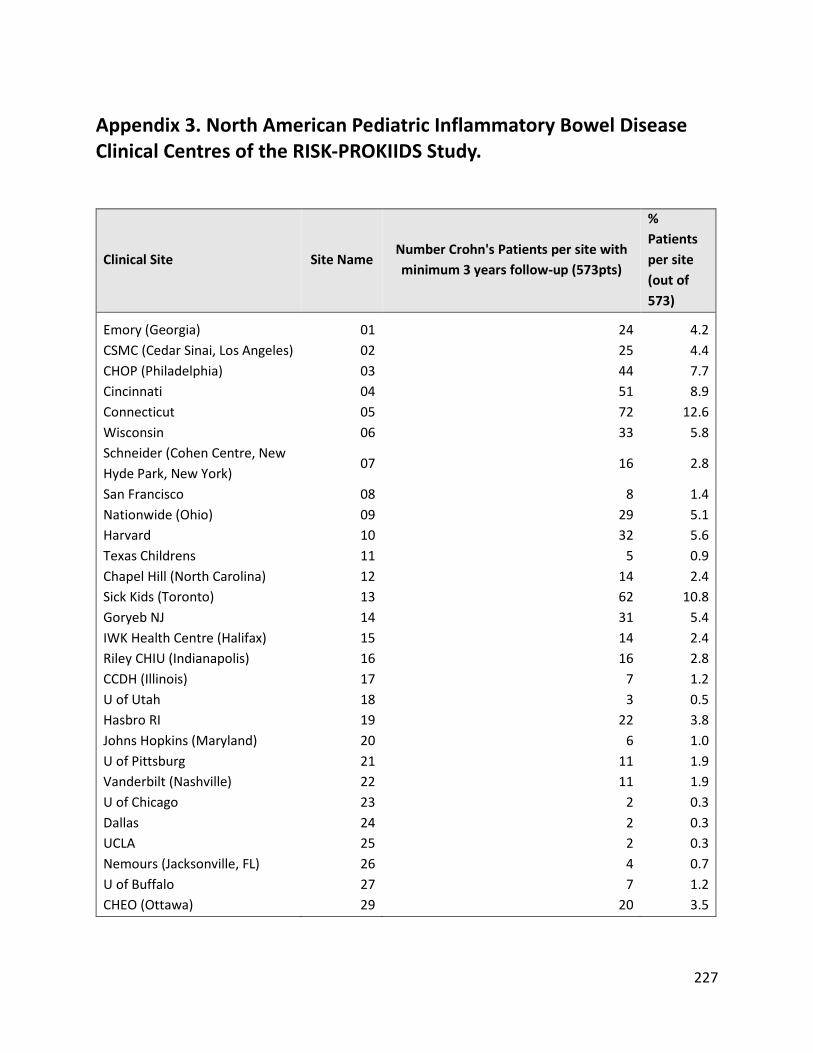
227
Appendix 3. North American Pediatric Inflammatory Bowel Disease Clinical Centres of the RISK-PROKIIDS Study.
Clinical Site Site Name Number Crohn's Patients per site with minimum 3 years follow-up (573pts)
% Patients per site (out of 573)
Emory (Georgia) 01 24 4.2 CSMC (Cedar Sinai, Los Angeles) 02 25 4.4 CHOP (Philadelphia) 03 44 7.7 Cincinnati 04 51 8.9 Connecticut 05 72 12.6 Wisconsin 06 33 5.8 Schneider (Cohen Centre, New Hyde Park, New York)
07 16 2.8
San Francisco 08 8 1.4 Nationwide (Ohio) 09 29 5.1 Harvard 10 32 5.6 Texas Childrens 11 5 0.9 Chapel Hill (North Carolina) 12 14 2.4 Sick Kids (Toronto) 13 62 10.8 Goryeb NJ 14 31 5.4 IWK Health Centre (Halifax) 15 14 2.4 Riley CHIU (Indianapolis) 16 16 2.8 CCDH (Illinois) 17 7 1.2 U of Utah 18 3 0.5 Hasbro RI 19 22 3.8 Johns Hopkins (Maryland) 20 6 1.0 U of Pittsburg 21 11 1.9 Vanderbilt (Nashville) 22 11 1.9 U of Chicago 23 2 0.3 Dallas 24 2 0.3 UCLA 25 2 0.3 Nemours (Jacksonville, FL) 26 4 0.7 U of Buffalo 27 7 1.2 CHEO (Ottawa) 29 20 3.5
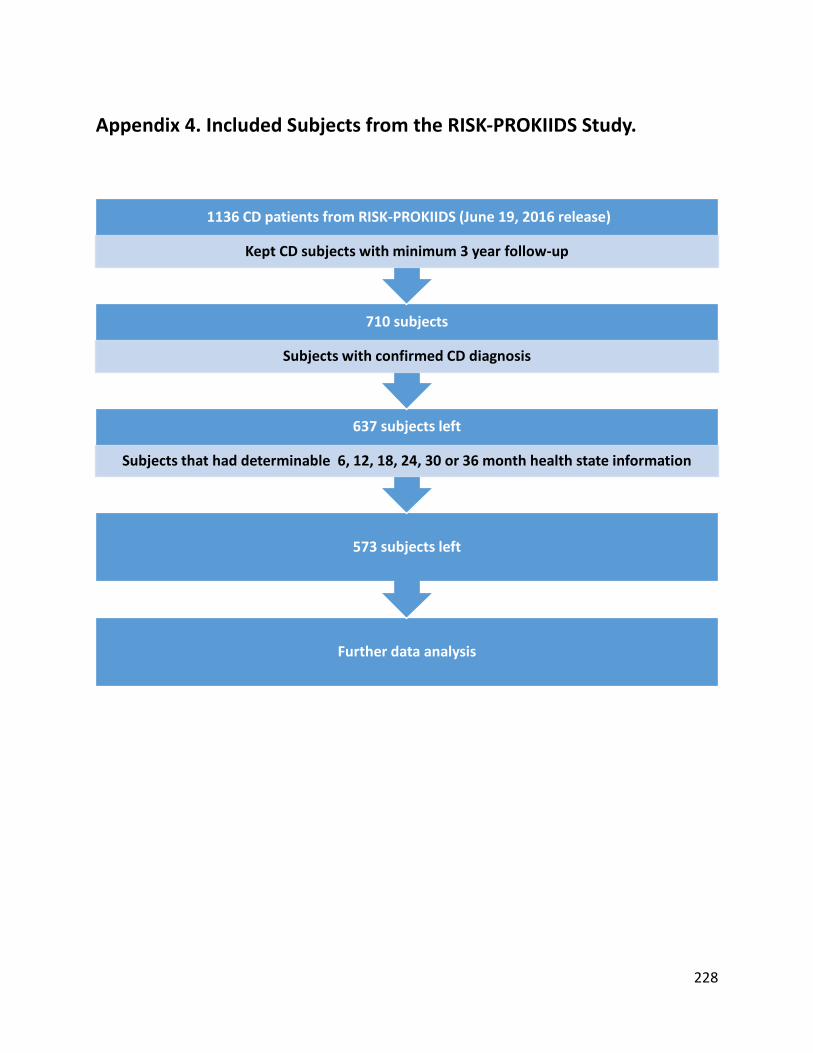
228
Appendix 4. Included Subjects from the RISK-PROKIIDS Study.
Further data analysis
573 subjects left
637 subjects left
Subjects that had determinable 6, 12, 18, 24, 30 or 36 month health state information
710 subjects
Subjects with confirmed CD diagnosis
1136 CD patients from RISK-PROKIIDS (June 19, 2016 release)
Kept CD subjects with minimum 3 year follow-up
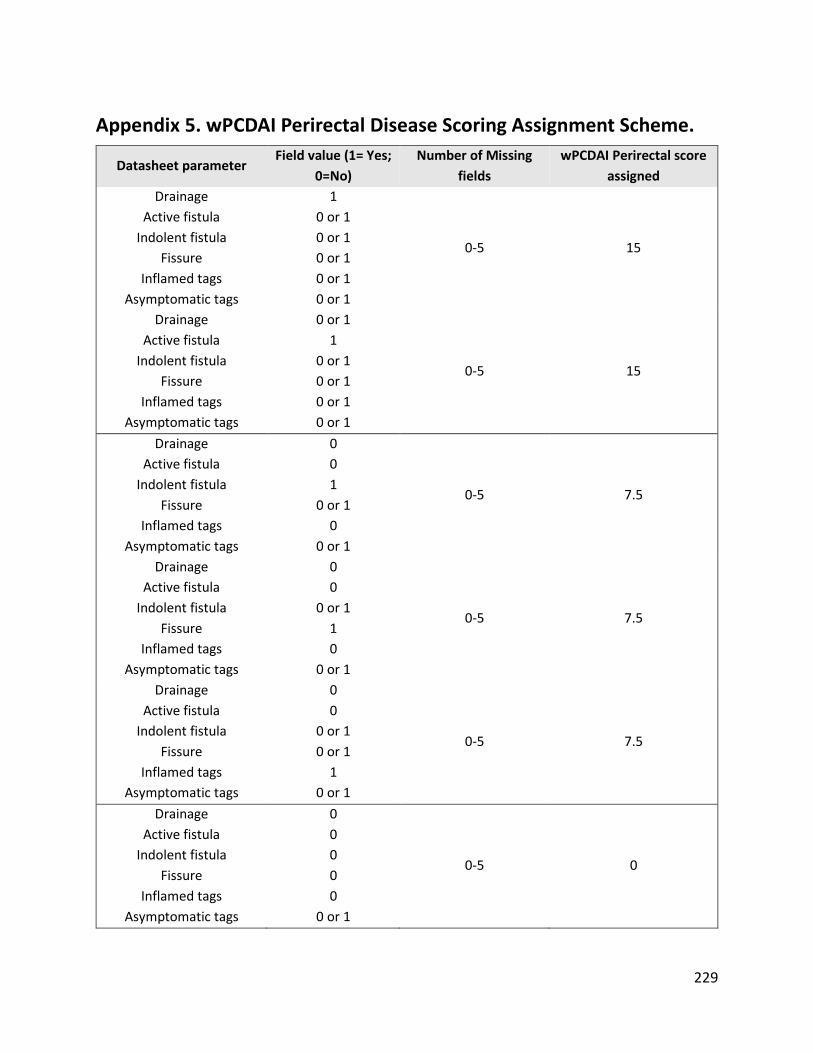
229
Appendix 5. wPCDAI Perirectal Disease Scoring Assignment Scheme.
Datasheet parameter Field value (1= Yes;
0=No) Number of Missing
fields wPCDAI Perirectal score
assigned Drainage
Active fistula Indolent fistula
Fissure Inflamed tags
Asymptomatic tags
1 0 or 1 0 or 1 0 or 1 0 or 1 0 or 1
0-5 15
Drainage Active fistula
Indolent fistula Fissure
Inflamed tags Asymptomatic tags
0 or 1 1
0 or 1 0 or 1 0 or 1 0 or 1
0-5 15
Drainage Active fistula
Indolent fistula Fissure
Inflamed tags Asymptomatic tags
0 0 1
0 or 1 0
0 or 1
0-5 7.5
Drainage Active fistula
Indolent fistula Fissure
Inflamed tags Asymptomatic tags
0 0
0 or 1 1 0
0 or 1
0-5 7.5
Drainage Active fistula
Indolent fistula Fissure
Inflamed tags Asymptomatic tags
0 0
0 or 1 0 or 1
1 0 or 1
0-5 7.5
Drainage Active fistula
Indolent fistula Fissure
Inflamed tags Asymptomatic tags
0 0 0 0 0
0 or 1
0-5 0
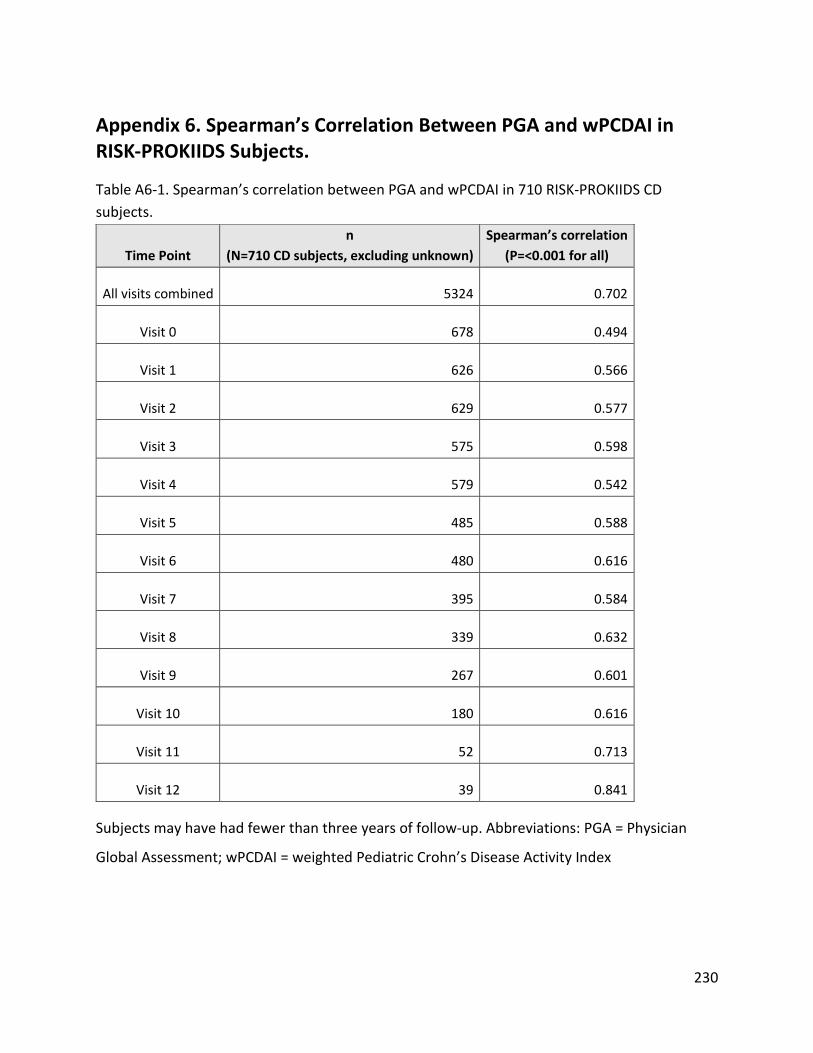
230
Appendix 6. Spearman’s Correlation Between PGA and wPCDAI in RISK-PROKIIDS Subjects.
Table A6-1. Spearman’s correlation between PGA and wPCDAI in 710 RISK-PROKIIDS CD subjects.
Time Point n
(N=710 CD subjects, excluding unknown) Spearman’s correlation
(P=<0.001 for all)
All visits combined 5324 0.702
Visit 0 678 0.494
Visit 1 626 0.566
Visit 2 629 0.577
Visit 3 575 0.598
Visit 4 579 0.542
Visit 5 485 0.588
Visit 6 480 0.616
Visit 7 395 0.584
Visit 8 339 0.632
Visit 9 267 0.601
Visit 10 180 0.616
Visit 11 52 0.713
Visit 12 39 0.841
Subjects may have had fewer than three years of follow-up. Abbreviations: PGA = Physician
Global Assessment; wPCDAI = weighted Pediatric Crohn’s Disease Activity Index
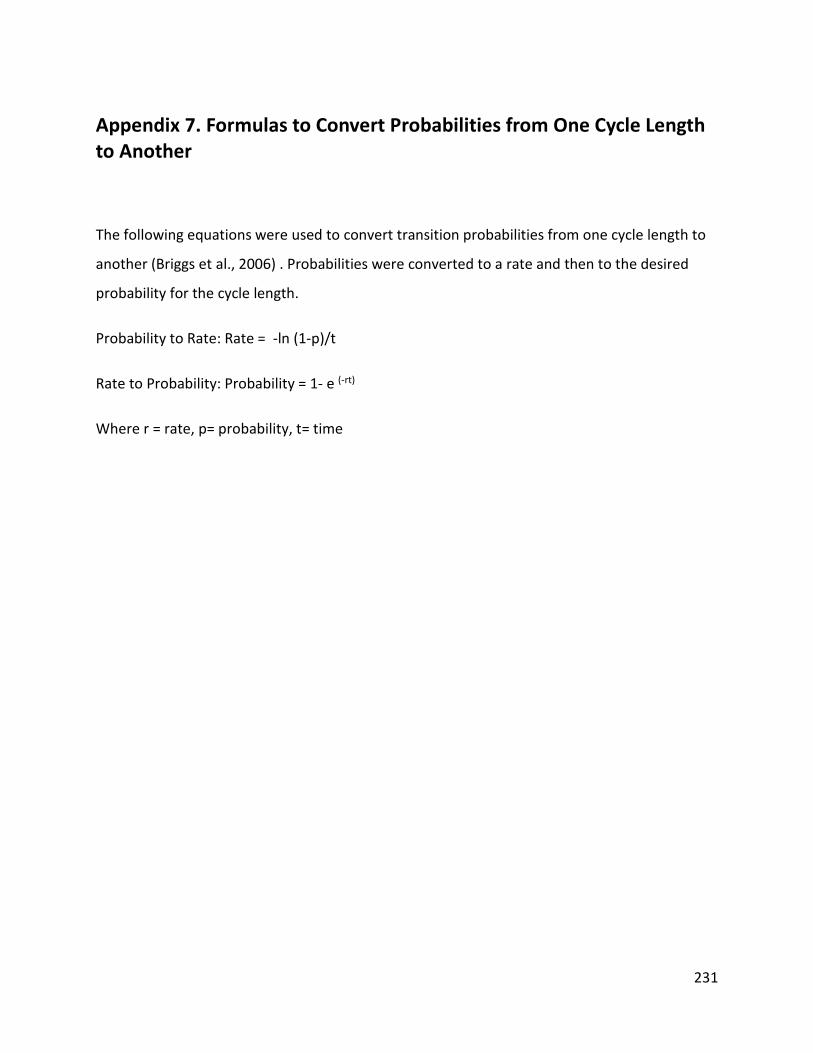
231
Appendix 7. Formulas to Convert Probabilities from One Cycle Length to Another
The following equations were used to convert transition probabilities from one cycle length to
another (Briggs et al., 2006) . Probabilities were converted to a rate and then to the desired
probability for the cycle length.
Probability to Rate: Rate = -ln (1-p)/t
Rate to Probability: Probability = 1- e (-rt)
Where r = rate, p= probability, t= time
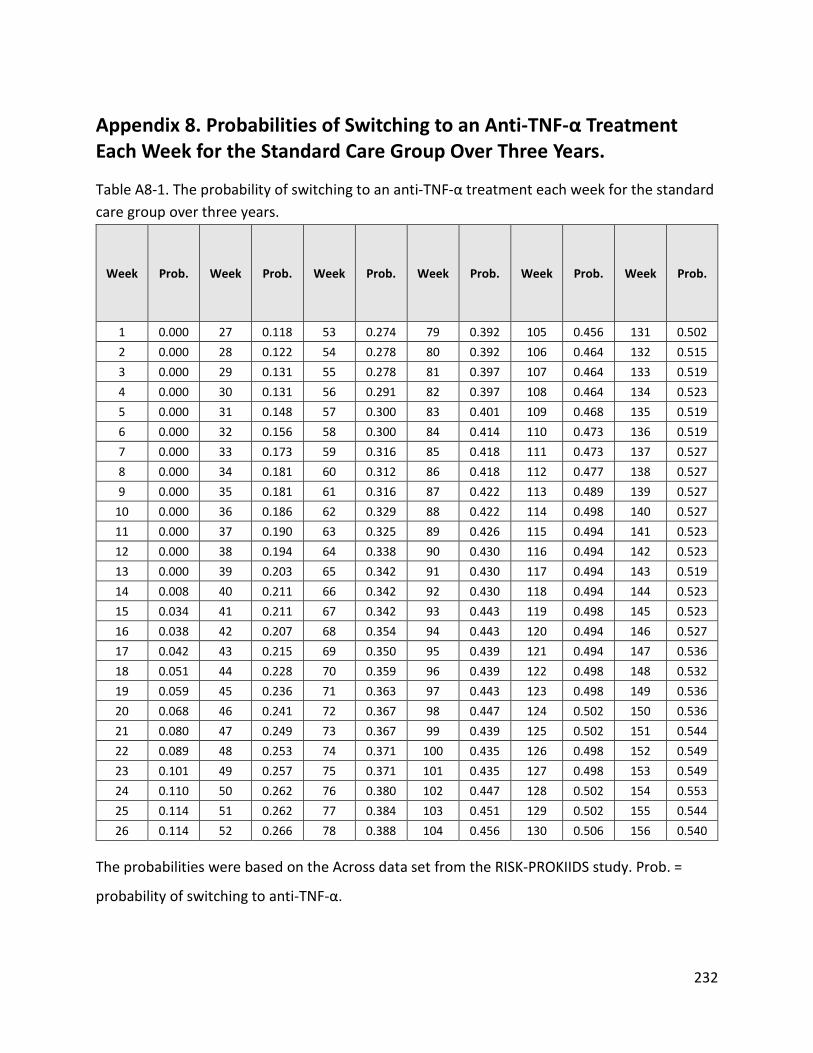
232
Appendix 8. Probabilities of Switching to an Anti-TNF-α Treatment Each Week for the Standard Care Group Over Three Years.
Table A8-1. The probability of switching to an anti-TNF-α treatment each week for the standard care group over three years.
Week Prob. Week Prob. Week Prob. Week Prob. Week Prob. Week Prob.
1 0.000 27 0.118 53 0.274 79 0.392 105 0.456 131 0.502 2 0.000 28 0.122 54 0.278 80 0.392 106 0.464 132 0.515 3 0.000 29 0.131 55 0.278 81 0.397 107 0.464 133 0.519 4 0.000 30 0.131 56 0.291 82 0.397 108 0.464 134 0.523 5 0.000 31 0.148 57 0.300 83 0.401 109 0.468 135 0.519 6 0.000 32 0.156 58 0.300 84 0.414 110 0.473 136 0.519 7 0.000 33 0.173 59 0.316 85 0.418 111 0.473 137 0.527 8 0.000 34 0.181 60 0.312 86 0.418 112 0.477 138 0.527 9 0.000 35 0.181 61 0.316 87 0.422 113 0.489 139 0.527
10 0.000 36 0.186 62 0.329 88 0.422 114 0.498 140 0.527 11 0.000 37 0.190 63 0.325 89 0.426 115 0.494 141 0.523 12 0.000 38 0.194 64 0.338 90 0.430 116 0.494 142 0.523 13 0.000 39 0.203 65 0.342 91 0.430 117 0.494 143 0.519 14 0.008 40 0.211 66 0.342 92 0.430 118 0.494 144 0.523 15 0.034 41 0.211 67 0.342 93 0.443 119 0.498 145 0.523 16 0.038 42 0.207 68 0.354 94 0.443 120 0.494 146 0.527 17 0.042 43 0.215 69 0.350 95 0.439 121 0.494 147 0.536 18 0.051 44 0.228 70 0.359 96 0.439 122 0.498 148 0.532 19 0.059 45 0.236 71 0.363 97 0.443 123 0.498 149 0.536 20 0.068 46 0.241 72 0.367 98 0.447 124 0.502 150 0.536 21 0.080 47 0.249 73 0.367 99 0.439 125 0.502 151 0.544 22 0.089 48 0.253 74 0.371 100 0.435 126 0.498 152 0.549 23 0.101 49 0.257 75 0.371 101 0.435 127 0.498 153 0.549 24 0.110 50 0.262 76 0.380 102 0.447 128 0.502 154 0.553 25 0.114 51 0.262 77 0.384 103 0.451 129 0.502 155 0.544 26 0.114 52 0.266 78 0.388 104 0.456 130 0.506 156 0.540
The probabilities were based on the Across data set from the RISK-PROKIIDS study. Prob. =
probability of switching to anti-TNF-α.
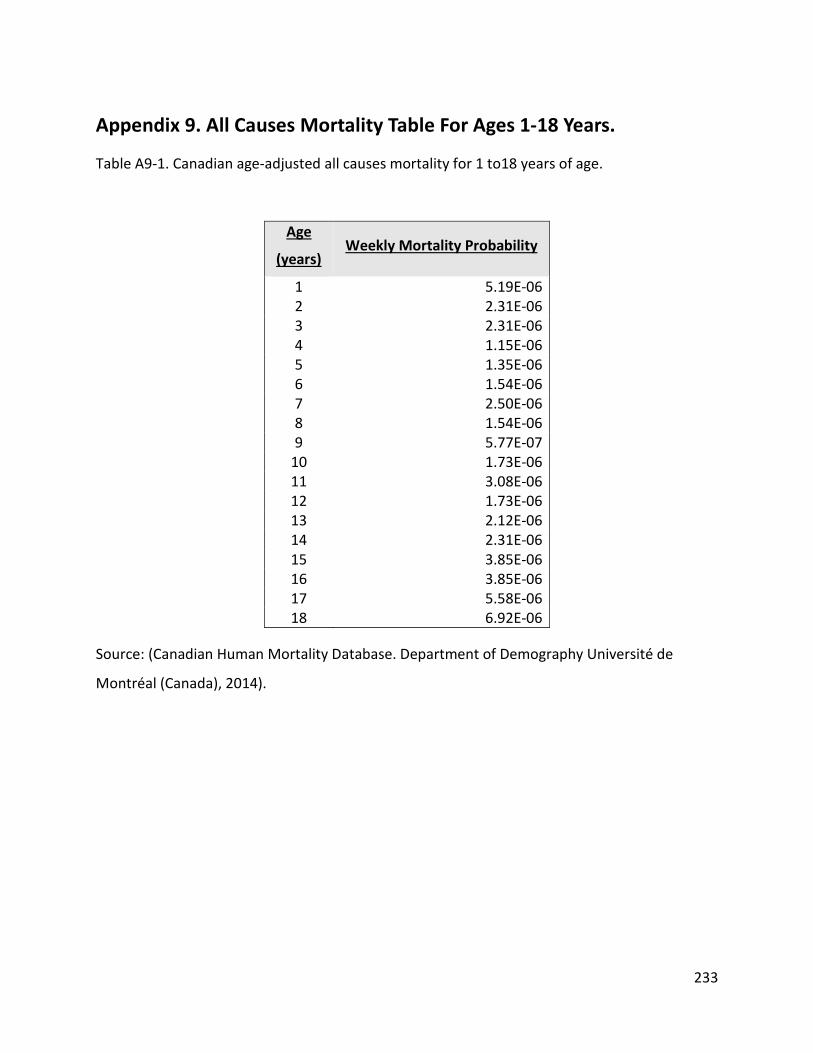
233
Appendix 9. All Causes Mortality Table For Ages 1-18 Years.
Table A9-1. Canadian age-adjusted all causes mortality for 1 to18 years of age.
Age
(years) Weekly Mortality Probability
1 5.19E-06 2 2.31E-06 3 2.31E-06 4 1.15E-06 5 1.35E-06 6 1.54E-06 7 2.50E-06 8 1.54E-06 9 5.77E-07
10 1.73E-06 11 3.08E-06 12 1.73E-06 13 2.12E-06 14 2.31E-06 15 3.85E-06 16 3.85E-06 17 5.58E-06 18 6.92E-06
Source: (Canadian Human Mortality Database. Department of Demography Université de
Montréal (Canada), 2014).
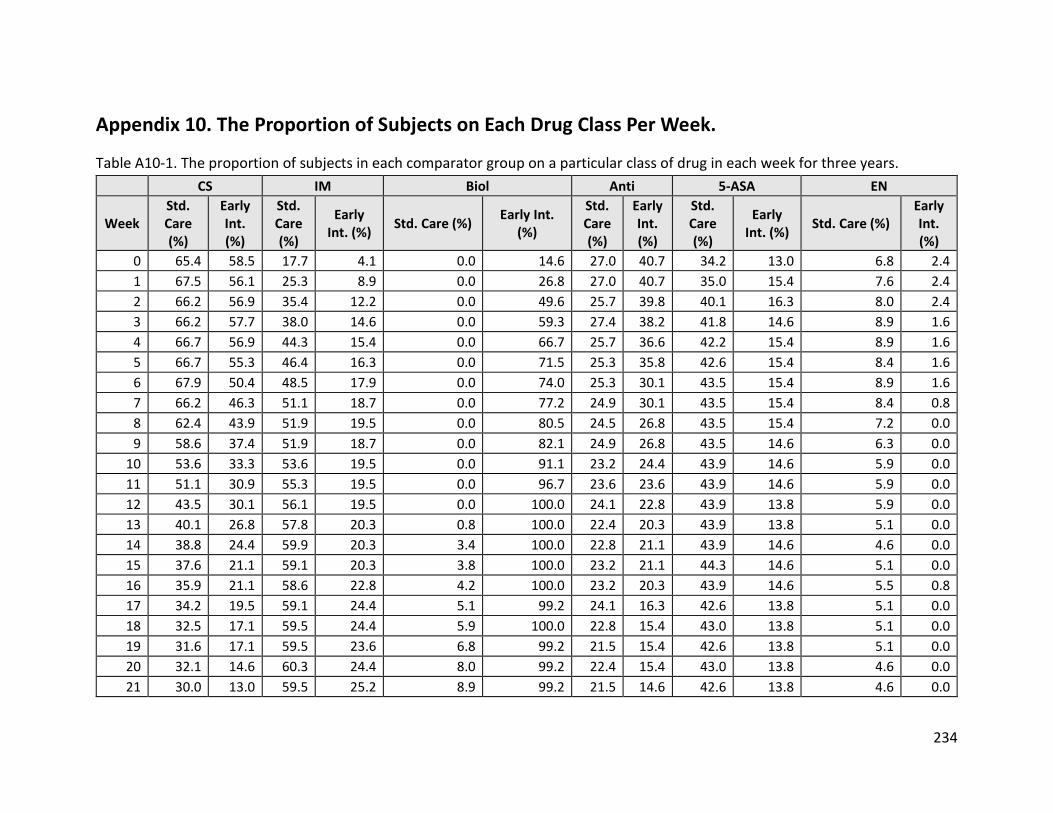
234
Appendix 10. The Proportion of Subjects on Each Drug Class Per Week.
Table A10-1. The proportion of subjects in each comparator group on a particular class of drug in each week for three years. CS IM Biol Anti 5-ASA EN
Week Std. Care (%)
Early Int. (%)
Std. Care (%)
Early Int. (%) Std. Care (%) Early Int.
(%)
Std. Care (%)
Early Int. (%)
Std. Care (%)
Early Int. (%) Std. Care (%)
Early Int. (%)
0 65.4 58.5 17.7 4.1 0.0 14.6 27.0 40.7 34.2 13.0 6.8 2.4 1 67.5 56.1 25.3 8.9 0.0 26.8 27.0 40.7 35.0 15.4 7.6 2.4 2 66.2 56.9 35.4 12.2 0.0 49.6 25.7 39.8 40.1 16.3 8.0 2.4 3 66.2 57.7 38.0 14.6 0.0 59.3 27.4 38.2 41.8 14.6 8.9 1.6 4 66.7 56.9 44.3 15.4 0.0 66.7 25.7 36.6 42.2 15.4 8.9 1.6 5 66.7 55.3 46.4 16.3 0.0 71.5 25.3 35.8 42.6 15.4 8.4 1.6 6 67.9 50.4 48.5 17.9 0.0 74.0 25.3 30.1 43.5 15.4 8.9 1.6 7 66.2 46.3 51.1 18.7 0.0 77.2 24.9 30.1 43.5 15.4 8.4 0.8 8 62.4 43.9 51.9 19.5 0.0 80.5 24.5 26.8 43.5 15.4 7.2 0.0 9 58.6 37.4 51.9 18.7 0.0 82.1 24.9 26.8 43.5 14.6 6.3 0.0
10 53.6 33.3 53.6 19.5 0.0 91.1 23.2 24.4 43.9 14.6 5.9 0.0 11 51.1 30.9 55.3 19.5 0.0 96.7 23.6 23.6 43.9 14.6 5.9 0.0 12 43.5 30.1 56.1 19.5 0.0 100.0 24.1 22.8 43.9 13.8 5.9 0.0 13 40.1 26.8 57.8 20.3 0.8 100.0 22.4 20.3 43.9 13.8 5.1 0.0 14 38.8 24.4 59.9 20.3 3.4 100.0 22.8 21.1 43.9 14.6 4.6 0.0 15 37.6 21.1 59.1 20.3 3.8 100.0 23.2 21.1 44.3 14.6 5.1 0.0 16 35.9 21.1 58.6 22.8 4.2 100.0 23.2 20.3 43.9 14.6 5.5 0.8 17 34.2 19.5 59.1 24.4 5.1 99.2 24.1 16.3 42.6 13.8 5.1 0.0 18 32.5 17.1 59.5 24.4 5.9 100.0 22.8 15.4 43.0 13.8 5.1 0.0 19 31.6 17.1 59.5 23.6 6.8 99.2 21.5 15.4 42.6 13.8 5.1 0.0 20 32.1 14.6 60.3 24.4 8.0 99.2 22.4 15.4 43.0 13.8 4.6 0.0 21 30.0 13.0 59.5 25.2 8.9 99.2 21.5 14.6 42.6 13.8 4.6 0.0
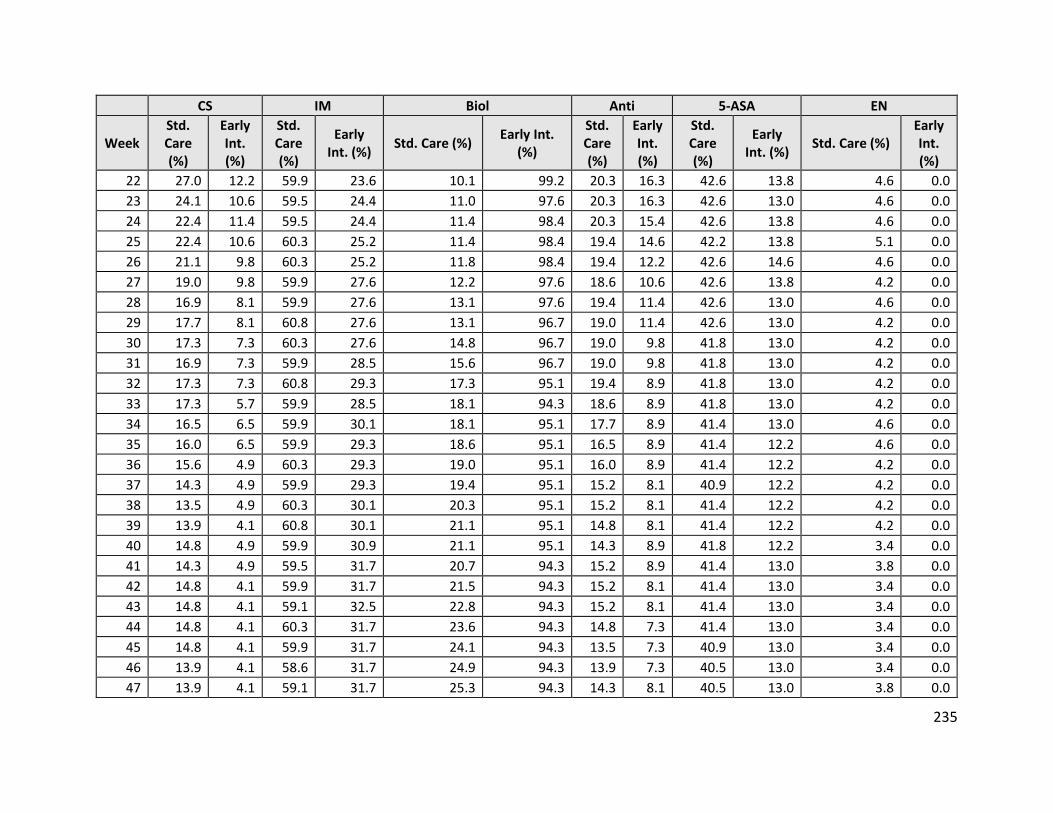
235
CS IM Biol Anti 5-ASA EN
Week Std. Care (%)
Early Int. (%)
Std. Care (%)
Early Int. (%) Std. Care (%) Early Int.
(%)
Std. Care (%)
Early Int. (%)
Std. Care (%)
Early Int. (%) Std. Care (%)
Early Int. (%)
22 27.0 12.2 59.9 23.6 10.1 99.2 20.3 16.3 42.6 13.8 4.6 0.0 23 24.1 10.6 59.5 24.4 11.0 97.6 20.3 16.3 42.6 13.0 4.6 0.0 24 22.4 11.4 59.5 24.4 11.4 98.4 20.3 15.4 42.6 13.8 4.6 0.0 25 22.4 10.6 60.3 25.2 11.4 98.4 19.4 14.6 42.2 13.8 5.1 0.0 26 21.1 9.8 60.3 25.2 11.8 98.4 19.4 12.2 42.6 14.6 4.6 0.0 27 19.0 9.8 59.9 27.6 12.2 97.6 18.6 10.6 42.6 13.8 4.2 0.0 28 16.9 8.1 59.9 27.6 13.1 97.6 19.4 11.4 42.6 13.0 4.6 0.0 29 17.7 8.1 60.8 27.6 13.1 96.7 19.0 11.4 42.6 13.0 4.2 0.0 30 17.3 7.3 60.3 27.6 14.8 96.7 19.0 9.8 41.8 13.0 4.2 0.0 31 16.9 7.3 59.9 28.5 15.6 96.7 19.0 9.8 41.8 13.0 4.2 0.0 32 17.3 7.3 60.8 29.3 17.3 95.1 19.4 8.9 41.8 13.0 4.2 0.0 33 17.3 5.7 59.9 28.5 18.1 94.3 18.6 8.9 41.8 13.0 4.2 0.0 34 16.5 6.5 59.9 30.1 18.1 95.1 17.7 8.9 41.4 13.0 4.6 0.0 35 16.0 6.5 59.9 29.3 18.6 95.1 16.5 8.9 41.4 12.2 4.6 0.0 36 15.6 4.9 60.3 29.3 19.0 95.1 16.0 8.9 41.4 12.2 4.2 0.0 37 14.3 4.9 59.9 29.3 19.4 95.1 15.2 8.1 40.9 12.2 4.2 0.0 38 13.5 4.9 60.3 30.1 20.3 95.1 15.2 8.1 41.4 12.2 4.2 0.0 39 13.9 4.1 60.8 30.1 21.1 95.1 14.8 8.1 41.4 12.2 4.2 0.0 40 14.8 4.9 59.9 30.9 21.1 95.1 14.3 8.9 41.8 12.2 3.4 0.0 41 14.3 4.9 59.5 31.7 20.7 94.3 15.2 8.9 41.4 13.0 3.8 0.0 42 14.8 4.1 59.9 31.7 21.5 94.3 15.2 8.1 41.4 13.0 3.4 0.0 43 14.8 4.1 59.1 32.5 22.8 94.3 15.2 8.1 41.4 13.0 3.4 0.0 44 14.8 4.1 60.3 31.7 23.6 94.3 14.8 7.3 41.4 13.0 3.4 0.0 45 14.8 4.1 59.9 31.7 24.1 94.3 13.5 7.3 40.9 13.0 3.4 0.0 46 13.9 4.1 58.6 31.7 24.9 94.3 13.9 7.3 40.5 13.0 3.4 0.0 47 13.9 4.1 59.1 31.7 25.3 94.3 14.3 8.1 40.5 13.0 3.8 0.0
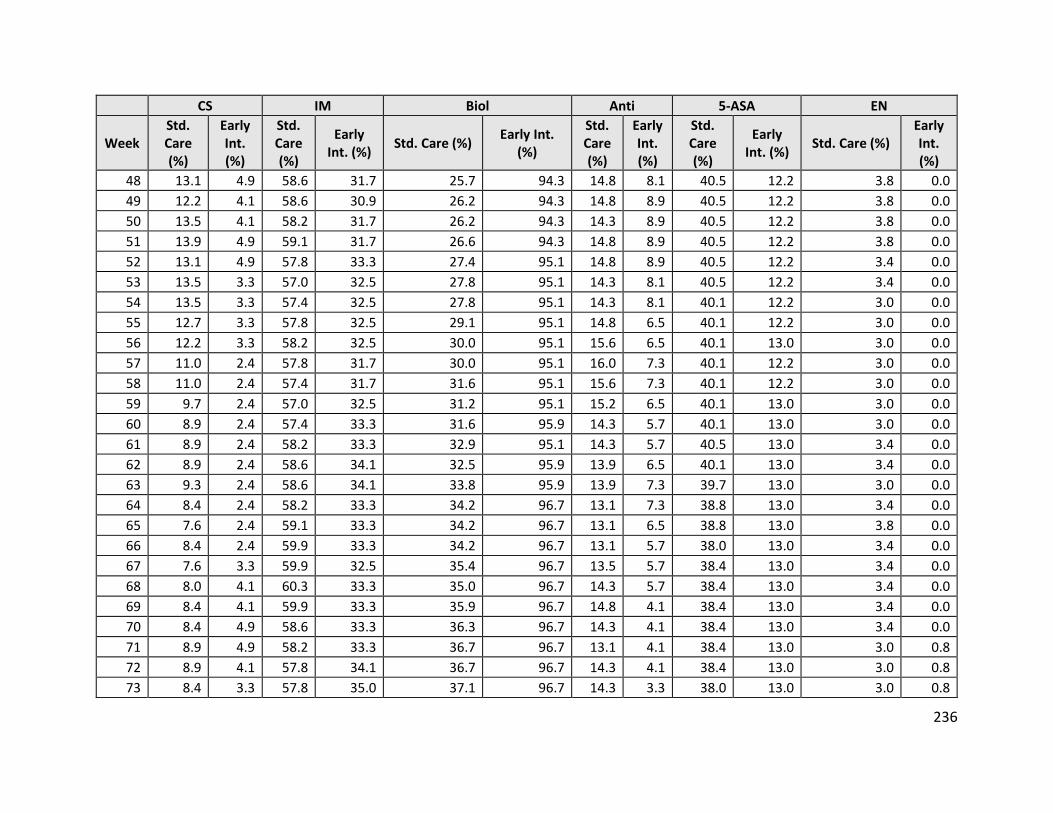
236
CS IM Biol Anti 5-ASA EN
Week Std. Care (%)
Early Int. (%)
Std. Care (%)
Early Int. (%) Std. Care (%) Early Int.
(%)
Std. Care (%)
Early Int. (%)
Std. Care (%)
Early Int. (%) Std. Care (%)
Early Int. (%)
48 13.1 4.9 58.6 31.7 25.7 94.3 14.8 8.1 40.5 12.2 3.8 0.0 49 12.2 4.1 58.6 30.9 26.2 94.3 14.8 8.9 40.5 12.2 3.8 0.0 50 13.5 4.1 58.2 31.7 26.2 94.3 14.3 8.9 40.5 12.2 3.8 0.0 51 13.9 4.9 59.1 31.7 26.6 94.3 14.8 8.9 40.5 12.2 3.8 0.0 52 13.1 4.9 57.8 33.3 27.4 95.1 14.8 8.9 40.5 12.2 3.4 0.0 53 13.5 3.3 57.0 32.5 27.8 95.1 14.3 8.1 40.5 12.2 3.4 0.0 54 13.5 3.3 57.4 32.5 27.8 95.1 14.3 8.1 40.1 12.2 3.0 0.0 55 12.7 3.3 57.8 32.5 29.1 95.1 14.8 6.5 40.1 12.2 3.0 0.0 56 12.2 3.3 58.2 32.5 30.0 95.1 15.6 6.5 40.1 13.0 3.0 0.0 57 11.0 2.4 57.8 31.7 30.0 95.1 16.0 7.3 40.1 12.2 3.0 0.0 58 11.0 2.4 57.4 31.7 31.6 95.1 15.6 7.3 40.1 12.2 3.0 0.0 59 9.7 2.4 57.0 32.5 31.2 95.1 15.2 6.5 40.1 13.0 3.0 0.0 60 8.9 2.4 57.4 33.3 31.6 95.9 14.3 5.7 40.1 13.0 3.0 0.0 61 8.9 2.4 58.2 33.3 32.9 95.1 14.3 5.7 40.5 13.0 3.4 0.0 62 8.9 2.4 58.6 34.1 32.5 95.9 13.9 6.5 40.1 13.0 3.4 0.0 63 9.3 2.4 58.6 34.1 33.8 95.9 13.9 7.3 39.7 13.0 3.0 0.0 64 8.4 2.4 58.2 33.3 34.2 96.7 13.1 7.3 38.8 13.0 3.4 0.0 65 7.6 2.4 59.1 33.3 34.2 96.7 13.1 6.5 38.8 13.0 3.8 0.0 66 8.4 2.4 59.9 33.3 34.2 96.7 13.1 5.7 38.0 13.0 3.4 0.0 67 7.6 3.3 59.9 32.5 35.4 96.7 13.5 5.7 38.4 13.0 3.4 0.0 68 8.0 4.1 60.3 33.3 35.0 96.7 14.3 5.7 38.4 13.0 3.4 0.0 69 8.4 4.1 59.9 33.3 35.9 96.7 14.8 4.1 38.4 13.0 3.4 0.0 70 8.4 4.9 58.6 33.3 36.3 96.7 14.3 4.1 38.4 13.0 3.4 0.0 71 8.9 4.9 58.2 33.3 36.7 96.7 13.1 4.1 38.4 13.0 3.0 0.8 72 8.9 4.1 57.8 34.1 36.7 96.7 14.3 4.1 38.4 13.0 3.0 0.8 73 8.4 3.3 57.8 35.0 37.1 96.7 14.3 3.3 38.0 13.0 3.0 0.8
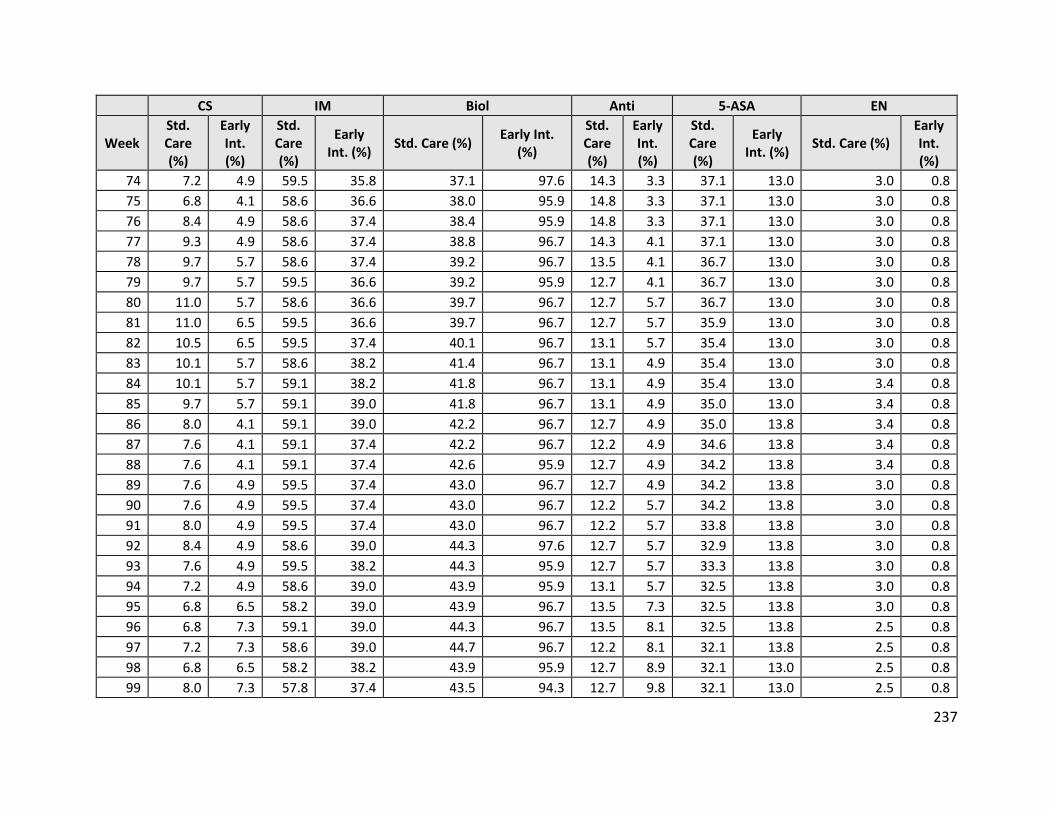
237
CS IM Biol Anti 5-ASA EN
Week Std. Care (%)
Early Int. (%)
Std. Care (%)
Early Int. (%) Std. Care (%) Early Int.
(%)
Std. Care (%)
Early Int. (%)
Std. Care (%)
Early Int. (%) Std. Care (%)
Early Int. (%)
74 7.2 4.9 59.5 35.8 37.1 97.6 14.3 3.3 37.1 13.0 3.0 0.8 75 6.8 4.1 58.6 36.6 38.0 95.9 14.8 3.3 37.1 13.0 3.0 0.8 76 8.4 4.9 58.6 37.4 38.4 95.9 14.8 3.3 37.1 13.0 3.0 0.8 77 9.3 4.9 58.6 37.4 38.8 96.7 14.3 4.1 37.1 13.0 3.0 0.8 78 9.7 5.7 58.6 37.4 39.2 96.7 13.5 4.1 36.7 13.0 3.0 0.8 79 9.7 5.7 59.5 36.6 39.2 95.9 12.7 4.1 36.7 13.0 3.0 0.8 80 11.0 5.7 58.6 36.6 39.7 96.7 12.7 5.7 36.7 13.0 3.0 0.8 81 11.0 6.5 59.5 36.6 39.7 96.7 12.7 5.7 35.9 13.0 3.0 0.8 82 10.5 6.5 59.5 37.4 40.1 96.7 13.1 5.7 35.4 13.0 3.0 0.8 83 10.1 5.7 58.6 38.2 41.4 96.7 13.1 4.9 35.4 13.0 3.0 0.8 84 10.1 5.7 59.1 38.2 41.8 96.7 13.1 4.9 35.4 13.0 3.4 0.8 85 9.7 5.7 59.1 39.0 41.8 96.7 13.1 4.9 35.0 13.0 3.4 0.8 86 8.0 4.1 59.1 39.0 42.2 96.7 12.7 4.9 35.0 13.8 3.4 0.8 87 7.6 4.1 59.1 37.4 42.2 96.7 12.2 4.9 34.6 13.8 3.4 0.8 88 7.6 4.1 59.1 37.4 42.6 95.9 12.7 4.9 34.2 13.8 3.4 0.8 89 7.6 4.9 59.5 37.4 43.0 96.7 12.7 4.9 34.2 13.8 3.0 0.8 90 7.6 4.9 59.5 37.4 43.0 96.7 12.2 5.7 34.2 13.8 3.0 0.8 91 8.0 4.9 59.5 37.4 43.0 96.7 12.2 5.7 33.8 13.8 3.0 0.8 92 8.4 4.9 58.6 39.0 44.3 97.6 12.7 5.7 32.9 13.8 3.0 0.8 93 7.6 4.9 59.5 38.2 44.3 95.9 12.7 5.7 33.3 13.8 3.0 0.8 94 7.2 4.9 58.6 39.0 43.9 95.9 13.1 5.7 32.5 13.8 3.0 0.8 95 6.8 6.5 58.2 39.0 43.9 96.7 13.5 7.3 32.5 13.8 3.0 0.8 96 6.8 7.3 59.1 39.0 44.3 96.7 13.5 8.1 32.5 13.8 2.5 0.8 97 7.2 7.3 58.6 39.0 44.7 96.7 12.2 8.1 32.1 13.8 2.5 0.8 98 6.8 6.5 58.2 38.2 43.9 95.9 12.7 8.9 32.1 13.0 2.5 0.8 99 8.0 7.3 57.8 37.4 43.5 94.3 12.7 9.8 32.1 13.0 2.5 0.8
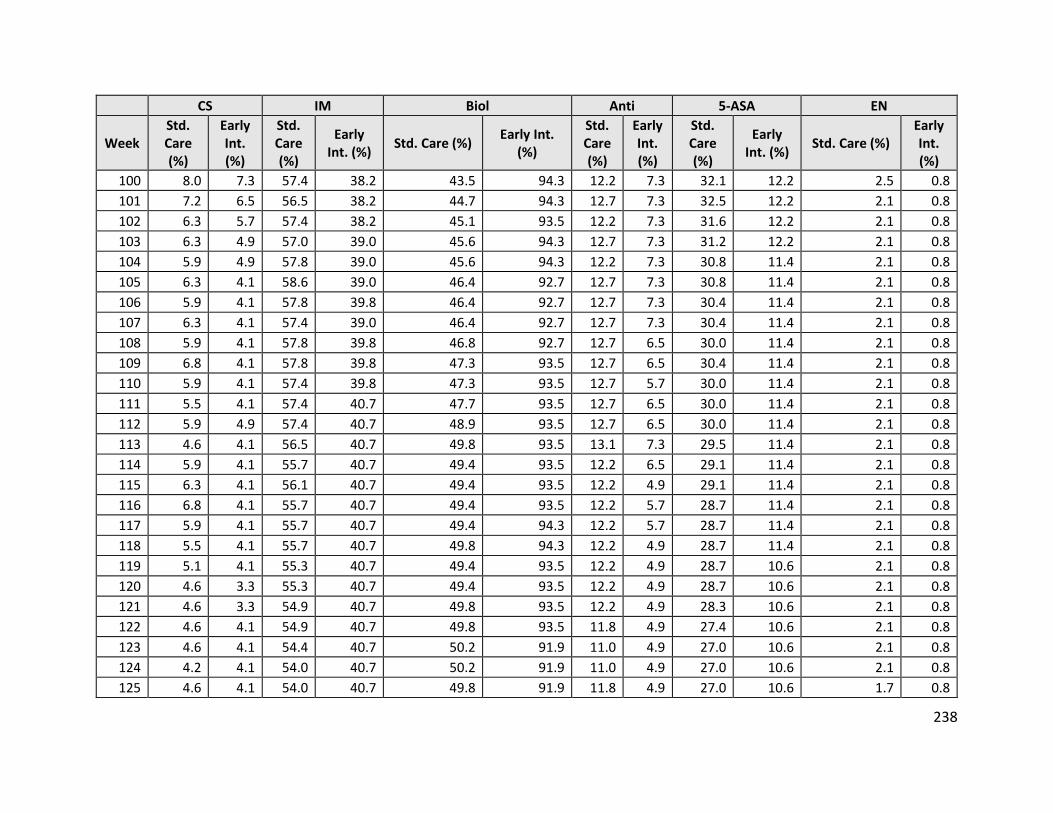
238
CS IM Biol Anti 5-ASA EN
Week Std. Care (%)
Early Int. (%)
Std. Care (%)
Early Int. (%) Std. Care (%) Early Int.
(%)
Std. Care (%)
Early Int. (%)
Std. Care (%)
Early Int. (%) Std. Care (%)
Early Int. (%)
100 8.0 7.3 57.4 38.2 43.5 94.3 12.2 7.3 32.1 12.2 2.5 0.8 101 7.2 6.5 56.5 38.2 44.7 94.3 12.7 7.3 32.5 12.2 2.1 0.8 102 6.3 5.7 57.4 38.2 45.1 93.5 12.2 7.3 31.6 12.2 2.1 0.8 103 6.3 4.9 57.0 39.0 45.6 94.3 12.7 7.3 31.2 12.2 2.1 0.8 104 5.9 4.9 57.8 39.0 45.6 94.3 12.2 7.3 30.8 11.4 2.1 0.8 105 6.3 4.1 58.6 39.0 46.4 92.7 12.7 7.3 30.8 11.4 2.1 0.8 106 5.9 4.1 57.8 39.8 46.4 92.7 12.7 7.3 30.4 11.4 2.1 0.8 107 6.3 4.1 57.4 39.0 46.4 92.7 12.7 7.3 30.4 11.4 2.1 0.8 108 5.9 4.1 57.8 39.8 46.8 92.7 12.7 6.5 30.0 11.4 2.1 0.8 109 6.8 4.1 57.8 39.8 47.3 93.5 12.7 6.5 30.4 11.4 2.1 0.8 110 5.9 4.1 57.4 39.8 47.3 93.5 12.7 5.7 30.0 11.4 2.1 0.8 111 5.5 4.1 57.4 40.7 47.7 93.5 12.7 6.5 30.0 11.4 2.1 0.8 112 5.9 4.9 57.4 40.7 48.9 93.5 12.7 6.5 30.0 11.4 2.1 0.8 113 4.6 4.1 56.5 40.7 49.8 93.5 13.1 7.3 29.5 11.4 2.1 0.8 114 5.9 4.1 55.7 40.7 49.4 93.5 12.2 6.5 29.1 11.4 2.1 0.8 115 6.3 4.1 56.1 40.7 49.4 93.5 12.2 4.9 29.1 11.4 2.1 0.8 116 6.8 4.1 55.7 40.7 49.4 93.5 12.2 5.7 28.7 11.4 2.1 0.8 117 5.9 4.1 55.7 40.7 49.4 94.3 12.2 5.7 28.7 11.4 2.1 0.8 118 5.5 4.1 55.7 40.7 49.8 94.3 12.2 4.9 28.7 11.4 2.1 0.8 119 5.1 4.1 55.3 40.7 49.4 93.5 12.2 4.9 28.7 10.6 2.1 0.8 120 4.6 3.3 55.3 40.7 49.4 93.5 12.2 4.9 28.7 10.6 2.1 0.8 121 4.6 3.3 54.9 40.7 49.8 93.5 12.2 4.9 28.3 10.6 2.1 0.8 122 4.6 4.1 54.9 40.7 49.8 93.5 11.8 4.9 27.4 10.6 2.1 0.8 123 4.6 4.1 54.4 40.7 50.2 91.9 11.0 4.9 27.0 10.6 2.1 0.8 124 4.2 4.1 54.0 40.7 50.2 91.9 11.0 4.9 27.0 10.6 2.1 0.8 125 4.6 4.1 54.0 40.7 49.8 91.9 11.8 4.9 27.0 10.6 1.7 0.8
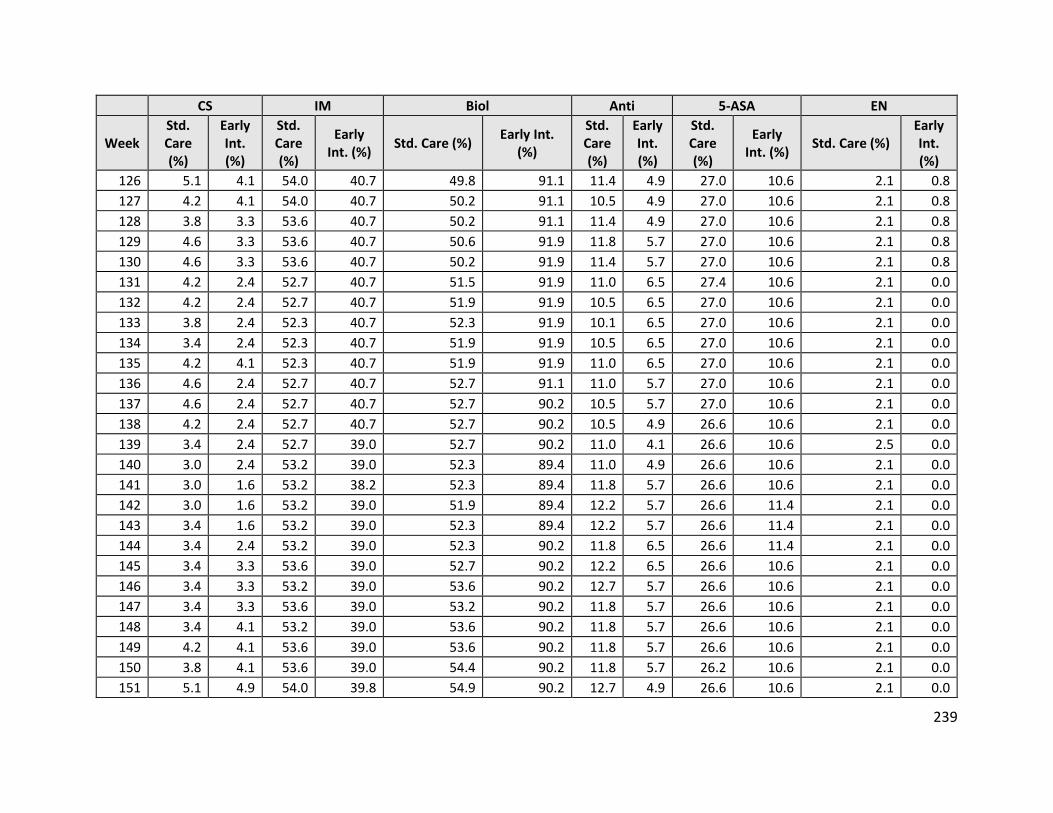
239
CS IM Biol Anti 5-ASA EN
Week Std. Care (%)
Early Int. (%)
Std. Care (%)
Early Int. (%) Std. Care (%) Early Int.
(%)
Std. Care (%)
Early Int. (%)
Std. Care (%)
Early Int. (%) Std. Care (%)
Early Int. (%)
126 5.1 4.1 54.0 40.7 49.8 91.1 11.4 4.9 27.0 10.6 2.1 0.8 127 4.2 4.1 54.0 40.7 50.2 91.1 10.5 4.9 27.0 10.6 2.1 0.8 128 3.8 3.3 53.6 40.7 50.2 91.1 11.4 4.9 27.0 10.6 2.1 0.8 129 4.6 3.3 53.6 40.7 50.6 91.9 11.8 5.7 27.0 10.6 2.1 0.8 130 4.6 3.3 53.6 40.7 50.2 91.9 11.4 5.7 27.0 10.6 2.1 0.8 131 4.2 2.4 52.7 40.7 51.5 91.9 11.0 6.5 27.4 10.6 2.1 0.0 132 4.2 2.4 52.7 40.7 51.9 91.9 10.5 6.5 27.0 10.6 2.1 0.0 133 3.8 2.4 52.3 40.7 52.3 91.9 10.1 6.5 27.0 10.6 2.1 0.0 134 3.4 2.4 52.3 40.7 51.9 91.9 10.5 6.5 27.0 10.6 2.1 0.0 135 4.2 4.1 52.3 40.7 51.9 91.9 11.0 6.5 27.0 10.6 2.1 0.0 136 4.6 2.4 52.7 40.7 52.7 91.1 11.0 5.7 27.0 10.6 2.1 0.0 137 4.6 2.4 52.7 40.7 52.7 90.2 10.5 5.7 27.0 10.6 2.1 0.0 138 4.2 2.4 52.7 40.7 52.7 90.2 10.5 4.9 26.6 10.6 2.1 0.0 139 3.4 2.4 52.7 39.0 52.7 90.2 11.0 4.1 26.6 10.6 2.5 0.0 140 3.0 2.4 53.2 39.0 52.3 89.4 11.0 4.9 26.6 10.6 2.1 0.0 141 3.0 1.6 53.2 38.2 52.3 89.4 11.8 5.7 26.6 10.6 2.1 0.0 142 3.0 1.6 53.2 39.0 51.9 89.4 12.2 5.7 26.6 11.4 2.1 0.0 143 3.4 1.6 53.2 39.0 52.3 89.4 12.2 5.7 26.6 11.4 2.1 0.0 144 3.4 2.4 53.2 39.0 52.3 90.2 11.8 6.5 26.6 11.4 2.1 0.0 145 3.4 3.3 53.6 39.0 52.7 90.2 12.2 6.5 26.6 10.6 2.1 0.0 146 3.4 3.3 53.2 39.0 53.6 90.2 12.7 5.7 26.6 10.6 2.1 0.0 147 3.4 3.3 53.6 39.0 53.2 90.2 11.8 5.7 26.6 10.6 2.1 0.0 148 3.4 4.1 53.2 39.0 53.6 90.2 11.8 5.7 26.6 10.6 2.1 0.0 149 4.2 4.1 53.6 39.0 53.6 90.2 11.8 5.7 26.6 10.6 2.1 0.0 150 3.8 4.1 53.6 39.0 54.4 90.2 11.8 5.7 26.2 10.6 2.1 0.0 151 5.1 4.9 54.0 39.8 54.9 90.2 12.7 4.9 26.6 10.6 2.1 0.0
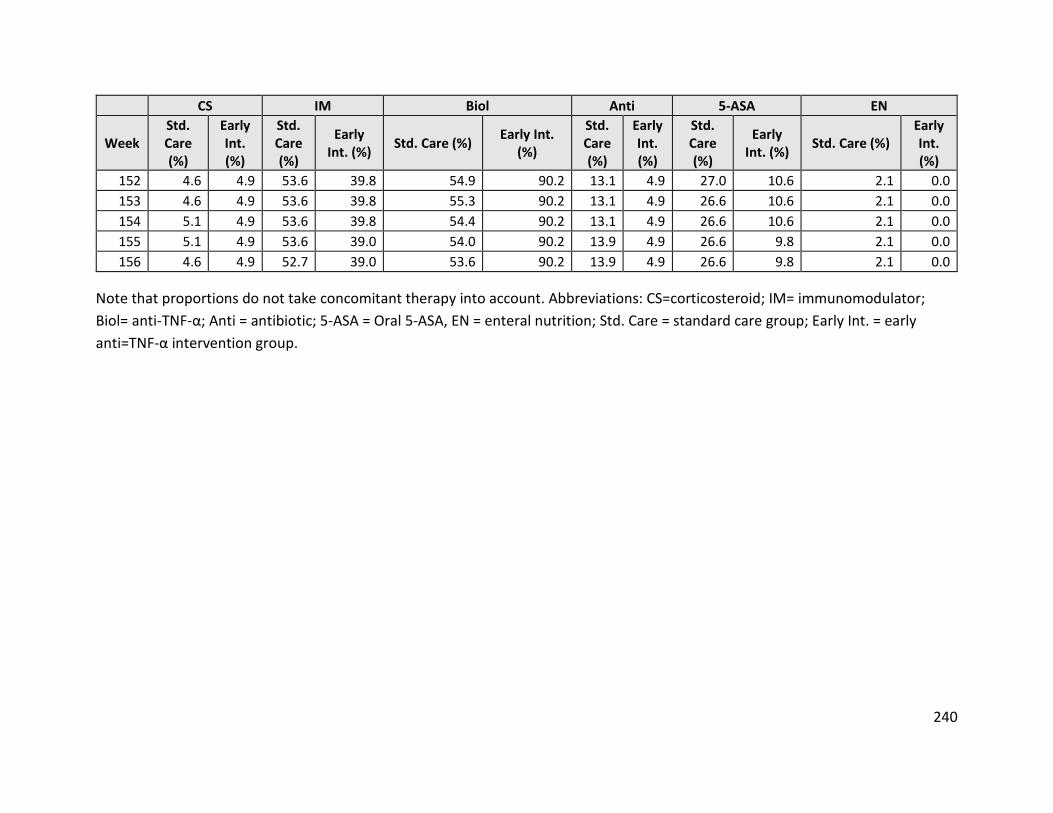
240
CS IM Biol Anti 5-ASA EN
Week Std. Care (%)
Early Int. (%)
Std. Care (%)
Early Int. (%) Std. Care (%) Early Int.
(%)
Std. Care (%)
Early Int. (%)
Std. Care (%)
Early Int. (%) Std. Care (%)
Early Int. (%)
152 4.6 4.9 53.6 39.8 54.9 90.2 13.1 4.9 27.0 10.6 2.1 0.0 153 4.6 4.9 53.6 39.8 55.3 90.2 13.1 4.9 26.6 10.6 2.1 0.0 154 5.1 4.9 53.6 39.8 54.4 90.2 13.1 4.9 26.6 10.6 2.1 0.0 155 5.1 4.9 53.6 39.0 54.0 90.2 13.9 4.9 26.6 9.8 2.1 0.0 156 4.6 4.9 52.7 39.0 53.6 90.2 13.9 4.9 26.6 9.8 2.1 0.0
Note that proportions do not take concomitant therapy into account. Abbreviations: CS=corticosteroid; IM= immunomodulator; Biol= anti-TNF-α; Anti = antibiotic; 5-ASA = Oral 5-ASA, EN = enteral nutrition; Std. Care = standard care group; Early Int. = early anti=TNF-α intervention group.
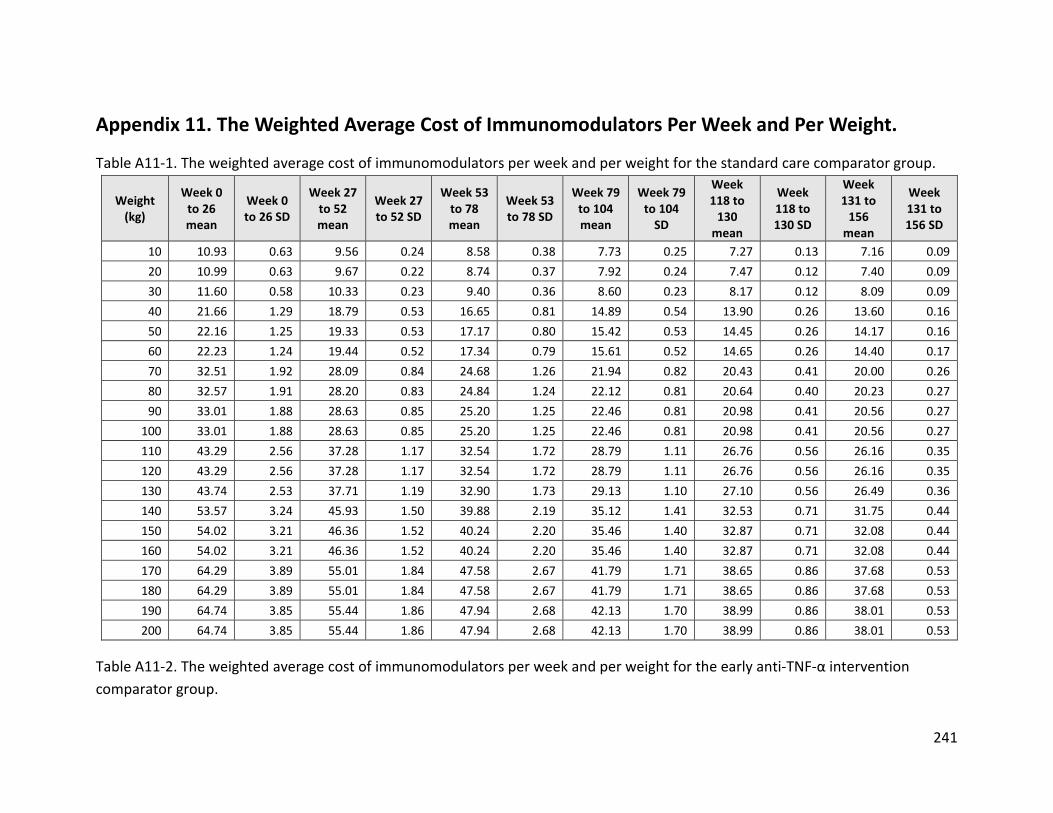
241
Appendix 11. The Weighted Average Cost of Immunomodulators Per Week and Per Weight.
Table A11-1. The weighted average cost of immunomodulators per week and per weight for the standard care comparator group.
Weight (kg)
Week 0 to 26 mean
Week 0 to 26 SD
Week 27 to 52 mean
Week 27 to 52 SD
Week 53 to 78 mean
Week 53 to 78 SD
Week 79 to 104 mean
Week 79 to 104
SD
Week 118 to
130 mean
Week 118 to 130 SD
Week 131 to
156 mean
Week 131 to 156 SD
10 10.93 0.63 9.56 0.24 8.58 0.38 7.73 0.25 7.27 0.13 7.16 0.09 20 10.99 0.63 9.67 0.22 8.74 0.37 7.92 0.24 7.47 0.12 7.40 0.09 30 11.60 0.58 10.33 0.23 9.40 0.36 8.60 0.23 8.17 0.12 8.09 0.09 40 21.66 1.29 18.79 0.53 16.65 0.81 14.89 0.54 13.90 0.26 13.60 0.16 50 22.16 1.25 19.33 0.53 17.17 0.80 15.42 0.53 14.45 0.26 14.17 0.16 60 22.23 1.24 19.44 0.52 17.34 0.79 15.61 0.52 14.65 0.26 14.40 0.17 70 32.51 1.92 28.09 0.84 24.68 1.26 21.94 0.82 20.43 0.41 20.00 0.26 80 32.57 1.91 28.20 0.83 24.84 1.24 22.12 0.81 20.64 0.40 20.23 0.27 90 33.01 1.88 28.63 0.85 25.20 1.25 22.46 0.81 20.98 0.41 20.56 0.27
100 33.01 1.88 28.63 0.85 25.20 1.25 22.46 0.81 20.98 0.41 20.56 0.27 110 43.29 2.56 37.28 1.17 32.54 1.72 28.79 1.11 26.76 0.56 26.16 0.35 120 43.29 2.56 37.28 1.17 32.54 1.72 28.79 1.11 26.76 0.56 26.16 0.35 130 43.74 2.53 37.71 1.19 32.90 1.73 29.13 1.10 27.10 0.56 26.49 0.36 140 53.57 3.24 45.93 1.50 39.88 2.19 35.12 1.41 32.53 0.71 31.75 0.44 150 54.02 3.21 46.36 1.52 40.24 2.20 35.46 1.40 32.87 0.71 32.08 0.44 160 54.02 3.21 46.36 1.52 40.24 2.20 35.46 1.40 32.87 0.71 32.08 0.44 170 64.29 3.89 55.01 1.84 47.58 2.67 41.79 1.71 38.65 0.86 37.68 0.53 180 64.29 3.89 55.01 1.84 47.58 2.67 41.79 1.71 38.65 0.86 37.68 0.53 190 64.74 3.85 55.44 1.86 47.94 2.68 42.13 1.70 38.99 0.86 38.01 0.53 200 64.74 3.85 55.44 1.86 47.94 2.68 42.13 1.70 38.99 0.86 38.01 0.53
Table A11-2. The weighted average cost of immunomodulators per week and per weight for the early anti-TNF-α intervention comparator group.
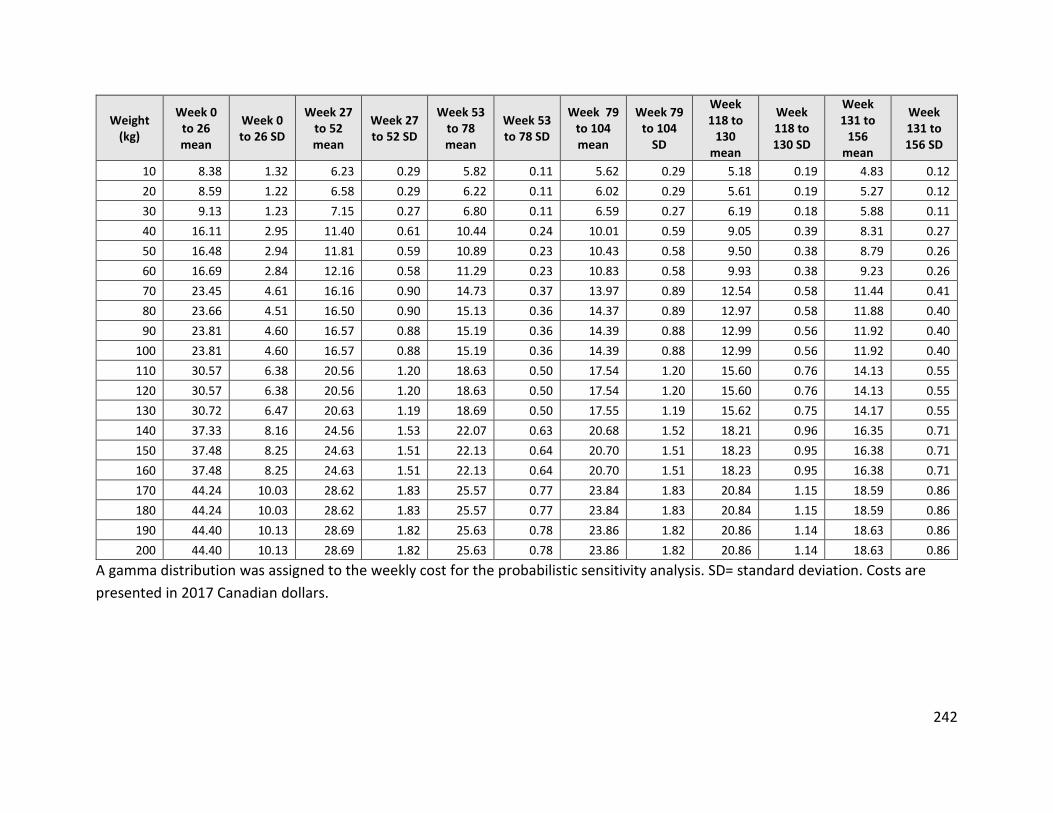
242
Weight (kg)
Week 0 to 26 mean
Week 0 to 26 SD
Week 27 to 52 mean
Week 27 to 52 SD
Week 53 to 78 mean
Week 53 to 78 SD
Week 79 to 104 mean
Week 79 to 104
SD
Week 118 to
130 mean
Week 118 to 130 SD
Week 131 to
156 mean
Week 131 to 156 SD
10 8.38 1.32 6.23 0.29 5.82 0.11 5.62 0.29 5.18 0.19 4.83 0.12 20 8.59 1.22 6.58 0.29 6.22 0.11 6.02 0.29 5.61 0.19 5.27 0.12 30 9.13 1.23 7.15 0.27 6.80 0.11 6.59 0.27 6.19 0.18 5.88 0.11 40 16.11 2.95 11.40 0.61 10.44 0.24 10.01 0.59 9.05 0.39 8.31 0.27 50 16.48 2.94 11.81 0.59 10.89 0.23 10.43 0.58 9.50 0.38 8.79 0.26 60 16.69 2.84 12.16 0.58 11.29 0.23 10.83 0.58 9.93 0.38 9.23 0.26 70 23.45 4.61 16.16 0.90 14.73 0.37 13.97 0.89 12.54 0.58 11.44 0.41 80 23.66 4.51 16.50 0.90 15.13 0.36 14.37 0.89 12.97 0.58 11.88 0.40 90 23.81 4.60 16.57 0.88 15.19 0.36 14.39 0.88 12.99 0.56 11.92 0.40
100 23.81 4.60 16.57 0.88 15.19 0.36 14.39 0.88 12.99 0.56 11.92 0.40 110 30.57 6.38 20.56 1.20 18.63 0.50 17.54 1.20 15.60 0.76 14.13 0.55 120 30.57 6.38 20.56 1.20 18.63 0.50 17.54 1.20 15.60 0.76 14.13 0.55 130 30.72 6.47 20.63 1.19 18.69 0.50 17.55 1.19 15.62 0.75 14.17 0.55 140 37.33 8.16 24.56 1.53 22.07 0.63 20.68 1.52 18.21 0.96 16.35 0.71 150 37.48 8.25 24.63 1.51 22.13 0.64 20.70 1.51 18.23 0.95 16.38 0.71 160 37.48 8.25 24.63 1.51 22.13 0.64 20.70 1.51 18.23 0.95 16.38 0.71 170 44.24 10.03 28.62 1.83 25.57 0.77 23.84 1.83 20.84 1.15 18.59 0.86 180 44.24 10.03 28.62 1.83 25.57 0.77 23.84 1.83 20.84 1.15 18.59 0.86 190 44.40 10.13 28.69 1.82 25.63 0.78 23.86 1.82 20.86 1.14 18.63 0.86 200 44.40 10.13 28.69 1.82 25.63 0.78 23.86 1.82 20.86 1.14 18.63 0.86
A gamma distribution was assigned to the weekly cost for the probabilistic sensitivity analysis. SD= standard deviation. Costs are presented in 2017 Canadian dollars.
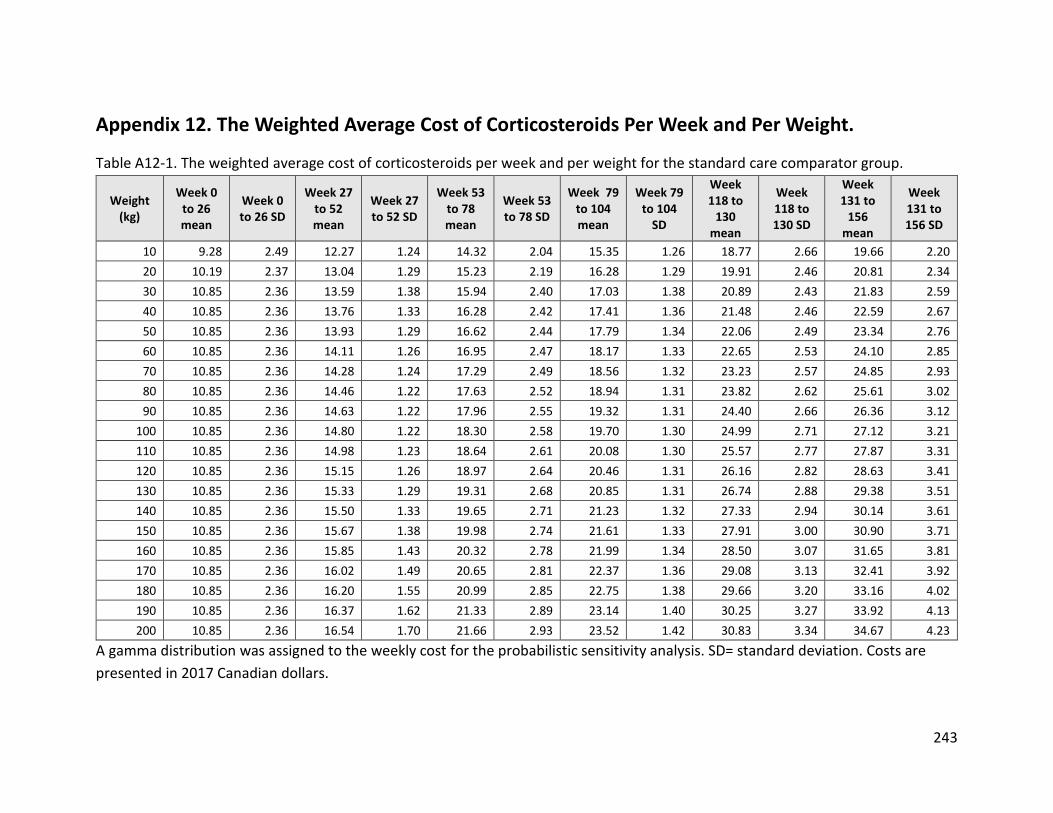
243
Appendix 12. The Weighted Average Cost of Corticosteroids Per Week and Per Weight.
Table A12-1. The weighted average cost of corticosteroids per week and per weight for the standard care comparator group.
Weight (kg)
Week 0 to 26 mean
Week 0 to 26 SD
Week 27 to 52 mean
Week 27 to 52 SD
Week 53 to 78 mean
Week 53 to 78 SD
Week 79 to 104 mean
Week 79 to 104
SD
Week 118 to
130 mean
Week 118 to 130 SD
Week 131 to
156 mean
Week 131 to 156 SD
10 9.28 2.49 12.27 1.24 14.32 2.04 15.35 1.26 18.77 2.66 19.66 2.20 20 10.19 2.37 13.04 1.29 15.23 2.19 16.28 1.29 19.91 2.46 20.81 2.34 30 10.85 2.36 13.59 1.38 15.94 2.40 17.03 1.38 20.89 2.43 21.83 2.59 40 10.85 2.36 13.76 1.33 16.28 2.42 17.41 1.36 21.48 2.46 22.59 2.67 50 10.85 2.36 13.93 1.29 16.62 2.44 17.79 1.34 22.06 2.49 23.34 2.76 60 10.85 2.36 14.11 1.26 16.95 2.47 18.17 1.33 22.65 2.53 24.10 2.85 70 10.85 2.36 14.28 1.24 17.29 2.49 18.56 1.32 23.23 2.57 24.85 2.93 80 10.85 2.36 14.46 1.22 17.63 2.52 18.94 1.31 23.82 2.62 25.61 3.02 90 10.85 2.36 14.63 1.22 17.96 2.55 19.32 1.31 24.40 2.66 26.36 3.12
100 10.85 2.36 14.80 1.22 18.30 2.58 19.70 1.30 24.99 2.71 27.12 3.21 110 10.85 2.36 14.98 1.23 18.64 2.61 20.08 1.30 25.57 2.77 27.87 3.31 120 10.85 2.36 15.15 1.26 18.97 2.64 20.46 1.31 26.16 2.82 28.63 3.41 130 10.85 2.36 15.33 1.29 19.31 2.68 20.85 1.31 26.74 2.88 29.38 3.51 140 10.85 2.36 15.50 1.33 19.65 2.71 21.23 1.32 27.33 2.94 30.14 3.61 150 10.85 2.36 15.67 1.38 19.98 2.74 21.61 1.33 27.91 3.00 30.90 3.71 160 10.85 2.36 15.85 1.43 20.32 2.78 21.99 1.34 28.50 3.07 31.65 3.81 170 10.85 2.36 16.02 1.49 20.65 2.81 22.37 1.36 29.08 3.13 32.41 3.92 180 10.85 2.36 16.20 1.55 20.99 2.85 22.75 1.38 29.66 3.20 33.16 4.02 190 10.85 2.36 16.37 1.62 21.33 2.89 23.14 1.40 30.25 3.27 33.92 4.13 200 10.85 2.36 16.54 1.70 21.66 2.93 23.52 1.42 30.83 3.34 34.67 4.23
A gamma distribution was assigned to the weekly cost for the probabilistic sensitivity analysis. SD= standard deviation. Costs are presented in 2017 Canadian dollars.
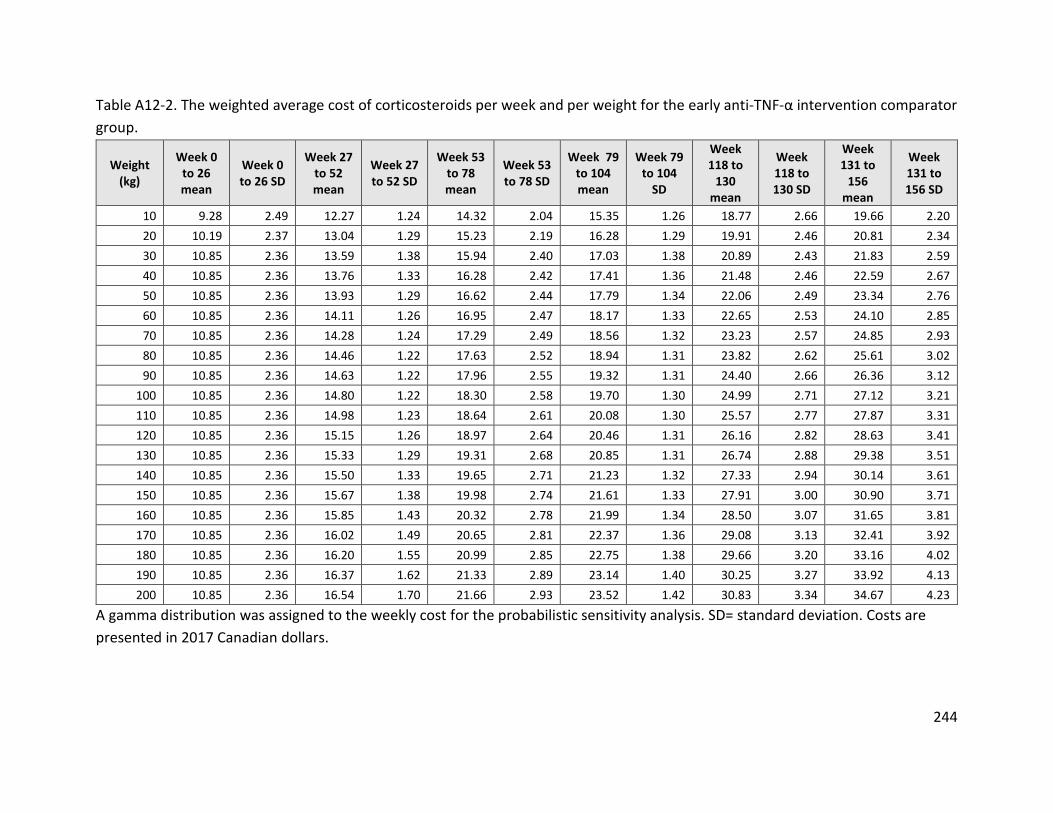
244
Table A12-2. The weighted average cost of corticosteroids per week and per weight for the early anti-TNF-α intervention comparator group.
Weight (kg)
Week 0 to 26 mean
Week 0 to 26 SD
Week 27 to 52 mean
Week 27 to 52 SD
Week 53 to 78 mean
Week 53 to 78 SD
Week 79 to 104 mean
Week 79 to 104
SD
Week 118 to
130 mean
Week 118 to 130 SD
Week 131 to
156 mean
Week 131 to 156 SD
10 9.28 2.49 12.27 1.24 14.32 2.04 15.35 1.26 18.77 2.66 19.66 2.20 20 10.19 2.37 13.04 1.29 15.23 2.19 16.28 1.29 19.91 2.46 20.81 2.34 30 10.85 2.36 13.59 1.38 15.94 2.40 17.03 1.38 20.89 2.43 21.83 2.59 40 10.85 2.36 13.76 1.33 16.28 2.42 17.41 1.36 21.48 2.46 22.59 2.67 50 10.85 2.36 13.93 1.29 16.62 2.44 17.79 1.34 22.06 2.49 23.34 2.76 60 10.85 2.36 14.11 1.26 16.95 2.47 18.17 1.33 22.65 2.53 24.10 2.85 70 10.85 2.36 14.28 1.24 17.29 2.49 18.56 1.32 23.23 2.57 24.85 2.93 80 10.85 2.36 14.46 1.22 17.63 2.52 18.94 1.31 23.82 2.62 25.61 3.02 90 10.85 2.36 14.63 1.22 17.96 2.55 19.32 1.31 24.40 2.66 26.36 3.12
100 10.85 2.36 14.80 1.22 18.30 2.58 19.70 1.30 24.99 2.71 27.12 3.21 110 10.85 2.36 14.98 1.23 18.64 2.61 20.08 1.30 25.57 2.77 27.87 3.31 120 10.85 2.36 15.15 1.26 18.97 2.64 20.46 1.31 26.16 2.82 28.63 3.41 130 10.85 2.36 15.33 1.29 19.31 2.68 20.85 1.31 26.74 2.88 29.38 3.51 140 10.85 2.36 15.50 1.33 19.65 2.71 21.23 1.32 27.33 2.94 30.14 3.61 150 10.85 2.36 15.67 1.38 19.98 2.74 21.61 1.33 27.91 3.00 30.90 3.71 160 10.85 2.36 15.85 1.43 20.32 2.78 21.99 1.34 28.50 3.07 31.65 3.81 170 10.85 2.36 16.02 1.49 20.65 2.81 22.37 1.36 29.08 3.13 32.41 3.92 180 10.85 2.36 16.20 1.55 20.99 2.85 22.75 1.38 29.66 3.20 33.16 4.02 190 10.85 2.36 16.37 1.62 21.33 2.89 23.14 1.40 30.25 3.27 33.92 4.13 200 10.85 2.36 16.54 1.70 21.66 2.93 23.52 1.42 30.83 3.34 34.67 4.23
A gamma distribution was assigned to the weekly cost for the probabilistic sensitivity analysis. SD= standard deviation. Costs are presented in 2017 Canadian dollars.
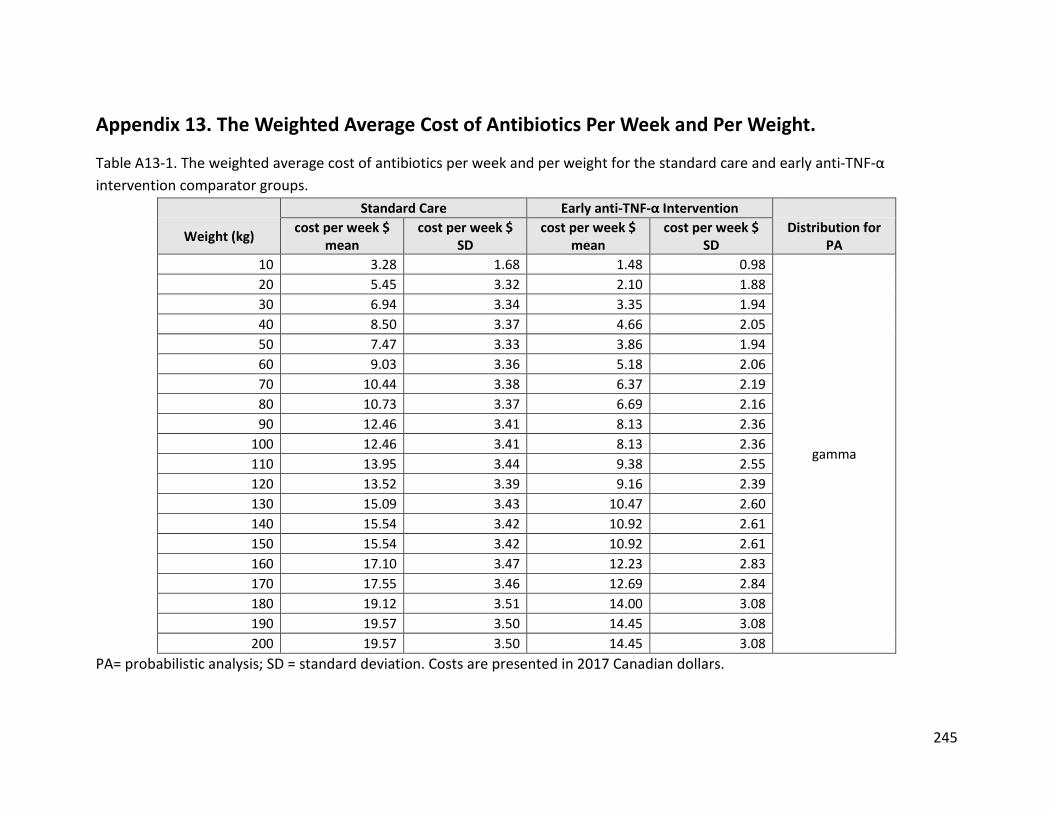
245
Appendix 13. The Weighted Average Cost of Antibiotics Per Week and Per Weight.
Table A13-1. The weighted average cost of antibiotics per week and per weight for the standard care and early anti-TNF-α intervention comparator groups.
Standard Care Early anti-TNF-α Intervention
Weight (kg) cost per week $ mean
cost per week $ SD
cost per week $ mean
cost per week $ SD
Distribution for PA
10 3.28 1.68 1.48 0.98
gamma
20 5.45 3.32 2.10 1.88 30 6.94 3.34 3.35 1.94 40 8.50 3.37 4.66 2.05 50 7.47 3.33 3.86 1.94 60 9.03 3.36 5.18 2.06 70 10.44 3.38 6.37 2.19 80 10.73 3.37 6.69 2.16 90 12.46 3.41 8.13 2.36
100 12.46 3.41 8.13 2.36 110 13.95 3.44 9.38 2.55 120 13.52 3.39 9.16 2.39 130 15.09 3.43 10.47 2.60 140 15.54 3.42 10.92 2.61 150 15.54 3.42 10.92 2.61 160 17.10 3.47 12.23 2.83 170 17.55 3.46 12.69 2.84 180 19.12 3.51 14.00 3.08 190 19.57 3.50 14.45 3.08 200 19.57 3.50 14.45 3.08
PA= probabilistic analysis; SD = standard deviation. Costs are presented in 2017 Canadian dollars.
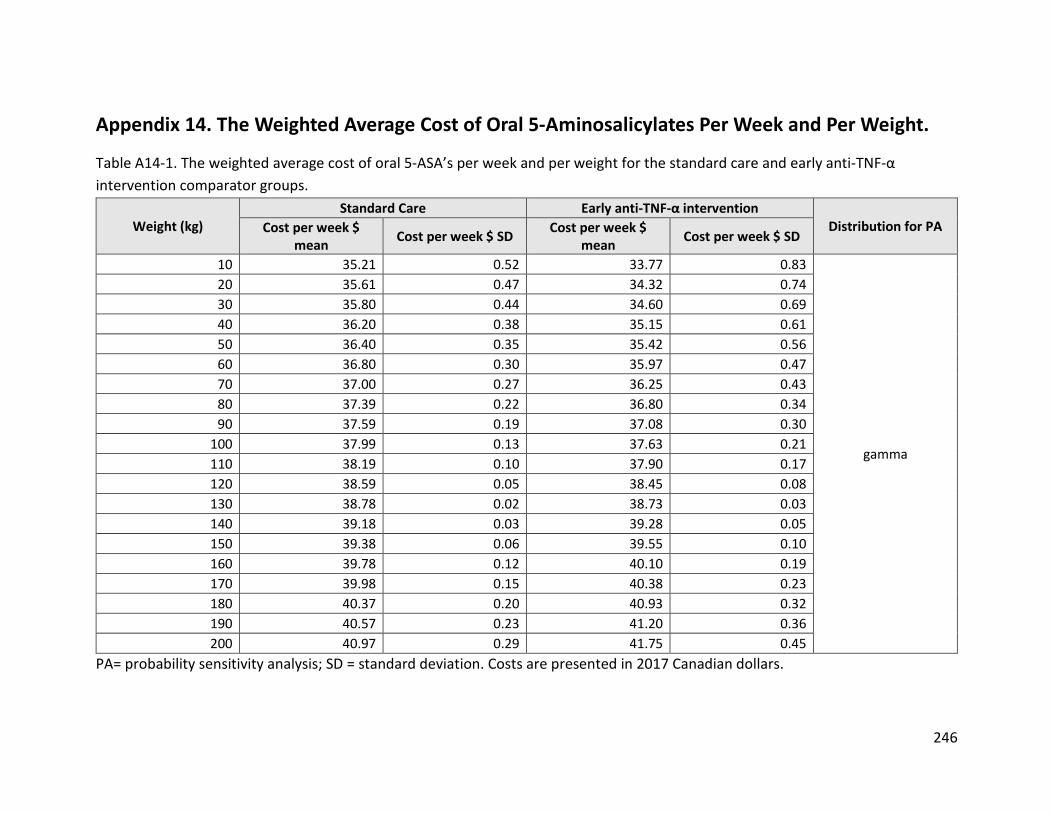
246
Appendix 14. The Weighted Average Cost of Oral 5-Aminosalicylates Per Week and Per Weight.
Table A14-1. The weighted average cost of oral 5-ASA’s per week and per weight for the standard care and early anti-TNF-α intervention comparator groups.
Weight (kg) Standard Care Early anti-TNF-α intervention
Distribution for PA Cost per week $ mean Cost per week $ SD Cost per week $
mean Cost per week $ SD
10 35.21 0.52 33.77 0.83
gamma
20 35.61 0.47 34.32 0.74 30 35.80 0.44 34.60 0.69 40 36.20 0.38 35.15 0.61 50 36.40 0.35 35.42 0.56 60 36.80 0.30 35.97 0.47 70 37.00 0.27 36.25 0.43 80 37.39 0.22 36.80 0.34 90 37.59 0.19 37.08 0.30
100 37.99 0.13 37.63 0.21 110 38.19 0.10 37.90 0.17 120 38.59 0.05 38.45 0.08 130 38.78 0.02 38.73 0.03 140 39.18 0.03 39.28 0.05 150 39.38 0.06 39.55 0.10 160 39.78 0.12 40.10 0.19 170 39.98 0.15 40.38 0.23 180 40.37 0.20 40.93 0.32 190 40.57 0.23 41.20 0.36 200 40.97 0.29 41.75 0.45
PA= probability sensitivity analysis; SD = standard deviation. Costs are presented in 2017 Canadian dollars.
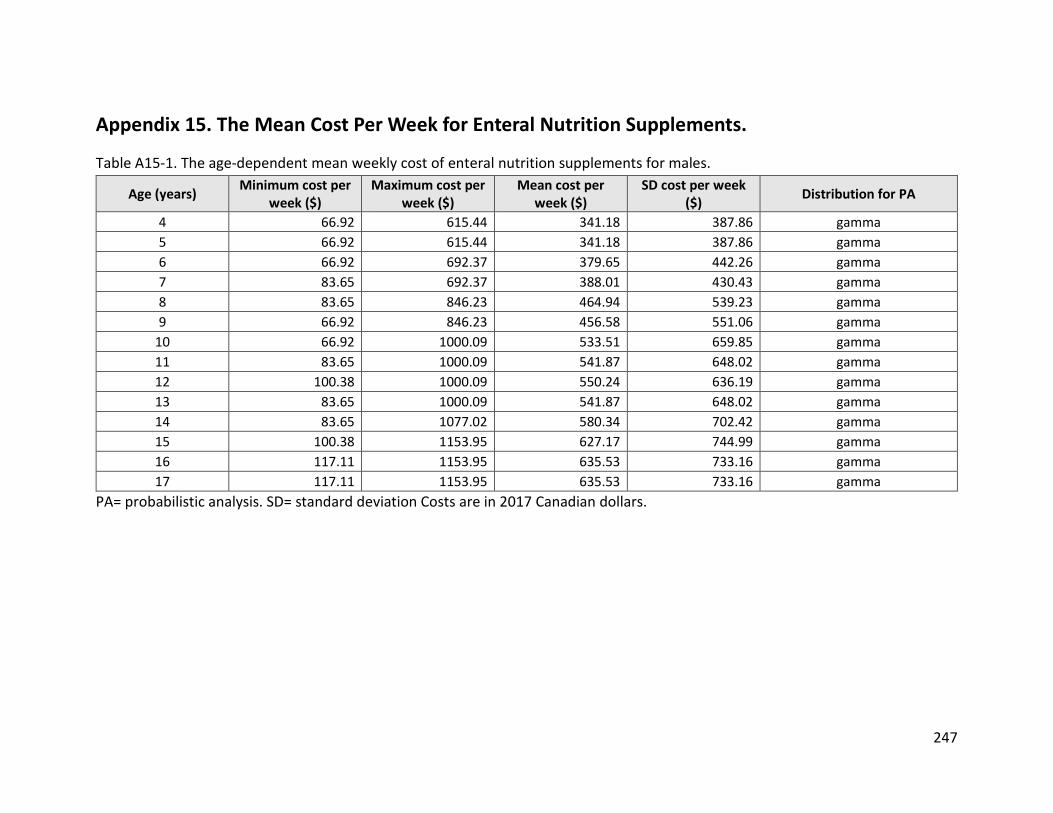
247
Appendix 15. The Mean Cost Per Week for Enteral Nutrition Supplements.
Table A15-1. The age-dependent mean weekly cost of enteral nutrition supplements for males.
Age (years) Minimum cost per week ($)
Maximum cost per week ($)
Mean cost per week ($)
SD cost per week ($) Distribution for PA
4 66.92 615.44 341.18 387.86 gamma 5 66.92 615.44 341.18 387.86 gamma 6 66.92 692.37 379.65 442.26 gamma 7 83.65 692.37 388.01 430.43 gamma 8 83.65 846.23 464.94 539.23 gamma 9 66.92 846.23 456.58 551.06 gamma
10 66.92 1000.09 533.51 659.85 gamma 11 83.65 1000.09 541.87 648.02 gamma 12 100.38 1000.09 550.24 636.19 gamma 13 83.65 1000.09 541.87 648.02 gamma 14 83.65 1077.02 580.34 702.42 gamma 15 100.38 1153.95 627.17 744.99 gamma 16 117.11 1153.95 635.53 733.16 gamma 17 117.11 1153.95 635.53 733.16 gamma
PA= probabilistic analysis. SD= standard deviation Costs are in 2017 Canadian dollars.
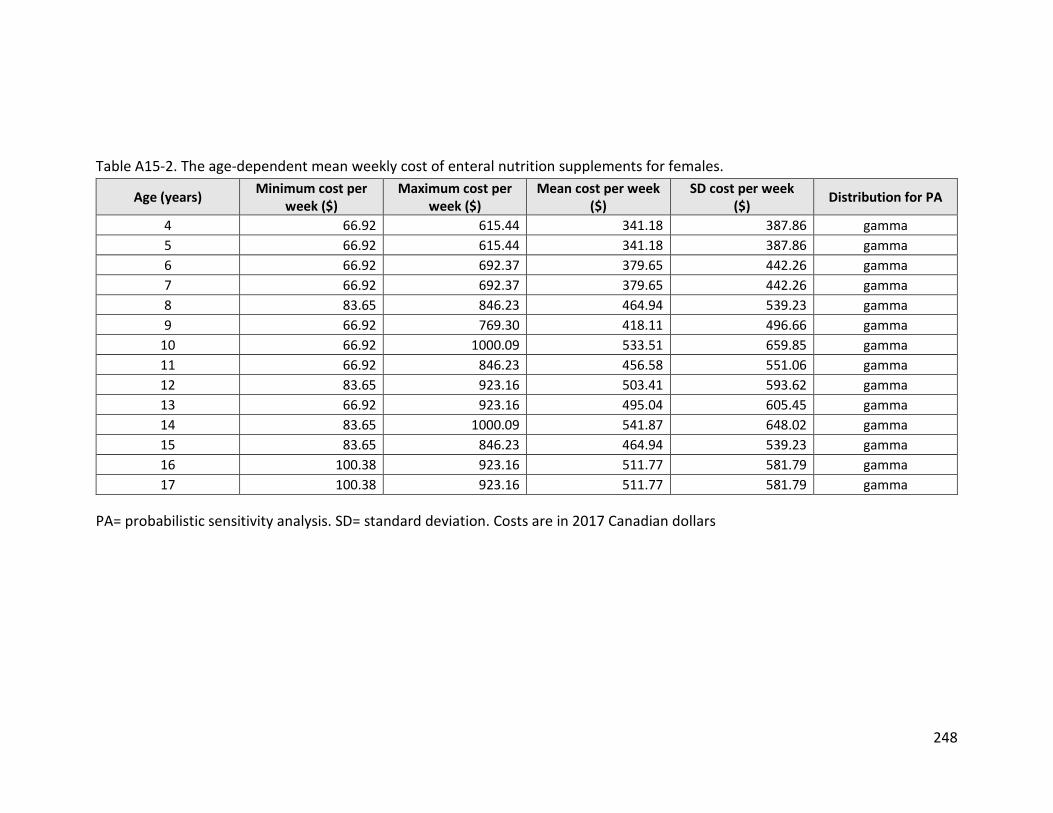
248
Table A15-2. The age-dependent mean weekly cost of enteral nutrition supplements for females.
Age (years) Minimum cost per week ($)
Maximum cost per week ($)
Mean cost per week ($)
SD cost per week ($) Distribution for PA
4 66.92 615.44 341.18 387.86 gamma 5 66.92 615.44 341.18 387.86 gamma 6 66.92 692.37 379.65 442.26 gamma 7 66.92 692.37 379.65 442.26 gamma 8 83.65 846.23 464.94 539.23 gamma 9 66.92 769.30 418.11 496.66 gamma
10 66.92 1000.09 533.51 659.85 gamma 11 66.92 846.23 456.58 551.06 gamma 12 83.65 923.16 503.41 593.62 gamma 13 66.92 923.16 495.04 605.45 gamma 14 83.65 1000.09 541.87 648.02 gamma 15 83.65 846.23 464.94 539.23 gamma 16 100.38 923.16 511.77 581.79 gamma 17 100.38 923.16 511.77 581.79 gamma
PA= probabilistic sensitivity analysis. SD= standard deviation. Costs are in 2017 Canadian dollars
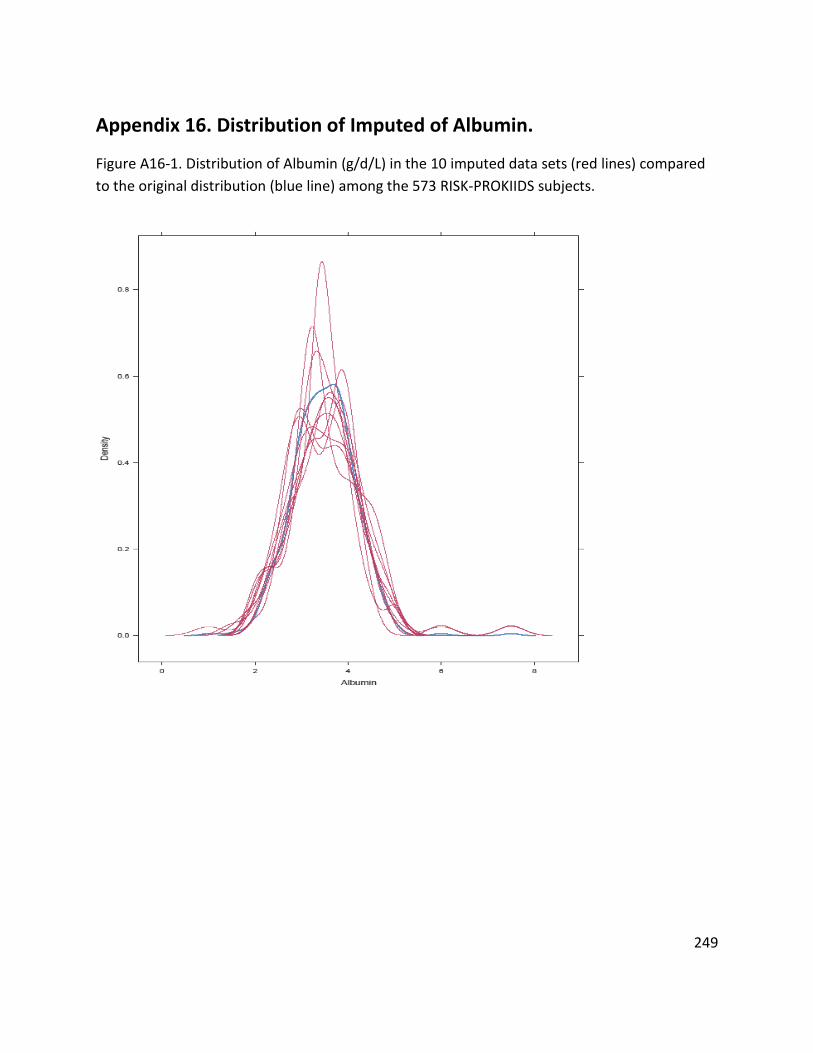
249
Appendix 16. Distribution of Imputed of Albumin.
Figure A16-1. Distribution of Albumin (g/d/L) in the 10 imputed data sets (red lines) compared to the original distribution (blue line) among the 573 RISK-PROKIIDS subjects.
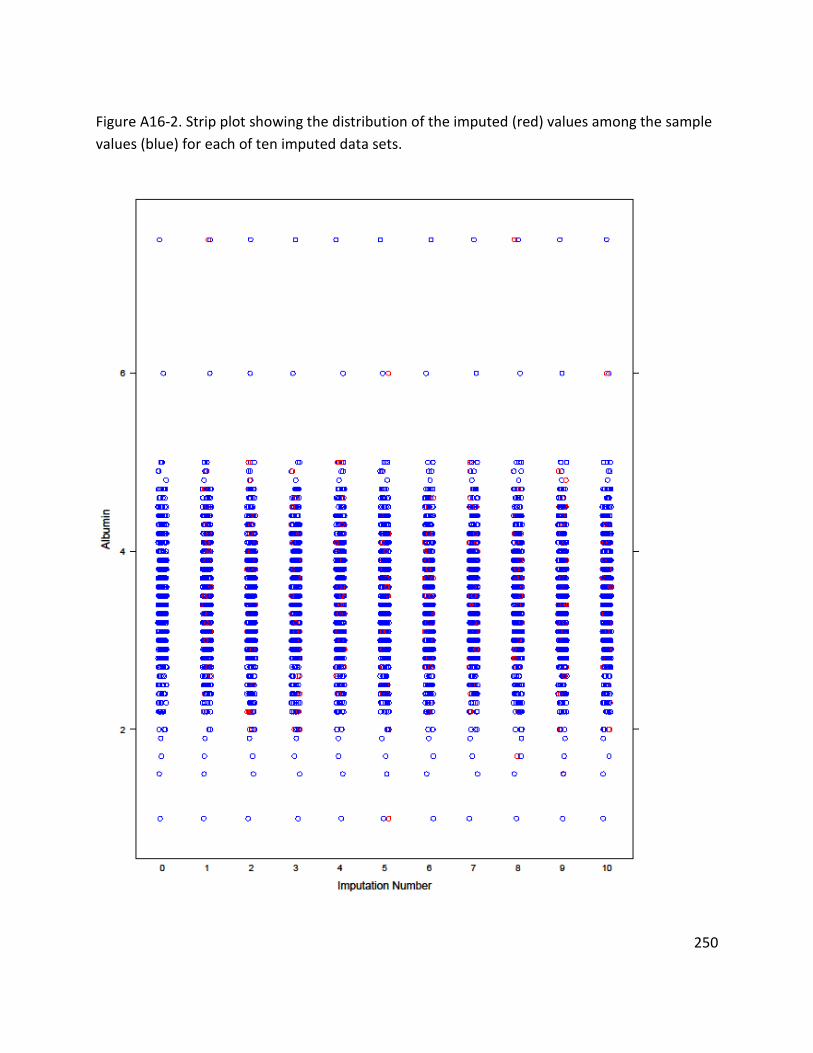
250
Figure A16-2. Strip plot showing the distribution of the imputed (red) values among the sample values (blue) for each of ten imputed data sets.
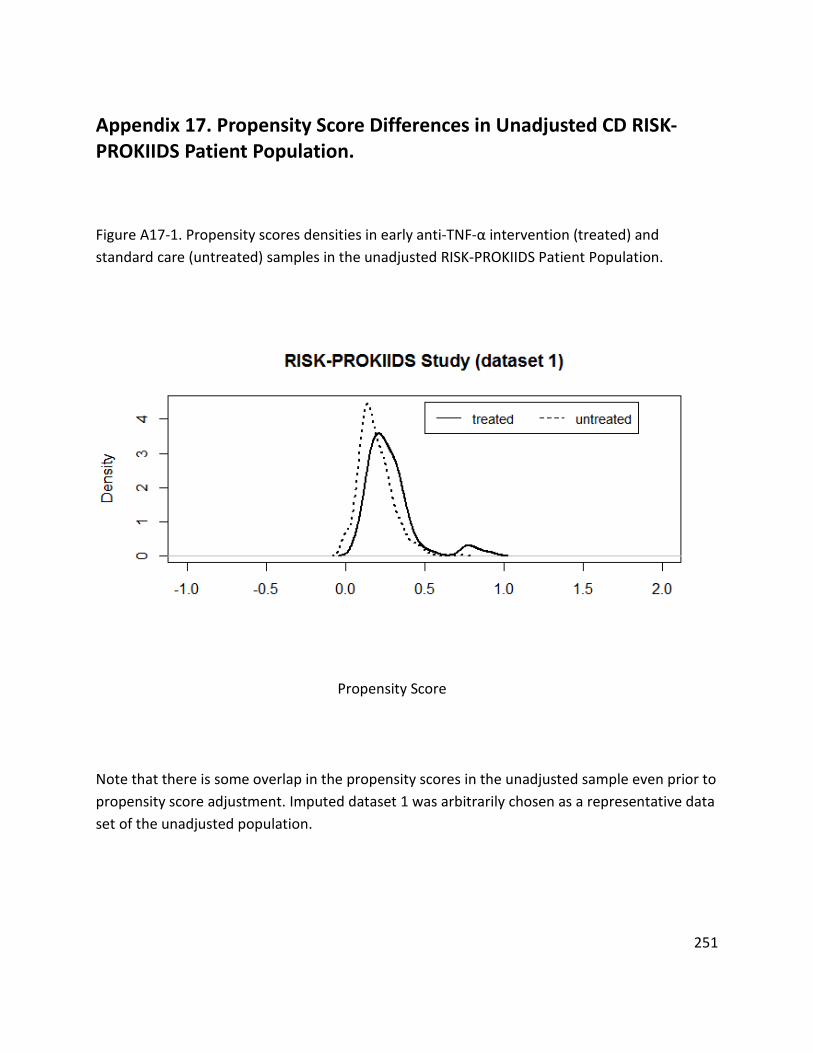
251
Appendix 17. Propensity Score Differences in Unadjusted CD RISK-PROKIIDS Patient Population.
Figure A17-1. Propensity scores densities in early anti-TNF-α intervention (treated) and standard care (untreated) samples in the unadjusted RISK-PROKIIDS Patient Population.
Propensity Score
Note that there is some overlap in the propensity scores in the unadjusted sample even prior to propensity score adjustment. Imputed dataset 1 was arbitrarily chosen as a representative data set of the unadjusted population.
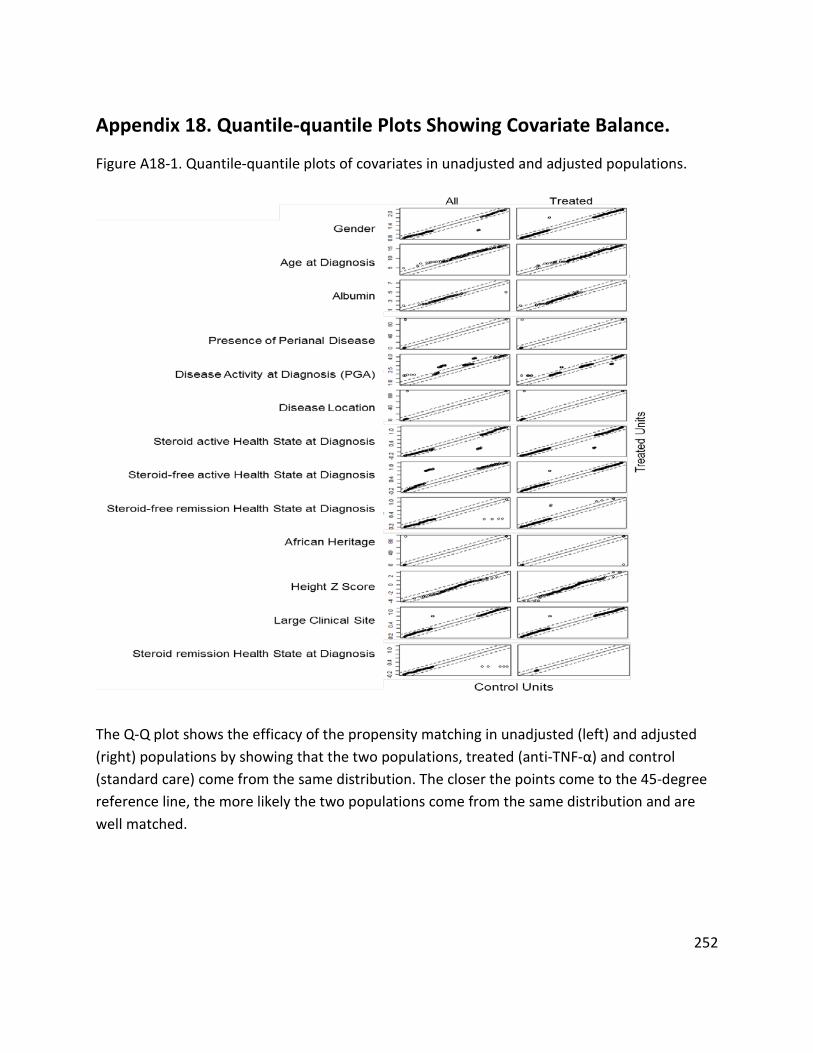
252
Appendix 18. Quantile-quantile Plots Showing Covariate Balance.
Figure A18-1. Quantile-quantile plots of covariates in unadjusted and adjusted populations.
The Q-Q plot shows the efficacy of the propensity matching in unadjusted (left) and adjusted (right) populations by showing that the two populations, treated (anti-TNF-α) and control (standard care) come from the same distribution. The closer the points come to the 45-degree reference line, the more likely the two populations come from the same distribution and are well matched.
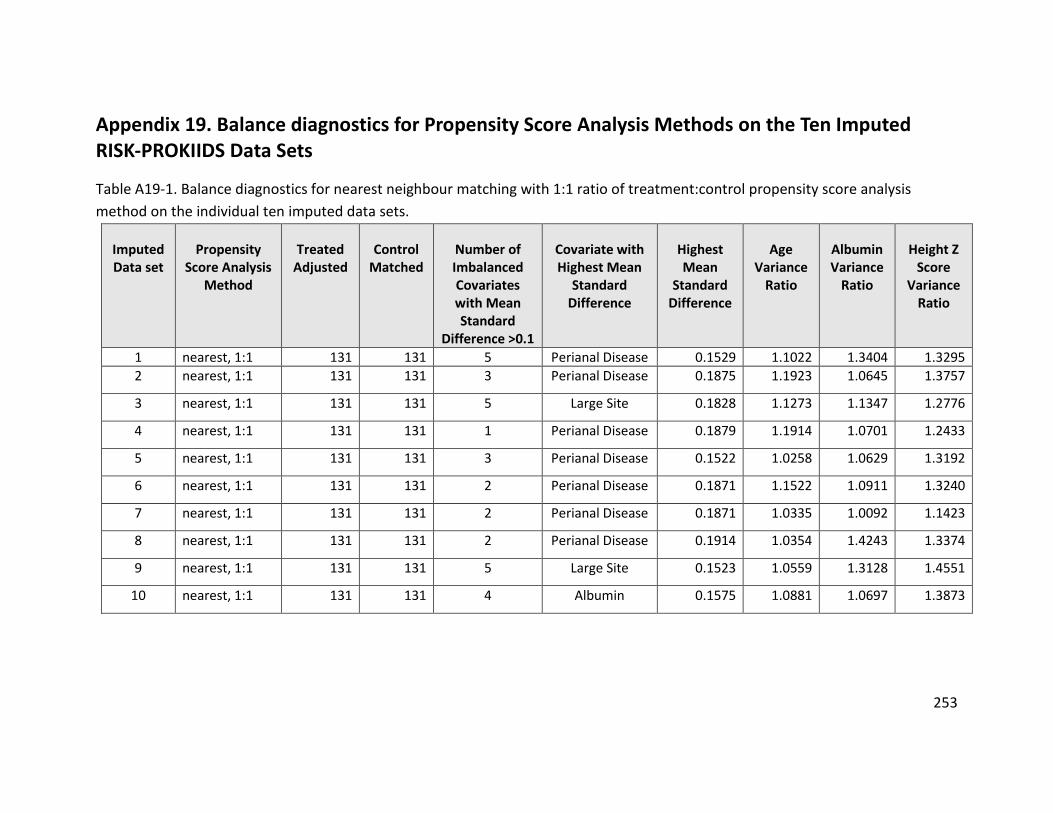
253
Appendix 19. Balance diagnostics for Propensity Score Analysis Methods on the Ten Imputed RISK-PROKIIDS Data Sets
Table A19-1. Balance diagnostics for nearest neighbour matching with 1:1 ratio of treatment:control propensity score analysis method on the individual ten imputed data sets.
Imputed Data set
Propensity Score Analysis
Method
Treated Adjusted
Control Matched
Number of Imbalanced Covariates with Mean Standard
Difference >0.1
Covariate with Highest Mean
Standard Difference
Highest Mean
Standard Difference
Age Variance
Ratio
Albumin Variance
Ratio
Height Z Score
Variance Ratio
1 nearest, 1:1 131 131 5 Perianal Disease 0.1529 1.1022 1.3404 1.3295 2 nearest, 1:1 131 131 3 Perianal Disease 0.1875 1.1923 1.0645 1.3757
3 nearest, 1:1 131 131 5 Large Site 0.1828 1.1273 1.1347 1.2776
4 nearest, 1:1 131 131 1 Perianal Disease 0.1879 1.1914 1.0701 1.2433
5 nearest, 1:1 131 131 3 Perianal Disease 0.1522 1.0258 1.0629 1.3192
6 nearest, 1:1 131 131 2 Perianal Disease 0.1871 1.1522 1.0911 1.3240
7 nearest, 1:1 131 131 2 Perianal Disease 0.1871 1.0335 1.0092 1.1423
8 nearest, 1:1 131 131 2 Perianal Disease 0.1914 1.0354 1.4243 1.3374
9 nearest, 1:1 131 131 5 Large Site 0.1523 1.0559 1.3128 1.4551
10 nearest, 1:1 131 131 4 Albumin 0.1575 1.0881 1.0697 1.3873
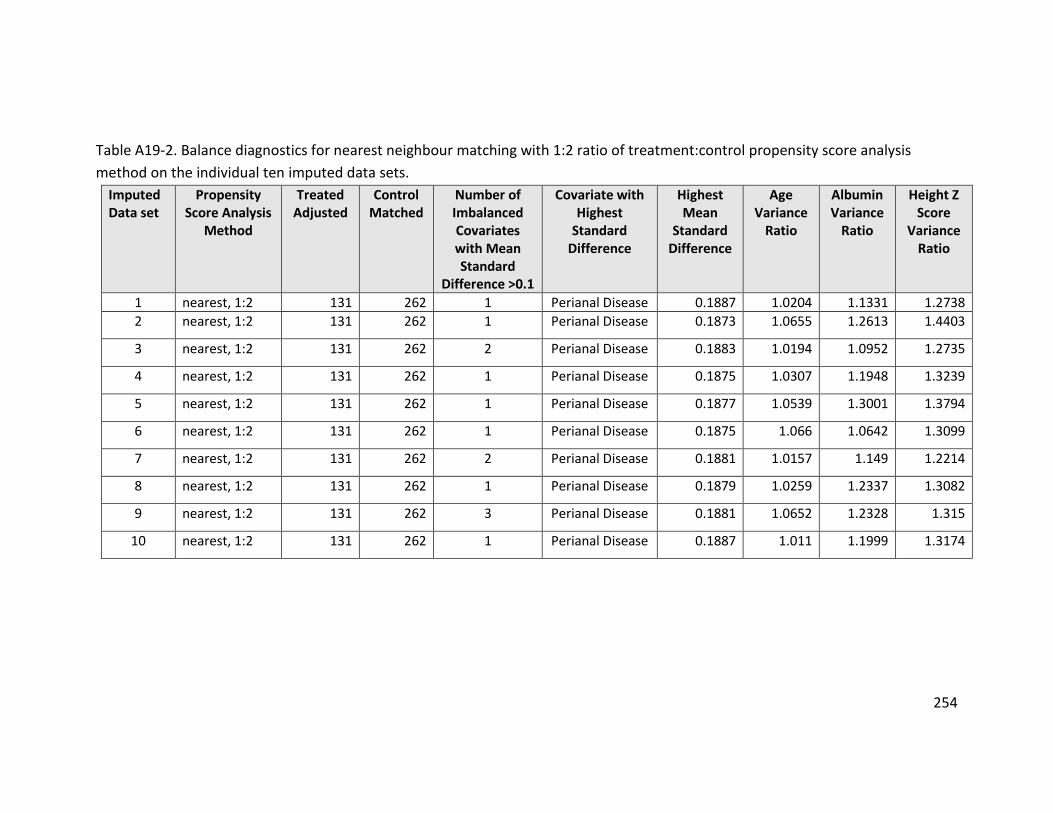
254
Table A19-2. Balance diagnostics for nearest neighbour matching with 1:2 ratio of treatment:control propensity score analysis method on the individual ten imputed data sets.
Imputed Data set
Propensity Score Analysis
Method
Treated Adjusted
Control Matched
Number of Imbalanced Covariates with Mean Standard
Difference >0.1
Covariate with Highest
Standard Difference
Highest Mean
Standard Difference
Age Variance
Ratio
Albumin Variance
Ratio
Height Z Score
Variance Ratio
1 nearest, 1:2 131 262 1 Perianal Disease 0.1887 1.0204 1.1331 1.2738 2 nearest, 1:2 131 262 1 Perianal Disease 0.1873 1.0655 1.2613 1.4403
3 nearest, 1:2 131 262 2 Perianal Disease 0.1883 1.0194 1.0952 1.2735
4 nearest, 1:2 131 262 1 Perianal Disease 0.1875 1.0307 1.1948 1.3239
5 nearest, 1:2 131 262 1 Perianal Disease 0.1877 1.0539 1.3001 1.3794
6 nearest, 1:2 131 262 1 Perianal Disease 0.1875 1.066 1.0642 1.3099
7 nearest, 1:2 131 262 2 Perianal Disease 0.1881 1.0157 1.149 1.2214
8 nearest, 1:2 131 262 1 Perianal Disease 0.1879 1.0259 1.2337 1.3082
9 nearest, 1:2 131 262 3 Perianal Disease 0.1881 1.0652 1.2328 1.315
10 nearest, 1:2 131 262 1 Perianal Disease 0.1887 1.011 1.1999 1.3174
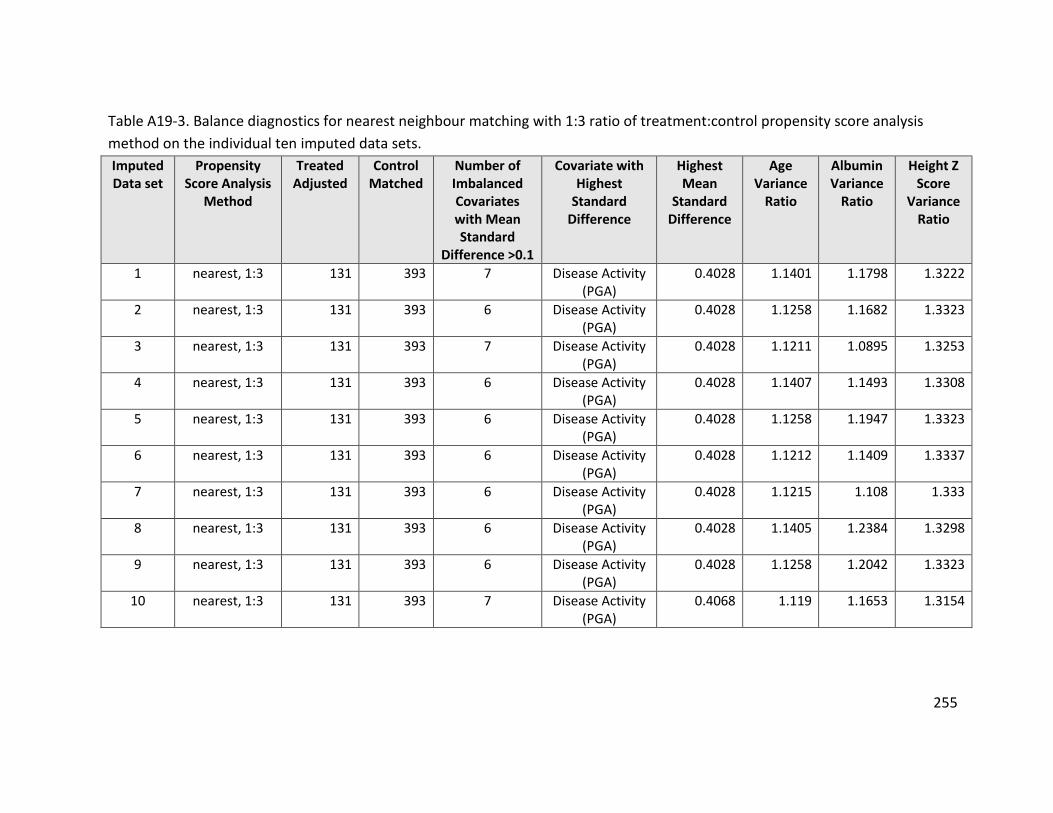
255
Table A19-3. Balance diagnostics for nearest neighbour matching with 1:3 ratio of treatment:control propensity score analysis method on the individual ten imputed data sets. Imputed Data set
Propensity Score Analysis
Method
Treated Adjusted
Control Matched
Number of Imbalanced Covariates with Mean Standard
Difference >0.1
Covariate with Highest
Standard Difference
Highest Mean
Standard Difference
Age Variance
Ratio
Albumin Variance
Ratio
Height Z Score
Variance Ratio
1 nearest, 1:3 131 393 7 Disease Activity (PGA)
0.4028 1.1401 1.1798 1.3222
2 nearest, 1:3 131 393 6 Disease Activity (PGA)
0.4028 1.1258 1.1682 1.3323
3 nearest, 1:3 131 393 7 Disease Activity (PGA)
0.4028 1.1211 1.0895 1.3253
4 nearest, 1:3 131 393 6 Disease Activity (PGA)
0.4028 1.1407 1.1493 1.3308
5 nearest, 1:3 131 393 6 Disease Activity (PGA)
0.4028 1.1258 1.1947 1.3323
6 nearest, 1:3 131 393 6 Disease Activity (PGA)
0.4028 1.1212 1.1409 1.3337
7 nearest, 1:3 131 393 6 Disease Activity (PGA)
0.4028 1.1215 1.108 1.333
8 nearest, 1:3 131 393 6 Disease Activity (PGA)
0.4028 1.1405 1.2384 1.3298
9 nearest, 1:3 131 393 6 Disease Activity (PGA)
0.4028 1.1258 1.2042 1.3323
10 nearest, 1:3 131 393 7 Disease Activity (PGA)
0.4068 1.119 1.1653 1.3154
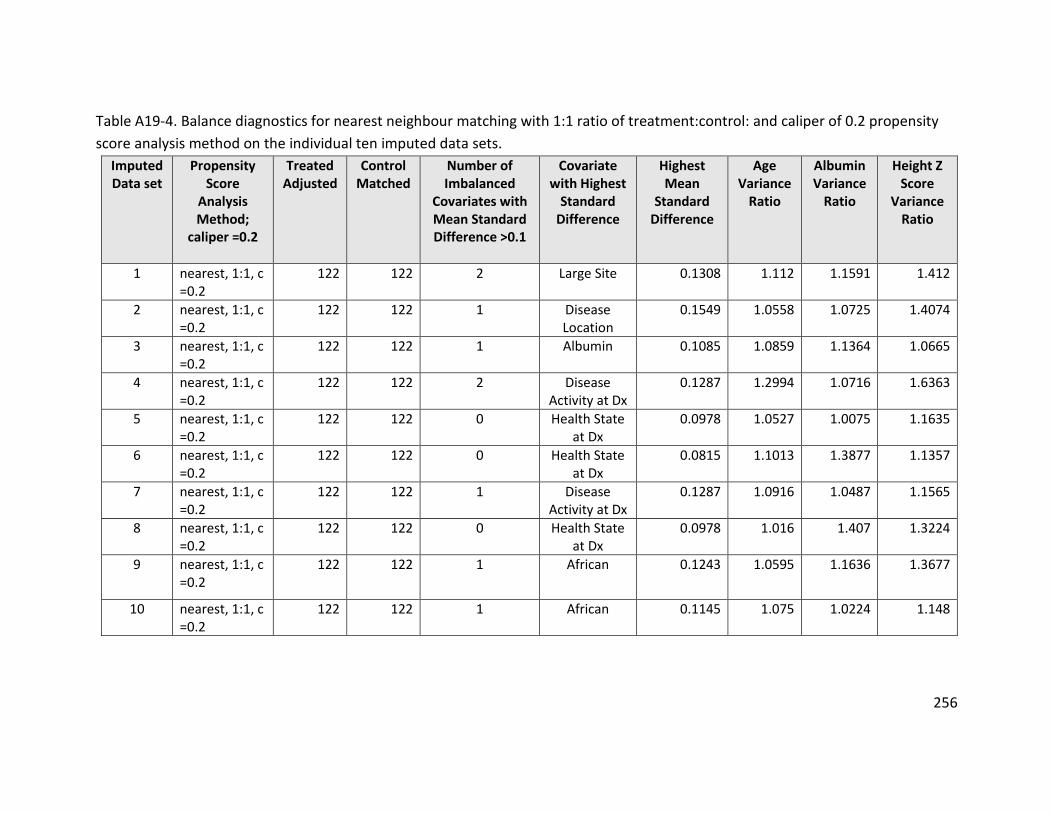
256
Table A19-4. Balance diagnostics for nearest neighbour matching with 1:1 ratio of treatment:control: and caliper of 0.2 propensity score analysis method on the individual ten imputed data sets.
Imputed Data set
Propensity Score
Analysis Method;
caliper =0.2
Treated Adjusted
Control Matched
Number of Imbalanced
Covariates with Mean Standard Difference >0.1
Covariate with Highest
Standard Difference
Highest Mean
Standard Difference
Age Variance
Ratio
Albumin Variance
Ratio
Height Z Score
Variance Ratio
1 nearest, 1:1, c =0.2
122 122 2 Large Site 0.1308 1.112 1.1591 1.412
2 nearest, 1:1, c =0.2
122 122 1 Disease Location
0.1549 1.0558 1.0725 1.4074
3 nearest, 1:1, c =0.2
122 122 1 Albumin 0.1085 1.0859 1.1364 1.0665
4 nearest, 1:1, c =0.2
122 122 2 Disease Activity at Dx
0.1287 1.2994 1.0716 1.6363
5 nearest, 1:1, c =0.2
122 122 0 Health State at Dx
0.0978 1.0527 1.0075 1.1635
6 nearest, 1:1, c =0.2
122 122 0 Health State at Dx
0.0815 1.1013 1.3877 1.1357
7 nearest, 1:1, c =0.2
122 122 1 Disease Activity at Dx
0.1287 1.0916 1.0487 1.1565
8 nearest, 1:1, c =0.2
122 122 0 Health State at Dx
0.0978 1.016 1.407 1.3224
9 nearest, 1:1, c =0.2
122 122 1 African 0.1243 1.0595 1.1636 1.3677
10 nearest, 1:1, c =0.2
122 122 1 African 0.1145 1.075 1.0224 1.148
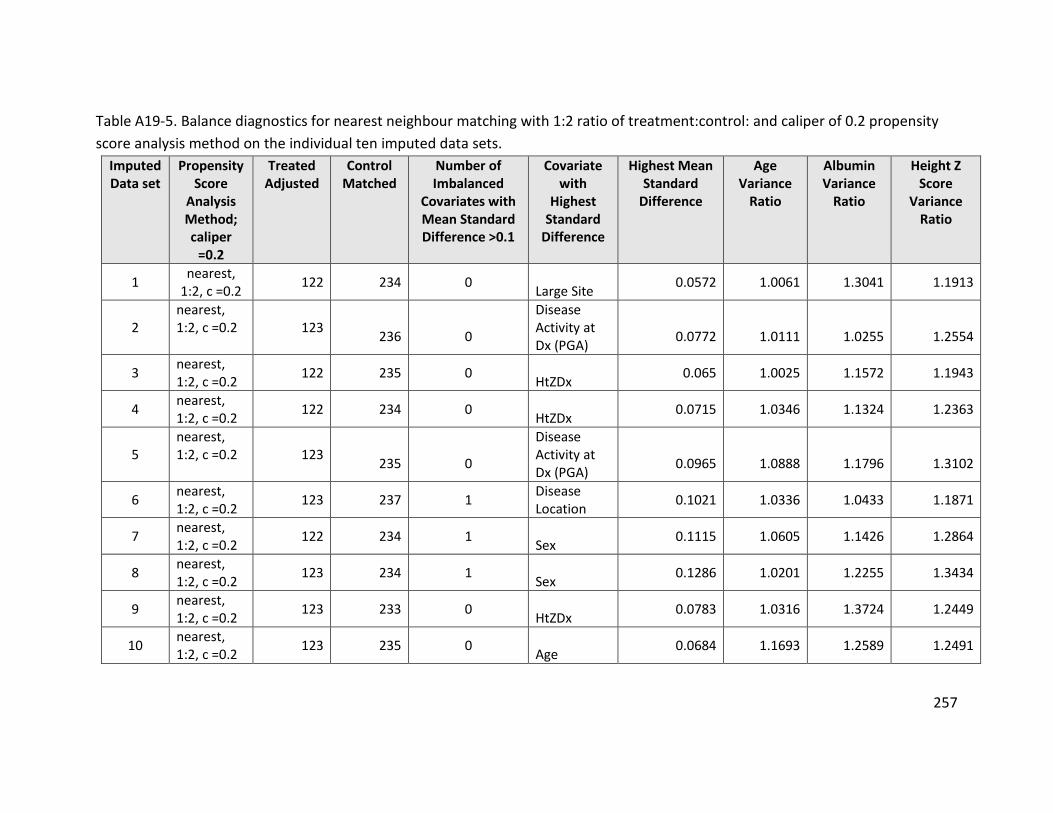
257
Table A19-5. Balance diagnostics for nearest neighbour matching with 1:2 ratio of treatment:control: and caliper of 0.2 propensity score analysis method on the individual ten imputed data sets.
Imputed Data set
Propensity Score
Analysis Method; caliper
=0.2
Treated Adjusted
Control Matched
Number of Imbalanced
Covariates with Mean Standard Difference >0.1
Covariate with
Highest Standard
Difference
Highest Mean Standard
Difference
Age Variance
Ratio
Albumin Variance
Ratio
Height Z Score
Variance Ratio
1 nearest, 1:2, c =0.2 122 234 0 Large Site 0.0572 1.0061 1.3041 1.1913
2 nearest, 1:2, c =0.2 123 236 0
Disease Activity at Dx (PGA) 0.0772 1.0111 1.0255 1.2554
3 nearest, 1:2, c =0.2 122 235 0 HtZDx 0.065 1.0025 1.1572 1.1943
4 nearest, 1:2, c =0.2 122 234 0 HtZDx 0.0715 1.0346 1.1324 1.2363
5 nearest, 1:2, c =0.2 123 235 0
Disease Activity at Dx (PGA) 0.0965 1.0888 1.1796 1.3102
6 nearest, 1:2, c =0.2 123 237 1 Disease
Location 0.1021 1.0336 1.0433 1.1871
7 nearest, 1:2, c =0.2 122 234 1 Sex 0.1115 1.0605 1.1426 1.2864
8 nearest, 1:2, c =0.2 123 234 1 Sex 0.1286 1.0201 1.2255 1.3434
9 nearest, 1:2, c =0.2 123 233 0 HtZDx 0.0783 1.0316 1.3724 1.2449
10 nearest, 1:2, c =0.2 123 235 0 Age 0.0684 1.1693 1.2589 1.2491
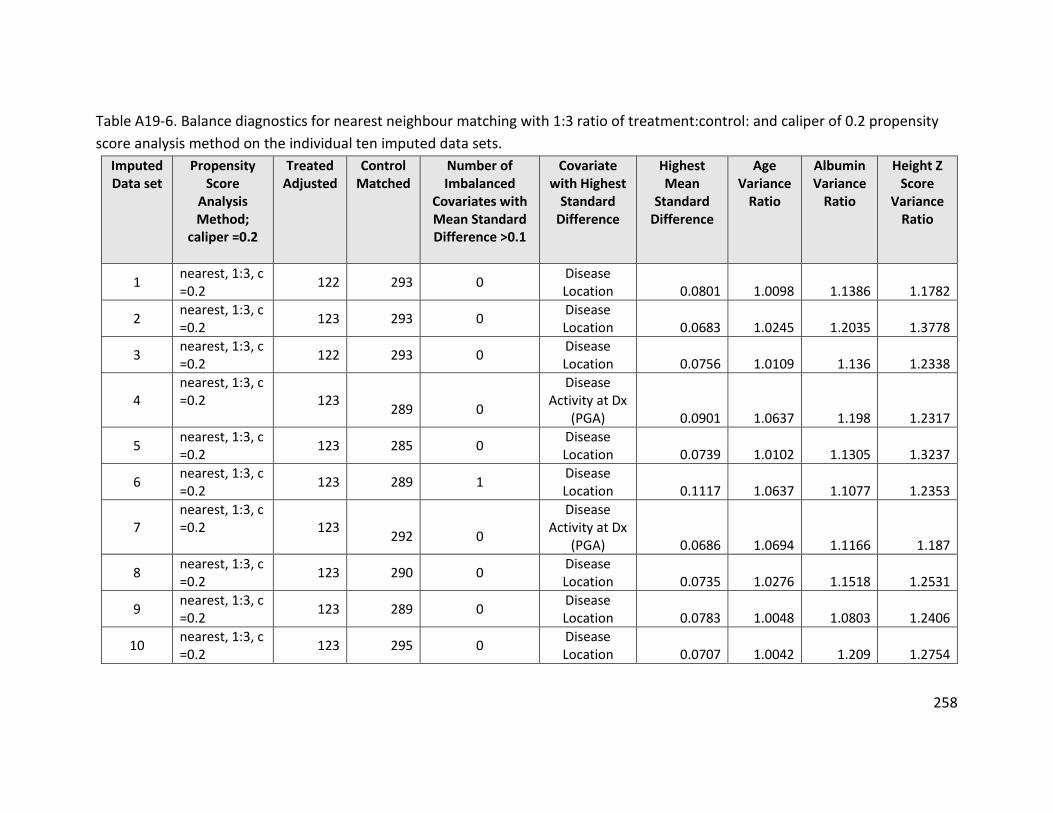
258
Table A19-6. Balance diagnostics for nearest neighbour matching with 1:3 ratio of treatment:control: and caliper of 0.2 propensity score analysis method on the individual ten imputed data sets.
Imputed Data set
Propensity Score
Analysis Method;
caliper =0.2
Treated Adjusted
Control Matched
Number of Imbalanced
Covariates with Mean Standard Difference >0.1
Covariate with Highest
Standard Difference
Highest Mean
Standard Difference
Age Variance
Ratio
Albumin Variance
Ratio
Height Z Score
Variance Ratio
1 nearest, 1:3, c =0.2 122 293 0 Disease
Location 0.0801 1.0098 1.1386 1.1782
2 nearest, 1:3, c =0.2 123 293 0 Disease
Location 0.0683 1.0245 1.2035 1.3778
3 nearest, 1:3, c =0.2 122 293 0 Disease
Location 0.0756 1.0109 1.136 1.2338
4 nearest, 1:3, c =0.2 123 289 0
Disease Activity at Dx
(PGA) 0.0901 1.0637 1.198 1.2317
5 nearest, 1:3, c =0.2 123 285 0 Disease
Location 0.0739 1.0102 1.1305 1.3237
6 nearest, 1:3, c =0.2 123 289 1 Disease
Location 0.1117 1.0637 1.1077 1.2353
7 nearest, 1:3, c =0.2 123 292 0
Disease Activity at Dx
(PGA) 0.0686 1.0694 1.1166 1.187
8 nearest, 1:3, c =0.2 123 290 0 Disease
Location 0.0735 1.0276 1.1518 1.2531
9 nearest, 1:3, c =0.2 123 289 0 Disease
Location 0.0783 1.0048 1.0803 1.2406
10 nearest, 1:3, c =0.2 123 295 0 Disease
Location 0.0707 1.0042 1.209 1.2754
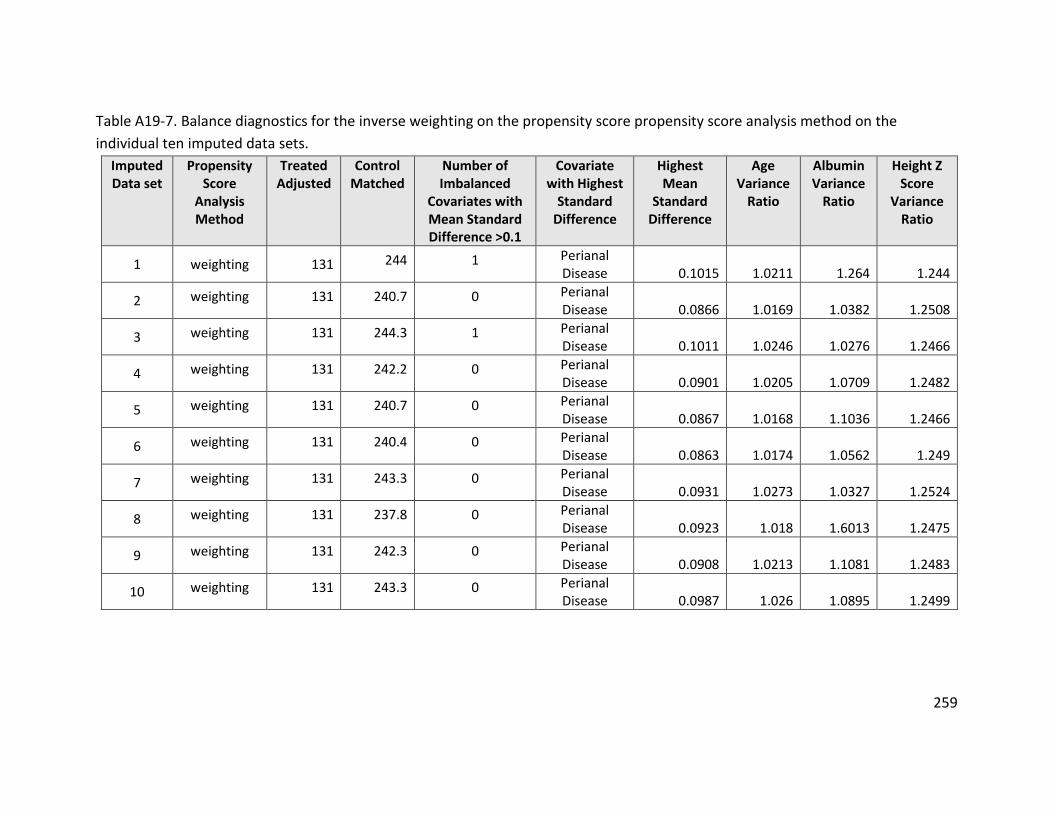
259
Table A19-7. Balance diagnostics for the inverse weighting on the propensity score propensity score analysis method on the individual ten imputed data sets.
Imputed Data set
Propensity Score
Analysis Method
Treated Adjusted
Control Matched
Number of Imbalanced
Covariates with Mean Standard Difference >0.1
Covariate with Highest
Standard Difference
Highest Mean
Standard Difference
Age Variance
Ratio
Albumin Variance
Ratio
Height Z Score
Variance Ratio
1 weighting 131 244 1 Perianal Disease 0.1015 1.0211 1.264 1.244
2 weighting 131 240.7 0 Perianal Disease 0.0866 1.0169 1.0382 1.2508
3 weighting 131 244.3 1 Perianal Disease 0.1011 1.0246 1.0276 1.2466
4 weighting 131 242.2 0 Perianal Disease 0.0901 1.0205 1.0709 1.2482
5 weighting 131 240.7 0 Perianal Disease 0.0867 1.0168 1.1036 1.2466
6 weighting 131 240.4 0 Perianal Disease 0.0863 1.0174 1.0562 1.249
7 weighting 131 243.3 0 Perianal Disease 0.0931 1.0273 1.0327 1.2524
8 weighting 131 237.8 0 Perianal Disease 0.0923 1.018 1.6013 1.2475
9 weighting 131 242.3 0 Perianal Disease 0.0908 1.0213 1.1081 1.2483
10 weighting 131 243.3 0 Perianal Disease 0.0987 1.026 1.0895 1.2499
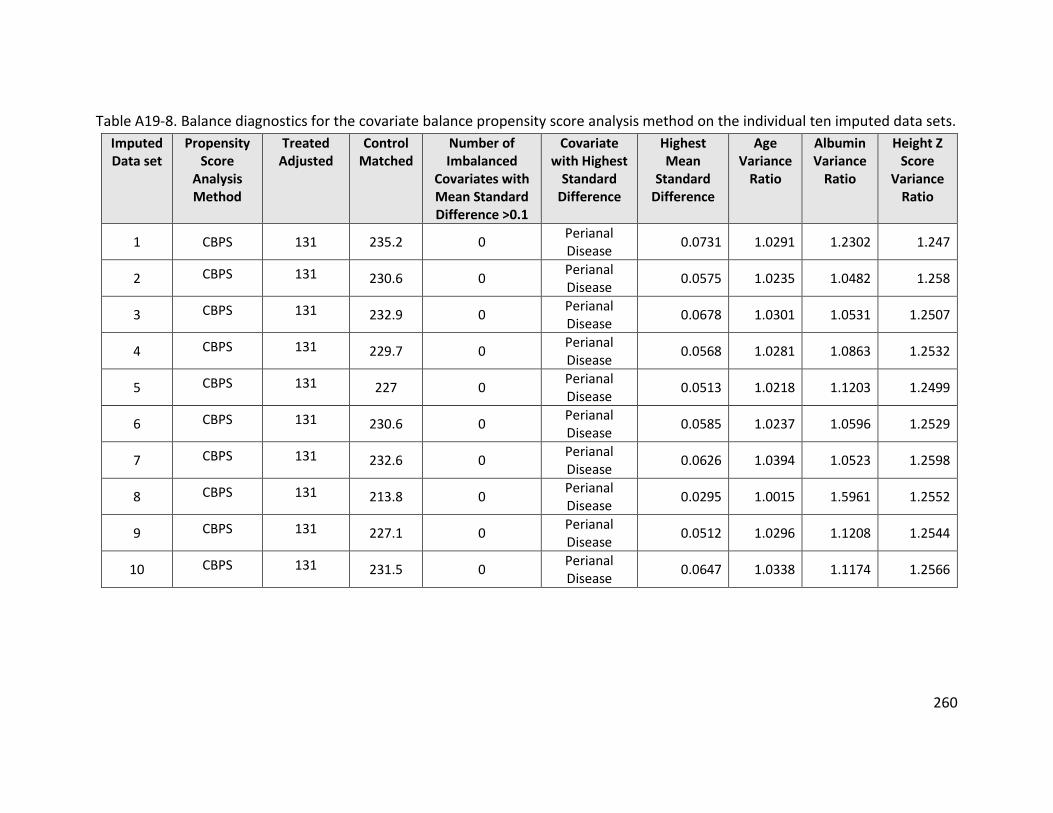
260
Table A19-8. Balance diagnostics for the covariate balance propensity score analysis method on the individual ten imputed data sets. Imputed Data set
Propensity Score
Analysis Method
Treated Adjusted
Control Matched
Number of Imbalanced
Covariates with Mean Standard Difference >0.1
Covariate with Highest
Standard Difference
Highest Mean
Standard Difference
Age Variance
Ratio
Albumin Variance
Ratio
Height Z Score
Variance Ratio
1 CBPS 131 235.2 0 Perianal Disease 0.0731 1.0291 1.2302 1.247
2 CBPS 131 230.6 0 Perianal Disease 0.0575 1.0235 1.0482 1.258
3 CBPS 131 232.9 0 Perianal Disease 0.0678 1.0301 1.0531 1.2507
4 CBPS 131 229.7 0 Perianal Disease 0.0568 1.0281 1.0863 1.2532
5 CBPS 131 227 0 Perianal Disease 0.0513 1.0218 1.1203 1.2499
6 CBPS 131 230.6 0 Perianal Disease 0.0585 1.0237 1.0596 1.2529
7 CBPS 131 232.6 0 Perianal Disease 0.0626 1.0394 1.0523 1.2598
8 CBPS 131 213.8 0 Perianal Disease 0.0295 1.0015 1.5961 1.2552
9 CBPS 131 227.1 0 Perianal Disease 0.0512 1.0296 1.1208 1.2544
10 CBPS 131 231.5 0 Perianal Disease 0.0647 1.0338 1.1174 1.2566
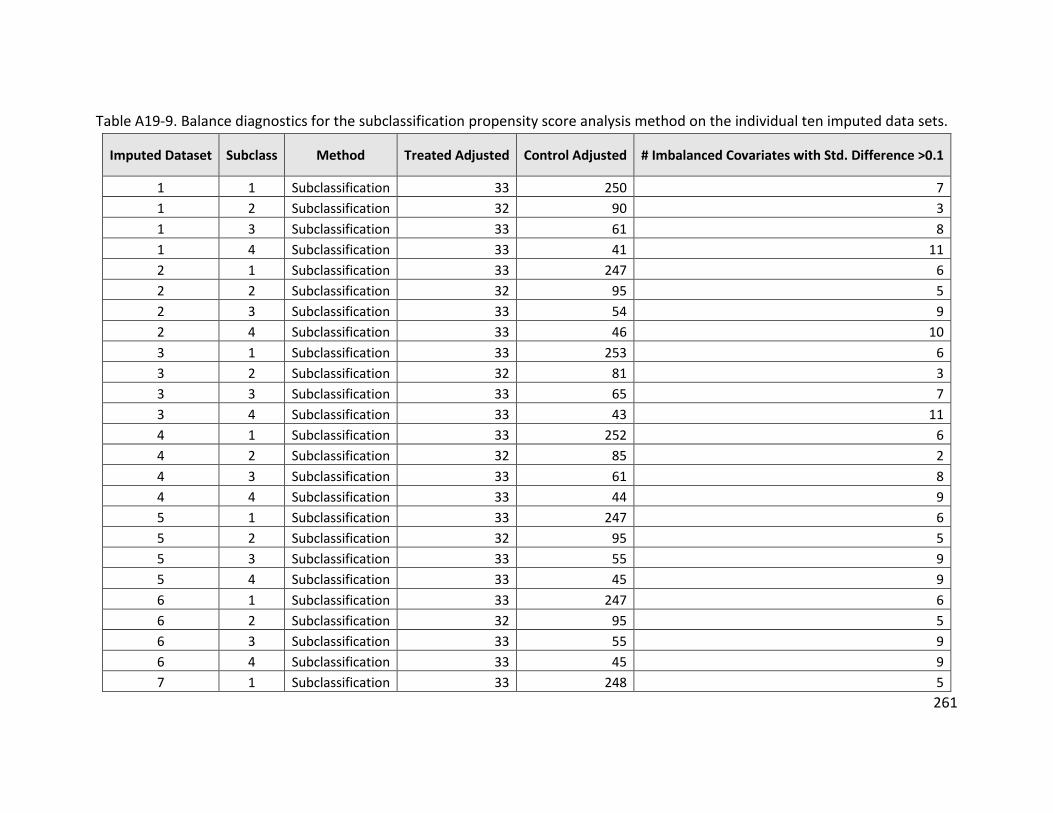
261
Table A19-9. Balance diagnostics for the subclassification propensity score analysis method on the individual ten imputed data sets.
Imputed Dataset Subclass Method Treated Adjusted Control Adjusted # Imbalanced Covariates with Std. Difference >0.1
1 1 Subclassification 33 250 7 1 2 Subclassification 32 90 3 1 3 Subclassification 33 61 8 1 4 Subclassification 33 41 11 2 1 Subclassification 33 247 6 2 2 Subclassification 32 95 5 2 3 Subclassification 33 54 9 2 4 Subclassification 33 46 10 3 1 Subclassification 33 253 6 3 2 Subclassification 32 81 3 3 3 Subclassification 33 65 7 3 4 Subclassification 33 43 11 4 1 Subclassification 33 252 6 4 2 Subclassification 32 85 2 4 3 Subclassification 33 61 8 4 4 Subclassification 33 44 9 5 1 Subclassification 33 247 6 5 2 Subclassification 32 95 5 5 3 Subclassification 33 55 9 5 4 Subclassification 33 45 9 6 1 Subclassification 33 247 6 6 2 Subclassification 32 95 5 6 3 Subclassification 33 55 9 6 4 Subclassification 33 45 9 7 1 Subclassification 33 248 5
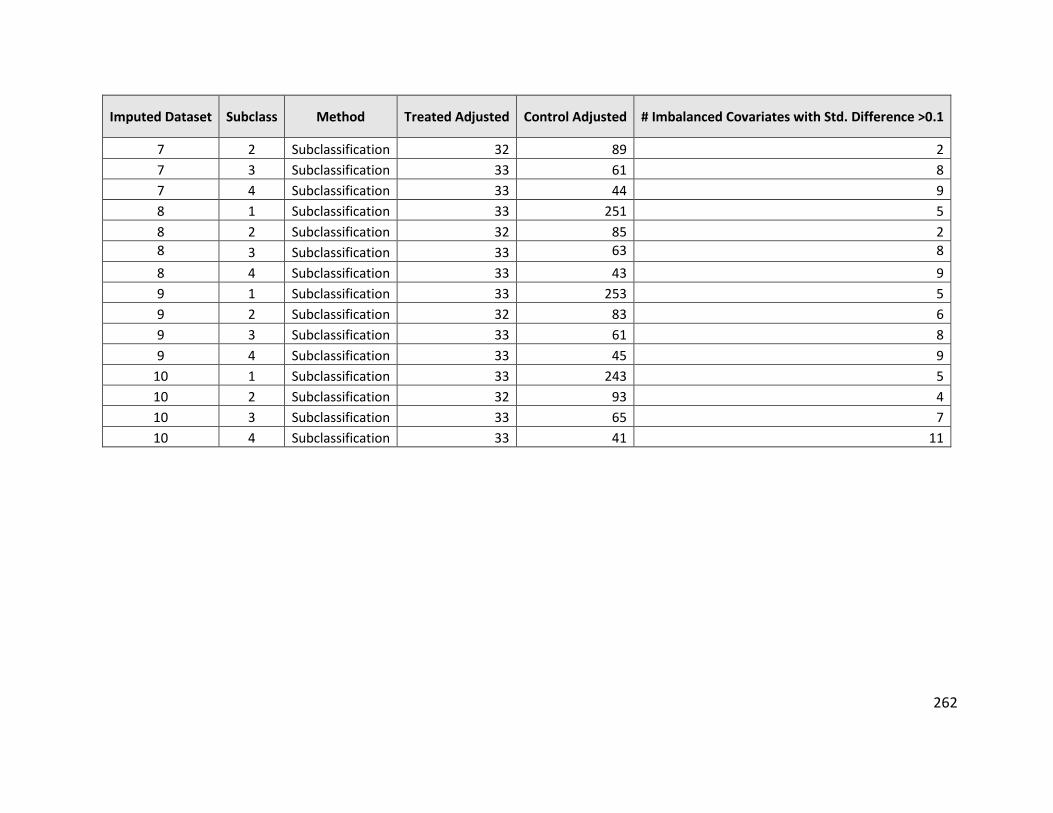
262
Imputed Dataset Subclass Method Treated Adjusted Control Adjusted # Imbalanced Covariates with Std. Difference >0.1
7 2 Subclassification 32 89 2 7 3 Subclassification 33 61 8 7 4 Subclassification 33 44 9 8 1 Subclassification 33 251 5 8 2 Subclassification 32 85 2 8 3 Subclassification 33 63 8 8 4 Subclassification 33 43 9 9 1 Subclassification 33 253 5 9 2 Subclassification 32 83 6 9 3 Subclassification 33 61 8 9 4 Subclassification 33 45 9
10 1 Subclassification 33 243 5 10 2 Subclassification 32 93 4 10 3 Subclassification 33 65 7 10 4 Subclassification 33 41 11
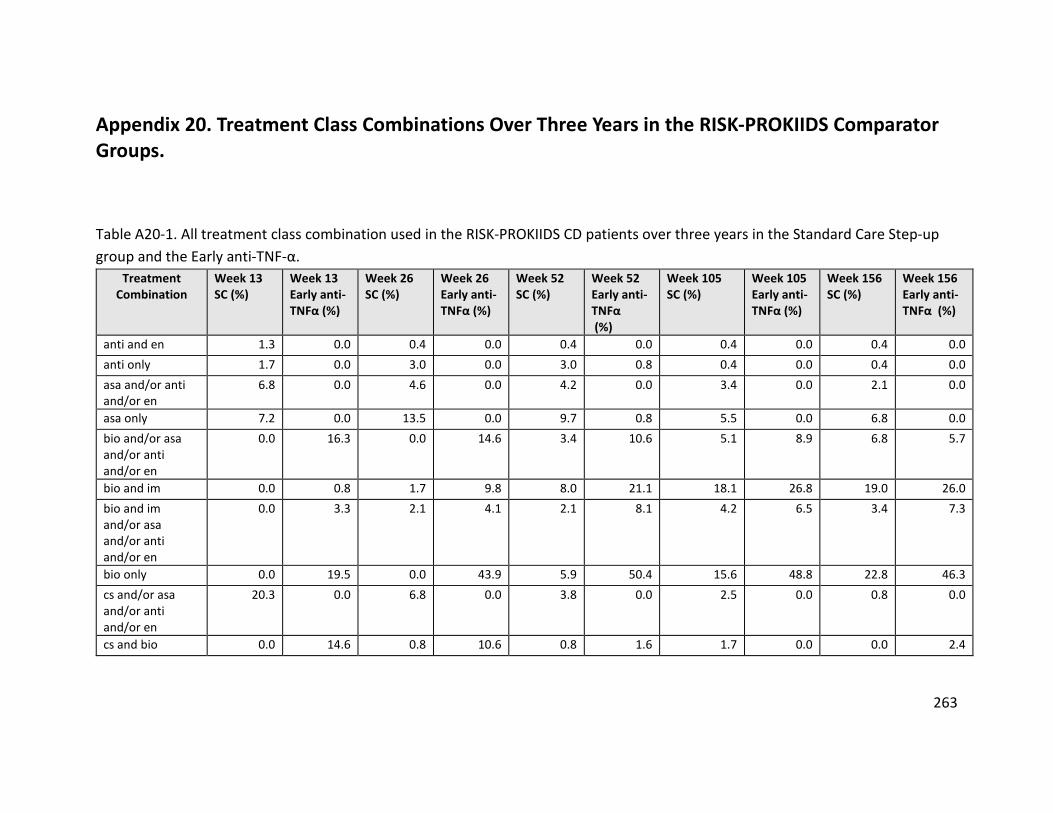
263
Appendix 20. Treatment Class Combinations Over Three Years in the RISK-PROKIIDS Comparator Groups.
Table A20-1. All treatment class combination used in the RISK-PROKIIDS CD patients over three years in the Standard Care Step-up group and the Early anti-TNF-α.
Treatment Combination
Week 13 SC (%)
Week 13 Early anti-TNFα (%)
Week 26 SC (%)
Week 26 Early anti-TNFα (%)
Week 52 SC (%)
Week 52 Early anti-TNFα (%)
Week 105 SC (%)
Week 105 Early anti-TNFα (%)
Week 156 SC (%)
Week 156 Early anti-TNFα (%)
anti and en 1.3 0.0 0.4 0.0 0.4 0.0 0.4 0.0 0.4 0.0 anti only 1.7 0.0 3.0 0.0 3.0 0.8 0.4 0.0 0.4 0.0 asa and/or anti and/or en
6.8 0.0 4.6 0.0 4.2 0.0 3.4 0.0 2.1 0.0
asa only 7.2 0.0 13.5 0.0 9.7 0.8 5.5 0.0 6.8 0.0 bio and/or asa and/or anti and/or en
0.0 16.3 0.0 14.6 3.4 10.6 5.1 8.9 6.8 5.7
bio and im 0.0 0.8 1.7 9.8 8.0 21.1 18.1 26.8 19.0 26.0 bio and im and/or asa and/or anti and/or en
0.0 3.3 2.1 4.1 2.1 8.1 4.2 6.5 3.4 7.3
bio only 0.0 19.5 0.0 43.9 5.9 50.4 15.6 48.8 22.8 46.3 cs and/or asa and/or anti and/or en
20.3 0.0 6.8 0.0 3.8 0.0 2.5 0.0 0.8 0.0
cs and bio 0.0 14.6 0.8 10.6 0.8 1.6 1.7 0.0 0.0 2.4
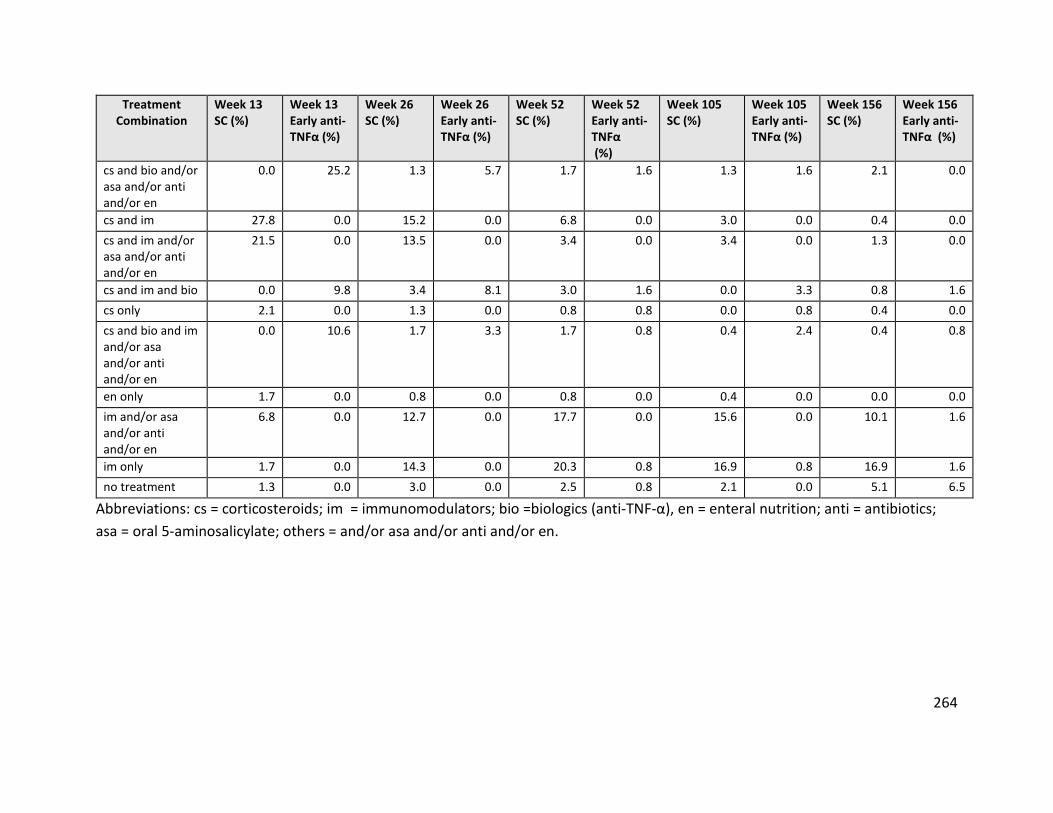
264
Treatment Combination
Week 13 SC (%)
Week 13 Early anti-TNFα (%)
Week 26 SC (%)
Week 26 Early anti-TNFα (%)
Week 52 SC (%)
Week 52 Early anti-TNFα (%)
Week 105 SC (%)
Week 105 Early anti-TNFα (%)
Week 156 SC (%)
Week 156 Early anti-TNFα (%)
cs and bio and/or asa and/or anti and/or en
0.0 25.2 1.3 5.7 1.7 1.6 1.3 1.6 2.1 0.0
cs and im 27.8 0.0 15.2 0.0 6.8 0.0 3.0 0.0 0.4 0.0 cs and im and/or asa and/or anti and/or en
21.5 0.0 13.5 0.0 3.4 0.0 3.4 0.0 1.3 0.0
cs and im and bio 0.0 9.8 3.4 8.1 3.0 1.6 0.0 3.3 0.8 1.6 cs only 2.1 0.0 1.3 0.0 0.8 0.8 0.0 0.8 0.4 0.0 cs and bio and im and/or asa and/or anti and/or en
0.0 10.6 1.7 3.3 1.7 0.8 0.4 2.4 0.4 0.8
en only 1.7 0.0 0.8 0.0 0.8 0.0 0.4 0.0 0.0 0.0 im and/or asa and/or anti and/or en
6.8 0.0 12.7 0.0 17.7 0.0 15.6 0.0 10.1 1.6
im only 1.7 0.0 14.3 0.0 20.3 0.8 16.9 0.8 16.9 1.6 no treatment 1.3 0.0 3.0 0.0 2.5 0.8 2.1 0.0 5.1 6.5
Abbreviations: cs = corticosteroids; im = immunomodulators; bio =biologics (anti-TNF-α), en = enteral nutrition; anti = antibiotics; asa = oral 5-aminosalicylate; others = and/or asa and/or anti and/or en.
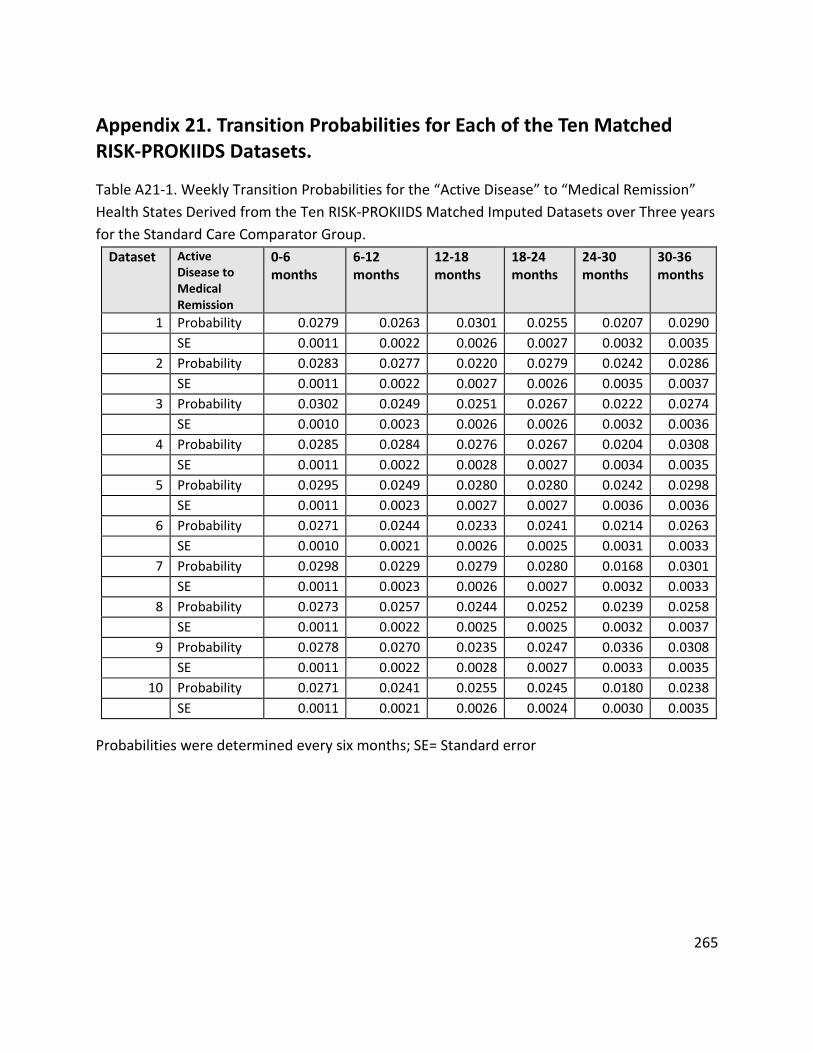
265
Appendix 21. Transition Probabilities for Each of the Ten Matched RISK-PROKIIDS Datasets.
Table A21-1. Weekly Transition Probabilities for the “Active Disease” to “Medical Remission” Health States Derived from the Ten RISK-PROKIIDS Matched Imputed Datasets over Three years for the Standard Care Comparator Group.
Dataset Active Disease to Medical Remission
0-6 months
6-12 months
12-18 months
18-24 months
24-30 months
30-36 months
1 Probability 0.0279 0.0263 0.0301 0.0255 0.0207 0.0290 SE 0.0011 0.0022 0.0026 0.0027 0.0032 0.0035
2 Probability 0.0283 0.0277 0.0220 0.0279 0.0242 0.0286 SE 0.0011 0.0022 0.0027 0.0026 0.0035 0.0037
3 Probability 0.0302 0.0249 0.0251 0.0267 0.0222 0.0274 SE 0.0010 0.0023 0.0026 0.0026 0.0032 0.0036
4 Probability 0.0285 0.0284 0.0276 0.0267 0.0204 0.0308 SE 0.0011 0.0022 0.0028 0.0027 0.0034 0.0035
5 Probability 0.0295 0.0249 0.0280 0.0280 0.0242 0.0298 SE 0.0011 0.0023 0.0027 0.0027 0.0036 0.0036
6 Probability 0.0271 0.0244 0.0233 0.0241 0.0214 0.0263 SE 0.0010 0.0021 0.0026 0.0025 0.0031 0.0033
7 Probability 0.0298 0.0229 0.0279 0.0280 0.0168 0.0301 SE 0.0011 0.0023 0.0026 0.0027 0.0032 0.0033
8 Probability 0.0273 0.0257 0.0244 0.0252 0.0239 0.0258 SE 0.0011 0.0022 0.0025 0.0025 0.0032 0.0037
9 Probability 0.0278 0.0270 0.0235 0.0247 0.0336 0.0308 SE 0.0011 0.0022 0.0028 0.0027 0.0033 0.0035
10 Probability 0.0271 0.0241 0.0255 0.0245 0.0180 0.0238 SE 0.0011 0.0021 0.0026 0.0024 0.0030 0.0035
Probabilities were determined every six months; SE= Standard error
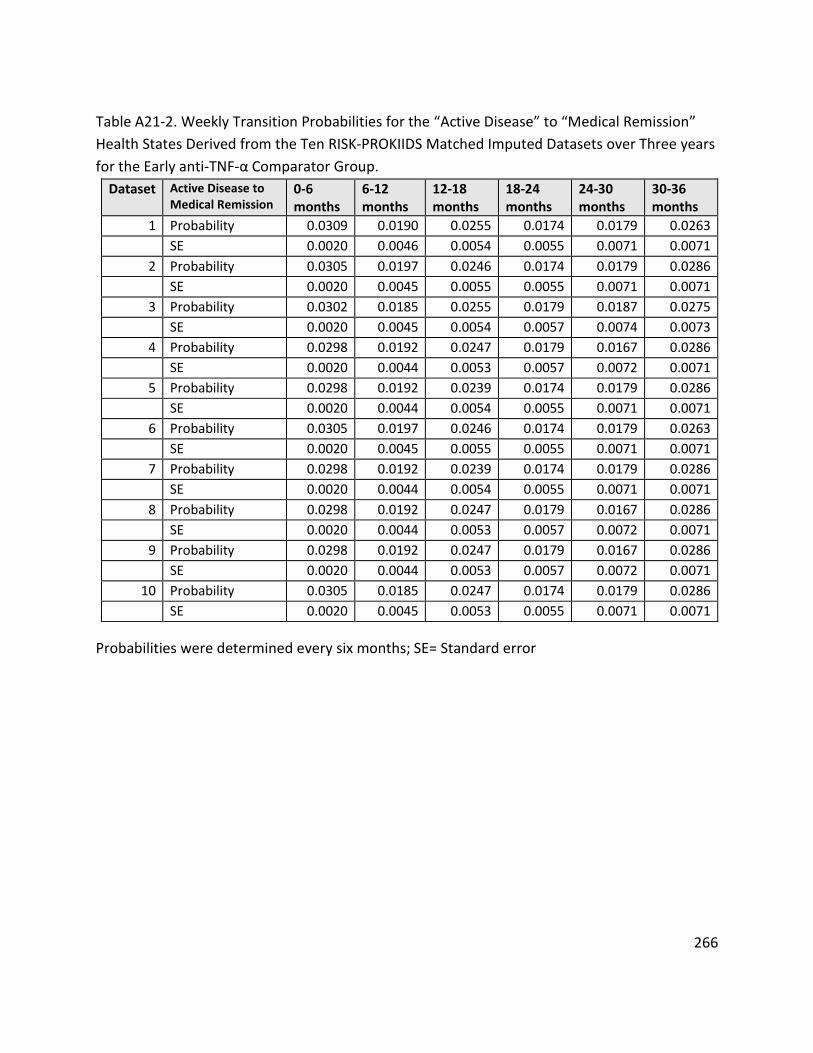
266
Table A21-2. Weekly Transition Probabilities for the “Active Disease” to “Medical Remission” Health States Derived from the Ten RISK-PROKIIDS Matched Imputed Datasets over Three years for the Early anti-TNF-α Comparator Group.
Dataset Active Disease to Medical Remission
0-6 months
6-12 months
12-18 months
18-24 months
24-30 months
30-36 months
1 Probability 0.0309 0.0190 0.0255 0.0174 0.0179 0.0263 SE 0.0020 0.0046 0.0054 0.0055 0.0071 0.0071
2 Probability 0.0305 0.0197 0.0246 0.0174 0.0179 0.0286 SE 0.0020 0.0045 0.0055 0.0055 0.0071 0.0071
3 Probability 0.0302 0.0185 0.0255 0.0179 0.0187 0.0275 SE 0.0020 0.0045 0.0054 0.0057 0.0074 0.0073
4 Probability 0.0298 0.0192 0.0247 0.0179 0.0167 0.0286 SE 0.0020 0.0044 0.0053 0.0057 0.0072 0.0071
5 Probability 0.0298 0.0192 0.0239 0.0174 0.0179 0.0286 SE 0.0020 0.0044 0.0054 0.0055 0.0071 0.0071
6 Probability 0.0305 0.0197 0.0246 0.0174 0.0179 0.0263 SE 0.0020 0.0045 0.0055 0.0055 0.0071 0.0071
7 Probability 0.0298 0.0192 0.0239 0.0174 0.0179 0.0286 SE 0.0020 0.0044 0.0054 0.0055 0.0071 0.0071
8 Probability 0.0298 0.0192 0.0247 0.0179 0.0167 0.0286 SE 0.0020 0.0044 0.0053 0.0057 0.0072 0.0071
9 Probability 0.0298 0.0192 0.0247 0.0179 0.0167 0.0286 SE 0.0020 0.0044 0.0053 0.0057 0.0072 0.0071
10 Probability 0.0305 0.0185 0.0247 0.0174 0.0179 0.0286 SE 0.0020 0.0045 0.0053 0.0055 0.0071 0.0071
Probabilities were determined every six months; SE= Standard error

267
Table A21-3. Weekly Transition Probabilities for the Continued “Medical Remission” Health State Derived from the Ten RISK-PROKIIDS Matched Imputed Datasets over Three years for the Standard Care Comparator Group.
Dataset
Medical Remission to
Medical Remission
6-12 months
12-18 months
18-24 months
24-30 months
30-36 months
1 Probability 0.0429 0.0386 0.0600 0.0617 0.0730 SE 0.0018 0.0016 0.0011 0.0010 0.0008
2 Probability 0.0426 0.0441 0.0622 0.0626 0.0670 SE 0.0017 0.0015 0.0011 0.0009 0.0008
3 Probability 0.0422 0.0398 0.0541 0.0659 0.0808 SE 0.0017 0.0016 0.0013 0.0009 0.0006
4 Probability 0.0442 0.0404 0.0598 0.0617 0.0726 SE 0.0017 0.0016 0.0011 0.0010 0.0008
5 Probability 0.0453 0.0406 0.0630 0.0596 0.0708 SE 0.0016 0.0016 0.0011 0.0010 0.0008
6 Probability 0.0426 0.0395 0.0582 0.0605 0.0710 SE 0.0018 0.0016 0.0012 0.0010 0.0008
7 Probability 0.0444 0.0408 0.0598 0.0631 0.0738 SE 0.0017 0.0016 0.0011 0.0009 0.0008
8 Probability 0.0414 0.0385 0.0569 0.0643 0.0677 SE 0.0018 0.0017 0.0013 0.0010 0.0008
9 Probability 0.0466 0.0452 0.0603 0.0639 0.0699 SE 0.0017 0.0015 0.0011 0.0009 0.0008
10 Probability 0.0442 0.0366 0.0592 0.0688 0.0685 SE 0.0018 0.0017 0.0012 0.0009 0.0008
Probabilities were determined every six months; SE= Standard error
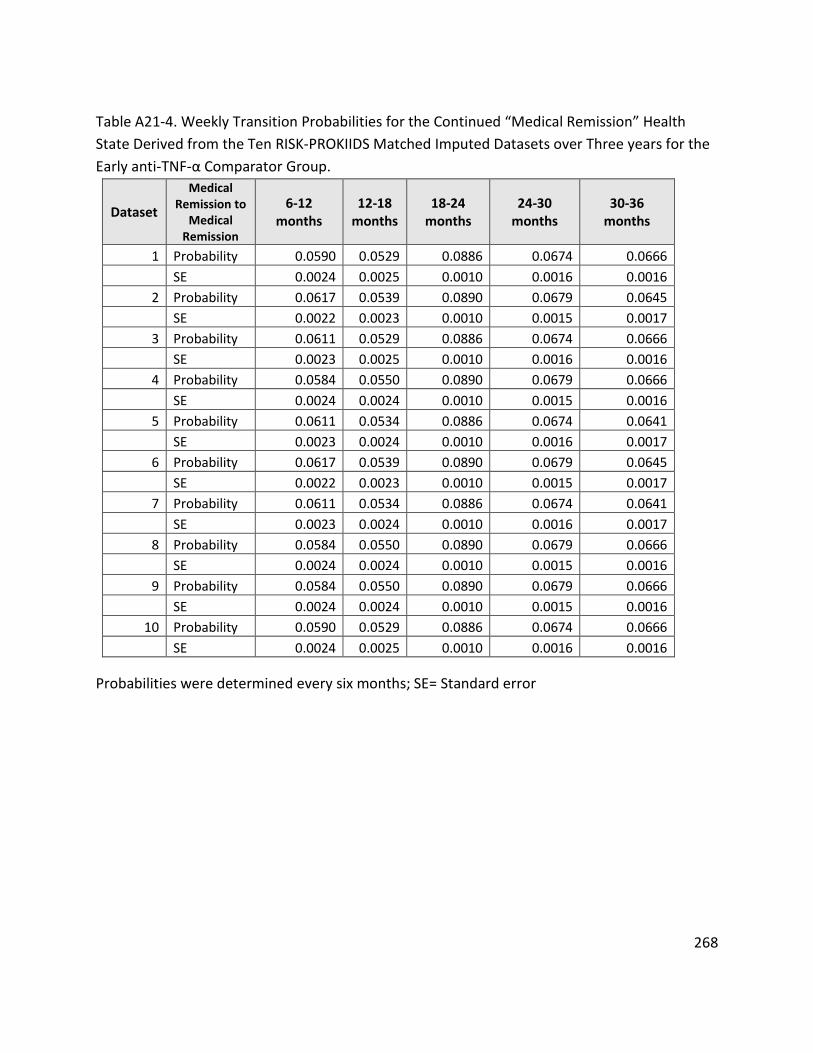
268
Table A21-4. Weekly Transition Probabilities for the Continued “Medical Remission” Health State Derived from the Ten RISK-PROKIIDS Matched Imputed Datasets over Three years for the Early anti-TNF-α Comparator Group.
Dataset
Medical Remission to
Medical Remission
6-12 months
12-18 months
18-24 months
24-30 months
30-36 months
1 Probability 0.0590 0.0529 0.0886 0.0674 0.0666 SE 0.0024 0.0025 0.0010 0.0016 0.0016
2 Probability 0.0617 0.0539 0.0890 0.0679 0.0645 SE 0.0022 0.0023 0.0010 0.0015 0.0017
3 Probability 0.0611 0.0529 0.0886 0.0674 0.0666 SE 0.0023 0.0025 0.0010 0.0016 0.0016
4 Probability 0.0584 0.0550 0.0890 0.0679 0.0666 SE 0.0024 0.0024 0.0010 0.0015 0.0016
5 Probability 0.0611 0.0534 0.0886 0.0674 0.0641 SE 0.0023 0.0024 0.0010 0.0016 0.0017
6 Probability 0.0617 0.0539 0.0890 0.0679 0.0645 SE 0.0022 0.0023 0.0010 0.0015 0.0017
7 Probability 0.0611 0.0534 0.0886 0.0674 0.0641 SE 0.0023 0.0024 0.0010 0.0016 0.0017
8 Probability 0.0584 0.0550 0.0890 0.0679 0.0666 SE 0.0024 0.0024 0.0010 0.0015 0.0016
9 Probability 0.0584 0.0550 0.0890 0.0679 0.0666 SE 0.0024 0.0024 0.0010 0.0015 0.0016
10 Probability 0.0590 0.0529 0.0886 0.0674 0.0666 SE 0.0024 0.0025 0.0010 0.0016 0.0016
Probabilities were determined every six months; SE= Standard error
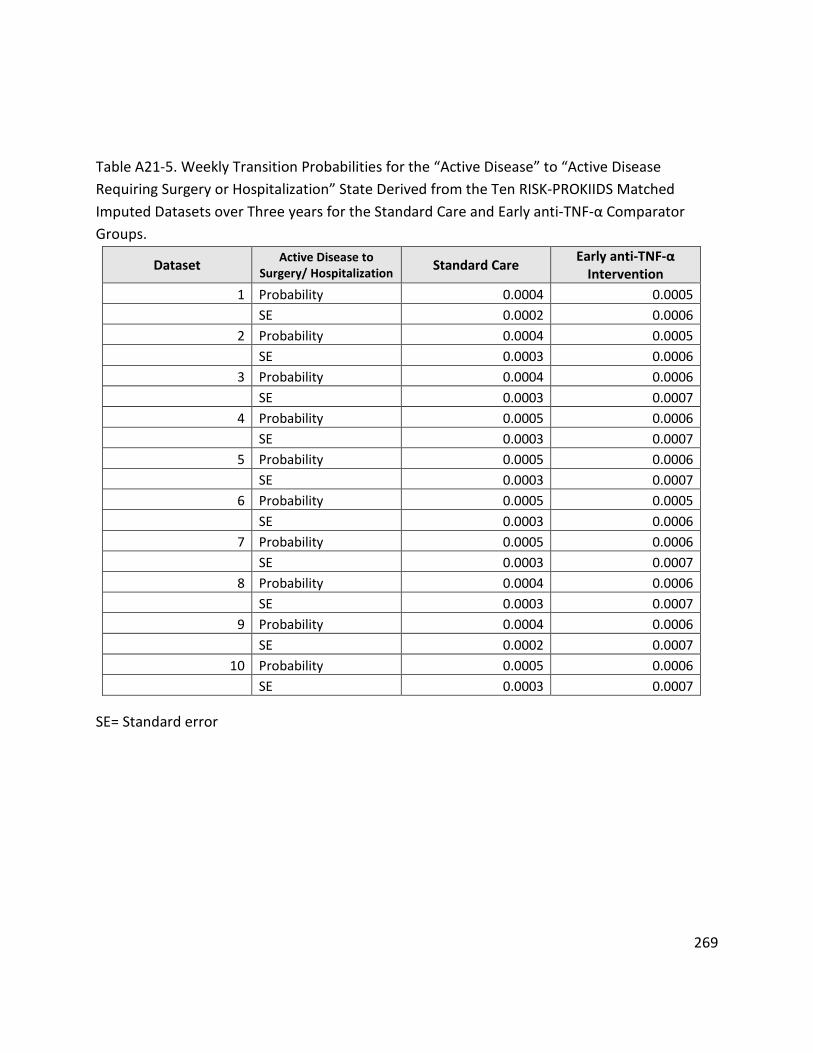
269
Table A21-5. Weekly Transition Probabilities for the “Active Disease” to “Active Disease Requiring Surgery or Hospitalization” State Derived from the Ten RISK-PROKIIDS Matched Imputed Datasets over Three years for the Standard Care and Early anti-TNF-α Comparator Groups.
Dataset Active Disease to Surgery/ Hospitalization Standard Care
Early anti-TNF-α Intervention
1 Probability 0.0004 0.0005 SE 0.0002 0.0006
2 Probability 0.0004 0.0005 SE 0.0003 0.0006
3 Probability 0.0004 0.0006 SE 0.0003 0.0007
4 Probability 0.0005 0.0006 SE 0.0003 0.0007
5 Probability 0.0005 0.0006 SE 0.0003 0.0007
6 Probability 0.0005 0.0005 SE 0.0003 0.0006
7 Probability 0.0005 0.0006 SE 0.0003 0.0007
8 Probability 0.0004 0.0006 SE 0.0003 0.0007
9 Probability 0.0004 0.0006 SE 0.0002 0.0007
10 Probability 0.0005 0.0006 SE 0.0003 0.0007
SE= Standard error
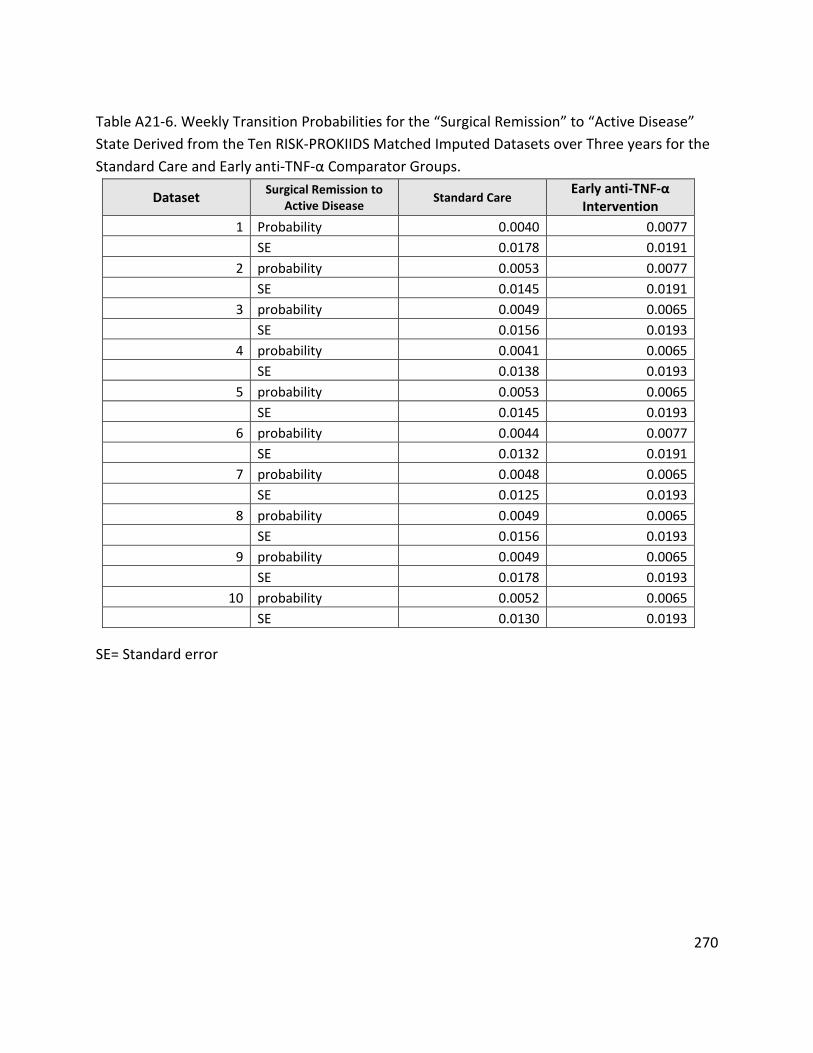
270
Table A21-6. Weekly Transition Probabilities for the “Surgical Remission” to “Active Disease” State Derived from the Ten RISK-PROKIIDS Matched Imputed Datasets over Three years for the Standard Care and Early anti-TNF-α Comparator Groups.
Dataset Surgical Remission to Active Disease Standard Care
Early anti-TNF-α Intervention
1 Probability 0.0040 0.0077 SE 0.0178 0.0191
2 probability 0.0053 0.0077 SE 0.0145 0.0191
3 probability 0.0049 0.0065 SE 0.0156 0.0193
4 probability 0.0041 0.0065 SE 0.0138 0.0193
5 probability 0.0053 0.0065 SE 0.0145 0.0193
6 probability 0.0044 0.0077 SE 0.0132 0.0191
7 probability 0.0048 0.0065 SE 0.0125 0.0193
8 probability 0.0049 0.0065 SE 0.0156 0.0193
9 probability 0.0049 0.0065 SE 0.0178 0.0193
10 probability 0.0052 0.0065 SE 0.0130 0.0193
SE= Standard error
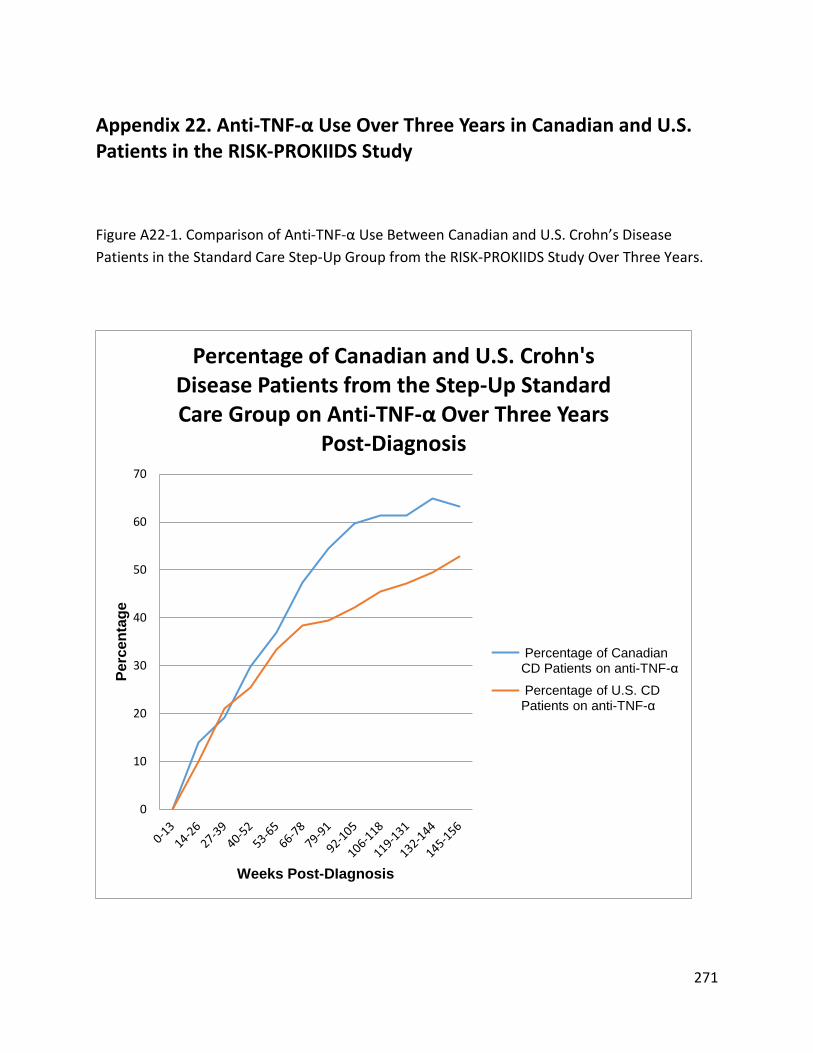
271
Appendix 22. Anti-TNF-α Use Over Three Years in Canadian and U.S. Patients in the RISK-PROKIIDS Study
Figure A22-1. Comparison of Anti-TNF-α Use Between Canadian and U.S. Crohn’s Disease Patients in the Standard Care Step-Up Group from the RISK-PROKIIDS Study Over Three Years.
0
10
20
30
40
50
60
70
Perc
enta
ge
Weeks Post-DIagnosis
Percentage of Canadian and U.S. Crohn's Disease Patients from the Step-Up Standard Care Group on Anti-TNF-α Over Three Years
Post-Diagnosis
Percentage of Canadian CD Patients on anti-TNF-αPercentage of U.S. CD Patients on anti-TNF-α
272
References
Abbvie Corporation. (2018). Humira Product Monograph. Retrieved from https://www.abbvie.ca/content/dam/abbviecorp/ca/en/docs/HUMIRA_PM_EN.pdf
Al Hadithy, A., de Boer, N., Derijks, L., Escher, J., Mulder, C., & Brouwers, J. (2005). Thiopurines in inflammatory bowel disease: pharmacogenetics, therapeutic drug monitoring and clinical recommendations. Digestive and Liver Disease, 37(4), 282-297.
Aquilina, A., Bisson, R., Brennan, J., Carricato, M., Connolly, B., Green, G., . . . Wales, P. (2007). Guidelines for the Administration of Enteral and Parenteral Nutrition in Paediatrics. Retrieved from Toronto: https://www.sickkids.ca/pdfs/Clinical-Dietitians/19499-Enteral_Parenteral_Nutrition.pdf
Arseneau, K. O., Cohn, S. M., Cominelli, F., & Connors Jr, A. F. (2001). Cost-utility of initial medical management for Crohn's disease perianal fistulae. Gastroenterology, 120(7), 1640-1656.
Assa, A., Hartman, C., Weiss, B., Broide, E., Rosenbach, Y., Zevit, N., . . . Shamir, R. (2013). Long-term outcome of tumor necrosis factor alpha antagonist's treatment in pediatric Crohn's disease. Journal of Crohn's and Colitis, 7(5), 369-376.
Assasi, N., Blackhouse, G., Xie, F., Gaebel, K., Marshall, J., Irvine, E., . . . Canadian Agency for Drugs and Technologies in Health. (2009). Anti-TNF-α Drugs for Refractory Inflammatory Bowel Disease: Clinical- and Cost-Effectiveness Analyses, Technology Report Number 120.
Austin, P. C. (2009). Some Methods of Propensity-Score Matching had Superior Performance to Others: Results of an Empirical Investigation and Monte Carlo simulations. Biometrical Journal, 51(1), 171-184.
Austin, P. C. (2010). Statistical Criteria for Selecting the Optimal Number of Untreated Subjects Matched to Each Treated Subject When Using Many-to-One Matching on the Propensity Score. American Journal of Epidemiology, 172(9), 1092-1097. doi:10.1093/aje/kwq224
Austin, P. C. (2011a). An introduction to propensity score methods for reducing the effects of confounding in observational studies. Multivariate behavioral research, 46(3), 399-424.
Austin, P. C. (2011b). Optimal caliper widths for propensity-score matching when estimating differences in means and differences in proportions in observational studies. Pharmaceutical statistics, 10(2), 150-161.
Azur, M. J., Stuart, E. A., Frangakis, C., & Leaf, P. J. (2011). Multiple imputation by chained equations: what is it and how does it work? International journal of methods in psychiatric research, 20(1), 40-49.
273
Baert, F., Moortgat, L., Van Assche, G., Caenepeel, P., Vergauwe, P., De Vos, M., . . . Vermeire, S. (2010). Mucosal healing predicts sustained clinical remission in patients with early-stage Crohn's disease. Gastroenterology, 138(2), 463-468.
Barr, V., Robinson, S., Marin-Link, B., Underhill, L., Dotts, A., Ravensdale, D., & Salivaras, S. (2003). The expanded chronic care model. Hospital quarterly, 7(1), 73-82.
Behm, B. W., & Bickston, S. J. (2008). Tumor necrosis factor-alpha antibody for maintenance of remission in Crohn’s disease. Cochrane Database Syst Rev, 1(1), CD006893.
Benchimol, E. I., Bernstein, C. N., Bitton, A., Carroll, M. W., Singh, H., Otley, A. R., . . . Griffiths, A. M. (2017). Trends in Epidemiology of Pediatric Inflammatory Bowel Disease in Canada: Distributed Network Analysis of Multiple Population-Based Provincial Health Administrative Databases. Am J Gastroenterol, 112, 1120-1134. doi:10.1038/ajg.2017.97
Benchimol, E. I., Guttmann, A., Griffiths, A. M., Rabeneck, L., Mack, D. R., Brill, H., . . . To, T. (2009). Increasing incidence of paediatric inflammatory bowel disease in Ontario, Canada: evidence from health administrative data. Gut, 58(11), 1490-1497. doi:10.1136/gut.2009.188383
Benchimol, E. I., Mack, D. R., Nguyen, G. C., Snapper, S. B., Li, W., Mojaverian, N., . . . Muise, A. M. (2014). Incidence, outcomes, and health services burden of very early onset inflammatory bowel disease. Gastroenterology, 147(4), 803-813 e807; quiz e814-805. doi:10.1053/j.gastro.2014.06.023
Bennett, D. A. (2001). How can I deal with missing data in my study? Australian and New Zealand journal of public health, 25(5), 464-469.
Bitton, A., Vutcovici, M., Sewitch, M., Suissa, S., & Brassard, P. (2016). Mortality trends in Crohn's disease and ulcerative colitis: a population-based study in Quebec, Canada. Inflamm Bowel Dis, 22(2), 416-423.
Blackburn, S., Wiskin, A., Barnes, C., Dick, K., Afzal, N., Griffiths, D., . . . Stanton, M. (2014). Surgery for children with Crohn's disease: indications, complications and outcome. Arch Dis Child, archdischild-2013-305214.
Blackhouse, G., Assasi, N., Xie, F., Marshall, J., Irvine, E. J., Gaebel, K., . . . Goeree, R. (2012a). Canadian cost-utility analysis of initiation and maintenance treatment with anti-TNF-alpha drugs for refractory Crohn's disease. Journal of Crohn's and Colitis, 6(1), 77-85.
Blackhouse, G., Assasi, N., Xie, F., Marshall, J., Irvine, E. J., Gaebel, K., . . . Goeree, R. (2012b). Canadian cost-utility analysis of initiation and maintenance treatment with anti-TNF-alpha drugs for refractory Crohn's disease. Journal of Crohn's & colitis, 6(1), 77-85. doi:10.1016/j.crohns.2011.07.007
274
Braegger, C., Nicholls, S., Murch, S., MacDonald, T., & Stephens, S. (1992). Tumour necrosis factor alpha in stool as a marker of intestinal inflammation. The Lancet, 339(8785), 89-91.
Briggs, A., Sculpher, M., & Claxton, K. (2006). Decision modelling for health economic evaluation: Oxford university press.
Burnett, H. F., Ungar, W. J., Regier, D. A., Feldman, B. M., & Miller, F. A. (2014). Parent willingness-to-pay for biologic treatments in juvenile idiopathic arthritis. Value in health, under review.
Buuren, S., & Groothuis-Oudshoorn, K. (2011). mice: Multivariate imputation by chained equations in R. Journal of Statistical software, 45(3).
Canadian Agency for Drugs and Technologies in Health (CADTH). (2009). Report in Brief Anti-TNF-α Drugs for Refractory Inflammatory Bowel Disease: Clinical- and Cost-Effectiveness Analyses.
Canadian Agency for Drugs and Technologies in Health (CADTH). (2017). Guidelines for the economic evaluation of health technologies: Canada. 4th ed. Retrieved from Ottawa: https://www.cadth.ca/about-cadth/how-we-do-it/methods-and-guidelines/guidelines-for-the-economic-evaluation-of-health-technologies-canada
Canadian Agency for Drugs and Technologies in Health (CADTH). (2018). Biosimilars — Regulatory, Health Technology Assessment, Reimbursement Trends, and Market Outlook. Retrieved from https://www.cadth.ca/sites/default/files/pdf/ES0317_biosimilars.pdf
Canadian Cancer Society’s Advisory Committee on Cancer Statistics. (2017). Canadian Cancer Statistics 2017. Retrieved from Toronto, ON: http://www.cancer.ca/~/media/cancer.ca/CW/publications/Canadian%20Cancer%20Statistics/Canadian-Cancer-Statistics-2017-EN.pdf
Canadian Human Mortality Database. Department of Demography Université de Montréal (Canada). (2014). Canadian Human Mortality Database. Retrieved from www.demo.umontreal.ca/chmd/
Canadian Institute for Health Information. (2017). Prescribed Drug Spending in Canada, 2017: A Focus on Public Drug Programs. Retrieved from https://www.cihi.ca/sites/default/files/document/pdex2017-report-en.pdf
Casteele, N. V., Ferrante, M., Van Assche, G., Ballet, V., Compernolle, G., Van Steen, K., . . . Vermeire, S. (2015). Trough concentrations of infliximab guide dosing for patients with inflammatory bowel disease. Gastroenterology, 148(7), 1320-1329. e1323.
275
Choi, G. K. H., Collins, S. D. E., Greer, D. P., Warren, L., Dowson, G., Clark, T., . . . Ford, A. C. (2014). Costs of adalimumab versus infliximab as first-line biological therapy for luminal Crohn's disease. Journal of Crohn's and Colitis, 8(5), 375-383.
Church, P. C., Guan, J., Walters, T. D., Frost, K., Assa, A., Muise, A. M., & Griffiths, A. M. (2014). Infliximab maintains durable response and facilitates catch-up growth In luminal pediatric Crohn's disease. Inflamm Bowel Dis, 20(7), 1177-1186.
Church, P. C., Hyams, J., Ruemmele, F., de Ridder, L., Turner, D., & Griffiths, A. M. (2018). The Continental Divide: Anti-TNF Use in Pediatric IBD Is Different in North America Compared to Other Parts of the World. Canadian Journal of Gastroenterology and Hepatology, 2018.
Cincinnati Children's Hospital Medical Center. (2007). Evidence-based care guideline for management of pediatric moderate/severe inflammatory bowel disease (IBD). Cincinnati
Civitelli, F., Viola, F., Nuti, F., Oliva, S., Di Nardo, G., Labalestra, V., . . . Cucchiara, S. (2009). Efficacy and safety of adalimumab in pediatric Crohndisease: A prospective, open-label, single-centre trial. J Pediatr Gastroenterol Nutr, 48, E39-E40.
Cochran WG. (1968). The effectiveness of adjustment by subclassiffication in removing bias in observational studies. Biometrics, 24, 295-313.
Colombel, J.-F., Narula, N., & Peyrin-Biroulet, L. (2017). Management strategies to improve outcomes of patients with inflammatory bowel diseases. Gastroenterology, 152(2), 351-361. e355.
Colombel, J. F., Loftus Jr, E. V., Tremaine, W. J., Pemberton, J. H., Wolff, B. G., Young-Fadok, T., . . . Sandborn, W. J. (2004). Early postoperative complications are not increased in patients with Crohn's disease treated perioperatively with infliximab or immunosuppressive therapy. American Journal of Gastroenterology, 99(5), 878-883.
Colombel, J. F., Sandborn, W. J., Reinisch, W., Mantzaris, G. J., Kornbluth, A., Rachmilewitz, D., . . . Sonic Study Group. (2010). Infliximab, azathioprine, or combination therapy for Crohn's disease. New England Journal of Medicine, 362(15), 1383-1395.
Colombel, J. F., Sandborn, W. J., Rutgeerts, P., Enns, R., Hanauer, S. B., Panaccione, R., . . . Kent, J. D. (2007). Adalimumab for maintenance of clinical response and remission in patients with Crohn’s disease: the CHARM trial. Gastroenterology, 132(1), 52-65.
Conti, R., Veenstra, D. L., Armstrong, K., Lesko, L. J., & Grosse, S. D. (2010). Personalized medicine and genomics: challenges and opportunities in assessing effectiveness, cost-effectiveness, and future research priorities. Medical Decision Making, 30(3), 328-340.
276
Cozijnsen, M., van Pieterson, M., Samsom, J., Escher, J., & de Ridder, L. (2016). Top-down Infliximab Study in Kids with Crohn's disease (TISKids): an international multicentre randomised controlled trial. BMJ open gastroenterology, 3(1), e000123.
Crohn’s and Colitis Foundation of Canada. (2012). The Impact Of Inflammatory Bowel Disease In Canada: 2012 Final Report and Recommendations. Retrieved from Toronto, ON: http://crohnsandcolitis.ca/About-Us/Resources-Publications/Impact-of-IBD-Report
Crowley, E., Carman, N., Arpino, V., Frost, K., Sherlock, M., Critch, J., . . . Laurence, S. (2017). Early Use of Therapeutic Drug Monitoring to Individualize Infliximab Therapy in Paediatric IBD, a Multicentre Prospective Study. Paper presented at the Inflamm Bowel Dis.
D'Haens, G. (2004). Mucosal healing in pediatric Crohn's disease: The goal of medical treatment. Inflamm Bowel Dis, 10(4), 479-480.
D'Haens, G., Baert, F., Van Assche, G., Caenepeel, P., Vergauwe, P., Tuynman, H., . . . Donner, A. (2008). Early combined immunosuppression or conventional management in patients with newly diagnosed Crohn's disease: an open randomised trial. The Lancet, 371(9613), 660-667.
De Ridder, L., Turner, D., Wilson, D. C., Koletzko, S., Martin-de-Carpi, J., Fagerberg, U. L., . . . Roma-Giannikou, E. (2014). Malignancy and mortality in pediatric patients with inflammatory bowel disease: a multinational study from the Porto Pediatric IBD group. Inflamm Bowel Dis, 20(2), 291-300.
Deiana, S., Gabbani, T., & Annese, V. (2017). Biosimilars in inflammatory bowel disease: A review of post-marketing experience. World Journal of Gastroenterology, 23(2), 197.
Denson, L. A., Long, M. D., McGovern, D. P. B., Kugathasan, S., Wu, G. D., Young, V. B., . . . Challenges, W. (2013). Challenges in IBD research: update on progress and prioritization of the CCFA's research agenda. Inflamm Bowel Dis, 19(4), 677-682.
Ding, N., Hart, A., & De Cruz, P. (2016). Systematic review: predicting and optimising response to anti-TNF therapy in Crohn's disease–algorithm for practical management. Aliment Pharmacol Ther, 43(1), 30-51.
Drummond, M. F., Sculpher, M. J., Torrance, G. W., O'Brien, B. J., & Stoddart, G. L. (2005). Methods for the Economic Evaluation of Health Care Programmes (3rd ed.). Oxford: Oxford University Press.
Dulai, P. S., Thompson, K. D., Blunt, H. B., Dubinsky, M. C., & Siegel, C. A. (2014). Risks of serious infection or lymphoma with anti–tumor necrosis factor therapy for pediatric inflammatory bowel disease: a systematic review. Clinical Gastroenterology and Hepatology, 12(9), 1443-1451.
277
Eddy, D. M., Hollingworth, W., Caro, J. J., Tsevat, J., McDonald, K. M., & Wong, J. B. (2012). Model Transparency and Validation: A Report of the ISPOR-SMDM Modeling Good Research Practices Task Force-7. Value in health, 15(6), 843-850. doi:10.1016/j.jval.2012.04.012
Escher, J. C., Taminiau, J. A. J. M., Nieuwenhuis, E. E. S., Buller, H. A., & Grand, R. J. (2003). Treatment of inflammatory bowel disease in childhood: Best available evidence. Inflamm Bowel Dis, 9(1), 34-58.
Feagan, B. G., Panaccione, R., Sandborn, W. J., D'Haens, G. R., Schreiber, S., Rutgeerts, P. J., . . . Wu, E. Q. (2008). Effects of adalimumab therapy on incidence of hospitalization and surgery in Crohn's disease: results from the CHARM study. Gastroenterology, 135(5), 1493-1499.
Fiona M. Clement, Lesley J.J. Soril, Herbert Emery, David J.T. Campbell, & Braden J. Manns. (2016 ). Canadian Publicly Funded Prescription Drug Plans, Expenditures and an Overview of Patient Impacts. Retrieved from https://obrieniph.ucalgary.ca/system/files/comparison-of-canadian-publicly-funded-drug-plans-for-alberta-health-feb-1-2016.pdf
Flegal, K. M., & Cole, T. J. (2013). Construction of LMS parameters for the Centers for Disease Control and Prevention 2000 growth charts: US Department of Health and Human Services, Centers for Disease Control and Prevention, National Center for Health Statistics.
Fong, C., Ratkovic, M., & Imai, K. (2014). CBPS: R package for covariate balancing propensity score. Comprehensive R Archive Network (CRAN).
Ford, A. C., Sandborn, W. J., Khan, K. J., Hanauer, S. B., Talley, N. J., & Moayyedi, P. (2011). Efficacy of biological therapies in inflammatory bowel disease: systematic review and meta-analysis. Am J Gastroenterol, 106(4), 644-659, quiz 660. doi:10.1038/ajg.2011.73
Gastrointestinal Society. (2017). Biologic Coverage in Canada for Inflammatory Bowel Disease. Retrieved from https://www.badgut.org/wp-content/uploads/IBD-Report-Card-2017-05-16.pdf
Gecse, K. B., Lovász, B. D., Farkas, K., Banai, J., Bene, L., Gasztonyi, B., . . . Csontos, Á. A. (2015). Efficacy and safety of the biosimilar infliximab CT-P13 treatment in inflammatory bowel diseases: a prospective, multicentre, nationwide cohort. Journal of Crohn's and Colitis, 10(2), 133-140.
Gouldthorpe, O., Catto-Smith, A. G., Alex, G., & Simpson, D. (2013). Loss of response to long-term infliximab therapy in children with Crohn's disease. Pharmaceuticals (Basel), 6(10), 1322-1334. doi:10.3390/ph6101322
278
Government of British Columbia. (2018). British Columbia Pharmacare Formulary Search. Retrieved from https://pharmacareformularysearch.gov.bc.ca/faces/Search.xhtml
Gregor, J. C., John W. D. McDonald, J. W. D., Klar, N., Wall, R., Atkinson, K., Lamba, B., & Feagan, B. G. (1997). An Evaluation of Utility Measurement in Crohn’s Disease. Inflamm Bowel Dis, 3(4), 265-270.
Greifer, N. (2016). Covariate Balance Tables and Plots: A Guide to the cobalt Package.
Griffiths, A. M., Otley, A. R., Hyams, J., Quiros, A. R., Grand, R. J., Bousvaros, A., . . . Ferry, G. R. (2005). A review of activity indices and end points for clinical trials in children with Crohn's disease. Inflamm Bowel Dis, 11(2), 185-196.
Grossi, V., Lerer, T., Leleiko, N. S., Mack, D. R., Griffiths, A. M., Otley, A. R., . . . Hyams, J. S. (2014). Durability of Maintenance Infliximab Therapy in Children With Crohn's Disease: Are Gender and Concomitant Immunomodulators More Important Than We Thought? Gastroenterology, 146(5), S-25-S-26. doi:10.1016/s0016-5085(14)60090-1
Guo, S., & Fraser, M. W. (2014). Propensity score analysis: Statistical methods and applications (Vol. 11): Sage Publications.
Hanauer, S. B. (2005). Top-down versus step-up approaches to chronic inflammatory bowel disease: presumed innocent or presumed guilty: Nature Publishing Group.
Hanauer SB, F. B., Lichtenstein GR, et al; ACCENT I Study Group. (2002). Maintenance infliximab for Crohn’s disease: the ACCENT I randomised trial. Lancet, 359, 1541-1549.
Hanauer, S. B., Feagan, B. G., Lichtenstein, G. R., Mayer, L. F., Schreiber, S., Colombel, J. F., . . . Bao, W. (2002). Maintenance infliximab for Crohn's disease: the ACCENT I randomised trial. The Lancet, 359(9317), 1541-1549.
Hanauer, S. B., Sandborn, W. J., Rutgeerts, P., Fedorak, R. N., Lukas, M., MacIntosh, D., . . . Pollack, P. (2006). Human anti–tumor necrosis factor monoclonal antibody (adalimumab) in Crohn’s disease: the CLASSIC-I Trial. Gastroenterology, 130(2), 323-333.
Harvey, R., & Bradshaw, J. (1980). A simple index of Crohn's-disease activity. The Lancet, 315(8167), 514.
Health Canada. (2016). Health Canada New Drug Authorizations: 2016 Highlights. Retrieved from https://www.canada.ca/content/dam/hc-sc/documents/services/publications/drugs-health-products/health-canada-new-drug-authorizations-2016-highlights-eng.pdf
Health Canada. (2017). Fact Sheet: Biosimilars Retrieved from https://www.canada.ca/content/dam/hc-sc/migration/hc-sc/dhp-
279
mps/alt_formats/pdf/brgtherap/applic-demande/guides/biosimilars-biosimilaires-qa-qr-eng.pdf
Health Canada. (2018). Summary Basis of Decision-Renflexis. Retrieved from https://hpr-rps.hres.ca/reg-content/summary-basis-decision-detailTwo.php?linkID=SBD00379#paatDiv
Health Quality Ontario. (2018). Health Technology Assessments: Methods and Process Guide version. 2.0 Retrieved from http://www.hqontario.ca/Portals/0/documents/evidence/reports/hta-methods-and-process-guide-en.pdf
Heuschkel, R., Salvestrini, C., Beattie, M. R., Hildebrand, H., Walters, T., & Griffiths, A. (2008). Guidelines for the management of growth failure in childhood inflammatory bowel disease. Inflamm Bowel Dis, 14(6), 839-849.
Ho, D. E., Imai, K., King, G., & Stuart, E. A. (2011). MatchIt: nonparametric preprocessing for parametric causal inference. Journal of Statistical software, 42(8), 1-28.
Hoekman, D., Brandse, H., De Meij, T., Hummel, T., Lowenberg, M., Benninga, M., . . . Kindermann, A. (2014). Large variation in infliximab trough levels is associated with disease activity in paediatric inflammatory bowel disease. Journal of Crohn's and Colitis, 8, S35.
Huoponen, S., & Blom, M. (2015). A systematic review of the cost-effectiveness of biologics for the treatment of inflammatory bowel diseases. PloS one, 10(12), e0145087.
Husereau, D., Dempster, W., Blanchard, A., & Chambers, J. (2014). Evolution of drug reimbursement in Canada: the pan-Canadian Pharmaceutical Alliance for new drugs. Value in health, 17(8), 888-894.
Hyams, J., Crandall, W., Kugathasan, S., Griffiths, A., Olson, A., Johanns, J., . . . Markowitz, J. (2007). Induction and maintenance infliximab therapy for the treatment of moderate-to-severe Crohn’s disease in children. Gastroenterology, 132(3), 863-873.
Hyams, J., Walters, T. D., Crandall, W., Kugathasan, S., Griffiths, A., Blank, M., . . . Baldassano, R. (2011). Safety and efficacy of maintenance infliximab therapy for moderate-to-severe Crohn's disease in children: REACH open-label extension. Curr Med Res Opin, 27(3), 651-662. doi:10.1185/03007995.2010.547575
Hyams, J., Walters, T. D., Crandall, W., Kugathasan, S., Griffiths, A., Blank, M., . . . Baldassano, R. (2011). Safety and efficacy of maintenance infliximab therapy for moderate-to-severe Crohn's disease in children: REACH open-label extension. Current Medical Research & Opinion, 27(3), 651-662.
280
Hyams, J. S., Dubinsky, M. C., Baldassano, R. N., Colletti, R. B., Cucchiara, S., Escher, J., . . . Griffiths, A. (2017). Infliximab is not associated with increased risk of malignancy or hemophagocytic lymphohistiocytosis in pediatric patients with inflammatory bowel disease. Gastroenterology, 152(8), 1901-1914. e1903.
Hyams, J. S., Ferry, G. D., Mandel, F. S., Gryboski, J. D., Kibort, P. M., Kirschner, B. S., . . . Boyle, J. T. (1991). Development and validation of a pediatric Crohn's disease activity index. J Pediatr Gastroenterol Nutr, 12(4), 449.
Hyams, J. S., Griffiths, A., Markowitz, J., Baldassano, R. N., Faubion, W. A., Colletti, R. B., . . . Wang, Y. (2012). Safety and efficacy of adalimumab for moderate to severe Crohn's disease in children. Gastroenterology, 143(2), 365-374. e362.
Imai, K., & Ratkovic, M. (2014). Covariate balancing propensity score. Journal of the Royal Statistical Society: Series B (Statistical Methodology), 76(1), 243-263.
Jaisson-Hot, I., Flourie, B., Descos, L., & Colin, C. (2004). Management for severe Crohn's disease: A lifetime cost-utility analysis. International Journal of Technology Assessment in Health Care, 20(3), 274-279.
Jamshidian, M., Jalal, S. J., & Jansen, C. (2014). Missmech: an R package for testing homoscedasticity, multivariate normality, and missing completely at random (mcar). Journal of Statistical software, 56(6).
Janssen Inc. (2018). Remicade Product Monograph. Retrieved from http://www.janssen.com/canada/sites/www_janssen_com_canada/files/prod_files/live/remicade_cpm.pdf
Jean, L., Audrey, M., Beauchemin, C., & Consortium, o. b. o. t. i. (2018). Economic Evaluations of Treatments for Inflammatory Bowel Diseases: A Literature Review. Canadian Journal of Gastroenterology and Hepatology, 2018, 14. doi:10.1155/2018/7439730
Jørgensen, K. K., Olsen, I. C., Goll, G. L., Lorentzen, M., Bolstad, N., Haavardsholm, E. A., . . . Kvien, T. K. (2017). Switching from originator infliximab to biosimilar CT-P13 compared with maintained treatment with originator infliximab (NOR-SWITCH): a 52-week, randomised, double-blind, non-inferiority trial. The Lancet, 389(10086), 2304-2316.
Kang, B., Choi, S. Y., Kim, H. S., Kim, K., Lee, Y. M., & Choe, Y. H. (2016). Mucosal healing in paediatric patients with moderate-to-severe luminal Crohn’s disease under combined immunosuppression: escalation versus early treatment. Journal of Crohn's and Colitis, 10(11), 1279-1286.
Khanna, R., Bressler, B., Levesque, B. G., Zou, G., Stitt, L. W., Greenberg, G. R., . . . Vermeire, S. (2015). Early combined immunosuppression for the management of Crohn's disease (REACT): a cluster randomised controlled trial. The Lancet, 386(10006), 1825-1834.
281
Kierkus, J., Crandall, W., Hyams, J., Rosh, J., Markowitz, J., Baldassano, R., . . . Thakkar, R. (2013). Early response to treatment with adalimumab in children with moderately to severely active crohn's disease: Results from imagine 1. American Journal of Gastroenterology, 108, S621-S622.
Kierkuś, J., Iwańczak, B., Wegner, A., Dadalski, M., Grzybowska-Chlebowczyk, U., Łazowska, I., . . . Mierzwa, G. (2015). Monotherapy With Infliximab vs. Combo Therapy in the Maintenance of Clinical Remission in Children With Moderate to Severe Crohn's Disease-a Randomized Study. J Pediatr Gastroenterol Nutr.
Kim, M. J., Lee, J. S., Lee, J. H., Kim, J. Y., & Choe, Y. H. (2011). Infliximab therapy in children with Crohn's disease: a one-year evaluation of efficacy comparing 'top-down' and 'step-up' strategies. Acta Paediatr, 100(3), 451-455. doi:10.1111/j.1651-2227.2010.01938.x
Kuczmarski, R. J., Ogden, C. L., Grummer-Strawn, L. M., Flegal, K. M., Guo, S. S., Wei, R., . . . Johnson, C. L. (2000). CDC growth charts: United States. Advance data(314), 1-27.
Lahad, A., & Weiss, B. (2015). Current therapy of pediatric Crohn’s disease. World journal of gastrointestinal pathophysiology, 6(2), 33.
Lee, J., Biasci, D., Noor, N., McKinney, E., Ahmad, T., Lewis, N., . . . Smith, K. (2017). OC-044 Profile trial: predicting outcomes for Crohn’s disease using a molecular biomarker: BMJ Publishing Group.
Lee, Y. M., Kang, B., Lee, Y., Kim, M. J., & Choe, Y. H. (2015). Infliximab “top-down” strategy is superior to “step-up” in maintaining long-term remission in the treatment of pediatric Crohn disease. J Pediatr Gastroenterol Nutr, 60(6), 737-743.
Lee, Y. S., Baek, S. H., Kim, M. J., Lee, Y. M., Lee, Y., & Choe, Y. H. (2012). Efficacy of Early Infliximab Treatment for Pediatric Crohn's Disease: A Three-year Follow-up. Pediatr Gastroenterol Hepatol Nutr, 15(4), 243-249. doi:10.5223/pghn.2012.15.4.243
Leonor, R., Jacobson, K., Pinsk, V., Webber, E., & Lemberg, D. A. (2007). Surgical intervention in children with Crohn's disease. Int J Colorectal Dis, 22(9), 1037-1041. doi:10.1007/s00384-007-0281-3
Leyrat, C., Seaman, S. R., White, I. R., Douglas, I., Smeeth, L., Kim, J., . . . Williamson, E. J. (2017). Propensity score analysis with partially observed covariates: How should multiple imputation be used? Statistical methods in medical research, 0(0), 1-17
Lichtenstein, G. R. (2013). Comprehensive review: antitumor necrosis factor agents in inflammatory bowel disease and factors implicated in treatment response. Therapeutic advances in gastroenterology. doi:10.1177/
282
Lichtenstein, G. R., Hanauer, S. B., Sandborn, W. J., & Practice Parameters Committee of American College of, G. (2009). Management of Crohn's disease in adults. Am J Gastroenterol, 104(2), 465-483; quiz 464, 484. doi:10.1038/ajg.2008.168
Lichtenstein, G. R., Yan, S., Bala, M., Blank, M., & Sands, B. E. (2005). Infliximab maintenance treatment reduces hospitalizations, surgeries, and procedures in fistulizing Crohn’s disease. Gastroenterology, 128(4), 862-869.
Lindsay, J., Punekar, Y. S., Morris, J., & Chung-Faye, G. (2008). Health-economic analysis: cost-effectiveness of scheduled maintenance treatment with infliximab for Crohn's disease--modelling outcomes in active luminal and fistulizing disease in adults. Aliment Pharmacol Ther, 28(1), 76-87. doi:10.1111/j.1365-2036.2008.03709.x
Lipstein, E. A., Lovell, D. J., Denson, L. A., Moser, D. W., Saeed, S. A., Dodds, C. M., & Britto, M. T. (2013). Parents' information needs in tumor necrosis factor-alpha inhibitor treatment decisions. J Pediatr Gastroenterol Nutr, 56(3), 244-250.
Mamula, P., Grossman, A. B., Baldassano, R. N., Kelsen, J. R., & Markowitz, J. E. (2017). Pediatric inflammatory bowel disease (Third ed.): Springer.
Mamula, P., & Kelsen. (2012). Biologics for the treatment of moderate- to-severe ulcerative colitis in pediatric patients. Pediatric Health, Medicine and Therapeutics, 51. doi:10.2147/phmt.s24749
Mamula, P., Markowitz, J. E., Baldassano, R. N., Grossman, A. B., & Kelsen, J. R. (2008). Pediatric inflammatory bowel disease: Springer.
Marchetti, M., Liberato, N. L., Di Sabatino, A., & Corazza, G. R. (2013). Cost-effectiveness analysis of top-down versus step-up strategies in patients with newly diagnosed active luminal Crohn's disease. European Journal of Health Economics, 14(6), 853-861.
Martin-De-Carpi, J., Navas-Lopez, V., Navalon-Rubio, M., Llerena-Santa-Cruz, E., Ortega, D. G., Varea-Calderon, V., & Sierra-Salinas, C. (2014). Adalimumab as first-line anti-TNF treatment in pediatric crohn's disease. Gastroenterology, 1), S-780.
Middlesex-London Health Unit. (2016). TB Skin Tests and IGRAs. Retrieved from https://www.healthunit.com/tb-skin-testing-and-igra
Mitra, R., & Reiter, J. P. (2016). A comparison of two methods of estimating propensity scores after multiple imputation. Statistical methods in medical research, 25(1), 188-204.
Mrakotsky, C., Watson, C., Waber, D., Grand, R., & Rivkin, M. (2013). Gray matter volume, cognition, corticosteroids and inflammation: Further evidence of brain involvement in pediatric crohn's disease. Inflamm Bowel Dis, 19, S7.

283
National Institute of Health and Care Excellence. (2010). Infliximab (review) and adalimumab for the treatment of Crohn’s disease Technology assessment 187.
National Institute of Health and Care Excellence. (2016). Crohn's disease: management Retrieved from https://www.nice.org.uk/guidance/cg152/chapter/recommendations
Navas-Lopez, V. M., Blasco-Alonso, J., Giron-Fernandez-Crehuet, F., Serrano-Nieto, M. J., & Sierra-Salinas, C. (2013). Efficacy and safety of adalimumab in the treatment of Crohn's disease in children. [Eficacia y seguridad del adalimumab en el tratamiento de la enfermedad de Crohn infantil.]. Revista Espanola de Enfermedades Digestivas, 105(10), 579-584.
Norton, B.-A., Thomas, R., Lomax, K. G., & Dudley-Brown, S. (2012). Patient perspectives on the impact of Crohn’s disease: results from group interviews. Patient preference and adherence, 6, 509-520. doi:10.2147/PPA.S32690
Nuti, F., Alessandri, C., Dilillo, A., Civitelli, F., Aloi, M., Di Nardo, G., . . . Viola, F. (2013). Anti-TNF alpha therapy and mucosal healing: the key to change the story of pediatric Crohn's disease? Journal of Crohn's and Colitis, 7, S249.
Odes, S. (2008). How expensive is inflammatory bowel disease? A critical analysis. World Journal of Gastroenterology, 14(43), 6641. doi:10.3748/wjg.14.6641
Office of the Auditor General of Ontario. (2017). Ontario Ministry of Health and Long-Term Care Ontario Public Drug Programs, . Retrieved from http://www.auditor.on.ca/en/content/annualreports/arreports/en17/v1_309en17.pdf
Ontario Case Costing Initiative. (2017). OCCI Costing Analysis Tool. Retrieved from http://www.occp.com/mainPage.htm
Ontario Ministry of Health and Long-Term Care. (2007). Preventing and Managing Chronic Disease: Ontario’s Framework.
Ontario Ministry of Health and Long-Term Care. (2013). Schedule of Benefits and Fees. Retrieved from http://www.health.gov.on.ca/english/providers/program/ohip/sob/sob_mn.html
Ontario Ministry of Health and Long-Term Care. (2014a). Exceptional Access Program (2014). Retrieved from http://www.health.gov.on.ca/en/pro/programs/drugs/odbf/odbf_except_access.aspx
Ontario Ministry of Health and Long-Term Care. (2014b). Ontario drug benefit formulary/comparative drug index no. 42 (2014). Retrieved from http://www.health.gov.on.ca/en/pro/programs/drugs/odbf_mn.aspx
284
Ontario Ministry of Health and Long-Term Care. (2016a). 2015/16 Report Card for the Ontario Drug Benefit Program Retrieved from http://health.gov.on.ca/en/public/programs/drugs/publications/opdp/docs/odb_report_16.pdf
Ontario Ministry of Health and Long-Term Care. (2016b). E-formulary Infliximab Retrieved from https://www.formulary.health.gov.on.ca/formulary/limitedUseNotes.xhtml?pcg9Id=923600001
Ontario Ministry of Health and Long-Term Care. (2018a). Formulary Exceptional Accsess Program. Retrieved from http://health.gov.on.ca/en/pro/programs/drugs/odbf/odbf_except_access.aspx
Ontario Ministry of Health and Long-Term Care. (2018b). OHIP+: Children and Youth Pharmacare. Retrieved from http://www.health.gov.on.ca/en/pro/programs/drugs/ohipplus/
Ontario Ministry of Health and Long-Term Care. (2018c). Ontario Public Drug Programs, OHIP+: Children and Youth Pharmacare. Retrieved from http://www.health.gov.on.ca/en/pro/programs/drugs/ohipplus/
Pan, W., & Bai, H. (2015). Propensity score analysis: Fundamentals and developments: Guilford Publications.
Pandolfini, C., & Bonati, M. (2005). A literature review on off-label drug use in children. European Journal of Pediatrics, 164(9), 552-558.
Park, K. T., & Bass, D. (2011). Inflammatory bowel disease-attributable costs and cost-effective strategies in the United States: a review. Inflamm Bowel Dis, 17(7), 1603-1609. doi:10.1002/ibd.21488
Peake, S. T., Bernardo, D., Mann, E. R., Al-Hassi, H. O., Knight, S. C., & Hart, A. L. (2013). Mechanisms of action of anti-tumor necrosis factor alpha agents in Crohn's disease. Inflamm Bowel Dis, 19(7), 1546-1555. doi:10.1097/MIB.0b013e318281333b
Persley, K., Scherl, E., & Rubin, P. (2001). Avoidance of steroids by the early use of infliximab and 6-mercaptopurine in an adolescent with active Crohn's colitis. American Journal of Gastroenterology, 96(12), 3444-3445.
Peyrin-Biroulet, L., Deltenre, P., de Suray, N., Branche, J., Sandborn, W., & Colombel, J. (2008). Efficacy and safety of tumor necrosis factor antagonists in Crohn’s disease:meta-analysis of placebo-controlled trials. Clin Gastroenterol Hepatol, 6, 644-653.
285
Pillai, N., Dusheiko, M., Burnand, B., & Pittet, V. (2017). A systematic review of cost-effectiveness studies comparing conventional, biological and surgical interventions for inflammatory bowel disease. PloS one, 12(10), e0185500.
Present, D. H., Rutgeerts, P., Targan, S., Hanauer, S. B., Mayer, L., Van Hogezand, R., . . . DeWoody, K. L. (1999). Infliximab for the treatment of fistulas in patients with Crohn's disease. New England Journal of Medicine, 340(18), 1398-1405.
Punekar, Y. S., Sunderland, T., Hawkins, N., & Lindsay, J. (2010). Cost-effectiveness of scheduled maintenance treatment with infliximab for pediatric Crohn's disease. Value in health, 13(2), 188-195.
Raghunathan, T. E., Solenberger, P. W., & Van Hoewyk, J. (2002). IVEware: imputation and variance estimation software. Ann Arbor, MI: Survey Methodology Program, Survey Research Center, Institute for Social Research, University of Michigan.
Reinink, A. R., Gregory, M., Kymes, S., & Dassopoulos, T. (2011). Cost-effectiveness analysis of azathioprine vs. infliximab vs. combination therapy for Crohn's disease. Gastroenterology, 1), S175-S176.
Rocchi, A., Benchimol, E. I., Bernstein, C. N., Bitton, A., Feagan, B., Panaccione, R., . . . Ghosh, S. (2012). Inflammatory bowel disease: a Canadian burden of illness review. Canadian journal of gastroenterology= Journal canadien de gastroenterologie, 26(11), 811-817.
Rogler, G. (2013). Top-down or step-up treatment in Crohn's disease? Dig Dis, 31(1), 83-90. doi:10.1159/000347190
Rosenbaum, P. R., & Rubin, D. B. (1983). The central role of the propensity score in observational studies for causal effects. Biometrika, 70(1), 41-55.
Rubin, D. B. (2004). Multiple imputation for nonresponse in surveys (Vol. 81): John Wiley & Sons.
Rubin, D. T., Uluscu, O., & Sederman, R. (2012). Response to biologic therapy in Crohn's disease is improved with early treatment: an analysis of health claims data. Inflamm Bowel Dis, 18(12), 2225-2231. doi:10.1002/ibd.22925
Ruemmele, F., Veres, G., Kolho, K.-L., Griffiths, A., Levine, A., Escher, J., . . . Bronsky, J. (2014). Consensus guidelines of ECCO/ESPGHAN on the medical management of pediatric Crohn's disease. Journal of Crohn's and Colitis, 8(10), 1179-1207.
Ruemmele, F. M., Hyams, J. S., Otley, A., Griffiths, A., Kolho, K.-L., Dias, J. A., . . . Veres, G. (2014). Outcome measures for clinical trials in paediatric IBD: an evidence-based, expert-driven practical statement paper of the paediatric ECCO committee. Gut, gutjnl-2014-307008.
286
Rufo, P. A., Denson, L. A., Sylvester, F. A., Szigethy, E., Sathya, P., Lu, Y., . . . Faubion, W. A. (2012). Health supervision in the management of children and adolescents with IBD: NASPGHAN recommendations. J Pediatr Gastroenterol Nutr, 55(1), 93-108.
Rumman, A., Candia, R., Sam, J. J., Croitoru, K., Silverberg, M. S., Steinhart, A. H., & Nguyen, G. C. (2017). Public versus private drug insurance and outcomes of patients requiring biologic therapies for inflammatory bowel disease. Canadian Journal of Gastroenterology and Hepatology, 2017.
Rutgeerts, P., D'Haens, G., Targan, S., Vasiliauskas, E., Hanauer, S. B., Present, D. H., . . . DeWoody, K. L. (1999). Efficacy and safety of retreatment with anti–tumor necrosis factor antibody (infliximab) to maintain remission in Crohn's disease. Gastroenterology, 117(4), 761-769.
Rutgeerts, P., Diamond, R. H., Bala, M., Olson, A., Lichtenstein, G. R., Bao, W., . . . Colombel, J. F. (2006). Scheduled maintenance treatment with infliximab is superior to episodic treatment for the healing of mucosal ulceration associated with Crohn's disease. Gastrointestinal Endoscopy, 63(3), 433-442.
Sadowski, D. C., Bernstein, C. N., Bitton, A., Croitoru, K., Fedorak, R. N., & Griffiths, A. (2009). Canadian Association of Gastroenterology Clinical Practice Guidelines: The use of tumour necrosis factor-alpha antagonist therapy in Crohn's disease. Can J Gastroenterol, 23(3), 185-202.
Sandborn, W. J., Feagan, B. G., Stoinov, S., Honiball, P. J., Rutgeerts, P., Mason, D., . . . Schreiber, S. (2007). Certolizumab pegol for the treatment of Crohn's disease. New England Journal of Medicine, 357(3), 228-238.
Sandborn, W. J., Rutgeerts, P., Enns, R., Hanauer, S. B., Colombel, J.-F., Panaccione, R., . . . Kent, J. D. (2007). Adalimumab induction therapy for Crohn disease previously treated with infliximab: a randomized trial. Annals of internal medicine, 146(12), 829-838.
Sands, B. E., Anderson, F. H., Bernstein, C. N., Chey, W. Y., Feagan, B. G., Fedorak, R. N., . . . Onken, J. E. (2004). Infliximab maintenance therapy for fistulizing Crohn's disease. New England Journal of Medicine, 350(9), 876-885.
Schafer, J. L., & Graham, J. W. (2002). Missing data: our view of the state of the art. Psychological methods, 7(2), 147.
Schmier, J., Ogden, K., Nickman, N., Halpern, M. T., Cifaldi, M., Ganguli, A., . . . Garg, V. (2017). Costs of Providing Infusion Therapy for Rheumatoid Arthritis in a Hospital-based Infusion Center Setting. Clinical Therapeutics, 39(8), 1600-1617.
287
Schreiber, S., Khaliq-Kareemi, M., Lawrance, I. C., Thomsen, O. Ø., Hanauer, S. B., McColm, J., . . . Sandborn, W. J. (2007). Maintenance therapy with certolizumab pegol for Crohn's disease. New England Journal of Medicine, 357(3), 239-250.
Severs, M., Oldenburg, B., Van Bodegraven, A., Siersema, P., Mangen, M. J., Crohn’s, i. o., & Colitis. (2016). The economic impact of the introduction of biosimilars in inflammatory bowel disease. Journal of Crohn's and Colitis, 11(3), 289-296.
Sher, J. (2018). One specialist says OHIP-plus limits options for kids with Crohn's, colitis. . Retrieved from https://lfpress.com/2018/01/09/one-specialist-says-ohip-plus-limits-options-for-kids-with-crohns-colitis/wcm/f96f539e-ab37-02fe-6242-bfec216d410a
Shiroiwa, T., Sung, Y. K., Fukuda, T., Lang, H. C., Bae, S. C., & Tsutani, K. (2010). International survey on willingness-to-pay (WTP) for one additional QALY gained: what is the threshold of cost effectiveness? Health Economics, 19(4), 422-437.
Siebert, U., Alagoz, O., Bayoumi, A. M., Jahn, B., Owens, D. K., Cohen, D. J., . . . Force, I.-S. M. G. R. P. T. (2012). State-transition modeling: a report of the ISPOR-SMDM modeling good research practices task force-3. Value in health, 15(6), 812-820.
Siegel, C. A. (2010). What Options Do We Have for Induction Therapy for Crohn's Disease? Digestive Diseases (Basel, Switzerland), 28(3), 543-547. doi:10.1159/000320414
Spurio, F. (2012). Early Treatment in Crohn’s Disease: Do We Have Enough Evidence to Reverse the Therapeutic Pyramid? J Gastrointestin Liver Dis, 21(1), 67-73.
Standing Senate Committe on Social Affairs Science and Technology. (2014). Prescription Pharmaceuticals in Canada: Off Label Use. Retrieved from www.senate-senat.ca/social.asp
Statistics Canada. (2014). Average hourly wages of employees by selected characteristics and occupation, unadjusted data, by province (monthly) (Canada). Retrieved from http://www.statcan.gc.ca/tables-tableaux/sum-som/l01/cst01/labr69a-eng.htm
Statistics Canada. (2015). Statistics Canada, Consumer Price Index, health and personal care, CANSIM, table 326-0021 and Catalogue nos. 62-001-X and 62-010-X. Consumer Price Index. Retrieved from http://www.statcan.gc.ca
Steenholdt, C., Brynskov, J., Thomsen, O. Ø., Munck, L. K., Fallingborg, J., Christensen, L. A., . . . Oxholm, A. S. (2013). Individualised therapy is more cost-effective than dose intensification in patients with Crohn’s disease who lose response to anti-TNF treatment: a randomised, controlled trial. Gut, gutjnl-2013-305279.
Takeda Pharmaceutical Company Limited. (2016). Biologic treatment ENTYVIO™ (vedolizumab) approved by Health Canada to treat Crohn’s disease. Retrieved from
288
https://www.takeda.com/en-ca/newsroom/news-releases/2016/biologic-treatment-entyvio-vedolizumab-approved-by-health-canada-to-treat-crohns-disease/
Tang, D. H., Harrington, A. R., Lee, J. K., Lin, M., & Armstrong, E. P. (2013). A systematic review of economic studies on biological agents used to treat Crohn's disease. Inflamm Bowel Dis, 19(12), 2673-2694.
Tang, D. H., Harrington, A. R., Lee, J. K., Lin, M., & Armstrong, E. P. (2013). A systematic review of economic studies on biological agents used to treat Crohn’s disease. Inflamm Bowel Dis, 19(12), 2673-2694.
Targan, S. R., Hanauer, S. B., Van Deventer, S. J., Mayer, L., Present, D. H., Braakman, T., . . . Rutgeerts, P. J. (1997). A short-term study of chimeric monoclonal antibody cA2 to tumor necrosis factor α for Crohn's disease. New England Journal of Medicine, 337(15), 1029-1036.
Teitelbaum, J. E., Rajaraman, R. R., Jaeger, J., Para, S., & Rakitt, T. (2013). Correlation of health-related quality of life in children with inflammatory bowel disease, their parents, and physician as measured by a visual analog scale. J Pediatr Gastroenterol Nutr, 57(5), 594-597.
Tetteh, E. K., & Morris, S. (2014). Evaluating the administration costs of biologic drugs: development of a cost algorithm. Health economics review, 4(1), 26.
The Specialty Food Shop. (2017). The Specialty Food Shop Specialized Nutritional Needs. Retrieved from https://www.specialtyfoodshop.ca/products/specialized-nutritional-needs/energy-boosting/paediatric-plus-calories,-protein-fibre
Torres, J., Mehandru, S., Colombel, J.-F., & Peyrin-Biroulet, L. (2017). Crohn's disease. The Lancet, 389(10080), 1741-1755.
Tsui, J. J., & Huynh, H. Q. (2018). Is top-down therapy a more effective alternative to conventional step-up therapy for Crohn’s disease? Annals of gastroenterology, 413-413.
Tugwell, P., Bennett, K. J., Sackett, D. L., & Haynes, R. B. (1985). The measurement iterative loop: a framework for the critical appraisal of need, benefits and costs of health interventions. Journal of chronic diseases, 38(4), 339-351.
Turner, D., Griffiths, A. M., Walters, T. D., Seah, T., Markowitz, J., Pfefferkorn, M., . . . LeLeiko, N. S. (2012). Mathematical weighting of the pediatric Crohn's disease activity index (PCDAI) and comparison with its other short versions. Inflamm Bowel Dis, 18(1), 55-62.
Ungar, W., & Gerber, A. (2010). The uniqueness of child health and challenges to measuring costs and consequences. In W. Ungar (Ed.), Economic evaluation in child health (pp. 3-32). New York, NY Oxford University Press.
289
Ungar, W. J. (2010). Economic Evaluation in Child Health. New York, NY: Oxford University Press.
Ungar, W. J., & Witkos, M. (2005). Public drug plan coverage for children across Canada: a portrait of too many colours. Health Policy, 1(1), 100-122.
Uptodate. (2018a). Hydrocortisone (systemic): Pediatric drug information. Retrieved from https://www-uptodate-com.myaccess.library.utoronto.ca/contents/hydrocortisone-systemic-pediatric-drug-information?source=history_widget
Uptodate. (2018b). Mesalamine (mesalazine): Pediatric drug information. Retrieved from https://www.uptodate.com/contents/mesalamine-mesalazine-pediatric-drug-information?search=mesalazine&source=search_result&selectedTitle=2~62&usage_type=default&display_rank=2
Uptodate. (2018c). Methylprednisolone: Pediatric drug information. Retrieved from https://www-uptodate-com.myaccess.library.utoronto.ca/contents/methylprednisolone-pediatric-drug-information?search=methylprednisolone&source=search_result&selectedTitle=2~148&usage_type=default&display_rank=2
Uptodate. (2018d). Metronidazole (systemic): Pediatric drug information. Retrieved from Metronidazole (systemic): Pediatric drug information
Uptodate. (2018e). Rifaximin: Pediatric drug information. Retrieved from https://www.uptodate.com/contents/rifaximin-pediatric-drug-information?search=rifaximin&source=search_result&selectedTitle=2~34&usage_type=default&display_rank=2
Uptodate. (2018f). Sulfasalazine: Pediatric drug information. Retrieved from https://www.uptodate.com/contents/sulfasalazine-pediatric-drug-information?search=sulfasalazine&source=search_result&selectedTitle=2~148&usage_type=default&display_rank=2
van der Valk, M. E., Mangen, M.-J. J., Leenders, M., Dijkstra, G., van Bodegraven, A. A., Fidder, H. H., . . . Romberg-Camps, M. J. (2014). Healthcare costs of inflammatory bowel disease have shifted from hospitalisation and surgery towards anti-TNFα therapy: results from the COIN study. Gut, 63(1), 72-79.
Vande Casteele, N., Gils, A., Ballet, V., Compernolle, G., Peeters, M., Van Steen, K., . . . Vermeire, S. (2013). Randomised controlled trial of drug level versus clinically based dosing of infliximab maintenance therapy in IBD: final results of the TAXIT study. United European Gastroenterology Journal, 1(suppl. 1), A1.
290
Veereman, G., Escher, J. C., Ruemmele, F., Crandall, W., Lazar, A., Skup, M., . . . Hyams, J. S. (2013). Adalimumab treatment is associated with improved quality of life in pediatric crohn's disease. Gastroenterology, 1), S887.
Walters, T. D., Kim, M. O., Denson, L. A., Griffiths, A. M., Dubinsky, M., Markowitz, J., . . . Group, P.-K. R. (2014). Increased effectiveness of early therapy with anti-tumor necrosis factor-alpha vs an immunomodulator in children with Crohn's disease. Gastroenterology, 146(2), 383-391. doi:10.1053/j.gastro.2013.10.027
Whicher, D. M., Chalkidou, K., Dhalla, I. A., Levin, L., & Tunis, S. (2009). Comparative effectiveness research in Ontario, Canada: producing relevant and timely information for health care decision makers. Milbank Quarterly, 87(3), 585-606.
White, I. R., Royston, P., & Wood, A. M. (2011). Multiple imputation using chained equations: issues and guidance for practice. Statistics in Medicine, 30(4), 377-399.
Woods, B., Revill, P., Sculpher, M., & Claxton, K. (2016). Country-level cost-effectiveness thresholds: initial estimates and the need for further research. Value in health, 19(8), 929-935.
World Health Organization. (2010). International Statistical Classification of Diseases and Related Health Problems 10th Revision (ICD-10) Version for 2010. Retrieved from http://apps.who.int/classifications/icd10/browse/2010/en#/K50-K52
World Health Organization (WHO). (2001). Macroeconomics and health: investing in health for economic development-report of the commission on macroeconomics and health. Commission on Macroeconomics and Health.
Yang, L. S., Alex, G., & Catto-Smith, A. G. (2012). The use of biologic agents in pediatric inflammatory bowel disease. Curr Opin Pediatr, 24(5), 609-614. doi:10.1097/MOP.0b013e3283574154
Yoshida, K., Bohn, J., & Yoshida, M. K. (2017). Package ‘tableone’.
Yu, A. P., Johnson, S., Wang, S. T., Atanasov, P., Tang, J., Wu, E., . . . Mulani, P. M. (2009). Cost utility of adalimumab versus infliximab maintenance therapies in the United States for moderately to severely active crohns disease. Pharmacoeconomics, 27(7), 609-621.