Caribbean ACP countriesaei.pitt.edu/67514/1/Country_Profile_Caribbean_countries.pdf · Uganda....
200
eurostat Country profile Statistisches Bundesamt Caribbean ACP countries o BAHAMAS 0 BELIZE DOMINICAN HAITI REPUBLIC JAMAICA St KITTS and NEVIS O o ANTIGUA A. BARBUDA ( DOMINICA St LUCIA St VINCENT and the GRENADINES o Q BARBADOS O GRENADA O TRINIDAD AND TOBAGO SURINAME **• • • • • • •
Transcript of Caribbean ACP countriesaei.pitt.edu/67514/1/Country_Profile_Caribbean_countries.pdf · Uganda....
eurostat
Country profile Statistisches Bundesamt
Caribbean ACP countries
o BAHAMAS
0 BELIZE
DOMINICAN HAITI REPUBLIC
JAMAICA St KITTS and NEVIS O o
ANTIGUA A. BARBUDA
( DOMINICA
St LUCIA
St VINCENT and the GRENADINES o Q BARBADOS
O GRENADA
O TRINIDAD AND TOBAGO
SURINAME
* * • • • • • • •

Έί£ eurostat
Statistisches Bundesamt
Caribbean ACP countries
BAHAMAS
ΰ BELIZE Ό
DOMINICAN HAITI REPUBLIC
<3> SI KITTS and NEWS
O o ANTIGUA A. BARBUDA
-DOMINICA
n St LUCIA
St VINCENT and the GRENADINES o Q BARBADOS
O GRENADA
O TRINIDAD AND TOBAGO
GUYANA 1 S. ) SURINAME
* • • • • •
Statistisches Bundesamt Gustav-Stresemann-Ring 11, D-65180 Wiesbade and Eurostat, the Statistical Office of the European Communities Plateau de Kirchbers, L-2920 Luxembourg
in Cooperation with the Overseas Development Institute (ODI), London
Cataloguing data can be found at the end of this publication
The French version of this publication is available from the Office for Official Publications of the European Communities
The German version of this publication may be obtained from the publisher: Verlag Metzler-Poeschel, Stuttgart, Germany Delivery: Hermann Leins GmbH & Co. KG, Holzwiesenstraße 2, D-72125 Kusterdingen Tel.: (49-7071) 93 53 50; Fax: (49-7071) 336 53
All rights reserved. No part of this publication may be translated, reproduced or copied, recorded on microfilm/microfiche or stored in electronic systems without the explicit prior permission of the Federal Statistical Office
Luxembourg: Office for Official Publications of the European Communities, 1996 ISBN 92-827-6153-3 © ECSC-EC-EAEC, Brussels . Luxembourg, 1996
Printed in Belgium
Printed on non-chlorine bleached paper
C O N T E N T S
Page
Explanation of symbols 4
General abbreviations 5
List of tables 6
List of graphics 8
Foreword 9
Introduction 11
Maps and graphs 14
Selected basic indicators 18
1. Historial overview and future directions 30
2. Economic structure and development of the Caribbean ACP countries 35
3. Agriculture, forestry and fisheries 63
4. Industry 88
5. Tourism 96
6. Transport and communications 110
7. Money and credit 113
8. Public finance 119
9. Employment 123
10. Wages and salaries 125
11. Prices 128
12. Balance of payments 133
13. External trade 142
14. Foreign direct investment 156
15. Official development assistance 162
16. Foreign debt 174
17. Economic systems, economic policies and structural adjustment 181
Bibliography 188
StBa/Eurostat Caribbean ACP countries. 1995
EXPLANATION OF SYMBOLS
0 = Less than half of 1 at the last occupied digit, but
more than nil
= Magnitude zero
1 = General break in the series affecting comparison over time
= Figure unknown
χ = Tabular group blocked, because information is not meaningful
n.a. = data not available
SELECTED INTERNATIONAL WEIGHTS AND MEASURES
1 inch (in) 1 foot (ft) 1 yard (yd) 1 mile (mi) 1 acre (ac) 1 cubic foot (ft3). 1 gallon (gal.)....
2.540 cm 0.305 m 0.914 m
1.609 km 4 047 m2
28.317 dm3
3.785 1
1 imperial gallon (imp. gal.).. = 4.546 1 I ban-el (bl.) = 158.983 1 I ounce (oz) = 28.350 g I troy ounce (troy oz) = 31.103g 1 pound (lb) = 453.592 g 1 short ton (sh t) = 0.907 t 1 long ton (1 t) = 1.016 t
StBa/Eurostat Caribbean ACP countries. 1995
GENERAL ABBREVIATIONS
O ir kg dt t mm cm m km m2
ha km2
1 hl ni3 tkm GRT tdw
ECS BS BDSS BzS dom$ GS Gde. J$ Sf TT$ bfr lfr dkr FF DM Dr. Fmk
= = = = = = = = = = = = = = = = =
= = = = = = = = = = = = = = = = =
gram kilogram quintal (100 kg) tonne (1 000 kg) millimetre centimetre metre kilometre square metre hectare (10 000 m2) square kilometre litre hectolitre (100 1) cubic metre tonne-kilometre gross registered tonne tonnes dead-weight ( t= 1 016.05 kg) East Caribbean dollar Bahamian dollar Barbados dollar Belize dollar Dominican Republic peso Guyana dollar Gourde Jamaican dollar Suriname guilder Trinidad and Tobago dollar Belgian franc Luxembourg franc Danish krone French franc German mark drachma Finnish markka
Ft ir£ Lit hfl Esc Pta K.Sh. mcxNS B £ USS SDR WE h kW kWh MW MWh GW GWh St Ρ Mill. Bn A p.a. YB YM YE YE Qrt. HY MA cif fob
= = = = = = = = = = = = = = = = = = = = = = = = = = = = = = = = = = =
Hungarian florint Irish punt Italian lira Dutch guilder escudo peseta Kenyan shilling New Mexican peso Thai Baht pound sterling US dollar Special Drawing Rights Currency unit hour kilowatt (103 watts) kilowatt-hour (103 watt-hours) megawatt ( 106 watts) megawatt-hour ( 106 watt-hours) gigawatt (109 watts) gigawatt-hour (109 watt-hours) piece pair million billion (thousand million) average per annum beginning of year mid-year year-end annual average quarter half-year monthly average cost, insurance, freight included free on board
Special abbreviations are allocated to the respective sections. With only a few exceptions, provisional, revised and estimated figures are not marked as such. Detail may not add to total because of rounding.
StBa/Eurostat Caribbean ACP countries, 1995
LIST OF TABLES
Page
2 Economic structure and development of the Caribbean ACP countries 2.1 Regional gross domestic product by the Caribbean ACP countries
at market prices in 1987 prices 36 2.2 Annual average growth in gross domestic product by the Caribbean ACP
countries at market prices in 1987 prices 38 2.3 Development of gross domestic product at market prices 53 2.4 Generation of gross domestic product at factor cost 57 2.5 Use of gross domestic product 60
3 Agriculture, forestry and fisheries 3.1 Banana production and sugar production in selected Caribbean ACP
countries 67 3.2 Land use 1992 76 3.3 Machines and equipment 77 3.4 Use of fertilizers 1992 77 3.5 Index of agricultural production 78 3.6 Areas under selected crops, yields and harvest volumes in 1985 and 1993 .. 79 3.7 Livestock population and slaughterings in 1985 and 1993 82 3.8 Production of selected animal products in 1985 and 1993 84 3.9 Timber-felling in 1985 and 1992 86
3.10 Number of fishing vessels 87 3.11 Total catches 87
4 Industry 4.1 Installed capacity of power stations, generation and consumption of
electricity 88 4.2 Consumption of selected petroleum products in 1992 88 4.3 Mining and quarrying 89 4.4 Production of selected products of manufacturing industry 91
5 Tourism 5.1 Foreign visitors by selected country of origin 103 5.2 Foreign visitors by purpose of trip in 1989 and 1992 106 5.3 Tourists arriving on cruise ships 107 5.4 Rooms in establishments providing accommodation 107 5.5 Room capacity utilization rate 108 5.6 Average length of stay 108 5.7 Net foreign currency receipts from tourism 109
StBa/Eurostat Caribbean ACP countries, 1995
Page
6 Transport and communications 6.1 Length of road network, number of motor vehicles and car density 110 6.2 Shipping fleet 110 6.3 Communications 111
7 Money and credit 7.1 Exchange rates 114 7.2 Exchange rates for the European Currency Unit (ECU) 114 7.3 Gold and foreign exchange reserves, Special Drawing Rights 116 7.4 Cash in circulation and money supply 117
8 Public finance 8.1 Central government budget revenue and expenditure 119
9 Employment 9.1 Economically active population and activity rates by age group 123 9.2 Working population by branch of economic activity 124 9.3 Strikes and lockouts 124
10 Wages and salaries 10.1 Minimum earnings for persons in employment by selected occupation 125
11 Prices 11.1 General cost-of-living index 128 11.2 Cost-of-living index 128
12 Balance of payments 12.1 Current account balances 134 12.2 Shares of merchandise exports, exports of travel services in current
receipts and the ratio of foreign direct investment to current receipts 136 12.3 Balance of payments 137
13 External trade 13.1 Geographical destination of ACP Caribbean exports, 1992-1993 144 13.2 Geographical origin of ACP Caribbean exports, 1992-1993 145 13.3 ACP Caribbean exports, shares by broad categories 148 13.4 Commodity composition of trade with the EU, average 1992-93, by
commodity group 149 13.5 Share of selected products in exports to the European Union 151 13.6 Trade in services: balances, total, transport and travel 153
StBa/Eurostat Caribbean ACP countries, 1995
Page
14 Foreign direct investment 14.1 Net inflows of foreign direct investment 156 14.2 Foreign direct investment and gross investment 160
15 Official development assistance 15.1 Development assistance flows to the Caribbean region 162 15.2 Total resources allocated to the ACP Caribbean under successive
European Development Funds 169 15.3 EDF payments by principal instrument 170 15.4 Loans signed by the European Investment Bank 172
16 Foreign debt 16.1 Long-term debt 176 16.2 Debt-service and present value of debt-service ratios, 1991-93
average, based on World Bank estimates 177 16.3 Structure of foreign debt, 1993 179
17 Economic systems, economic policies and structural adjustment 17.1 Real effective exchange rates 183
L I S T OF G R A P H I C S
Page
2.1 Caribbean ACP countries: Development of regional gross domestic product at market prices (in 1987 prices) 37
3.1 Banana production in selected Caribbean ACP countries. 1988-1993 69 3.2 Sugar production in selected Caribbean ACP countries 72 5.1 Total number of foreign visitors and foreign visitors per 1 000 inhabitants
in 1993 97 5.2 Net foreign currency receipts from tourism - total and per capita in 1993 ... 100 7.1 Growth in the M2 money supply. 1994: % change on previous year 1 17
11.1 Cost-of-living index 1993: % change on previous year 132 13.1 Total merchandise exports and imports of the ACP Caribbean countries
by geographical destination and origin, 1992-9193 143 14.1 Net inflows of foreign direct investment to the ACP Caribbean countries,
1987-1993 157 15.1 Total development assistance flows (net) to the ACP Caribbean countries,
1980-1993 166 16.1 Long-term debt and its ratio to GDP of the ACP Caribbean countries,
1993 175
StBa/Eurostat Caribbean ACP countries, 1995
F O R E W O R D
For some years now, the Statistisches Bundesamt and Eurostat have collaborated successfully in producing reports on developing countries, and this country profile on the Caribbean ACP countries continues the tradition. One of the key features of this partnership regarding statistics on foreign countries is the compilation of country reports on what are known as the ACP (African, Caribbean and Pacific) countries, with which the European Union conducts a particularly close form of economic and development cooperation under the Lomé Agreement. Having focused initially on individual countries, as reflected in the publication of profiles on African countries (Zimbabwe, Togo. Uganda. Namibia and Cameroon), the two statistical offices have recently adopted a new approach. In 1994, they published their first joint regional study on the 'Maghreb Countries' which formed the Union of the Arab Maghreb in 1989. By dealing with groups of countries, Eurostat and the Statistisches Bundesamt aim to take fuller account of the trend towards the formation of regional economic blocks, a pattern which can also be observed among the developing countries.
This statistical report on the Caribbean ACP countries is another step in that direction, as it deals with the 15 Caribbean countries which have signed the Lome Agreement. It particularly focuses on important aspects concerning the Caribbean Community or Caricom, to which 13 of these countries belong and whose principal aims arc to strengthen economic integration and develop a common trade and external tariff policy. In addition to analysing the regional economy, this regional profile also spotlights the structure of each country's domestic economy as well as their trade links and economic exchanges with the European Union and the recently-established North American Free Trade Area, NAFTA.
The publication of this regional profile on the Caribbean ACP countries in English, French and German should make it accessible to a broad international readership. The primary purpose of the profile is to arouse European business interest in an area of the globe which offers considerable potential for closer economic cooperation in the future, cooperation extending beyond the former colonial tics which link the area with a number of EU countries. For the Gemían economy in particular, which is strongly export-oriented and owes much of its international standing to its ability to identify and open up new markets, this profile provides information on potentially profitable trade and investment opportunities in the Caribbean.
StBa/Eurostat Caribbean ACP countries. 1995
Following this report on the Caribbean ACP countries. Eurostat and the Statistisches Bundesamt plan to publish in the near future the results of their next joint venture in statistics on foreign countries - a regional study on the Pacific ACP countries.
Wiesbaden, June 1995 Luxembourg, June 1995
The President of the The Director-General of the Statistisches Bundesamt Statistical Office of the European Union
Hans Günther Merk Yves Franchet
StBa/Eurostat 10 Caribbean ACP countries. 1995
I N T R O D U C T I O N
The spotlight for the country profiles published in the 'Statistik des Auslandes' series has been moved back onto groups of countries, and this regional profile on the Caribbean ACP countries in 1995 focuses on the 15 Caribbean countries with which the European Union conducts a wide range of economic and development cooperation policies under the Lomé Agreement. These 15 countries are Antigua and Barbuda, the Bahamas, Barbados, Belize, Dominica, the Dominican Republic, Grenada, Guyana, Haiti, Jamaica, Suriname, St Kitts and Nevis, St Lucia, St Vincent and the Grenadines, and Trinidad and Tobago. Given that twelve of these countries (along with Montserrat) make up the Caribbean Economic Community or Caricom, founded in July 1973, this regional profile examines not just the development of the individual countries but extends its analysis to cover economic aspects concerning this community. Another good reason for looking at specific Caricom issues is that the three non-Caricom members (the Dominican Republic, Haiti and Suriname) all have observer status and enjoy close economic relations with the Caricom Member States.' Up until now, however, these three countries have been unable to achieve the same level of free trade with each other or with the Caricom countries as those within the economic community, nor do they participate in Caricom's Common External Tariff (CET). The reasons why no data are generally given for Caricom member Montserrat are that up-to-date statistics are not available in many cases and because, as a British Dependent Territory, Montserrat is neither independent nor an ACP State.
Another organization of some importance which has been taken into consideration where appropriate is the Organization of Eastern Caribbean States (OECS) comprising the smaller island nations of Antigua and Barbuda, Dominica, Grenada, St Kitts and Nevis, St Lucia and St Vincent and the Grenadines (plus Montserrat) united under a common central bank. Analyzing OECS data made sense not just from the point of view of content but also for the sake of clarity and the need to compile partial aggregates, since it was not always possible or desirable to present data on all 15 countries. Another good reason for adopting a joint approach was the fact that there are strong similarities between these island nations in terms of their economic structure. Montserrat has also been omitted from the OECS data.
This regional profile on the Caribbean ACP countries in 1995 adopts an eclectic approach, whose main purpose is to highlight features which are specific both to the region and to the individual countries. The emphasis is not therefore on dealing with the gamut of economic and social aspects, but on presenting the salient features and problems of the economy in the area, the most striking differences between the countries and the most important external relations for most of the countries in the Caribbean, particularly those with the European
Shortly before this profile went to press, it was learned that Suriname has now also become a ful member of Caricom. Due to a shortage of time, however, Suriname could not be included in the presentation of statistical material dealing with Caricom as a whole.
StBa/Eurostat Caribbean ACP countries. 1995
Union and North America. Only in cases where this was associated with far-reaching economic consequences, or more advanced analytical considerations so dictated, were identifiable similarities or common structural characteristics and patterns of development presented on a country-by-country basis.
The profile begins with a short historical overview and prognosis as to future developments, followed by an analysis of the economic structure and development of the whole area and the 15 countries. There then follows an analysis of various sectors of the national economics, the emphasis being on agriculture, forestry and fisheries (particularly bananas and sugar) and tourism, which are central to the economic life of most of these countries. The analysis of external relations focuses on the development of foreign trade, foreign direct investment, development aid and the foreign debt situation. The profile closes with an examination of the economic systems of the Caribbean ACP countries and the economic policies they pursue. There is also a special section entitled 'Selected basic indicators', which offers a comprehensive inter-country comparison on the basis of key economic, demographic and social data. This section also includes data on several countries from other parts of the world so that the reader can compare how the Caribbean countries rank internationally in terms of development.
The Statistisches Bundesamt was responsible for the chapters on the regional economics, whilst Eurostat contracted the Overseas Development Institute (ODI) in London to write the chapters on foreign economic affairs (inch the chapter on the balance of payments).
The regional profile on the Caribbean ACP countries in 1995 was mainly based on international statistics, since current official data from the national organizations were often not available or were not appropriate for inter-country comparisons. Despite the fact that a number of international statistical collections were used, up-to-date statistical material was not always available for all the countries in the region. Whilst the gaps in the range of data available for Haiti were particularly large, the statistics on some other countries such as Antigua and Barbuda, Grenada and Suriname were also often far from complete. In view of the predominant use of international statistics, it is possible that the figures diverge from those in the corresponding individual country reports on the Caribbean countries, as the latter relied much more heavily at times on national sources. More detailed methodological explanations and definitions giving a better idea of the statistics used can be found in the relevant chapters of this profile, whilst the Bibliography at the end contains information on the statistics and background material used as references.
The Information Service of the Berlin branch of the Statistisches Bundesamt will bc happy to assist users seeking the original sources, figures on the Caribbean ACP countries in a more detailed breakdown by subject or over time, or further information on the bases used for the calculations. More detailed information on the statistics used can also be received from the Statistical Office of the European Union (Eurostat) in Luxembourg.
StBa/Eurostat Caribbean ACP countries. 1995
The maps in this report have been provided solely for illustrative purposes and had to be simplified substantially in order to give a general picture of the Caribbean region, which is made up of numerous small groups of islands and territorial units. In using the designations and borders shown, the Statistisches Bundesamt and Eurostat are not passing judgment on the legal status of any of the territories or confirming or recognizing any borders. With some justifiable exceptions, standard international spellings are used for the geographical designations. They may, therefore, diverge slightly from atlases published in the English-speaking world.
The unification of Germany took place with effect from 3 October 1990 when the German Democratic Republic joined the Federal Republic of Germany. Figures given for the whole of Germany within its territorial boundaries since 3 October 1990 arc said to relate to 'Germany'. The designation used for the Federal Republic of Germany within its territorial boundaries up to 3 October 1990 is the 'former territory of the Federal Republic'.
StBa/Eurostat Caribbean ACP countries. 1995
UNITED STATES
Gulf oi Mexico Q THE BAHAMAS
CARIBBEAN ACP COUNTRIES POPULATION DENSITY IN 1995
AND POPULATION GROWTH
FOR 1990/95 A
JAMAICA
Caribbean Sea
COLOMBIA
ANNUAL POPULATION GROWTH
FOR 1990/95 A In %
n "n
cr'
3
f ( }
ΤΙ η
α D
rõ' ΕΛ
\ο ν> CJ1
00
» & c
ο
Antigua ard Barbuda
Bahamas
Barbados
Belize
Dominica
Dominican Rep.
Grenada
Guyana
Haiti
Jamaica
St Kitts and Nevis
St Lucia
St Vincent and Gr.
Suriname
Trinidad and Tobago
Total
C
I
I
b I
3
Η ι
ι = ) >■:■:■:■:■:;»■;■: v f W j
ι
£ 1 POPULATION DENSITY
(Inhabitants per km2)
Antigua and Barbuda
Bahamas
Barbados
Belize
Dominica
Dominican Rep.
Grenada
Guyana Haiti
Jamaica
St Kitts and Nevis
St Lucia
St Vincent and Gr.
Suriname
Trinidad and Tobago
Total
ATLANTIC OCEAN DOMINICAN
. REPUBLIC
H A I T I A ) ^ V „ 1 ( \ PUERTO RICO (part oí U S )
U ST KITTS AND NEVIS O O ANTIGUA AND BARBUDA
O MONTSERRAT
DOMINICA
O ST LUCIA
ST. VINCENT AND O n BARBADOS THE GRENADINES
n GRENADA
1 1
J
1
1
1
' 1
1
1
1
1
1
M
1
< J J TRINIDAD AND TOBAGO
0 100 200 300 400 500 600 700 Statistisches Bundesamt 95 0203 Β
n Oi CT CT
EU
D
> f l 13
o o c: 3
ΕΛ
_ O
00
δ 03
t í c f i C/5
UNITED STATES
Gulf of Mexico Q THE BAHAMAS
DOMINICAN
REPUBLIC
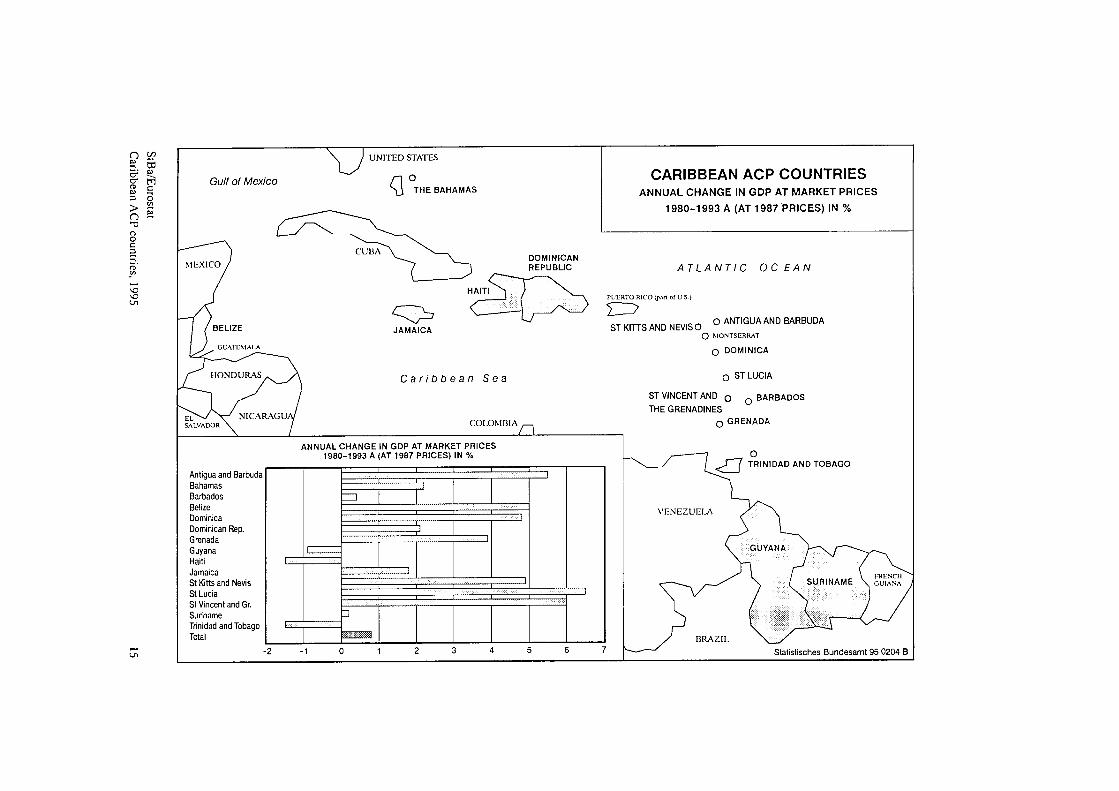
ANNUAL CHANGE IN GDP AT MARKET PRICES 1980-1993 A (AT 1987 PRICES) IN %
Antigua and Barbuda
Bahamas
Barbados
Belize
Dominica
Dominican Rep.
Grenada
Guyana
Haiti
Jamaica
St Kitts and Nevis
St Lucia
St Vincent and Gr.
Suriname
Trinidad and Tobago
Total
CARIBBEAN ACP COUNTRIES ANNUAL CHANGE IN GDP AT MARKET PRICES
1980-1993 A (AT 1987 PRICES) IN %
ATLANTIC OCEAN
PUERTO RICO (part of U.S.)
ST KITTS AND NEVISO O ANTIGUA AND BARBUDA
O MONTSERRAT
O DOMINICA
O ST LUCIA
O THE GRENADINES
O GRENADA
zu
zi
<J~n TRINIDAD AND TOBAGO
Statistisches Bundesamt 95 0204 B
> n Ό r¡ υ c 3
£Λ
\r> ^ Ln
oo C3
c
Crt
ü
UNITED STATES
Gulf of Mexico Q THE BAHAMAS
DOMINICAN
REPUBLIC
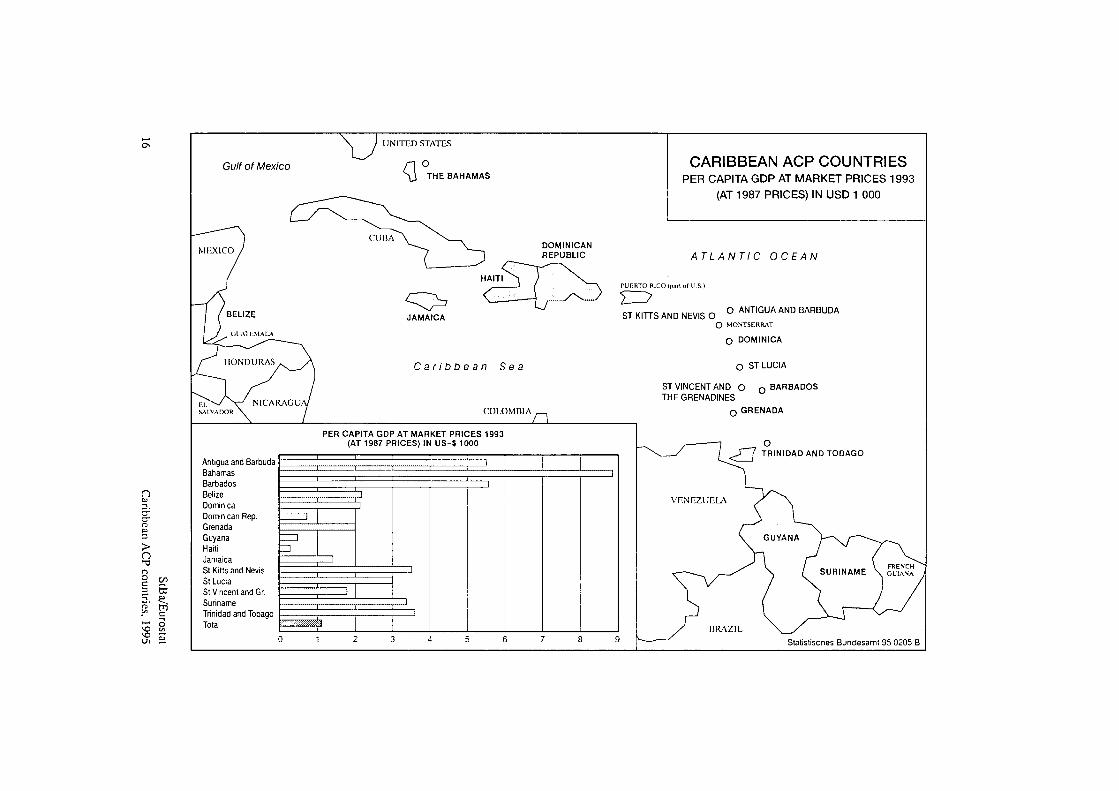
PER CAPITA GDP AT MARKET PRICES 1993 (AT 1987 PRICES) IN U S Í 1000
Antigua and Barbuda
Bahamas
Barbados
Belize
Dominica
Dominican Rep.
Grenada
Guyana
Haiti
Jamaica
St Kitts and Nevis
St Lucia
St Vincent and Gr.
Suriname
Trinidad and Tobago
Total
H
CARIBBEAN ACP COUNTRIES PER CAPITA GDP AT MARKET PRICES 1993
(AT 1987 PRICES) IN USD 1 000
ATLANTIC OCEAN
PUERTO RICO (part of U S )
ST KITTS AND NEVIS O O ANTIGUA AND BARBUDA
O MONTSERRAT
O DOMINICA
O ST LUCIA
ST VINCENT AND O n BARBADOS
THE GRENADINES
n GRENADA
J 7 TRINIDAD AND TOBAGO
Statistiscnes Bundesamt 95 0205 Β
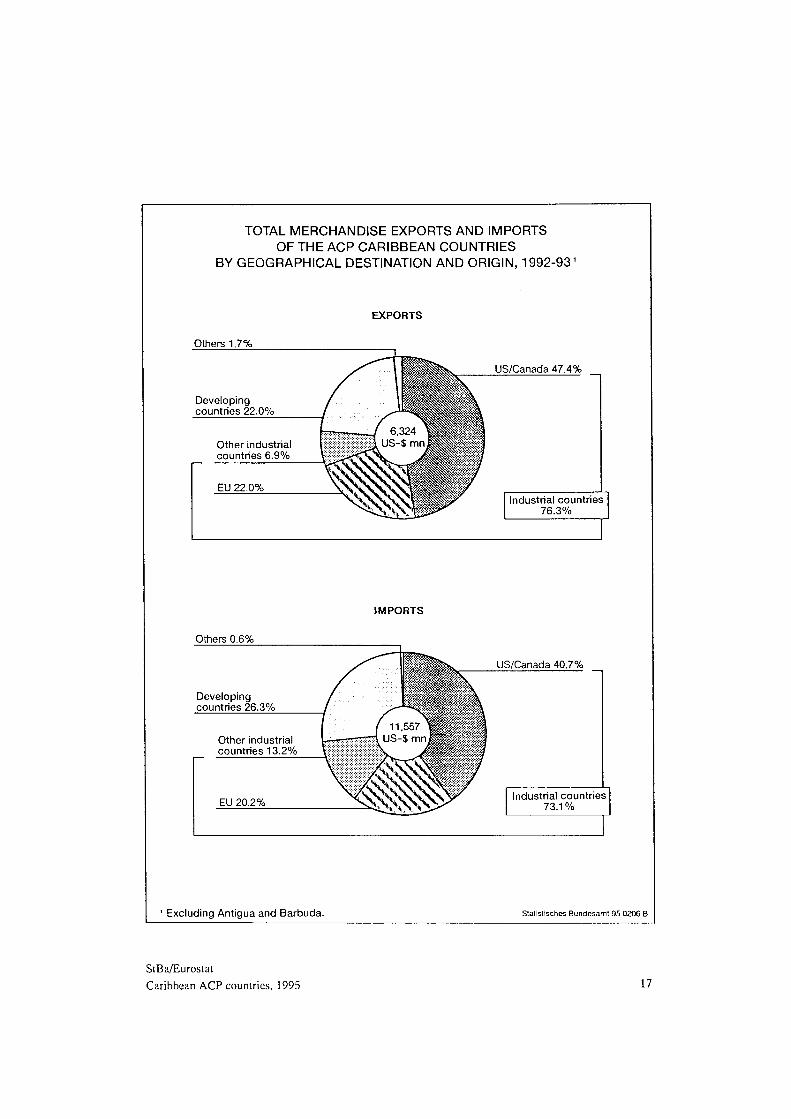
TOTAL MERCHANDISE EXPORTS AND IMPORTS OF THE ACP CARIBBEAN COUNTRIES
BY GEOGRAPHICAL DESTINATION AND ORIGIN, 1992-931
Others 1.7%
Developing countries 22.0%
Other industrial countries 6.9%
EU 22.0%
Others 0.6%
Developing countries 26.3%
EU 20.2%
EXPORTS
US/Canada 47.4%
Industrial countries 76.3%
IMPORTS
Other industrial countries 13.2%
US/Canada 40.7%
Industrial countries 73.1 %
' Excluding Antigua and Barbuda. Statistisches Bundesamt 95 0206 Β
StBa/Eurostat Caribbean ACP countries, 1995 17
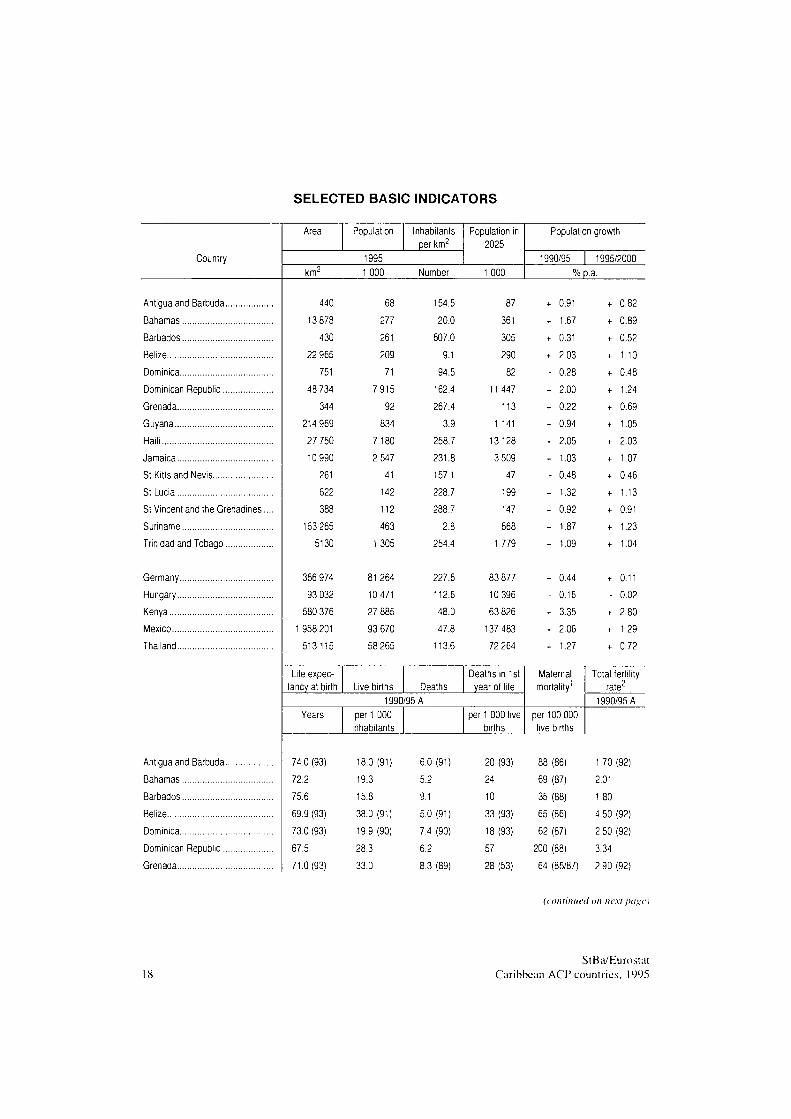
SELECTED BASIC INDICATORS
Country
Area Population Inhabitants
per km2
1995
Population in
2025
knr 1000 Number 1 000
Population growth
1990/95 1995/2000
% p.a.
Antigua and Barbuda
Bahamas
Barbados
Belize
Dominica
Dominican Republic
Grenada
Guyana
Haiti
Jamaica
St Kitts and Nevis
St Lucia
St Vincent and the Grenadines.
Suriname
Trinidad and Tobago
Germany
Hungary
Kenya
Mexico
Thailand
Antigua and Barbuda.
Bahamas
Barbados
Belize
Dominica
Dominican Republic..
Grenada
440
13 878
430
22 965
751
48 734
344
214 969
27 750
10 990
261
622
388
163 265
5130
356 974
93 032
580 376
1958 201
513115
277
261
209
71
7915
92
834
7 180
2 547
41
142
112
463
1 305
81264
10 471
27 885
93 670
58 265
154.5
20.0
607.0
9.1
94.5
162.4
267.4
3.9
258.7
231.8
157.1
228.7
288.7
2.8
254.4
227.6
112.6
48.0
47.8
113.6
87
361
305
290
82
11 447
113
1 141
13128
3 509
47
199
147
668
1 779
83 877
10 396
63 826
137 483
72 264
0.91
1.67
0.31
2.03
0.28
2.00
0.22
0.94
2.05
1.03
0.48
1.32
0.92
1.87
1.09
0.44
0.16
3.35
2.06
1.27
0.82
0.89
0.52
1.10
0.48
1.24
0.69
1.05
2.03
1.07
0.46
1.13
0.91
1.23
1.04
0.11
0.02
2.80
1.29
0.72
Life expec
tancy at birth Live births Deaths
Deaths in 1st
year ol life
1990/95 A
Years per 1 000
inhabitants
per 1 000 live
births
Maternal
mortality'
per 100 000
live births
Total fertility
rate2
1990/95 A
74.0 (93)
72.2
75.6
69.9 (93)
73.0 (93)
67.5
71.0(93)
18.0 (91)
19.3
15.8
38.0 (91)
19.9 (90)
28.3
33.0
6.0 (91)
5.2
9.1
5.0 (91)
7.4 (90)
6.2
8.3 (89)
20 (93)
24
10
33 (93)
18 (93)
57
28 (53)
88 (86)
69 (87)
35 (88)
65 (86)
62 (87)
200 (88)
64 (85/87)
1.70(92)
2.01
1.80
4.50 (92)
2.50 (92)
3.34
2.90 (92)
(continued on nc.M ¡ιιιχνί
StBa/Eurostat Caribbean A C P countries. 1995
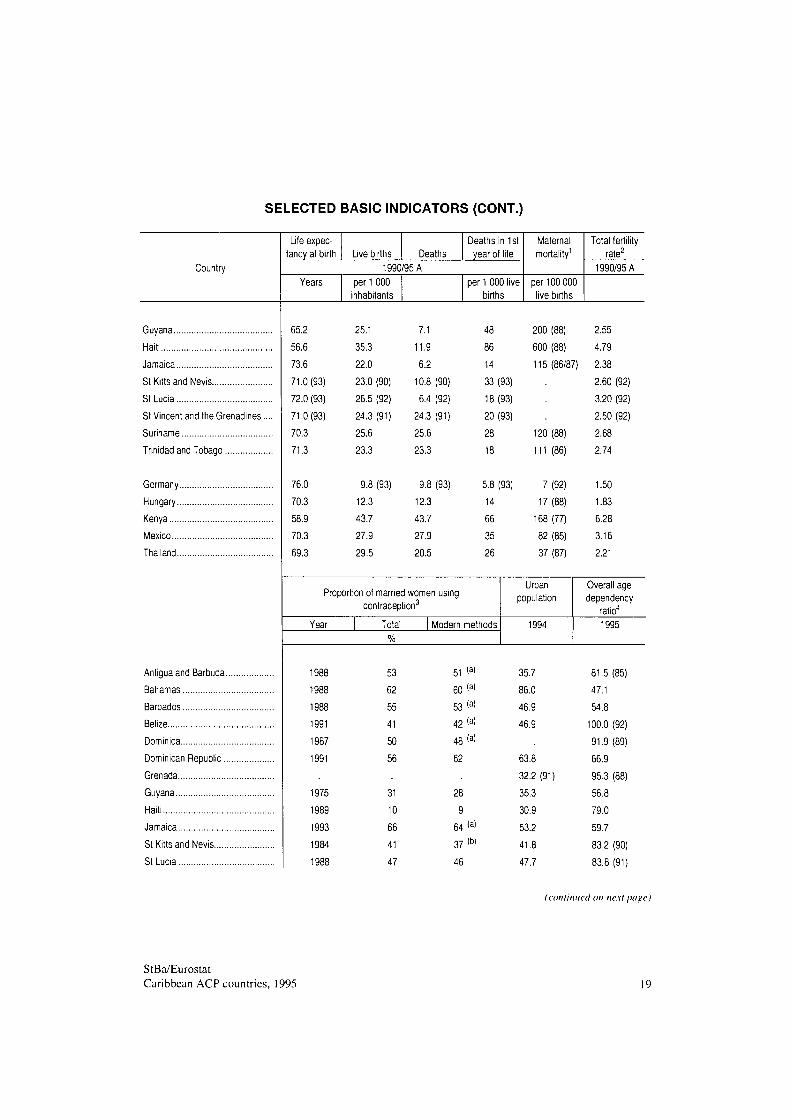
SELECTED BASIC INDICATORS (CONT.)
Country
Life expec-tancy at birth Live births Deaths
Deaths in 1st year of life
1990/95 A Years per 1 000
inhabitants per 1 000 live
births
Maternal mortality1
per 100 000 live births
Total fertility rate2
1990/95 A
Guyana
Haiti
Jamaica
St Kitts and Nevis
St Lucia
St Vincent and the Grenadines.
Suriname
Trinidad and Tobago
Germany
Hungary
Kenya
Mexico
Thailand
Antigua and Barbuda.
Bahamas
Barbados
Belize
Dominica
Dominican Republic.
Grenada
Guyana
Haiti
Jamaica
St Kitts and Nevis
St Lucia
65.2
56.6
73.6
71.0(93)
72.0 (93)
71.0(93) 70.3 71.3
76.0
70.3
58.9
70.3
69.3
25.1
35.3
22.0
23.0 (90)
26.5 (92)
24.3 (91)
25.6
23.3
7.1
11.9
6.2
10.8 (90)
6.4 (92)
24.3 (91)
25.6
23.3
9.8 (93) 9.8 (93)
12.3 12.3
43.7 43.7
27.9 27.9
29.5 20.5
86
14
33 (93)
18 (93)
20 (93)
28
18
5.8 (93)
14
66
35
26
200 (88)
600 (88)
115(86/87)
120 (88)
111 (86)
7(92)
17 (88)
168 (77)
82 (85)
37 (87)
Proportion of married women using contraception3
Year Total Modern methods
Urban population
1994
1988
1988
1991
1987
1991
1975
1989
1993
1984
1988
53
62
55
41
50
56
31 10 66 41 47
51<a>
60<a>
53 <a»
42(a)
48 (a)
62
28
9
6 4 (a)
37(b)
46
35.7
86.0
46.9
46.9
63.8
32.2 (91)
35.3
30.9 53.2 41.8
47.7
2.55
4.79
2.38
2.60 (92)
3.20 (92)
2.50 (92)
2.68
2.74
1.50
1.83
6.28
3.16
2.21
Overall age dependency
ratio4
1995
81.5 (85)
47.1
54.8
100.0 (92)
91.9 (89)
66.9
95.3 (88)
56.8
79.0
59.7
83.2 (90)
83.8 (91)
(continued on next page)
StBa/Eurostat Caribbean ACP countries, 1995 19
SELECTED BASIC INDICATORS (CONT.)
Country
Proportion of married women using contraception3
Year Total Modern methods
Urban population
1994
Overall age dependency
ratio4
1995
St Vincent and the Grenadines.
Suriname
Trinidad and Tobago
Germany
Hungary
Kenya Mexico
Thailand
Antigua and Barbuda
Bahamas
Barbados
Belize
Dominica
Dominican Republic
Grenada
Guyana
Haiti
Jamaica
St Kitts and Nevis
St Lucia
St Vincent and the Grenadines.
Suriname
Trinidad and Tobago
1987
1992 1986 1993 1987 1987
58
58
75 73 33 53 66
55 Ia'
44
72 (c) 62«» 28 45(a) 64
45.8 49.7 71.3
86.3 64.1 26.8 74.8 19.7
81.5 (85) 62.7 65.2
46.1 (93) 47.7 101.4 66.8 50.8
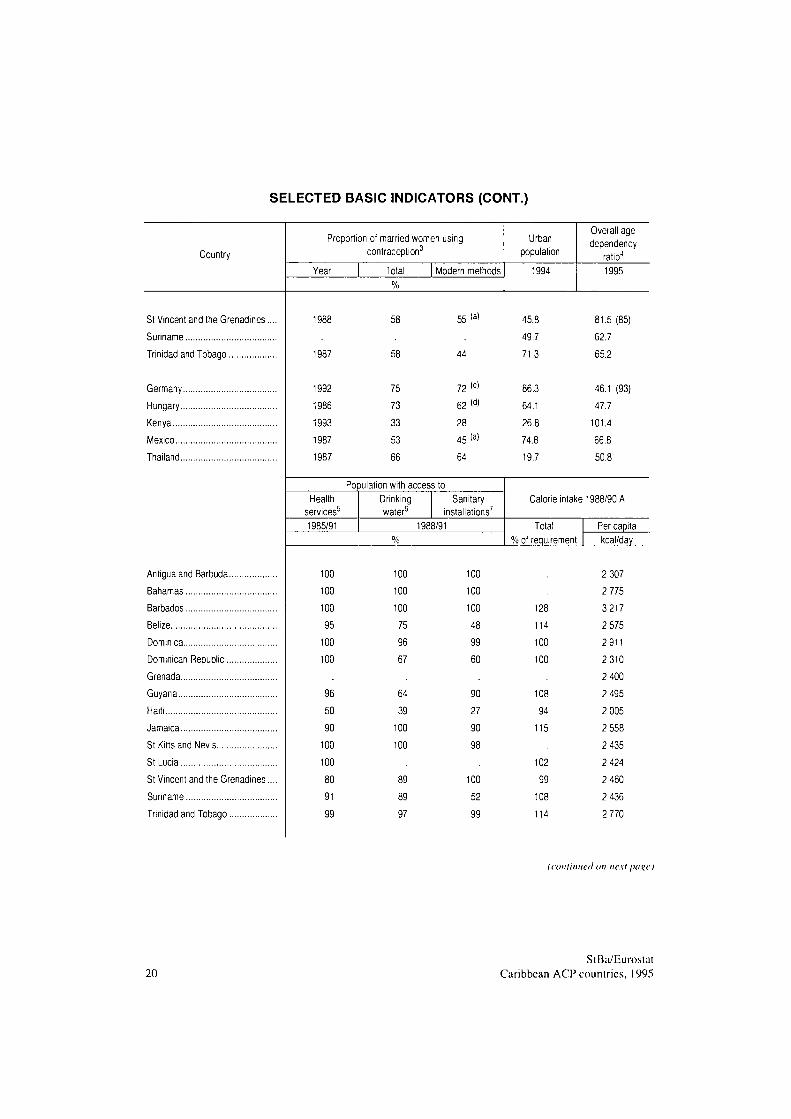
Population with access to Health
services5
1985/91
Drinking water6
Sanitary installations7
1988/91 %
Calorie intake 1988/90 A
Total % of requirement
Per capita kcal/day
100 100 100 95 100 100
96 50 90 100 100 80 91 99
100 100 100 75 96 67
64 39 100 100
97
100 100 100 48 99 60
90 27 90 98
100 52 99
128 114 100 100
108 94 115
102 99 108 114
2 307 2 775 3217 2 575 2911 2310 2 400 2 495 2 005 2 558 2 435 2 424 2 460 2 436 2 770
(continued on next pagel
20 StBa/Eurostat
Caribbean ACP countries, 1995
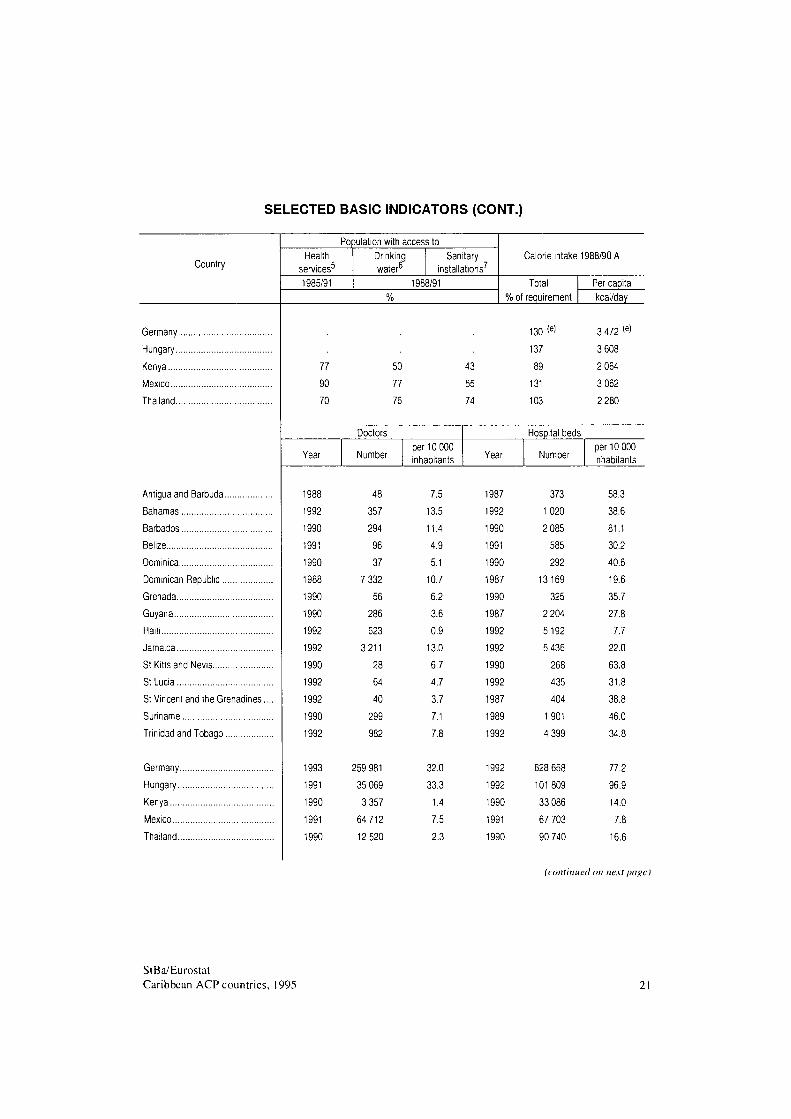
SELECTED BASIC INDICATORS (CONT.)
Country
Population with access to Health
services5
1985/91
Drinking water6
Sanitary installations7
1988/91
Calorie intake 1988/90 A
Total % of requirement
Per capita kcal/day
Germany.
Hungary..
Kenya
Mexico....
Thailand-
Antigua and Barbuda
Bahamas
Barbados
Belize
Dominica
Dominican Republic
Grenada
Guyana
Haiti
Jamaica
St Kitts and Nevis
St Lucia
St Vincent and the Grenadines
Suriname
Trinidad and Tobago
Germany Hungary Kenya Mexico Thailand
77 90 70
Year
1988 1992 1990 1991 1990 1988 1990 1990 1992 1992 1990 1992 1992 1990 1992
1993 1991 1990 1991 1990
50 77 76
43 55 74
130 <e' 137 89 131 103
3 472 <e>
3 608
2 064
3 062
2 280
Doctors
Number per 10000 inhabitants Year
Hospital beds
Number per 10000 inhabitants
357
294
96
37
7 332
56
286
623
3211
28
64
40
299
982
259 981
35 069
3 357
64 712
12 520
7.5
13.5
11.4
4.9
5.1
10.7
6.2
3.6
0.9
13.0
6.7
4.7
3.7
7.1
7.8
32.0
33.3
1.4
7.5
2.3
1987
1992
1990
1991
1990
1987
1990
1987
1992
1992
1990
1992
1987
1989
1992
1992
1992
1990
1991
1990
373
1 020
2 085
585
292
13169
325
2 204
5192
5 436
268
435
404
1901
4 399
628 658
101 809
33 086
67 703
90 740
58.3
38.6
81.1
30.2
40.6
19.6
35.7
27.8
7.7
22.0
63.8
31.8
38.8
46.0
34.8
77.2
96.9
14.0
7.8
16.6
(continued on next page)
StBa/Eurostat Caribbean ACP countries, 1995 21
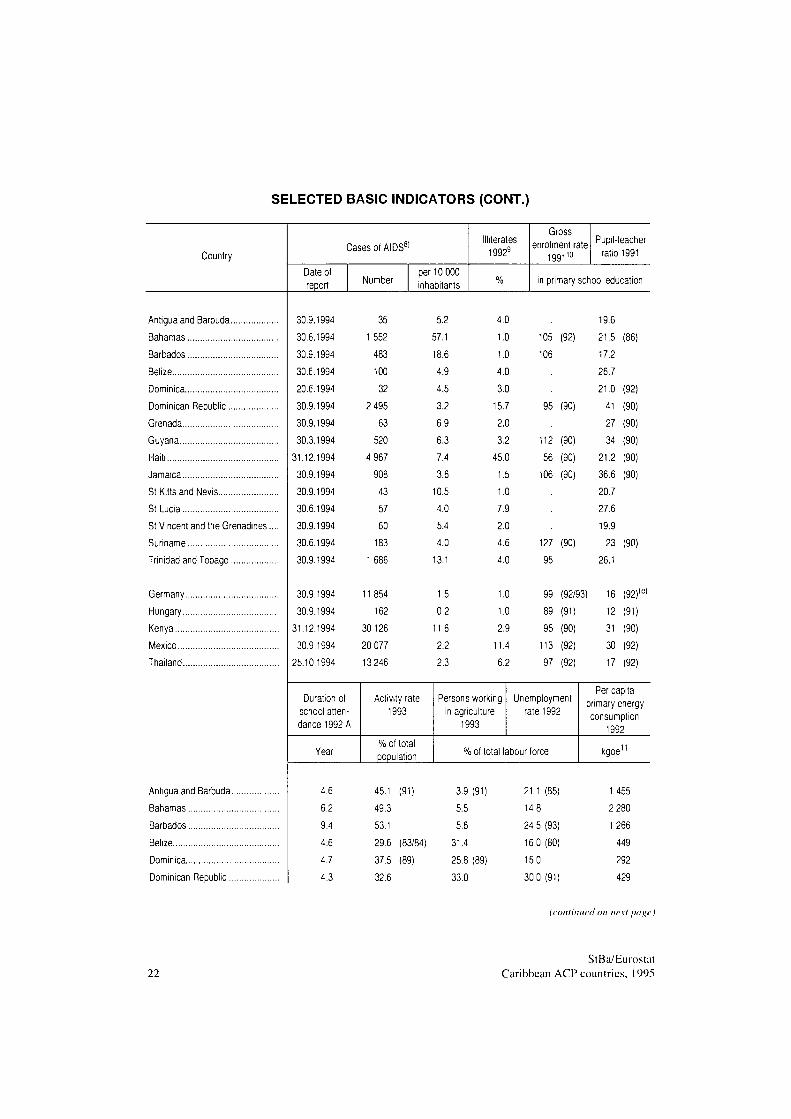
SELECTED BASIC INDICATORS (CONT.)
Country Cases of AIDS81
Date of report Number
per 10000 inhabitants
¡literates 19929
Gross enrolment rate
1991 ,10
Pupil-teacher ratio 1991
in primary school education
Antigua and Barbuda
Bahamas
Barbados
Belize
Dominica
Dominican Republic
Grenada
Guyana
Haiti
Jamaica
St Kitts and Nevis
St Lucia
St Vincent and the Grenadines.
Suriname
Trinidad and Tobago
Germany Hungary Kenya Mexico Thailand
30.9.1994 30.6.1994 30.9.1994 30.6.1994 20.6.1994 30.9.1994 30.9.1994 30.3.1994
31.12.1994 30.9.1994 30.9.1994 30.6.1994 30.9.1994 30.6.1994 30.9.1994
30.9.1994 30.9.1994
31.12.1994 30.9.1994
25.10.1994
35 1 552 483 100 32
2 495 63
520 4 967 908 43 57 60 183
1 686
11 854 162
30 126 20 077 13 246
5.2 57.1 18.6 4.9 4.5 3.2 6.9 6.3 7.4 3.6 10.5 4.0 5.4 4.0 13.1
1.5 0.2 11.6 2.2 2.3
4.0 1.0 1.0 4.0 3.0 15.7 2.0 3.2
45.0 1.5 1.0 7.9 2.0 4.6 4.0
1.0 1.0 2.9 11.4 6.2
105 (92) 106
95 (90)
112 (90) 56 (90) 106 (90)
127 (90) 95
19.6 21.5 (86) 17.2 26.7 21.0 (92) 41 (90) 27 (90) 34 (90)
21.2 (90) 36.6 (90) 20.7 27.6 19.9 23 (90)
26.1
99 (92/93) 16 (92),e)
89 (91) 12 (91) 95 (90) 31 (90) 113 (92) 30 (92) 97 (92) 17 (92)
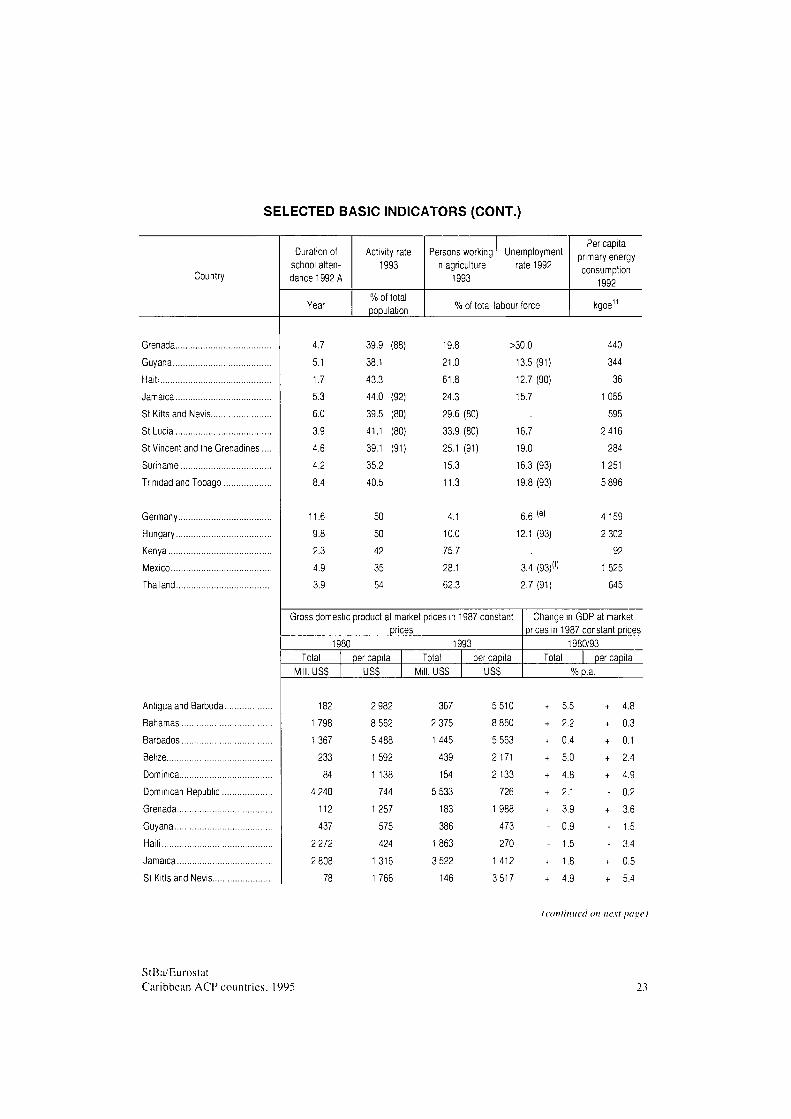
Du'ation of school attendance 1992 A
Year
Activity rate 1993
% of total population
Persons working in agriculture
1993
Unemployment rale 1992
% of total labour force
Per capila primary energy consumption
1992
kgoe"
Antigua and Barbuda.
Bahamas
Barbados
Belize
Dominica
Dominican Republic.
4.6
6.2
9.4
4.6
4.7
4.3
45.1 (91)
49.3
53.1
29.6 (83/84)
37.5 (89)
32.6
3.9 (91)
5.5
5.6
31.4
25.8 (89)
33.0
21.1 (85)
14.8
24.5 (93)
16.0 (80)
15.0
30.0 (91)
1 455
2 280
1 266
449
292
429
(continued on next page)
22 StBa/Eurostat
Caribbean ACP countries, 1995
SELECTED BASIC INDICATORS (CONT.)
Country
Duration of school attendance 1992 A
Year
Activity rate 1993
% of total population
Persons working in agriculture
1993
Unemployment rate 1992
% of total labour force
Per capita primary energy consumption
1992
kgoe
Grenada
Guyana
Haiti
Jamaica
St Kitts and Nevis
St Lucia
St Vincent and the Grenadines.
Suriname
Trinidad and Tobago
Germany
Hungary
Kenya
Mexico
Thailand
Antigua and Barbuda.
Bahamas
Barbados
Belize
Dominica
Dominican Republic.
Grenada
Guyana
Haiti
Jamaica
St Kitts and Nevis
4.7
5.1
1.7
5.3
6.0
3.9
4.6
4.2
8.4
11.6
9.8
2.3
4.9
3.9
39.9 (88)
38.1
43.3
44.0 (92)
39.5 (80)
41.1 (80)
39.1 (91)
35.2
40.5
50
50
42
35
54
19.8
21.0
61.8
24.3
29.6 (80)
33.9 (80)
25.1 (91)
15.3
11.3
4.1
10.0
75.7
28.1
62.3
>30.0
13.5 (91)
12.7 (90)
15.7
16.7
19.0
16.3 (93)
19.8 (93)
6.6 Ie'
12.1 (93)
3.4 (93)(,)
2.7 (91)
440
344
36
1 055
595
2416
284
1 251
5 896
4 159
2 302
92
1525
645
Gross domestic product at market prices in 1987 constant prices
1980 1993 Total II. USS
per capita USS
Total .USS
per capita USS
Change in GDP at market prices in 1987 constant prices
1980/93 Total per capita
% p.a.
182
1 798
1367
233
84
4 240
112
437
2 272
2 808
78
2 982
8 562
5 488
1592
1 138
744
1 257
575
424
1316
1 766
367
2 375
1 445
439
154
5 533
183
386
1863
3 522
146
5 510
8 860
5 563
2171
2 133
726
1988
473
270
1 412
3517
5.5
2.2
0.4
5.0
4.8
2.1
3.9
0.9
1.5
1.8
4.9
4.8
0.3
0.1
2.4
4.9
0.2
3.6
1.5
3.4
0.5
5.4
(continued on next page)
StBa/Eurostat Caribbean ACP countries. 1995 23
SELECTED BASIC INDICATORS (CONT.)
Country
Gross domest ic product at market prices in 1987 constant
prices
1980 1993
Total
USD million
per capi ta
USD mill ion
Total
USD million
per capi la
USD mill ion
Change in GDP at market prices in 1987 constant pr ices
1980/93 Total per capita
% p.a.
St Lucia
St Vincent and the Grenadines.
Suriname
Trinidad and Tobago
Germany'2'
Hungary
Kenya
Mexico
Thailand
Antigua and Barbuda
Barbados
Belize
Dominica
Dominican Republ ic
Grenada
Guyana
Haiti
Jamaica
St Kitts and Nevis
St Lucia
St Vincent and the Grenad ines .
Sur iname
Trinidad and Tobago
183
92
1 468
5 638
957 881
21965
6 159
129316
33 530
1590
939
4 171
5 2 1 0
15 566
2 051
372
417
196
1502
4 609
1 257 207
21289
9 388
1929 163 719
718 89 907
3 001
1783
3 368
3 603
19 184
2 071
370
1 888
1 528
6.5
6.0
0.2
1.5
0.0
0.2
3.3
1.8
7.9
5.0
5.1
1.6
2.8
0.0
0.1
0.0
0.2
6.0
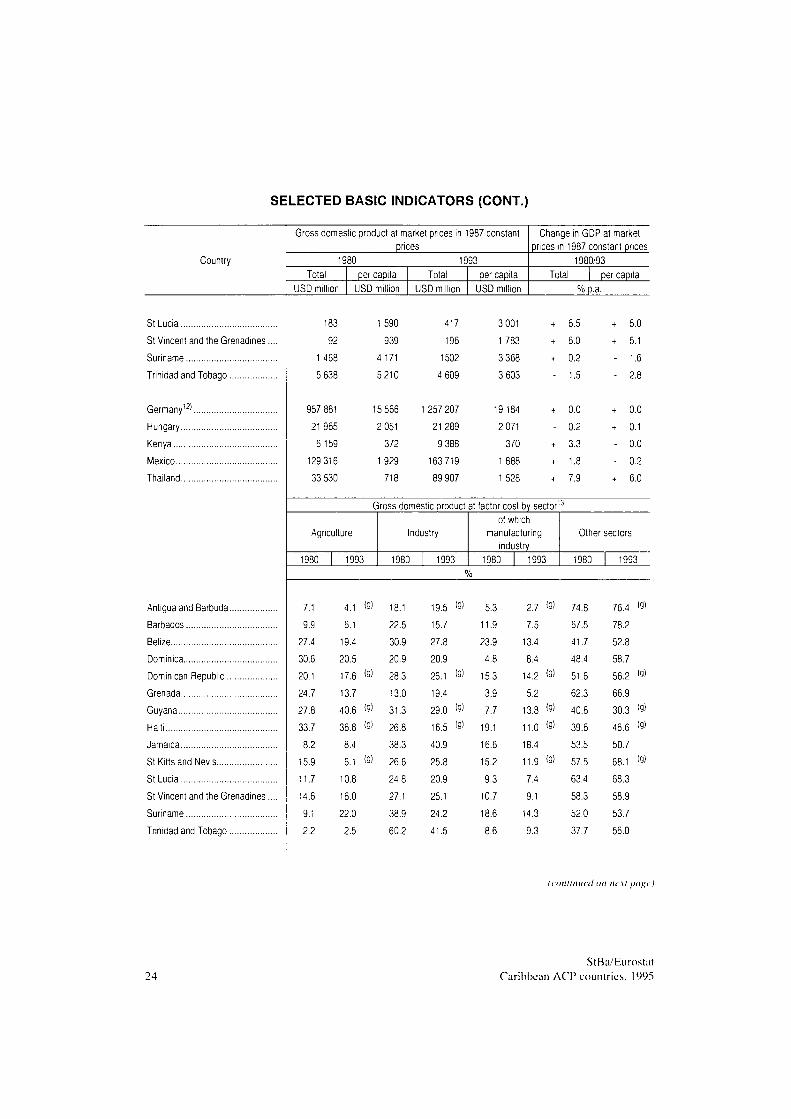
Gross domestic product at factor cost by sector13
Agriculture
1980
7.1
9.9
27.4
30.6
20.1
24.7
27.8
33.7
8.2
15.9
11.7
14.6
9.1
2.2
1993
Industry
1980 1993
of which manufacturing
industry 1980 1993
Other sectors
1980 1993
4.1 «I
6.1
19.4
20.5
17.6 '9'
13.7
40.6 (9>
36.8 (9)
8.4
6.1 O)
10.8
16.0
22.0
2.5
18.1
22.5
30.9
20.9
28.3
13.0
31.3
26.8
38.3
26.6
24.8
27.1
38.9
60.2
19.5 19)
15.7
27.8
20.9
26.1 '91
19.4
29.0 (9)
16.5 '9)
40.9
25.8
20.9
25.1
24.2
41.5
5.3
11.9
23.9
4.8
15.3
3.9
7.7
19.1
16.6
15.2
9.3
10.7
18.6
8.6
2.7 <9)
7.5
13.4
8.4
14.2 <9)
5.2
13.8 O'
11.0 19)
18.4
1 1 . 9 <9>
7.4
9.1
14.3
9.3
74.8
67.5
41.7
48.4
51.6
62.3
40.8
39.6
53.5
57.5
63.4
58.3
52.0
37.7
76.4 0)
78.2
52.8
58.7
56.2 <9)
66.9
30.3 <9)
46.6 <9>
50.7
68.1 'S'
68.3
58.9
53.7
56.0
(continuedon next page)
24 StBa'Eurostat
Caribbean ACP countries. 1995
SELECTED BASIC INDICATORS (CONT.)
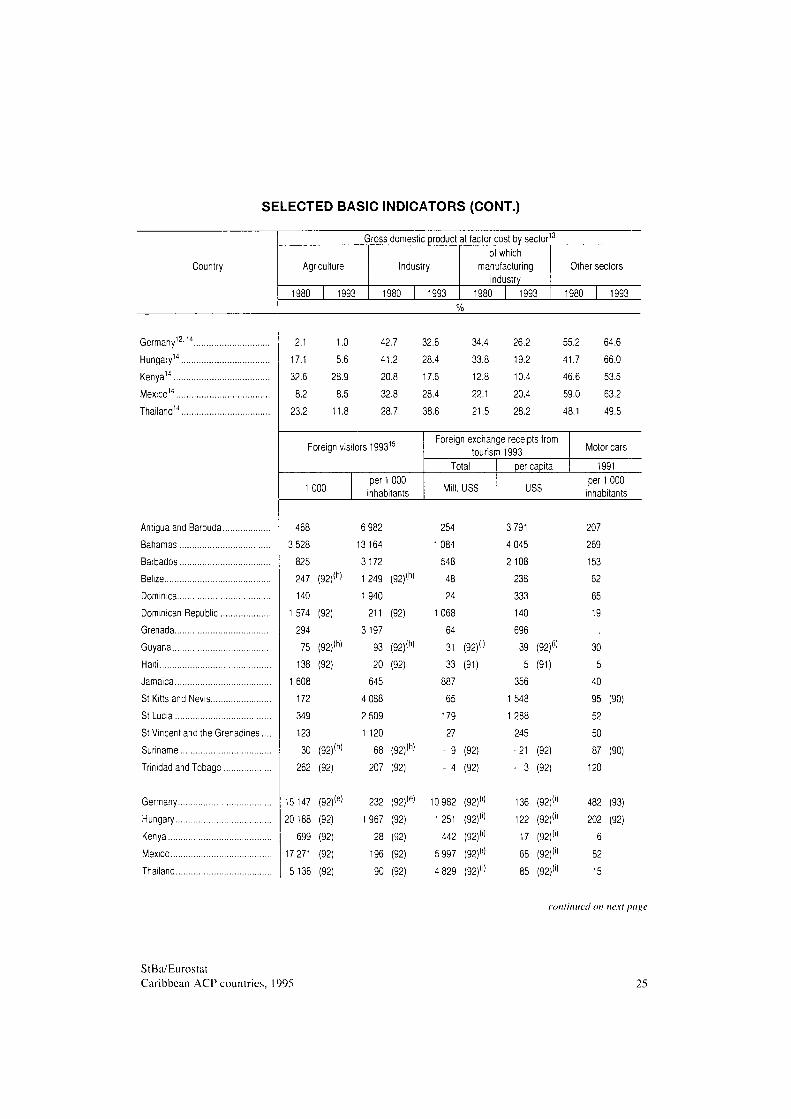
Country
Gross domestic product at factor cost by sector
Agriculture
1980 1993
Industry
1980 1993
of which manufacturing
industry 1980 1993
Other sectors
1980 1993
Germany12·'4.
Hungary14
Kenya14
Mexico14
Thailand14
Antigua and Barbuda
Bahamas
Barbados
Belize
Dominica
Dominican Republic
Grenada
Guyana
Haiti
Jamaica
St Kitts and Nevis
St Lucia
St Vincent and the Grenadines
Suriname
Trinidad and Tobago
Germany
Hungary
Kenya
Mexico
Thailand
2.1
17.1
32.6
8.2
23.2
1.0
5.6
28.9
8.5
11.8
42.7
41.2
20.8
32.8
28.7
32.6
28.4
17.6
28.4
38.6
34.4
33.8
12.8
22.1
21.5
26.2
19.2
10.4
20.4
28.2
55.2
41.7
46.6
59.0
48.1
64.6
66.0
53.5
63.2
49.5
Foreign visitors 199315
1 000 per 1 000 inhabitants
Foreign exchange receipts from tourism 1993
Total
Mill. USS
per capita
USS
468
3 528
825
247 (92)(h)
140
1 574 (92)
294
75 (92)<h)
138 (92)
1 608
172
349
123
30 (92)(h)
262 (92)
15 147 (92)(e>
20 188 (92)
699 (92)
17 271 (92)
5136 (92)
6 982
13164
3172
1249 (92)(h>
1940
211 (92)
3197
93 (92)<h>
20 (92)
645
4 088
2 509
1 120
68 (92)(h>
207 (92)
254
1 084
548
48
24
1068
64
31 (92)·')
33 (91)
887
65
179
27
- 9 (92)
- 4 (92)
232 (92)(e) 10 982 (92)
1 967 (92) 1 251 (92)
28 (92) 442 (92)
196 (92) 5 997 (92)
90 (92) 4 829 (92)
3 791
4 045
2 108
238
333
140
696
39 (92)(')
5 (91)
356
1 548
1 288
245
-21 (92)
- 3 (92)
136 (92)'
122 (92)'
17 (92)
68 (92)
85 (92)
Motor cars
1991 per 1 000 inhabitants
207
269
153
62
65
19
30
5
40
95 (90)
52
50
87 (90)
120
482 (93)
202 (92)
6
82
15
continued on next page
StBa/Eurostat Caribbean ACP countries, 1995 25
SELECTED BASIC INDICATORS (CONT.)
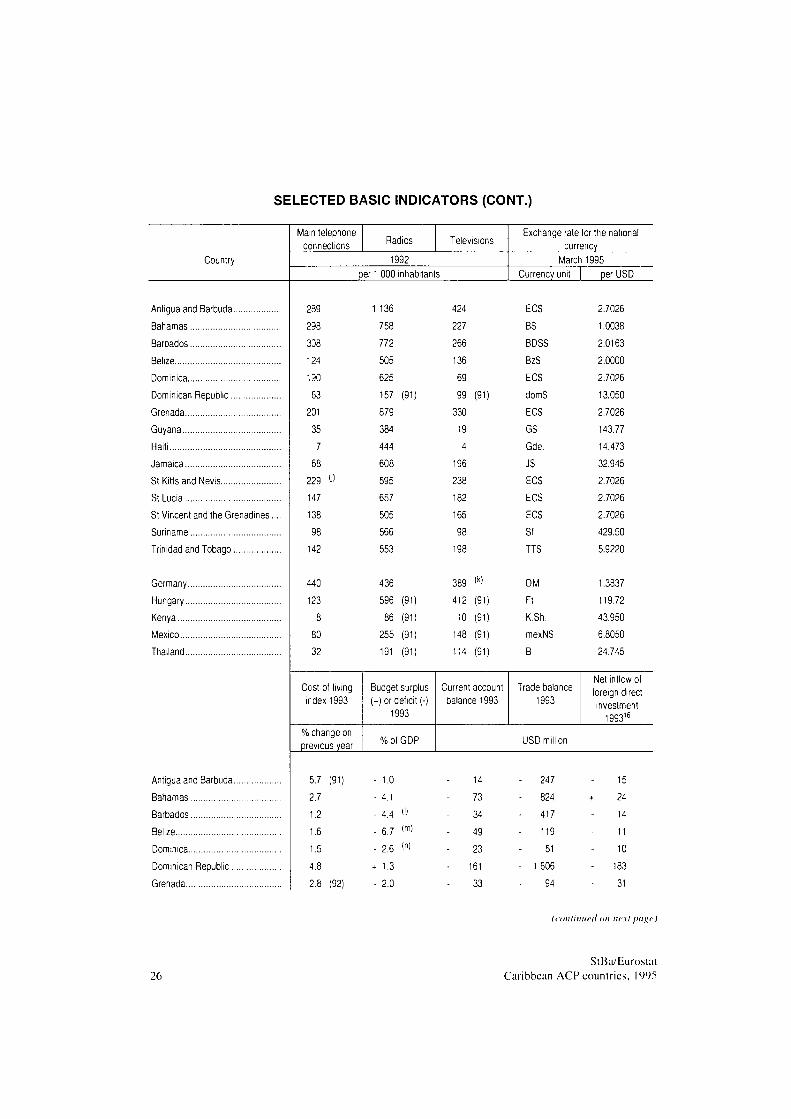
Country
Main telephone
connections Radios Televisions
1992
per 1 000 inhabitants
Exchange rate for the national
currency
March 1995
Currency unit per USD
Antigua and Barbuda
Bahamas
Barbados
Belize
Dominica
Dominican Republic
Grenada
Guyana
Haiti
Jamaica
St Kitts and Nevis
St Lucia
St Vincent and the Grenadines.
Suriname
Trinidad and Tobago
Germany
Hungary
Kenya
Mexico
Thailand
Antigua and Barbuda.
Bahamas
Barbados
Belize
Dominica
Dominican Republic..
Grenada
239
298
308
124
130
63
231
35
7
68
229 <i)
147
138
98
142
440
123
32
Cost-of-living
index 1993
1 136
758
772
505
625
157 (91)
879
384
444
608
595
657
505
566
553
436
596 (91)
86 (91)
255 (91)
191 (91)
424
227
266
136
69
99 (91)
330
19
4
196
238
182
165
389 (k)
412 (91)
10 (91)
148 (91)
114 (91)
ECS
BS
BDSS
BzS
ECS
domS
ECS
GS
Gde.
JS
ECS
ECS
ECS
Sf
TTS
DM
Ft
K.Sh.
mexNS
Β
% change on
previous year
Budget surplus
(+) or deficit ()
1993
% of GDP
Current account
balance 1993
Trade balance
1993
USD million
5.7 (91)
2.7
1.2
1.6
1.5
4.8
2.8 (92)
1.0
4.1
4.4 O
6.7 (m)
2.6 (n)
+ 1.3
2.0
14
73
34
49
23
161
33
247
824
417
119
51
1 606
94
2.7026
1.0038
2.0163
2.0000
2.7026
13.050
2.7026
143.77
14.473
32.945
2.7026
2.7026
2.7026
429.50
5.9220
1.3837
119.72
43.950
6.8050
24.745
Net inflow ol
foreign direct
investment
1993'6
15
24
14
11
10
183
31
(continued on next ¡>agc )
26
StBa/Eurostat
Caribbean ACP countries. 1995
SELECTED BASIC INDICATORS (CONT.)
Country
Cost-of-living index 1993
% change on previous year
Budget surplus (+) or deficit (-)
1993
% of GDP
Current account balance 1993
Trade balance 1993
Net inflow of foreign direct investment
199316)
.USS
Guyana
Haiti
Jamaica
St Kitts and Nevis
St Lucia
St Vincent and the Grenadines.
Suriname
Trinidad and Tobago
Germany
Hungary
Kenya
Mexico
Thailand
12.0
26.2
22.1
2.8
0.7
4.3
143.5
10.8
4.2 (e)
22.5
45.8
9.8
3.8
- 9.9
- 5.4 <m>
- 1.8
- 1.9 (m)
- 2.9
- 6.9
- 0.3
- 2.7 <e>
+ 0.8 (90)
- 2.6 (91)
+ 0.7 (90)
+ 1.7
136
7(92)
182
25
44
26
11 (92)
122 (92)
68
113 (92)
814
63
158
49
0
386
19 960
4 262
153
23 391
6 520
+ 44 530
- 4 020
- 591
- 18 891
- 4 155
60
- 139
12
50
29
+ 30
178
+ 14 070
- 2 339
2
- 4 901
- 1979
Official development assistance 1993
per capita
USD million
Total
USD
Long-term foreign debts 199317
USD million % of GDP
Debt servicing
1991/93 A % of exports of
goods & services
Antigua and Barbuda.
Bahamas
Barbados
Belize
Dominica
Dominican Republic..
Grenada
Guyana
Haiti
Jamaica
St Kitts and Nevis
St Lucia
3.1
0.6
5.6
30.5
9.2
2.0
7.6
106.9
126.9
109.6
10.5
26.3
47
2
22
151
127
0
83
131
18 44
254
189
114
1315
647
170
236
3 091
79
1634
622
3 470
55
124
25.0
43.1
39.6
32.6
120.7
37.2
35.8
502.1
26.1 (9>
86.6
28.3
25.1
14
8
6
12
5
28
2
24
3
4
(continued on next page)
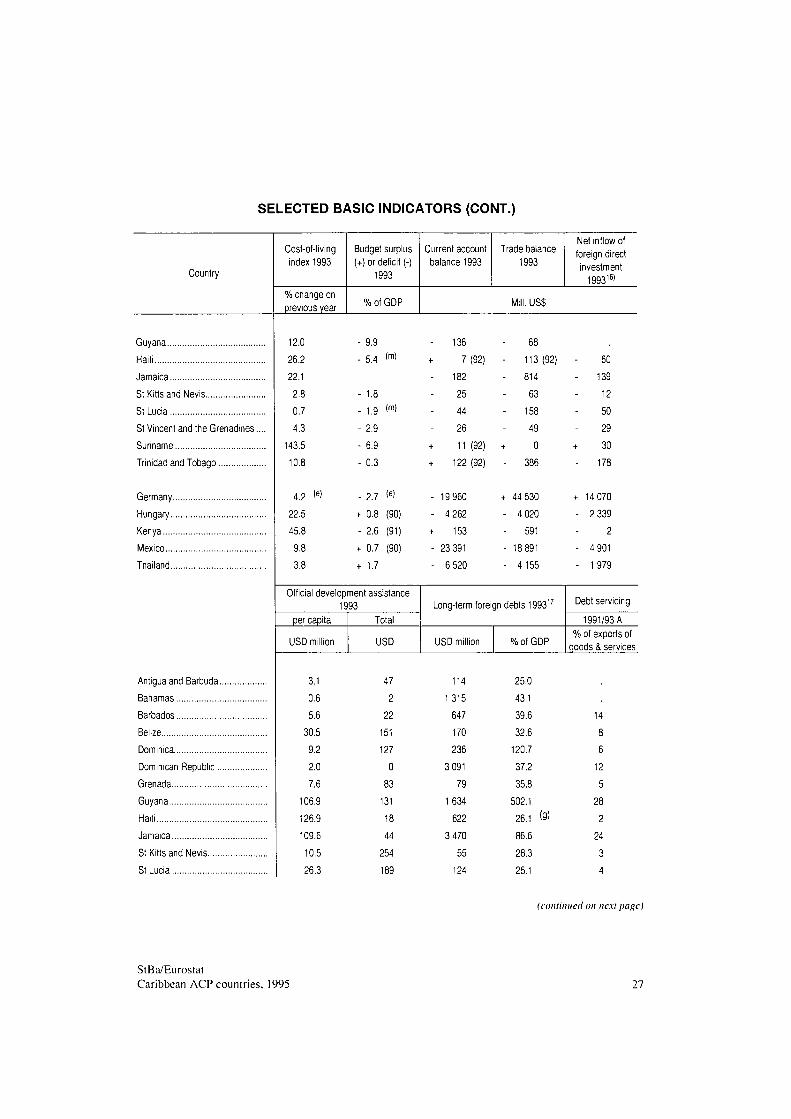
StBa/Eurostat Caribbean ACP countries, 1995 27
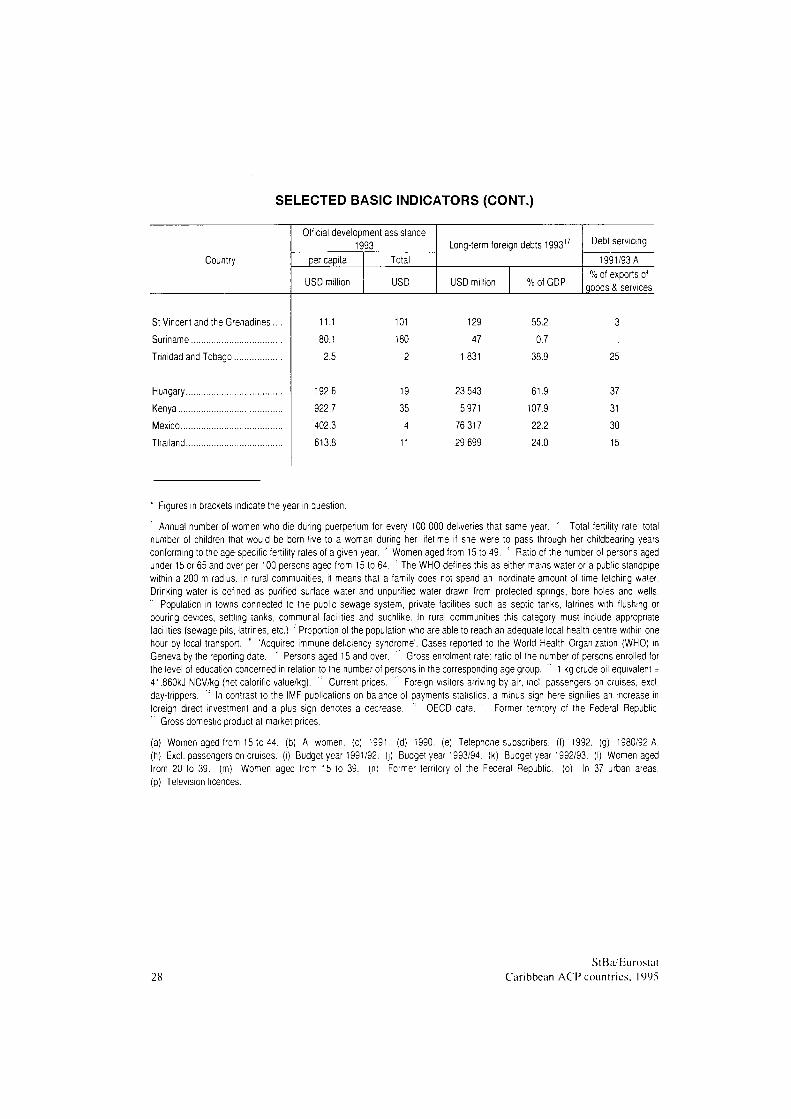
SELECTED BASIC INDICATORS (CONT.)
Country
Official development assistance 1993
per capila
USD million
Total
USD
Long-term foreign debts 1993'
USD million % of GDP
Debt servicing
1991/93 A % of exports of
goods & services
St Vincent and the Grenadines.
Suriname
Trinidad and Tobago
Hungary
Kenya
Mexico
Thailand
11.1
80.1
2.5
192.6
922.7
402.3
613.8
101
19
35
4
11
129
47
1831
23 543
5 971
76 317
29 699
55.2
0.7
38.9
61.9
107.9
22.2
24.0
25
37
31
30
15
' Figures in brackets indicate the year in question.
Annual number of women who die during Puerperium for every 100 000 deliveries that same year. ' Total fertility rate: total number of children that would be born live to a woman during her lifetime if she were to pass through her childbearing years conforming to the age-specific fertility rates of a given year. ! Women aged from 15 to 49. ; Ratio of the number of persons aged under 15 or 65 and over per 100 persons aged from 15 to 64. ; The WHO defines this as either mains water or a public standpipe within a 200 m radius. In rural communities, it means that a family does not spend an inordinate amount of time fetching water. Drinking water is defined as purified surface water and unpurified water drawn from protected springs, bore holes and wells. " Population in towns connected to the public sewage system, private facilities such as septic tanks, latrines with flushing or pouring devices, settling tanks, commural facilities and suchlike. In rural communities this category must include appropriate facilities (sewage pits, latrines, etc.) ' Proportion of the population who are able to reach an adequate local health centre within one hour by local transport. ' 'Acquired immune deficiency syndrome'. Cases reported to the World Health Organization (WHO) in Geneva by the reporting date. a Persons aged 15 and over. ' : Gross enrolment rate: ratio of the number of persons enrolled for the level of education concerned in relation to the number of persons in the corresponding age group. 1 kg crude oil equivalent = 41.860kJ NCV/kg (net calorific value/kg). '" Current prices. '' Foreign visitors arriving by air, incl. passengers on cruises, excl. day-trippers. ' In contrast to the IMF publications on balance of payments statistics, a minus sign here signifies an increase in foreign direct investment and a plus sign denotes a decrease. 'r OECD data. '' Former territory of the Federal Republic. ' Gross domestic product at market prices.
(a) Women aged from 15 to 44. (b) Al women, (c) 1991. (d) 1990. (e) Telephone subscribers, (f) 1992. (g) 1980/92 A. (h) Excl. passengers on cruises, (ι) Budget year 1991/92. (j) Budget year 1993/94. (k) Budget year 1992/93. (I) Women aged from 20 to 39. (m) Women aged fron 15 to 39. (n) Former territory of the Federal Republic, (o) In 37 urban areas, (p) Television licences.
28 StBa/Eurostat
Caribbean ACP countries. 1995
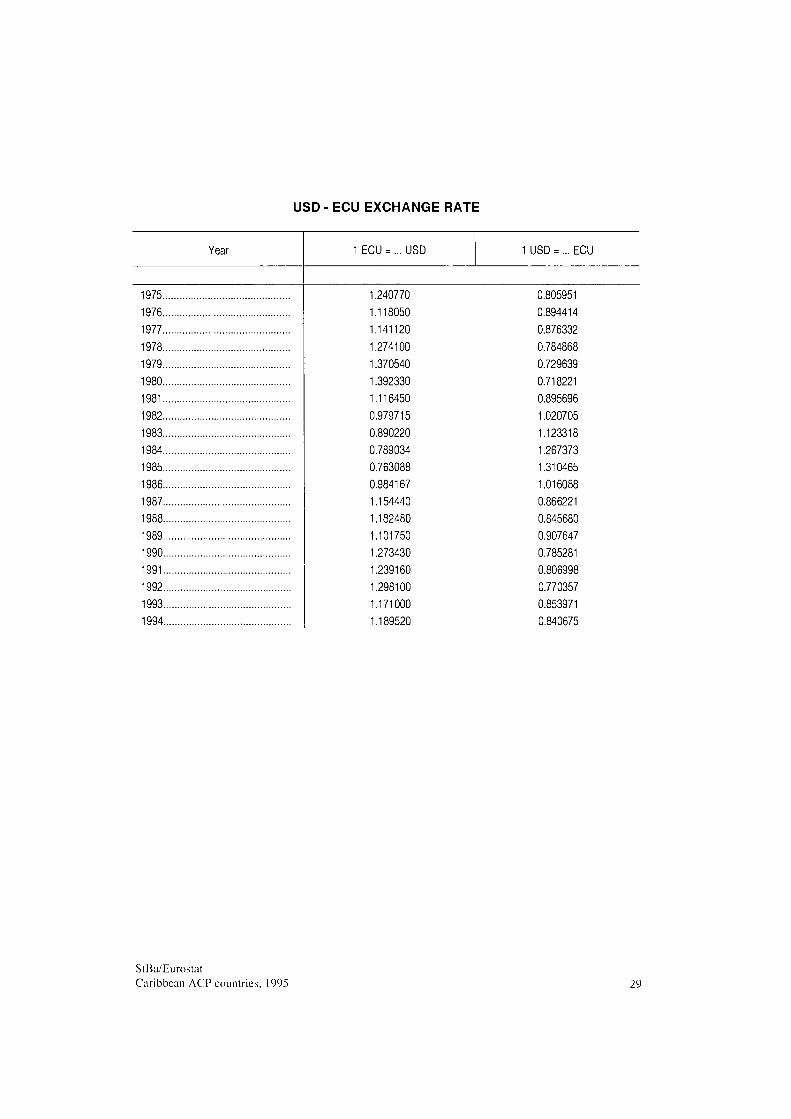
USD - ECU EXCHANGE RATE
Year
1975 1976 1977 1978 1979 1980 1981 1982 1983 1984 1985 1986 1987 1988 1989 1990 1991 1992 1993 1994
1 ECU = ... USD 1 USD = ... ECU
1.240770 0.805951 1.118050 0.894414 1.141120 0.876332 1.274100 0.784868 1.370540 0.729639 1.392330 0.718221 1.116450 0.895696 0.979715 1.020705 0.890220 1.123318 0.789034 1.267373 0.763088 1.310465 0.984167 1.016088 1.154440 0.866221 1.182480 0.845680 1.101750 0.907647 1.273430 0.785281 1.239160 0.806998 1.298100 0.770357 1.171000 0.853971 1.189520 0.840675
StBa/Eurostat Caribbean ACP countries. 1995 29
1 . H I S T O R I C A L O V E R V I E W A N D F U T U R E D I R E C T I O N S
While the two parts of the island of Hispaniola have been independent since early in the nineteenth century, the smaller Caribbean countries cither became independent in the early 1960s, or in some cases, retained a relationship with their erstwhile colonial rulers. Haiti obtained its independence from France as early as 1804, but Santo Domingo, which had been ceded to France by Spain in 1795, remained under French occupation for another five years. Then the French were expelled and the country nominally reverted to Spanish rule. In 1821 the Dominicans proclaimed their independence, but the country was invaded and annexed to Haiti the following year. Boyer, the Haitian President, was overthrown in 1843, and a year later, Santo Domingo again declared its independence, forming the Dominican Republic.'
In the late 1950s and early 1960s the Caribbean countries participated in the worldwide drive for liberation and national independence. Puerto Rico sought association as an independent "Commonwealth" within the United States, the French Antilles as full French Departments, the Dutch colonies initially as parts of the Kingdom of the Netherlands, though Curaçao and Aruba later became independent within that Kingdom.
Most of the English-speaking islands joined together in the Federation of the West Indies. The Federation was dissolved in 1962 and the member states moved on to independence on their own, or in the case of some of the smaller islands, to self-government under the British crown. The appreciation of their common cultural heritage and awareness of their common economic interests resulted in the establishment of a number of joint enterprises, including the University of the West Indies and Carifta, the Caribbean Free Trade Area. The latter, in 1973, was replaced by an embryonic customs union, Caricom. The Dominican Republic and Haiti have since applied to join Caricom, but the imbalance in size between the existing member states and these countries - each has a population greater than that of all the present members combined - has led to a cautious response on the part of the current membership.
Caricom has not yet developed into a fully-fledged free trade area, let alone the common market with free movement of factors of production that it formally set as a target in 1989. Even the Common External Tariff (CET) is not comprehensively applied. There arc all manner of exceptions. Surcharges and excise duties in addition to the CET tariffs are common. The Eastern Caribbean Common Market (ECCM) countries and Belize may apply lower rates for non-competing products. Generally lowcr-than-CET rates arc allowed for goods where there is a 'cost of living' factor and highcr-than-CET rates where there is a tariff revenue factor.
Cuba which is not treated in this report received its independence in 1902.
StBa/Eurostat 30 Caribbean ACP countries. 1995
Within Caricom free trade is not yet a reality though much progress has been made. Most countries have abolished their surcharges and excise duties on intra-Caricom trade though internal taxation sometimes discriminates between imports and domestically produced goods. There is also a lack of public interest in deeper integration. Because most business links, whether supply arrangements or joint ventures, are between Caribbean firms and firms in North America or Europe, there is limited pressure from the business community.
Caricom's importance lies more as an organisation for promoting common policies on such matters as tourism, telecommunications, air and sea transport and, most important, trade negotiations with outside countries. There is scope for trade creation through regional reallocation of production to benefit from economies of scale and limited managerial and technical expertise. But those arc limited to a few manufacturing sectors, and, in any event, such rationalisation will be resisted by the small states who have nurtured small and highly specialised manufacturing sectors.
The most important role for Caricom may well be in negotiations for additional preferences in NAFTA or negotiations for entry into an expanded pan-American trade bloc. The United States has already indicated that it would rather negotiate with a single organisation than 13 small countries. And those countries would greatly enhance their bargaining strength vis-à-vis the regional hegemon. Caricom has to some extent established its role as a trade negotiator in trade agreements with Venezuela and Colombia. However some of the experience so far is less than benign since Jamaica embarked on discussions on 'NAFTA-parity' treatment for its apparel exports to the United States with little consultation with its partners.
The Caribbean region, including both Caricom and non-Caricom states, is particularly vulnerable to recent and likely changes in the régimes governing its international trade. These include
• the Uruguay Round (UR) of multilateral negotiations under the General Agreement on Tariffs and Trade (GATT), which finally reached a conclusion - at least insofar as most negotiating groups were concerned - at Marrakesh in April 1994, but which has in effect largely set the agenda for forthcoming negotiations on agriculture, labour conditions and environmental protection, as well as certain unfinished business such as in financial and maritime services:
• the North American Free Trade Agreement (NAFTA) which came into force at the beginning of 1995. This extends the free trade area which hitherto existed among the United States and Canada to Mexico, and will benefit Mexican exports to some extent at the expense of the Caribbean:
• the possibility of negotiating some NAFTA-parity arrangements for the Caribbean to partially offset this trade diversion;
StBa/Eurostat Caribbean ACP countries. 1995 31
• future developments extending NAFTA into a Free Trade Area of the Americas, which was the goal agreed by all the sovereign Western Hemisphere countries at their summit in Miami in December, 1994;
• the evolution of Lomé after the conclusion of Lome IV at the end of 1999 and the possibility of significant changes in the system of preferential access for the ACP States on EU markets;
• further potential developments in regional trade groupings including in Latin America, with the deepening and widening of Mercosur, the Pacific area, the recently-mooted EU-North American Free Trade Area (FTA) and indeed within the Caribbean region itself;
• a new round of reforms of the European Union's Common Agricultural Policy (CAP), which could have important implications for export markets in rice and sugar; and further adjustments to the banana regime which has already led to complaints to GATT and is now threatening action through the World Trade Organisation (WTO) disputes mechanism, and which, in any event will terminate in 2002 with important consequences for the banana-producing Caribbean states.
Clearly these issues go far beyond the scope of this report. But certain general points can be made. In very broad terms, the direct trade effects of both the Uruguay Round and NAFTA on the ACP Caribbean are likely to be negative since the tariff cuts effectively erode the tariff preferences of the Generalized System of Preferences (GSP), the Lomé Convention and the Caribbean Basin Initiative (CBI). Reductions in internal EU prices of sugar and cuts in tariffs on rice and bananas will eventually and significantly reduce the value of the preferential access quotas for these products on the EU market. The phasing out of the MultiFibrc Arrangement (MFA) will mean that, on the EU market, where ACP States arc free of MFA quotas, they will experience tough and possibly fatal competition from the low-cost Asian countries, in particular China and India. On some other industrialised markets, for example the United States, the major Caribbean clothing producers, except on 807A goods, are currently subject to MFA quotas which will be gradually dismantled. However any new opportunities for expanding trade are likely to be more than offset by price competition from Asia.
The effects of NAFTA on the ACP Caribbean arc likely to be less in the form of immediate trade diversion - though that may occur particularly for 807A goods, that is the apparel thai is manufactured from fabric formed and cut in the United States and on which tariffs arc only levied on the value added (generally about 25%) in the Caribbean country in question, mainly Jamaica and the Dominican Republic. The medium term effect on investment is likely to be much more serious. US investors and others anxious to expand markets in North America arc going to find Mexico relatively more attractive. Not only are nearly all tariffs within the NAFTA area being gradually eliminated but NAFTA affords a far greater security of access to the US market for products originating in Mexico than does the Caribbean Basin Initiative
StBa/Eurostat 32 Caribbean ACP countries. 1995
(CBI) for its much more limited range of covered products. The CBI has been regularly extended in scope but it is a concessional scheme and can be discontinued unilaterally by the US, as can Caribcan, Canada's analogous preference scheme for the Caribbean.
The lessons of the erosion of preferences through the Uruguay Round, the threat of further reforms to the CAP, including the EU's banana regime and early, often radical reflections on the shape of Lomé V, have not been lost in the Caribbean. Preferential trade concessions are by their nature unreliable and can even be detrimental if they create their own dependency. Diversification into export goods or services which are competitive on the world market has to be given top priority.
At the same time that competitiveness may require an even playing field as regards tariffs. But with tariffs likely to continue to fall in multilateral negotiations, the ability of countries to attract foreign investment becomes critical. That means (at least) national treatment for foreign firms, the appropriate regulatory framework, and, in time, the right labour and environmental policies. In the case of investment from the United States it increasingly means a bilateral investment treaty and enacting an acceptable intellectual property protection act -which go beyond any Uruguay Round requirements.
The Caribbean countries cannot afford to remain aloof from the regional blocs forming around them. Most of their manufactured exports go to North America. So do most of their service exports - tourism, obviously, but also data processing and software services, and other professional services. They are largely dependent on emigrant remittances from North America.
The North American share in their trade will likely grow as manufactures and service exports expand relative to food and industrial raw materials. For the Caribbean countries eventual membership of a pan-American FTA is taken for granted. They unequivocally expressed their interest in joining an expanded NAFTA at the Summit of the Americas in Miami in December 1994. The FTA of the Americas will be much more than an area defined in terms of preferential access for goods. It will be more an area defined in terms of a network of agreed rules, most importantly concerning the cross-country establishment and property rights.
The issue of whether joining an expanded NAFTA is compatible with continued membership of the ACP group is likely to arise at some stage. Article 174 of the Lomé IV Convention reads as follows:
1. In view of their present development needs, the ACP States shall not be required for the duration of this Convention to assume, in respect of imports of products originating in the Community, obligations corresponding to the commitment entered into by the Community under this Chapter in respect of imports of the products originating in the ACP States.
StBa/Eurostat Caribbean ACP countries, 1995 33
2. (a) In their trade with the Community, the ACP States shall not discriminate among the Member States and shall grant to the Community treatment no less favourable than most-favoured-nation treatment.
(b) Notwithstanding specific provisions of this Convention, the Community shall not discriminate between ACP States in the field of trade.
(c) The most-favoured-nation (MFN) treatment referred to in subparagraph (a) shall not apply in respect of trade or economic relations between ACP States or between one or more ACP States and other developing countries.
It is possible that the ACP Caribbean might be granted a derogation to allow them to grant tariff-free entry to NAFTA goods without offering the same access terms to EU exports, as has been allowed for certain southern African countries in their trade with South Africa. Alternatively the EU might insist that the equivalent tariff-free access was granted to all EU exports. This would create additional problems for budget revenues as well as reducing protection for particular Caribbean industries. At the same time the Caribbean countries have demonstrated a growing awareness of the gains that ensue from liberalising trade, in the lower cost of imported inputs into their own production, in lower consumer prices, in the spur it yields to improving productivity and international competitiveness and, in general, the strengthened links with the international economy.
StBa/Eurostat 34 Caribbean ACP countries, 1995
2. E C O N O M I C S T R U C T U R E A N D D E V E L O P M E N T OF T H E C A R I B B E A N
A C P C O U N T R I E S
The overall economic development of the Caribbean is very much dependent upon domestic economic activity in three countries - the Dominican Republic, Jamaica and Trinidad and Tobago - which together account for almost 60% of the region's total value added. All in all, real growth in gross domestic product in the Caribbean (in 1987 prices) has been rather disappointing since 1980. Between 1980 and 1993, the total value added of the 15 Caribbean ACP countries (excluding Montserrat) rose by 10.2% from US$ 20 991 million to US$ 23 135 million, which is a modest 0.8% per annum (cf. Figure 2.1 and Table 2.1). One major restraint on growth in total GDP was the prolonged recession in Trinidad and Tobago, whose economy had previously been the strongest in the region. This recession was triggered by a drop in oil production at the beginning of the 1980s and then exacerbated by the collapse in oil prices on the world market from 1986 onwards. Between 1980 (US$ 5 638 million) and 1993 (US$ 4 609 million) Trinidad and Tobago's GDP fell by 18% (cf. Table 2.3). The fact that there was a slight increase in the region's economic output during this period was primarily due to the more positive trends recorded in the Dominican Republic and Jamaica. Trinidad and Tobago has since lost its place as the strongest Caribbean ACP economy to the Dominican Republic. Whilst high growth rates were also recorded by several other countries, chiefly Belize and the small Eastern Caribbean countries of Antigua and Barbuda, Dominica, Grenada, St Kitts and Nevis, St Lucia and St Vincent and the Grenadines, they did not have the economic clout to significantly influence economic growth in the region.
Following a period of virtual stagnation in regional output between 1980 and 1985 when the average annual increase was only 0.1%, the second half of the decade saw GDP rise by 1.4% per annum, mainly as the result of an upturn in the global economy which helped stimulate the tourism and mining sectors. However, the recession in the western industrialized countries, particularly North America and Western Europe, which provide the bulk of tourists to the Caribbean and the lion's share of the demand for the region's export products, resulted in growth in GDP falling back to 0.7% in 1991 and 1.0% in 1992. Initial estimates for 1993 also predict an increase of only 0.7% in real value added for the Caribbean countries. Whilst the start of the economic recovery in North America has generated much greater tourist activity, other factors such as adverse weather conditions, low international prices for agricultural products, the depreciation of the pound sterling and the introduction of new uniform regulations on EU banana imports with the completion of the Single European Market have had a detrimental effect on the production and export of agricultural products (sugar and bananas in particular) in a number of Caribbean countries (cf. Chapters on Agriculture, Forestry and Fisheries and Foreign Trade). The slump in the international commodities markets also put a damper on regional growth in GDP. The further drop in oil production and tumbling world market prices for crude oil in the 4th quarter of 1993 caused
StBa/Eurostat Caribbean ACP countries, 1995 35
Trinidad and Tobago's GDP to fall sharply in 1993, whilst the bauxite-producing countries. Jamaica and Suriname, registered only moderate growth due to flagging international demand. Another factor which curbed economic growth in 1993 was the serious crisis in the Haitian economy caused by the country's isolation from foreign trade activities following the military takeover. In addition, the introduction of the Common External Tariff (CET) in 1993 adversely affected the short-term economic development of some countries, since in some cases the initial effect of this measure was to reduce State revenue and place certain branches of industry under greater pressure from international competition.
At the present moment, one can only attempt to estimate overall economic development in the Caribbean region in 1994 and such attempts are fraught with uncertainty. It would nevertheless seem likely that the regional economy is in better shape than in 1993 due to the steady expansion of tourism and the boost in sugar production. On top of this, the economic recovery in Trinidad and Tobago, the marked increase in economic activity in Barbados and the continuing upsurge in value added in the Dominican Republic and Guyana have all had a part to play. On the basis of these facts, it would seem reasonable to assume that regional GDP rose by 1.5% to 2% in real terms in 1994.
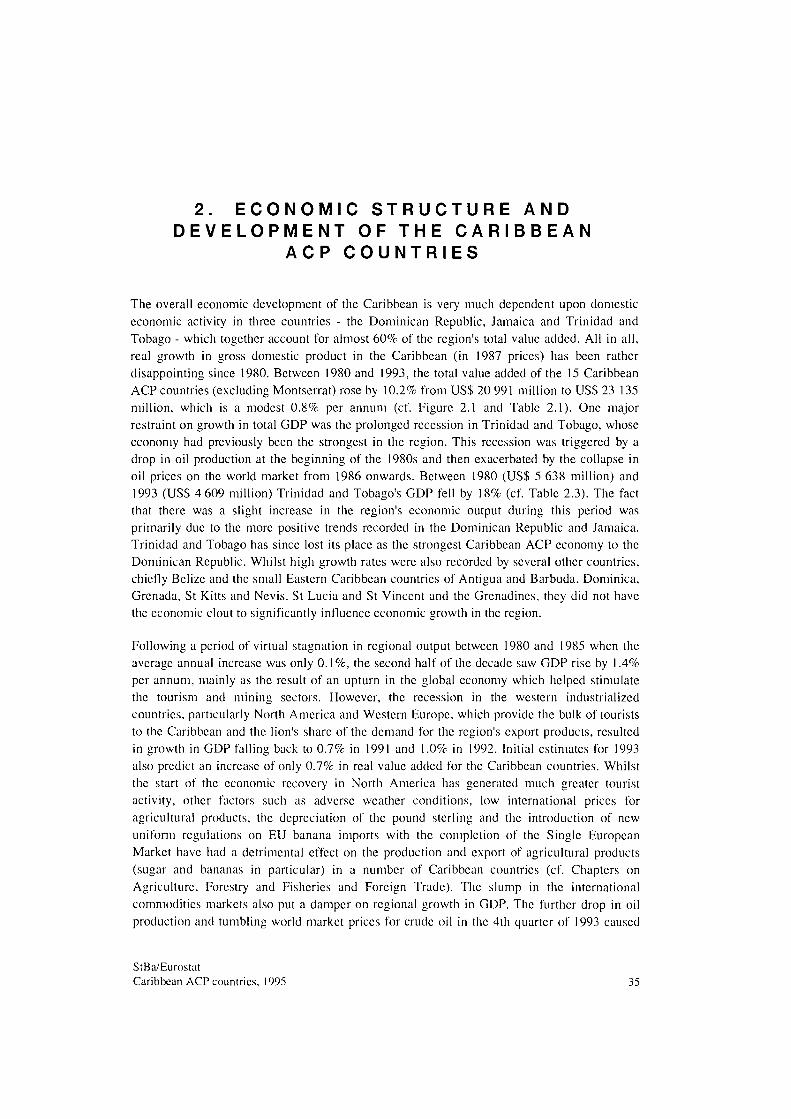
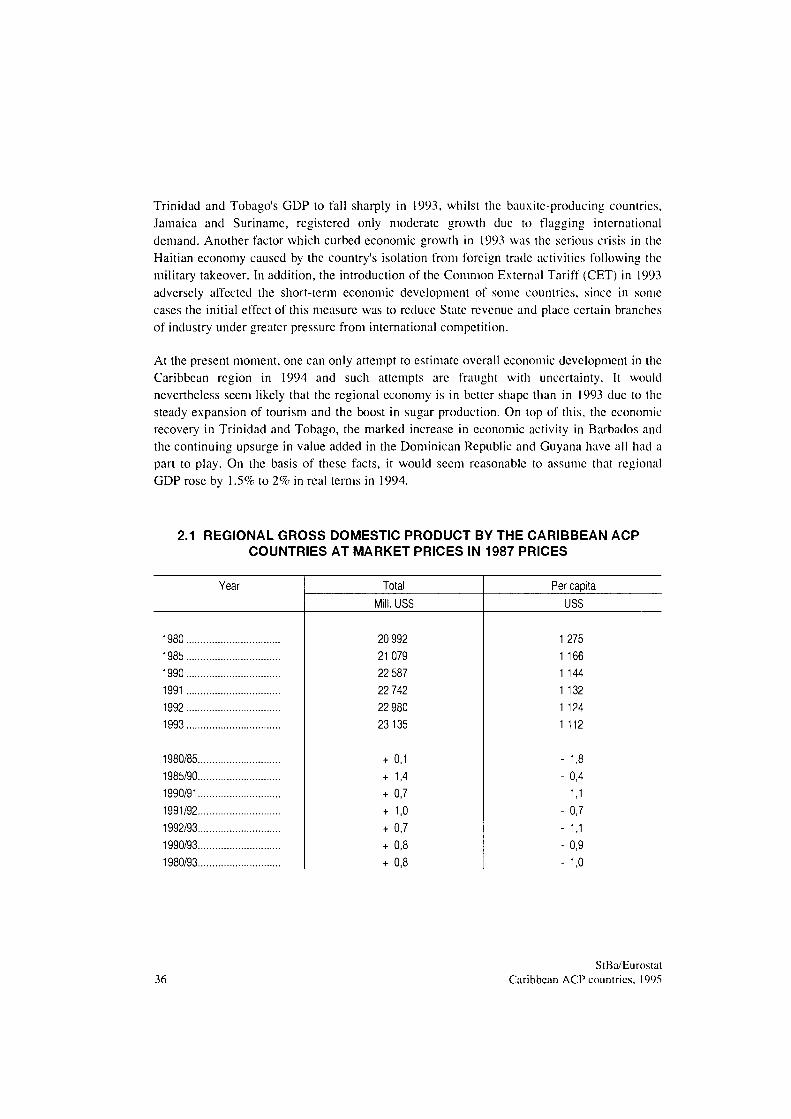
2.1 REGIONAL GROSS DOMESTIC PRODUCT BY THE CARIBBEAN ACP COUNTRIES AT MARKET PRICES IN 1987 PRICES
Year
1980 1985 1990 1991
1992 1993
1980/85 1985/90 1990/91 1991/92 1992/93 1990/93 1980/93
Total
Mill. USS
20 992 21079 22 587 22 742 22 980 23135
+ 0,1 + 1,4 + 0,7 + 1,0 + 0,7 + 0,8 + 0,8
Per capita
USS
1 275 1 166 1 144 1 132 1 124 1 112
- 1,8 - 0,4
- 1,1 - 0,7
- 1,1 - 0,9 - 1,0
36 StBa/Eurostat
Caribbean ACP countries, 1995
2.1. CARIBBEAN ACP COUNTRIES:
DEVELOPMENT OF REGIONAL GROSS DOMESTIC PRODUCT
AT MARKET PRICES (IN 1987 PRICES)
Total in USD Bn 25
20
15
10
5
1.5
0.5
1980 1985 1990 1991 1992
Change or average growth rate in %
1993
i t i l i
jKW-v.-'.m'&Wü
tiili
80/85D 85/90D 1990/91 1991/92 1992/93
1500
1250
1000
750
500
250
0
0
-0.5
-1
-1.5
Per capita in USD
1980 1985 1990 1991 1992
Change or average growth rate in %
1993
1I1PII [iilil 1
1
;
80/85A 85/90A 1990/91 1991/92 1992/93
Statistisches Bundesamt 95 0207 Β
StBa/Eurostat
Caribbean ACP countries, 1995 37
The abovementioned slow economic growth combined with a much faster increase in the population led to average per capita GDP for the 15 countries falling between 1980 and 1993. Whereas regional per capita economic output had been US$ 1 275 in 1980, it subsequently slid to US$ 1 166 in 1985, US$ 1 144 in 1990 and down to US$ 1 112 in 1993 (cf. Table 2.1 and Figure 2.1). This amounts to a total reduction of 12.8%. or around 1% per year. An analysis of the trend in the various countries reveals enormous differences in per capita output. The highest per capita GDP in 1993 was to be found in the Bahamas with US$ 8 860, followed by Barbados with USS 5 563 and Antigua and Barbuda with US$ 5 510 (cf. Table 2.3). At the bottom end of the scale came Guyana (US$ 473) and Haiti (US$ 270), which arc two of the world's poorest countries. The differences in per capita GDP increased significantly during the 1980s and early 1990s, as many of the smaller countries whose per capita value added was already high in 1980 experienced economic growth which was well above the regional average, whilst output in most of the larger countries with low per capita figures in 1980 either rose slowly or fell. For example, per capita GDP had doubled by 1993 in countries such as Antigua and Barbuda, St Kitts and Nevis and St Lucia, where the 1980 values were already above average. Haiti represents the opposite extreme: its 1980 figure for per capita GDP was already the lowest in the region at US$ 424, yet even this had fallen by half in 1993 as a result of the latest economic crisis. The gravity of the economic recession in Trinidad and Tobago is reflected in the fact that average per capita value added fell by more than 30% from the heights of US$ 5 210 in 1980 to US$ 3 603 in 1993. These differences in per capita GDP provide an insight into the substantial disparities in economic performance and standard of living within the Caribbean.
2.2. ANNUAL AVERAGE GROWTH IN GROSS DOMESTIC PRODUCT BY THE CARIBBEAN ACP COUNTRIES AT MARKET PRICES IN 1987 PRICES
%
Country 1930/85 1985/90 1990/91 1991/92 1992/93 1980/93 1990/93
Antigua and Barbuda.. Bahamas Barbados Belize Dominica Dominican Republic... Grenada Guyana Haiti Jamaica
+ 5.3 + 3.7
0.9 + 0.4 + 5.6 + 1.6 + 3.8
3.8 1.0
- 0.1
+ + + + + + + -+ +
Total GDP
7.4 2.1 3.4 9.2 5.5 1.9 5.9 2.9 0.2 4.1
+ --+ + -+ + + +
4.9 3.1 2.3 4.6 4.9 0.7 2.3 6.3 0.7 0.7
+ + -+ + -+ + + +
0.4 0.1 5.5 9.1 0.8 7.4 1.2 8.3
10.8 1.4
+ + + + + + + + -+
3.5 2.0 1.5 4.2 1.7 2.9 1.0 7.9 4.7 1.2
+ + + + + + + --+
5.5 2.2 0.4 5.0 4.8 2.1 3.9 0.9 1.5 1.8
+ --+ + + + + -+
2.9 0.4 2.2 6.0 2.5 3.1 0.7 7.5 5.1 1.1
38 StBa/Eurostat
Caribbean ACP countries. 1995
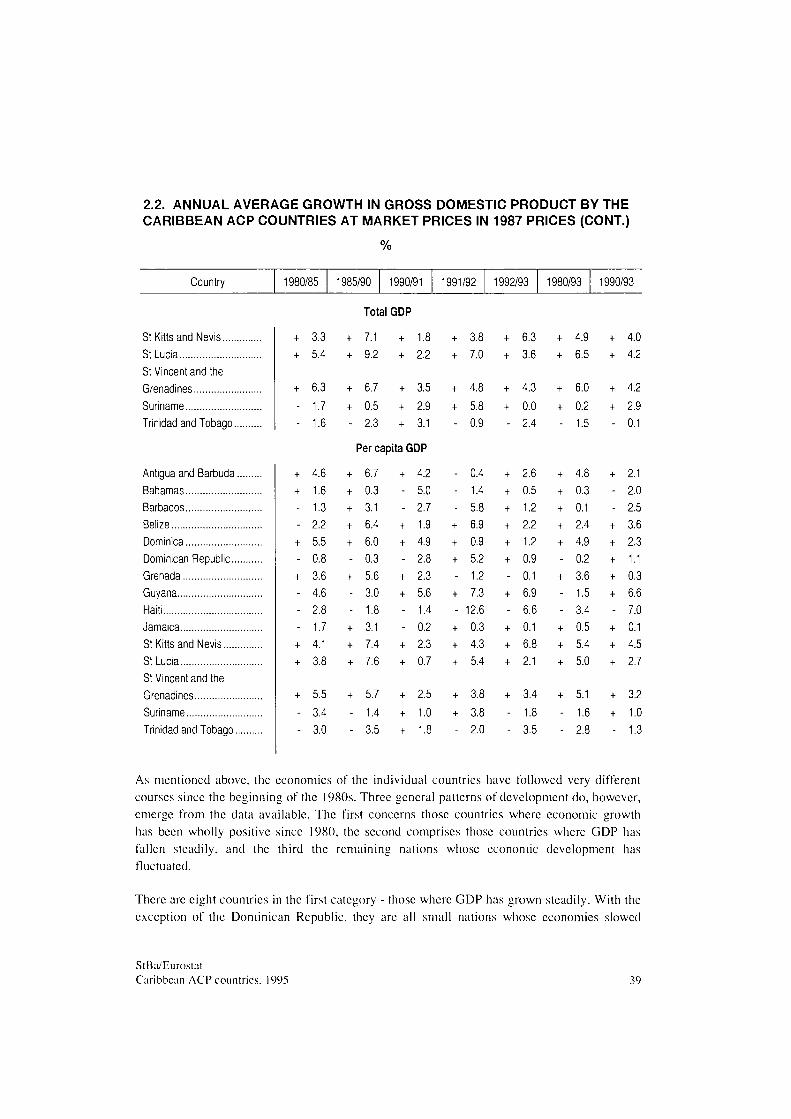
2.2. ANNUAL AVERAGE GROWTH IN GROSS DOMESTIC PRODUCT BY THE CARIBBEAN ACP COUNTRIES AT MARKET PRICES IN 1987 PRICES (CONT.)
%
Country 1980/85 1985/90 1990/91 1991/92 1992/93 1980/93 1990/93
St Kitts and Nevis St Lucia St Vincent and the Grenadines Suriname Trinidad and Tobago..
Antigua and Barbuda. Bahamas Barbados Belize Dominica Dominican Republic... Grenada Guyana Haiti Jamaica St Kitts and Nevis St Lucia St Vincent and the Grenadines Suriname Trinidad and Tobago..
+ +
+ --
+ + --+ -+ ---+ +
+ --
3.3 5.4
6.3 1.7 1.6
4.6 1.6 1.3 2.2 5.5 0.8 3.6 4.6 2.8 1.7 4.1 3.8
5.5 3.4 3.0
+ +
+ + -
+ + + + + -+ --+ + +
+ --
Total GDP
7.1 9.2
6.7 0.5 2.3
+ +
+ + +
1.8 2.2
3.5 2.9 3.1
Per capita GDP
6.7 0.3 3.1 6.4 6.0 0.3 5.6 3.0 1.8 3.1 7.4 7.6
5.7 1.4 3.5
+ --+ + -+ + --+ +
+ + +
4.2 5.0 2.7 1.9 4.9 2.8 2.3 5.6 1.4 0.2 2.3 0.7
2.5 1.0 1.8
+ +
+ + -
---+ + + -+ -+ + +
+ + -
3.8 7.0
4.8 5.8 0.9
0.4 1.4 5.8 6.9 0.9 5.2 1.2 7.3
12.6 0.3 4.3 5.4
3.8 3.8 2.0
+ +
+ + -
+ + + + + + -+ -+ + +
+ --
6.3 3.6
4.3 0.0 2.4
2.6 0.5 1.2 2.2 1.2 0.9 0.1 6.9 6.6 0.1 6.8 2.1
3.4 1.8 3.5
+ +
+ + -
+ + + + + -+ --+ + +
+ --
4.9 6.5
6.0 0.2 1.5
4.8 0.3 0.1 2.4 4.9 0.2 3.6 1.5 3.4 0.5 5.4 5.0
5.1 1.6 2.8
+ +
+ + -
+ --+ + + + + -+ + +
+ + -
4.0 4.2
4.2 2.9 0.1
2.1 2.0 2.5 3.6 2.3 1.1 0.3 6.6 7.0 0.1 4.5 2.7
3.2 1.0 1.3
As mentioned above, the economics of the individual countries have followed very different courses since the beginning of the 1980s. Three general patterns of development do, however, emerge from the data available. The first concerns those countries where economic growth has been wholly positive since 1980, the second comprises those countries where GDP has fallen steadily, and the third the remaining nations whose economic development has fluctuated.
There arc eight countries in the first category - those where GDP has grown steadily. With the exception of the Dominican Republic, they arc all small nations whose economics slowed
StBa/Eurostat Caribbean ACP countries. 1995 39
down after 1990 as a knock-on effect of the recession in the western industrialised nations (which resulted in fewer tourists), price movements on the international agricultural and commodities markets and/or the reorganisation of their preferential trade relations with the EU and North America. This meant that from 1990 to 1993, some of them recorded substantially lower growth rates than those seen in the second half of the 1980s.
Antigua and Barbuda is one country where the economic upturn has been uninterrupted since 1980. Between 1980 and 1993 annual GDP rose by an impressive 5.5%. The annual growth rate had already been 5.3% from 1980 to 1985, but rose further in 1985/90 to an average 7.4%. The increase in value added then dropped to 2.9% per year between 1990 and 1993, having risen from a very modest +0.4% in 1992 to 3.5% in 1993 thanks to the resurgence in foreign tourism when the recession in North America abated. Economic growth in 1993 would have been even greater had it not been for the downturn in the construction industry, industrial production falling for the third consecutive year, and the increase in agricultural production being tempered by high production costs and bad weather.
Estimates differ as to the economic outlook for 1994. The Economist Intelligence Unit (EIU) assumes real growth of 3.0%, whilst the Eastern Caribbean Central Bank (ECCB) assesses the prospects for growth more favourably. Behind its forecast of 5.5% real growth in GDP lies the assumption that there will be a significant expansion in tourism in view of the latest increase in hotel and flight reservations, mainly from Europe (cf. Chapter 5). The ECCB also expects there to be a clear upturn in the construction industry in 1994, mainly due to the start of a road improvement programme for the whole island and growth in private investment. Antigua and Barbuda's economic development beyond 1994 is heavily dependent upon the development of tourism, which is of paramount importance to the economy. In order to achieve its declared aim of expanding the tourist sector, it needs to promote tourism aggressively and completely overhaul its infrastructure. In an attempt to reduce the country's dependence on international tourism, expand its economic basis and make it less dependent on imports of agricultural products, the government has recently stepped up support for the agricultural sector, focussing particularly on vegetable production and, using funds from the European Development Fund (EDF), on promoting the livestock industry. In this way, the government hopes to achieve lasting success in raising the profile of the agriculture, forestry and fisheries sector, which at present contributes less than 5% of total GDP (cf. Table 2.4).
Economic growth in Belize has been constant, although the rate has fluctuated. The balance of payments crisis triggered off by the collapse in sugar prices seriously hampered economic development during the first half of the 1980s, with GDP going up only a modest 0.4% per year from 1980 to 1985. Growth was much stronger in the second half of the decade, however, reaching 9.2% p.a. as a result of the push to expand exports of agricultural products, which displaced the hitherto dominant forestry sector as the main branch of the economy, and the onset of the tourist boom. This growth in the Belize economy continued in 1990/93, but the rate of increase was down on the preceding period at an average 6.07c per annum. In 1993 in
StBa/Eurostat 40 Caribbean ACP countries, 1995
particular, when value added rose by only 4.2%, there were clear signs that the economy was cooling off, although the average increase in GDP for the period from 1980 to 1993 as a whole was still high at around 5.0% p.a. One of the main causes of the weaker growth in 1993 was the revision and reorientation of official development strategy carried out by the newly-elected government which took over in June 1993. This led to delays in the implementation of numerous public projects during the second half of the year. Another damper on economic growth came in the form of lower export earnings from citrus fruits, which have duty-free and quota-free access to the US market under the Caribbean Basin Initiative (CBI). Sugar and banana exports, on the other hand, continued to be satisfactory in 1993, whereas manufacturing industry, which relies heavily on import substitute industries, also suffered in 1993 from the limited internal market.
The EIU predicts a further drop in GDP growth to 0.4% in 1994, primarily as a result of the withdrawal of the British garrison, whose spending in days gone by was estimated by the government to account for almost 4% of the country's GDP. GDP is then expected to go up again by around 4% in 1995 as a result of higher prices for sugar and citrus fruits and an increase in the number of tourists. Another factor which should have a positive effect is the agreed increase in the EU banana quota for Belize in 1995 from 40 000 t to 55 000 t. The government, meanwhile, is making strenuous efforts to diversify the range of agricultural exports partly because the economy is very dependent on foreign trade, as illustrated by the fact that well over 50% of the total value added in goods and services is exported (cf. Table 2.5), and also because it is very likely that the preferential market access accorded to its traditional agricultural export products (sugar, citrus fruits and bananas) will have elapsed by the turn of the century. As a result, the cultivation of papayas, cucumbers and ginger is being strongly encouraged in an attempt to offset the dwindling market openings for traditional produce with exports of these new products.
Economic growth in Dominica was high at 4.8% per annum between 1980 and 1993. The substantial 5.6% average growth rate recorded in 1980/85 was sustained throughout the second half of the decade, before falling to 2.5% p.a. between 1990 and 1993. 1992 (+0.8%) and 1993 (+1.7%) in particular were years of poor economic growth, 1993's moderate increase in GDP mainly being due to the crisis in the banana sector caused by the depreciation in the pound sterling at the end of 1992. This resulted in banana production falling and export earnings from bananas shrinking by around one-fifth. With overall agricultural output in 1993 down by 2.0% in real terms, the modest growth rate can mainly be explained by the increase in the number of tourists and the dynamic building activity engendered by the extension of the hotel infrastructure.
The 1994 estimates for Dominica also suggest only moderate expansion. Above all, the continuing problems in the banana sector, which were exacerbated by the dry spell at the beginning of 1994 and Cyclone Debbie in September 1994. are likely to have negative repercussions on the development of the economy as a whole. The expected further slight
StBa/Eurostat Caribbean ACP countries, 1995 41
increase in GDP in 1994 is based on assumptions that the construction sector will remain buoyant, tourism will expand (with the promotion of cco-tourism) and industrial growth (especially food processing) will be solid. However, it will be 1995 at the earliest before more cost-efficient production methods lead to a recovery in the banana sector and stronger growth rates than those recorded between 1992 and 1994. In order to guarantee lasting economic growth, however, steps need to be taken to promote agricultural production other than bananas and to divert resources into the services sector.
Grenada is another of the countries where the economic upswing has been constant. However, following an average 3.8% increase in 1980/85 and 5.9% in 1985/90, the growth curve for 1990/93 fell back to a modest 0.7%, forcing the annual increase in GDP over the whole period from 1980 to 1993 back down to 3.9% - the lowest growth rate of all the OECS countries. During the second half of the 1980s, the thriving construction industry, strong industrial sector and healthy growth in tourism had still been strong enough to cushion the first signs of the lull in export trade and produce the high growth rates recorded during this period, but at the start of the 1990s these branches too began to flag. Although agriculture, forestry and fisheries remains one of the pillars of Grenada's economy, its importance in terms of contribution to GDP diminished considerably between 1980 (24.7%) and 1993 (13.7%). The main reason for this is the downward trend in traditional fruit exports which goes back a number of years, as is the case with the steady decline in banana production since 1987 caused by low international prices, drought, dock strikes and marketing problems. The cocoa industry has suffered since the end of the 1980s from the slump in world market prices and poorer yields due to the overmaturity of the cocoa trees, and the recent trend in nutmeg production has also been negative. 1992 even saw a temporary drop in GDP (-1.2%) as tourism rose only marginally and construction activity tailed off. The recession in the export-oriented agricultural sector and the construction sector did not let up in 1993 and industrial output also fell for the first time since 1984 as a result of dwindling production by the food processing and drinks industries. It was only because of the recovery in the tourist industry due to the increased influx of holidaymakers from the United States that GDP rose slightly by 1.0% in 1993.
There seems to be little chance of an appreciable upturn in the economy in 1994, given the absence of radical improvements in the conditions governing agricultural production, and the probable negative effects on industry of the reduction in the number of exemptions from trade tax. Tourism, however, should be given a further boost by the economic upturn in North America and the United Kingdom. Given these premises, the EIU estimates that GDP will grow by just 0.6% in 1994, whilst the ECCB feels that a return to higher growth rates in the medium term will be very much dependent on how much progress is made in effectively implementing the programme of public investment.
The economy of St Kitts and Nevis grew by 4.9% p.a. between 1980 and 1993 in a number of different stages. GDP rose by only 3.3% per year from 1980 to 1985, shot up to 7.1% in the
StBa/Eurostat 42 Caribbean ACP countries. 1995
second half of the decade and then dropped back again to 4.0% between 1990 and 1993. The two main pillars of the economy are tourism and sugar production. The latter took a while to recover from the 1990 production low induced by low prices on the international market and although the 1993 harvest did show an increase it still fell short of its 1989 level. The moderate increase in the production and processing of sugar cane together with the growth in tourism and a dynamic building sector (including the construction of the new ECCB headquarters, new hotels and residential buildings) produced a 6.3% growth rate in 1993 in constrast to the sluggish state of the economy in the preceding years. The economic outlook for 1994 is for continued growth based on the thriving construction industry, a further expansion of tourist activity and the increase in hotel capacity. However, with the sugar industry expected to show little vitality, the forecast is for economic output to only increase by around 3%. It is also anticipated that the decline in the importance of the sugar industry (and, by extension, agriculture as a whole) which has been evident for some years will continue in 1994. In order to make the economy less dependent on sugar cultivation and tourism, the State plans to diversify agricultural production with a view to strengthening self-sufficiency in foodstuffs and expanding agro-industrial processing capacity. Other priority areas in the public domain include improvements to the infrastructure and the development of tourist facilities.
St Lucia's economy recorded the strongest growth rate of all the Caricom countries for the reference period as a whole, since this eastern Caribbean nation's average annual GDP growth rate amounted to 6.5% for the period from 1980 to 1993. After an annual increase in value added of 5.4% in 1980/85, the growth rate peaked at an average of 9.2% p.a. during the second half of the 1980s. The economy then cooled down appreciably during the early 1990s as the increase in total economic output dropped back to an average of 4.2% per annum from 1990 to 1993. This was due to moderate growth in 1991 (+2.2%) and 1993 (+3.6%), mainly resulting from hiccups in the banana sector. Banana production fell and export earnings dwindled in 1993 because of bad weather, the depreciation in the pound sterling since the end of 1992 and the introduction half way through the year of new regulations concerning preferential access into the EU for bananas from ACP countries. With cocoa production also falling, agricultural output in 1993 was down in real terms despite more abundant harvests of other products (incl. copra, tropical and subtropical fruits, and vegetables). Retail trade also contracted on account of the slump in agricultural production. The positive growth rate of over 3% was. therefore, mainly due to the advances made by the construction industry, tourism, the transport sector and manufacturing industry.
The growth rate is expected to be down again in 1994, given the likelihood of a further fall in the production and export of bananas due to marginal producers being squeezed out and the damage caused by Cyclone Debbie. The EIU estimates that GDP will increase by just 1.5%. The Banana Growers Association (BGA) has exhausted the reserves set aside for price supports, and although the EU is providing financial support for a programme to restructure the banana industry which aims to increase its international competitiveness vis-à-vis the
StBa/Eurostat Caribbean ACP countries. 1995 43
'dollar banana', medium- and long-term restructuring of the economy needs to be carried out in favour of manufacturing industry and the services sector (tourism) in order to make it less vulnerable to the imminent changes in preferential access to the EU banana market. Forecasts of growth rates ranging from 2% to 4% over the next few years are. therefore, realistic despite the recession in the agricultural sector, mainly because of the good opportunities for expansion in the tourism sector. Also, the influx of several new enterprises should help strengthen the country's industrial base (cf. Chapter 14).
The economy of St Vincent and the Grenadines is just as dependent on banana-growing and tourism as that of St Lucia, and has therefore followed much the same trend. After a period of healthy expansion during the 1980s (1980/85 A: +6.3% p.a.: 1985/90 A: +6.7% p.a.). the pace of growth slowed down at the start of the 1990s (1990/93 A: +4.2% p.a.). The overall growth rate for GDP between 1980 and 1993 totalled 6.0% p.a. As in the case of St Lucia, the lower growth rates at the start of the 1990s were due to the slump in banana production which was only partly offset by the bouyant tourist industry and positive developments in other sectors such as construction and the distributive trades. According to both the EIU and the United Nations Economic Commission for Latin America and the Caribbean (ECLAC), real value added rose by 3.0% in 1994. Banana production in 1994 is thought to have fallen to its lowest level for 10 years (around 30 000 t), producing substantial export losses. The main contributors to growth in GDP in 1994 arc likely to be tourism, which is still booming, and the construction industry which is reaping the benefits of the State investment programme. The government's efforts to broaden the range of agricultural export products have recently begun to bear fruit with, for example, exports of root crops and vegetables to Trinidad and Tobago gaining in importance.
This same mainly upward trend was also followed by the economy of the Dominican Republic during the 1980s and early 1990s, although with GDP falling slightly during some of these years the overall growth rate of 2.1% p.a. between 1980 and 1993 was appreciably lower than in the eastern Caribbean countries. The country's economy grew by only a modest 1.6% per year on average during the first half of the 1980s. This unsatisfactory trend was caused by low export growth and rising oil prices, which led to balance of payments difficulties and put pressure on public finances. This resulted in greater recourse to foreign loans, which in turn forced the country into a debt crisis. The austerity measures recommended by the International Monetary Fund (IMF) had little initial effect with the result that economic output again rose only slightly in 1986. In 1987. increased tourist activity briefly produced a much higher growth rate, but the increase in value added dropped back to under 1% in 1988, mainly as a consequence of problems with agricultural, mining and industrial output stemming from inadequate supplies of electricity.
In 1989. the government's Public Works Programme, a flourishing tourism sector and the expansion of free trade zones all fostered strong economic growth in the Dominican Republic, but in 1990 the economic reforms, carried out in accordance with IMF specifications, and
StBa/Eurostat 44 Caribbean ACP countries. 1995
energy shortages combined to produce an initial 5% fall in GDP. In view of these fluctuating trends, value added was again only slightly up during the second half of the 1980s (1985/90 D: +1.9% per annum). After a further slight fall in GDP in 1991 (-0.7%), the economy experienced a boom which produced real growth of 7.4% in 1992. The dominant factors behind this upturn were a flourishing tourist industry and strong growth in the construction and energy sectors and manufacturing industry. In 1993, the increase in GDP was lower than the previous year at 2.9%. All in all, however, the economy grew by 3.1% p.a. between 1990 and 1993 - a much stronger performance than during the 1980s. One of the plus points behind these figures is that with the development of free trade zones, tourism and non-traditional exports, the Dominican Republic is now considerably less susceptible to fluctuations in international nickel and sugar prices and the economy has been put on a substantially more solid production basis.
Initial results show that despite some lingering unstable macroeconomic conditions, 1994 was a good year for the Dominican Republic economy. The EIU, ECLAC and the national central bank are all agreed that GDP should have risen by 4.0% in real terms, this growth being due first and foremost to the 88% increase in mining production. According to the first estimates available, nickel production should be up 135% in 1994 as a result of rising world market prices, and another reason for the strong growth in mining activity was the reopening of the Rosaria gold and silver mine. Other important contributory factors behind the upward trend in GDP include the electricity and water sector, the free trade zones, the communications industry, tourism and construction. Agricultural production, on the other hand, fell slightly as a result of the dry weather conditions. GDP is expected to increase in 1995 at much the same rate as in 1994 in view of the rising world market prices for some key export products (incl. nickel and cocoa). Mining, agriculture and, above all, tourism arc other key sectors which should stimulate growth in 1995.
The second group comprises just two countries - Haiti and Trinidad and Tobago - where economic performance has fallen constantly since 1980, although the reasons for this downswing are very different in each of the two cases.
Haiti's economy is one of the most underdeveloped in the western world. It is heavily dependent upon agriculture, has few foreign trade components and much of the production is still at a subsistence level. Economic, and particularly industrial, growth has been seriously hampered by the lack of effective export trade and the absence hitherto of strong demand from the domestic market. Between 1980 and 1985, GDP fell by 1.0% per annum due to the effect of these structural flaws in the economy combined with the worldwide recession, the devastation wrought on the agricultural sector by Hurricane Allen, a poor credit basis arising from its underdeveloped money economy and its abortive attempts to reduce the budget deficit. The second half of the decade was characterized by stagnant production (1985/90 D: +0.2% per annum). Economic activity in Haiti has been particularly badly affected by the exodus of US export-assembly industries as a result of the increasingly unstable political
StBa/Eurostat Caribbean ACP countries, 1995 45
climate since 1986 and by the diminishing numbers of foreign visitors. The military coup in September 1991 then crippled the economy and also led to the suspension of foreign development assistance and the imposition of a trade embargo by the Organization of American States (OAS). The situation reached a climax in 1994 with the preparations for a military invasion by the USA and the subsequent restoration of ex-President Aristide who had fled into exile in 1991. As a consequence of these political upheavals, the Haitian economy plunged into serious recession. After recording a marginal growth rate of 0.7% in 1991, real value added tumbled by 10.8% in 1992 and the ECLAC estimates that GDP will be down 4.7% in 1993. This means that value added will have fallen by an average of 5.1% p.a. between 1990 and 1993 and by 1.5% p.a. for the period from 1980 to 1993 as a whole.
With the tightening of the trade embargo in May 1994 and the subsequent US intervention, the ECLAC predicts that the economy will have contracted by a further 10% in 1994. Many secondary branches of economic activity felt the effects of this recession and production came to a virtual standstill in the few remaining export-assembly industries. Even those branches of industry serving the domestic market were obliged to shut down much of their production. There was at least, however, an increase in the output of some agricultural products as many coffee-growers switched over to cultivating products for domestic customers in view of the low world market prices for coffee and the high cost of artificial fertilizers. Instead of the intended increase in economic diversity being achieved, agriculture has actually become even more important to the economy since the beginning of the 1980s because of the above-mentioned developments (cf. Table 2.2). Even with the return of President Aristide, the chances of a speedy economic recovery are slim, as the inefficiency of the government bureaucracy is still a major stumbling block. One glimmer of hope is the fact that the EU has announced the resumption of development assistance, and the World Bank has held out the possibility of offering a sizeable loan. With Haiti able to count on an externally-financed aid programme totalling some US$ 600 million for 1995, there arc grounds for believing that the economy of this Caribbean country will recover in the medium-term at least.
The other country where value added has dropped virtually every year since the beginning of the 1980s is Trinidad and Tobago. In contrast to Haiti where the negative trend is largely conditioned by internal political influences, the economic crisis in Trinidad and Tobago is mainly due to exogenous factors. As an oil-producing country, its economy has been particularly badly affected by the slump in world market prices for crude oil which has lasted since the mid-1980s. Even though the erosion in the oil sector's share of GDP has been almost constant since 1980, this sector still accounts for between 20% and 25% of total value added. On top of this, the crude oil extracted supports the petrochemical industry, which plays a key role in manufacturing industry. The strength of oil-related activities means that over 40% of total economic output is still produced by the secondary sector of the economy. Following the period of strong growth in GDP at the end of the 1970s driven by the thriving
StBa/Eurostat 46 Caribbean ACP countries. 1995
oil industry, the Trinidad and Tobago economy collapsed into severe recession after 1982. GDP was already falling by 1.6% per year in the early 1980s, and with the crisis intensifying as oil extraction slowed down and international oil prices dropped after 1986, GDP then nosedived by -2.3% p.a. between 1985 and 1990. The balance of payments deficits caused by the rapid reduction in export earnings after 1985 were initially absorbed by the foreign currency reserves accumulated during the boom years, but these were exhausted in 1987. The government then imposed tight import (import licencing) and foreign exchange controls to try and prevent the balance of payments getting out of hand. The situation did not improve, however, and when the balance of payments difficulties were then compounded by the increasingly precarious state of public finance, there was no option but to call in the IMF in 1988. The latter guaranteed a standby arrangement of over 99 million SDRs in January 1989 to help Trinidad and Tobago out of its dire financial straits. The economic situation improved temporarily at the beginning of the 1990s with the Gulf Crisis and the resulting increase in oil prices, and after a slight rise in 1990, GDP went up +3.1% in 1991. This helped to consolidate public finances and boost the foreign currency reserves, thus putting an end to the IMF loan. The very next year, however, a further drop in oil production resulted in a return to negative growth (-0.9%) and the situation worsened in 1993 (-2.4%) when oil production dropped to its lowest level since 1960, despite an increase in prospecting, and the international prices for crude oil plunged in the fourth quarter of the year. As a result of the drop in oil production, the petrochemical industry also had to make substantial cutbacks. The increase in economic activity in non-oil sectors, particularly agriculture and some segments of the services sector (finance and insurance), was not enough to offset the serious recession in the oil industry. As a result of the virtually uninterrupted decline in the oil industry since 1982, GDP in Trinidad and Tobago crashed by almost one-fifth over the whole period from 1980 to 1993, at a rate of around 1.5% per year.
1994 saw a reversal in the downward spiral, which had lasted over ten years, as GDP grew by around 4%. According to Central Statistical Office (CSO) data, this was the result of the oil industry expanding by over 10% as the production of crude oil and petrochemicals both shot up. Other determining factors included a sharp increase in sugar production and a construction boom. Real economic growth of 4% to 5% is forecast for 1995 and 1996 on the basis of a rejuvenated oil industry and its dependent manufacturing industries. In the long term, however, there is a need to press ahead with diversifying the economy, a requirement identified back in the 1980s but which has hitherto only proceeded in fits and starts. This is a matter of some urgency given the uncertainties of the crude oil market and, above all, the fact that at the present rate of extraction its known oil reserves will be exhausted in 10 years. There is certainly plenty of potential for extending the economic base in Trinidad and Tobago, such as its large reserves of natural gas, which could also provide a platform for new industrial activities. Nor is there any reason why tourism should not develop its role as an important foreign currency-earner since a number of projects aimed at extending the tourist infrastructure are already under way. The development prospects for agriculture are also very promising, given that its current share of GDP still amounts to less than 3%.
StBa/Eurostat Caribbean ACP countries. 1995 47
The third group of countries comprises those whose economic development has experienced ups and downs. There are five countries in this group and although their economies have all fluctuated, their patterns of development have been very different.
The economy of the Bahamas set off in a positive direction during the first half of the 1980s with GDP rising by 3.7% each year. It continued to expand during the period from 1985 to 1990, but the growth rate was already slowing down (+2.17c per annum). Value added then fell on average by 0.4% a year between 1990 and 1993, mainly as a result of a downturn in tourism, which is the backbone of the economy. Despite this dip in the early 1990s, output over the whole period from 1980 to 1993 was up on average by 2.2%. This susceptibility of the Bahamas economy to short-term fluctuations in the volume of holidaymakers from North America in particular is illustrated by the fact that as the economic situation in the United States and Canada improved and the flow of tourists from these two countries increased, GDP started to climb back up again in 1993 (+2.0%) after the lull of the two previous years. Poor weather conditions in 1993 were responsible for the downward trend in agriculture, but this had little effect on the economy as a whole since agriculture only accounts for around 5% of GDP. The dominance of the services sector in the Bahamas is underlined by the fact that along with tourism financial services (offshore banking) in particular also play an important role. The secondary sector, on the other hand, remains underdeveloped and manufacturing industry's total contribution to GDP is only around 10%.
1994 should be another year of marginal growth in the economy in real terms on account of the increase in revenue from tourism. Official forecasts for 1995 also predict a low level of growth based on the continuing health of the US economy and thus strong expansion by the tourism sector (new hotel developments). In the short and medium term, therefore, the country's ovcrdependence on the general economic condition of the United States will remain its Achilles heel. Given this lopsided dependence on tourism, the government has announced plans to promote specific areas of the agriculture and fisheries sector in an attempt to quickly bring about some diversification of the economy. Another important motive behind developing selected areas of agricultural activity is to try and reduce the high level of expenditure on food imports which weigh heavily upon the balance of trade (cf. Chapter 3).
Economic developments in Barbados followed a completely different course. Value added fell by around 1% p.a. from 1980 to 1985. GDP then rose by 3.47c per annum during the second half of the decade thanks to the healthy expansion of tourism. 1990, however, marked the start of a downward trend in GDP due to the poor economic situation in North America and the associated recession in the tourism sector. Economic output in Barbados then fell by 2.37 in 1991, and 1992 was the third consecutive year of negative growth, this time -5.5%. The economic decline at the beginning of the 1990s can be ascribed not just to the slump in tourism, but also to the recession which hit the other two most important sectors of the economy - agriculture and manufacturing industry. 1993 saw a return to positive growth for the first time in the 1990s (+1.57c). All in all, these widely fluctuating trends resulted in the
StBa/Eurostat 48 Caribbean ACP countries, 1995
Barbados economy more or less stagnating over the reference period, as the average annual growth rate between 1980 and 1993 was a modest +0.47c. The slight increase in 1993 was mainly due to an increase in the number of visitors from North America and the United Kingdom. Other factors which should be taken into consideration in 1993 were the growth in the construction industry and distributive trades whilst output fell in agriculture and manufacturing industry. The drop in agricultural output was mainly the result of a fall in sugar production, but the production figures for other crop products as well as poultry and milk were also down. The reduction in output by manufacturing industry was mainly due to poor performance by the furniture and electronics industries.
The EIU and ECLAC both agree that the economy picked up substantially in 1994 and are forecasting vigorous growth of 4.0% in real terms. Alongside the upturn in tourism, increases in sugar production and industrial production both contributed to the improved health of the economy. The growth in GDP is then expected to slip back to 37c in 1995, primarily because the sugar harvest will, in all probability, be around one-third lower than the previous year as the result of an unusually long dry period. On the other hand, the recovery in the North American and European economies should mean that tourism continues along the path of dynamic growth.
The pattern of economic development in Guyana was relatively atypical since its economy is comparatively broad-based by Caribbean standards (mining, agriculture, forestry, fisheries). The country's GDP fell by an annual 3.87c between 1980 and 1985 and value added continued to decrease during the second half of the decade (-2.9% per annum). The fact that this crisis in the Guyanan economy lasted throughout the decade was the result of declining production by the main export branches, a chronic shortage of foreign currency, hefty debt servicing, a serious public finance crisis, inadequate infrastructure facilities and an inefficient State bureaucracy. In order to tackle these serious structural deficits hampering the economy, the government launched an Economic Reconstruction Programme (ERP) in 1988 aimed at privatizing unprofitable State enterprises, liberalizing the economy and encouraging foreign investment. The subsequent conclusion of an agreement with the IMF smoothed the way for the rescheduling of debts and the inflow of project and programme aid. The enthusiastic application of these reforms along with a sharp increase in private investment activity met with success at the beginning of the 1990s, producing a high average annual growth rate of +7.57c between 1990 and 1993. GDP had already soared by 6.37c in 1991 before the growth rate in value added reached the heights of 8.3% in 1992, and this strong growth was pretty much sustained in 1993 when the increase in GDP totalled 7.9%. Despite these recent impressive figures for economic growth, however, the nation's value added in 1993 was still below its 1980 level, as Guyana's economic output over the whole of the reference period fell on average by 0.97c p.a. As already mentioned, the powerful surge in production in the early 1990s was underpinned by a significant upswing in investment activity, which is reflected in the fact that the investment ratio had risen to almost 54% of GDP in 1993 (cf. Table 2.5). As a result of the massive inflow of investment, gold-mining, timber production and rice-growing
StBa/Eurostat Caribbean ACP countries. 1995 49
in particular were the dominant forces behind the strong economic growth recorded in 1993. The clear upturn in the construction industry and distributive trades also played a part in this success, and industry also managed to step up production in 1993 despite repeated shortages of electricity. The only sectors which did not fit into this otherwise healthy picture of a blooming economy were bauxite mining and sugar production, which both suffered the effects of low world market prices.
The EIU and ECLAC both agree that value added should increase by a further 87c-8.57c in 1994, with agriculture and mining once again being the mainstays of economic growth. Sugar production in 1994 achieved record returns and other branches of agricultural production and livestock farming also enjoyed healthy expansion. The situation in the mining sector was less uniform. There was a sharp drop in the extraction of bauxite in 1994 due to low world market prices and the disposal of stocks in the United States. Gold-mining, on the other hand, was up significantly and this helped the mining sector overall to record substantial growth. The economic forecasts for the years after 1994 are not so optimistic and arc mainly dependent upon the renovation of the physical infrastructure and sustaining the high level of private investment activity. Given the administrative bottlenecks which exist, the EIU feels that the government will have less scope for implementing strategic projects and, on the basis of this premise, forecasts that growth in GDP will fall back to 6% in 1995. In order to service the country's substantial national and foreign debts, Guyana's economy will need to sustain its high level of expansion over the coming years so that it can meet its forthcoming payment obligations (cf. Chapter 16).
The mainstays of Jamaica's economy arc tourism, mining (bauxite) and agriculture. The Jamaican economy is another of those which have taken something of a roller-coaster ride since the beginning of the 1980s. During the first half of the 1980s, GDP fell slightly (1980/85 D: -0.1% p.a.) as a result of the worldwide recession and associated low prices for bauxite. The second half of the decade was characterized by a high average growth rate of 4.1% per annum, mainly thanks to an upturn in the mining sector and the expansion of the construction industry. This period of rapid growth in GDP came to an abrupt end in 1991 with the fresh crisis in the international commodities markets and the tailing off of tourist activity. The growth in economic output in 1991 was modest at just 0.7%. It then rose marginally in 1992 to 1.47c and the 1993 figure of + 1.27c meant that real growth in GDP fell short of the anticipated 2.0%. The average annual rate for the period from 1990 to 1993 was therefore a mediocre 1.1%, whilst the growth rate for GDP over the whole period from 1980 to 1993 averaged 1.8% per annum. The reason why the growth rate forecast for 1993 was not achieved can mainly be ascribed to the weak international demand for raw materials, which dragged down production of bauxite and alumimium. Bad weather affected some branches of agricultural production and exports of agricultural products (incl. citrus fruits, sugar, cocoa and coffee). These difficulties were then compounded by the unfavourable export conditions for bananas as a result of the depreciation in the value of the pound sterling. This meant thai despite an increase in the volumes exported, earnings from banana exports actually fell. Industrial production was mainly hampered by the restrictive monetary and financial policy
StBa/Eurostat 50 Caribbean ACP countries, 1995
(high interest rates on loans) and stiffer competition from imported goods resulting from the introduction of the CET. The fact that GDP increased at all in 1993 was almost solely due to the healthy revival in the tourist trade stimulated by an aggressive marketing campaign.
Economic output in Jamaica should again be up by around 1% in 1994, but in contrast to 1993 the main factors behind this growth are likely to be an increase in exports of bauxite and aluminium and higher figures for sugar production. The banana industry is another branch which has expanded. The other side of the coin is a drop in tourism for the first time in 10 years, one of the main reasons being the country's high level of crime. It looks as if agricultural exports, bauxite mining and tourism will remain key variables which will influence economic development in the medium and longer terms. This means that the Jamaican economy will remain dependent upon short-term trends in the western industrialised countries and its two main trading partners, the United States and the United Kingdom, in particular. Given these conditions, it is more than likely that economic development will be subject to the same ups and downs as the country has already experienced in the recent past.
The economic development of Suriname has also fluctuated considerably. It should, however, be pointed out that the basic macroeconomic data for this country are very unreliable and can vary considerably depending on the statistical source. The backbone of the Suriname economy is formed by bauxite mining and the aluminium industry based upon this resource. According to World Bank data, Suriname's GDP fell by 1.7% per annum between 1980 and 1985. The slump in export prices for bauxite, suspension of Dutch development aid in 1982 and internal unrest were all reasons for this negative trend, which continued into 1986 and 1987, exacerbated by guerilla raids and acts of sabotage in the bauxite mining and palm oil sectors. Improvements in the world markets for bauxite and aluminium and measures to defuse the tense political situation at home helped stabilize the Suriname economy in 1988 and 1989. Value added even managed to increase by a modest 0.57c per annum over the second half of the decade as a whole. GDP then shot up in 1991 and 1992, recording growth rates of 2.97c and 5.8% respectively, mainly as the result of an increase in investment activity. 1993 was then a year of stagnation in the Suriname economy on account of the recession in the international bauxite market, but despite this stagnation the average annual growth rate during the period from 1990 to 1993 was still 2.97c.
No provisional data or estimates are so far available for the development of GDP in Suriname in 1994. The IMF does, however, expect value added to recede and is recommending drastic financial and monetary measures that would make lasting improvements to the macroeconomic framework.
StBa/Eurostat Caribbean ACP countries, 1995 51
SUMMARY AND OUTLOOK
The main conclusion to emerge from this analysis of the economic structure and development of the Caribbean ACP countries is that the economies of virtually all these nations arc heavily dependent upon external influences. The monocentricity of the economic structure of most of the States in this region is seen in their lopsided dependence on one or two agricultural or mineral export products and/or international tourism. As a result, the economic development of the Caribbean countries is largely conditioned by exogenous forces which can barely be influenced by domestic economic policy. Overall economic development in this region is very much at the mercy of price trends in the world markets for individual raw materials, changes in preferential access to the main outlets for Caribbean agricultural and industrial products (the EU and North America) and prevailing economic conditions in North America and Europe. In view of this situation, there is an urgent need for almost all these countries to take future action to diversify their economic basis in order to render themselves much less vulnerable to external crises. In the short term, they also need to restructure their traditional export sectors - particularly the banana and sugar industries - in order to successfully adapt to changes which have been (and in all likelihood will continue to be) made in the international conditions governing the markets for these products, thus safeguarding the competitiveness of these branches of the economy.
The broadening of each country's economic basis must form the initial focus of medium- and long-term economic policy in the Caribbean countries. The small domestic markets with their limited purchasing power constitute a structural weakness which will particularly handicap the development of goods-producing economic sectors and the expansion of existing industries. In view of the similarity of their resources and, therefore, the fairly uniform structure of production and services in the Caribbean countries, there is very little potential for increasing intra-regional trade through complementing each other's production. Quite the opposite in fact is true, since far from being able to produce more in future for regional markets they are actually competing with each other in many sectors of the economy (inc!, the banana and sugar industries, bauxite mining, tourism and export-assembly industries). Given this state of affairs, the economic diversification which some countries have already attempted and many hope to attain must continue to seek out niches in the production and service sectors which are targeted at world markets. Some of the more promising possibilities in this area arc offered by eco-tourism, international financial services, offshore banking, computer services and setting up further free zones for exports.
StBa/Eurostat 52 Caribbean ACP countries, 1995
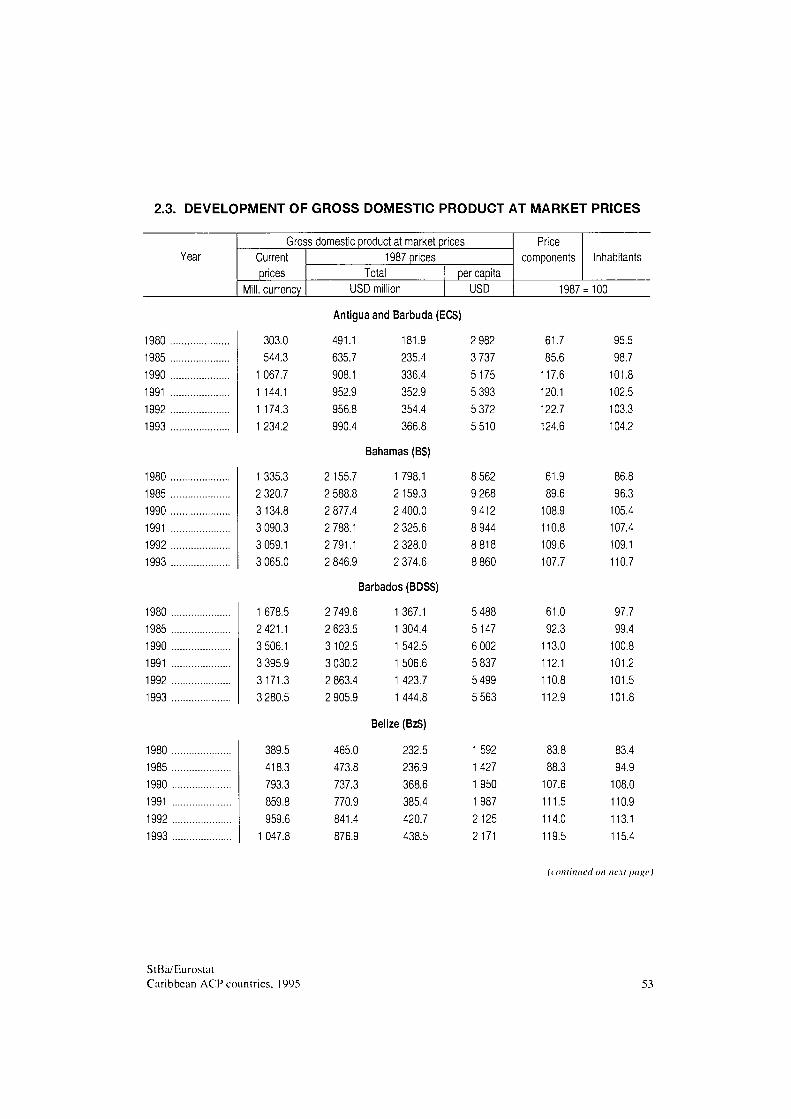
2.3. DEVELOPMENT OF GROSS DOMESTIC PRODUCT AT MARKET PRICES
Year Gross domestic product at market prices
Current prices
Mill, currency
1987 prices Total
USD million per capita
USD
Price components Inhabitants
1987=100
Antigua and Barbuda (ECS)
1980 1985 1990 1991 1992 1993
1980 1985 1990 1991 1992 1993
1980 1985 1990 1991 1992 1993
1980 1985 1990 1991 1992 1993
303.0 544.3
1 067.7 1 144.1 1 174.3 1 234.2
1 335.3 2 320.7 3134.8 3 090.3 3 059.1 3 065.0
1 678.5 2 421.1 3 506.1 3 395.9 3171.3 3 280.5
389.5 418.3 793.3 859.8 959.6
1 047.8
491.1 635.7 908.1 952.9 956.8 990.4
2 155.7 2 588.8 2 877.4 2 788.1 2 791.1 2 846.9
181.9 235.4 336.4 352.9 354.4 366.8
Bahamas (BS)
1 798.1 2159.3 2 400.0 2 325.6 2 328.0 2 374.6
Barbados (BDSS)
2 749.6 2 623.5 3 102.5 3 030.2 2 863.4 2 905.9
465.0 473.8 737.3 770.9 841.4 876.9
1 367.1 1 304.4 1 542.5 1 506.6 1 423.7 1 444.8
Belize (BzS)
232.5 236.9 368.6 385.4 420.7 438.5
2 982 3 737 5175 5 393 5 372 5510
8 562 9 268 9412 8 944 8 818 8 860
5 488 5147 6 002 5 837 5 499 5 563
1592 1427 1950 1987 2 125 2171
61.7 85.6
117.6 120.1 122.7 124.6
61.9 89.6
108.9 110.8 109.6 107.7
61.0 92.3
113.0 112.1 110.8 112.9
83.8 88.3
107.6 111.5 114.0 119.5
95.5 98.7
101.8 102.5 103.3 104.2
86.8 96.3
105.4 107.4 109.1 110.7
97.7 99.4
100.8 101.2 101.5 101.8
83.4 94.9
108.0 110.9 113.1 115.4
(continued on next page )
StBa/Eurostat Caribbean ACP countries, 1995 53
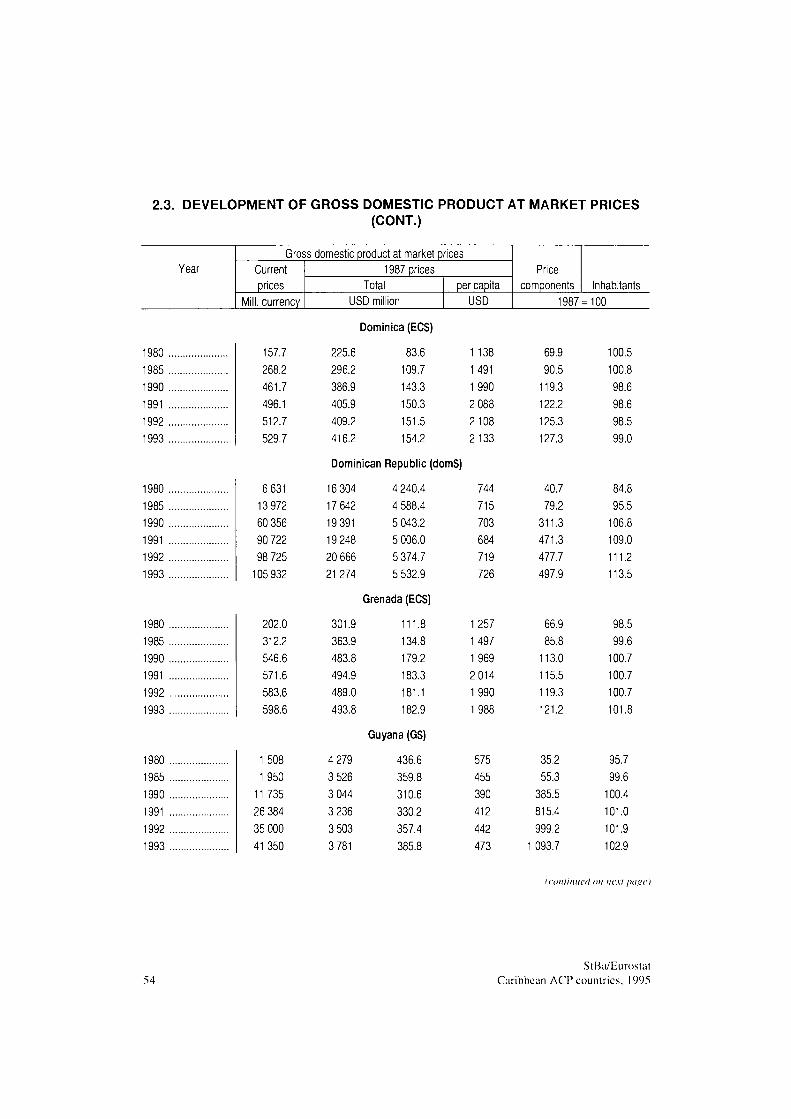
2.3. DEVELOPMENT OF GROSS DOMESTIC PRODUCT AT MARKET PRICES (CONT.)
Year
1980 1985 1990 1991 1992 1993
1980 1985 1990 1991
1992 1993
1980 1985 1990 1991 1992 1993
1980 1985 1990 1991 1992 1993
Gross domestic product at market prices Current prices
Mill, currency
157.7 268.2 461.7 496.1 512.7 529.7
6 631 13 972 60 356 90 722 98 725
105 932
202.0 312.2 546.6 571.6 583.6 598.6
1 508 1950
11 735 26 384 35 000 41350
1987 prices Total
USD million per capita
USD
Dominica (ECS)
225.6 83.6 1 138 296.2 109.7 1491 386.9 143.3 1990 405.9 150.3 2 088 409.2 151.5 2108 416.2 154.2 2133
Dominican Republic (domS)
16 304 4 240.4 744 17 642 4 588.4 715 19 391 5043.2 703 19 248 5 006.0 684 20 666 5 374.7 719 21274 5 532.9 726
Grenada (ECS)
301.9 111.8 1257 363.9 134.8 1497 483.8 179.2 1969 494.9 183.3 2 014 489.0 181.1 1990 493.8 182.9 1 988
Guyana (GS)
4 279 436.6 575 3 526 359.8 455 3 044 310.6 390 3 236 330.2 412 3 503 357.4 442 3 781 385.8 473
Price components
1987
69.9 90.5
119.3 122.2 125.3 127.3
40.7 79.2
311.3 471.3 477.7 497.9
66.9 85.8
113.0 115.5 119.3 121.2
35.2 55.3
385.5 815.4 999.2
1 093.7
Inhabitants = 100
100.5 100.8 98.6 98.6 98.5 99.0
84.8 95.5
106.8 109.0 111.2 113.5
98.5 99.6
100.7 100.7 100.7 101.8
95.7 99.6
100.4 101.0 101.9 102.9
f continued on next page)
54 StBa/Eurostat
Caribbean ACP countries, 1995
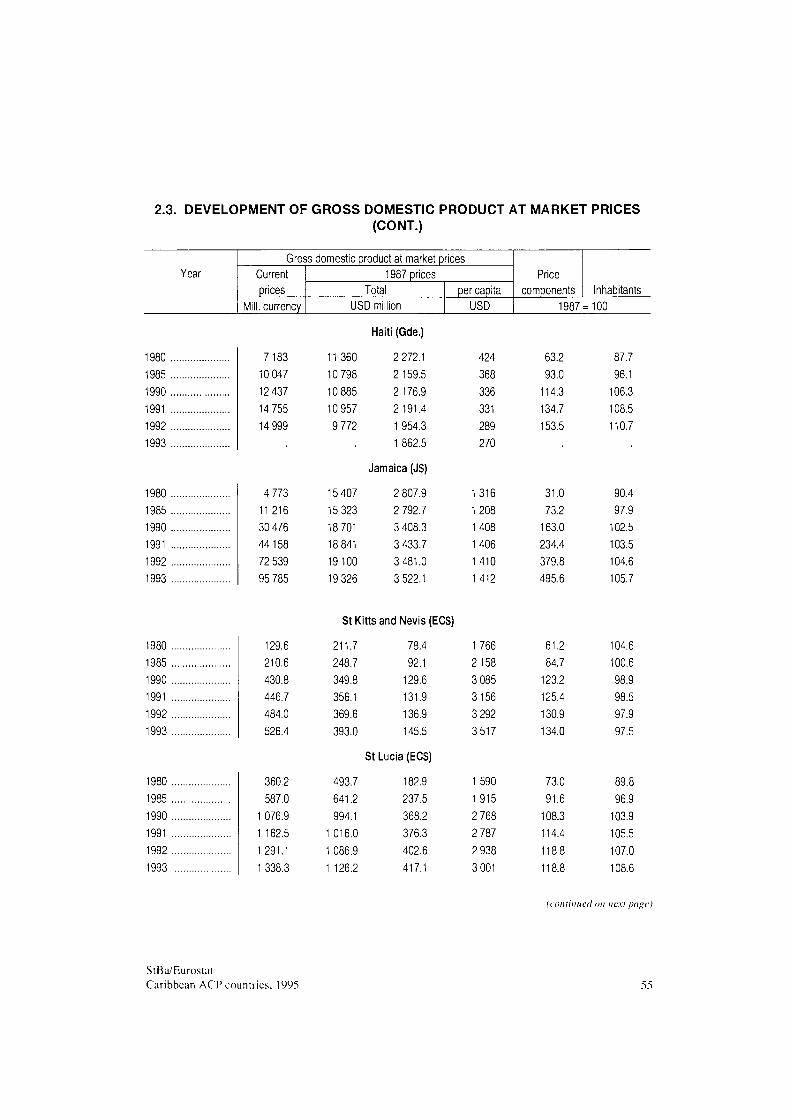
2.3. DEVELOPMENT OF GROSS DOMESTIC PRODUCT AT MARKET PRICES (CONT.)
Year Gross domestic product at market prices
Current prices
Mill, currency
1987 prices Total
USD million per capita
USD
Price components Inhabitants
1987 = 100
1980 1985 1990 1991 1992 1993
1980 1985 1990 1991 1992 1993
1980 1985 1990 1991 1992 1993
1980 1985 1990 1991 1992 1993
Haiti (Gde.]
7183 10 047 12 437 14 755 14 999
4 773 11 216 30 476 44158 72 539 95 785
11360 10 798 10 885 10 957 9 772
15 407 15 323 18 701 18 841 19100 19 326
2 272.1 2 159.5 2176.9 2 191.4 1 954.3 1 862.5
Jamaica (JS)
2 807.9 2 792.7 3 408.3 3 433.7 3 481.0 3 522.1
424 368 336 331 289 270
1316 1208 1408 1406 1 410 1 412
63.2 93.0
114.3 134.7 153.5
31.0 73.2
163.0 234.4 379.8 495.6
87.7 96.1
106.3 108.5 110.7
90.4 97.9
102.5 103.5 104.6 105.7
St Kitts and Nevis (ECS)
129.6 210.6 430.8 446.7 484.0 526.4
360.2 587.0
1 076.9 1 162.5 1291.1 1 338.3
211.7 248.7 349.8 356.1 369.6 393.0
493.7 641.2 994.1
1 016.0 1 086.9 1 126.2
78.4 92.1
129.6 131.9 136.9 145.5
St Lucia (ECS)
182.9 237.5 368.2 376.3 402.6 417.1
1766 2 158 3 085 3156 3 292 3517
1590 1915 2 768 2 787 2 938 3 001
61.2 84.7
123.2 125.4 130.9 134.0
73.0 91.6
108.3 114.4 118.8 118.8
104.6 100.6 98.9 98.5 97.9 97.5
89.8 96.9
103.9 105.5 107.0 108.6
(continued on next page)
StBa/Eurostat Caribbean ACP countries. 1995
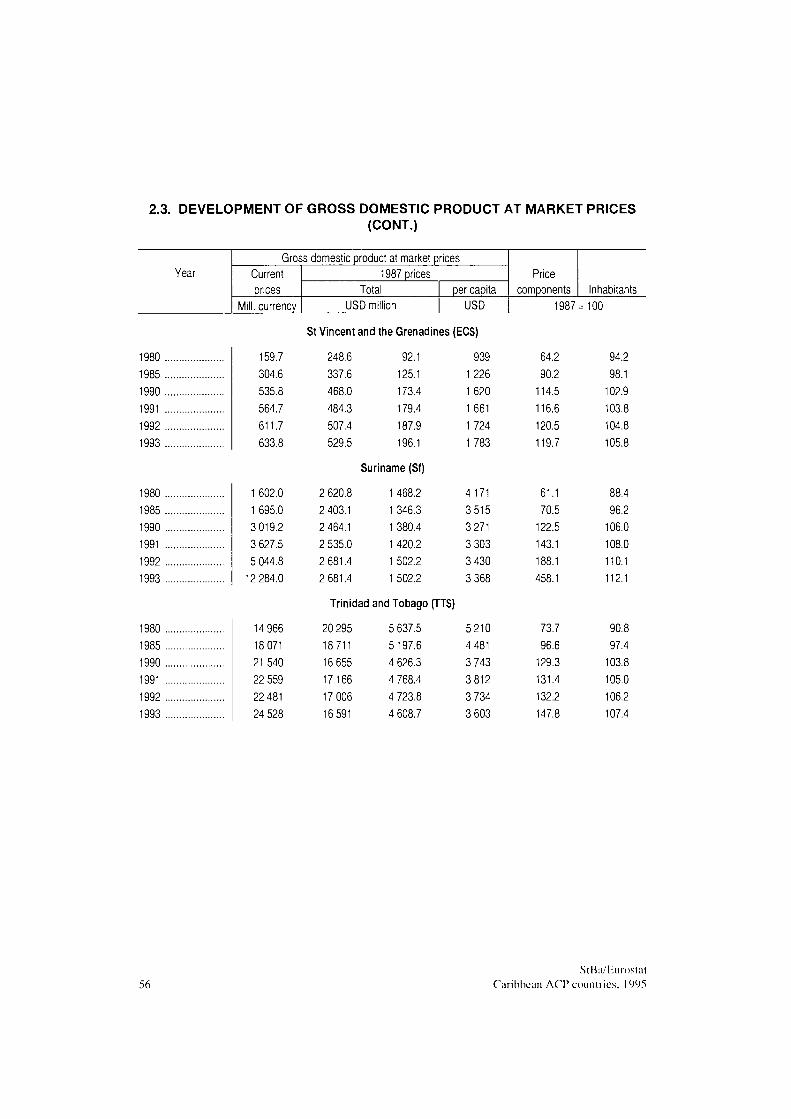
2.3. DEVELOPMENT OF GROSS DOMESTIC PRODUCT AT MARKET PRICES (CONT.)
Year Gross domestic product at market prices
Current prices
Mill, currency
1987 prices Total
USD million per capita
USD
Price components Inhabitants
1987 = 100
St Vincent and the Grenadines (ECS)
1980 1985 1990 1991 1992 1993
1980 1985 1990 1991 1992 1993
1980 1985 1990 1991 1992 1993
159.7 304.6 535.8 564.7 611.7 633.8
1 602.0 1 695.0 3 019.2 3 627.5 5 044.8
12 284.0
14 966 18 071 21540 22 559 22 481 24 528
248.6 337.6 468.0 484.3 507.4 529.5
2 620.8 2 403.1 2 464.1 2 535.0 2 681.4 2 681.4
92.1 125.1 173.4 179.4 187.9 196.1
Suriname (Sf)
1 468.2 1 346.3 1 380.4 1 420.2 1 502.2 1 502.2
Trinidad and Tobago (TTS)
20 295 18711 16 655 17166 17 006 16 591
5 637.5 5197.6 4 626.3 4 768.4 4 723.8 4 608.7
939 1226 1620 1661 1 724 1 783
4 171 3 515 3 271 3 303 3 430 3 368
5210 4 481 3 743 3812 3 734 3 603
64.2 90.2
114.5 116.6 120.5 119.7
61.1 70.5
122.5 143.1 188.1 458.1
73.7 96.6
129.3 131.4 132.2 147.8
94.2 98.1
102.9 103.8 104.8 105.8
88.4 96.2
106.0 108.0 110.1 112.1
90.8 97.4
103.8 105.0 106.2 107.4
56 StBa/Eurostat
Caribbean ACP countries. 1995
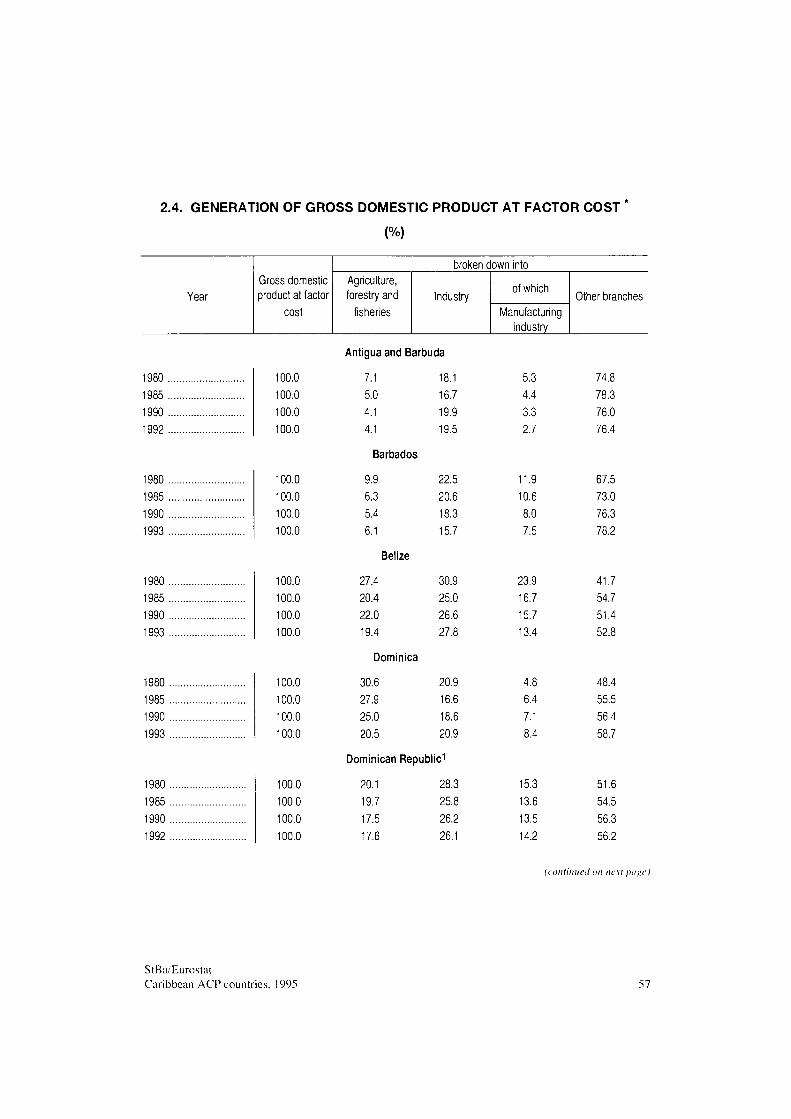
2.4. GENERATION OF GROSS DOMESTIC PRODUCT AT FACTOR COST
(%)
Year Gross domestic product at factor
cost
broken down Into Agriculture, forestry and
fisheries Industry
of which
Manufacturing industry
Other branches
Antigua and Barbuda
1980. 1985. 1990 . 1992 .
1980 1985 1990 1993
1980 1985 1990 1993
1980 1985 1990 1993
1980 1985 1990 1992
100.0 100.0 100.0 100.0
100.0 100.0 100.0 100.0
100.0 100.0 100.0 100.0
100.0 100.0 100.0 100.0
100.0 100.0 100.0 100.0
7.1 5.0 4.1 4.1
Barbados
9.9 6.3 5.4 6.1
Belize
27.4 20.4 22.0 19.4
Dominica
30.6 27.9 25.0 20.5
Dominican Repub
20.1 19.7 17.5 17.6
18.1 16.7 19.9 19.5
22.5 20.6 18.3 15.7
30.9 25.0 26.6 27.8
20.9 16.6 18.6 20.9
ici
28.3 25.8 26.2 26.1
5.3 4.4 3.3 2.7
11.9 10.6 8.0 7.5
23.9 16.7 15.7 13.4
4.8 6.4 7.1 8.4
15.3 13.6 13.5 14.2
74.8 78.3 76.0 76.4
67.5 73.0 76.3 78.2
41.7 54.7 51.4 52.8
48.4 55.5 56.4 58.7
51.6 54.5 56.3 56.2
(continued on next page)
StBa/Eurostat Caribbean ACP countries. 1995 57
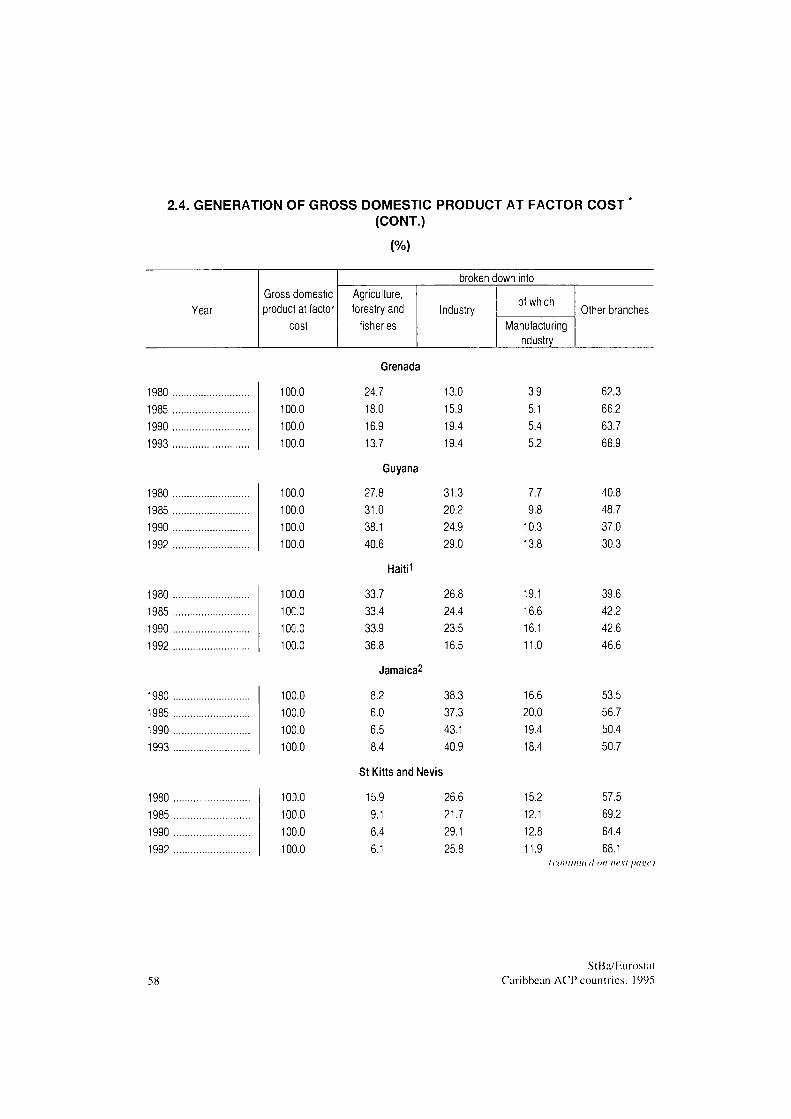
2.4. GENERATION OF GROSS DOMESTIC PRODUCT AT FACTOR COST (CONT.)
(%)
Year Gross domestic product at factor
cost
broken down into Agriculture, forestry and
fisheries Industry
of which
Manufacturing Industry
Other branches
1980 1985 1990 1993
1980 1985 1990 1992
1980 1985 1990 1992
1980 1985 1990 1993
1980 1985 1990 1992
Grenada 100.0 100.0 100.0 100.0
100.0 100.0 100.0 100.0
100.0 10C.0 100.0 100.0
100.0 100.0 100.0 100.0
100.0 100.0 100.0 100.0
24.7 18.0 16.9 13.7
Guyana
27.8 31.0 38.1 40.6
Haitil
33.7 33.4 33.9 36.8
Jamaica2
8.2 6.0 6.5 8.4
13.0 15.9 19.4 19.4
31.3 20.2 24.9 29.0
26.8 24.4 23.5 16.5
38.3 37.3 43.1 40.9
St Kitts and Nevis
15.9 9.1 6.4 6.1
26.6 21.7 29.1 25.8
3.9 5.1 5.4 5.2
7.7 9.8
10.3 13.8
19.1 16.6 16.1 11.0
16.6 20.0 19.4 18.4
15.2 12.1 12.8 11.9
62.3 66.2 63.7 66.9
40.8 48.7 37.0 30.3
39.6 42.2 42.6 46.6
53.5 56.7 50.4 50.7
57.5 69.2 64.4 68.1
(continued on nc\l page)
58 StBa/Eurostat
Caribbean ACP countries. 1995
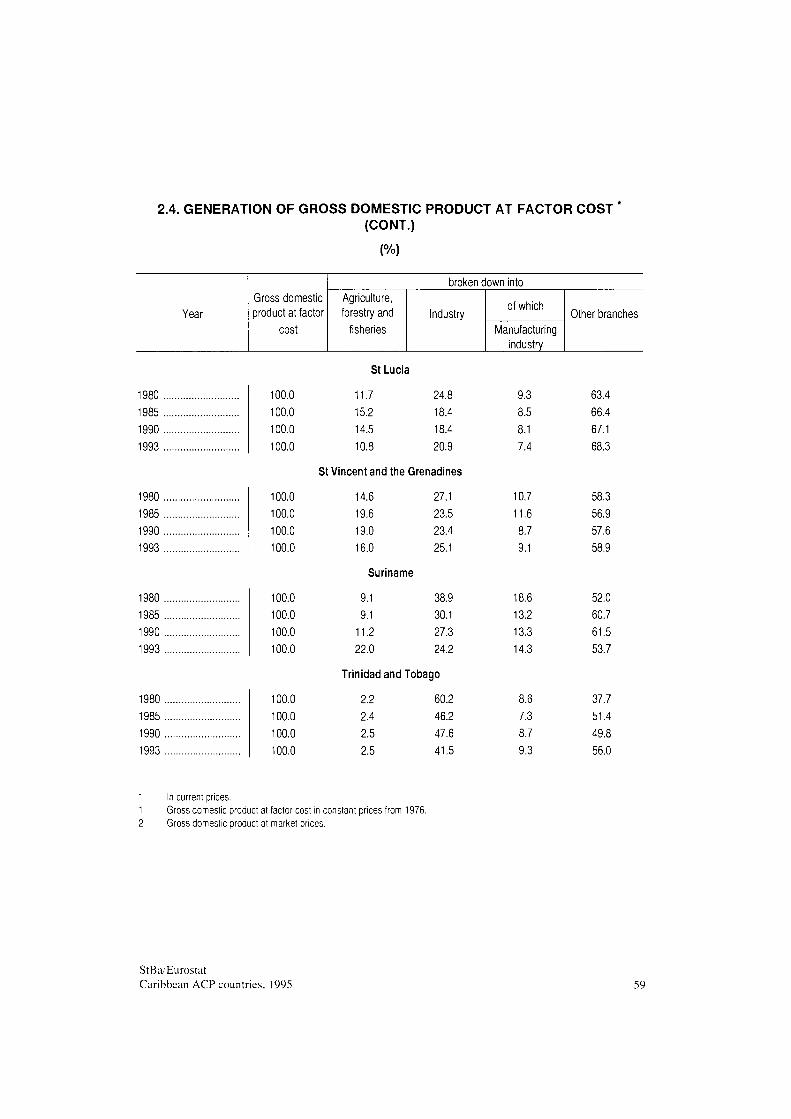
2.4. GENERATION OF GROSS DOMESTIC PRODUCT AT FACTOR COST (CONT.)
(%)
Year Gross domestic product at factor
cost
broken down into Agriculture, forestry and
fisheries Industry
of which
Manufacturing industry
Other branches
St Lucia
1980 1985 1990 1993
1980 1985 1990 1993
1980 1985 1990 1993
1980 1985 1990 1993
100.0 100.0 100.0 100.0
100.0 100.0 100.0 100.0
100.0 100.0 100.0 100.0
100.0 100.0 100.0 100.0
11.7 15.2 14.5 10.8
24.8 18.4 18.4 20.9
St Vincent and the Grenadines
14.6 19.6 19.0 16.0
Suriname
9.1 9.1
11.2 22.0
27.1 23.5 23.4 25.1
38.9 30.1 27.3 24.2
Trinidad and Tobago
2.2 2.4 2.5 2.5
60.2 46.2 47.6 41.5
9.3 8.5 8.1 7.4
10.7 11.6 8.7 9.1
18.6 13.2 13.3 14.3
8.6 7.3 8.7 9.3
63.4 66.4 67.1 68.3
58.3 56.9 57.6 58.9
52.0 60.7 61.5 53.7
37.7 51.4 49.8 56.0
In current prices. 1 Gross domestic product at factor cost in constant prices from 1976. 2 Gross domestic product at market prices.
StBa/Eurostat Caribbean ACP countries. 1995 59
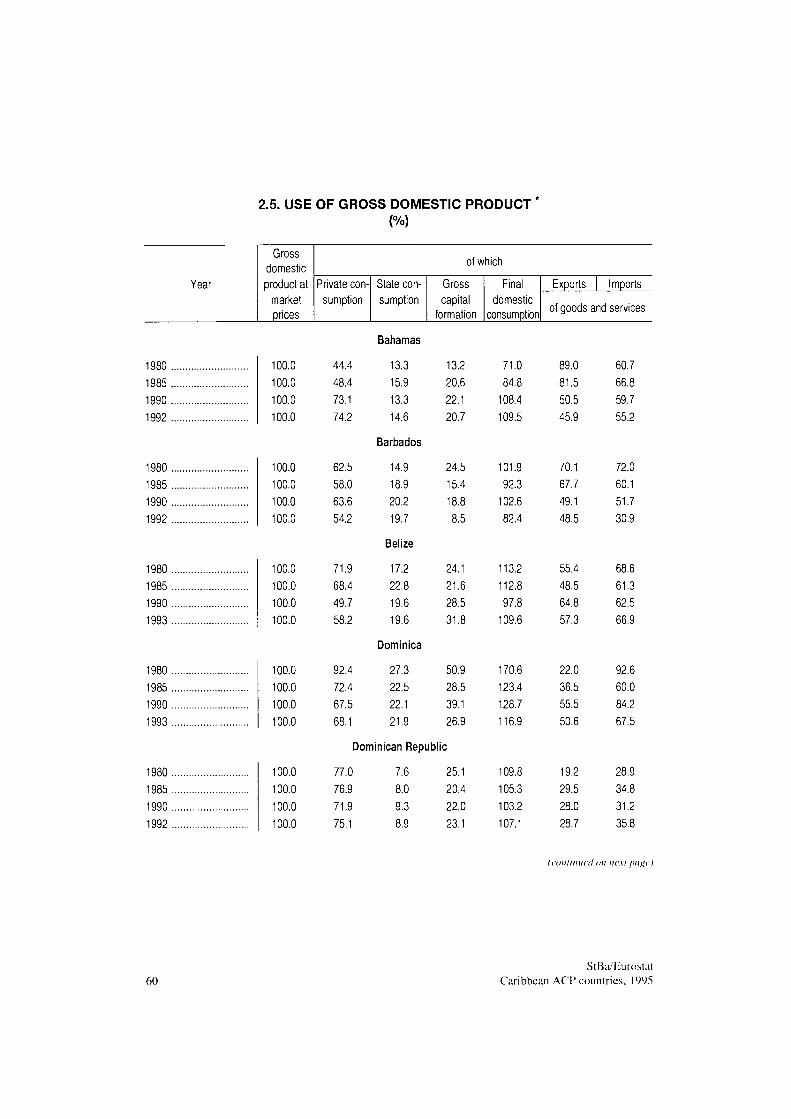
2.5. USE OF GROSS DOMESTIC PRODUCT
(%)
Year
Gross domestic product at
market prices
of which
Private consumption
State consumption
Gross capital
formation
Final domestic
consumption
Exports | Imports
of goods and services
1980 1985 1990 1992
1980 1985 1990 1992
1980 1985 1990 1993
1980 1985 1990 1993
1980 1985 1990 1992
Bahamas 100.0 100.0 100.0 100.0
100.0 100.0 100.0 100.0
100.0 100.0 100.0 100.0
100.0 100.0 100.0 100.0
100.0 100.0 100.0 100.0
44.4 48.4 73.1 74.2
62.5 58.0 63.6 54.2
71.9 68.4 49.7 58.2
92.4 72.4 67.5 68.1
13.3 15.9 13.3 14.6
Barbados
14.9 18.9 20.2 19.7
Belize
17.2 22.8 19.6 19.6
Dominica
27.3 22.5 22.1 21.9
13.2 20.6 22.1 20.7
24.5 15.4 18.8 8.5
24.1 21.6 28.5 31.8
50.9 28.5 39.1 26.9
Dominican Republic
77.0 76.9 71.9 75.1
7.6 8.0 9.3 8.9
25.1 20.4 22.0 23.1
71.0 84.8
108.4 109.5
101.9 92.3
102.6 82.4
113.2 112.8 97.8
109.6
170.6 123.4 128.7 116.9
109.8 105.3 103.2 107.1
89.0 81.5 50.5 45.9
70.1 67.7 49.1 48.5
55.4 48.5 64.8 57.3
22.0 36.5 55.5 50.6
19.2 29.5 28.0 28.7
60.7 66.8 59.7 55.2
72.0 60.1 51.7 30.9
68.6 61.3 62.5 66.9
92.6 60.0 84.2 67.5
28.9 34.8 31.2 35.8
(continued on next page)
60 StBa/Eurostat
Caribbean ACP countries. 1995
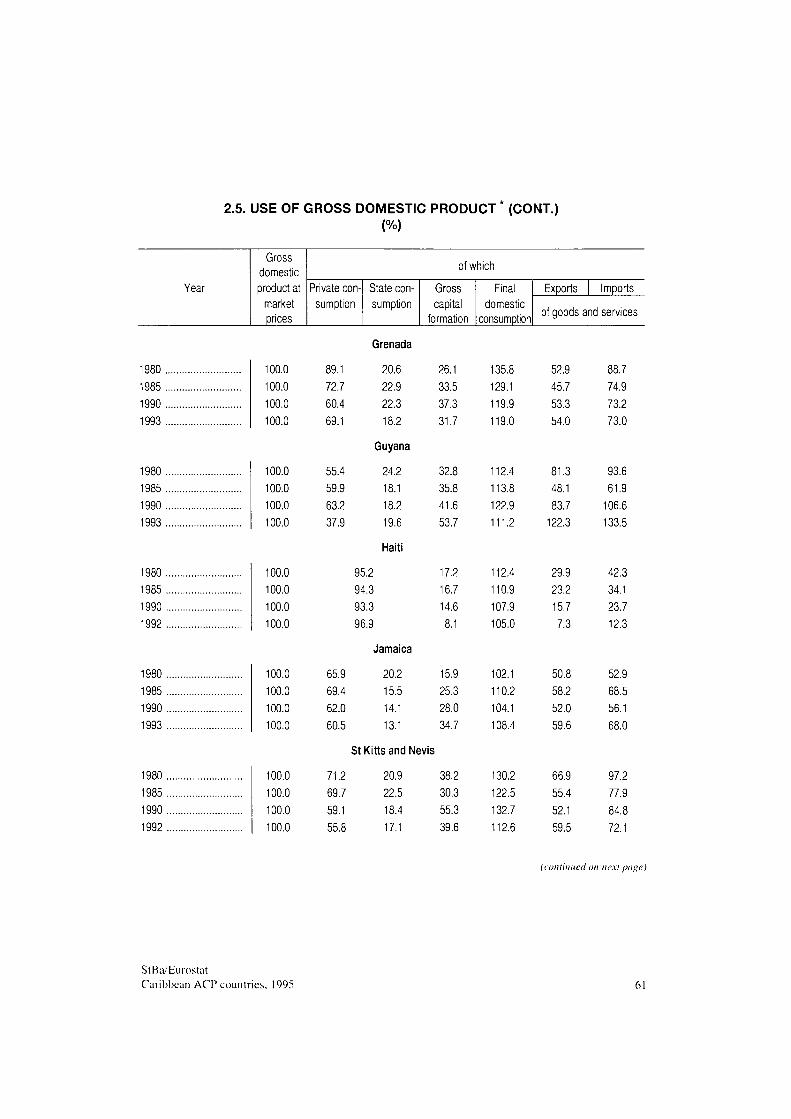
2.5. USE O F G R O S S D O M E S T I C P R O D U C T * (CONT. )
(%)
Year
Gross domestic product at
market prices
of which
Private consumption
State consumption
Gross capital
formation
Final domestic
consumption
Exports | Imports
of goods and services
1980 1985 1990 1993
1980 1985 1990 1993
1980 1985 1990 1992
1980 1985 1990 1993
1980 1985 1990 1992
Grenada 100.0 100.0 100.0 100.0
100.0 100.0 100.0 100.0
100.0 100.0 100.0 100.0
100.0 100.0 100.0 100.0
100.0 100.0 100.0 100.0
89.1 72.7 60.4 69.1
55.4 59.9 63.2 37.9
65.9 69.4 62.0 60.5
71.2 69.7 59.1 55.8
95.2 94.3 93.3 96.9
20.6 22.9 22.3 18.2
juyana
24.2 18.1 18.2 19.6
Haiti
Jamaica
20.2 15.5 14.1 13.1
St Kitts and Nevis
20.9 22.5 18.4 17.1
26.1 33.5 37.3 31.7
32.8 35.8 41.6 53.7
17.2 16.7 14.6 8.1
15.9 25.3 28.0 34.7
38.2 30.3 55.3 39.6
135.8 129.1 119.9 119.0
112.4 113.8 122.9 111.2
112.4 110.9 107.9 105.0
102.1 110.2 104.1 108.4
130.2 122.5 132.7 112.6
52.9 45.7 53.3 54.0
81.3 48.1 83.7
122.3
29.9 23.2 15.7 7.3
50.8 58.2 52.0 59.6
66.9 55.4 52.1 59.5
88.7 74.9 73.2 73.0
93.6 61.9
106.6 133.5
42.3 34.1 23.7 12.3
52.9 68.5 56.1 68.0
97.2 77.9 84.8 72.1
(continued on next page)
StBa/Eurostat Caribbean ACP countries. 1995 61
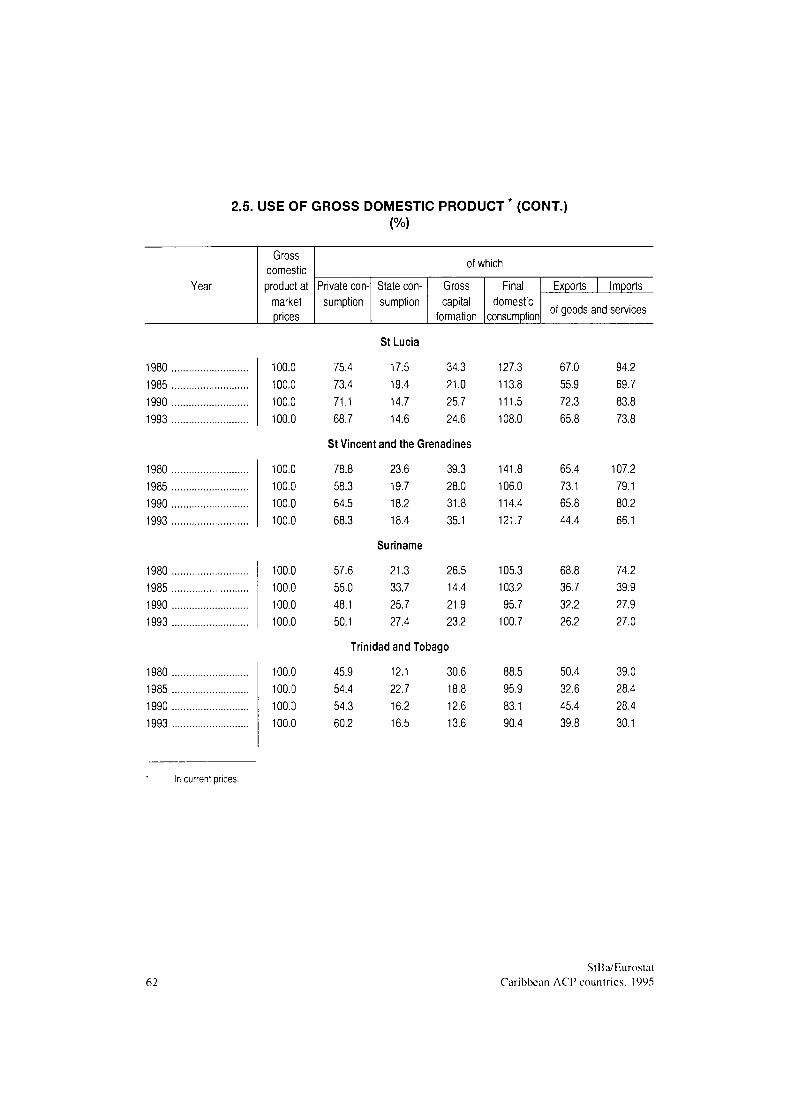
2.5. USE OF GROSS DOMESTIC PRODUCT (CONT.) (%)
Year
Gross domestic product at
market prices
of which
Private consumption
State consumption
Gross capital
formation
Final domestic
consumption
Exports Imports
of goods and services
St Lucia
1980 1985 1990 1993
1980 1985 1990 1993
1980 1985 1990 1993
1980 1985 1990 1993
In current prices.
100.0 100.0 100.0 100.0
100.C 100.0 100.0 100.0
100.0 100.0 100.0 100.0
100.0 100.0 100.3 100.0
75.4 17.5 34.3 73.4 19.4 21.0 71.1 14.7 25.7 68.7 14.6 24.6
St Vincent and the Grenadines
78.8 23.6 39.3 58.3 19.7 28.0 64.5 18.2 31.8 68.3 18.4 35.1
Suriname
57.6 21.3 26.5 55.0 33.7 14.4 48.1 25.7 21.9 50.1 27.4 23.2
Trinidad and Tobago
45.9 12.1 30.6 54.4 22.7 18.8 54.3 16.2 12.6 60.2 16.5 13.6
127.3 113.8 111.5 108.0
141.8 106.0 114.4 121.7
105.3 103.2 95.7
100.7
88.5 95.9 83.1 90.4
67.0 55.9 72.3 65.8
65.4 73.1 65.8 44.4
68.8 36.7 32.2 26.2
50.4 32.6 45.4 39.8
94.2 69.7 83.8 73.8
107.2 79.1 80.2 66.1
74.2 39.9 27.9 27.0
39.0 28.4 28.4 30.1
62 StBa/Eurostat
Caribbean ACP countries, 1995
3. A G R I C U L T U R E , F O R E S T R Y A N D F I S H E R I E S
INTRODUCTION
Agriculture, forestry and fisheries is one of the key sectors of the Caribbean economy, and the overall economic development of many countries in the region is very heavily influenced by trends in the agricultural sector. In regional terms, agricultural exports form the largest production segment in the primary sector, whilst the cultivation of foodstuffs for the resident population is also of some importance. These two branches form the focus of this Chapter. Livestock farming, forestry and fisheries, on the other hand, are only summarized briefly since they are of limited economic importance in all but a few countries.
The importance of agriculture, forestry and fisheries to the economies of a number of Caribbean countries is clearly reflected in the scale of its contribution to total value added. In Guyana, its share of GDP is over 40% and in Haiti it accounts for 37%. In Belize, Dominica, the Dominican Republic, St Vincent and the Grenadines and Suriname too, the agricultural sector is responsible for around one-fifth of total output (cf. Chapter 2, Table 2.4). This contrasts with the situation in countries such as Antigua and Barbuda, Barbados, Jamaica and Trinidad and Tobago where agriculture accounts for well under 10% of national GDP and therefore plays a less important role. Agricultural products do nevertheless make up a sizeable chunk of the exports by almost all the countries in the region, accounting for an average of over one-fifth of the total value of exports by the region in 1992.
The proportion is much higher when it comes to agricultural exports to the EU. which accords preferential access to its markets for a range of products from the Caribbean ACP countries. Almost half (49.1%) of the regional average figure for the value of exports by the Caribbean countries to the EU in 1992/93 was produced by agricultural products, beverages and tobacco (cf. Chapter 13, Table 13.4). Generally speaking, between 40% and 45% of the total exports by the Caribbean countries to the EU are in the form of just four products - bananas, sugar, rice and rum (cf. Table 13.5). In some countries the proportion of agricultural products in their goods exports to the EU is way above the regional average, this being the case for Belize, Guyana and the OECS States of Dominica, St Kitts and Nevis and St Lucia, where such products account for 80% to nigh on 100% of their exports to the EU. On top of this, it is also the case for most of these countries that their agricultural exports arc in the form of just one or two different products. In 1993, bananas made up 84% of Dominica's total goods exports to the EU, sugar represented 94% of the value of EU exports by St Kitts and Nevis, and bananas again constituted 93% of St Lucia's total exports. Other countries too - such as Belize, St Vincent and the Grenadines, Barbados. Trinidad and Tobago or Guyana - display this same dependence on just a few agricultural products in their export trade with the EU (cf. Table 13.5). It is, therefore, little wonder that changes in the existing preferential trade conditions
StBa/Eurostat Caribbean ACP countries, 1995 63
for the export of agricultural products to the EU can sometimes have such a radical effect on the total export trade carried out by many Caribbean countries (cf. Chapter 13).
Another fundamental problem which ranks alongside the general lack of diversity in agricultural exports is that little attention has been paid to the production of foodstuffs. As a result, substantial quantities of foodstuffs often have to be imported, thus placing an additional burden on the chronic balance of trade deficit recorded by almost all the Caribbean States. Despite their large agricultural export sectors, no fewer than ten of these fifteen countries are net importers of agricultural products because of the serious shortage of foodstuffs produced. This is partly due to tourism, since large quantities of foodstuffs have to be imported to cater for the foreign tourists, but the inadequate level of domestic production is also responsible for the fact that substantial imports of wheat, animal products and fish arc sometimes required to meet demand by domestic consumers. It is even the case that sugar, one of the Caribbean's classic export products, has to be imported into a number of producer countries because domestic production is unable to satisfy internal demand (e.g. Haiti) and/or because with virtually the whole crop being grown for lucrative export markets which guarantee prices way over the world market level (particularly the EU and the United States), there is too little home-produced sugar available for domestic consumers (e.g. Barbados, Dominican Republic, Guyana).
Fortunately, some encouraging trends have emerged in the Caribbean agricultural sector over the last few years, including the attempts undertaken by a number of countries to broaden the basis of their agricultural production, which should open up new, if also limited, export potential in the medium and longer terms. Another positive development is the shift towards the cultivation of fruit. Credit must also be given to the recent initiatives launched to restructure the traditional agricultural export sectors (banana and sugar industries), with the aim of making them competitive on international markets for some time to come.
AGRICULTURAL PRODUCTION FOR THE DOMESTIC MARKET
Bad weather conditions (periods of drought, tropical storms, flooding), shortages of land and water, soil erosion, the current conditions concerning land ownership, the general lack of access to agricultural credit, to inputs capable of increasing production (artificial fertilizers, pesticides) and to machinery, inadequate storage and marketing systems and insufficient infrastructure facilities have all hitherto combined to hamper the full development of agricultural potential in the Caribbean, and have particularly curtailed the production of foodstuffs. The latter has also suffered from the bias towards the export trade in agricultural products.
Some of the more important food plants grown in the Caribbean to supply domestic markets include rice, maize, sugar, sweet potatoes, various types of vegetables (inch beans, tomatoes and cucumbers) and a large range of tropical fruits and spices. In addition to these, millet, sorghum and manioc also help feed the population of some countries. On account of the
StBa/Eurostat 64 Caribbean ACP countries, 1995
above-mentioned bias towards export markets, the Caribbean countries were unable to step up production of these products to the extent that would have been required to improve their self-sufficiency in foodstuffs. Table 3.6 contains a cross-sectional comparison between the 1985 and 1993 figures forsorne countries in the region which reveals that the fall in the production of food plants was sometimes substantial. By way of example, the 1993 harvests in two of the larger Caribbean rice-producing countries, Haiti and Suriname, were much lower than in 1985, and whilst rice production was up in the Dominican Republic (which has the region's strongest agricultural sector), the maize and sweet potato harvests fell. With little progress having so far been made in increasing domestic production, some countries have become very dependent upon food imports. The Bahamas, for example, have to import 80% of all foodstuffs, whilst Trinidad and Tobago, which was once a traditional agricultural nation and was still self-sufficient in the 1960s, now has to rely on imports to meet 75% of its food requirements. Even Haiti, where agriculture still plays such an important role in the economy, was obliged to fill the gaps in its production with agricultural imports even before the imposition of the economic embargo in 1991 led to a serious under-supply of foodstuffs, malnutrition and the threat of famine. It too ranks amongst those countries with a negative foreign trade balance in agricultural products.
In view of the heavy burden placed upon the balance of trade by food imports, there have, admittedly, been moves in virtually all the Caribbean nations to change the focus of agricultural policy in recent years. Alongside the promotion of the agricultural export trade, the spotlight is being moved more and more towards expanding the cultivation of selected fruits in order to reduce the excessive dependence upon imports and generally encourage much-needed diversification in agricultural production. One good example of this policy is the expansion of domestic production successfully carried out in Belize, where production of rice, beans, maize and fresh vegetables is now of a level to guarantee complete self-sufficiency. In Guyana, the expansion of areas used for rice-growing and the 1991 liberalisation of producer prices led to a large increase in rice production, with the result that as well as supplying the domestic market there is now scope for additional export potential. Since 1992, the government of the Dominican Republic has provided extensive agricultural loans in order to boost domestic production of basic foodstuffs and non-traditional export plants. In the case of Haiti, the rising demographic pressure combined with the collapse in world market prices for various export products (coffee, sugar and cocoa) has led to a rethinking of cultivation priorities and to increased production of food plants. The Suriname government is also seeking to expand rice-growing in order both to increase export volumes and achieve a sufficient supply of rice for the domestic market. In the eastern Caribbean countries, which have hitherto been heavily dependent upon food imports, one of the aims of national development strategy has been to strengthen their own production bases for basic foodstuffs and to build up processing industries. In 1993, the government of the Bahamas adopted a new Agricultural Land Policy (ALP) with the aim of stimulating investment in agriculture and fisheries in order to increase the production of food for local consumers. In Barbados too, one of the main components of government policy is to increase domestic production of food plants.
StBa/Eurostat Caribbean ACP countries, 1995 65
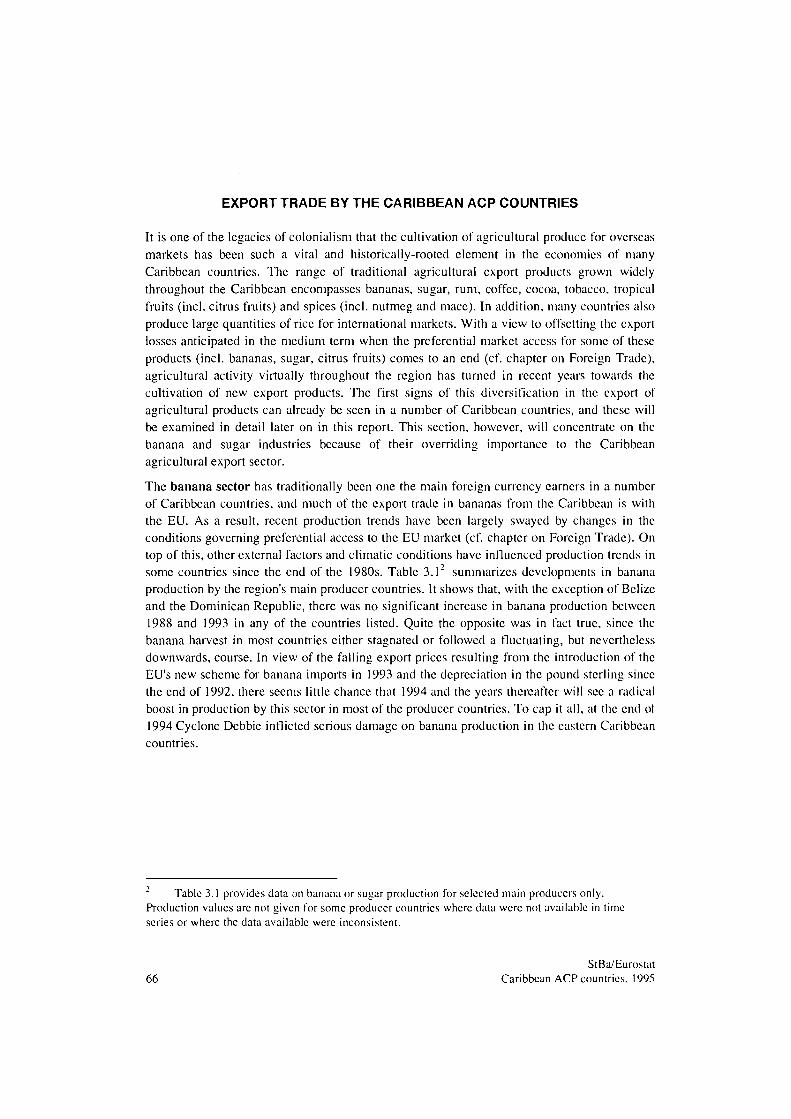
EXPORT TRADE BY THE CARIBBEAN ACP COUNTRIES It is one of the legacies of colonialism that the cultivation of agricultural produce for overseas markets has been such a vital and historically-rooted element in the economies of many Caribbean countries. The range of traditional agricultural export products grown widely throughout the Caribbean encompasses bananas, sugar, rum, coffee, cocoa, tobacco, tropical fruits (incl. citrus fruits) and spices (incl. nutmeg and mace). In addition, many countries also produce large quantities of rice for international markets. With a view to offsetting the export losses anticipated in the medium term when the preferential market access for some of these products (incl. bananas, sugar, citrus fruits) comes to an end (cf. chapter on Foreign Trade), agricultural activity virtually throughout the region has turned in recent years towards the cultivation of new export products. The first signs of this diversification in the export of agricultural products can already be seen in a number of Caribbean countries, and these will be examined in detail later on in this report. This section, however, will concentrate on the banana and sugar industries because of their overriding importance to the Caribbean agricultural export sector.
The banana sector has traditionally been one the main foreign currency earners in a number of Caribbean countries, and much of the export trade in bananas from the Caribbean is with the EU. As a result, recent production trends have been largely swayed by changes in the conditions governing preferential access to the EU market (cf. chapter on Foreign Trade). On top of this, other external factors and climatic conditions have influenced production trends in some countries since the end of the 1980s. Table 3.12 summarizes developments in banana production by the region's main producer countries. It shows that, with the exception of Belize and the Dominican Republic, there was no significant increase in banana production between 1988 and 1993 in any of the countries listed. Quite the opposite was in fact true, since the banana harvest in most countries either stagnated or followed a fluctuating, but nevertheless downwards, course. In view of the falling export prices resulting from the introduction of the EU's new scheme for banana imports in 1993 and the depreciation in the pound sterling since the end of 1992, there seems little chance that 1994 and the years thereafter will see a radical boost in production by this sector in most of the producer countries. To cap it all, at the end of 1994 Cyclone Debbie inflicted serious damage on banana production in the eastern Caribbean countries.
Table 3.1 provides data on banana or sugar production for selected main producers only. Production values are not given for some producer countries where data were not available in time series or where the data available were inconsistent.
StBa/Eurostat 66 Caribbean ACP countries. 1995
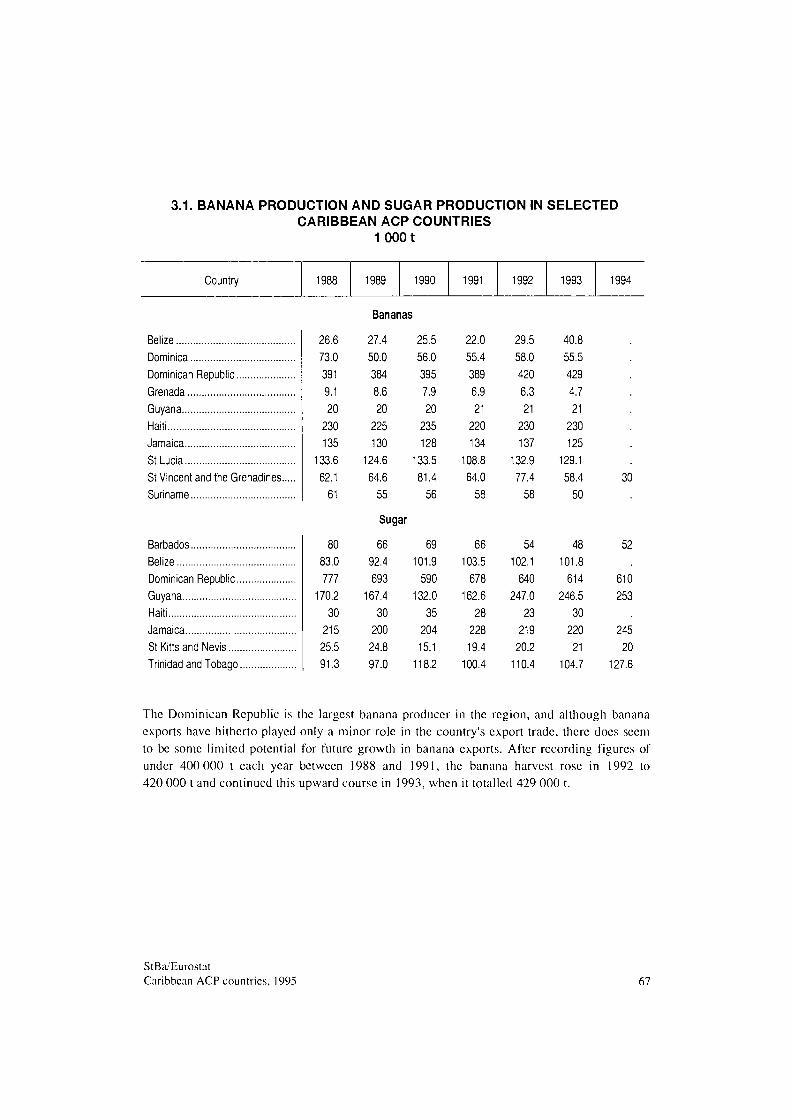
3.1. BANANA PRODUCTION AND SUGAR PRODUCTION IN SELECTED CARIBBEAN ACP COUNTRIES
1 000 t
Country 1989 1990 1991 1992 1993 1994
Belize Dominica Dominican Republic Grenada Guyana Haiti Jamaica St Lucia St Vincent and the Grenadines. Suriname
Barbados Belize Dominican Republic Guyana Haiti Jamaica St Kitts and Nevis Trinidad and Tobago
26.6 73.0 391 9.1 20
230 135
133.6 62.1
61
80 83.0 777
170.2 30
215 25.5 91.3
Bananas
27.4 50.0 384
8.6 20
225 130
124.6 64.6
55
25.5 56.0 395 7.9 20
235 128
133.5 81.4
56
Sugar
66 92.4 693
167.4 30
200 24.8 97.0
69 101.9
590 132.0
35 204 15.1
118.2
22.0 55.4 389 6.9 21
220 134
108.8 64.0
58
66 103.5
678 162.6
28 228 19.4
100.4
29.5 58.0 420 6.3 21
230 137
132.9 77.4
58
54 102.1
640 247.0
23 219 20.2
110.4
40.8 55.5 429 4.7 21
230 125
129.1 58.4
50
48 101.8
614 246.5
30 220 21
104.7
30
52
610 253
245 20
127.6
The Dominican Republic is the largest banana producer in the region, and although banana exports have hitherto played only a minor role in the country's export trade, there does seem to be some limited potential for future growth in banana exports. After recording figures of under 400 000 t each year between 1988 and 1991, the banana harvest rose in 1992 to 420 000 t and continued this upward course in 1993, when it totalled 429 000 t.
StBa/Eurostat Caribbean ACP countries, 1995 67
Banana output in the eastern Caribbean producer countries fluctuated between 230 000 t and 280 000 t in the period from 1988 to 1993. In 1993, the harvest was almost 107c down on the previous year at 247 700 t (1992: 274 600 t). The banana sector in these countries almost exclusively serves the United Kingdom market and was therefore particularly badly hit by the depreciation of the pound. Marginal producers in these countries were forced out of business by falling export prices and massive losses in export earnings. Other reasons for the slump in production in 1993 were bad weather (drought) and the lack of local credit facilities. With the exception of St Lucia (EU quota: 127 000 t), banana production in 1993 in the three other eastern Caribbean producer countries (Dominica: 71 000 t; Grenada: 14 000 t; St Vincent: 82 000 t) came nowhere near filling the existing duty-free quotas for exports to the EU agreed under the Lomé Convention. This situation repeated itself in 1994, as the devastation wrought by Cyclone Debbie meant banana production and exports still fell far short of the permitted EU quotas. The crop losses in St Vincent and the Grenadines were particularly heavy and initial estimates for 1994 put banana production at 30 000 t - its lowest level for 10 years. The three other eastern Caribbean producer countries also sustained serious crop losses. In order to alleviate the immediate effects of the cyclone, the EU has since earmarked US$ 47.2 million for a programme of reconstruction in the eastern Caribbean banana industry.
In contrast to the eastern Caribbean countries, the banana industry in Belize has experienced an upturn in recent years. Banana production started up again in 1975, but was initially hampered by bad plantation management, undercapitalisation and transport problems. The situation then went from bad to worse due to sudden cold snaps and infestation of the plants, which caused production to fall in 1990 and 1991. Following the privatisation of the banana sector and the successful implementation of measures to rid the plants of disease, production started to take off. Already up at 29 500 t in 1992, the harvest then reached 40 800 t in 1993. On account of these developments and the above-mentioned difficulties experienced by the eastern Caribbean producers, the EU banana quota for Belize was raised to 55 000 t for 1995.
The banana crop in the other main banana-producing countries in the Caribbean (Guyana, Haiti, Jamaica and Suriname) showed little change between 1988 and 1993. Although Jamaica at least has increased its volume of banana exports in recent years, it is still falling short of its EU quota of 105 000 t.
The other linchpin of Caribbean export trade is sugar, another product for which the countries in the region enjoy preferential access into the EU market and, partly in the form of varying export quotas, into the United States (cf. Chapter 13). Developments in the sugar industry in the different Caribbean countries have been very varied over the last few years, and the future prospects for this branch of production look to be anything but uniform.
StBa/Eurostat 68 Caribbean ACP countries, 1995
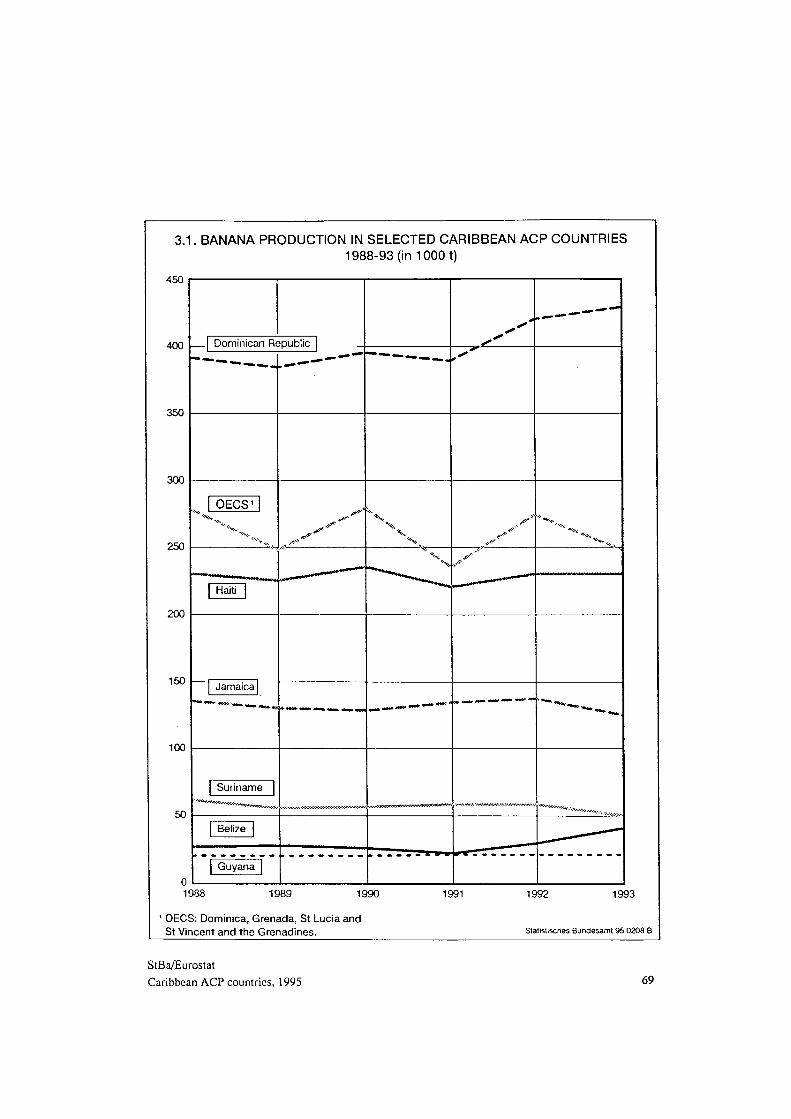
3.1. BANANA PRODUCTION IN SELECTED CARIBBEAN ACP COUNTRIES
198893 (in 1000 t)
4!XÍ
400
300
250
200
150
100
50
η
Dominican Republic
*♦«<■
OECS1
ΛΛ*ν
Haiti
Jamaica
*«*^,
Suriname
"«^^Λ ΐ^ν . , . ^ . -»~«^
Belize
Guyana
-**
. lm.
\ X V
%
««·—" "*""**'***
. ' ' , • '
.sT*
^
„««,* -—· · - " "
■^ΛΛ.-Λ-Λ'.ΐΛ,ίΑΛΛΕΛΤ.ν.νΛνΛ^Λ'ΑΝ·.
**<
"""*"* "***"·· «·«
* * *owv f f w Y
1988 1989 1990 1991 1992 1993
' OECS: Dominica, Grenada, St Lucia and St Vincent and the Grenadines. Slailsllsches Bundesamt 95 0208 Β
StBa/Eurostat Caribbean ACP countries, 1995 69
The once-dominant sugar industry in Barbados has lost much of its importance due to sagging production figures, and its high production costs and low productivity arc posing serious problems. Sugar production has been on an almost uninterrupted downward curve since the mid-1980s as the cultivation of unprofitable areas has been abandoned. The low point was reached with the 1993 harvest of 48 000 t - the lowest since 1931. 1994 saw a temporary rally in production which went up to 52 000 t, thus meeting the EU quota of 50 000 t. However, with heavy crop losses due to drought, it is expected that sugar production will slip back to around 36 000 t in 1995. The country's sugar industry is in the process of being restructured following the decision taken in 1992 by the Barbados Sugar Industries Ltd. (BSIL), which was responsible for all sugar production, to file for bankruptcy due to overindcbtcdncss. With substantial new investment in sugar mills, it is hoped that production can be stepped up again, thereby avoiding the danger of losing the US sugar quota due to problems with deliveries and putting the industry in a position to meet the EU quota, which was recently raised to 64 000 t.
Sugar is Belize's main agricultural export product and this country is the lowest-cost producer in the English-speaking Caribbean. Production was boosted to over 100 000 t by 1990 and remained stable at this level over the following years. The United Kingdom is Belize's sole EU client, guaranteeing a fixed export volume of 39 400 t. The other main destination for sugar from Belize is the United States (1993/94 quota: 10 803 t). In view of the stagnation in production since the beginning of the 1990s and the shrinking quota for exports to the United States, the government, together with US Export Promotion Agencies, is promoting a programme of agricultural diversification in the main sugar-growing areas in the north of the country. The increase in the EU quota for 1995 to 55 000 t could act as a fillip to the sugar sector.
As is the case with bananas, the Dominican Republic is the region's largest sugar producer. Whilst sugar remains the country's main agricultural export product, both production and exports have dropped significantly since the mid-1980s as a result of the gradual reduction in the US sugar quota. Between 1988 and 1994 alone, the bumpy ride taken by sugar output resulted in a fall of over one-fifth from 777 000 t to 610 000 t. In view of the contracting export markets, the government is pressing growers to switch to non-traditional agricultural export products.
The climate in Guyana is particularly favourable to the cultivation of cane sugar, since the abundant rainfall makes it possible to harvest two crops per year. Despite this, sugar production fell steadily from 1983 to 1990, when it reached rock bottom at 132 000 t. This slump in production was explained by shortages of equipment, strikes and sometimes excessive rainfall, as a result of which there was a period when the country could no longer reach its EU quota of 163 000 t and even had to import sugar to meet domestic demand. Although production rose to 162 600 t in 1991, this was still short of the target of 180 000 t set for that year. This provoked a shake-up in the management structure of the sugar industry, a measure which produced an immediate powerful upsurge in production, reflected in the data for 1992 to 1994. Production in 1992 was already up by over 50% to 247 000 t, remained stable at this level in 1993 and then rose further to 253 000 t in 1994. Assuming that the
StBa/Eurostat 70 Caribbean ACP countries, 1995
urgent measures required to reorganise the infrastructure are successfully implemented, the future prospects for the Guyanan sugar industry look good, since it is counting on supplying an additional 30 000 t per year to the Portuguese market as of July 1995, on top of its existing EU quota. The production target for 1995 has been set at 265 000 t.
Sugar production in Haiti stagnated during the reference period at around 30 000 t. Whilst sugar remains an important export product for this crisis-torn economy, the low volume of output compared to the high population means that Haiti is actually a net importer of sugar, which it requires in order to satisfy domestic demand.
Up until recently, Jamaica was the second-largest producer of all the Caribbean ACP States, but sugar production here too has remained stagnant for a long time at between 200 000 t and 220 000 t. In 1994, however, production rose by 11% to 245 000 t despite the dry conditions and the devastation caused by Hurricane Gordon. Most of Jamaica's sugar ends up in the EU as part of its current 126 000 t export quota, and some still finds its way to the United States.
St Kitts and Nevis is the only OECS country where sugar is produced in any great quantity. After falling to 15 100 t in 1990, sugar production climbed back up to over 20 000 t in 1992, and though the industry managed to sustain this performance in 1993 and 1994, it never recaptured the heights of 1988 and 1989. The generally downward trend of the recent past was mainly the result of low world market prices and a shrinking export quota to the United States.
Trinidad and Tobago was once one of the Caribbean's traditional sugar producers, but when oil was found the sugar sector lost much of its economic clout. After fluctuating between 90 000 t and 120 000 t during the period from 1988 to 1993, sugar production then rose by over 20% in 1994 to 127 600 t. The largest customer for sugar from Trinidad and Tobago is once again the EU (EU quota: 47 500 t), followed by the United States, where over 8 000 t of sugar per year can be sold under preferential conditions.
Rice is an important export product for several Caribbean countries, and Guyana and Suriname in particular have established themselves as exporters on the world market. The cultivation of rice for export has taken off in recent years, particularly in Guyana which exports to the EU and, now that access to their markets has improved, to several Caricom countries (primarily Jamaica), as well as Aruba, Bonaire and Curaçao.
StBa/Eurostat Caribbean ACP countries, 1995
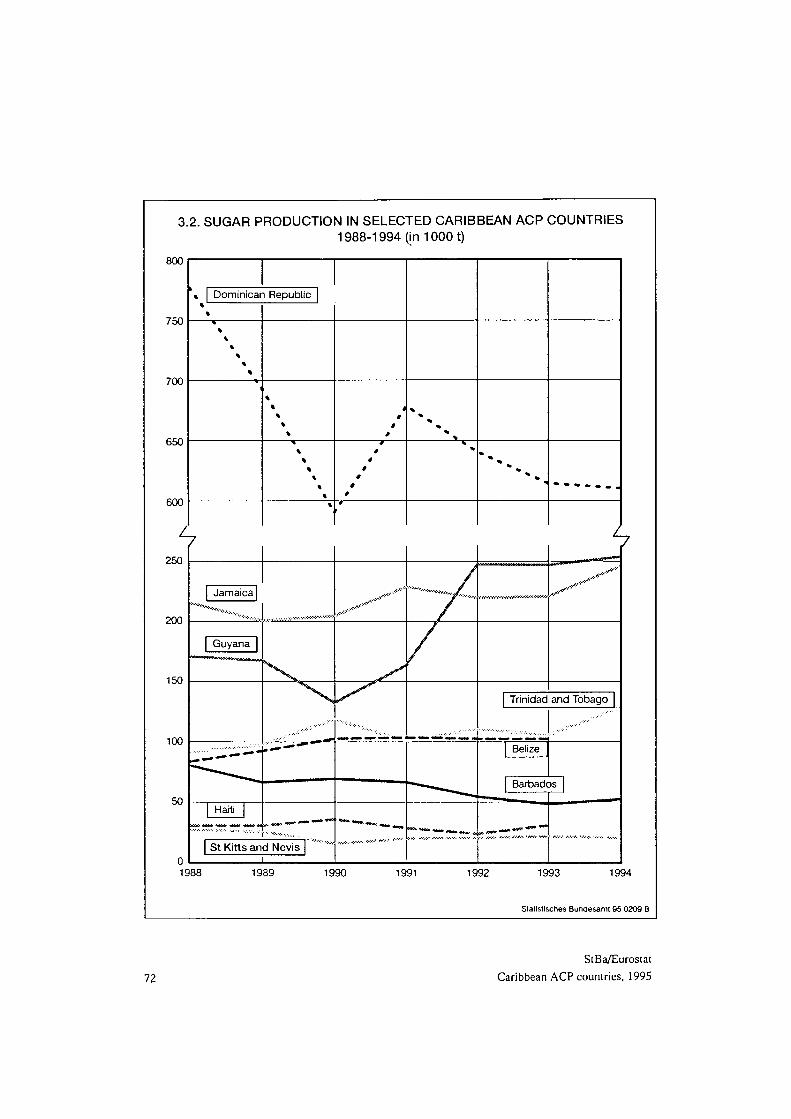
3.2. SUGAR PRODUCTION IN SELECTED CARIBBEAN ACP COUNTRIES
19881994 (in 1000 t)
800
750
700
650
600
h
'% Dominican Republic
%
■
%
1
4
» 9
0
9 0
0 Φ
0 0
Φ
'
% %
%
% % *
* %
250
200
150
100
50
Jamaica
Haiti
St Kitts and Nevis
'A/ . •AV .WAVr tVW»«« '« ' / / . ̂
h
Trinidad and Tobago
Belize
Barbados
1988 1989 1990 1991 1992 1993 1994
Statistisches Bundesamt 95 0209 Β
72
StBa/Eurostat
Caribbean ACP countries, 1995
The coffee and cocoa industries are traditional export sectors in the Caribbean, but as world market prices have tumbled since the end of the 1980s they have fallen deeper and deeper into crisis. The Dominican Republic and Haiti are the two largest countries where coffee production is aimed at world markets, and the slump in international prices has led to a drastic fall in coffee production and the value of coffee exports. For example, earnings from coffee exports by the Dominican Republic in 1992 were at their lowest level for 20 years, whilst the value of exports by Haiti was halved between 1987 and 1992. The same trend can be observed for cocoa, where the region's top exporters are once again the Dominican Republic and Haiti. Here too they have had to endure swingeing export losses, and the export of cocoa has virtually ground to a halt in Haiti. In addition to these two countries, a certain amount of cocoa is also grown in Grenada and Trinidad and Tobago for the world market. Cocoa production in Grenada has followed a downward course since 1992 because the small growers lack the financial resources required for capital projects. In the medium term, the only chance of any immediate or longer term revitalisation of these two segments of the export sector, allowing them to increase their contribution to the economy as a whole, would seem to lie in some lasting upturn in international coffee and cocoa prices. This does, however, seem rather unlikely.
Over the last few decades, citrus fruits have made up an ever-larger share of the agricultural exports by some Caribbean countries, and the developments in Belize in particular are worth highlighting. In recent years, it has expanded its duty-free and quota-free exports of deep-frozen orange and grapefruit concentrates to the United States, whilst citrus fruits over the same period have become the country's second largest group of agricultural exports behind sugar. With world market prices on the up and up, export revenue from citrus fruits is expected to rise substantially in 1995. In the Dominican Republic too, citrus fruits were once traded mainly within the Caribbean, but have developed into one of the growth sectors of its export trade. The country has plans, therefore, to tap the European and North American markets for citrus fruits.
The export of nutmeg and mace by Grenada is a rather special case, as together with Indonesia it controls the world market for this tropical spice. The collapse of the bilateral agreement with Indonesia in 1987 triggered offa serious downward spiral in nutmeg prices and resulted in massive export losses. After years of diminishing returns, the situation improved somewhat in 1994 when prices rose again and stocks were gradually reduced. For there to be any lasting recovery in nutmeg exports, however, a new agreement will need to be reached with Indonesia in order to stabilize the world market. Although these two dominant producers have, in the meantime, returned to the negotiating table, the talks were suspended in December 1994 because of certain disagreements. The negotiations arc scheduled to resume in March 1995.
In réponse to the pressing need to diversify their range of agricultural exports, promising steps have been taken recently by some Caribbean countries towards the production of non-traditional export fruits. The most important of these products are fresh vegetables, tropical fruits and spices. There looks to be a particularly good chance of success in Belize,
StBa/Eurostat Caribbean ACP countries, 1995 73
where the cultivation of cucumbers, ginger, pepper, papayas and mangoes to supply American consumers during the winter season is being intensified. The Dominican Republic is now successfully growing larger quantities of tropical fruits (particularly pineapples) and flowers for export markets, whilst grapefruit and copra could be potential new export products for Jamaica.
These new developments will, however, not be sufficient to offset the losses which traditional agricultural exports are soon expected to sustain when the new world trade order comes into being, and the chances that the new products will become as important to the economics of the Caribbean countries as, say, sugar or bananas arc extremely remote.
FORESTRY AND FISHERIES
Moving away from crop production, the forestry and fisheries sectors would seem to offer potential for broadening the export basis in some countries at least.
In Belize, for example, forestry once dominated economic life and this sector is showing strong signs of revival after long years of recession. An afforestation programme has recently been set in motion which, if successful, should make it possible to harvest tropical hardwoods. Of all the 15 Caribbean States, Guyana undoubtedly offers the greatest potential for forestry because it has the largest forested area (cf. Table 3.2). Recent investment in new wood-processing facilities has already led to a significant expansion in forestry activities, and with no let-up in the interest shown by foreign timber companies there is every chance that this sector will continue to grow over the coming years. Suriname is the third country whose abundance of forest resources should ensure that forestry plays a much more important role in the economy in the future. In the past, the development of forestry activities was hampered by the unstable state of the country and damage inflicted on the infrastructure, and timber-felling in Suriname actually fell in the 1980s and early 1990s. This situation could change very shortly, as an Indonesian consortium started commercial logging in 1994 and a Malaysian timber company also has plans for massive investment in this sector.
With regard to fisheries, the last few years have also witnessed some promising developments. Catching and exporting crabs, in particular, is becoming an increasingly lucrative export activity for many countries in the region. In Suriname, crabs have now overtaken rice and bananas as the most important agricultural export, as a result of promotional measures taken by the State. In neighbouring Guyana, which is self-sufficient in fish products, crab exports are third in the list of agricultural exports behind sugar and rice, and the potential for increasing exports offish and crabs is felt to be excellent. In Belize too, fish and fish products already formed the third-largest group of agricultural export products in 1993, behind sugar and citrus fruits but ahead of bananas. This was mainly due to the measures promoting crab-farming. Overfishing and illegal fishing outside the fishing season do, however, pose a threat to the fishing industry. The Bahamas also have plentiful fishery resources which, if the existing potential is properly exploited, could be developed into a key
StBa/Eurostat 74 Caribbean ACP countries, 1995
component of its export trade. A crab-farming project was recently set up using Taiwanese capital. In Barbados, the opening of a new fishing port and new marketing opportunities should yield good export prospects, and a fishing agreement recently reached with Guyana and Trinidad and Tobago allows Barbados to catch greater volumes of fish for export by fishing the territorial waters of these two countries. Although currently dependent on fish imports, Jamaica also has large stocks of freshwater fish and extensive seafishing grounds which, if developed, could bring in additional export revenue in the medium- and longer terms.
SUMMARY
The overall effect of the abovementioned attempts to diversify agricultural exports and expand food production should be to produce some moderate future growth in the agricultural sector in the Caribbean and to raise the level of agricultural productivity. These new efforts to promote non-traditional segments of the export market will not, however, be enough to make up for the declining importance of the traditional agricultural export sectors. All in all, the potential for increasing agricultural production, and more specifically broadening the range of exports, is not felt to be very great on account of the limited natural resources available to most Caribbean countries (the scarcity of land and water) and the shortage of manpower. Crop losses and setbacks in agricultural production will remain a fact of life in view of the recurring periods of drought, floods and tropical storms. Given these circumstances, agriculture, forestry and fisheries will be no more than a moderate growth factor for the economies of the Caribbean and certainly cannot be expected to be the powerhouse behind sustained economic growth. It is, therefore, essential that official economic policy in the Caribbean countries look beyond promoting the agricultural sector towards the development of the secondary and tertiary branches of the economy.
StBa/Eurostat Caribbean ACP countries, 1995 75
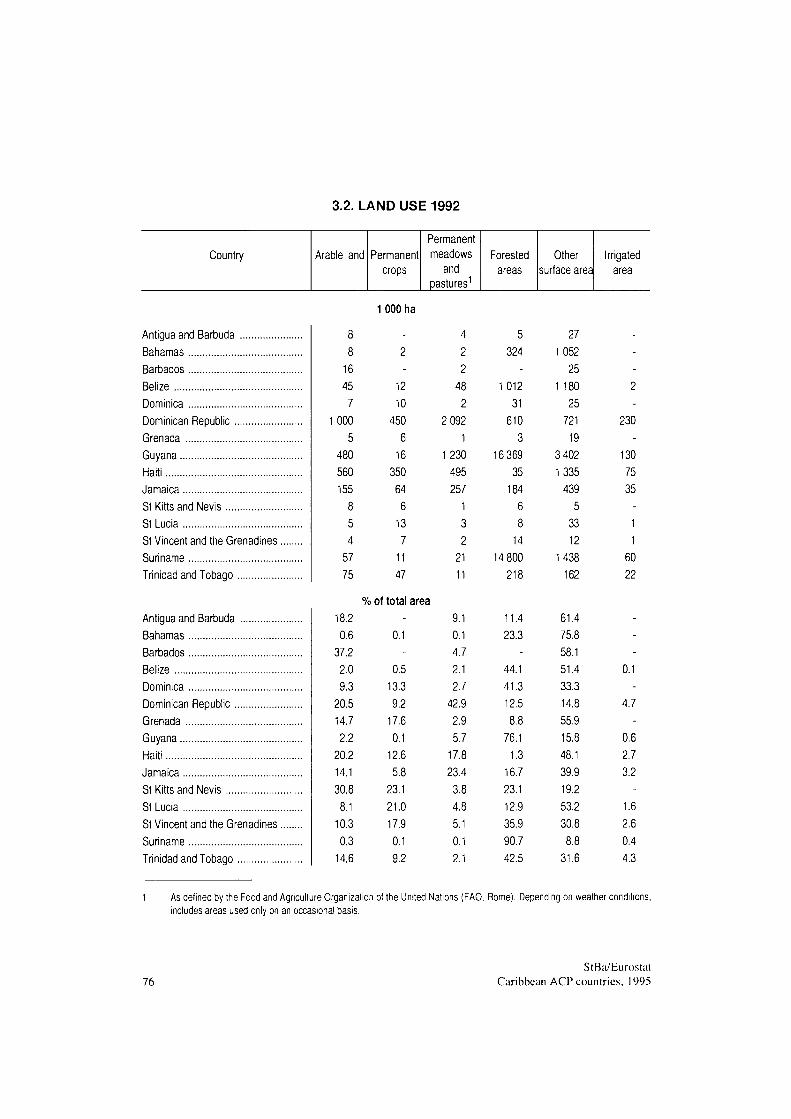
3.2. LAND USE 1992
Country Arable land Permanent crops
Permanent meadows
and pastures1
Forested areas
Other surface area
Irrigated area
1 000 ha
Antigua and Barbuda Bahamas Barbados Belize Dominica Dominican Republic Grenada Guyana Haiti Jamaica St Kitts and Nevis St Lucia St Vincent and the Grenadines Suriname Trinidad and Tobago
Antigua and Barbuda Bahamas Barbados Belize Dominica Dominican Republic Grenada Guyana Haiti Jamaica St Kitts and Nevis St Lucia St Vincent and the Grenadines Suriname Trinidad and Tobago
8 8
16 45 7
1000 5
480 560 155
8 5 4
57 75
18.2 0.6
37.2 2.0 9.3
20.5 14.7 2.2
20.2 14.1 30.8 8.1
10.3 0.3
14.6
-2 -
12 10
450 6
16 350 64 6
13 7
11 47
% of total area -
0.1 -
0.5 13.3 9.2
17.6 0.1
12.6 5.8
23.1 21.0 17.9 0.1 9.2
4 2 2
48 2
2 092 1
1230 495 257
1 3 2
21 11
9.1 0.1 4.7 2.1 2.7
42.9 2.9 5.7
17.8 23.4 3.8 4.8 5.1 0.1 2.1
5 324
-1012
31 610
3 16 369
35 184
6 8
14 14 800
218
11.4 23.3
-44.1 41.3 12.5 8.8
76.1 1.3
16.7 23.1 12.9 35.9 90.7 42.5
27 1052
25 1 180
25 721 19
3 402 1335
439 5
33 12
1438 162
61.4 75.8 58.1 51.4 33.3 14.8 55.9 15.8 48.1 39.9 19.2 53.2 30.8 8.8
31.6
---2 -
230 -
130 75 35
-1 1
60 22
---
0.1 -
4.7 -
0.6 2.7 3.2
-1.6 2.6 0.4 4.3
1 As defined by the Food and Agriculture Organization of the United Nations (FAO, Rome). Depending on weather conditions, includes areas used only on an occasional basis.
76 StBa/Eurostat
Caribbean ACP countries, 1995
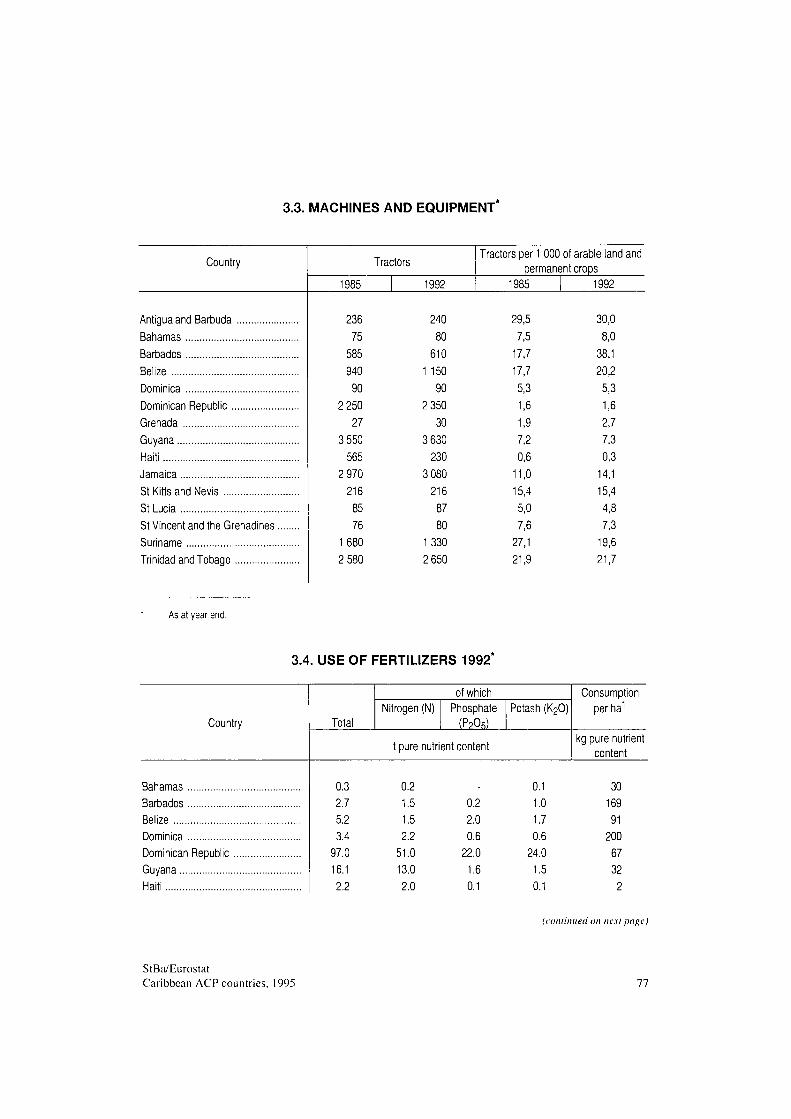
3.3. MACHINES AND EQUIPMENT
Country Tractors
1985 1992
Tractors per 1 000 of arable land and permanent crops
1985 1992
Antigua and Barbuda Bahamas Barbados Belize Dominica Dominican Republic Grenada Guyana Haiti Jamaica St Kitts and Nevis St Lucia St Vincent and the Grenadines Suriname Trinidad and Tobago
As at year end.
236 75
585 940 90
2 250 27
3 550 565
2 970 216 85 76
1680 2 580
240 80
610 1 150
90 2 350
30 3 630
230 3 080
216 87 80
1330 2 650
29,5 7,5
17,7 17,7 5,3 1,6 1,9 7,2 0,6
11,0 15,4 5,0 7,6
27,1 21,9
30,0 8,0
38,1 20,2 5,3 1,6 2,7 7,3 0,3
14,1 15,4 4,8 7,3
19,6 21,7
3.4. USE OF FERTILIZERS 1992
Country Total
of which Nitrogen I Phosphate
(PpOs)
Potash (K20)
i pure nutrient content
Consumption per ha1
kg pure nutrient content
Bahamas Barbados Belize Dominica Dominican Republic Guyana Haiti
0.3 2.7 5.2 3.4
97.0 16.1 2.2
0.2 1.5 1.5 2.2
51.0 13.0 2.0
0.2 2.0 0.6
22.0 1.6 0.1
0.1 1.0 1.7 0.6
24.0 1.5 0.1
30 169 91
200 67 32 2
(continued on next page)
StBa/Eurostat Caribbean ACP countries. 995 77
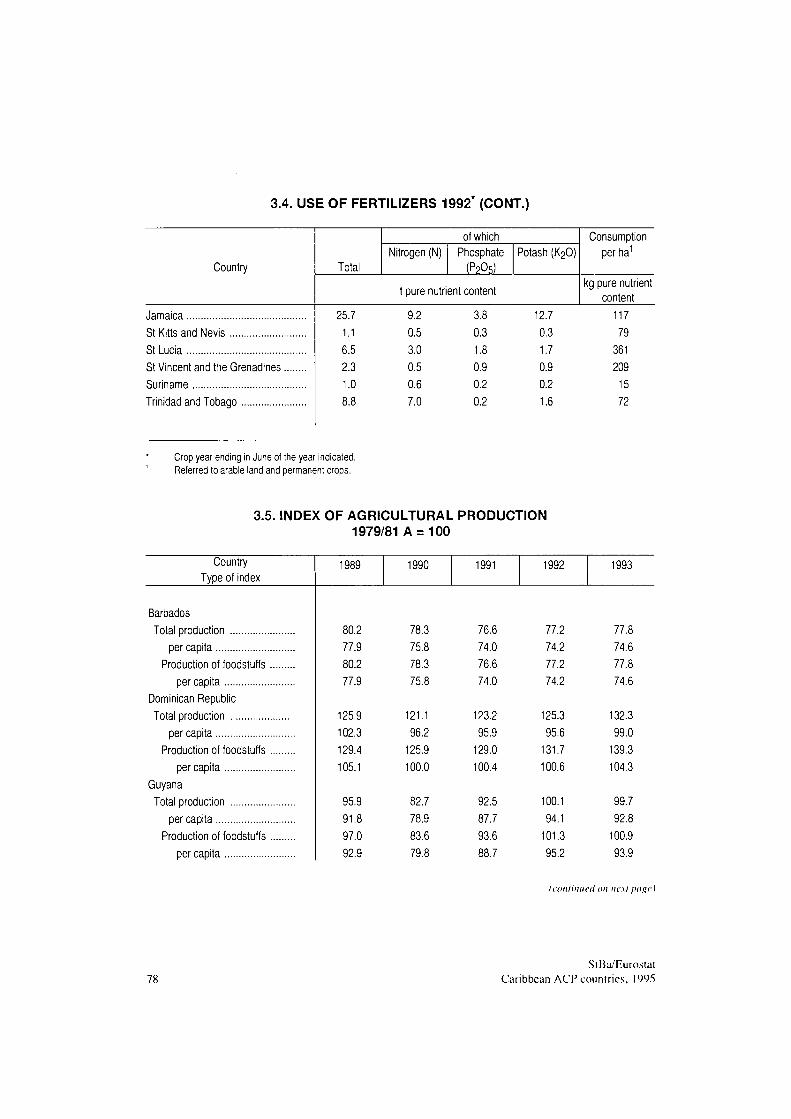
3.4. USE OF FERTILIZERS 1992* (CONT.)
Country
Jamaica St Kitts and Nevis St Lucia St Vincent and the Grenadines Suriname Trinidad and Tobago
Total
of which Nitrogen (N) Phosphate
(PpOs) Potash (K20)
t pure nutrient content
25.7 1.1 6.5 2.3 1.0 8.8
9.2 0.5 3.0 0.5 0.6 7.0
3.8 0.3 1.8 0.9 0.2 0.2
12.7 0.3 1.7 0.9 0.2 1.6
Consumption per ha1
kg pure nutrient content
117 79
361 209
15 72
Crop year ending in June of the year indicated. Referred to arable land and permanent crops.
3.5. INDEX OF AGRICULTURAL PRODUCTION 1979/81 A = 100
Country Type of index
1989 1990 1991 1992 1993
Barbados Total production
per capita Production of foodstuffs
per capita Dominican Republic Total production
per capita Production of foodstuffs
per capita Guyana Total production
per capita Production of foodstuffs
per capita
80.2 77.9 80.2 77.9
125.9 102.3 129.4 105.1
95.9 91.8 97.0 92.9
78.3 75.8 78.3 75.8
121.1 96.2
125.9 100.0
82.7 78.9 83.6 79.8
76.6 74.0 76.6 74.0
123.2 95.9
129.0 100.4
92.5 87.7 93.6 88.7
77.2 74.2 77.2 74.2
125.3 95.6
131.7 100.6
100.1 94.1
101.3 95.2
77.8 74.6 77.8 74.6
132.3 99.0
139.3 104.3
99.7 92.8
100.9 93.9
(continued on next page)
78 StBa/Eurostat
Caribbean ACP countries, 1995
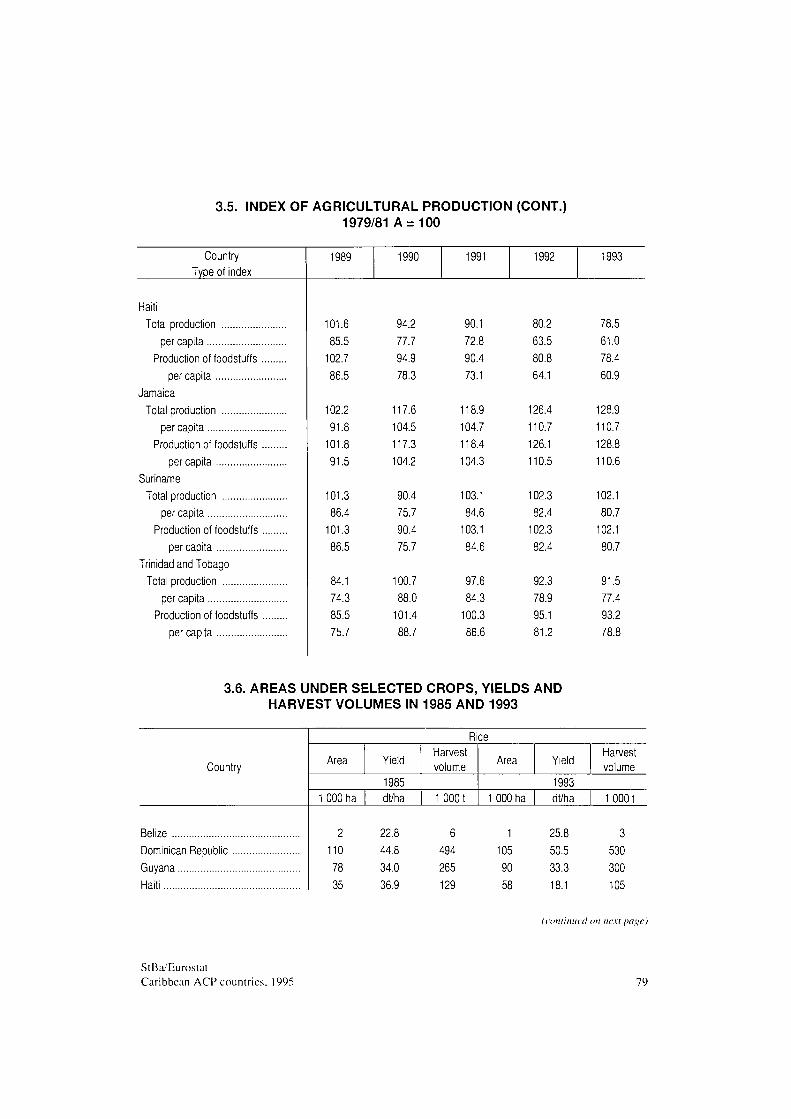
3.5. INDEX OF AGRICULTURAL PRODUCTION (CONT.) 1979/81 A = 100
Country Type of Index
Haiti Total production
per capita Production of foodstuffs
per capita Jamaica
Total production per capita
Production of foodstuffs per capita
Suriname Total production
per capita Production of foodstuffs
per capita Trinidad and Tobago
Total production per capita
Production of foodstuffs per capita
1989
101.6 85.5
102.7 86.5
102.2 91.8
101.8 91.5
101.3 86.4
101.3 86.5
84.1 74.3 85.5 75.7
1990
94.2 77.7 94.9 78.3
117.6 104.5 117.3 104.2
90.4 75.7 90.4 75.7
100.7 88.0
101.4 88.7
1991
90.1 72.8 90.4 73.1
118.9 104.7 118.4 104.3
103.1 84.6
103.1 84.6
97.6 84.3
100.3 86.6
1992
80.2 63.5 80.8 64.1
126.4 110.7 126.1 110.5
102.3 82.4
102.3 82.4
92.3 78.9 95.1 81.2
1993
78.5 61.0 78.4 60.9
128.9 110.7 128.8 110.6
102.1 80.7
102.1 80.7
91.5 77.4 93.2 78.8
3.6. AREAS UNDER SELECTED CROPS, YIELDS AND HARVEST VOLUMES IN 1985 AND 1993
Country
Belize Dominican Republic Guyana Haiti
Rice
Area Yield Harvest volume
1985 1 000 ha dt/ha 1 0001
Area Yield Harvest volume
1993 1 000 ha dt/ha 10001
2 22.8 6 1 25.8 3 110 44.8 494 105 50.5 530 78 34.0 265 90 33.3 300 35 36.9 129 58 18.1 105
(continued on next page)
StBa/Eurostat Caribbean ACP countries. 1995 79
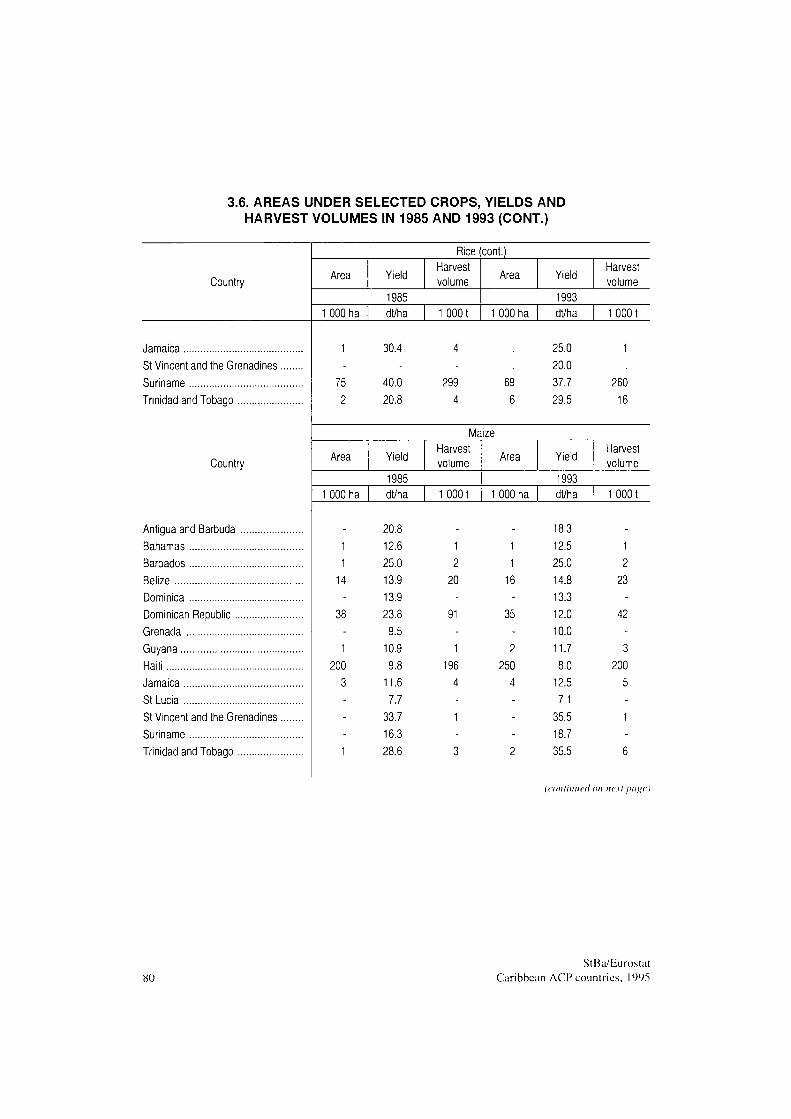
3.6. AREAS UNDER SELECTED CROPS, YIELDS AND HARVEST VOLUMES IN 1985 AND 1993 (CONT.)
Country
Jamaica St Vincent and the Grenadines Suriname Trinidad and Tobago
Country
Antigua and Barbuda Bahamas Barbados Belize Dominica Dominican Republic Grenada Guyana Haiti Jamaica St Lucia St Vincent and the Grenadines Suriname Trinidad and Tobago
Rice (cont.)
Area Yield Harvest volume
1985 1 000 ha dt/ha 1 0001
Area Yield Harvest volume
1993 1 000 ha dt/ha 10001
1 30.4 4 . 25.0 1 20.0
75 40.0 299 69 37.7 260 2 20.8 4 6 29.5 16
Maize
Area Yield Harvest volume
1985 1 000 ha dt/ha 1 0001
Area Yield Harvest volume
1993 1 000 ha dt/ha 1 0001
20.8 - - 18.3 1 12.6 1 1 12.5 1 1 25.0 2 1 25.0 2
14 13.9 20 16 14.8 23 13.9 - - 13.3
38 23.8 91 35 12.0 42 9.5 - - 10.0
1 10.9 1 2 11.7 3 200 9.8 196 250 8.0 200
3 11.6 4 4 12.5 5 7.7 - - 7.1
33.7 1 - 35.5 1 16.3 - - 18.7
1 28.6 3 2 35.5 6
(continued on next page)
80 StBa/Eurostat
Caribbean ACP countries. 1995
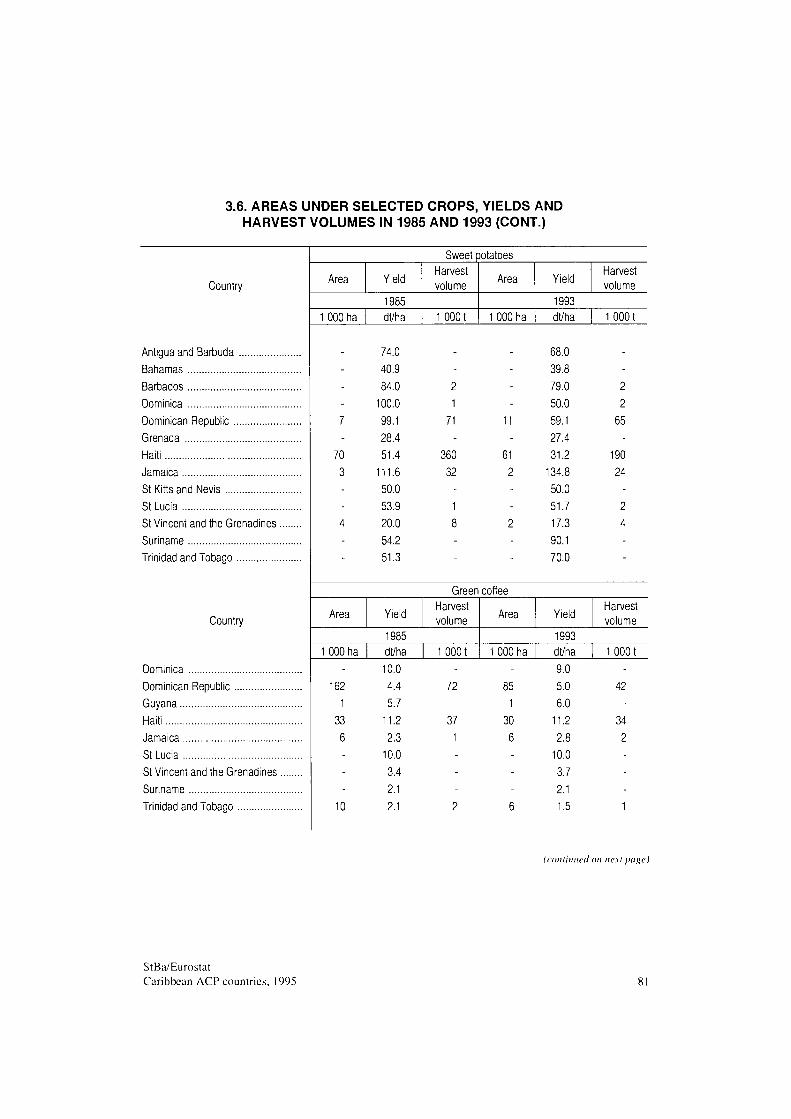
3.6. AREAS UNDER SELECTED CROPS, YIELDS AND HARVEST VOLUMES IN 1985 AND 1993 (CONT.)
Country
Antigua and Barbuda Bahamas Barbados Dominica Dominican Republic Grenada Haiti Jamaica St Kitts and Nevis St Lucia St Vincent and the Grenadines Suriname Trinidad and Tobago
Country
Dominica Dominican Republic Guyana Haiti Jamaica St Lucia St Vincent and the Grenadines Suriname Trinidad and Tobago
Sweet potatoes
Area Yield Harvest volume
1985 1 000 ha dt/ha 1 0001
Area Yield Harvest volume
1993 1 000 ha dt/ha 10001
74.0 - - 68.0 40.9 - - 39.8 84.0 2 - 79.0 2
100.0 1 - 50.0 2 7 99.1 71 11 59.1 65
28.4 - - 27.4 70 51.4 360 61 31.2 190 3 111.6 32 2 134.8 24
50.0 - - 50.0
53.9 1 - 51.7 2 4 20.0 8 2 17.3 4
54.2 - - 90.1 51.3 - - 70.0
Green coffee
Area Yield Harvest volume
1985 1 000 ha dt/ha 10001
Area Yield Harvest volume
1993 1 000 ha dt/ha 10001
10.0 - - 9.0 162 4.4 72 85 5.0 42
1 5.7 - 1 6.0 33 11.2 37 30 11.2 34 6 2.3 1 6 2.8 2
10.0 - - 10.0 3.4 - 3.7 2.1 - - 2.1
10 2.1 2 6 1.5 1
(continued on next page)
StBa/Eurostat Caribbean ACP countries, 1995 81
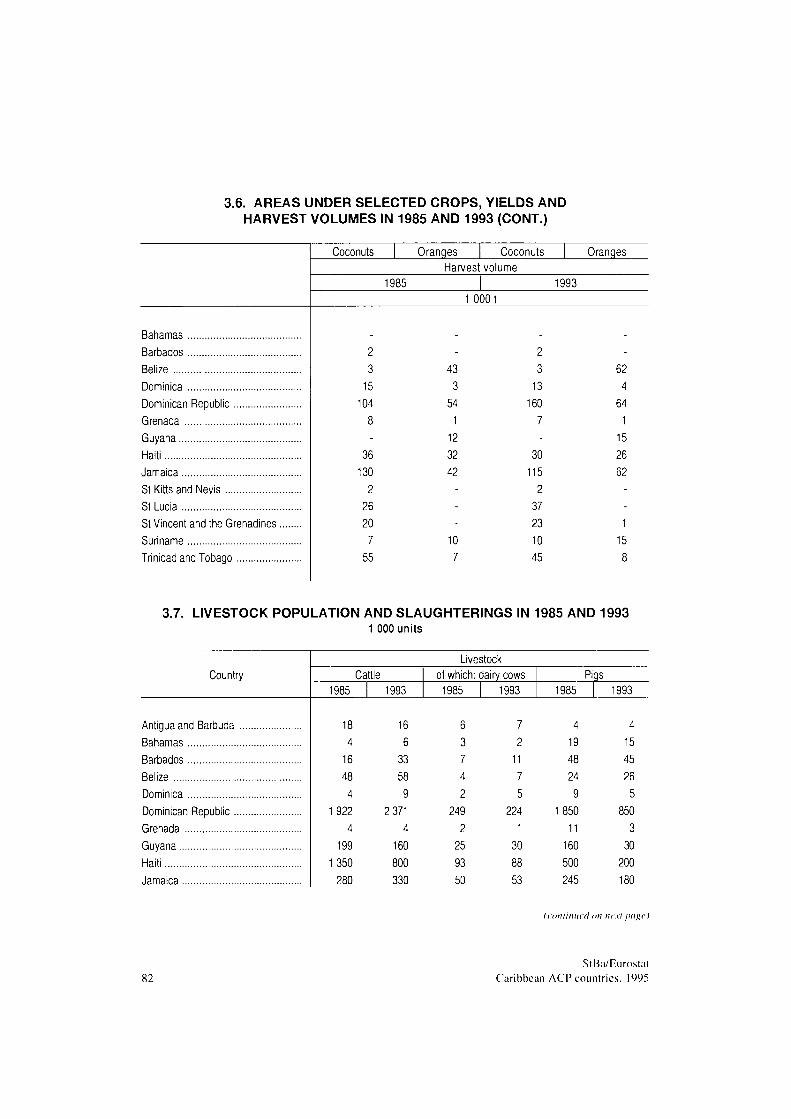
3.6. AREAS UNDER SELECTED CROPS, YIELDS AND HARVEST VOLUMES IN 1985 AND 1993 (CONT.)
Bahamas Barbados Belize Dominica Dominican Republic Grenada Guyana Haiti Jamaica St Kitts and Nevis St Lucia St Vincent and the Grenadines Suriname Trinidad and Tobago
Coconuts Oranges Coconuts Oranges Harvest volume
1985 1993 1 0001
2 3
15 104
8 -
36 130
2 26 20 7
55
-43 3
54 1
12 32 42
_ -
10 7
2 3
13 160
7 -
30 115
2 37 23 10 45
-62 4
64 1
15 26 62
_
1 15 8
3.7. LIVESTOCK POPULATION AND SLAUGHTERINGS IN 1985 AND 1993 1 000 units
Country
Antigua and Barbuda Bahamas ... Barbados ... Belize Dominica ... Dominican Renuhlic
Grenada .... Guyana Haiti Jamaica
Livestock Cattle
1985
18 4
16 48 4
1 922 4
199 1350
280
1993
16 6
33 58 9
2 371 4
160 800 330
of which 1985
6 3 7 4 2
249 2
25 93 50
dairy cows 1993
7 2
11 7 5
224 1
30 88 53
Pigs 1985
4 19 48 24 9
1 850 11
160 500 245
1993
4 15 45 26 5
850 3
30 200 180
(continued on next page)
82 StBa/Eurostat
Caribbean ACP countries. 1995
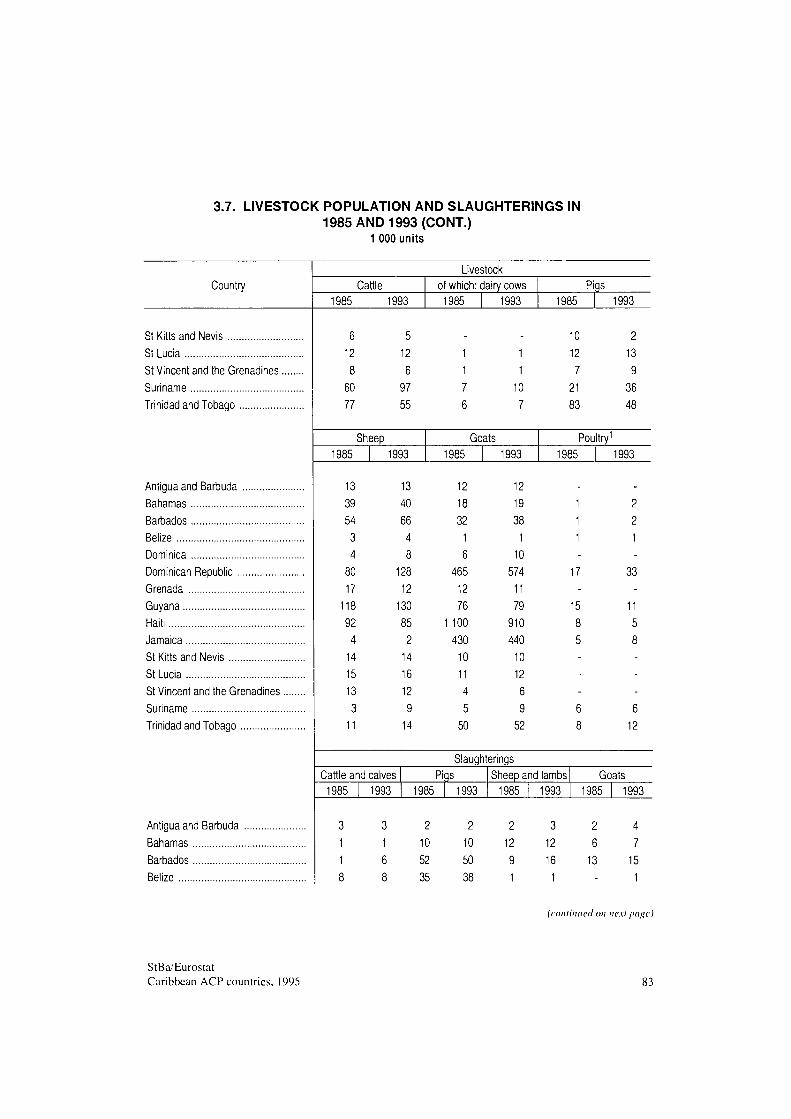
3.7. LIVESTOCK POPULATION AND SLAUGHTERINGS IN 1985 AND 1993 (CONT.)
1 000 units
Country Livestock
Cattle 1985 1993
of which: dairy cows 1985 1993
Pigs 1985 1993
St Kitts and Nevis St Lucia St Vincent and the Grenadines. Suriname Trinidad and Tobago
Antigua and Barbuda Bahamas Barbados Belize Dominica Dominican Republic Grenada Guyana Haiti Jamaica St Kitts and Nevis St Lucia St Vincent and the Grenadines Suriname Trinidad and Tobago
6 12 8
60 77
5 12 6
97 55
13 39 54 3 4
80 17
118 92 4
14 15 13
3 11
13 40 66 4 8
128 12
130 85 2
14 16 12 9
14
1 1
10 7
12 18 32
1 6
465 12 76
1 100 430
10 11 4
5 50
12 19 38
1 10
574 11 79
910 440
10 12 6 9
52
10 12 7
21 83
2 13 9
36 48
Sheep 1985 1993
Goats 1985 1993
Poultry1
1985 1993
1 1 1
17
15 8 5
2 2 1
33
11 5
6 12
Slaughterings Cattle and calves
1985 1993 Plqs
1985 1993 Sheep and lambs
1985 1993 Goats
1985 1993
Antigua and Barbuda Bahamas Barbados Belize
2
10 52 35
2
10 50 38
2 12 9 1
3 12 16 1
2
6 13
-
4 7
15 1
(continued on next page)
StBa/Eurostat Caribbean ACP countries, 1995 83
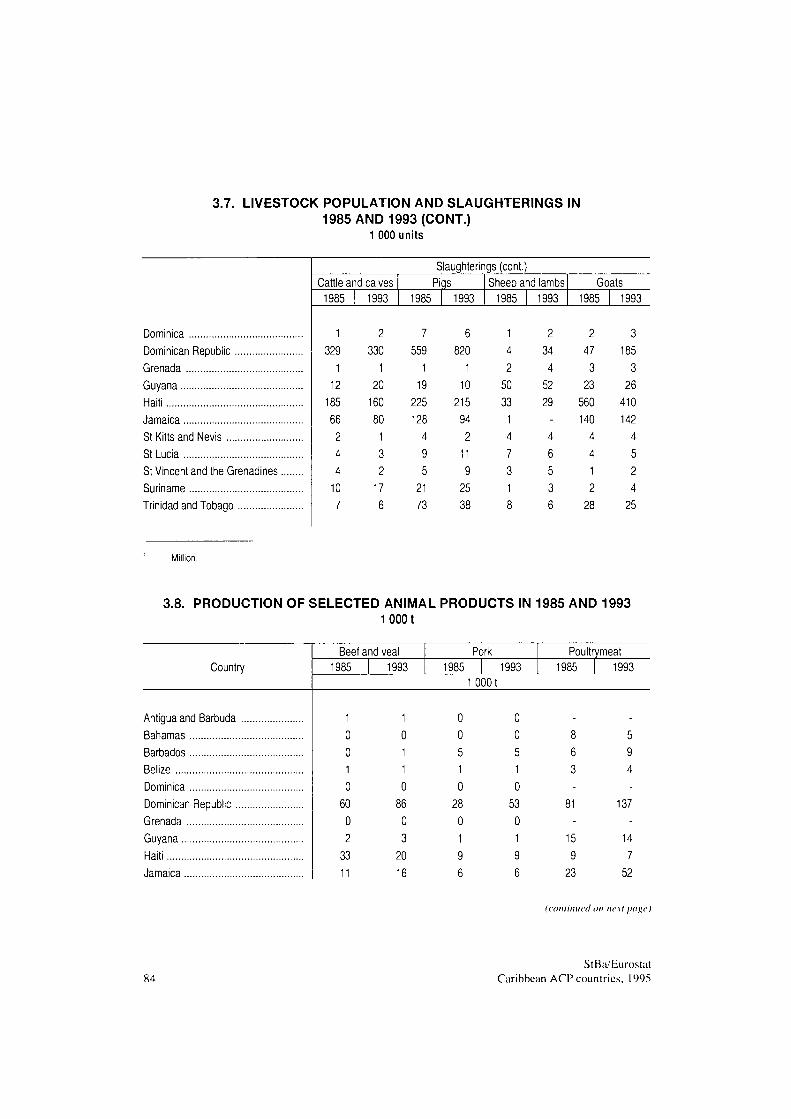
3.7. LIVESTOCK POPULATION AND SLAUGHTERINGS IN 1985 AND 1993 (CONT.)
1 000 units
Dominica Dominican Republic Grenada Guyana Haiti Jamaica St Kitts and Nevis St Lucia St Vincent and the Grenadines Suriname Trinidad and Tobago
Slaughterings (cont.) Cattle and calves
1985
1 329
1 12
185 66 2 4 4
10 7
1993
2 330
1 20
160 80
1 3 2
17 6
Pigs 1985
7 559
1 19
225 128
4 9 5
21 73
1993
6 820
1 10
215 94 2
11 9
25 38
Sheep and lambs 1985
1 4 2
50 33 1 4 7 3 1 8
1993
2 34 4
52 29
-4 6 5 3 6
Goats 1985
2 47 3
23 560 140
4 4 1 2
28
1993
3 185
3 26
410 142
4 5 2 4
25
Million.
3.8. PRODUCTION OF SELECTED ANIMAL PRODUCTS IN 1985 AND 1993 10001
Country
Antigua and Barbuda Bahamas Barbados Belize Dominica Dominican Republic Grenada Guyana Haiti Jamaica
Beef and veal 1985 1993
Pork 1985 1993
Poultrymeat 1985 1993
1 0001
1 1 0 0 - -0 0 0 0 8 5 0 1 5 5 6 9 1 1 1 1 3 4 0 0 0 0 - -
60 86 28 53 81 137 0 0 0 0 - -2 3 1 1 15 14
33 20 9 9 9 7 11 16 6 6 23 52
(continued on next page)
84 StBa/Eurostat
Caribbean ACP countries, 1995
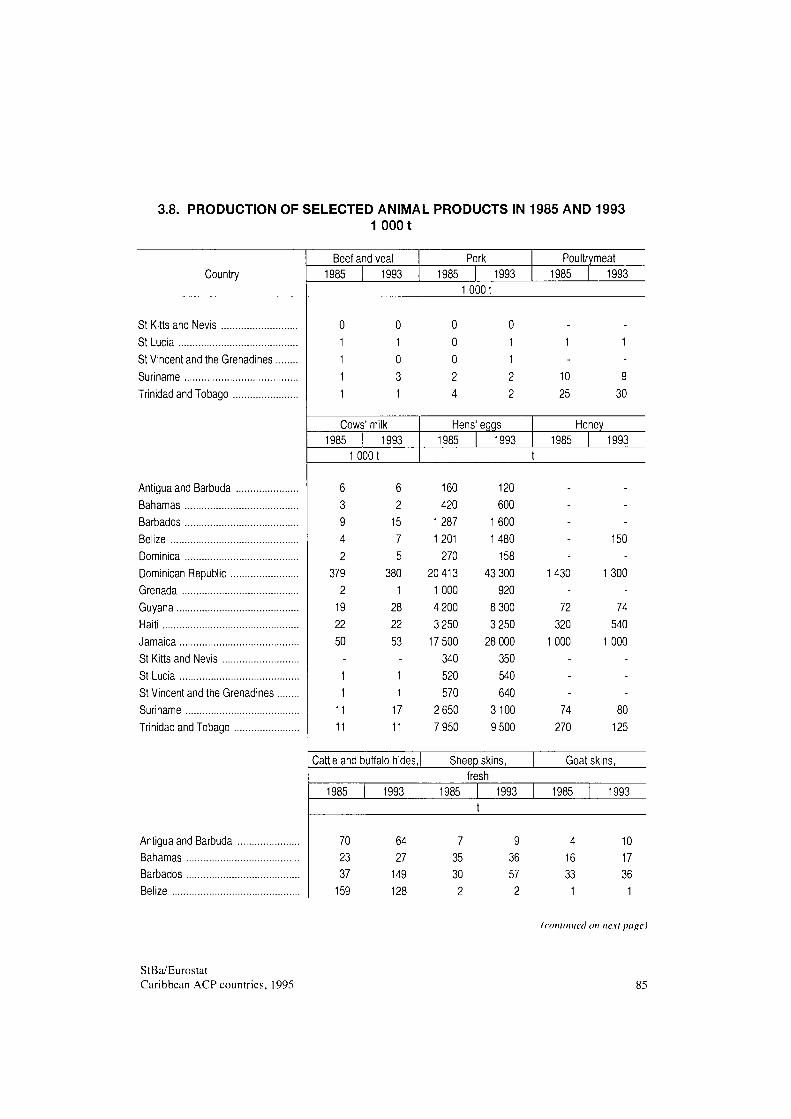
3.8. PRODUCTION OF SELECTED ANIMAL PRODUCTS IN 1985 AND 1993 1000 t
Country
St Kitts and Nevis St Lucia St Vincent and the Grenadines Suriname Trinidad and Tobago
Antigua and Barbuda Bahamas Barbados Belize Dominica Dominican Republic Grenada Guyana Haiti Jamaica St Kitts and Nevis St Lucia St Vincent and the Grenadines Suriname Trinidad and Tobago
Antigua and Barbuda Bahamas Barbados Belize
Beef and veal 1985 1993
Pork 1985 1993
Poultrymeat 1985 1993
10001
0 1 1 1 1
0 1 0 3 1
Cows' milk 1985 1993
1 0001
6 3 9 4 2
379 2
19 22 50
_ 1 1
11 11
6 2
15 7 5
380 1
28 22 53
_ 1 1
17 11
Cattle and buffalo hides,
0 0 0 2 4
Hens 1985
0 1 1 2 2
eggs 1993
1
10 25
1
9 30
Honey 1985 1993
t
160 420
1287 1201
270 20 413
1000 4 200 3 250
17 500 340 520 570
2 650 7 950
Sheer
120 600
1600 1480
158 43 300
920 8 300 3 250
28 000 350 540 640
3100 9 500
skins,
---
1430 -
72 320
1000 _ -
74 270
--
150
1 300 -
74 540
1000 _
-80
125
Goat skins, fresh
1985
70 23 37
159
1993
64 27
149 128
1985
7 35 30 2
1993
t
9 36 57 2
1985
4 16 33 1
1993
10 17 36 1
(continued on next page)
StBa/Eurostat Caribbean ACP countries, 1995 85
3.8. PRODUCTION OF SELECTED ANIMAL PRODUCTS IN 1985 AND 1993 (CONT.)
10001
Dominica Dominican Republic Grenada Guyana Haiti Jamaica St Kitts and Nevis St Lucia St Vincent and the Grenadines Suriname Trinidad and Tobago
Cattle and buffalo hides, Sheep skins, Goat skins, fresh
1985
32 7 600
19 300
4 070 1453
37 79 84
203 175
1993
40 7 623
18 500
2 420 1760
28 69 50
357 150
1985
4 14 5
125 116
2 13 23 7 4
23
1993
5 117
9 130 102
1 13 20 11 9
18
1985
6 93 6
46 1008
280 9
10 3 6
70
1993
9 370
7 52
738 284 10 12 3
10 63
3.9. TIMBER-FELLING IN 1985 AND 1992 1 000 m3
Country Total Industrial timber
Firewood 8 wood for charcoal
1985
Total Industrial
timber
1992
Firewood & wood for charcoal
Bahamas Belize Dominican Republic . Guyana Haiti Jamaica Suriname Trinidad and Tobago
115 167 982 214
5 284 133 230 56
115 41 6
198 239 120 216 34
126 976
16 5 045
13 14 22
115 188 982 177
6 051 169 154 87
115 62 6
163 239 156 135 65
126 976
14 5812
13 19 22
86 StBa/Eurostat
Caribbean ACP countries, 1995
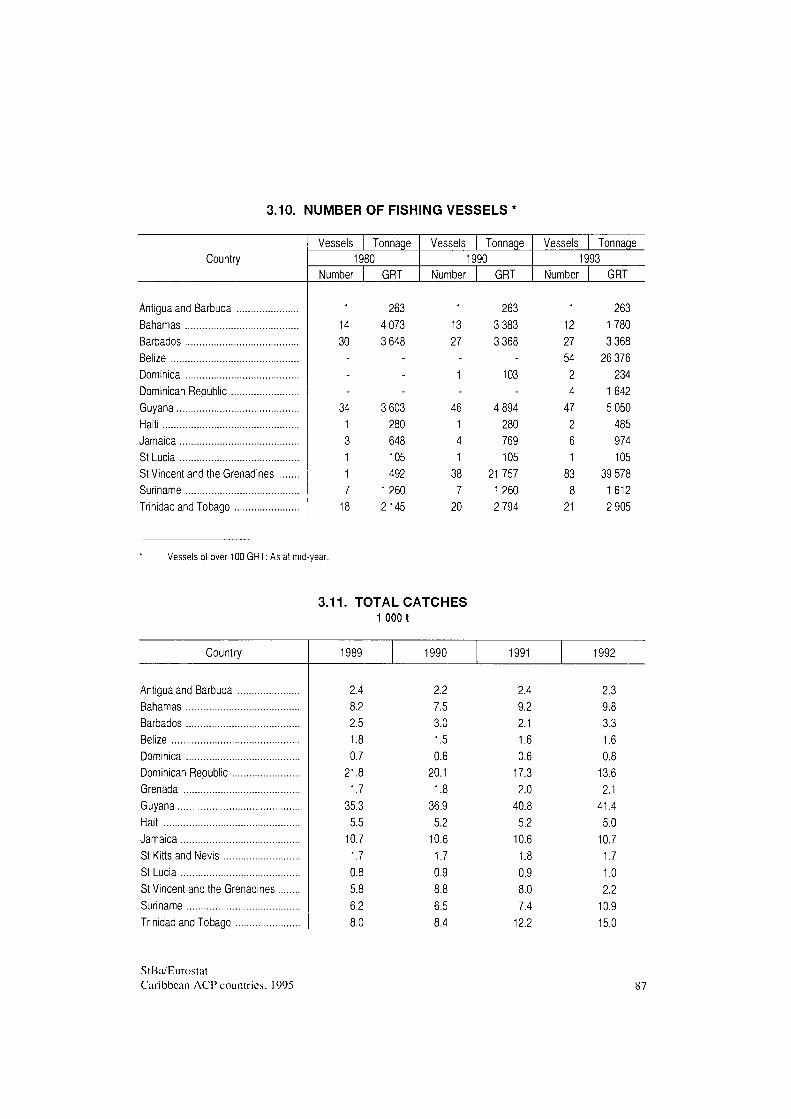
3.10. NUMBER OF FISHING VESSELS
Antigua and Barbuda Bahamas Barbados Belize Dominica Dominican Republic Guyana Haiti Jamaica St Lucia St Vincent and the Grenadines Suriname Trinidad and Tobago
Country Vessels Tonnaqe
1980 Number GRT
Vessels Tonnage 1990
Number GRT
Vessels Tonnage 1993
Number GRT
1 14 30
34 1 3 1 1 7
263 4 073 3 648
3 603 280 648 105 492
1260 2145
1 13 27
46 1 4 1 38 7 20
263 3 383 3 368
103
4 894 280 769 105
21757 1260 2 794
1 12 27 54 2 4 47 2 6 1 83 8 21
263 1780 3 368 26 376
234 1642 5 050 485 974 105
39 578 1612 2 905
Vessels of over 100 GRT: As at mid-year.
3.11. TOTAL CATCHES 1 000 t
Country 1989 1990 1991 1992
Antigua and Barbuda Bahamas Barbados Belize Dominica Dominican Republic Grenada Guyana Haiti Jamaica St Kitts and Nevis St Lucia St Vincent and the Grenadines Suriname Trinidad and Tobago
2.4 8.2 2.5 1.8 0.7
21.8 1.7
35.3 5.5
10.7 1.7 0.8 5.8 6.2 8.0
2.2 7.5 3.0 1.5 0.6
20.1 1.8
36.9 5.2
10.6 1.7 0.9 8.8 6.5 8.4
2.4 9.2 2.1 1.6 0.6
17.3 2.0
40.8 5.2
10.6 1.8 0.9 8.0 7.4
12.2
2.3 9.8 3.3 1.6 0.8
13.6 2.1
41.4 5.0
10.7 1.7 1.0 2.2
10.9 15.0
StBa/Eurostat Caribbean ACP countries. 1995 87
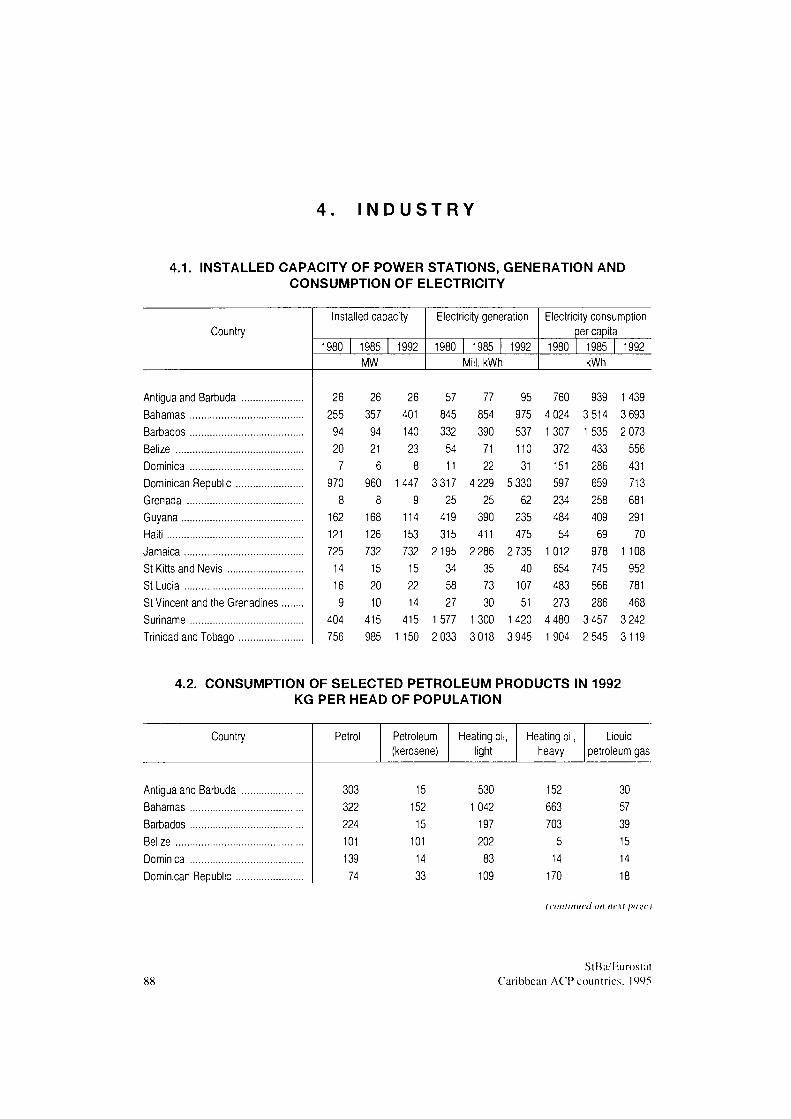
I N D U S T R Y
4.1. INSTALLED CAPACITY OF POWER STATIONS, GENERATION AND CONSUMPTION OF ELECTRICITY
Country
Antigua and Barbuda Bahamas Barbados Belize Dominica Dominican Republic Grenada Guyana Haiti Jamaica St Kitts and Nevis St Lucia St Vincent and the Grenadines Suriname Trinidad and Tobago
Installed capacity
1980 1985 1992 MW
Electricity generation
1980 1985 1992 Mill. kWh
Electricity consumption per capita
1980 1985 1992 kWh
26 26 26 57 77 95 760 939 1 439 255 357 401 845 854 975 4 024 3 514 3 693 94 94 140 332 390 537 1 307 1 535 2 073 20 21 23 54 71 110 372 433 556 7 6 8 11 22 31 151 286 431
970 960 1447 3 317 4 229 5 330 597 659 713 8 8 9 25 25 62 234 258 681
162 168 114 419 390 235 484 409 291 121 126 153 315 411 475 54 69 70 725 732 732 2195 2 286 2 735 1012 978 1108
14 15 15 34 35 40 654 745 952 16 20 22 58 73 107 483 566 781 9 10 14 27 30 51 273 286 468
404 415 415 1577 1300 1420 4 480 3 457 3 242 756 985 1150 2 033 3018 3945 1904 2 545 3119
4.2. CONSUMPTION OF SELECTED PETROLEUM PRODUCTS IN 1992 KG PER HEAD OF POPULATION
Country
Antigua and Barbuda Bahamas Barbados Belize Dominica Dominican Republic
Petrol
303 322 224 101 139 74
Petroleum (kerosene)
15 152 15
101 14 33
Heating oil, light
530 1042
197 202 83
109
Heating oil, heavy
152 663 703
5 14
170
Liquid petroleum gas
30 57 39 15 14 18
(continued on next page)
88 StBa/Eurostat
Caribbean ACP countries. 1995
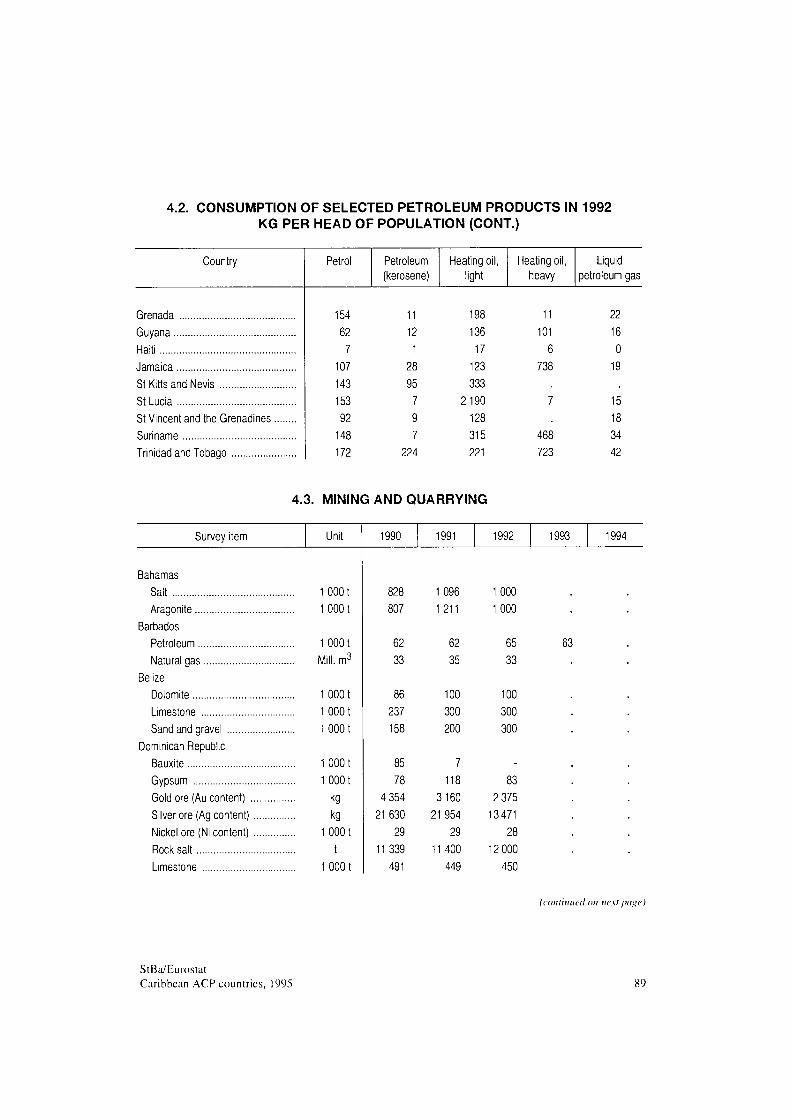
4.2. CONSUMPTION OF SELECTED PETROLEUM PRODUCTS IN 1992 KG PER HEAD OF POPULATION (CONT.)
Country
Grenada Guyana Haiti Jamaica St Kitts and Nevis St Lucia St Vincent and the Grenadines Suriname Trinidad and Tobago
Petrol
154 62 7
107 143 153 92
148 172
Petroleum (kerosene)
11 12 1
28 95 7 9 7
224
Heating oil, light
198 136 17
123 333
2190 128 315 221
Heating oil, heavy
11 101
6 738
7
468 723
Liquid petroleum gas
22 16 0
19
15 18 34 42
4.3. MINING AND QUARRYING
Survey Item Unit 1990 1991 992 1993 1994
Bahamas Salt 1 0001 Aragonlte 1 0001
Barbados Petroleum 1 0001 Natural gas Mill, m3
Belize Dolomite 1 0001 Limestone 1 0001 Sand and gravel 1 0001
Dominican Republic Bauxite 1 0001 Gypsum 1 000t Gold ore (Au content) kg Silver ore (Ag content) kg Nickel ore (Ni content) 1 0001 Rocksalt t Limestone 1 0001
828 807
62 33
237 158
85 78
4 354 21 630
29 11339
491
1096 1 211
62 35
100 300 200
118 3160 21954
29 11400
449
1000 1000
65 33
100 300 300
83 2 375 13 471
28 12 000
450
63
(continued on next page)
StBa/Eurostat Caribbean ACP countries, 1995 89
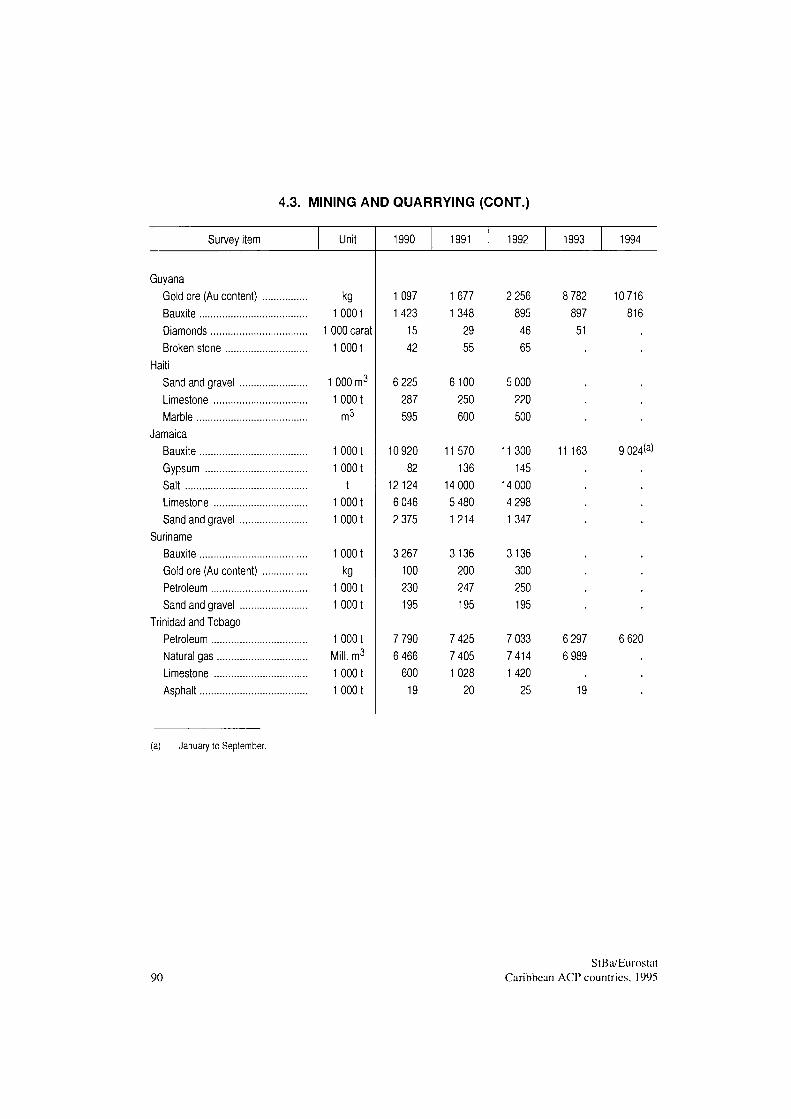
4.3. MINING AND QUARRYING (CONT.)
Survey item Unit 1990 1991 1992 1993 1994
Guyana Gold ore (Au content) kg Bauxite 1 0001 Diamonds 1 000 carat Broken stone 1 0001
Haiti Sand and gravel 1000 m3
Limestone 1 0001 Marble m3
Jamaica Bauxite 1 0001 Gypsum 1 0001 Salt t Limestone 1 0001 Sand and gravel 1 0001
Suriname Bauxite 1 0001 Gold ore (Au content) kg Petroleum 1 0001 Sand and gravel 10001
Trinidad and Tobago Petroleum 1 0001 Natural gas Mill, m3
Limestone 1 0001 Asphalt 1 0001
1097 1423 15 42
6 225 287 595
10 920 82
12124 6 046 2 375
3 267 100 230 195
7 790 6 466 600 19
1677 1348 29 55
6100 250 600
11570 136
14 000 5 480 1214
3136 200 247 195
7 425 7 405 1028 20
2 256 895 46 65
5 000 220 500
11300 145
14 000 4 298 1347
3136 300 250 195
7 033 7414 1420 25
8 782 897 51
11 163
6 297 6 989
19
10716 816
9 024
6 620
(a) January to September.
90 StBa/Eurostat
Caribbean ACP countries, 1995
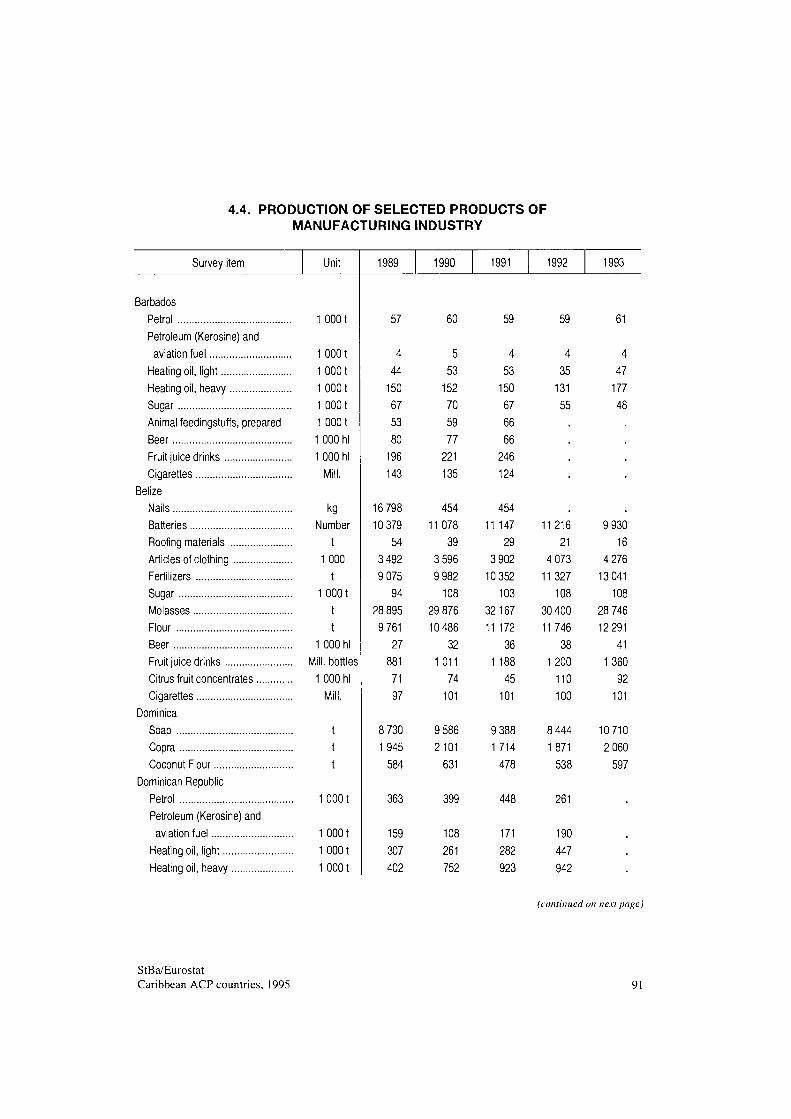
4.4. PRODUCTION OF SELECTED PRODUCTS OF MANUFACTURING INDUSTRY
Survey item Unit 1989 1990 1991 1992 1993
Barbados Petrol 10001 Petroleum (Kerosine) and aviation fuel 1 0001
Heating oil, light 1 0001 Heating oil, heavy 1 0001 Sugar 1 0001 Animal feedingstuffs, prepared 1 0001 Beer 1 000 hi Fruit juice drinks 1 000 hi Cigarettes Mill.
Belize Nails kg Batteries Number Roofing materials t Articles of clothing 1 000 Fertilizers t Sugar 1 0001 Molasses t Flour t Beer 1 000 hi Fruit juice drinks Mill, bottles Citrus fruit concentrates 1 000 hi Cigarettes Mill.
Dominica Soap t Copra t Coconut Flour t
Dominican Republic Petrol 1 0001 Petroleum (Kerosine) and aviation fuel 1 0001
Heating oil, light 1 0001 Heating oil, heavy 1 0001
57
363
60
399
59
448
59
261
159 307 402
108 261 752
171 282 923
190 447 942
61
4 44 150 67 53 80 196 143
16 798 10 379
54 3 492 9 075 94
28 895 9 761 27 881 71 97
8 730 1945 584
5 53 152 70 59 77 221 135
454 11078
39 3 596 9 982 108
29 876 10 486
32 1 011 74 101
9 586 2101 631
4 53 150 67 66 66 246 124
454 11 147
29 3 902 10 352 103
32167 11 172
36 1 188 45 101
9 388 1 714 478
4 35 131 55
11216 21
4 073 11327 108
30400 11746
38 1200 110 100
8 444 1871 538
4 47 177 48
9 930 16
4 276 13 041 108
28 746 12 291
41 1360 92 101
10710 2 060 597
(continued on next page)
StBa/Eurostat Caribbean ACP countries, 1995
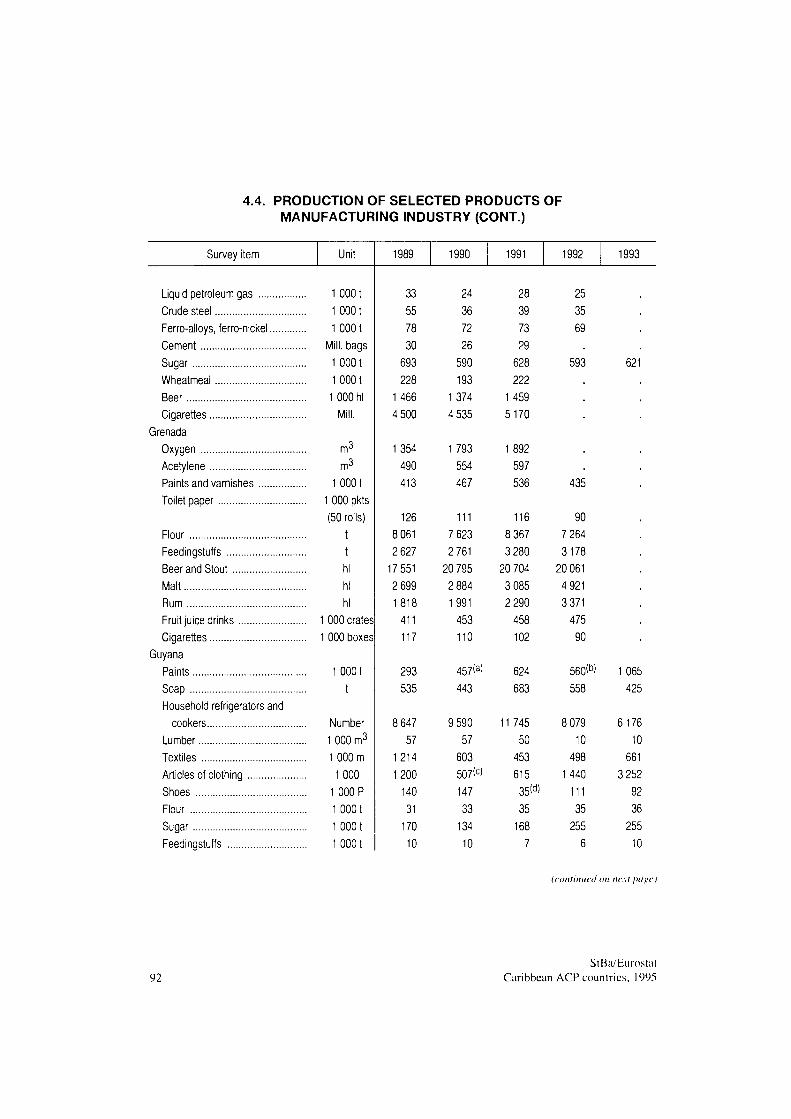
4.4. PRODUCTION OF SELECTED PRODUCTS OF
MANUFACTURING INDUSTRY (CONT.)
Survey item Unit 1989 1990 1991 1992 1993
Liquid petroleum gas 1 0001
Crude steel 1 0001
Ferroalloys, ferronickel 1 0001
Cement Mill, bags
Sugar 1 0001
Wheatmeal 1 0001
Beer 1000hl
Cigarettes Mill.
Grenada
Oxygen m3
Acetylene m3
Paints and varnishes 1 0001
Toilet paper 1 OOOpkts
(50 rolls)
Flour t
Feedingstuffs t
Beer and Stout hi
Malt hi
Rum hi
Fruit juice drinks 1 000 crates
Cigarettes 1 000 boxes
Guyana
Paints 1 0001
Soap t
Household refrigerators and
cookers Number
Lumber 1 000 m3
Textiles 1 000 m
Articles of clothing 1 000
Shoes 1 000 Ρ
Flour 1 0001
Sugar 1 0001
Feedingstuffs 1 0001
33
55
78
30
693
228
1466
4 500
1354
490
413
126
8 061
2 627
17 551
2 699
1818
411
117
293
535
8 647
57
1214
1200
140
31
170
10
24
36
72
26
590
193
1374
4 535
1793
554
467
111
7 623
2 761
20 795
2 884
1991
453
110
457(a)
443
9 590
57
603
507<c>
147
33
134
10
28
39
73
29
628
222
1459
5170
1892
597
536
116
8 367
3 280
20 704
3 085
2 290
458
102
624
683
11 745
50
453
615
35(d>
35
168
7
25
35
69
593
435
90
7 264
3178
20 061
4 921
3 371
475
90
560Íb>
558
8 079
10
498
1440
111
35
255
6
621
1065
425
6176
10
661
3 252
92
36
255
10
(continued on next page)
92
StBa/Eurostat
Caribbean ACP countries, 1995
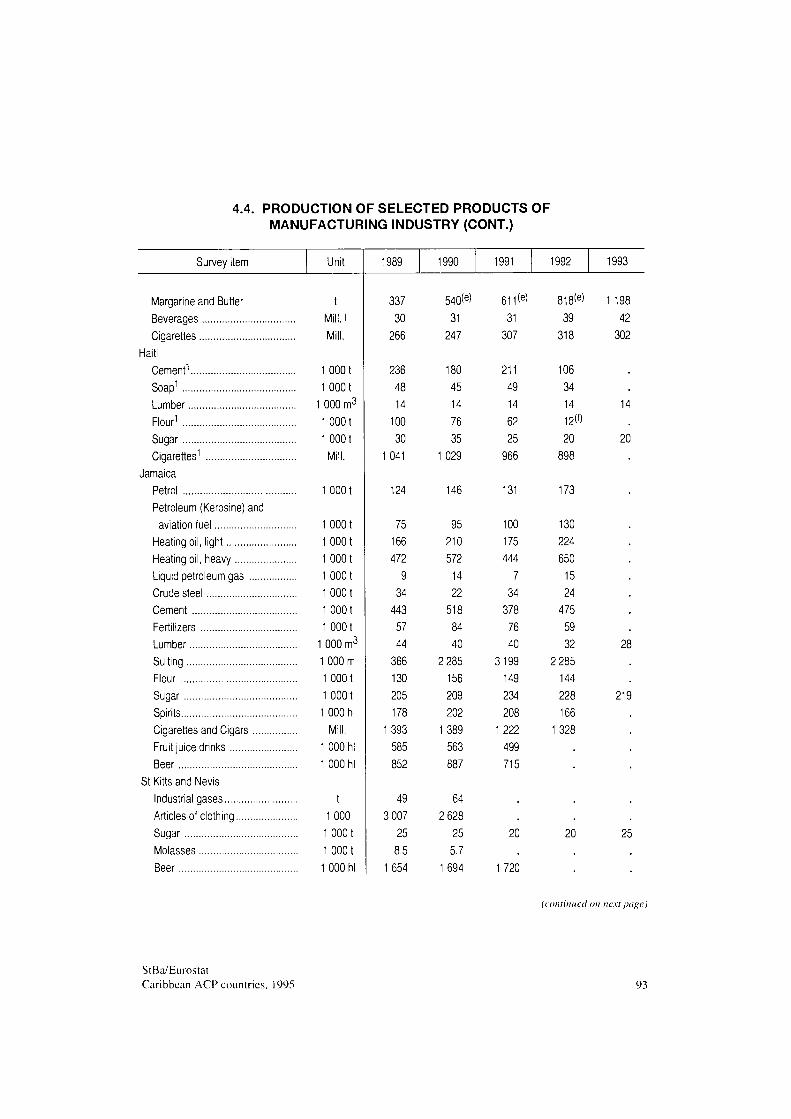
4.4. PRODUCTION OF SELECTED PRODUCTS OF MANUFACTURING INDUSTRY (CONT.)
Survey item Unit 15 1990 1991 1992 1993
Margarine and Butter t Beverages Mill. I Cigarettes Mill.
Haiti Cement1 1 0001 Soap1 10001 Lumber 1 000 m3
Flour1 1 0001 Sugar 1 0001 Cigarettes1 Mill.
Jamaica Petrol 1 0001 Petroleum (Kerosine) and aviation fuel 1 0001
Heating oll, light 1 0001 Heating oil, heavy 1 0001 Liquid petroleum gas 10001 Crude steel 1 0001 Cement 1 0001 Fertilizers 1 0001 Lumber 1 000 m3
Suiting 1 000 m Flour 1 0001 Sugar 1 000t Spirits 1 000 hi Cigarettes and Cigars Mill. Fruit juice drinks 1 000 hi Beer 1 000 hi
St Kitts and Nevis Industrial gases t Articles of clothing 1 000 Sugar 1 0001 Molasses 1 0001 Beer 1 000 hi
337 30
266
236 48 14 100 30
1 041
124
540<e> 31
247
180 45 14 76 35
1029
146
611<e> 31
307
211 49 14 62 25 966
131
818<e> 39
318
106 34 14 12(f) 20
173
75 166 472 9 34 443 57 44 366 130 205 178
1393 585 852
49 3 007 25 8.5
1654
95 210 572 14 22 518 84 40
2 285 156 209 202
1389 563 887
64 2 628 25 5.7
1694
100 175 444 7 34 378 76 40
3199 149 234 208
1222 499 715
20
1720
130 224 650 15 24 475 59 32
2 285 144 228 166
1328
20
1 198 42 302
14
20
28
219
25
(continued on next page)
StBa/Eurostat Caribbean ACP countries. 1995 93
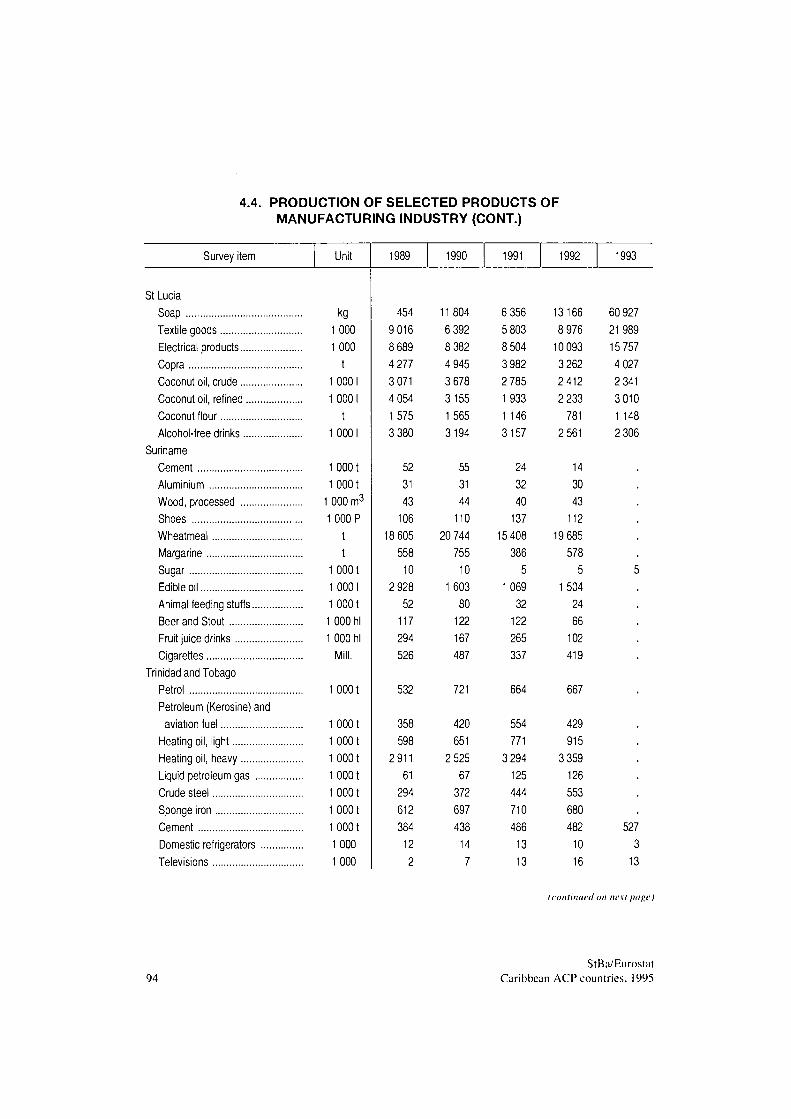
4.4. PRODUCTION OF SELECTED PRODUCTS OF MANUFACTURING INDUSTRY (CONT.)
Survey item Unit 1989 1990 1991 1992 1993
St Lucia Soap kg Textile goods 1 000 Electrical products 1 000 Copra t Coconut oil, crude 1 0001 Coconut oil, refined 1 0001 Coconut flour t Alcohol-free drinks 1 0001
Suriname Cement 1 0001 Aluminium 1 0001 Wood, processed 1000 m3
Shoes 1 000 Ρ Wheatmeal t Margarine t Sugar 1 0001 Edible oil 1 0001 Animal feeding stuffs 1 0001 Beer and Stout 1 000 hi Fruit juice drinks 1 000 hi Cigarettes Mill.
Trinidad and Tobago Petrol 1 0001 Petroleum (Kerosine) and aviation fuel 1 0001
Heating oil, light 1 0001 Heating oil, heavy 1 0001 Liquid petroleum gas 10001 Crude steel 1 0001 Sponge iron 1 0001 Cement 1 0001 Domestic refrigerators 1 000 Televisions 1 000
454 9016 8 689 4 277 3 071 4 054 1575 3 380
52 31 43 106
18 605 558 10
2 928 52 117 294 526
11804 6 392 8 382 4 945 3 678 3155 1565 3194
55 31 44 110
20 744 755 10
1603 80 122 167 487
6 356 5 803 8 504 3 982 2 785 1933 1 146 3157
24 32 40 137
15 408 386 5
1069 32 122 265 337
13166 8 976 10 093 3 262 2 412 2 233 781
2 561
14 30 43 112
19 685 578 5
1504 24 66 102 419
60 927 21989 15 757 4 027 2 341 3010 1 148 2 306
5
532 721 664 667
358 598
2911 61 294 612 384 12 2
420 651
2 525 67 372 697 438 14 7
554 771
3 294 125 444 710 486 13 13
429 915
3 359 126 553 680 482 10 16
527 3 13
(continued on next page)
94 StBa/Eurostat
Caribbean ACP countries, 1995
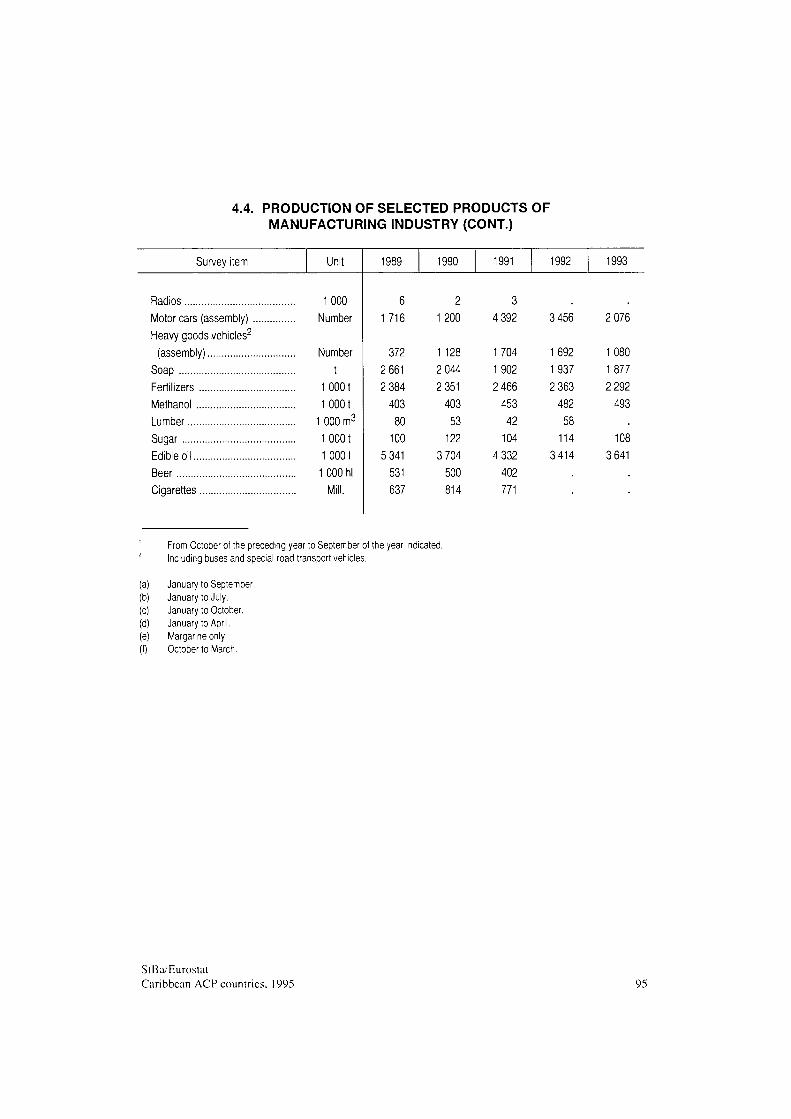
4.4. PRODUCTION OF SELECTED PRODUCTS OF MANUFACTURING INDUSTRY (CONT.)
Survey item
Radios Motorcars (assembly) Heavy goods vehicles2
(assembly) Soap Fertilizers Methanol Lumber Sugar Edible oil Beer Cigarettes
Unit
1000 Number
Number t
1000 t 1000 t
1 000 m3
1000 t 10001 1 000 hl
Mill.
1989
6 1716
372 2 661 2 384
403 80
100 5 341
531 637
1990
2 1200
1 128 2 044 2 351
403 53
122 3 704
500 814
1991
3 4 392
1704 1902 2 466
453 42
104 4 332
402 771
1992
3 456
1692 1937 2 363
482 58
114 3414
1993
2 076
1080 1877 2 292
493
108 3 641
From October of the preceding year to September of the year indicated. Including buses and special road transport vehicles.
(a) (b) (c) (d) (e) (f)
January to September January to July. January to October. January to April. Margarine only. October to March.
StBa/Eurostat Caribbean ACP countries. 1995 95
5. T O U R I S M
Tourism is the dominant economic sector in the Caribbean and has a strong influence on the general economic development of most countries in the region. The clearest indication of the significance of this sector is the fact that in many countries it is far and away the largest foreign currency earner. For example, foreign exchange receipts from tourism in the Bahamas, Barbados, the Dominican Republic and the OECS countries arc much higher than income from the export of goods and arc therefore the determining factor in the structure of the current account balance. Revenue from tourism is also very important to the economies of Belize and Jamaica, even if it is lower there than the earnings from goods exports (cf. Chapter 12, Table 12.2). It is only in Haiti, Suriname, Guyana and Trinidad and Tobago that tourism plays a fairly minor role, although these countries do also have considerable tourist potential and, if they were to exploit it, they could greatly increase its importance to the economy as a whole at some point in the future.
The role of tourism as a key foreign currency earner and an important factor in the economy can clearly be seen from the following figures. In 1993, for example, the Bahamas and the Dominican Republic both recorded net foreign exchange receipts from tourism totalling over USD 1 Bn (cf. Figure 5.2 and Tabic 5.7). In Jamaica, this figure was almost USD 900 million and in Barbados it was well over USD 500 million. The respective per capita income figures are even more impressive. In the case of the Bahamas, the largest tourist magnet in the Caribbean, where between 60 and 70% of GDP is accrued from tourist activities alone, the net foreign currency receipts from tourism in 1993 averaged USD 4 045 per head of population. The per capita income in Antigua and Barbuda was USD 3 971. and tourism was also the main source of income in Barbados (USD 2 108 per capita), St Kitts and Nevis (USD 1 548 per capita) and St Lucia (USD 1 288 per capita), explaining why per capita income in these countries is relatively high by international standards.
The extent to which tourism shapes economic life in the Caribbean also becomes clear from the number of visitors recorded (cf. Figure 5.1). The Bahamas now already provide accommodation for over 3.5 million visitors each year (incl. cruise passengers), which is approximately 13 times the resident population. The Dominican Republic and Jamaica each receive around 1.6 million visitors, and other popular holiday destinations include Barbados, Trinidad and Tobago and the OECS countries of Antigua and Barbuda. Grenada and Si Lucia, which all attract several hundred thousand holidaymakcrs each year.
StBa/Eurostat 96 Caribbean ACT countries. 1995
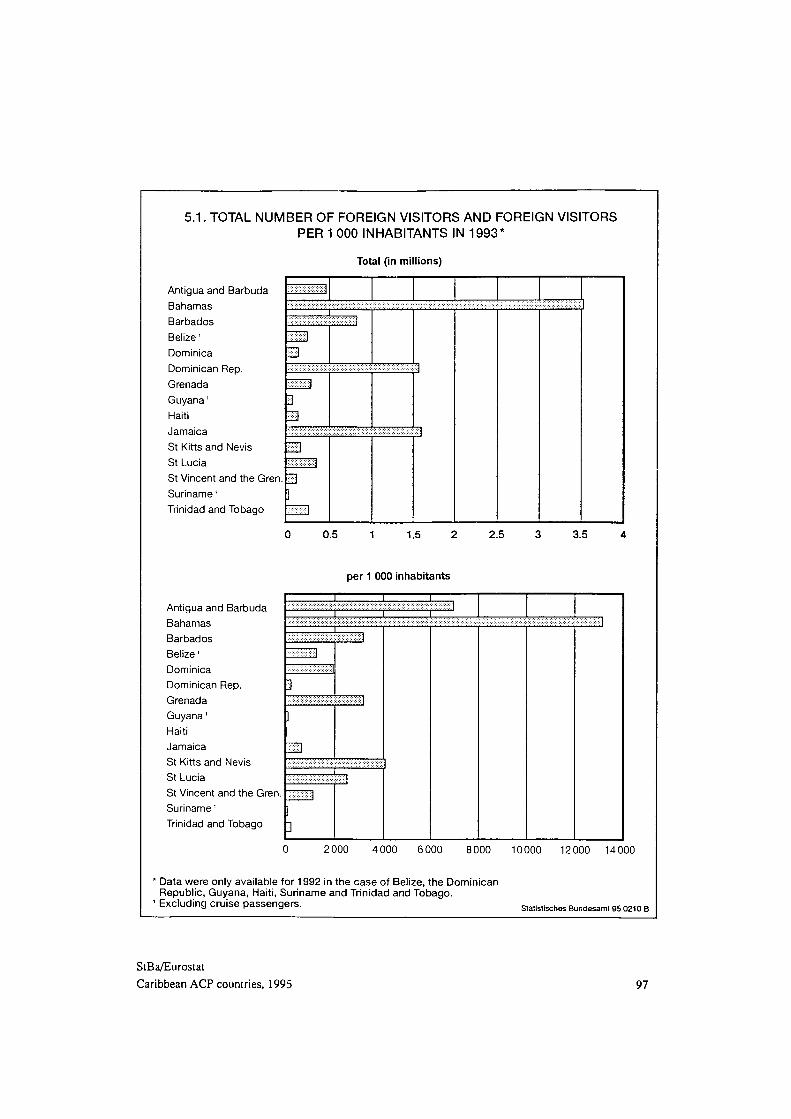
5.1. TOTAL NUMBER OF FOREIGN VISITORS AND FOREIGN VISITORS
PER 1 000 INHABITANTS IN 1993*
Antigua and Barbuda
Bahamas
Barbados
Belize '
Dominica
Dominican Rep.
Grenada
Guyana '
Haiti
Jamaica
St Kitts and Nevis
St Lucia
St Vincent and the Gren.
Suriname'
Trinidad and Tobago
Antigua and Barbuda
Bahamas
Barbados
Belize '
Dominica
Dominican Rep.
Grenada
Guyana '
Haiti
Jamaica
St Kitts and Nevis
St Lucia
St Vincent and the Gren.
Suriname'
Trinidad and Tobago
I
m
i
o
Total (in millions)
,-::,;% |
I I
• ::■:;.::: i : ,*·::: j
ll
m
m mmi 1 ]
mm
\
· : · ■ !
0.5 1 1.5
per 1 000 inhabitants
2.5 3.5
X
2000 4 000 6000 8000 10000 12000 14000
* Data were only available for 1992 in the case of Belize, the Dominican Republic, Guyana, Haiti, Suriname and Trinidad and Tobago.
' Excluding cruise passengers. Statistisches Bundesamt 95 0210 Β
StBa/Eurostat
Caribbean ACP countries, 1995 97
Tourism is the main driving force behind economic growth in many Caribbean countries not just on account of the high foreign exchange receipts but also because of its major contribution to value added, its positive effects on employment through the provision of tourist services and the stimulus that the expansion of tourism gives to other branches of the economy, such as construction, commerce and transport (cf. Chapter 2). The increase in international travel has triggered off an impressive expansion of tourism in the Caribbean since 1970. According to data held by the Caribbean Tourism Organization (CTO), the number of visitors to the 32 Caribbean countries (incl. the 15 Caribbean ACP States) virtually tripled between 1970 and 1992, rising from 4.2 million to 12.1 million. Most of these years saw a significant increase in the number of tourists, although the figures did occasionally sag due to recession in the western industrialized countries, particularly North America. This was the case, for example, in 1975 and in 1981 when the number of holidaymakcrs in the Caribbean fell briefly by 3% on each occasion. The period from 1982 to 1990 was marked by steady growth. The 0.4% fall in the number of tourists to the Caribbean region as a whole in 1991 and the rather modest increase in 1992 as a result of the sluggish state of the economy in the United States and Europe once again highlighted the extent to which tourism in the Caribbean is dependent upon economic developments in the main countries of origin. A number of Caribbean countries felt the effects of a sharp drop in the number of holidaymakcrs and the associated loss of revenue at the beginning of the 1990s, and this put a damper on their economic development (cf. Chapter 2).
The start of the economic recovery in the western industrialized countries in 1993 also marked a revival in tourism, and as the main countries of origin of these tourists further consolidated their economies in 1994, the upward trend in tourism in the Caribbean moved into a higher gear. There looks to be good short- and medium-term prospects for continued strong growth in tourism in the Caribbean countries. According to CTO estimates, there is more than likely to be a substantial worldwide increase in the number of tourists choosing cruise holidays during the second half of the 1990s, and the Caribbean should benefit particularly from this development. The Caribbean Development Bank (CDB) is also predicting that so long as effective measures are taken to promote and market tourism in the Caribbean, tourist activity in this region should increase despite evcr-stiffcr competition from other tourist countries seeking to profit from the upturn in the world economy. There is also a certain amount of undeveloped potential for new forms of tourism which might tempt larger numbers of holidaymakcrs to the region, such as eco-tourism (to the rainforests) and conference tourism. This further expansion in tourism and, specifically, the foreign currency it brings in are an absolutely essential precondition for almost all these countries to achieve their aim of generating the basic capital they need in order to broaden their economic basis.
With a view to developing tourism as the region's main source of foreign exchange earnings, the European Development Fund (EDF) provided a grant of over ECU 12.8 million in May 1995 for a three-year regional programme to promote tourism in the Caribbean ACP States (covering the training of skilled workers, advice on marketing and advertising tourism and protection of their cultural heritage).
StBa/Eurostat 98 Caribbean ACP countries, 1995
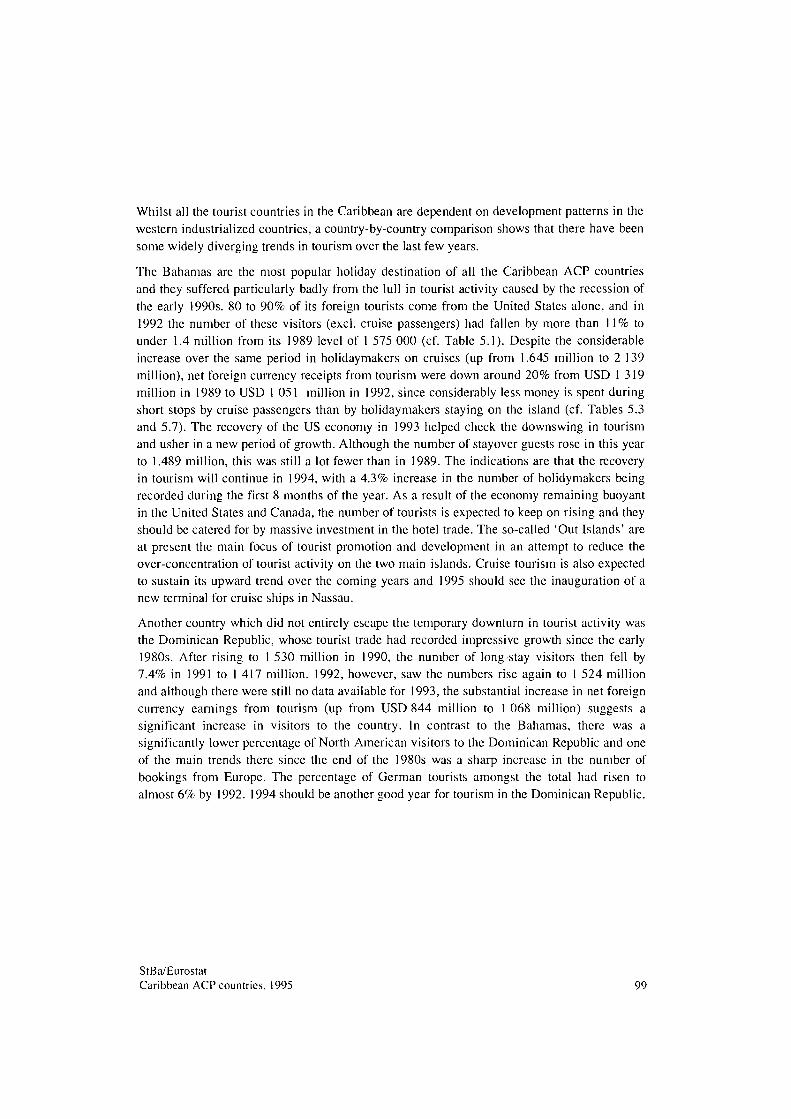
Whilst all the tourist countries in the Caribbean are dependent on development patterns in the western industrialized countries, a country-by-country comparison shows that there have been some widely diverging trends in tourism over the last few years.
The Bahamas are the most popular holiday destination of all the Caribbean ACP countries and they suffered particularly badly from the lull in tourist activity caused by the recession of the early 1990s. 80 to 90% of its foreign tourists come from the United States alone, and in 1992 the number of these visitors (excl. cruise passengers) had fallen by more than 11% to under 1.4 million from its 1989 level of 1 575 000 (cf. Table 5.1). Despite the considerable increase over the same period in holidaymakers on cruises (up from 1.645 million to 2 139 million), net foreign currency receipts from tourism were down around 20% from USD 1 319 million in 1989 to USD 1 051 million in 1992, since considerably less money is spent during short stops by cruise passengers than by holidaymakers staying on the island (cf. Tables 5.3 and 5.7). The recovery of the US economy in 1993 helped check the downswing in tourism and usher in a new period of growth. Although the number of stayover guests rose in this year to 1.489 million, this was still a lot fewer than in 1989. The indications are that the recovery in tourism will continue in 1994, with a 4.3% increase in the number of holidymakers being recorded during the first 8 months of the year. As a result of the economy remaining buoyant in the United States and Canada, the number of tourists is expected to keep on rising and they should be catered for by massive investment in the hotel trade. The so-called 'Out Islands' are at present the main focus of tourist promotion and development in an attempt to reduce the over-concentration of tourist activity on the two main islands. Cruise tourism is also expected to sustain its upward trend over the coming years and 1995 should see the inauguration of a new terminal for cruise ships in Nassau.
Another country which did not entirely escape the temporary downturn in tourist activity was the Dominican Republic, whose tourist trade had recorded impressive growth since the early 1980s. After rising to 1 530 million in 1990, the number of long-stay visitors then fell by 7.4% in 1991 to 1 417 million. 1992, however, saw the numbers rise again to 1 524 million and although there were still no data available for 1993, the substantial increase in net foreign currency earnings from tourism (up from USD 844 million to 1 068 million) suggests a significant increase in visitors to the country. In contrast to the Bahamas, there was a significantly lower percentage of North American visitors to the Dominican Republic and one of the main trends there since the end of the 1980s was a sharp increase in the number of bookings from Europe. The percentage of German tourists amongst the total had risen to almost 6% by 1992. 1994 should be another good year for tourism in the Dominican Republic.
StBa/Eurostat Caribbean ACP countries. 1995 99
5.2. NET FOREIGN CURRENCY RECEIPTS FROM TOURISM
(TOTAL AND PER CAPITA IN 1993)
Total (in USD million)
Antigua and Barbuda
Bahamas
Barbados
Belize
Dominica
Dominican Rep.
Grenada
Guyana2
Haiti '
Jamaica
St Kitts and Nevis
St Lucia
St Vincent and the Gren.
Suriname2
Trinidad and Tobago2
[
I I I
I t-
' l ' I ι ι I
3
I
' ;:-■■ m-i'-m'i
3 ι
100 0 100 200 300 400 500 600 700 800 900 1000 1100
Per capita (USD)
Antigua and Barbuda
Bahamas
Barbados
Belize
Dominica
Dominican Rep.
Grenada
Guyana2
Haiti '
Jamaica
St Kitts and Nevis
St Lucia
St Vincent and the Gren.
Suriname2
Trinidad and Tobago2
I
ι I"
„I I.
500 0 500 1000 1500 2 000 2 500 3000 3500 4 000 4 500
'Asat1991. 2
Asat1992. Statistisches Bundesamt 95 0211 Β
100
StBa/Eurostat
Caribbean ACP countries, 1995
Recent patterns of tourist development in Jamaica, the third-largest of the Caribbean holiday destinations, contrast starkly with those in the Dominican Republic and the Bahamas. Despite the recession in the US economy, tourism in Jamaica has been booming with the exception of 1991, when the growth rate dipped temporarily. The number of stayover guests rose by over 50% between 1988 and 1993, from 649 000 to 979 000, whilst the number of cruise passengers visiting Jamaica shot up from 368 000 to around 630 000. This boom produced an 89.5% increase in foreign currency receipts from tourism which rose from US$ 468 million to US$ 887 million. The main reason for this healthy expansion up until 1993 was the considerable increase in the number of European tourists despite the sharp drop in visitors from North America, who nevertheless remained the main contingent. The last few years have seen a substantial boost in the proportion of visitors from the United Kingdom, Germany and Italy in particular. In contrast to most other Caribbean countries where tourist activity expanded appreciably in 1994, there was a sharp fall in Jamaica due to a drastic reduction in the number of European tourists put off by the rising crime rate. Attempts are being made to halt this reversal as quickly as possible through an advertising campaign aimed at improving the country's image and by strengthening the forces of law and order. The involvement of certain politicians and the Church has also blocked discussions for the time being on whether to allow casinos, along the lines of those in the Bahamas and Puerto Rico, which would attract a new class of high-spending tourists. As a result, it is predicted that the tourist sector will consolidate its position in 1995 and tourist numbers will not start to rise again until 1996.
Barbados traditionally attracts large numbers of holidaymakers from Great Britain and Northern Ireland in addition to those from North America, and it suffered the same fate as the Bahamas between 1990 and 1992 when the number of visitors dwindled rapidly. The situation did improve in 1993, but without regaining the levels recorded in the late 1980s. The data available for the first nine months of 1994 confirm a clear revival in the tourist trade with the number of stayover visitors up by over 10% on the corresponding period in 1993. There were, however, opposing trends when it came to the breakdown of holidaymakers by country of origin. Whilst the reduction in the number of US charter flights led to fewer visitors from the United States, there was a 34% increase in visitors from Great Britain and Northern Ireland who now make up the single largest group of holidaymakers. The latest upturn in tourism has stimulated massive foreign private investment in the hotel trade, thus enhancing the prospects for permanent growth in the tourism sector.
Tourism is by far the most important factor in the economies of the OECS countries. Tougher competition from other tourist destinations in the Caribbean together with fluctuations in the value of European currencies against the US dollar, to which the EC$ is tied on a fixed exchange basis, have done some damage to the tourist sector and resulted in over-capacity in the hotel industry. 1990 was a boom year for tourism and all the OECS countries without exception recorded a rise in the number of tourists. 1991 was a year of mixed fortunes. Whilst the numbers were down slightly in Antigua and Barbuda and St Vincent and the Grenadines, there was a sharp increase in tourists choosing St Lucia and St Kitts and Nevis. This was also the year when Dominica made a notable entry into the market as a stopover for cruise ships.
StBa/Eurostat Caribbean ACP countries, 1995 101
The trend in 1992 was also patchy due to the slump in the cruise trade which affected several OECS Member States. 1993 marked a return to much more positive developments with the number of stayover visitors growing substantially everywhere except St Kitts and Nevis. This upward momentum looks likely to continue in 1994, as indicated by the high growth rates in the numbers visiting Antigua and Barbuda (+6.0%), Grenada (+15.9%) and St Kitts and Nevis (+6.3%). Because of the paramount importance of tourism to their general economic development, all the OECS countries are taking pains to extend their hotel infrastructures and adopt an aggressive promotional approach in marketing this sector.
There is also plenty of potential for tourism in those countries where it has hitherto played only a minor role, and in the medium term at least it could be developed into an important pillar of their economies. Belize started some years ago to develop its potential for specialized tourism (wildlife population, Mayan sites), but is presently still suffering from the lack of good-quality hotel capacity and an inadequate infrastructure. Guyana has built lodges at sites in the interior with tourist appeal and is now organizing tours of the rainforest. Tourism in Haiti virtually ground to a halt in 1991 due to the international embargo, but will once again be a port of call for cruise ships as of the beginning of 1995. Estimates for 1995 suggest that it will be visited by 250 000 cruise passengers and gross foreign currency earnings from tourism should total US$ 10 million. Extension of the limited accommodation space currently on offer is, however, a necessary precondition for any significant development of tourism to the country per se. Under a tourist development programme recommended by a Canadian expert, Trinidad and Tobago will build 7 150 more hotel rooms within the next ten years at a cost of US$ 700 million, financed mainly by foreign private capital. It is at present extending its harbour infrastructure to accommodate cruise liners and the decision has already been taken to upgrade the airport at Scarborough (Tobago) to international standards. With the help of these measures, Trinidad and Tobago hopes to attract a greater influx of foreign visitors in the medium term, thus enabling it record a clear surplus in its balance of foreign exchange from tourism, as opposed to the current deficit caused by the fact that its own wealthy citizens spend a lot of money on holiday trips abroad (cf. Table 5.7).
StBa/Eurostat 102 Caribbean ACP countries, 1995
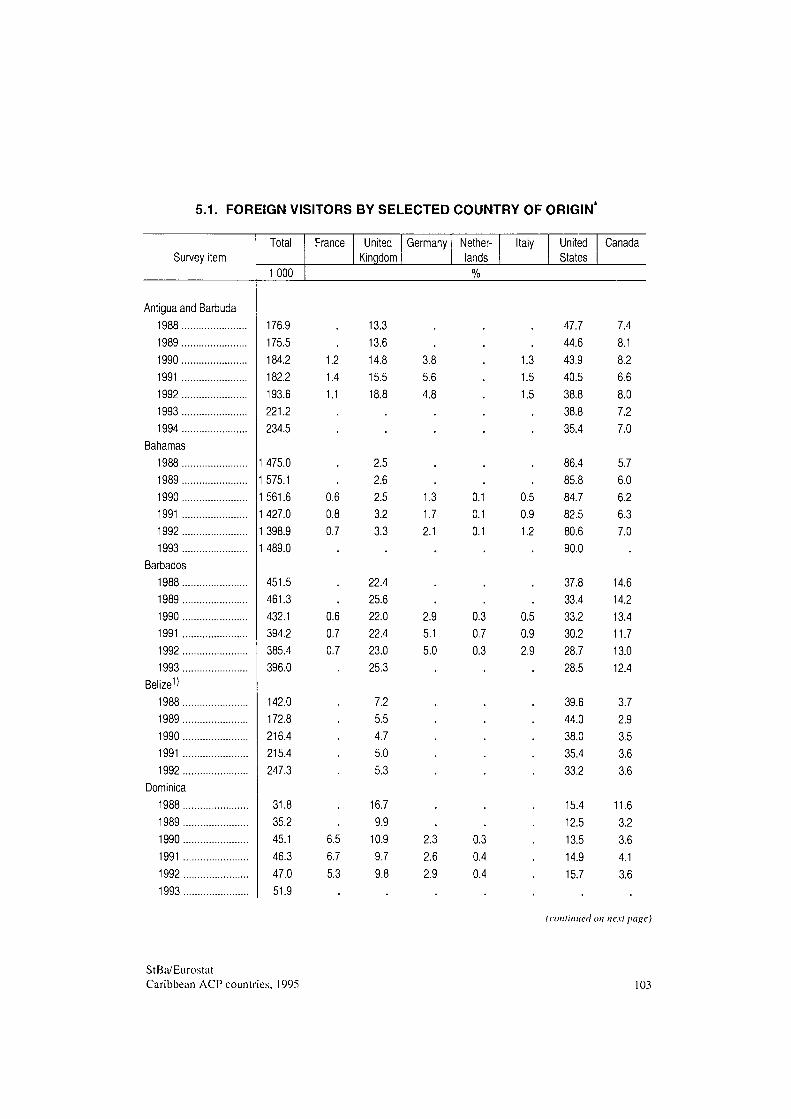
5.1. FOREIGN VISITORS BY SELECTED COUNTRY OF ORIGIN
Survey item Total
1000
France United Kingdom
Germany Netherlands
Italy
%
United States
Canada
Antigua and Barbuda 1988 1989 1990 1991 1992 1993 1994
Bahamas 1988 1989 1990 1991 1992 1993
Barbados 1988 1989 1990 1991 1992 1993
Belize1' 1988 1989 1990 1991 1992
Dominica 1988 1989 1990 1991 1992 1993
176.9 175.5 184.2 182.2 193.6 221.2 234.5
1 475.0 1 575.1 1561.6 1 427.0 1 398.9 1 489.0
451.5 461.3 432.1 394.2 385.4 396.0
142.0 172.8 216.4 215.4 247.3
31.8 35.2 45.1 46.3 47.0 51.9
1.2 1.4 1.1
0.6 0.8 0.7
0.6 0.7 0.7
6.5 6.7 5.3
13.3 13.6 14.8 15.5 18.8
2.5 2.6 2.5 3.2 3.3
22.4 25.6 22.0 22.4 23.0 25.3
7.2 5.5 4.7 5.0 5.3
16.7 9.9
10.9 9.7 9.8
3.8 5.6 4.8
1.3 1.7 2.1
2.9 5.1 5.0
2.3 2.6 2.9
0.1 0.1 0.1
0.3 0.7 0.3
0.3 0.4 0.4
1.3 1.5 1.5
0.5 0.9 1.2
0.5 0.9 2.9
47.7 44.6 43.9 40.5 38.8 38.8 35.4
86.4 85.8 84.7 82.5 80.6 90.0
37.8 33.4 33.2 30.2 28.7 28.5
39.6 44.0 38.0 35.4 33.2
15.4 12.5 13.5 14.9 15.7
7.4 8.1 8.2 6.6 8.0 7.2 7.0
5.7 6.0 6.2 6.3 7.0
14.6 14.2 13.4 11.7 13.0 12.4
3.7 2.9 3.5 3.6 3.6
11.6 3.2 3.6 4.1 3.6
(continued on next page)
StBa/Eurostat Caribbean ACP countries, 1995 103
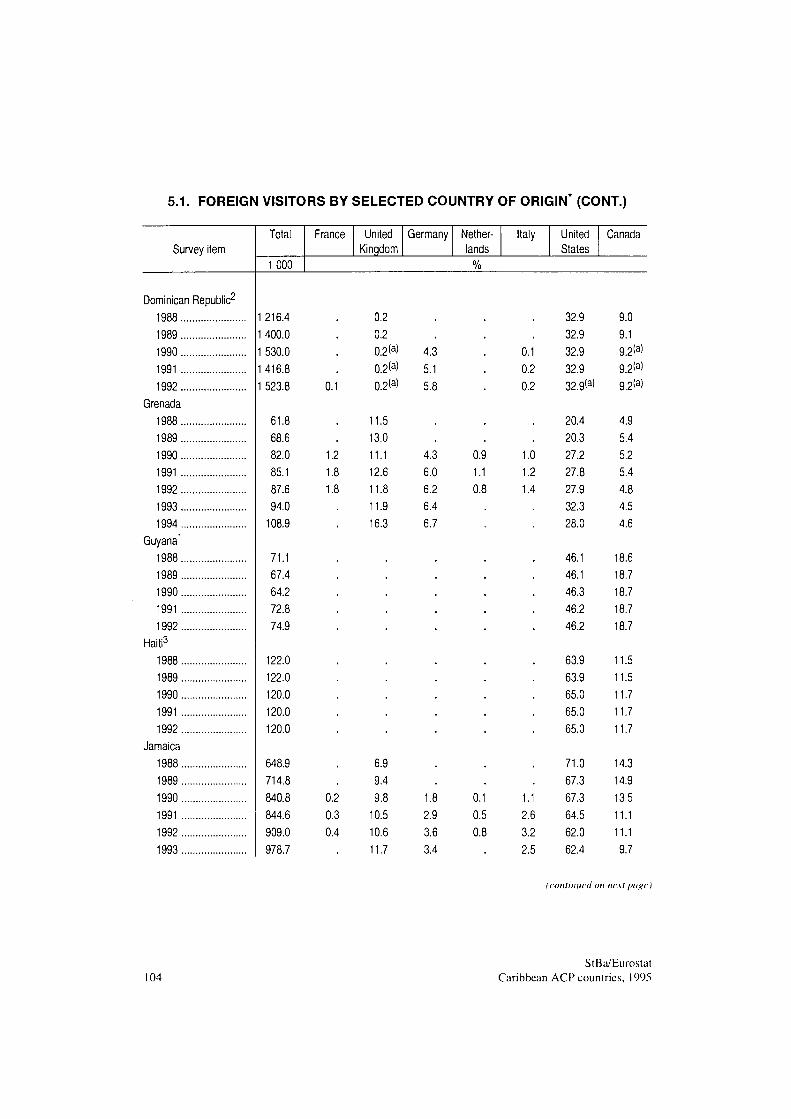
5.1. FOREIGN VISITORS BY SELECTED COUNTRY OF ORIGIN* (CONT.)
Survey item Total
1000
France United Kingdom
Germany Netherlands
Italy United States
Canada
%
Dominican Republic2
1988 1989 1990 1991 1992
Grenada 1988 1989 1990 1991 1992 1993 1994
Guyana1
1988 1989 1990 1991 1992
Haiti3
1988 1989 1990 1991 1992
Jamaica 1988 1989 1990 1991 1992 1993
1 216.4 1 400.0 1 530.0 1 416.8 1 523.8
61.8 68.6 82.0 85.1 87.6 94.0
108.9
71.1 67.4 64.2 72.8 74.9
122.0 122.0 120.0 120.0 120.0
648.9 714.8 840.8 844.6 909.0 978.7
0.1
1.2 1.8 1.8
0.2 0.3 0.4
0.2 0.2 0.2(a) 0.2(a) 0.2(a)
11.5 13.0 11.1 12.6 11.8 11.9 16.3
6.9 9.4 9.8
10.5 10.6 11.7
4.3 5.1 5.8
4.3 6.0 6.2 6.4 6.7
1.8 2.9 3.6 3.4
0.9 1.1 0.8
0.1 0.5 0.8
0.1 0.2 0.2
1.0 1.2 1.4
1.1 2.6 3.2 2.5
32.9 32.9 32.9 32.9 32g(a)
20.4 20.3 27.2 27.8 27.9 32.3 28.0
46.1 46.1 46.3 46.2 46.2
63.9 63.9 65.0 65.0 65.0
71.0 67.3 67.3 64.5 62.0 62.4
9.0 9.1 9.2<a) 9.2<a) 9.2<a)
4.9 5.4 5.2 5.4 4.8 4.5 4.6
18.6 18.7 18.7 18.7 18.7
11.5 11.5 11.7 11.7 11.7
14.3 14.9 13.5 11.1 11.1 9.7
(continued on next page)
104 StBa/Eurostat
Caribbean ACP countries, 1995
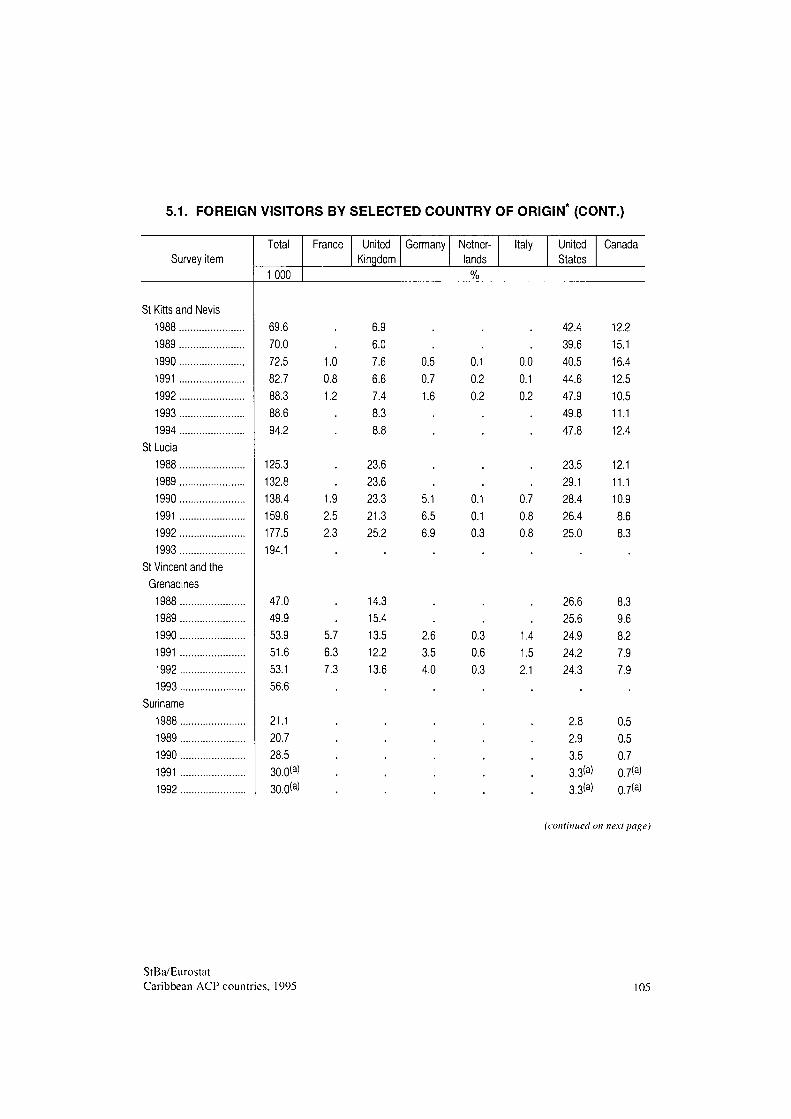
5.1. FOREIGN VISITORS BY SELECTED COUNTRY OF ORIGIN* (CONT.)
Survey item Total
1 000
France United Kingdom
Germany Netherlands
Italy
%
United States
Canada
St Kltts and Nevis 1988 1989 1990 1991 1992 1993 1994
St Lucia 1988 1989 1990 1991 1992 1993
St Vincent and the Grenadines
1988 1989 1990 1991 1992 1993
Suriname 1988 1989 1990 1991 1992
69.6 70.0 72.5 82.7 88.3 88.6 94.2
125.3 132.8 138.4 159.6 177.5 194.1
47.0 49.9 53.9 51.6 53.1 56.6
21.1 20.7 28.5 30.0(a) 30.0<a)
1.0 0.8 1.2
1.9 2.5 2.3
5.7 6.3 7.3
6.9 6.0 7.6 6.6 7.4 8.3
23.6 23.6 23.3 21.3 25.2
14.3 15.4 13.5 12.2 13.6
0.5 0.7 1.6
5.1 6.5 6.9
2.6 3.5 4.0
0.1 0.2 0.2
0.1 0.1 0.3
0.3 0.6 0.3
0.0 0.1 0.2
0.7 0.8 0.8
1.4 1.5 2.1
42.4 39.6 40.5 44.6 47.9 49.8 47.8
23.5 29.1 28.4 26.4 25.0
26.6 25.6 24.9 24.2 24.3
2.8 2.9 3.5 3.3<a) 3.3(a)
12.2 15.1 16.4 12.5 10.5 11.1 12.4
12.1 11.1 10.9 8.6 8.3
8.3 9.6 8.2 7.9 7.9
0.5 0.5 0.7 0.7(a) 0.7(a)
(continued on next page)
StBa/Eurostat Caribbean ACP countries, 1995 105
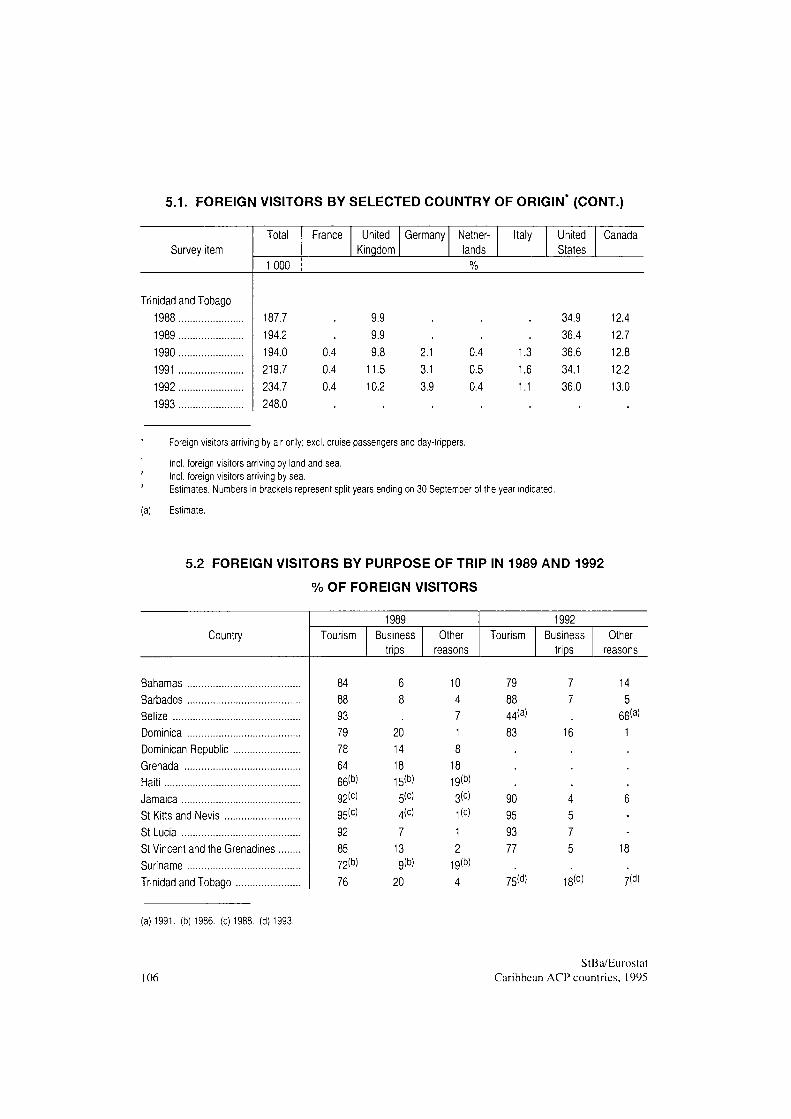
5.1. FOREIGN VISITORS BY SELECTED COUNTRY OF ORIGIN (CONT.)
Survey item
Trinidad and Tobago
1988
1989
1990
1991
1992
1993
Total
1000
187.7
194.2
194.0
219.7
234.7
248.0
France United Kingdom
Germany Netherlands
Italy United States
Canada
%
0.4
0.4
0.4
9.9
9.9
9.8
11.5
10.2
2.1
3.1
3.9
0.4
0.5
0.4
1.3
1.6
1.1
34.9
36.4
36.6
34.1
36.0
12.4
12.7
12.8
12.2
13.0
Foreign visitors arriving by air orly; excl. cruise passengers and day-trippers.
Incl. foreign visitors arriving by land and sea. Incl. foreign visitors arriving by sea. Estimates. Numbers in brackets represent split years ending on 30 September of the year indicated.
Estimate.
5.2 FOREIGN VISITORS BY PURPOSE OF TRIP IN 1989 AND 1992
% OF FOREIGN VISITORS
Country
Bahamas
Barbados
Belize
Dominica
Dominican Republic
Grenada
Haiti
Jamaica
St Kitts and Nevis
St Lucia
St Vincent and the Grenadines
Suriname
Trinidad and Tobago
1989 Tourism
84 88 93 79 78 64 66(b' 92(0
95(c)
92
85 72(b)
76
Business trips
6 8
20 14 18 15»)
5(c> 4(c)
7
13 g(b)
20
Other reasons
10 4 7 1 8
18 19(b)
3(0 i(c)
1
2
19<b>
4
1992
Tourism
79 88 44(a)
83
90 95
93
77
75<d>
Business trips
7 7
16
4 5
7
5
18(d)
Other reasons
14 5
66(a)
1
6 .
18
7(d)
(a) 1991. (b) 1986. (c) 1988. (d) 1993.
106 StBa/Eurostat
Caribbean ACP countries, 1995
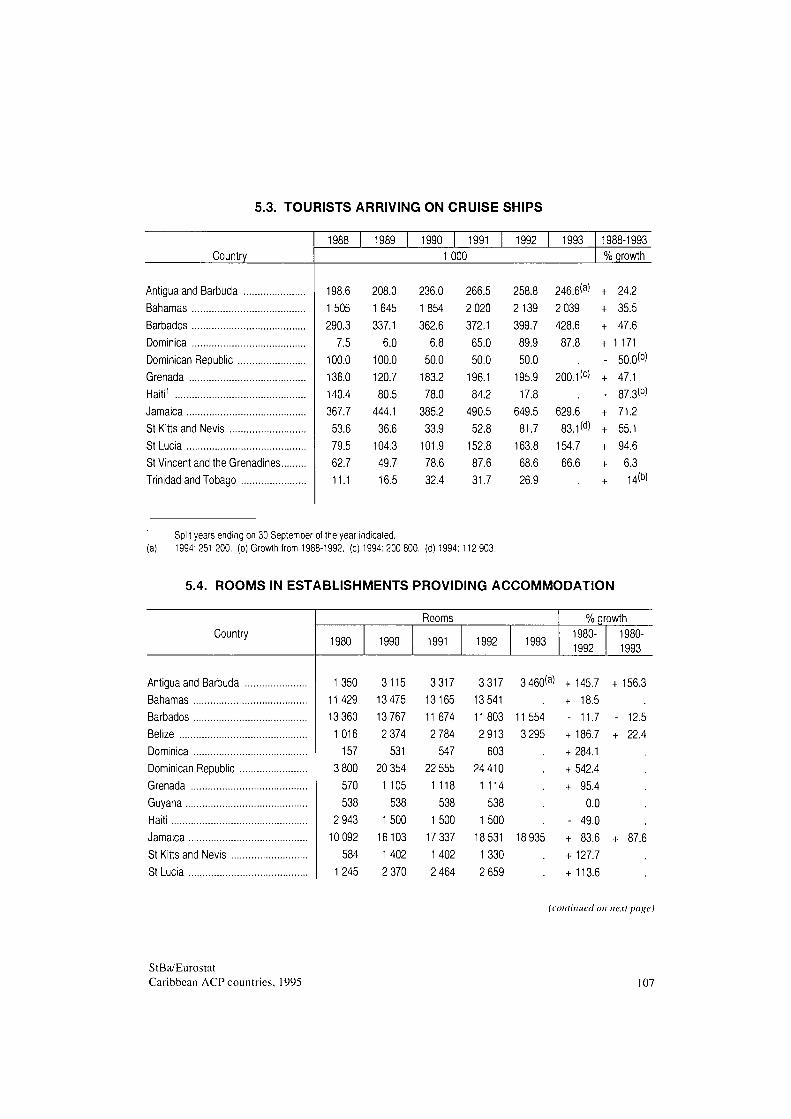
5.3. TOURISTS ARRIVING ON CRUISE SHIPS
Country 1988 1989 1990 1991 1992 1993
1000 1988-1993 % growth
Antigua and Barbuda Bahamas Barbados Dominica Dominican Republic Grenada Haiti1
Jamaica St Kitts and Nevis St Lucia St Vincent and the Grenadines. Trinidad and Tobago
198.6 1505 290.3
7.5 100.0 136.0 140.4 367.7
53.6 79.5 62.7 11.1
208.0 1645 337.1
6.0 100.0 120.7
80.5 444.1
36.6 104.3 49.7 16.5
236.0 1854 362.6
6.8 50.0
183.2 78.0
385.2 33.9
101.9 78.6 32.4
266.5 2 020 372.1 65.0 50.0
196.1 84.2
490.5 52.8
152.8 87.6 31.7
258.8 2139 399.7
89.9 50.0
195.9 17.8
649.5 81.7
163.8 68.6 26.9
246.6<a> 2 039 428.6
87.8
200.1<c)
629.6 83.1<d)
154.7 66.6
+ 24.2 + 35.5 + 47.6 + 1 171
- 50.0<b) + 47.1
- 87.3<b> 71.2 55.1 94.6 6.3 14(b)
Split years ending on 30 September of the year indicated. 1994:251200. (b) Growth from 1988-1992. (c) 1994:200 800. (d) 1994:112 903.
5.4. ROOMS IN ESTABLISHMENTS PROVIDING ACCOMMODATION
Country Rooms
1980 1990 1991 1992 1993
% growth 1980-1992
1980-1993
Antigua and Barbuda Bahamas Barbados Belize Dominica Dominican Republic . Grenada Guyana Haiti Jamaica St Kitts and Nevis .... St Lucia
1350 11429 13 360 1016
157 3 800
570 538
2 943 10 092
584
1245
3115 3 317 3 317 3 460<a) +145.7 +156.3 13 475 13 767 2 374
531 20 354
1 105 538
1500 16103 1402 2 370
13165 11674 2 784
547 22 555
1 118 538
1500 17 337
1 402 2 464
13 541 11803 2913
603 24410
1 114 538
1500 18 531
1330 2 659
11554 3295
18 935
+ 18.5 - 11.7 + 186.7 + 284.1 + 542.4 + 95.4
0.0 - 49.0 + 83.6 + 127.7 + 113.6
12.5 22.4
87.6
(continued on next page)
StBa/Eurostat Caribbean ACP countries, 1995 107
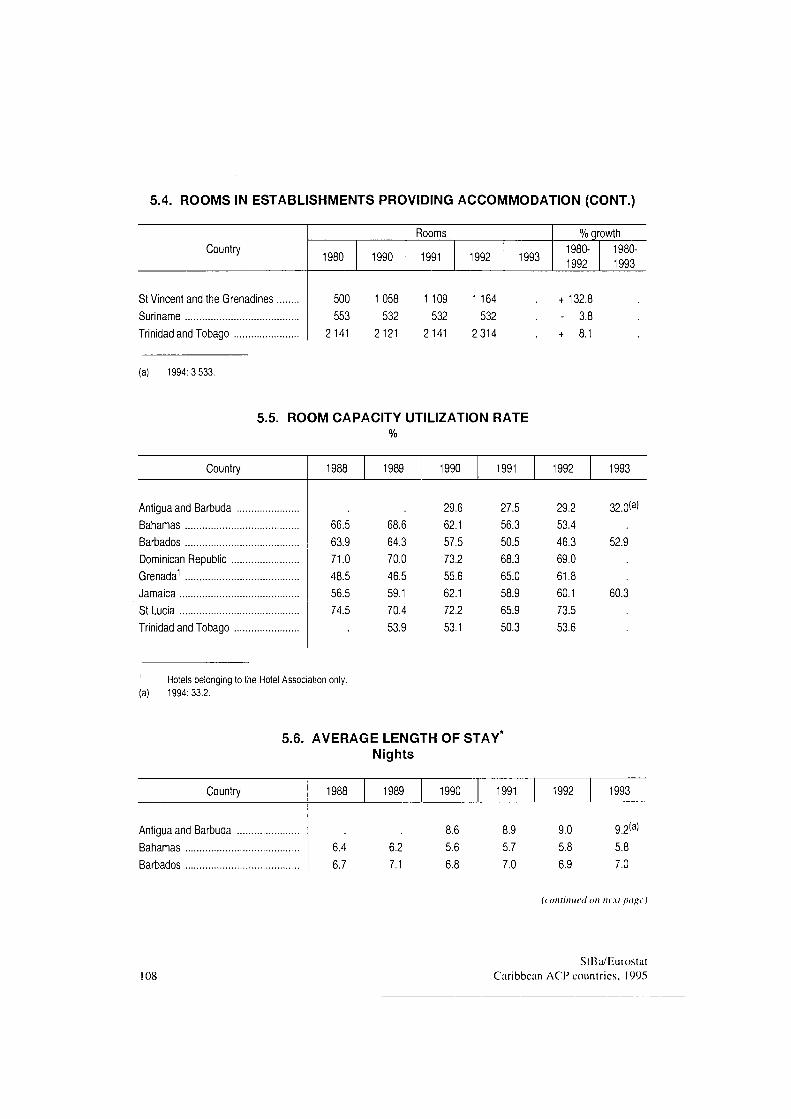
5.4. ROOMS IN ESTABLISHMENTS PROVIDING ACCOMMODATION (CONT.)
Country
St Vincent and the Grenadines Suriname Trinidad and Tobago
Rooms
1980
500 553
2141
1990
1058 532
2121
1991
1 109 532
2141
1992
1 164 532
2314
1993
% growth 1980-1992
+ 132.8 - 3.8 + 8.1
1980-1993
(a) 1994:3 533.
5.5. ROOM CAPACITY UTILIZATION RATE %
Country
Antigua and Barbuda Bahamas Barbados Dominican Republic Grenada1
Jamaica St Lucia Trinidad and Tobago
1988
66.5 63.9 71.0 48.5 56.5 74.5
1989
68.6 64.3 70.0 46.5 59.1 70.4 53.9
1990
29.6 62.1 57.5 73.2 55.6 62.1 72.2 53.1
1991
27.5 56.3 50.5 68.3 65.0 58.9 65.9 50.3
1992
29.2 53.4 46.3 69.0 61.8 60.1 73.5 53.6
1993
32.0(a)
52.9
60.3
Hotels belonging to the Hotel Association only, (a) 1994:33.2.
5.6. AVERAGE LENGTH OF STAY Nights
Country
Antigua and Barbuda Bahamas Barbados
1988
6.4 6.7
1989
6.2 7.1
1990
8.6 5.6 6.8
1991
8.9 5.7 7.0
1992
9.0 5.8 6.9
1993
9.2(a)
5.8 7.0
(continued on next page)
108 StBa/Eurostat
Caribbean ACP countries, 1995
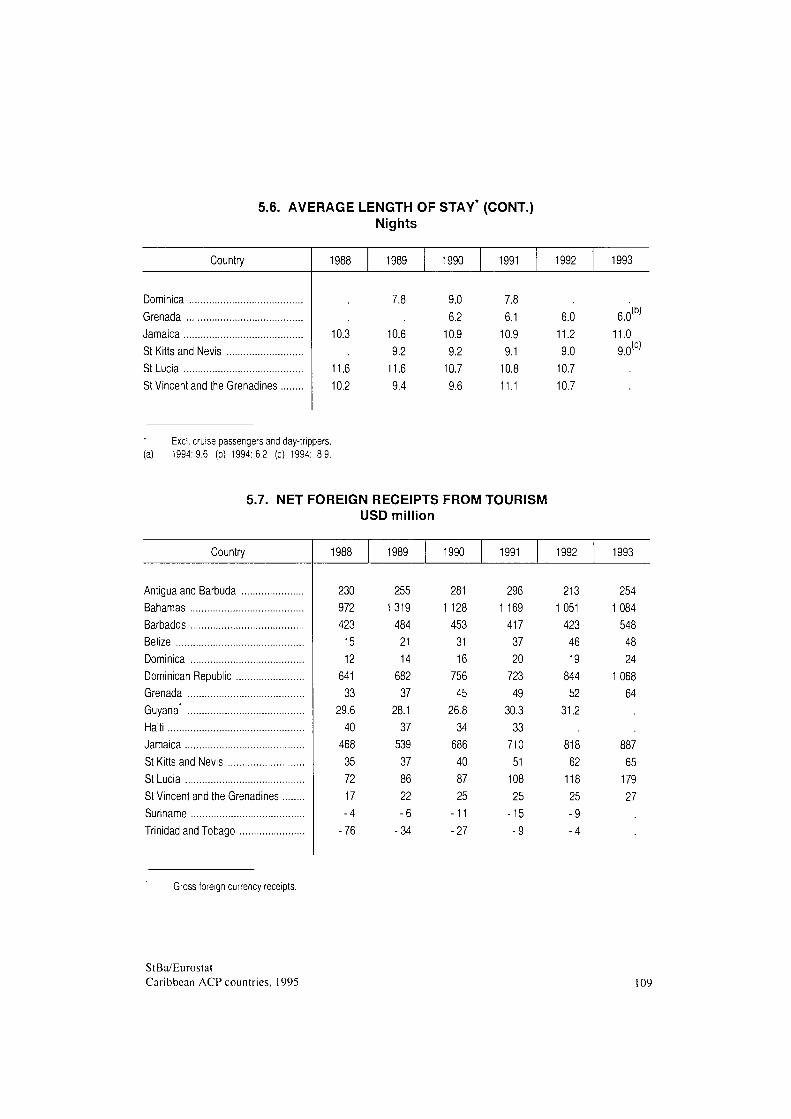
5.6. AVERAGE LENGTH OF STAY* (CONT.) Nights
Country
Dominica Grenada Jamaica St Kitts and Nevis St Lucia St Vincent and the Grenadines
1988
10.3
11.6 10.2
1989
7.8
10.6 9.2
11.6 9.4
1990
9.0 6.2
10.9 9.2
10.7 9.6
1991
7.8 6.1
10.9 9.1
10.8 11.1
1992
6.0 11.2 9.0
10.7 10.7
1993
6.0(b)
11.0 9.0(C)
Excl. cruise passengers and day-trippers, (a) 1994:9.6 (b) 1994:6.2 (c) 1994: 8.9.
5.7. NET FOREIGN RECEIPTS FROM TOURISM USD million
Country 1989 1990 1991 1992 1993
Antigua and Barbuda Bahamas Barbados Belize Dominica Dominican Republic Grenada Guyana1
Haiti Jamaica St Kitts and Nevis St Lucia St Vincent and the Grenadines Suriname Trinidad and Tobago
230 972 423 15 12
641 33
29.6 40 468 35 72 17 -4 -76
255 1319 484 21 14
682 37
28.1 37 539 37 86 22 -6 -34
281 1 128 453 31 16
756 45
26.8 34 686 40 87 25
-11 -27
296 1 169 417 37 20 723 49
30.3 33 710 51 108 25
-15 -9
213 1051 423 46 19
844 52
31.2
818 62 118 25 -9 -4
254 1084 548 48 24
1068 64
887 65 179 27
Gross foreign currency receipts.
StBa/Eurostat Caribbean ACP countries, 1995 109
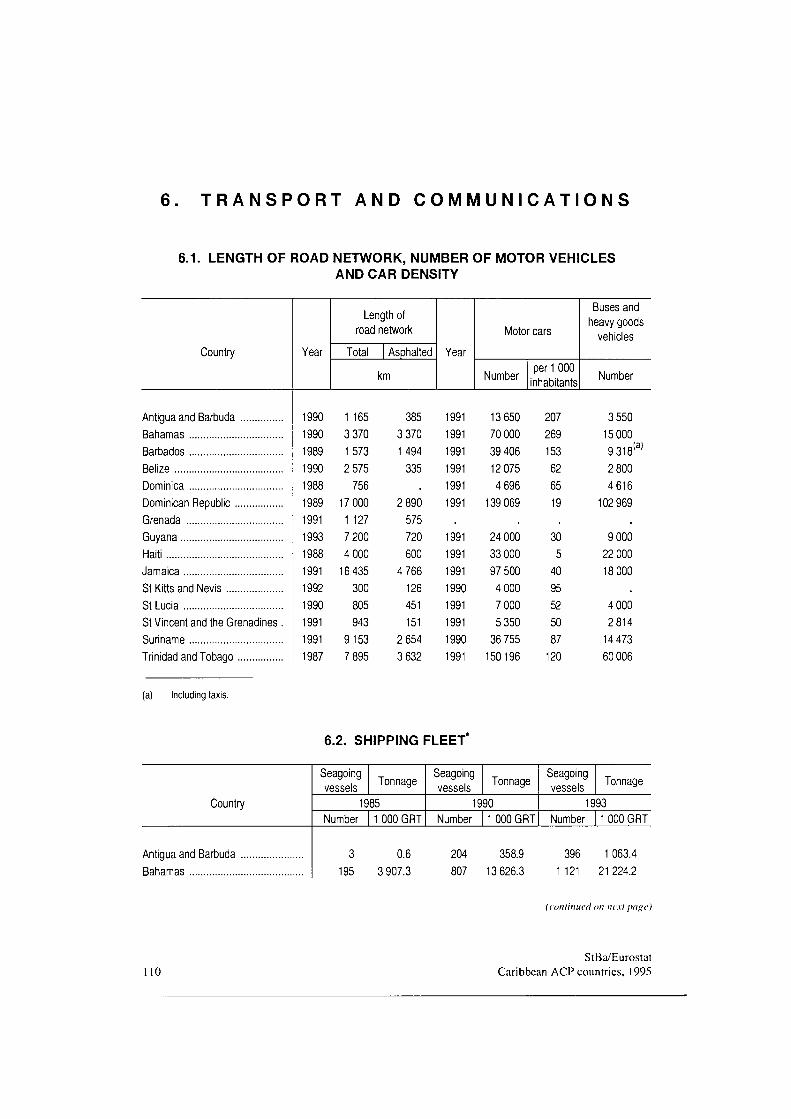
T R A N S P O R T A N D C O M M U N I C A T I O N S
6.1. LENGTH OF ROAD NETWORK, NUMBER OF MOTOR VEHICLES AND CAR DENSITY
Country Year
Length of road network
Total I Asphalted
km
Year
Motor cars
Number per 1 000
inhabitants
Buses and heavy goods
vehicles
Number
Antigua and Barbuda Bahamas Barbados Belize Dominica Dominican Republic Grenada Guyana Haiti Jamaica St Kitts and Nevis St Lucia St Vincent and the Grenadines Suriname Trinidad and Tobago
(a) Including taxis.
1990 1990 1989 1990 1988 1989 1991 1993 1988 1991 1992 1990 1991 1991 1987
1 165 3 370 1573 2 575 756
17 000 1 127 7 200 4 000 16435
300 805 943
9153 7 895
385 3 370 1 494 335
2 890 575 720 600
4 766 126 451 151
2 654 3 632
1991 1991 1991 1991 1991 1991
1991 1991 1991 1990 1991 1991 1990 1991
13 650 70 000 39 406 12 075 4 696
139 069
24 000 33 000 97 500 4 000 7 000 5 350 36 755 150196
207 269 153 62 65 19
30 5 40 95 52 50 87 120
3 550 15 000 9 318' 2 800 4616
102 969
9 000 22 000 18 000
4 000 2814 14 473 60 006
(a)
6.2. SHIPPING FLEET
Country
Antigua and Barbuda Bahamas
Seagoing vessels Tonnage
1985 Number 1 000 GRT
Seagoing vessels Tonnage
1990 Number 1 000 GRT
Seagoing vessels Tonnage
1993 Number 1 000 GRT
3 0.6 204 358.9 396 1 063.4 195 3 907.3 807 13 626.3 1121 21224.2
(continued on next page)
StBa/Eurostat Caribbean ACP countries, 1995
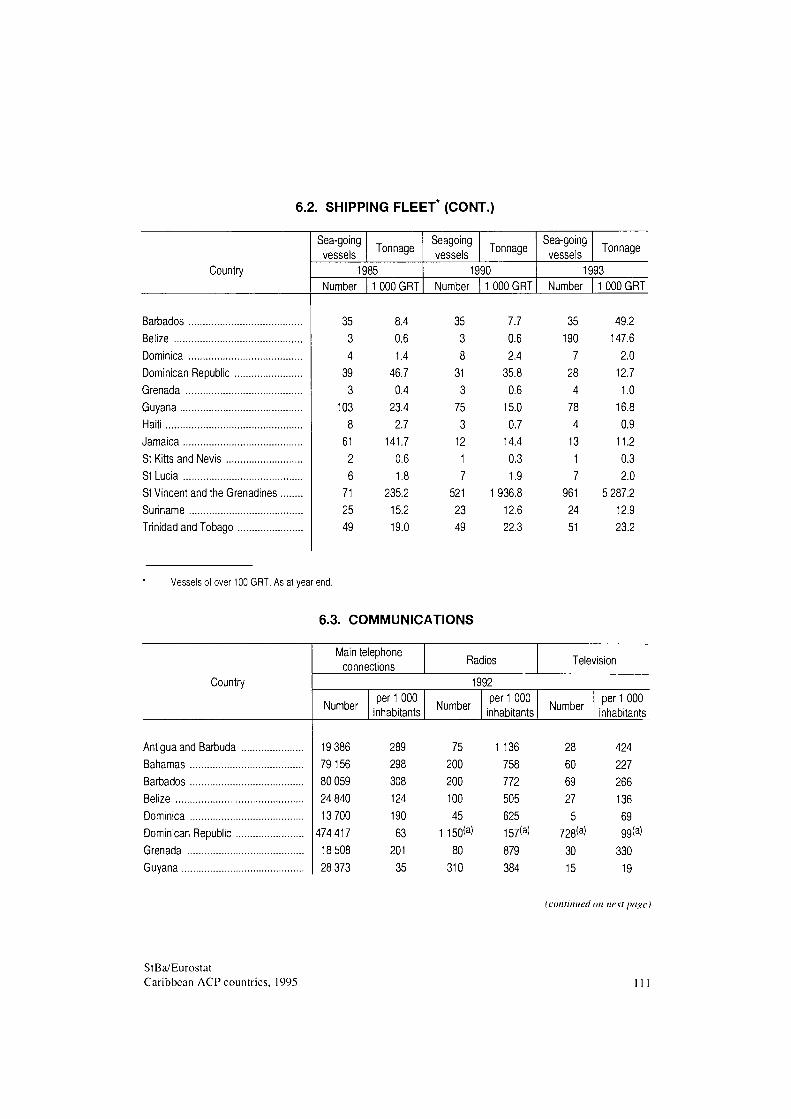
6.2. SHIPPING FLEET (CONT.)
Country
Sea-going vessels Tonnage
1985 Number 1 000 GRT
Seagoing vessels Tonnage
1990 Number 1 000 GRT
Sea-going vessels Tonnage
1993 Number 1 000 GRT
Barbados Belize Dominica Dominican Republic Grenada Guyana Haiti Jamaica St Kitts and Nevis St Lucia St Vincent and the Grenadines Suriname Trinidad and Tobago
35 3 4
39 3
103 8
61 2 6
71 25 49
8.4 0.6 1.4
46.7 0.4
23.4 2.7
141.7 0.6 1.8
235.2 15.2 19.0
35 3 8
31 3
75 3
12 1 7
521 23 49
7.7 0.6 2.4
35.8 0.6
15.0 0.7
14.4 0.3 1.9
1 936.8 12.6 22.3
35 190
7 28 4
78 4
13 1 7
961 24 51
49.2 147.6
2.0 12.7 1.0
16.8 0.9
11.2 0.3 2.0
5 287.2 12.9 23.2
Vessels of over 100 GRT. As at year end.
6.3. COMMUNICATIONS
Country
Antigua and Barbuda Bahamas Barbados Belize Dominica Dominican Republic Grenada Guyana
Main telephone connections Radios Television
1992
Number per 1 000
inhabitants Number per 1 000 inhabitants Number
per 1 000 inhabitants
19 386 289 75 1136 28 424 79156 298 200 758 60 227 80 059 308 200 772 69 266 24 840 124 100 505 27 136 13 700 190 45 625 5 69
474 417 63 1 150<a' 157<a) 728<a> 99<a> 18 508 201 80 879 30 330 28 373 35 310 384 15 19
(continued on next page)
StBa/Eurostat Caribbean ACP countries, 1995
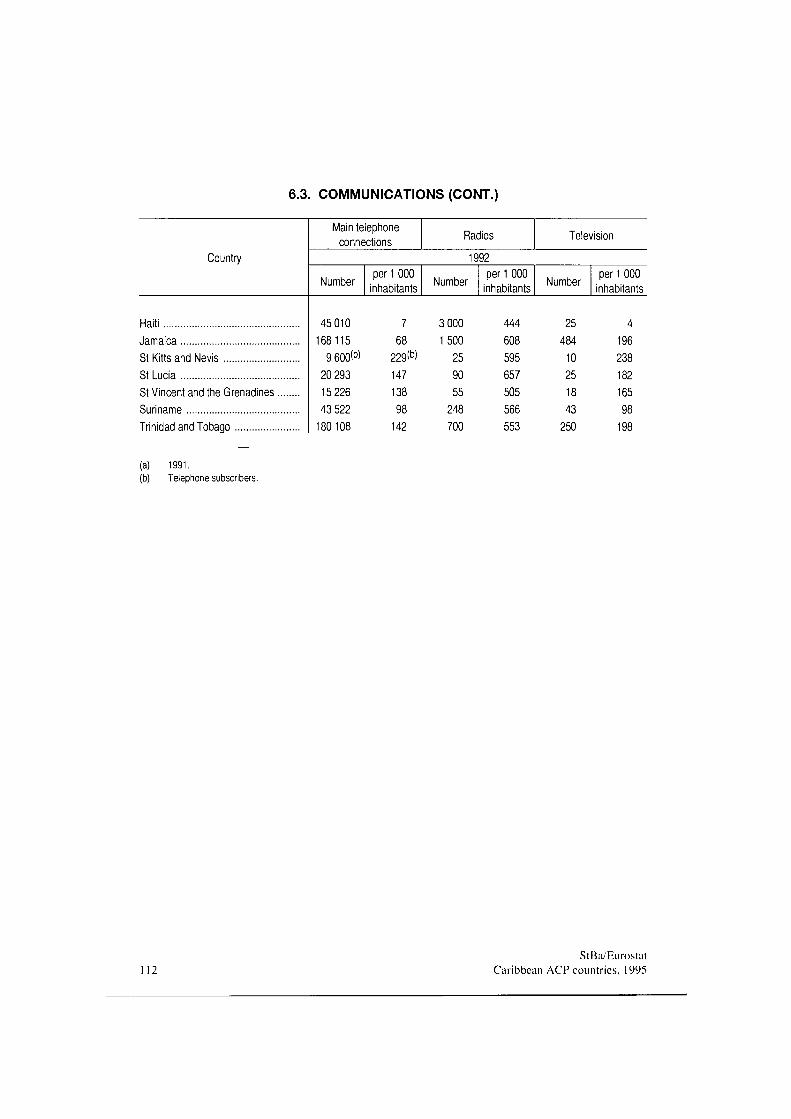
6.3. COMMUNICATIONS (CONT.)
Country
Haiti Jamaica St Kitts and Nevis St Lucia St Vincent and the Grenadines Suriname Trinidad and Tobago
Main telephone connections Radios Television
1992
Number per 1 000 Inhabitants Number
per 1 000 Inhabitants Number
per 1 000 inhabitants
45 010 7 3 000 444 25 4 168115 68 1500 608 484 196
9 600<b' 229<b> 25 595 10 238 20 293 147 90 657 25 182 15 226 138 55 505 18 165 43 522 98 248 566 43 98
180108 142 700 553 250 198
(a) 1991. (b) Telephone subscribers.
StBa/Eurostat Caribbean ACP countries, 1995
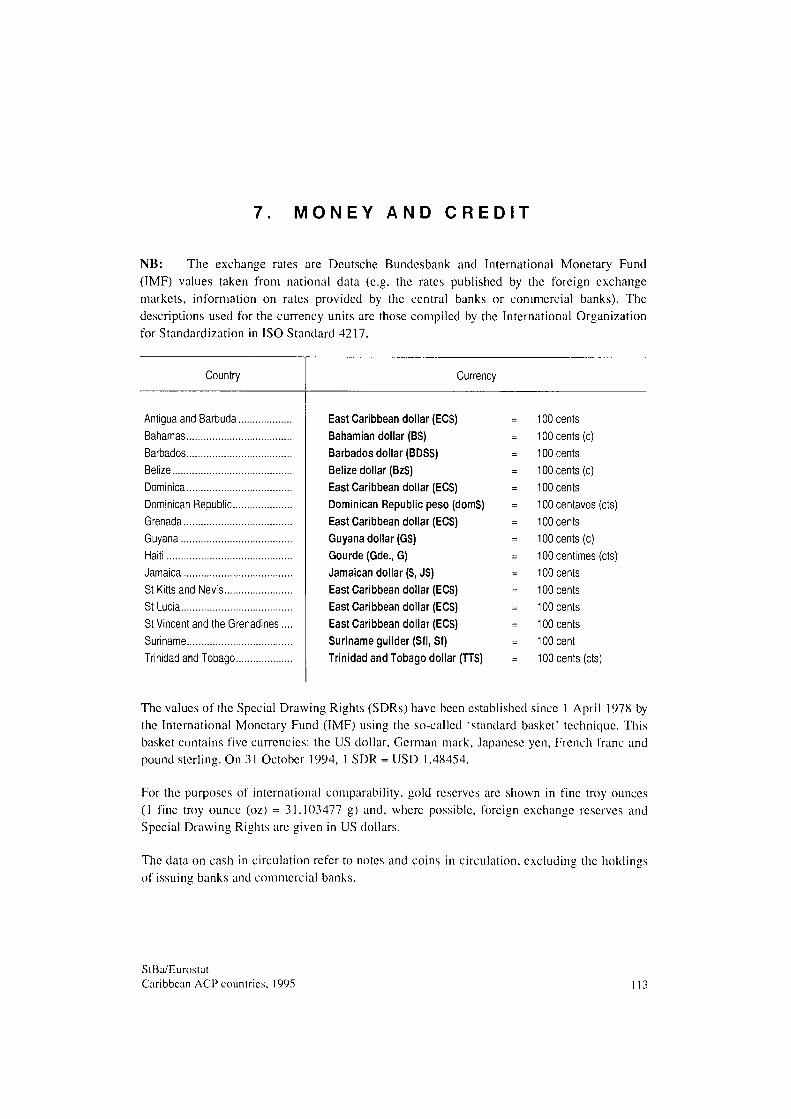
M O N E Y A N D C R E D I T
NB: The exchange rates are Deutsche Bundesbank and International Monetary Fund (IMF) values taken from national data (e.g. the rates published by the foreign exchange markets, information on rates provided by the central banks or commercial banks). The descriptions used for the currency units are those compiled by the International Organization for Standardization in ISO Standard 4217.
Country Currency
Antigua and Barbuda Bahamas Barbados Belize Dominica Dominican Republic Grenada Guyana Haiti Jamaica St Kitts and Nevis St Lucia St Vincent and the Grenadines. Suriname Trinidad and Tobago
East Caribbean dollar (ECS) Bahamian dollar (BS) Barbados dollar (BDSS) Belize dollar (BzS) East Caribbean dollar (ECS) Dominican Republic peso (domS) East Caribbean dollar (ECS) Guyana dollar (GS) Gourde (Gde., G) Jamaican dollar (S, JS) East Caribbean dollar (ECS) East Caribbean dollar (ECS) East Caribbean dollar (ECS) Suriname guilder (Sfl, Sf) Trinidad and Tobago dollar (TTS)
100 cents 100 cents (c) 100 cents 100 cents (c) 100 cents 100 centavos (cts) 100 cents 100 cents (c) 100 centimes (cts) 100 cents 100 cents 100 cents 100 cents 100 cent 100 cents (cts)
The values of the Special Drawing Rights (SDRs) have been established since 1 April 1978 by the International Monetary Fund (IMF) using the so-called 'standard basket' technique. This basket contains five currencies: the US dollar, German mark, Japanese yen, French franc and pound sterling. On 31 October 1994, 1 SDR = USD 1.48454.
For the purposes of international comparability, gold reserves are shown in fine troy ounces (1 fine troy ounce (oz) = 31.103477 g) and, where possible, foreign exchange reserves and Special Drawing Rights are given in US dollars.
The data on cash in circulation refer to notes and coins in circulation, excluding the holdings of issuing banks and commercial banks.
StBa/Eurostat Caribbean ACP countries. 1995 113
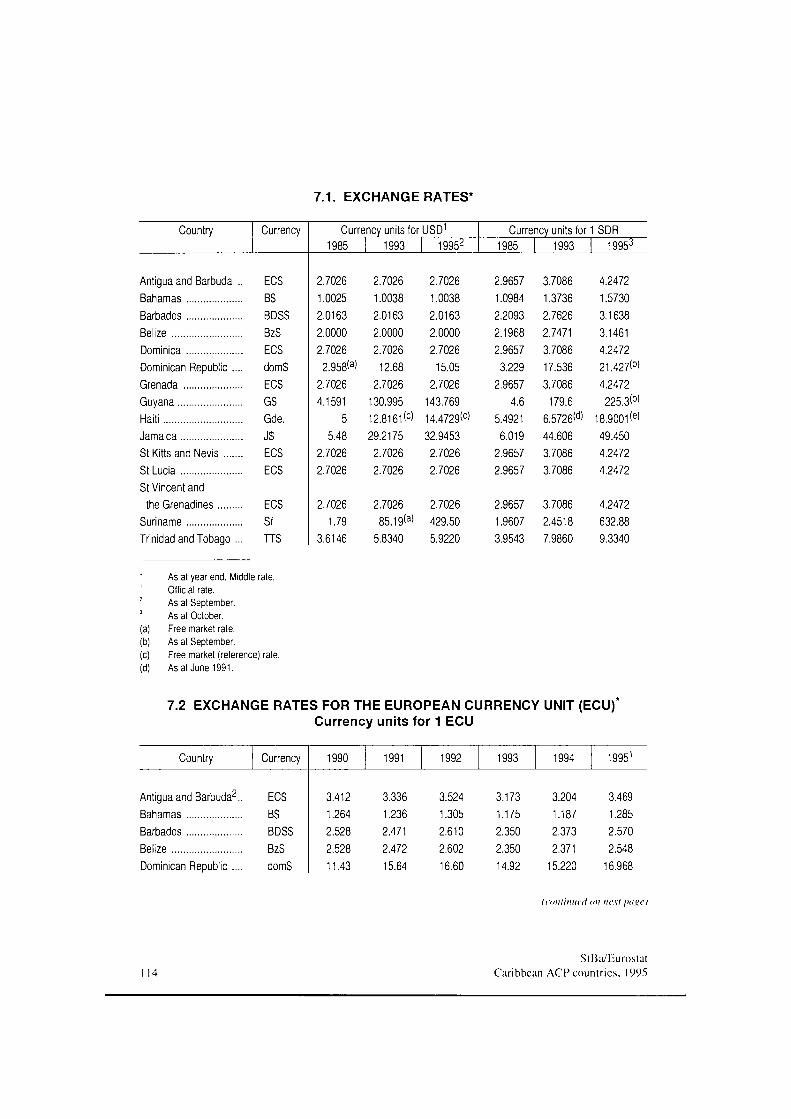
7.1. EXCHANGE RATES*
Country Currency Currency units tor USD 1985 1993 19952
Currency units tor 1 SDR 1985 1993 19953
Antigua and Barbuda .. ECS Bahamas BS Barbados BDSS Belize BzS Dominica ECS Dominican Republic .... domS Grenada ECS Guyana GS Haiti Gde. Jamaica JS St Kitts and Nevis ECS St Lucia ECS St Vincent and
the Grenadines ECS Suriname Sf Trinidad and Tobago ... TTS
2.7026 1.0025 2.0163 2.0000 2.7026
2.958<a> 2.7026 4.1591
5 5.48
2.7026 2.7026
2.7026 1.0038 2.0163 2.0000 2.7026
12.68 2.7026
130.995 12.8161 <c> 29.2175
2.7026 2.7026
2.7026 1.0038 2.0163 2.0000 2.7026
15.05 2.7026
143.769 14.4729<c' 32.9453
2.7026 2.7026
2.9657 1.0984 2.2093 2.1968 2.9657
3.229 2.9657
4.6 5.4921
6.019 2.9657 2.9657
3.7086 1.3736 2.7626 2.7471 3.7086 17.536 3.7086
179.6 6.5726<d> 44.606 3.7086 3.7086
4.2472 1.5730 3.1638 3.1461 4.2472 21.427<b> 4.2472
225.3<b> 18.9001 <e> 49.450 4.2472 4.2472
2.7026 2.7026 2.7026 1.79 85.19(a) 429.50
3.6146 5.8340 5.9220
2.9657 3.7086 4.2472 1.9607 2.4518 632.88 3.9543 7.9860 9.3340
: 3
(a) (b) (c) (d)
As at year end. Middle rate. Official rate. As at September. As at October. Free market rate. As at September. Free market (reference) rate. Asat June 1991.
7.2 EXCHANGE RATES FOR THE EUROPEAN CURRENCY UNIT (ECU) Currency units for 1 ECU
Country
Antigua and Barbuda2.. Bahamas Barbados Belize Dominican Republic ....
Currency
ECS BS BDSS BzS domS
1990
3.412 1.264 2.528 2.528 11.43
1991
3.336 1.236 2.471 2.472 15.64
1992
3.524 1.305 2.610 2.602 16.60
1993
3.173 1.175 2.350 2.350 14.92
1994
3.204 1.187 2.373 2.371
15.220
1995'
3.469 1.285 2.570 2.548
16.968
(continued on next page)
114 StBa/Eurostat
Caribbean ACP countries, 1995
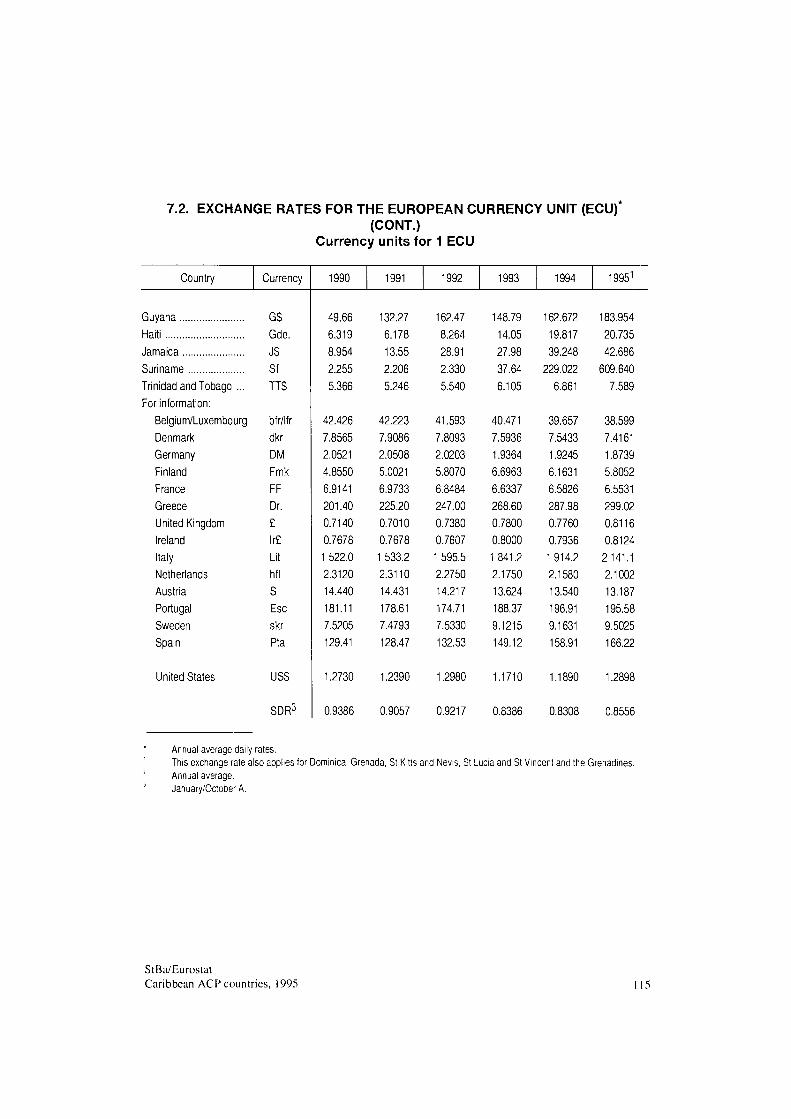
7.2. EXCHANGE RATES FOR THE EUROPEAN CURRENCY UNIT (ECU) (CONT.)
Currency units for 1 ECU
Country
Guyana Haiti Jamaica Suriname Trinidad and Tobago ... For information:
Belgium/Luxembourg Denmark Germany Finland France Greece United Kingdom Ireland Italy Netherlands Austria Portugal Sweden Spain
United States
Currency
GS Gde.
JS Sf TTS
bfr/lfr dkr DM Fmk FF Dr. £ Ire Lit hfl S Esc skr Pta
USS
SDR3
1990
49.66 6.319 8.954 2.255 5.366
42.426 7.8565 2.0521 4.8550 6.9141 201.40 0.7140 0.7678 1 522.0 2.3120 14.440 181.11 7.5205 129.41
1.2730
0.9386
1991
132.27 6.178 13.55 2.206 5.246
42.223 7.9086 2.0508 5.0021 6.9733 225.20 0.7010 0.7678 1 533.2 2.3110 14.431 178.61 7.4793 128.47
1.2390
0.9057
1992
162.47 8.264 28.91 2.330 5.540
41.593 7.8093 2.0203 5.8070 6.8484 247.00 0.7380 0.7607 1 595.5 2.2750 14.217 174.71 7.5330 132.53
1.2980
0.9217
1993
148.79 14.05 27.98 37.64 6.105
40.471 7.5936 1.9364 6.6963 6.6337 268.60 0.7800 0.8000 1 841.2 2.1750 13.624 188.37 9.1215 149.12
1.1710
0.8386
1994
162.672 19.817 39.248
229.022 6.861
39.657 7.5433 1.9245 6.1631 6.5826 287.98 0.7760 0.7936 1 914.2 2.1580 13.540 196.91 9.1631 158.91
1.1890
0.8308
19951
183.954 20.735 42.686
609.640 7.589
38.599 7.4161 1.8739 5.8052 6.5531 299.02 0.8116 0.8124 2 141.1 2.1002 13.187 195.58 9.5025 166.22
1.2898
0.8556
Annual average daily rates. This exchange rate also applies for Dominica, Grenada, St Kitts and Nevis, St Lucia and St Vincent and the Grenadines. Annual average. January/October A.
StBa/Eurostat Caribbean ACP countries. 1995
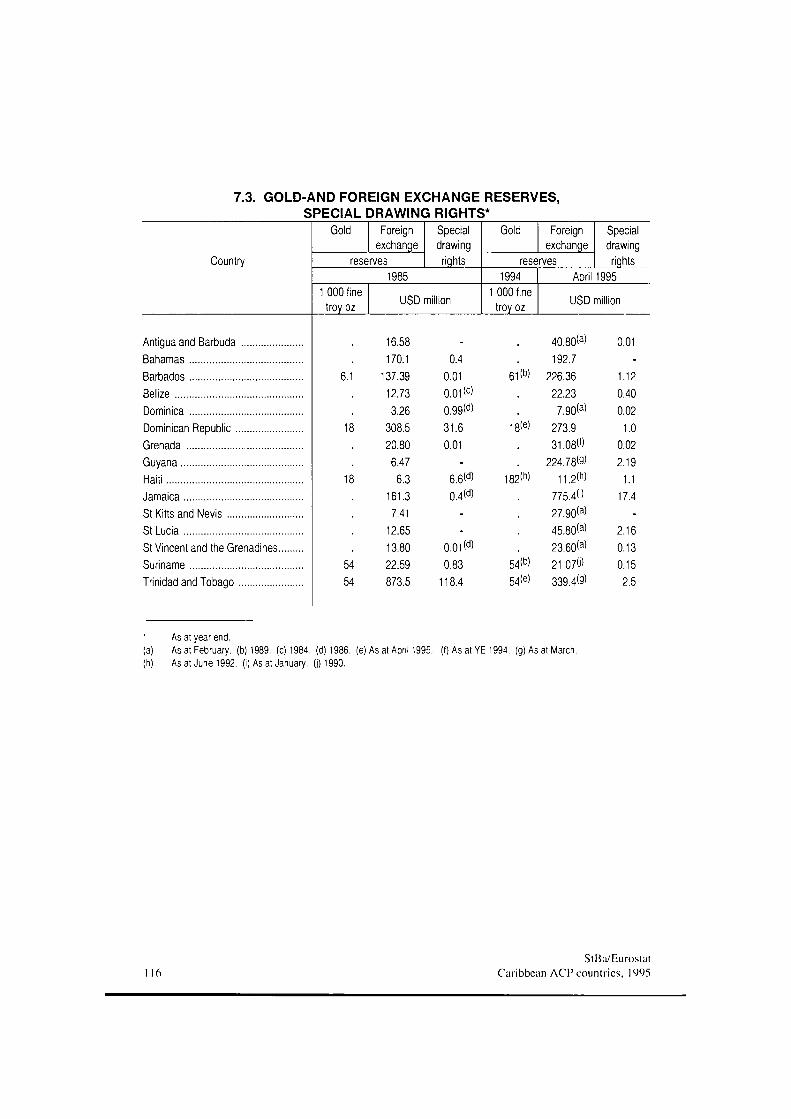
7.3. GOLD-AND FOREIGN EXCHANGE RESERVES, SPECIAL DRAWING RIGHTS*
Country
Gold Foreign exchange
reserves
Special drawing rights
1985 1 000 fine
troy oz USD million
Gold Foreign exchange
reserves 1994
1 000 fine troy oz
Special drawing rights
April 1995
USD million
Antigua and Barbuda Bahamas Barbados Belize Dominica Dominican Republic Grenada Guyana Haiti Jamaica St Kitts and Nevis St Lucia St Vincent and the Grenadines. Suriname Trinidad and Tobago
54 54
16.58 170.1
137.39 12.73 3.26
308.5 20.80
6.47 6.3
161.3 7.41
12.65 13.80 22.59 873.5
0.4 0.01 0.01<c> 0.99<d> 31.6 0.01
6.6(d) 0.4(d)
0.01 (d) 0.83
118.4
61(b)
18(e)
182<h)
54(b) 54(e)
40.80<a> 192.7
226.36 22.23
7.90<a) 273.9 31.08C)
224.78(9' 11.2<h>
775.4<') 27.90(a) 45.80<a) 23.60<a) 21.07» 339.4(9)
As at year end. (a) As at February, (b) 1989. (c) 1984. (d) 1986. (e) Asat April 1995. (f) Asat YE 1994. (g) As at March, (h) Asat June 1992. (i) As at January, (j) 1990.
0.01
1.12 0.40 0.02
1.0 0.02 2.19
1.1 17.4
2.16 0.13 0.15 2.5
StBa/Eurostat Caribbean ACP countries, 1995
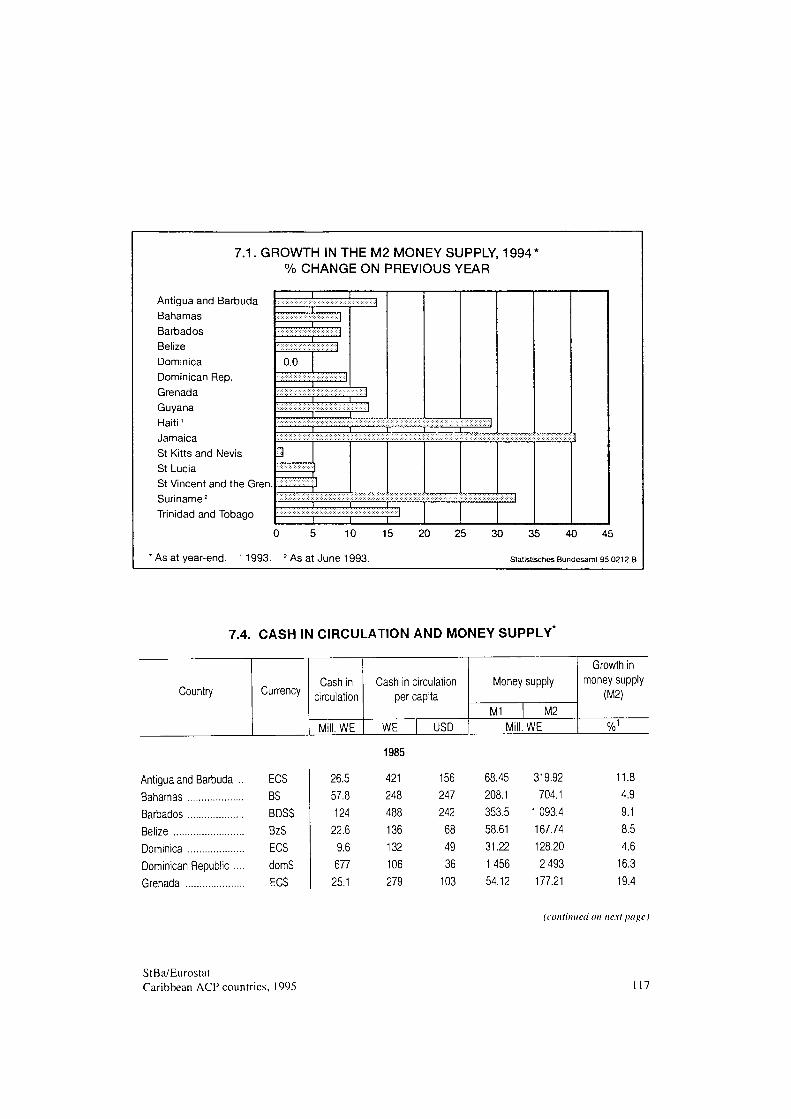
7.1. GROWTH IN THE M2 MONEY SUPPLY, 1994v
% CHANGE ON PREVIOUS YEAR
Antigua and Barbuda Bahamas Barbados Belize Dominica Dominican Rep. Grenada Guyana Haiti ' Jamaica St Kitts and Nevis St Lucia St Vincent and the Gren. Suriname2
Trinidad and Tobago
0.0
T ~
10 15 20 25 30 35 40 45
* As at year-end. ' 1993. 2 As at June 1993. Statistisches Bundesamt 95 0212 Β
7.4. CASH IN CIRCULATION AND MONEY SUPPLY
Country
Antigua and Barbuda .. Bahamas Barbados Belize Dominica Dominican Republic .... Grenada
Currency
ECS BS BDSS BzS ECS domS ECS
Cash in circulation
Mill. WE
26.5 57.8 124
22.6 9.6 677 25.1
Cash in circulation per capita
WE USD
1985
421 156 248 247 488 242 136 68 132 49 106 36 279 103
Money
M1
supply
M2 Mill. WE
68.45 208.1 353.5 58.61 31.22 1456 54.12
319.92 704.1
1 093.4 167.74 128.20 2 493
177.21
Growth in money supply
(M2)
%1
11.8 4.9 9.1 8.5 4.6
16.3 19.4
(continued on next page)
StBa/Eurostat Caribbean ACP countries, 1995 117
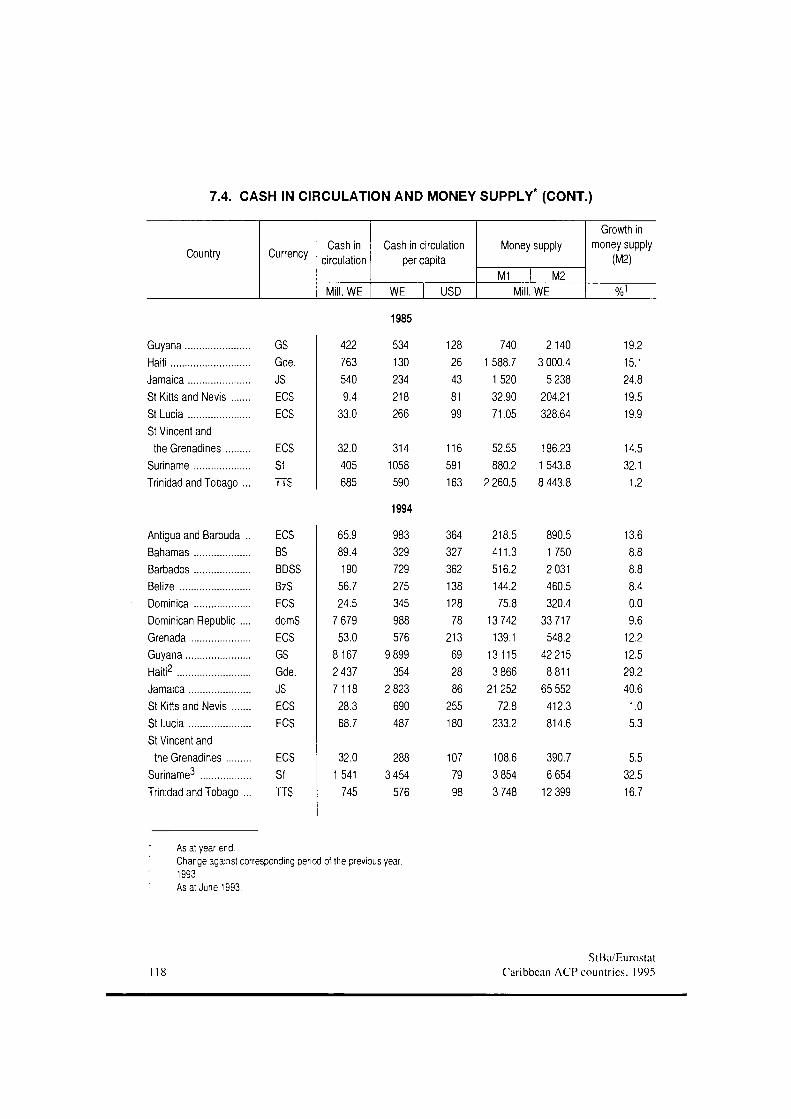
7.4. CASH IN CIRCULATION AND MONEY SUPPLY* (CONT.)
Country Currency Cash in
circulation
Mill. WE
Cash in circulation per capita
WE USD
Money supply
M1 M2 Mill. WE
Growth in money supply
(M2)
%1
1985
Guyana GS Haiti Gde. Jamaica JS St Kitts and Nevis ECS St Lucia ECS St Vincent and
the Grenadines ECS Suriname Sf Trinidad and Tobago ... TTS
Antigua and Barbuda .. ECS Bahamas BS Barbados BDSS Belize BzS Dominica ECS Dominican Republic .... domS Grenada ECS Guyana GS Haiti2 Gde. Jamaica JS St Kitts and Nevis ECS St Lucia ECS St Vincent and
the Grenadines ECS Suriname3 Sf Trinidad and Tobago ... TTS
422 763 540 9.4
33.0
32.0 405 685
65.9 89.4 190
56.7 24.5
7 679 53.0
8167 2 437 7118 28.3 68.7
32.0 1 541
745
534 130 234 218 266
314 1058 590
1994
983 329 729 275 345 988 576
9 899 354
2 823 690 487
288 3 454
576
128 26 43 81 99
116 591 163
364 327 362 138 128 78
213 69 28 86
255 180
107 79 98
740 1 588.7
1520 32.90 71.05
52.55 880.2
2 260.5
218.5 411.3 516.2 144.2 75.8
13 742 139.1
13115 3 866
21 252 72.8
233.2
108.6 3 854 3 748
2140 3 000.4
5 238 204.21 328.64
196.23 1 543.8 8 443.8
890.5 1750 2 031 460.5 320.4
33 717 548.2
42 215 8 811
65 552 412.3 814.6
390.7 6 654
12 399
19.2 15.1 24.8 19.5 19.9
14.5 32.1 1.2
13.6 8.8 8.8 8.4 0.0 9.6
12.2 12.5 29.2 40.6 1.0 5.3
5.5 32.5 16.7
As at year end. Change against corresponding period of the previous year. 1993. Asat June 1993.
18 StBa/Eurostat
Caribbean A C P countries, 1995
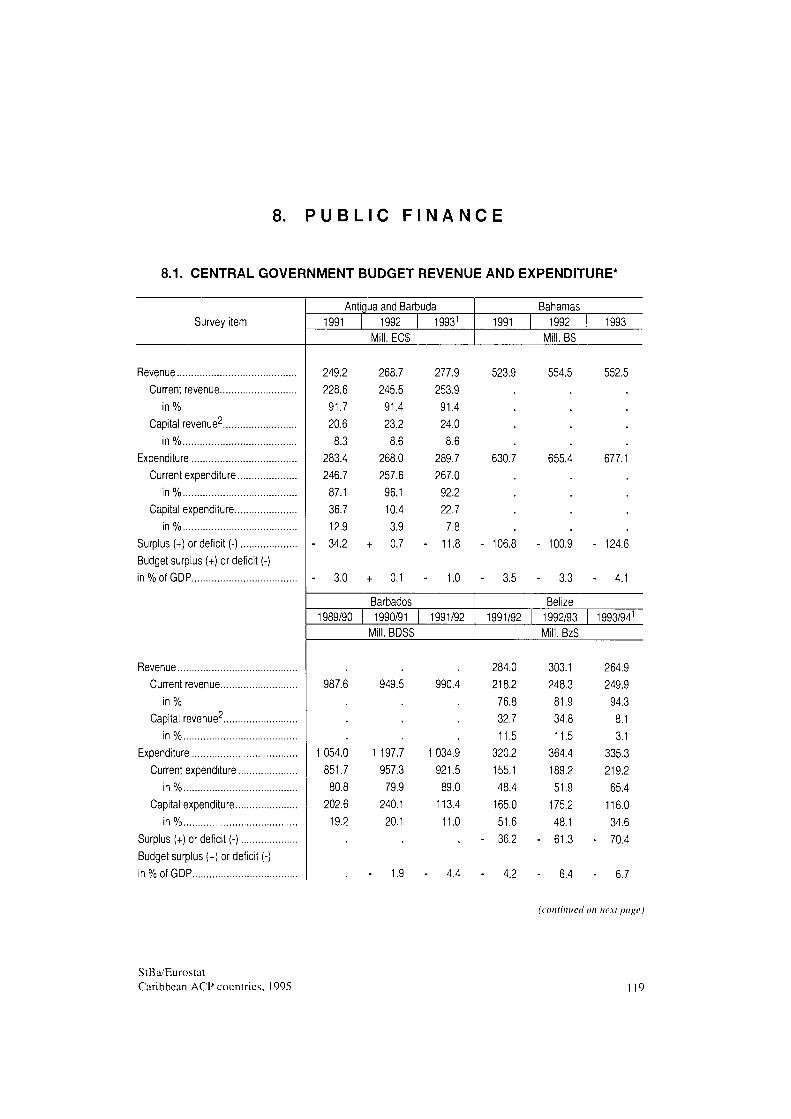
8. P U B L I C F I N A N C E
8.1. CENTRAL GOVERNMENT BUDGET REVENUE AND EXPENDITURE*
Survey item Antigua and Barbuda
1991 1992 1993' Mill. ECS
Bahamas 1991 1992 1993
Mill. BS
Revenue Current revenue
in% Capital revenue2
in% Expenditure
Current expenditure in%
Capital expenditure in%
Surplus (+) or deficit (-) Budget surplus (+) or deficit (-) in % of GDP
Revenue Current revenue
in% Capital revenue2
in% Expenditure
Current expenditure in%
Capital expenditure ¡n%
Surplus (+) or deficit (-) Budget surplus (+) or deficit (-) in % of GDP
249.2 228.6 91.7 20.6 8.3
283.4 246.7 87.1 36.7 12.9 34.2
3.0
987.6
054.0 851.7 80.8
202.6 19.2
268.7 245.5 91.4 23.2 8.6
268.0 257.6 96.1 10.4 3.9 0.7
0.1
277.9 253.9 91.4 24.0 8.6
289.7 267.0 92.2 22.7 7.8
11.8
1.0
523.9 554.5
630.7 655.4
106.8 - 100.9
3.5 3.3
949.5
1 197.7 957.3 79.9
240.1 20.1
1.9
990.4
034.9 921.5 89.0
113.4 11.0
4.4
284.0 218.2 76.8 32.7 11.5
320.2 155.1 48.4
165.0 51.6 36.2
4.2
303.1 248.3 81.9 34.8 11.5
364.4 189.2 51.9
175.2 48.1 61.3
6.4
552.5
677.
124.6
4.1
Barbados 1989/90 1990/91 i 1991/92
Mill. BDSS
Belize 1991/92 1992/93 1993/941
Mill. BzS
264.9 249.9 94.3 8.1 3.1
335.3 219.2 65.4
116.0
34.6 70.4
6.7
(continued on next page)
StBa/Eurostat Caribbean ACP countries. 1995 119
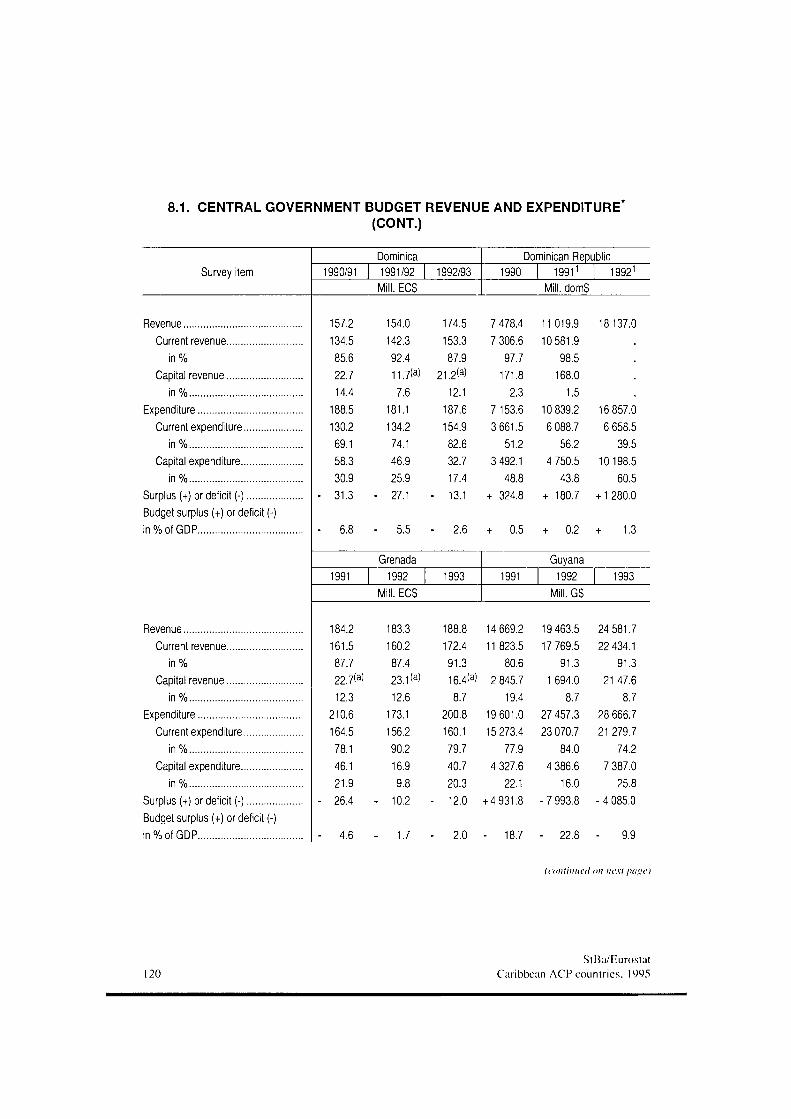
8.1. CENTRAL GOVERNMENT BUDGET REVENUE AND EXPENDITURE*
(CONT.)
Survey item
Dominica
1990/91 1991/92 1992/93
ECS
Dominican Republic
1990 1991' 19921
. domS
Revenue
Current revenue
in%
Capital revenue
in%
Expenditure
Current expenditure
in%
Capital expenditure
in%
Surplus (+) or deficit (-)
Budget surplus (+) or deficit (-)
in % of GDP
157.2
134.5
85.6
22.7
14.4
188.5
130.2
69.1
58.3
30.9
31.3
6.8
Revenue
Current revenue
in%
Capital revenue
in%
Expenditure
Current expenditure
in%
Capital expenditure
in%
Surplus (+) or deficit (-)
Budget surplus (+) or deficit (-
in % of GDP
184.2
161.5
87.7
22.7(a)
12.3
210.6
164.5
78.1
46.1
21.9
26.4
4.6
154.0
142.3
92.4
11.7(a)
7.6
181.1
134.2
74.1
46.9
25.9
27.1
5.5
174.5
153.3
87.9
21.2(3)
12.1
187.6
154.9
82.6
32.7
17.4
■ 13.1
■ 2.6
7 478.4
7 306.6
97.7
171.8
2.3
7 153.6
3 661.5
51.2
3 492.1
48.8
+ 324.8
+ 0.5
11 019.9
10 581.9
98.5
168.0
1.5
10 839.2
6 088.7
56.2
4 750.5
43.8
+ 180.7
+ 0.2
18137.0
16 857.0
6 658.5
39.5
10 198.5
60.5
+1 280.0
+ 1.3
Grenada
1991 1992 1993
Mill. ECS
Guyana
1991 1992 1993
Mill. GS
183.3
160.2
87.4
23.1<3)
12.6
173.1
156.2
90.2
16.9
9.8
10.2
1.7
188.8
172.4
91.3
16.4(3)
8.7
200.8
160.1
79.7
40.7
20.3
12.0
2.0
14 669.2
11 823.5
80.6
2 845.7
19.4
19 601.0
15 273.4
77.9
4 327.6
22.1
+ 4 931.8
- 18.7
19 463.5
17 769.5
91.3
1 694.0
8.7
27 457.3
23 070.7
84.0
4 386.6
16.0
- 7 993.8
- 22.8
24 581.7
22 434.1
91.3
21 47.6
8.7
28 666.7
21 279.7
74.2
7 387.0
25.8
- 4 085.0
9.9
(continued on next page)
120
StBa/Eurostat
Caribbean ACP countries, 1995
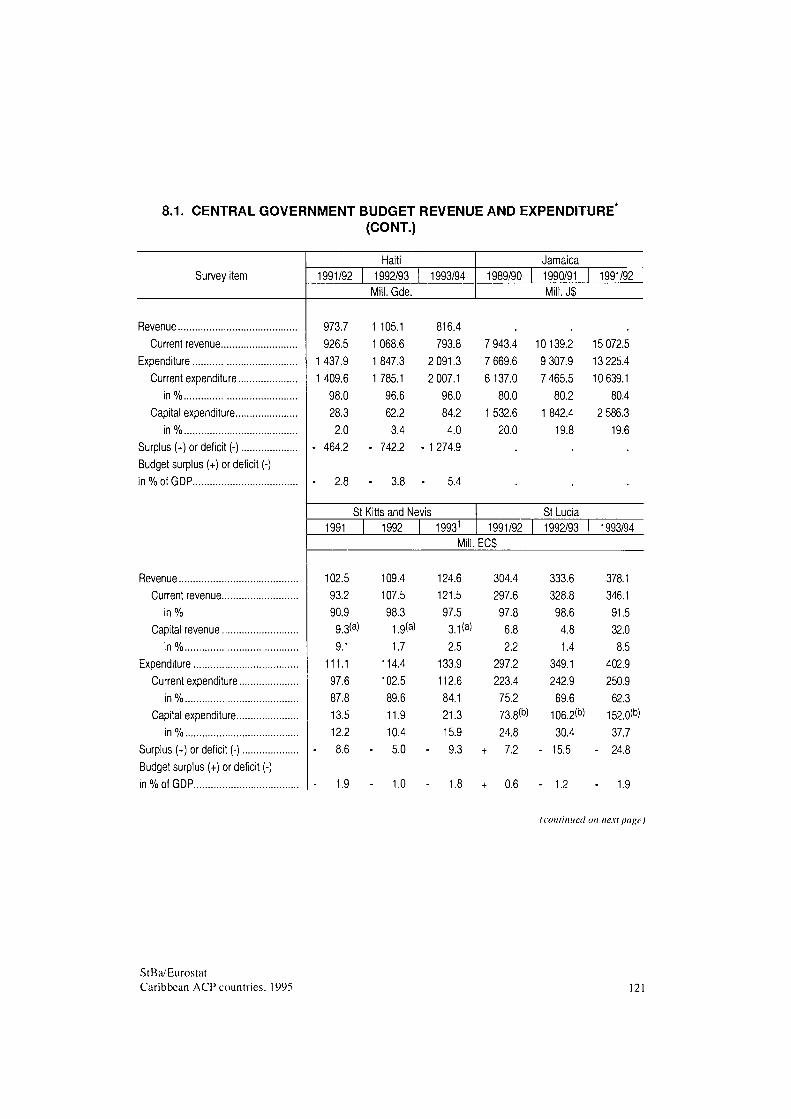
8.1. CENTRAL GOVERNMENT BUDGET REVENUE AND EXPENDITURE (CONT.)
Survey item Haiti
1991/92 1992/93 1993/94 Mill. Gde.
Jamaica 1989/90 1990/91 1991/92
Mill. JS
Revenue Current revenue
Expenditure Current expenditure
in% Capital expenditure
in% Surplus (+) or deficit (-) Budget surplus (+) or deficit (-) in % of GDP
Revenue Current revenue
in% Capital revenue
in% Expenditure
Current expenditure in%
Capital expenditure in%
Surplus (+) or deficit (-) Budget surplus (+) or deficit (-) in % of GDP
973.7 926.5
1 437.9 1 409.6
98.0 28.3 2.0
- 464.2
- 2.8
1 105.1 1 068.6 1 847.3 1 785.1
96.6 62.2 3.4
- 742.2
- 3.8
816.4 793.8
2 091.3 2 007.1
96.0 84.2 4.0
- 1 274.9
5.4
7 943.4 7 669.6 6 137.0
80.0 1 532.6
20.0
10139.2 9 307.9 7 465.5
80.2 1 842.4
19.8
15 072.5 13 225.4 10 639.1
80.4 2 586.3
19.6
St Kitts and Nevis 1991 1992 19931
St Lucia 1991/92 1992/93 1993/94
Mill. ECS
102.5 93.2 90.9 9.3(a) 9.1
111.1 97.6 87.8 13.5 12.2
8.6
1.9
109.4 107.5 98.3 1.9(3) 1.7
114.4 102.5 89.6 11.9 10.4 5.0
1.0
124.6 121.5 97.5 3.1(3) 2.5
133.9 112.6 84.1
21.3 15.9 9.3
304.4 297.6 97.8 6.8 2.2
297.2 223.4 75.2 73.8<b) 24.8 7.2
0.6
333.6 328.8 98.6 4.8 1.4
349.1 242.9 69.6
106.2<b) 30.4 15.5
1.2
378.1 346.1 91.5 32.0 8.5
402.9 250.9 62.3
152.0<b) 37.7 24.8
1.9
(continued on next page)
StBa/Eurostat Caribbean ACP countries, 1995 121
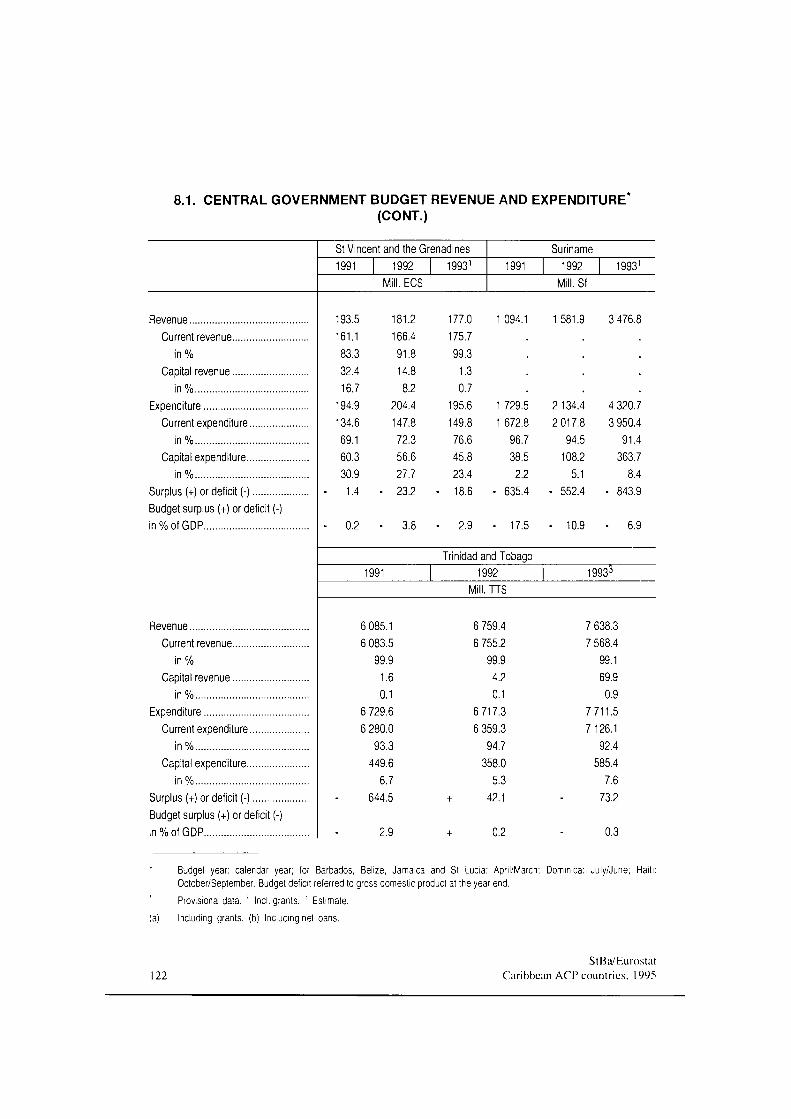
8.1. CENTRAL GOVERNMENT BUDGET REVENUE AND EXPENDITURE* (CONT.)
St Vincent and the Grenadines 1991 1992 19931
ECS
Suriname 1991 1992 1993'
Mill. Sf
Revenue Current revenue
in% Capital revenue
in% Expenditure
Current expenditure in%
Capital expenditure in%
Surplus (+) or deficit (-) Budget surplus (+) or deficit (-) in % of GDP
193.5 161.1 83.3 32.4 16.7
194.9 134.6 69.1 60.3 30.9 1.4
0.2
181.2 166.4
91.8 14.8 8.2
204.4
147.8 72.3 56.6 27.7 23.2
3.8
177.0 175.7
99.3 1.3 0.7
195.6 149.8 76.6 45.8 23.4 18.6
2.9
094.' 1581.9 3 476.8
1 729.5 1 672.8
96.7 38.5 2.2
- 635.4
- 17.5
2 134.4 2 017.8
94.5 108.2
5.1 - 552.4
- 10.9
4 320.7 3 950.4
91.4 363.7
8.4 - 843.9
- 6.9
Trinidad and Tobago 1991 1992 19933
.TTS
Revenue Current revenue
¡n% Capital revenue
in% Expenditure
Current expenditure in%
Capital expenditure in%
Surplus (+) or deficit (-) Budget surplus (+) or deficit (-) in % of GDP
6 085.1 6 083.5
99.9 1.6 0.1
6 729.6 6 280.0
93.3 449.6
6.7 644.5
2.9
6 759.4 6 755.2
99.9 4.2 0.1
6 717.3 6 359.3
94.7 358.0
5.3 42.1
0.2
7 638.3 7 568.4
99.1 69.9 0.9
7711.5 7 126.1
92.4 585.4
7.6 73.2
0.3
Budget year: calendar year; for Barbados, Belize, Jamaica and St Lucia: April/March; Dominica: July/June; Haiti: October/September. Budget deficit referred to gross domestic product at the year end. Provisional data. ' Incl. grants. "' Estimate.
(a) Including grants, (b) Inducing net loans.
122 StBa/Eurostat
Caribbean ACP countries. 1995
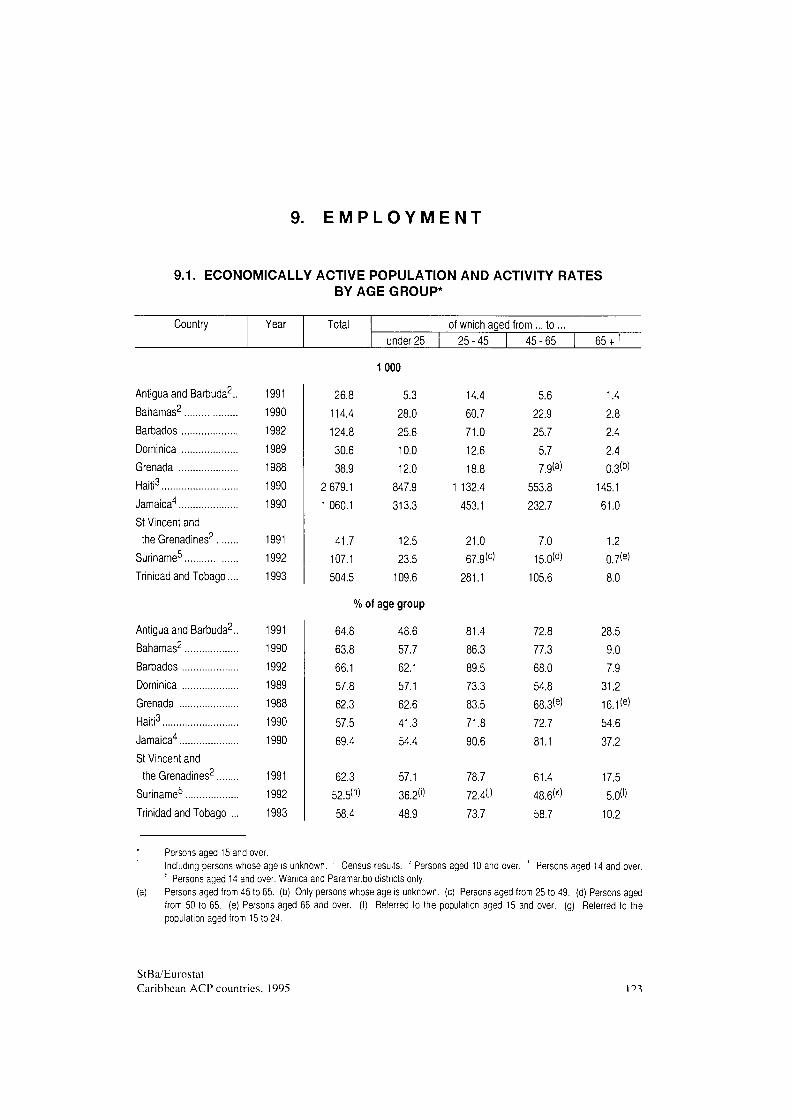
9. E M P L O Y M E N T
9.1. ECONOMICALLY ACTIVE POPULATION AND ACTIVITY RATES BY AGE GROUP*
Country Year Total under 25
of which aged from ... to . 25-45 45-65 65 +
Antigua and Barbuda2.. 1991
Bahamas2 1990
Barbados 1992
Dominica 1989
Grenada 1988
Haiti3 1990
Jamaica4 1990
St Vincent and
the Grenadines2 1991
Suriname5 1992
Trinidad and Tobago.... 1993
Antigua and Barbuda2.. 1991
Bahamas2 1990
Barbados 1992
Dominica 1989
Grenada 1988
Haiti3 1990
Jamaica4 1990
St Vincent and
the Grenadines2 1991
Suriname5 1992
Trinidad and Tobago ... 1993
1000
26.8
114.4
124.8
30.6
38.9
2 679.1
1 060.1
41.7
107.1
504.5
%of
64.8
63.8
66.1
57.8
62.3
57.5
69.4
62.3
52.5<")
58.4
5.3 28.0
25.6
10.0
12.0
847.9
313.3
12.5
23.5
109.6
age group
48.6
57.7
62.1
57.1
62.6
41.3
54.4
57.1
36.2«
48.9
14.4
60.7
71.0
12.6
18.8
1 132.4
453.1
21.0
67.9<c>
281.1
81.4
86.3
89.5
73.3
83.5
71.8
90.6
78.7
72.4«
73.7
5.6 22.9
25.7
5.7 7.9(a)
553.8
232.7
7.0 15.0(d)
105.6
72.8
77.3
68.0
54.8
68.3(e)
72.7
81.1
61.4
48.6<k)
58.7
1.4 2.8 2.4 2.4 0.3<b)
145.1
61.0
1.2 0.7(e>
8.0
28.5
9.0 7.9
31.2
16.1(e)
54.6
37.2
17.5
5.0«
10.2
Persons aged 15 and over. Including persons whose age is unknown. ' Census results. "' Persons aged 10 and over. ' Persons aged 14 and over. ; Persons aged 14 and over. Wanica and Paramaribo districts only. Persons aged from 45 to 65. (b) Only persons whose age is unknown, (c) Persons aged from 25 to 49. (d) Persons aged from 50 to 65. (e) Persons aged 66 and over, (f) Referred to the population aged 15 and over, (g) Referred to the population aged from 15 to 24.
StBa/Eurostat Caribbean ACP countries. 1995 m
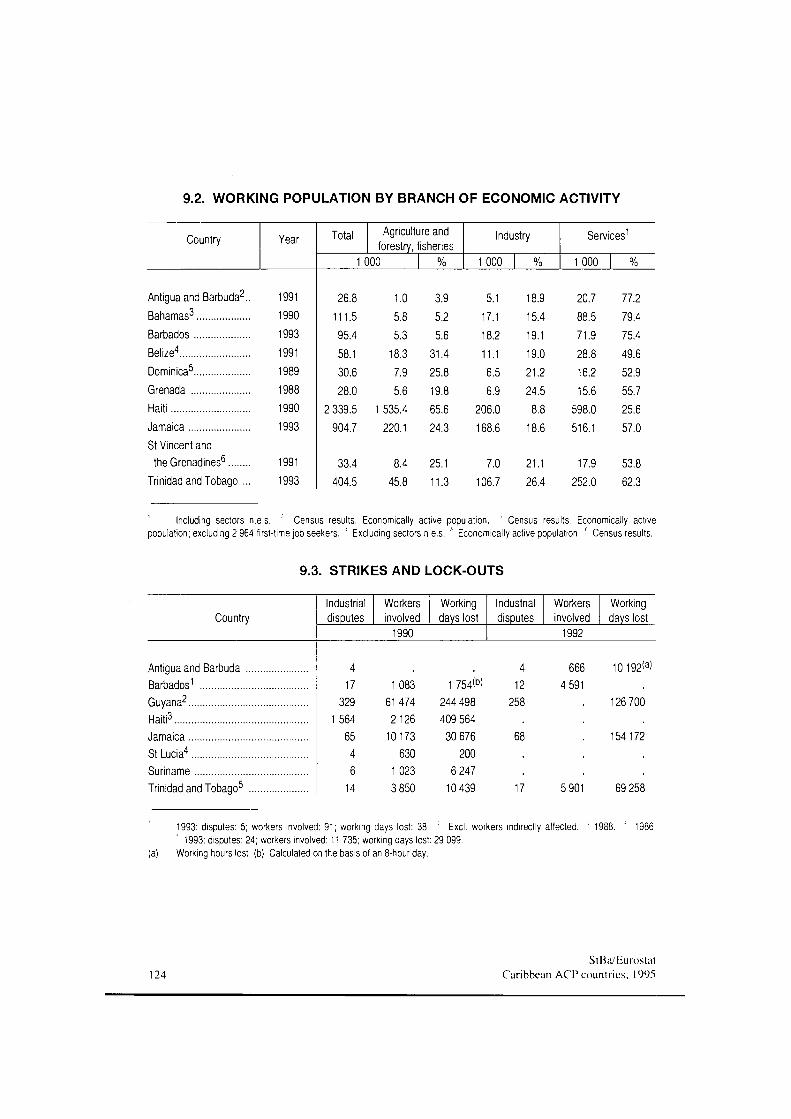
9.2. WORKING POPULATION BY BRANCH OF ECONOMIC ACTIVITY
Country Year Total Agriculture and forestry, fisheries
1000 %
Industry
1 000
Services'
000
Antigua and Barbuda2.. 1991
Bahamas3 1990
Barbados 1993
Belize4 1991
Dominica5 1989
Grenada 1988
Haiti 1990
Jamaica 1993
St Vincent and the Grenadines6 1991
Trinidad and Tobago ... 1993
26.8
111.5
95.4
58.1 30.6 28.0
2 339.5
904.7
33.4
404.5
1.0 5.8 5.3
18.3 7.9
5.6
535.4
220.1
8.4
45.8
3.9 5.2 5.6
31.4 25.8 19.8 65.6 24.3
25.1
11.3
5.1 17.1
18.2
11.1 6.5 6.9
206.0
168.6
7.0
106.7
18.9
15.4
19.1
19.0
21.2
24.5
8.8
18.6
21.1 26.4
20.7
88.5
71.9
28.8
16.2
15.6
598.0
516.1
17.9
252.0
77.2 79.4 75.4 49.6 52.9 55.7 25.6 57.0
53.8
62.3
Including sectors n.e.s. : Census results. Economically active population. ' Census results. Economically active population; excluding 2 964 first-time job seekers. ' Excluding sectors n.e.s. f Economically active population. ' Census results.
9.3. STRIKES AND LOCK-OUTS
Country Industrial disputes
Workers involved
Working days lost
1990
Industrial disputes
Workers involved
1992
Working days lost
Antigua and Barbuda . Barbados1
Guyana2
Haiti3
Jamaica St Lucia4
Suriname Trinidad and Tobago5
4 17
329 564
65 4 6
14
1083 61474 2126
10173 630
1 023 3 850
1 754<b> 244 498 409 564
30 676 200
6 247 10 439
4 12
258
666 4 591
5 901
1993: disputes: 5; workers involved: 91; working days lost: 38. ' Excl. workers indirectly affected. 1993: disputes: 24; workers involved: 11 735; working days lost: 29 099.
(a) Working hours lost (b) Calculated on the basis of an 8-hour day.
10192<3)
126 700
154 172
69 258
¡8. ' 1986.
124 StBa/Eurostat
Caribbean ACP countries, 1995
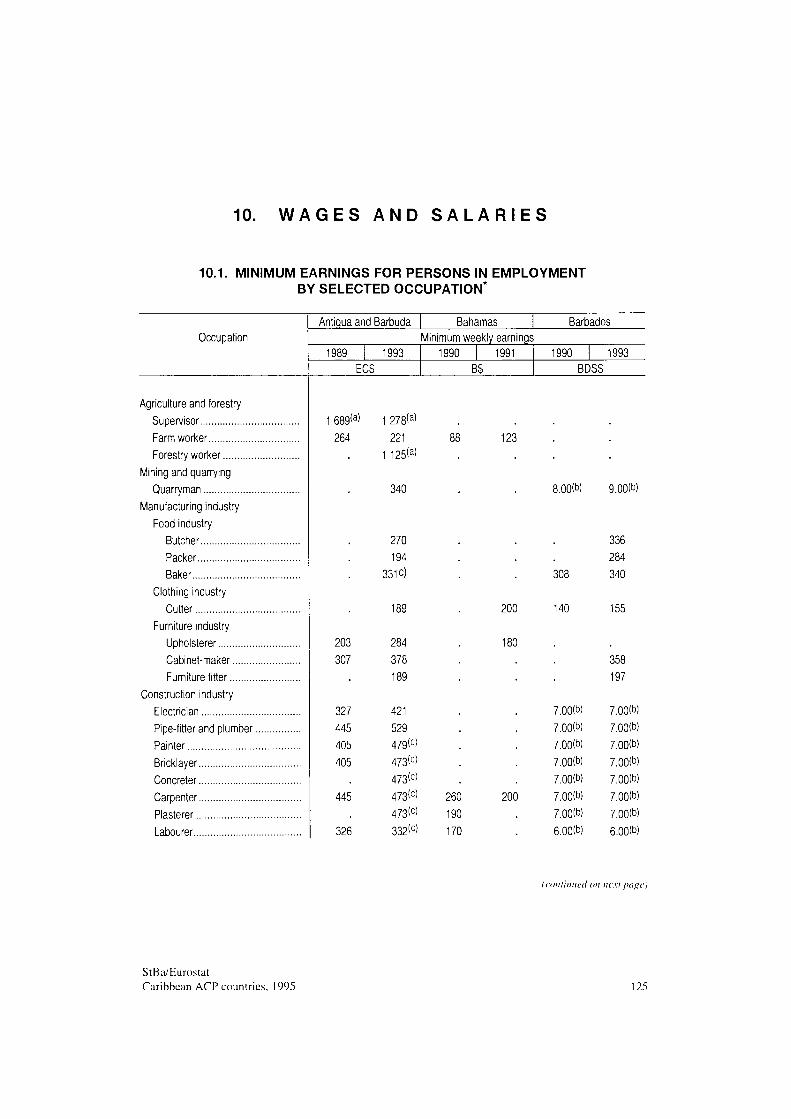
10. W A G E S A N D S A L A R I E S
10.1. MINIMUM EARNINGS FOR PERSONS IN EMPLOYMENT BY SELECTED OCCUPATION*
Occupation Antigua and Barbuda Bahamas Barbados
Minimum weekly earnings 1989 1993
ECS 1990 1991
BS 1990 1993
BDSS
Agriculture and forestry Supervisor Farmworker Forestry worker
Mining and quarrying Quarryman
Manufacturing industry Food industry
Butcher Packer Baker
Clothing industry Cutter
Furniture industry Upholsterer Cabinet-maker Furniture fitter
Construction industry Electrician Pipe-fitter and plumber Painter Bricklayer Concreter Carpenter Plasterer Labourer
689(3)
264 1 278(a)
221 1 125<3)
340
123
}.00(b) 9.00(b)
203 307
327 445 405 405
445
326
270 194
331 c)
189
284 378 189
421 529 479(c)
473<c> 473<c) 473(c) 473(°) 332(c>
260 190 170
200
180
200
308
140
7.00(b) 7.00(b)
7.00(b) 7.00(b) 7.00(b) 7.00(b) 7.00(b) 6.00(b)
336 284 340
155
358 197
7.00(b) 7.00(b) 7.00(b) 7.00(b) 7.00(b) 7.00(b) 7.00(b) 6.00(b)
(continued on next page)
StBa/Eurostat Caribbean ACP countries. 1995 125
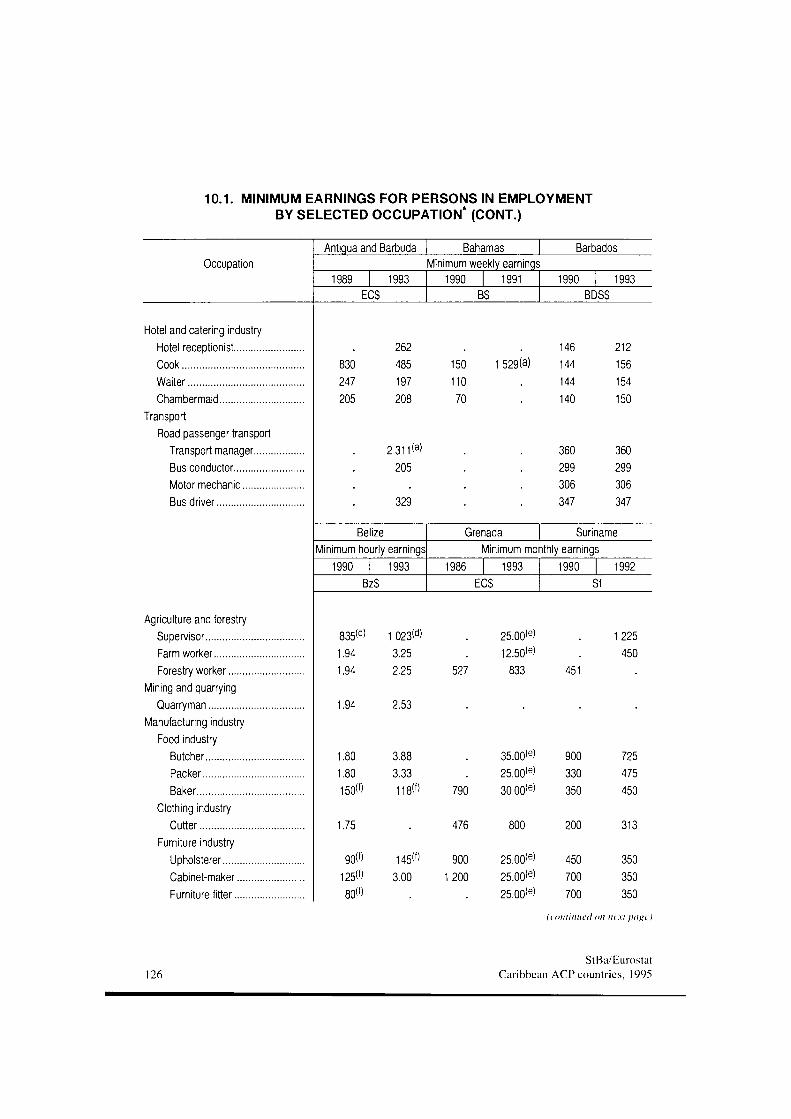
10.1. MINIMUM EARNINGS FOR PERSONS IN EMPLOYMENT BY SELECTED OCCUPATION* (CONT.)
Occupation Antigua and Barbuda Bahamas Barbados
Minimum weekly earnings 1993
ECS 1990 1991
BS 1990 1993
BDSS
Hotel and catering industry Hotel receptionist Cook Waiter Chambermaid
Transport Road passenger transport
Transport manager Bus conductor Motor mechanic Bus driver
830 247 205
262 485 197 208
2 311(3) 205
150 110 70
1 529(a)
329
146 144 144 140
360 299 306 347
212 156 154 150
360 299 306 347
Belize Minimum hourly earnings
1990 1993 BzS
Grenada Suriname Minimum monthly earnings
1986 1993 ECS
1990 1992 Sf
Agriculture and forestry Supervisor Farmworker Forestry worker
Mining and quarrying Quarryman
Manufacturing industry Food industry
Butcher Packer Baker
Clothing industry Cutter
Furniture industry Upholsterer Cabinet-maker Furniture fitter
835<d) 1 023'd) 1.94 3.25 1.94 2.25 527
25.00(e> 12.50(e>
833 451
1225 450
.94
150<f>
1.75
2.53
3.88 3.33 1180 790
476
35.00<e) 25.00(e> 30.00<e)
900 330 350
725 475 450
800 200 313
90«) 25«>
80<f)
I45C) 3.00
900 1200
25.00<e> 25.00<e) 25.00(e>
450 700 700
350 350 350
(continued on next pui>c)
126 StBa/Eurostat
Caribbean ACP countries, 1995
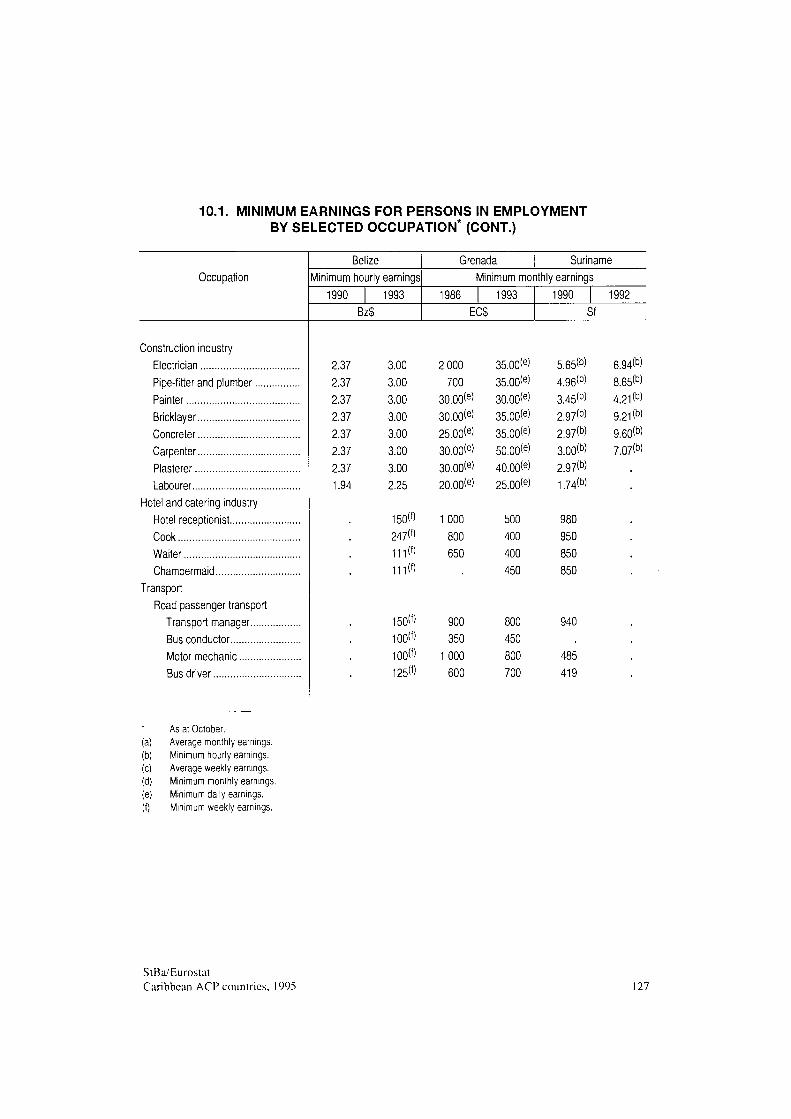
10.1. MINIMUM EARNINGS FOR PERSONS IN EMPLOYMENT BY SELECTED OCCUPATION* (CONT.)
Occupation Belize
Minimum hourly earnings
1990 1993 BzS
Grenada Suriname Minimum monthly earnings
1986 1993 ECS
1990 Sf
1992
Construction industry Electrician Pipe-fitter and plumber Painter Bricklayer Concreter Carpenter Plasterer Labourer
Hotel and catering industry Hotel receptionist Cook Waiter Chambermaid
Transport Road passenger transport
Transport manager Bus conductor Motor mechanic Bus driver
As at October. (a) Average monthly earnings. (b) Minimum hourly earnings. (c) Average weekly earnings. (d) Minimum monthly earnings. (e) Minimum daily earnings. (f) Minimum weekly earnings.
2.37 2.37 2.37 2.37 2.37 2.37 2.37 1.94
3.00 3.00 3.00 3.00 3.00 3.00 3.00 2.25
150O 247(f)
m(f)
150« 100(f) 100(f) 125(f)
2 000 700
30.00<e> 30.00(e> 25.00<e) 30.00<e) 30.00<e) 20.00<e)
1000 800 650
900 350
1000 600
35.00<e) 35.00<e' 30.00(e) 35.00<e) 35.00(e) 50.00<e) 40.00<e) 25.00(e)
5.65<b> 4.96<b> 3.45«) 2.97(b)
2.97«) 3.00«) 2.97(b) 1.74«)
500 400 400 450
800 450 800 700
980 950 850 850
940
485 419
6.94«) 8.65«> 4.21«) 9.21«) 9.60(b) 7.07«)
StBa/Eurostat Caribbean ACP countries. 1995 127
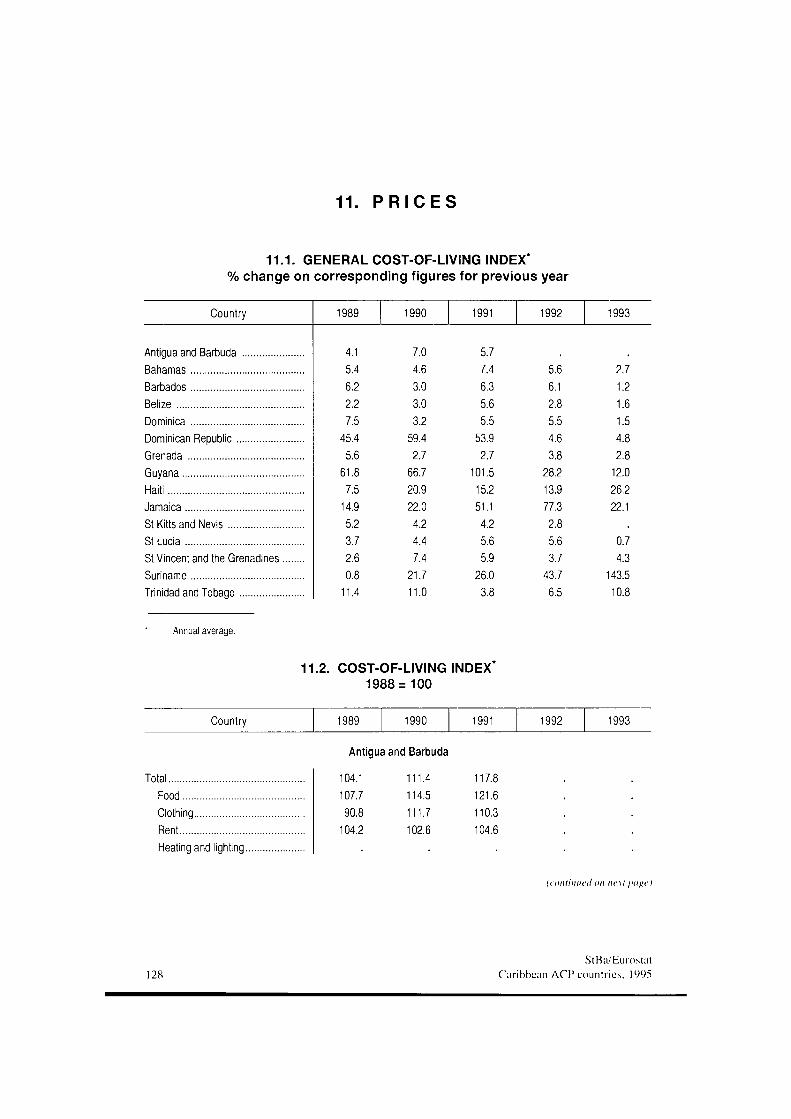
11. P R I C E S
11.1. GENERAL COST-OF-LIVING INDEX* % change on corresponding figures for previous year
Country
Antigua and Barbuda Bahamas Barbados Belize Dominica Dominican Republic Grenada Guyana Haiti Jamaica St Kitts and Nevis St Lucia St Vincent and the Grenadines Suriname Trinidad and Tobago
Annual average.
11
Country
Total Food Clothing Rent Heating and lighting
1989
4.1 5.4 6.2 2.2 7.5
45.4 5.6
61.8 7.5
14.9 5.2 3.7 2.6 0.8
11.4
1990
7.0 4.6 3.0 3.0 3.2
59.4 2.7
66.7 20.9 22.0 4.2 4.4 7.4
21.7 11.0
1991
5.7 7.4 6.3 5.6 5.5
53.9 2.7
101.5 15.2 51.1 4.2 5.6 5.9
26.0 3.8
.2. COST-OF-LIVING INDEX* 1988 = 100
1989
Antigu
104.1 107.7 90.8
104.2
1990
a and Barbuda
111.4 114.5 111.7 102.6
1991
117.8 121.6 110.3 104.6
1992
5.6 6.1 2.8 5.5 4.6 3.8
28.2 13.9 77.3 2.8 5.6 3.7
43.7 6.5
1992
1993
2.7 1.2 1.6 1.5 4.8 2.8
12.0 26.2 22.1
0.7 4.3
143.5 10.8
1993
(continued on next page)
128 StBa/Eurostat
Caribbean ACP countries. 1995
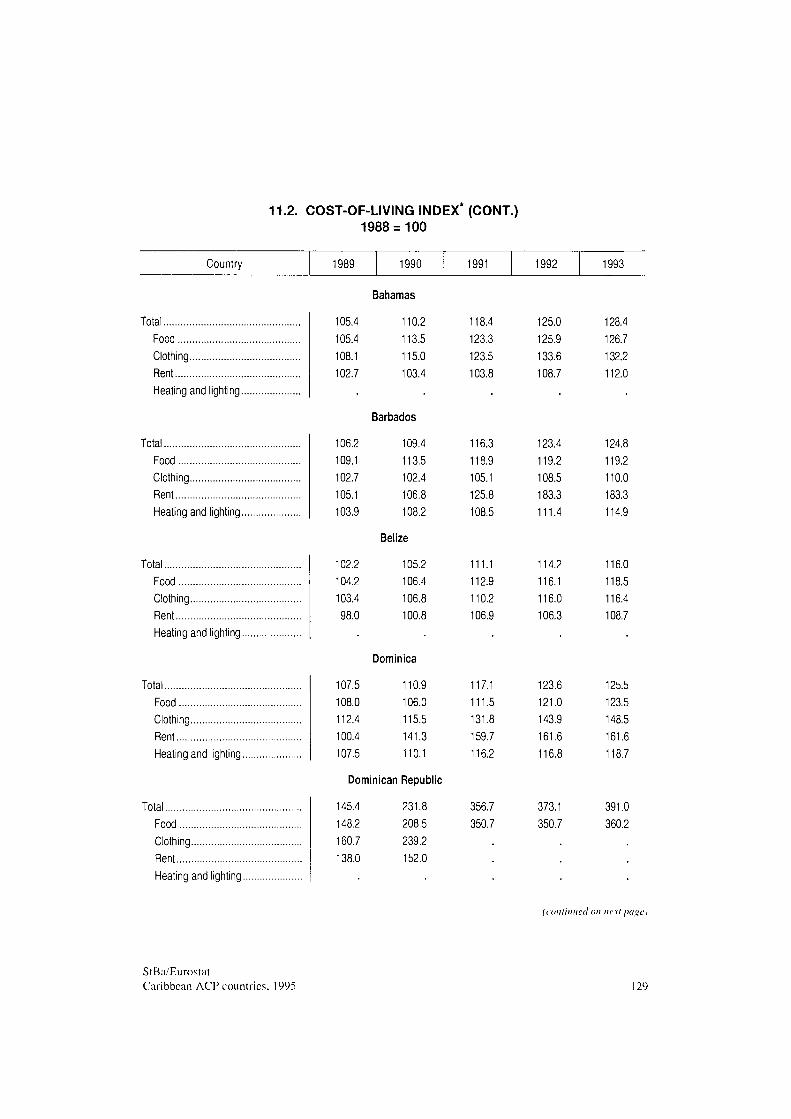
11.2. COST-OF-LIVING INDEX (CONT.) 1988 = 100
Country 1989 1990 1991 1992 1993
Total Food Clothing Rent Heating and lighting.
Total Food Clothing Rent Heating and lighting.
Total Food Clothing Rent Heating and lighting.
Total Food Clothing Rent Heating and lighting.
Total Food Clothing Rent Heating and lighting.
Bahamas
105.4 105.4 108.1 102.7
110.2 113.5 115.0 103.4
118.4 123.3 123.5 103.8
125.0 125.9 133.6 108.7
128.4 126.7 132.2 112.0
Barbados
106.2 109.1 102.7 105.1 103.9
102.2 104.2 103.4 98.0
109.4 113.5 102.4 106.8 108.2
Belize
105.2 106.4 106.8 100.8
116.3 118.9 105.1 125.8 108.5
111.1 112.9 110.2 106.9
123.4 119.2 108.5 183.3 111.4
114.2 116.1 116.0 106.3
124.8 119.2 110.0 183.3 114.9
116.0 118.5 116.4 108.7
Dominica
107.5 110.9 108.0 106.0 112.4 115.5 100.4 141.3 107.5 110.1
Dominican Republic
145.4 231.8 148.2 208.5 160.7 239.2 138.0 152.0
117.1 111.5 131.8 159.7 116.2
356.7 350.7
123.6 121.0 143.9 161.6 116.8
373.1 350.7
125.5 123.5 148.5 161.6 118.7
391.0 360.2
(continued on next page)
StBa/Eurostat Caribbean ACP countries, 1995 129
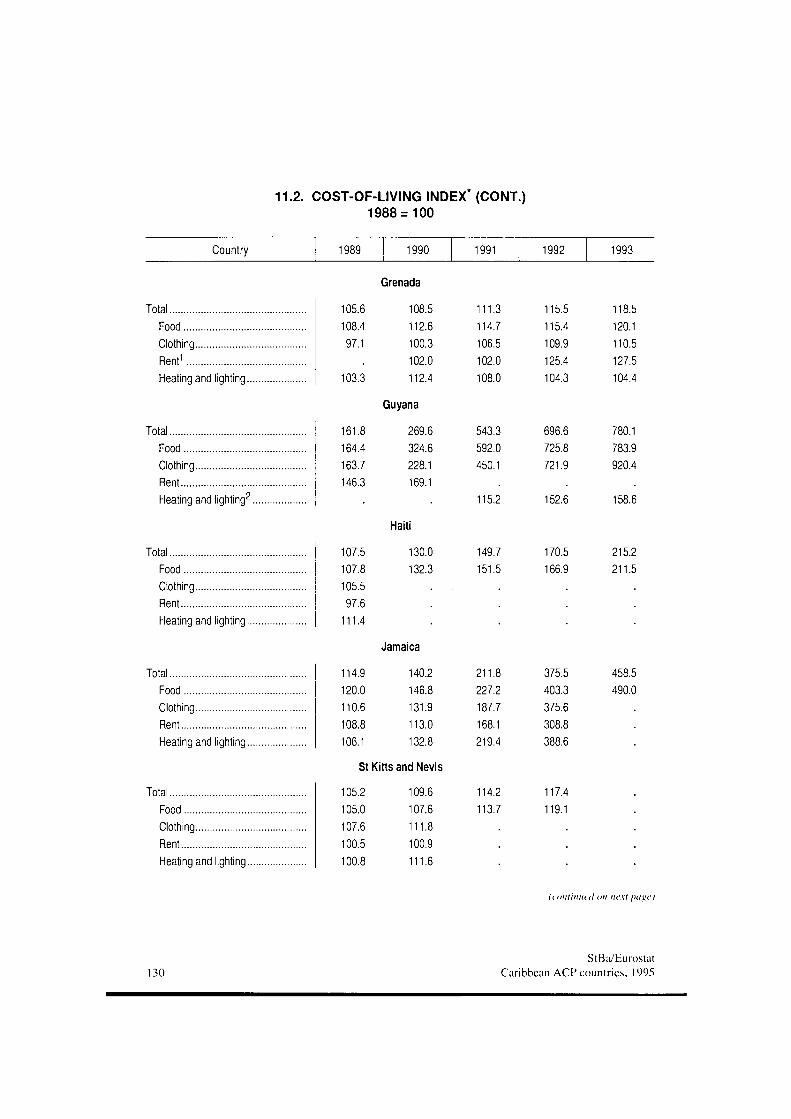
11.2. COST-OF-LIVING INDEX (CONT.) 1988 = 100
Country 1989 1990 1991 1992 1993
Total Food Clothing Rent1
Heating and lighting...
Total Food Clothing Rent Heating and lighting2.
Total Food Clothing Rent Heating and lighting...
Total Food Clothing Rent Heating and lighting...
Total Food Clothing Rent Heating and lighting...
Grenada
105.6 108.4 97.1
103.3
161.8 164.4 163.7 146.3
108.5 112.6 100.3 102.0 112.4
Guyana
269.6 324.6 228.1 169.1
111.3 114.7 106.5 102.0 108.0
543.3 592.0 450.1
115.5 115.4 109.9 125.4 104.3
696.6 725.8 721.9
118.5 120.1 110.5 127.5 104.4
780.1 783.9 920.4
Haiti
115.2 152.6 158.6
107.5 107.8 105.5 97.6
111.4
114.9 120.0 110.6 108.8 106.1
130.0 132.3
Jamaica
140.2 146.8 131.9 113.0 132.8
St Kitts and Nevis
105.2 105.0 107.6 100.5 100.8
109.6 107.6 111.8 100.9 111.6
149.7 151.5
211.8 227.2 187.7 168.1 219.4
114.2 113.7
170.5 166.9
375.5 403.3 375.6 308.8 388.6
117.4 119.1
215.2 211.5
458.5 490.0
(continued on next page)
130 StBa/Eurostat
Caribbean ACP countries, 1995
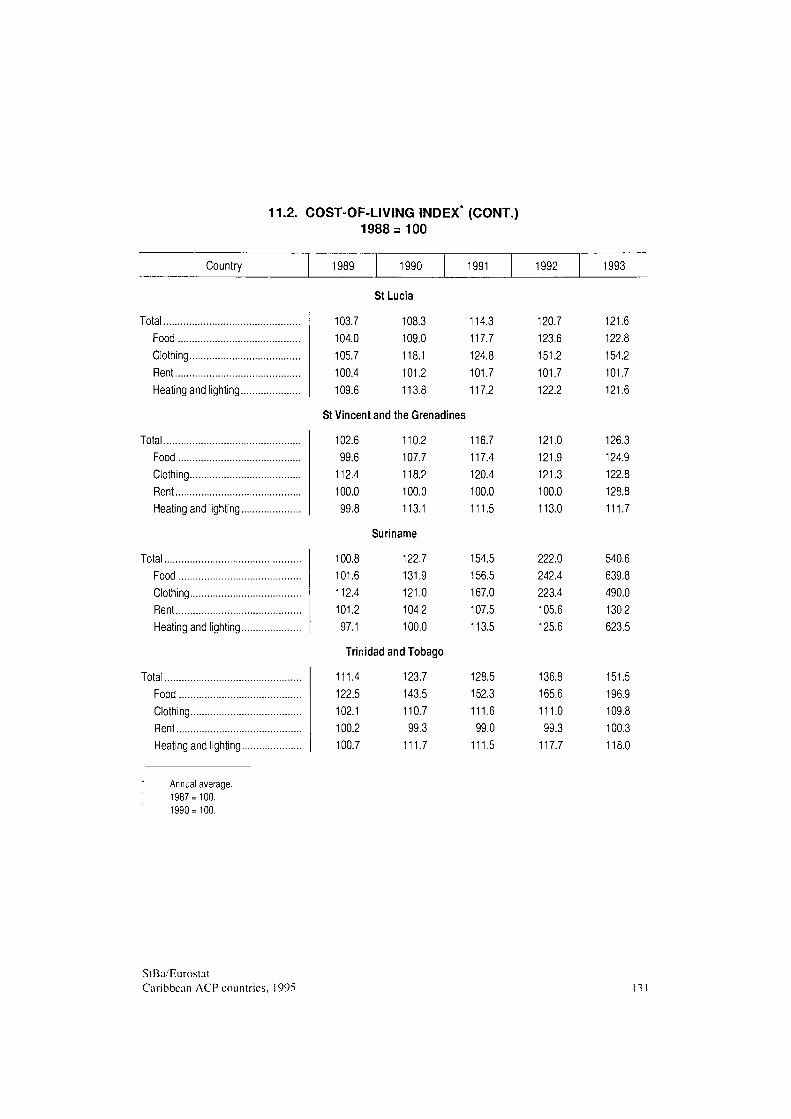
11.2. COST-OF-LIVING INDEX (CONT.) 1988 = 100
Country 1989 1990 1991 1992 1993
Total Food Clothing
Rent Heating and lighting..
Total Food Clothing Rent Heating and lighting.
Total Food Clothing Rent Heating and lighting.
Total Food Clothing Rent Heating and lighting.
Annual average. 1987=100. 1990 = 100.
St Lucia
103.7 104.0 105.7 100.4 109.6
108.3 109.0 118.1 101.2 113.8
St Vincent and the Grenadines
102.6 99.6
112.4 100.0 99.8
100.8 101.6 112.4 101.2 97.1
110.2 107.7 118.2 100.0 113.1
Suriname
122.7 131.9 121.0 104.2 100.0
Trinidad and Tobago
111.4 122.5 102.1 100.2 100.7
123.7 143.5 110.7 99.3
111.7
114.3 117.7 124.8 101.7 117.2
116.7 117.4 120.4 100.0 111.5
154.5 156.5 167.0 107.5 113.5
128.5 152.3 111.6 99.0
111.5
120.7 123.6 151.2 101.7 122.2
121.0 121.9 121.3 100.0 113.0
222.0 242.4 223.4 105.6 125.6
136.8 165.6 111.0 99.3
117.7
121.6 122.8 154.2 101.7 121.6
126.3 124.9 122.8 128.8 111.7
540.6 639.8 490.0 130.2 623.5
151.5 196.9 109.8 100.3 118.0
StBa/Eurostat Caribbean ACP countries, i 995 131
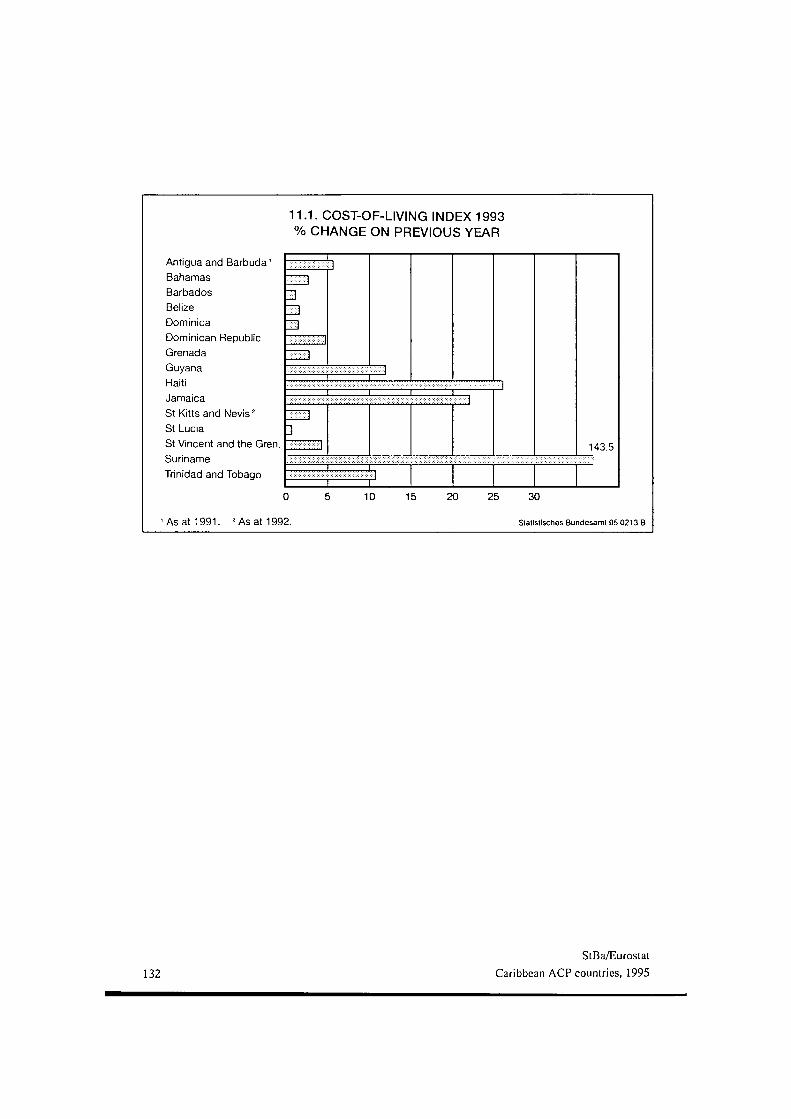
11.1. COST-OF-LIVING INDEX 1993 % CHANGE ON PREVIOUS YEAR
Antigua and Barbuda ' Bahamas Barbados Belize Dominica Dominican Republic Grenada Guyana Haiti Jamaica St Kitts and Nevis2
St Lucia St Vincent and the Gren. Suriname Trinidad and Tobago
3 Zi Ξ]
143.5
10 15 20 25 30
'As at 1991. zAsat1992. Statistisches Bundesami 95 0213 Β
132
StBa/Eurostat Caribbean ACP countries, 1995
1 2 . T H E B A L A N C E OF P A Y M E N T S
The Caribbean region experienced a number of external shocks in the 1970s and 1980s. Of these the most important were the oil price hikes in the early 1970s, again in the late 1970s and, thirdly, with the Gulf crisis in 1989-90. But there have been other damaging terms of trade effects through sudden falls in the prices of staple exports, in particular of sugar. These adverse terms of trade effects have led to a ratcheting upwards of current balance deficits. In periods of adverse prices, deficits were allowed to expand and to a large extent private and public consumption were protected through international borrowing. When prices moved favourably, little was done to build up reserves.
One country, Trinidad and Tobago, is an oil producer and might have been expected to have benefited from the oil price shocks. Indeed there was an upsurge in investment in the oil and petro-chemicals industries after the first sharp increase in oil prices. Real GDP grew at nearly 7% a year between 1974 and 1982. However from there on till 1990 GDP fell in nearly every year. The country suffered from the phenomenon known as 'Dutch disease' in which the rise in the value of exports of a single product, in this case oil, results in a sharp rise in the real effective exchange rate (REER) and the lack of competitiveness of the rest (non-oil sector) of the economy (see Chapter 17 for a further discussion).
Between 1980 and 1987 the countries of the region were in constant balance of payments trouble. All countries were in deficit in each of those years with only the exception of Barbados in 1984 and 1985. As Table 12.1 shows the deficits have continued through 1993 without any clear improving trend. This is also the impression from the current account balances as a percentage of GDP. There seems to have been a clear improvement in the cases of Antigua and Barbuda and Trinidad and Tobago and, possibly, Jamaica. In general though it is apparent that the problem of endemic current account deficits is far from having been resolved.
The most recent data on trends in the terms of trade are not encouraging. Only certain countries supply data on trade in volume terms which are needed to compute terms of trade and, even then, the data are unreliable and they are only available after a lag. However it does appear that there was some improvement in the four years up to 1992 in the tenns of trade of Barbados, the Dominican Republic and Trinidad and Tobago, while those of Guyana, Jamaica and Suriname deteriorated. Since 1992 oil and banana prices have been generally depressed while iron ore, aluminium and sugar prices have been strong. In general the terms of trade, and with them the current account balance, should have improved for most countries other than the OECS banana exporters, Belize and Trinidad and Tobago.
StBa/Eurostat 133 Caribbean ACP countries, 1995
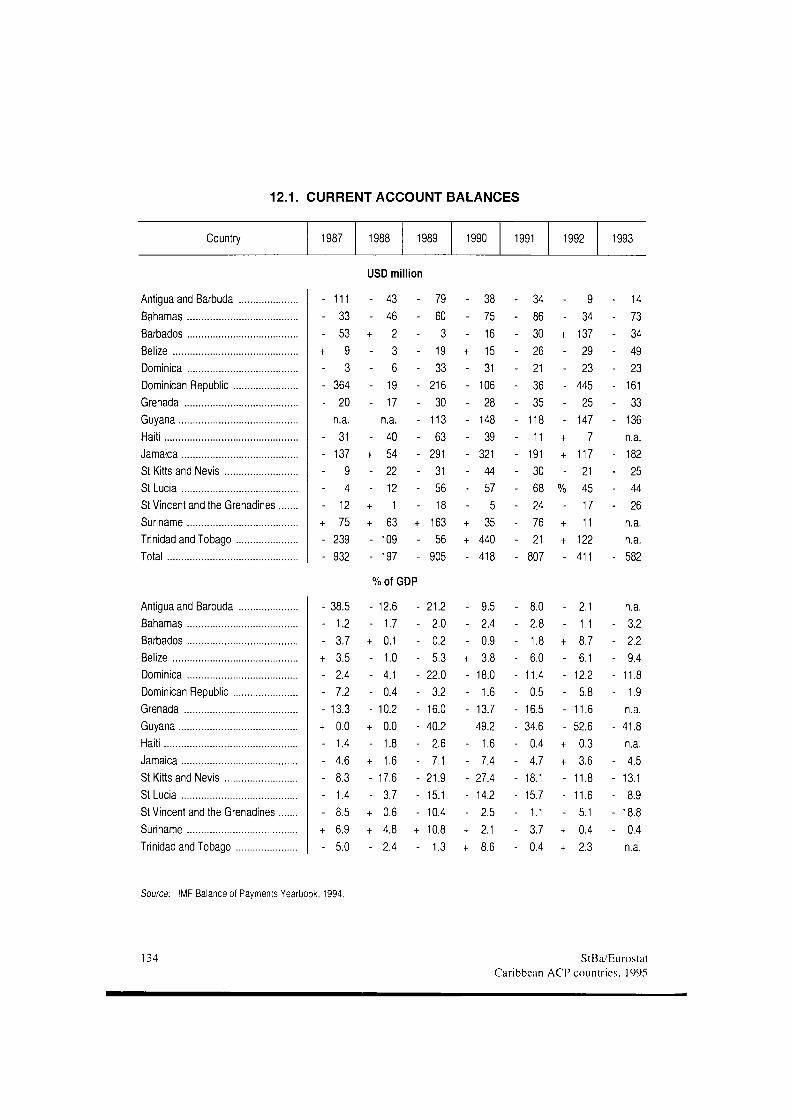
12.1. CURRENT ACCOUNT BALANCES
Country 1987 1989 1990 1991 1992 1993
Antigua and Barbuda Bahamas Barbados Belize Dominica Dominican Republic Grenada Guyana Haiti Jamaica St Kitts and Nevis St Lucia St Vincent and the Grenadines. Suriname Trinidad and Tobago Total
Antigua and Barbuda Bahamas Barbados Belize Dominica Dominican Republic Grenada Guyana Haiti Jamaica St Kitts and Nevis St Lucia St Vincent and the Grenadines . Suriname Trinidad and Tobago
- 111 - 33 - 53 + 9 - 3 - 364 - 20
n.a. - 31 - 137 - 9 - 4 - 12 + 75 - 239 - 932
- 38.5 - 1.2 - 3.7 + 3.5 - 2.4 - 7.2 - 13.3 + 0.0 - 1.4 - 4.6 - 8.3 - 1.4 - 8.5 + 6.9 - 5.0
USD million --+ ----
-+ --+ + --
43 46 2 3 6 19 17
n.a. 40 54 22 12 1 63 109 197
-------------+ --
% of GDP --+ ----+ -+ --+ + -
12.6 1.7 0.1 1.0 4.1 0.4 10.2 0.0 1.8 1.6
17.6 3.7 0.6 4.8 2.4
-------------+ -
79 60 3 19 33 216 30 113 63 291 31 56 18 163 56 905
21.2 2.0 0.2 5.3
22.0 3.2 16.0 40.2 2.6 7.1
21.9 15.1 10.4 10.8 1.3
---+ ---------+ + -
---+ ---------+ +
38 75 16 15 31 106 28 148 39 321 44 57 5 35 440 418
9.5 2.4 0.9 3.8 18.0 1.6
13.7 49.2 1.6 7.4
27.4 14.2 2.5 2.1 8.6
- 34 - 86 - 30 - 26 - 21 - 36 - 35 - 118 - 11 - 191 - 30 - 68 - 24 - 76 - 21 - 807
- 8.0 - 2.8 - 1.8 - 6.0 - 11.4 - 0.5 - 16.5 - 34.6 - 0.4 - 4.7 - 18.1 - 15.7 - 1.1 - 3.7 - 0.4
--+ -----+ + -% -+ + -
--+ -----+ + ---+ +
9 34 137 29 23 445 25 147 7
117 21 45 17 11 122 411
2.1 1.1 8.7 6.1 12.2 5.8 11.6 52.6 0.3 3.6 11.8 11.6 5.1 0.4 2.3
- 14 - 73 - 34 - 49 - 23 - 161 - 33 - 136
n.a. - 182 - 25 - 44 - 26
n.a. n.a.
- 582
n.a. - 3.2 - 2.2 - 9.4 - 11.8 - 1.9
n.a. - 41.8
n.a. - 4.5 - 13.1 - 8.9 - 18.8 - 0.4
n.a.
Source: IMF Balance of Payments Yearbook. 1994.
134 StBa/Eurostat Caribbean ACP countries, 1995
Table 12.2 gives an indication of the relative contributions of merchandise trade and tourism -which accounts for the bulk of receipts on the travel account - in current receipts. The OECS states who all depend very largely on tourism have been lumped together. It is clear that tourism is of growing importance to the balance of payments for Belize, the Dominican Republic and Jamaica, though in the first case it still remains relatively minor. Comparable data are not available for Guyana, but, like its neighbour, Suriname, has little in the way of a tourist industry (though efforts are being made in Guyana to develop eco-tourism). Tourism has been depressed in recent years by the recession in the United States, and, to a lesser extent, in Europe. With recovery in those areas the data for subsequent years should show the share of tourism pick up, though there are particular problems in certain countries. Antigua and Barbuda, for example, is in danger of pricing itself out as a tourist destination. Lack of investment to improve facilities and environmental degradation are creating difficulties in some countries.
The difference between receipts from exports of goods and services and total current receipts is mainly filled by remittances. Some 2Vi million people of Caribbean origin are now resident in North America and Europe. The current account gains from transfers to their families who remain in the Caribbean. It also benefits from pension rights accrued abroad by workers who have returned to their home countries. Remittances have doubled over the last decade. True, unlike foreign direct investment, this income is mainly spent on consumption rather than investment (though it must release some other income for investment). But as regards plugging the gap in the balance of trade in goods and services it is of much greater importance.
Foreign direct investment will be discussed in Chapter 14. While it appears in the capital account rather than the current account, it is useful to show FDI in relation to total current receipts in order to show its contribution to the overall balance of payments in relation to merchandise trade and tourism. The table reveals that only among the OECS countries and Barbados FDI has made a large direct contribution to the balance of payments, though it has played a significant, if unpredictable, role in Belize, the Dominican Republic, Jamaica and Trinidad and Tobago.
The large current account deficits have been primarily financed by development assistance, bilateral and multilateral grants and loans', commercial borrowing and, in some cases, "exceptional financing", which includes arrears, debt rescheduling and write-offs. As we shall sec in Chapter 15 the role of development assistance has been declining. Debt issues will be taken up in Chapter 16.
Net borrowing from the commercial banking system reached a peak of USD 310 million in 1986. There was a small negative figure for 1987 and it rose again to USD 280 million in 1988. Since 1988 net commercial borrowing has been negative. This mainly reflects the much
"In order to qualify as development assistance, a loan should contain a grant element of 25 %, for example in the form of an interest bonus and//or deferred payment. "
StBa/Eurostat 135 Caribbean ACP countries. 1995
more stringent policies of the commercial banks in their lending to developing countries in general. But some of the Caribbean countries themselves ran into debt servicing problems -and arrears - and have sought rescheduling of their commercial debt. This will be further discussed in Chapter 17. Lack of creditworthiness on the international capital markets remains a problem for Grenada, Guyana, Haiti and Suriname.
12.2. SHARES OF MERCHANDISE EXPORTS, EXPORTS OF TRAVEL SERVICES IN CURRENT RECEIPTS AND THE RATIO OF FOREIGN DIRECT INVESTMENT
TO CURRENT RECEIPTS %
Survey item 1987 1988 1989 1990 1991 1992 1993
Bahamas exports of goods exports of travel services . FDI net inflows
Barbados exports of goods exports of travel services . FDI net inflows
Belize exports of goods exports of travel services . FDI net inflows
Dominican Republic exports of goods exports of travel services . FDI net inflows
Haiti exports of goods exports of travel services . FDI net inflows
Jamaica exports of goods exports of travel services . FDI net inflows
18.9 78.7 0.8
22.4 65.1 31.3
62.8 11.6 4.3
44.9 34.4 5.4
39.4 16.9 0.9
47.2 39.6 -0.7
18.7 79.1 2.6
21.2 67.3 51.9
65.4 12.1 7.7
44.0 38.0 5.2
35.1 14.4 1.9
52.1 31.0 2.9
1.9 97.8 0.2 -
19.3 69.3 41.5
62.0 14.5 9.5
43.2 38.3 5.1
32.1 15.2 2.0
51.3 30.4 6.3
18.4 79.2 1.0
20.5 67.9 53.6
60.0 17.7 7.9
35.1 43.0 6.4
34.6 14.3 1.7
52.5 33.6 5.9
2.6 97.0 0.0
20.8 66.6 38.4
59.4 21.2 7.1
32.8 43.7 7.2
29.9 12.1 2.6
53.0 35.4 4.0
19.5 77.7 0.4
22.0 64.7 63.5
58.0 24.7 7.4
27.1 49.4 8.7
n.a. n.a. n.a.
48.1 40.3 6.5
16.6 82.5 -1.5
14.6 73.9 n.a.
54.8 28.6 4.6
22.9 55.0 8.2
n.a. n.a. n.a.
48.8 44.4
n.a.
(((tntinued on next page)
136 StBa/Eurostat Caribbean ACP countries. 1995
12.2. SHARES OF MERCHANDISE EXPORTS, EXPORTS OF TRAVEL SERVICES IN CURRENT RECEIPTS AND THE RATIO OF FOREIGN DIRECT
INVESTMENT TO CURRENT RECEIPTS (CONT.) (%)
Survey item 1987 1988 1989 1990 1991 1992 1993
Suriname exports of goods exports of travel services . FDI net inflows
Trinidad and Tobago exports of goods exports of travel services . FDI net inflows
OECS exports of goods exports of travel services . FDI net inflows
96.6 1.1
20.8
92.1 6.2 2.2
33.4 45.9 13.0
94.7 1.6
-25.4
92.7 5.9 4.0
34.7 48.3 9.8
99.5 0.1
-3.1
92.6 5.1 9.0
32.0 51.2 14.0
98.5 0.2
-9.1
93.1 4.6 5.2
31.4 53.1 16.9
93.5 0.3 2.7
91.2 5.4 8.8
27.9 55.4 16.2
88.8 0.5
-7.8
92.2 5.7 9.1
n.a. n.a. n.a.
n.a n.a n.a
n.a n.a n.a
n.a n.a n.a
Source: As Table 12.1.
Over the last two years Trinidad and Tobago has successfully completed an issue of international bonds. That however remains a category of external finance out of range for most of the countries of the Caribbean.
12.3. BALANCE OF PAYMENTS USD million
Survey item 1987 1989 1990 1991 1992 1993
Antigua and Barbuda Current account... of which
goods transfers
Long-term capital . Short-term capital
Overall balance
111 43 79 38 - 34
- 202 + 15 + 84 - 8 - 20
+ + --
184 -12 + 29 + 4 + 18 -
226 -15 + 28 + 8 -39 -
212 -11 + 16 + 1 -
47 -
218 -9 29 -24 + 34 -
206 -7 + 4 -8 + 19 -
247 6 9 11 12
(continued on next page)
StBa/Eurostat Caribbean ACP countries. 1995
137
12.3. BALANCE OF PAYMENTS (CONT.) USD million
Survey item 1987 1990 1991 1992 1993
Bahamas Current account... of which
goods transfers
Long-term capital. Short-term capital
Overall balance Barbados
Current account... of which
goods transfers
Long-term capital. Short-term capital
Overall balance Belize
Current account... of which
goods transfers
Long-term capital . Short-term capital
Overall balance Dominica
Current account... of which
goods transfers
Long-term capital. Short-term capital
Overall balance
33 46 60 75 86 34
15 26 29
33 31 21 23
73
- 725 + 16 - 27 - 7 + 13
- 53
- 327 + 40 + 70 + 31 + 6
--+ + +
+
-+ + + +
712 3 34 8 0
2
373 16 31 10 38
--+ -+
-
-+ + --
878 11 50 27 22
3
452 21 1 1 42
-+ + -+
-
--+ + -
882 4 24 7 12
16
472 73 31 14 3
-+ + + +
-
---+ -
726 17 165 8 23
30
474 54 4 3 40
-+ + -+
+
-+ --+
759 20 51 3 23
137
307 40 19 81 28
---+ +
-
--+
-
824 17 4 5 33
34
417 7.1 19
n.a. 9
49
- 24 + 2 + 7 - 5 + 12
-+ + + +
42 26 24 4 22
-+ + -+
65 30 30 4 16
-+ + -+
59 31 29 4 15
-+ + --
98 28 26 3 16
-+ + -+
104 31 25 2 0
- 119 + 28 + 35
2 - 14
23
- 10 - 4 + 20 - 11 + 8
-+ + --
20 19 14 8 1
+ + + + +
48 21 24 8 0
-+ + + +
48 21 19 11 5
-+ + + +
40 23 23 3 4
-+ + + +
43 18 24 1 3
-+ + + +
51 21 11 6 1
(continuei! on next page)
138 StBa/Eurostat Caribbean ACP countries, 1995
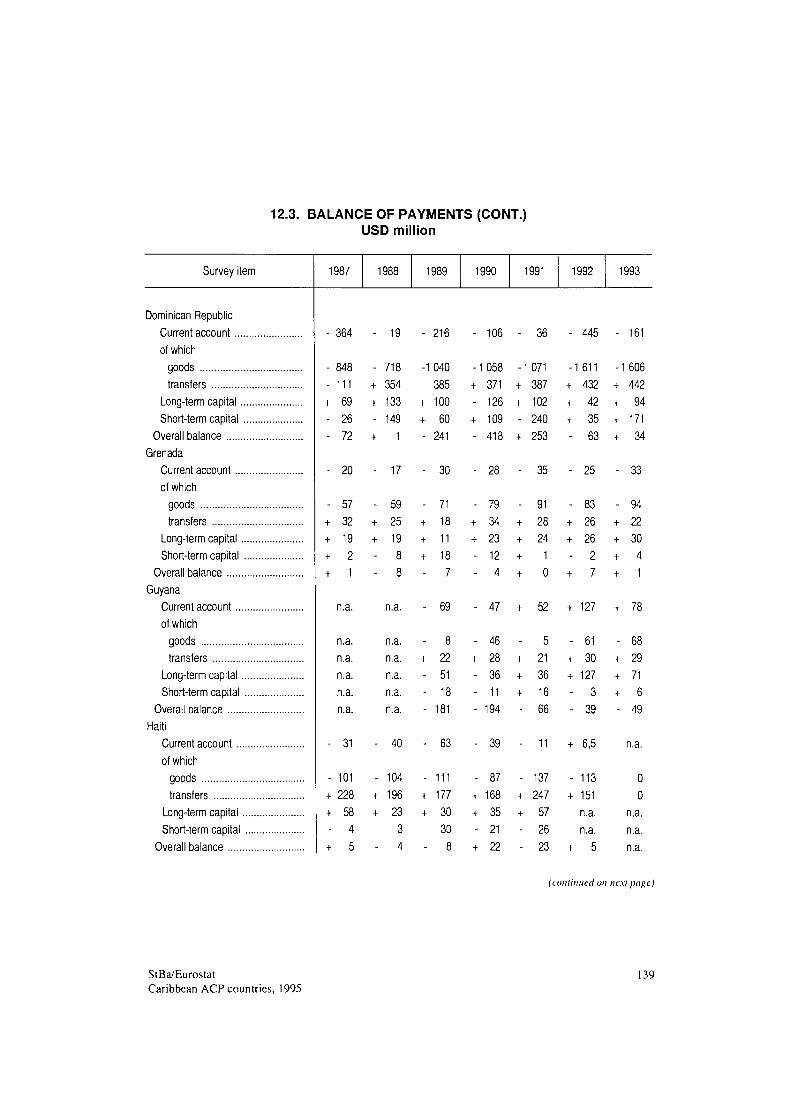
12.3. BALANCE OF PAYMENTS (CONT.) USD million
Survey item 1987 1988 1989 1990 1991 1992 1993
Dominican Republic Current account.... of which
goods transfers
Long-term capital.. Short-term capital .
Overall balance Grenada
Current account.... of which
goods transfers
Long-term capital. Short-term capital
Overall balance Guyana
Current account... of which
goods transfers
Long-term capital. Short-term capital
Overall balance Haiti
Current account... of which
goods transfers
Long-term capital. Short-term capital
Overall balance
- 364
- 848 - 111 + 69 - 26 - 72
- 19
- 718 + 354 + 133 - 149 + 1
- 216
-1040 385
+ 100 + 60 - 241
20
n.a.
- 106 36 445
17 30 28 35 25
- 57 + 32 + 19 + 2 + 1
- 59 + 25 + 19 - 8 - 8
- 71 + 18 + 11 + 18 - 7
n.a.
161
-1 058 -1 071 -1 611 -1 606 + 371 + 387 + 432 + 442 - 126 + 102 + 4 2 + 94 + 109 - 240 + 35 + 171 - 418 + 253 - 6 3 + 34
33
- 79 - 91 - 83 - 94 + 34 + 28 + 2 6 + 2 2 + 23 + 24 + 2 6 + 3 0 - 12 + 1 - 2 + 4 - 4 + 0 + 7 + 1
- 4 7 + 52 + 127 + 78
n.a. n.a. n.a. n.a. n.a.
- 31
- 101 + 228 + 58 - 4 + 5
n.a. n.a. n.a. n.a. n.a.
- 40
- 104 + 196 + 23
3 - 4
-τ
---
-
-+ +
-
8 22 51 18 181
63
111 177 30 30 8
-+ ---
-
-+ + -+
46 28 36 11 194
39
87 168 35 21 22
-+ + + -
-
-+ + --
5 21 36 16 66
11
137 247 57 26 23
-+ + --
+
-+
+
61 30 127 3 39
6,5
113 151 n.a. n.a. 5
- 68 + 29 + 71 + 6 - 49
n.a.
0 0
n.a. n.a. n.a.
(continued on next page)
StBa/Eurostat Caribbean ACP countries, 1995
139
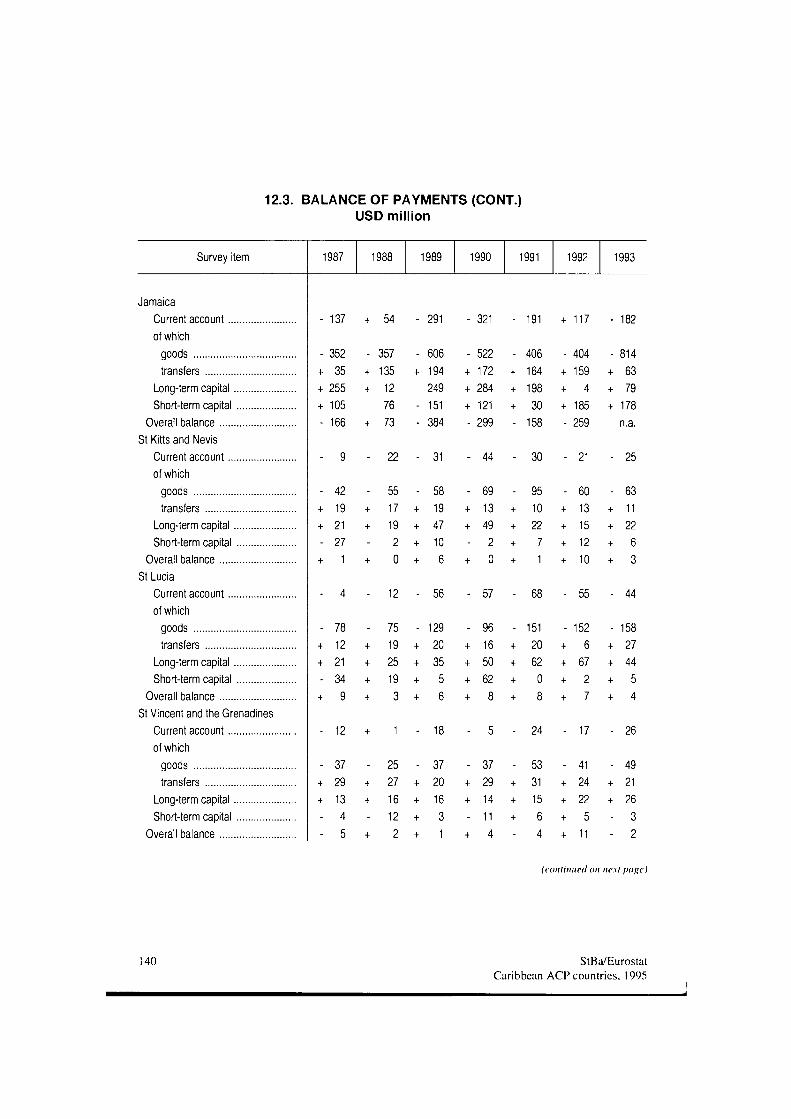
12.3. BALANCE OF PAYMENTS (CONT.) USD million
Survey item 1987 1988 1989 1990 1991 1992 1993
Jamaica Current account of which
goods transfers
Long-term capital Short-term capital
Overall balance St Kitts and Nevis
Current account of which
goods transfers
Long-term capital Short-term capital
Overall balance St Lucia
Current account of which
goods transfers
Long-term capital Short-term capital
Overall balance St Vincent and the Grenadines
Current account of which
goods transfers
Long-term capital Short-term capital
Overall balance
- 137 + 54 - 291
12
- 321 191
- 352 + 35 + 255 + 105 - 166
- 357 + 135 + 12
76 + 73
- 606 + 194 249
- 151 - 384
22 31 44 30 21
12 56 57 68 55
24 17
- 37 + 29 + 13 - 4 - 5
-+ + -+
25 27 16 12 2
- 37 + 20 + 16 + 3 + 1
182
- 522 - 406 - 404 - 814 + 172 + 164 + 159 + 63 + 284 + 1 9 8 + 4 + 7 9 + 121 + 30 + 185 + 178 - 299 - 158 - 259 n.a.
25
- 42 + 19 + 21 - 27 + 1
-+ + -+
55 17 19 2 0
-+ + + +
58 19 47 10 6
- 69 + 13 + 49 - 2 + 0
-+ + + +
95 10 22 7 1
- 60 + 13 + 15 + 12 + 10
- 63 + 11 + 22 + 6 + 3
44
- 78 + 12 + 21 - 34 + 9
-+ + + +
75 19 25 19 3
- 129 + 20 + 35 + 5 + 6
- 96 + 16 + 50 + 62 + 8
-+ + + +
151 20 62 0 8
- 152 + 6 + 67 + 2 + 7
- 158 + 27 + 44 + 5 + 4
26
- 37 - 53 - 41 - 49 + 29 + 31 + 2 4 + 2 1 + 14 + 1 5 + 2 2 + 2 6 - 11 + 6 + 5 - 3 + 4 - 4 + 1 1 - 2
(continued on next page)
140 StBa/Eurostat Caribbean ACP countries, 1995
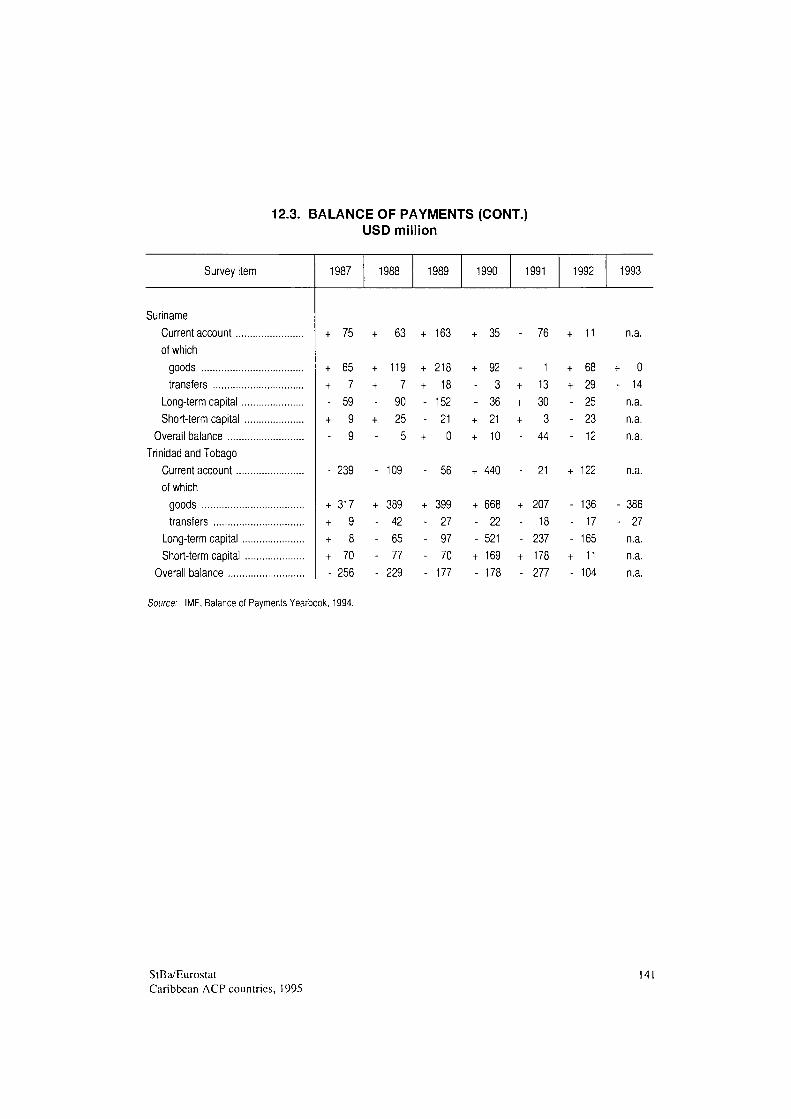
12.3. BALANCE OF PAYMENTS (CONT.) USD million
Survey item 1987 1989 1990 1991 1992 1993
Suriname Current account... of which
goods transfers
Long-term capital . Short-term capital
Overall balance Trinidad and Tobago
Current account... of which
goods transfers
Long-term capital. Short-term capital
Overall balance
+ 75 63 + 163 + 35 76 + 11 n.a.
+ 65 + 7 - 59 + 9 - 9
- 239
+ 317 + 9 + 8 + 70 - 256
+ + -+ -
-
+ ----
119 7 90 25 5
109
389 42 65 77 229
+ + --+
-
+ ----
218 18 152 21 0
56
399 27 97 70 177
+ --+ +
+
+ --+ -
92 3 36 21 10
440
668 22 521 169 178
-+ + + -
-
+ --+ -
1 13 30 3 44
21
207 18 237 178 277
+ + ---
+
---+ -
68 29 25 23 12
122
136 17 165 11 104
+ 0 - 14
n.a. n.a. n.a.
n.a.
- 386 - 27
n.a. n.a. n.a.
Source: IMF, Balance of Payments Yearbook, 1994.
StBa/Eurostat Caribbean ACP countries, 1995
141
1 3 . F O R E I G N T R A D E
Table 13.1 gives the destination of exports from individual ACP Caribbean countries using the most recent available data. For the region as a whole 76% of exports went to the OECD countries, with almost a half going to the United States. However the table also points to the marked dispersion in the Caribbean countries' export patterns. The share going to the OECD countries varies from 98.7% in the case of Haiti to 42.5% for Barbados - though in the latter case a high proportion is of unspecified destination. The share of exports going to developing countries varies from 46.7% in the case of Dominica to 1.3% for Haiti, with a regional average of about a fifth. Most ofthat goes to the Western hemisphere, i.e. Latin America and other countries in the Caribbean.
The European export share varied from 1.2% for the Antigua and Barbuda and 5.3% for Trinidad and Tobago to 50.0% for St Vincent and the Grenadines. These discrepancies largely have their source in special trade arrangements, ranging from protected markets in the European Union for sugar and bananas from traditional suppliers to investment in free export zones to take advantage of the special US tariff regime for the sewing of clothes from US-formed and cut textiles. For a number of ACP Caribbean countries, one or more of these régimes is of particular importance - and they will all to some extent be affected by the Uruguay Round of Multilateral Trade Negotiations (UR) agreement or NAFTA.
The data on intra-Caricom trade is based on data from the Caricom Secretariat. They show that the shares of exports going to other Caricom countries remain small, except for the small island economies. Improving access to the regional market was, of course, the justification for Caricom. The role of the customs union can to some extent be judged by the growth of intra-union trade, though tariff-free trade among member states is not yet fully realised. Caricom data show that the share of intra-union exports in total domestic exports has fallen from 12.2% in 1985 to 9.9% in 1990. For Barbados it rose from 14.2% to 41.7%. For the member states of the OECS it fell from 41.2% to 23.1%. In particular for St Vincent and the Grenadines it fell from 61.7% to 33.6%. For Jamaica it fell slightly - from 7.5% to 6.3%. Again the shares of intra-union trade reflect the importance of special preferential arrangements with the developed market economies (DMEs) and the evolution of these arrangements. However they also reflect a series of economic crises followed by cutbacks in imports among the larger Caricom states. For example, Trinidad and Tobago as a market for exports from Barbados, Belize and, in particular, Guyana has shrunk dramatically.
142 StBa/Eurostat Caribbean ACP countries, 1995
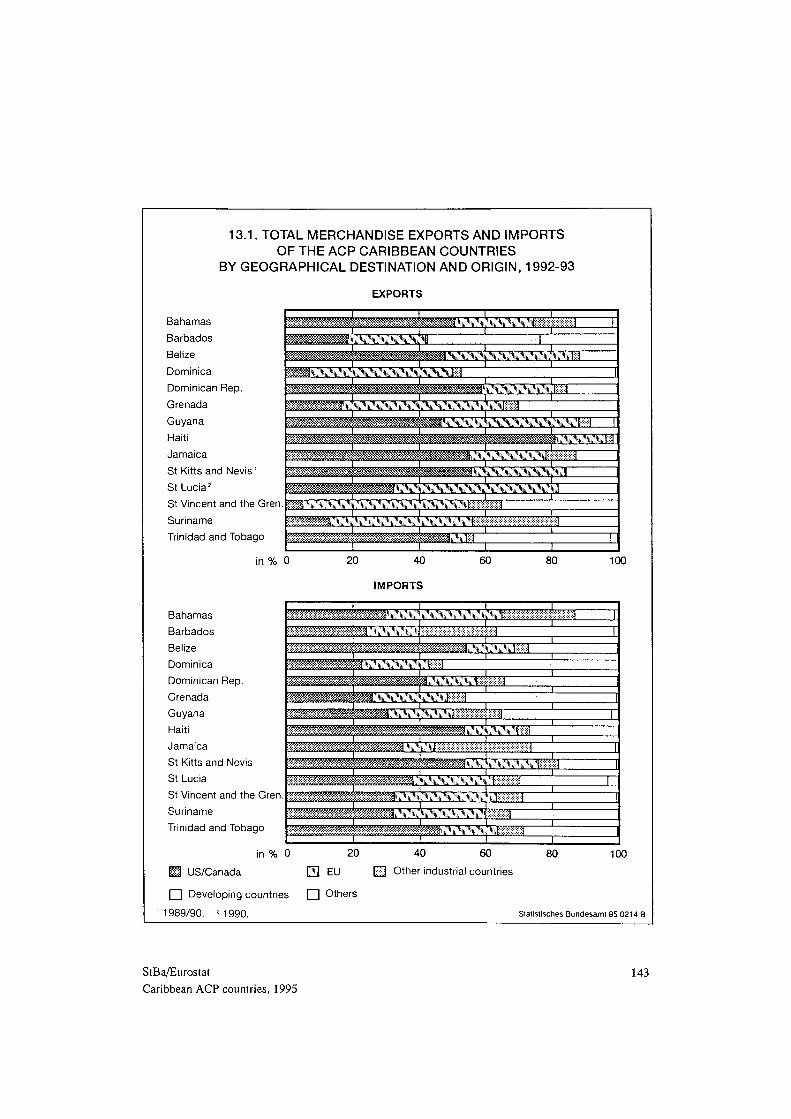
13.1. TOTAL MERCHANDISE EXPORTS AND IMPORTS
OF THE ACP CARIBBEAN COUNTRIES
BY GEOGRAPHICAL DESTINATION AND ORIGIN, 199293
Bahamas
Barbados
Belize
Dominica
Dominican Rep.
Grenada
Guyana
Haiti
Jamaica
St Kitts and Nevis '
St Lucia2
St Vincent and the G r e n . ^ „ \ ; S S
Suriname
EXPORTS
m^^^mmmBmmmaai j. v v \ \ . \ \ \ \ \ V v
M : SSSSSSSSSSSSM
■maa iv SSS \\\\s\ : SSM S ^ ^ S ^ ^ ^ ^ S ^ ^ ^ S S S ^ ^ *
M<**™mm»&<«*m*ifi~;-m^<m
SSSSSSSSSSSSSM:
imËMËmémMMmmâmMMm:\x:. SSSSM ESS S I
wiESiS$lilSii$$MSSSS&Sl$l$$$iSS$lS$^få^8få8
Trinidad and Tobago Z^M&
i n % 0
¡saasæsæsaa''ii, ■%,/%,
SSS : S ÌSS
■w*<ww.w>«o«»u«A»a«wai n. nn 'ii n, u ■■■■■■■·■·■■■■■■■■■■.■
I ^ ^ ^ ^ M W S S ; y g r
; \ y y y x v \,\.\: ::\,\r~
— ι . SSS :\:\;V'>;VWCT
.... % S mmm
100
Suriname
Trinidad and Tobago
i ' i^ i j^^ iaia s Λ,\\\: " : Siü í'WÍMÍAWíí'yAH^AVw'íJ % Χ Χ \ \l·------
i&tiiiiiiitïMMiiï&iiiiii, χ Hi, 'ii, lit, 'ψα X mmsL\s¿ s m
Bahamas
Barbados
Belize
Dominica
Dominican Rep.
Grenada
Guyana
Haiti
Jamaica
St Kitts and Nevis
St Lucia
St Vincent and the Gren. ΜΜΜΜΜΐ8Μ8Μ\! V \ X X V X l i i i
mmmm\ s \\mf -wm®.\. ; .; \S:immr
'WMMMmmmmcK. , :v \v " mm WM^MmßMMMM8mM<\\S' 'S u m
in % 0 20 40 60
M US/Canada CS EU ü Other industrial countries
I I Developing countries □ Others
1989/90. 2
1990.
80 100
Statistisches Bundesamt 95 0214 Β
StBa/Eurostat
Caribbean ACP countries, 1995
143
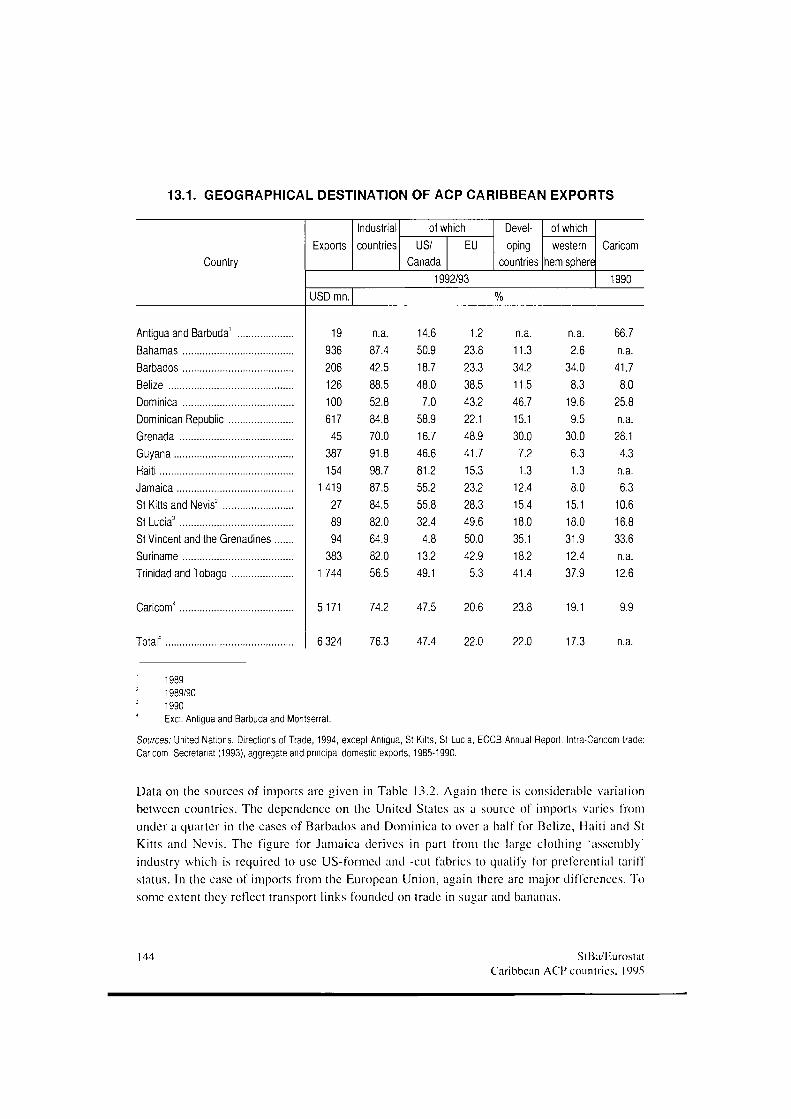
13.1. GEOGRAPHICAL DESTINATION OF ACP CARIBBEAN EXPORTS
Country Exports
Industrial countries
of which US/
Canada EU
Developing
countries
of which western
hemisphere 1992/93
USD mn.
Caricom
1990
Antigua and Barbuda' Bahamas Barbados Belize Dominica Dominican Republic Grenada Guyana Haiti Jamaica St Kitts and Nevis2
St Lucia3
St Vincent and the Grenadines . Suriname Trinidad and Tobago
Caricom'
Total'
19 936 206 126 100 617 45
387 154
1419 27 89 94
383 1744
5171
6 324
n.a. 87.4 42.5 88.5 52.8 84.8 70.0 91.8 98.7 87.5 84.5 82.0 64.9 82.0 56.5
74.2
76.3
14.6 50.9 18.7 48.0
7.0 58.9 16.7 46.6 81.2 55.2 55.8 32.4
4.8 13.2 49.1
47.5
47.4
1.2 23.8 23.3 38.5 43.2 22.1 48.9 41.7 15.3 23.2 28.3 49.6 50.0 42.9
5.3
20.6
22.0
n.a. 11.3 34.2 11.5 46.7 15.1 30.0 7.2 1.3
12.4 15.4 18.0 35.1 18.2 41.4
23.8
22.0
n.a. 2.6
34.0 8.3
19.6 9.5
30.0 6.3 1.3 8.0
15.1 18.0 31.9 12.4 37.9
19.1
17.3
66.7 n.a. 41.7 8.0
25.8 n.a. 28.1 4.3 n.a. 6.3
10.6 16.8 33.6 n.a. 12.6
9.9
n.a.
1989 1989/90 1990 Excl. Antigua and Barbuda and Montserrat.
Sources: United Nations, Directions of Trade, 1994, except Antigua, St Kitts, St Lucia, ECCB Annual Report. Intra-Caricom trade: Caricom Secretariat (1993), aggregate and principal domestic exports, 1985-1990.
Data on the sources of imports arc given in Table 13.2. Again there is considerable variation between countries. The dependence on the United States as a source of imports varies from under a quarter in the cases of Barbados and Dominica to over a half for Belize, Haiti and St Kitts and Nevis. The figure for Jamaica derives in part from the large clothing 'assembly' industry which is required to use US-formed and -cut fabrics to qualify for preferential tariff status. In the case of imports from the European Union, again there are major differences. To some extent they reflect transport links founded on trade in sugar and bananas.
144 StBa/Eurostat Caribbean ACP countries, 1995
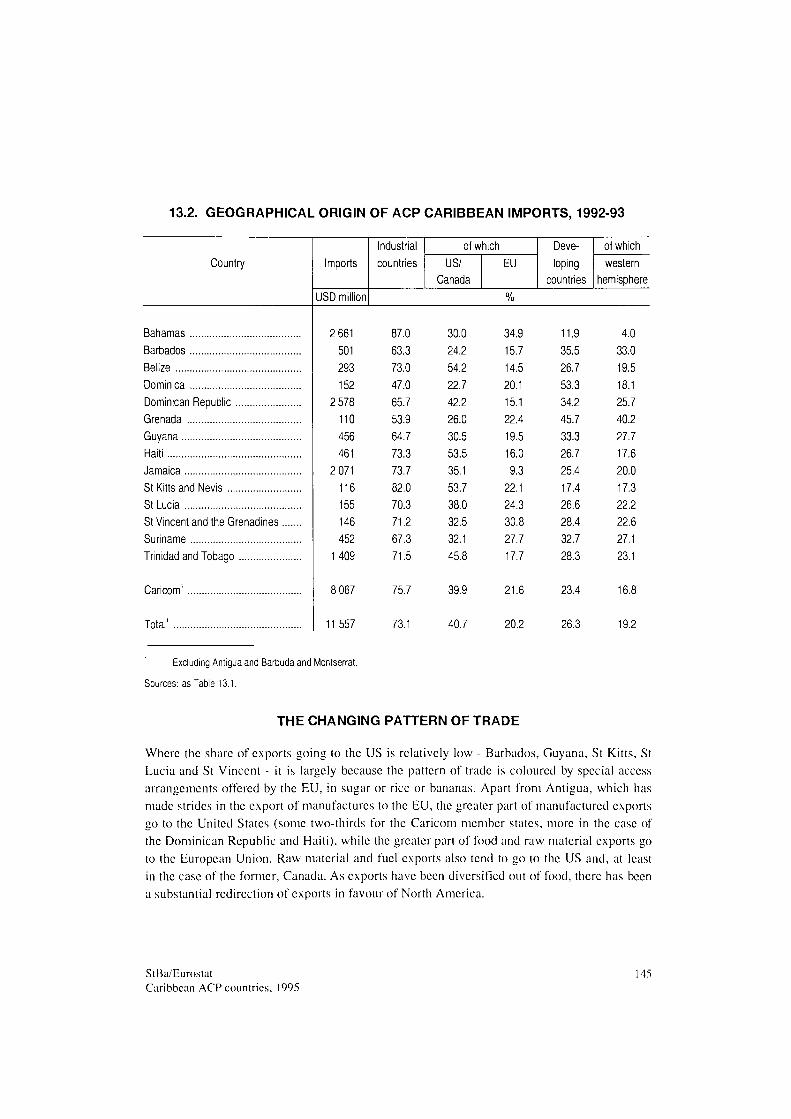
13.2. GEOGRAPHICAL ORIGIN OF ACP CARIBBEAN IMPORTS, 1992-93
Country Imports
USD million
Industrial countries
of which US/
Canada EU
Developing
countries
of which western
hemisphere
%
Bahamas Barbados Belize Dominica Dominican Republic Grenada Guyana Haiti Jamaica St Kitts and Nevis St Lucia St Vincent and the Grenadines . Suriname Trinidad and Tobago
Caricom'
Total'
2 661 501 293 152
2 578 110 456 461
2 071 116 155 146 452
1409
8 067
11557
87.0 63.3 73.0 47.0 65.7 53.9 64.7 73.3 73.7 82.0 70.3 71.2 67.3 71.5
75.7
73.1
30.0 24.2 54.2 22.7 42.2 26.0 30.5 53.5 35.1 53.7 38.0 32.5 32.1 45.8
39.9
40.7
34.9 15.7 14.5 20.1 15.1 22.4 19.5 16.0 9.3
22.1 24.3 30.8 27.7 17.7
21.6
20.2
11.9 35.5 26.7 53.3 34.2 45.7 33.3 26.7 25.4 17.4 26.6 28.4 32.7 28.3
23.4
26.3
4.0 33.0 19.5 18.1 25.7 40.2 27.7 17.6 20.0 17.3 22.2 22.6 27.1 23.1
16.8
19.2
Excluding Antigua and Barbuda and Montserrat.
Sources: as Table 13.1.
THE CHANGING PATTERN OF TRADE Where the share of exports going to the US is relatively low - Barbados, Guyana, St Kitts, St Lucia and St Vincent - it is largely because the pattern of trade is coloured by special access arrangements offered by the EU, in sugar or rice or bananas. Apart from Antigua, which has made strides in the export of manufactures to the EU, the greater part of manufactured exports go to the United States (some two-thirds for the Caricom member states, more in the case of the Dominican Republic and Haiti), while the greater part of food and raw material exports go to the European Union. Raw material and fuel exports also tend to go to the US and, at least in the case of the former, Canada. As exports have been diversified out of food, there has been a substantial redirection of exports in favour of North America.
StBa/Eurostat Caribbean ACP countries. 1995
145
Under the Caribbean Basin Economic Recovery Act (CBERA) of 1990, which extended the original 1983 Act, Caribbean countries enjoy tariff- and quota-free access to the US market for all goods, subject to a short but critical list of exceptions. The most important of these exceptions are most textiles and apparel, some leather goods including footwear, petroleum and petroleum products, canned tuna and certain agricultural products, though exports of most leather goods other than footwear benefit from special tariff preferences. Sugar exports are subject to US quotas which vary from year to year.
Exports benefiting from Caribbean Basin Initiative (CBI) access arc subject to rules of origin, which basically require that 35% of value added be contributed by the country in question, though this may be cumulated over CBI countries and up to 15% may take the form of imports from the United States, and that a 'substantial' transformation takes place in the CBI country, which is now interpreted as a shift in customs classification.
The main products benefiting from the CBERA are beef, pineapples, frozen concentrated orange juice, rum, ethyl alcohol and raw cane sugar. In recent years the share of manufactured goods has risen at the expense of food and raw materials. The most important of the manufactures has been apparel. The high duties on apparel explain why the US International Trade Commission (USITC) estimates of duty forgone through the CBI have risen faster than CBI imports.
The main beneficiaries of the CBERA in the ACP Caribbean arc the Dominican Republic (main export: footwear uppers, jewellery, cane sugar, medical instruments, cigars, voltage limiters etc. and rope), the Bahamas (aromatic drugs). Jamaica (ethyl alcohol), Trinidad and Tobago (iron and steel bars and rods). Out of US imports worth USD 3758 million (customs value), USD 999 million (or 27%) benefited from duty-free treatment (excluding goods that are Most Favoured Nation (MFN) duty-free or are eligible for Generalized System of Preferences (GSP) duty-free treatment.).
Normal textile and apparel items arc not included in the CBERA scheme. However the ACP Caribbean countries enjoy special preferences in respect of textile and clothing exports under HS 9802-00-60 and 9802-00-80 (previously 806.30 and 807A). Under these tariff heads, metal articles made of US metals and articles of apparel which have been made out of textiles formed and woven in the United States arc subject to duty only on the value added outside the US. Only in the case of apparel is this derogation used substantially and, in that sector, it is of strategic significance for Jamaica though Trinidad and Tobago also has a Guaranteed Access Level (GAL) agreement with the US.
Under Caribcan, the region enjoys tariff-free and quota-free entry to the Canadian market for most manufactured exports, the exclusions being similar to those currently excluded under the CBERA.
146 StBa/Eurostat Caribbean ACP countries, 1995
It is worth briefly considering the geographical distribution of exports of some of the individual Caribbean countries. Among the Caricom countries, Antigua has an above-average share of manufactures, both in total exports and in exports going to the EU. The exports of the other OECS member states and Belize are still dominated by agricultural goods with the share of food and beverages reaching 86% in Dominica's case. On the other hand, the share of food in the exports to the OECD of the Bahamas, Jamaica and Trinidad is under one quarter. Jamaica and Guyana are special cases with their exports of bauxite and bauxite products which raise the industrial raw material share to nearly 40 and 45% respectively.
But the most striking single aspect of change in the pattern of Caribbean merchandise exports over the last two decades has been the move out of food into manufactures. Table 13.3 illustrates this for the ACP Caribbean as a whole. Despite these major steps to diversification, in most Caribbean countries the share of food and raw materials in total exports to the OECD still comfortably exceeds 50%. There remains an important degree of dependence on traditional exports, sugar, rum, rice and bananas - commodities whose markets are subject to special trade régimes rather than to the vicissitudes of world markets. Among the new manufactured exports, apparel is particularly important, but here again Caribbean goods are mainly exported on special access terms to the US and the EU. In the case of Barbados in 1991-92, 54% of exports consisted of sugar industry products and clothing, with the former alone contributing 45%. In the case of Dominica, St Lucia and St Vincent, bananas dominated with 79, 73 and 58% of exports respectively. For six Caricom countries agricultural products (including fish) and clothing accounted for more than 50% of exports to the OECD, for eight countries they accounted for more than 40% of those exports. Agricultural products alone accounted for more than 50% in four cases and more than 40% in seven cases out of eleven.
The Dominican Republic's single most important export is pig iron, which accounts for over a third of the total. Sugar and apparel - it is the leading exporter of 807A products - each account for a fifth, with coffee and cocoa also important. Manufactured products now make up over 70% of total exports. In the case of Haiti manufactures are also dominant, accounting for over 80% of the total. Apparel exports to the United States are its most important source of revenues, with coffee also important. It is the world's leading exporter of baseballs. Suriname does not benefit from the CBI, and the share of its exports going to the United States is less than 20%. Its export earnings are concentrated on bauxite and bauxite products on the EU market.
StBa/Eurostat 147 Caribbean ACP countries, 1995
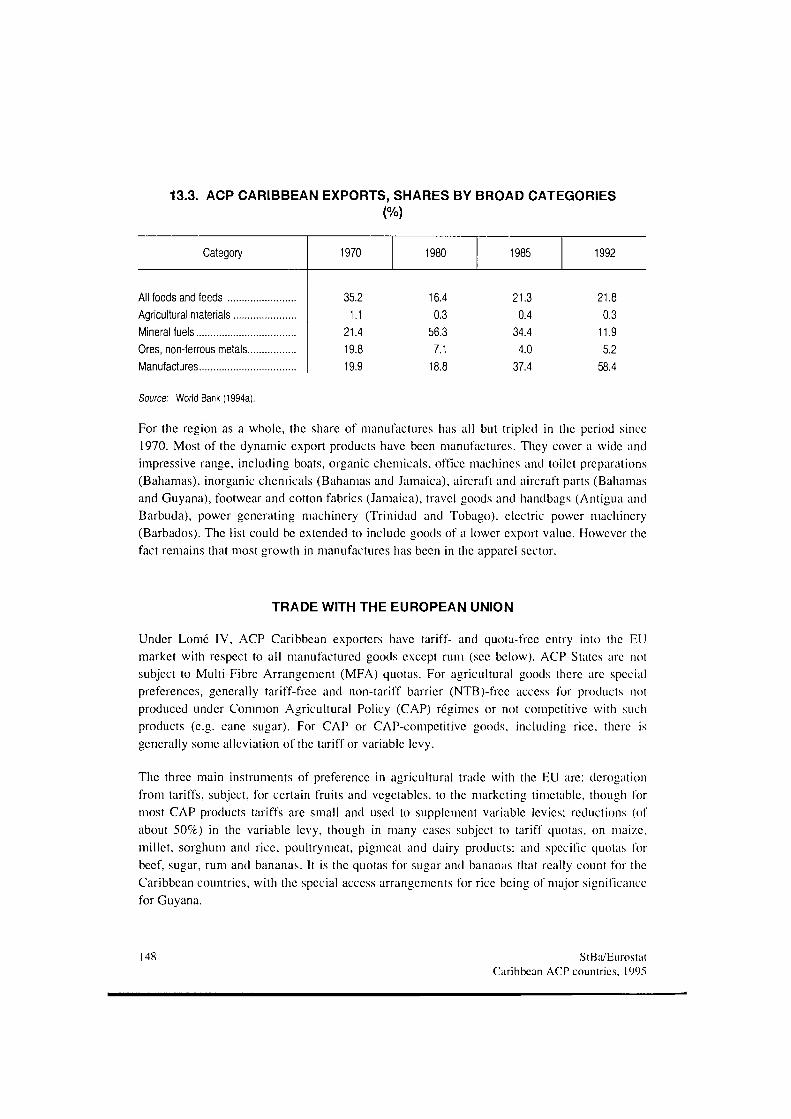
13.3. ACP CARIBBEAN EXPORTS, SHARES BY BROAD CATEGORIES (%)
Category
All foods and feeds Agricultural materials Mineral fuels Ores, non-ferrous metals Manufactures
1970
35.2 1.1
21.4 19.8 19.9
1980
16.4 0.3
56.3 7.1
18.8
1985
21.3 0.4
34.4 4.0
37.4
1992
21.8 0.3
11.9 5.2
58.4
Source: World Bank (1994a).
For the region as a whole, the share of manufactures has all but tripled in the period since 1970. Most of the dynamic export products have been manufactures. They cover a wide and impressive range, including boats, organic chemicals, office machines and toilet preparations (Bahamas), inorganic chemicals (Bahamas and Jamaica), aircraft and aircraft parts (Bahamas and Guyana), footwear and cotton fabrics (Jamaica), travel goods and handbags (Antigua and Barbuda), power generating machinery (Trinidad and Tobago), electric power machinery (Barbados). The list could be extended to include goods of a lower export value. However the fact remains that most growth in manufactures has been in the apparel sector.
TRADE WITH THE EUROPEAN UNION
Under Lomé IV, ACP Caribbean exporters have tariff- and quota-free entry into the EU market with respect to all manufactured goods except rum (see below). ACP States arc not subject to Multi-Fibre Arrangement (MFA) quotas. For agricultural goods there arc special preferences, generally tariff-free and non-tariff barrier (NTB)-frec access for products not produced under Common Agricultural Policy (CAP) régimes or not competitive with such products (e.g. cane sugar). For CAP or CAP-competitivc goods, including rice, there is generally some alleviation of the tariffor variable levy.
The three main instruments of preference in agricultural trade with the EU are: derogation from tariffs, subject, for certain fruits and vegetables, to the marketing timetable, though for most CAP products tariffs are small and used to supplement variable levies; reductions (of about 50%) in the variable levy, though in many cases subject to tariff quotas, on maize, millet, sorghum and rice, poultrymeat, pigmeat and dairy products: and specific quotas for beef, sugar, rum and bananas. It is the quotas for sugar and bananas that really count for the Caribbean countries, with the special access arrangements for rice being of major significance for Guyana.
148 StBa/Eurostat Caribbean ACP countries, 1995
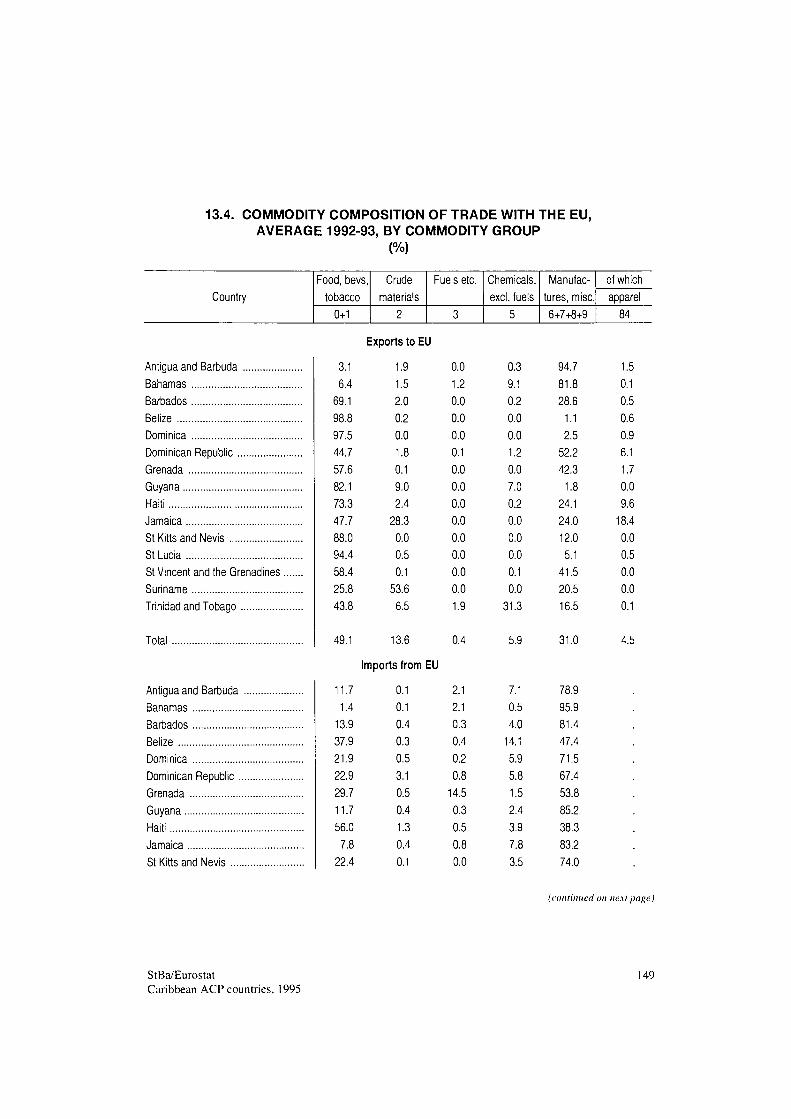
13.4. C O M M O D I T Y C O M P O S I T I O N O F T R A D E W I T H T H E E U , A V E R A G E 1992-93 , BY C O M M O D I T Y G R O U P
(%)
Country Food, bevs,
tobacco 0+1
Crude materials
2
Fuels etc.
3
Chemicals, excl. fuels
5
Manufactures, misc. 6+7+8+9
of which apparel
84
Antigua and Barbuda Bahamas Barbados Belize Dominica Dominican Republic Grenada Guyana Haiti Jamaica St Kitts and Nevis St Lucia St Vincent and the Grenadines . Suriname Trinidad and Tobago
Total
Antigua and Barbuda Bahamas Barbados Belize Dominica Dominican Republic Grenada Guyana Haiti Jamaica St Kitts and Nevis
3.1 6.4
69.1 98.8 97.5 44.7 57.6 82.1 73.3 47.7 88.0 94.4 58.4 25.8 43.8
Exports to EU
1.9 1.5 2.0 0.2 0.0 1.8 0.1 9.0 2.4
28.3 0.0 0.5 0.1
53.6 6.5
0.0 1.2 0.0 0.0 0.0 0.1 0.0 0.0 0.0 0.0 0.0 0.0 0.0 0.0 1.9
0.3 9.1 0.2 0.0 0.0 1.2 0.0 7.0 0.2 0.0 0.0 0.0 0.1 0.0
31.3
94.7 81.8 28.6 1.1 2.5
52.2 42.3 1.8
24.1 24.0 12.0 5.1
41.5 20.5 16.5
1.5 0.1 0.5 0.6 0.9 6.1 1.7 0.0 9.6
18.4 0.0 0.5 0.0 0.0 0.1
49.1 13.6 0.4 5.9 31.0
11.7 1.4
13.9 37.9 21.9 22.9 29.7 11.7 56.0 7.8
22.4
Imports from EU
0.1 0.1 0.4 0.3 0.5 3.1 0.5 0.4 1.3 0.4 0.1
2.1 2.1 0.3 0.4 0.2 0.8
14.5 0.3 0.5 0.8 0.0
7.1 0.5 4.0
14.1 5.9 5.8 1.5 2.4 3.9 7.8 3.5
78.9 95.9 81.4 47.4 71.5 67.4 53.8 85.2 38.3 83.2 74.0
4.5
(continued on next page)
StBa/Eurostat Caribbean ACP countries, 1995
149
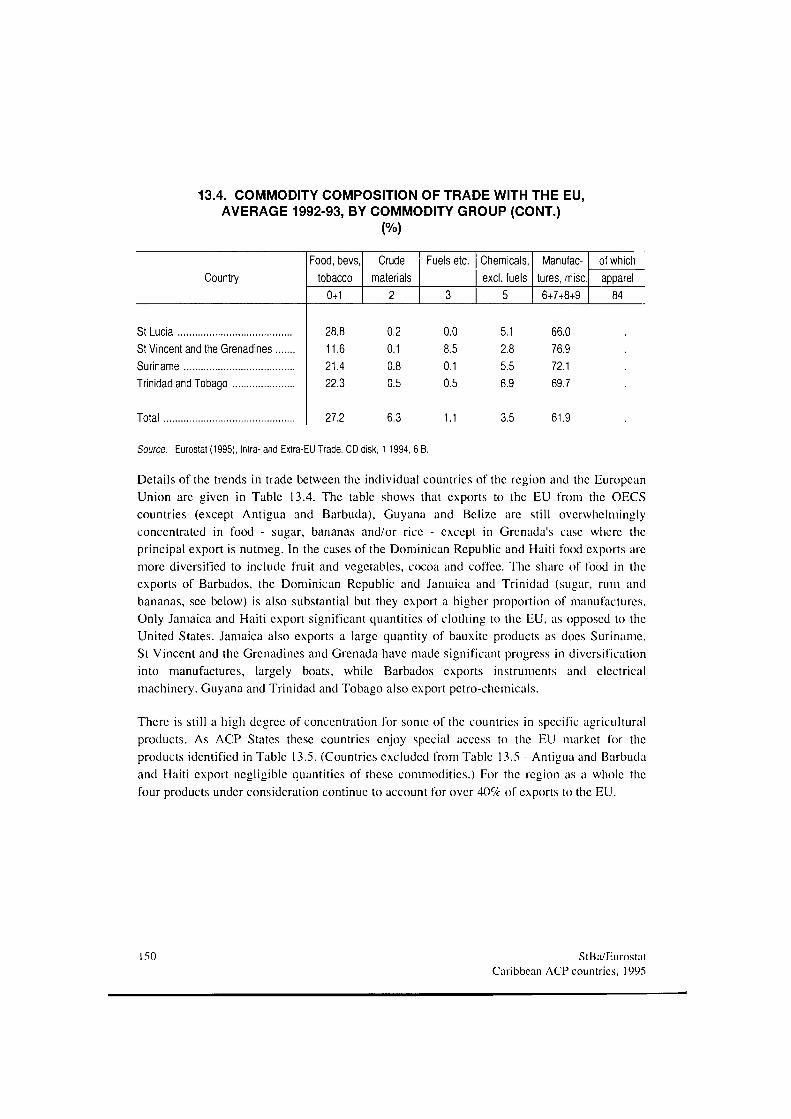
13.4. COMMODITY COMPOSITION OF TRADE WITH THE EU, AVERAGE 1992-93, BY COMMODITY GROUP (CONT.)
(%)
Country Food, bevs,
tobacco 0+1
Crude materials
2
Fuels etc.
3
Chemicals, excl. fuels
5
Manufactures, misc. 6+7+8+9
of which apparel
84
St Lucia St Vincent and the Grenadines . Suriname Trinidad and Tobago
Total 27.2 6.3 1.1
28.8 11.6 21.4 22.3
0.2 0.1 0.8 0.5
0.0 8.5 0.1 0.5
5.1 2.8 5.5 6.9
66.0 76.9 72.1 69.7
3.5 61.9
Source: Eurostat (1995), Intra- and Extra-EU Trade, CD disk, 1 1994, 6 B.
Details of the trends in trade between the individual countries of the region and the European Union are given in Table 13.4. The table shows that exports to the EU from the OECS countries (except Antigua and Barbuda), Guyana and Belize are still overwhelmingly concentrated in food - sugar, bananas and/or rice - except in Grenada's case where the principal export is nutmeg. In the cases of the Dominican Republic and Haiti food exports arc more diversified to include fruit and vegetables, cocoa and coffee. The share of food in the exports of Barbados, the Dominican Republic and Jamaica and Trinidad (sugar, rum and bananas, see below) is also substantial but they export a higher proportion of manufactures. Only Jamaica and Haiti export significant quantities of clothing to the EU, as opposed to the United States. Jamaica also exports a large quantity of bauxite products as docs Suriname. St Vincent and the Grenadines and Grenada have made significant progress in diversification into manufactures, largely boats, while Barbados exports instruments and electrical machinery. Guyana and Trinidad and Tobago also export pctro-chcmicals.
There is still a high degree of concentration for some of the countries in specific agricultural products. As ACP States these countries enjoy special access to the EU market for the products identified in Table 13.5. (Countries excluded from Table 13.5 - Antigua and Barbuda and Haiti export negligible quantities of these commodities.) For the region as a whole the four products under consideration continue to account for over 40% of exports to the EU.
150 StBa/Eurostat Caribbean ACP countries, 1995
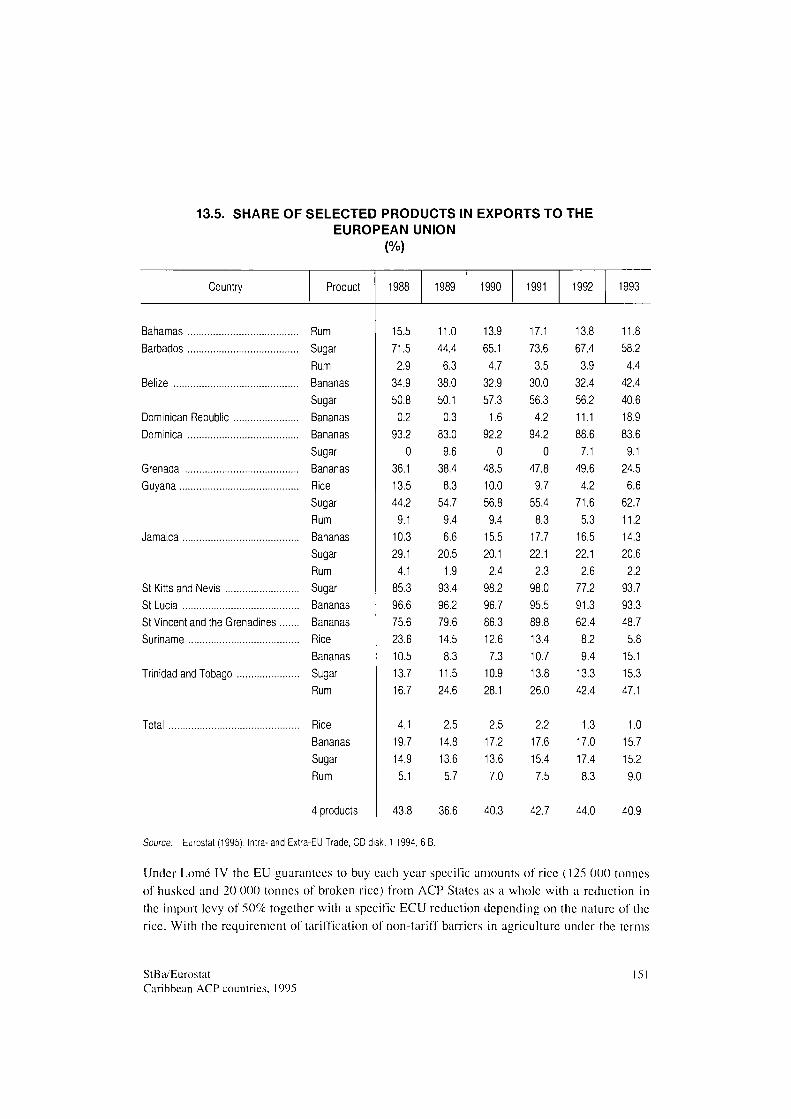
13.5. SHARE OF SELECTED PRODUCTS IN EXPORTS TO THE EUROPEAN UNION
(%)
Country Product 1990 1991 1992 1993
Bahamas Rum Barbados Sugar
Rum Belize Bananas
Sugar Dominican Republic Bananas Dominica Bananas
Sugar Grenada Bananas Guyana Rice
Sugar Rum
Jamaica Bananas Sugar Rum
St Kitts and Nevis Sugar St Lucia Bananas St Vincent and the Grenadines Bananas Suriname Rice
Bananas Trinidad and Tobago Sugar
Rum
Total Rice Bananas Sugar Rum
4 products 43.8 36.6 40.3 42.7 44.0 40.9
Source: Eurostat (1995), Intra- and Extra-EU Trade, CD disk, 1 1994, 6 B.
Under Lomé IV the EU guarantees to buy each year specific amounts of rice (125 000 tonnes of husked and 20 000 tonnes of broken rice) from ACP States as a whole with a reduction in the import levy of 50% together with a specific ECU reduction depending on the nature of the rice. With the requirement of tariffication of non-tariff barriers in agriculture under the terms
15.5 71.5 2.9
34.9 50.8 0.2
93.2 0
36.1 13.5 44.2 9.1
10.3 29.1 4.1
85.3 96.6 75.6 23.6 10.5 13.7 16.7
4.1 19.7 14.9 5.1
11.0 44.4 6.3
38.0 50.1 0.3
83.0 9.6
38.4 8.3
54.7 9.4 6.6
20.5 1.9
93.4 96.2 79.6 14.5 8.3
11.5 24.6
2.5 14.8 13.6 5.7
13.9 65.1 4.7
32.9 57.3 1.6
92.2 0
48.5 10.0 56.8 9.4
15.5 20.1 2.4
98.2 96.7 86.3 12.6 7.3
10.9 28.1
2.5 17.2 13.6 7.0
17.1 73.6 3.5
30.0 56.3 4.2
94.2 0
47.8 9.7
55.4 8.3
17.7 22.1 2.3
98.0 95.5 89.8 13.4 10.7 13.8 26.0
2.2 17.6 15.4 7.5
13.8 67.4 3.9
32.4 56.2 11.1 88.6 7.1
49.6 4.2
71.6 5.3
16.5 22.1 2.6
77.2 91.3 62.4 8.2 9.4
13.3 42.4
1.3 17.0 17.4 8.3
11.8 58.2 4.4
42.4 40.6 18.9 83.6 9.1
24.5 6.6
62.7 11.2 14.3 20.6 2.2
93.7 93.3 48.7 5.8
15.1 15.3 47.1
1.0 15.7 15.2 9.0
StBa/Eurostat Caribbean ACP countries, 1995
of the Uruguay Round agreement this preference will be converted into a tariff-quota, though at the time of writing the details are not yet known. Among the Caribbean countries both Guyana and Suriname avail themselves of this preference though in both cases the share of rice in their exports to the EU has declined substantially in recent years.
Under the Sugar Protocol to Lomé IV the EU guarantees to buy specific quantities from particular ACP States at a price negotiated annually but which in the past has closely followed the price guaranteed to EU sugar beet growers. Sugar remains an important export for Jamaica, Barbados and Trinidad and Tobago. For Belize (with bananas) and St Kitts and Nevis, the EU sugar market is critical for their overall export earnings. Little Caribbean sugar is exported to countries outside the EU - indeed outside the United Kingdom - though there are good prospects that, with its privatization programme and increased investment, Jamaica at least will gradually become competitive on world markets. St Kitts and Nevis has expanded production on the assumption that EU quotas will be increased with the enlargement of the Union and with the new allocations for Portugal.
Under Protocol 5 of Lomé IV, rum from the ACP States is admitted to the EU duty-free in quantities determined on the basis of the largest amounts imported over the last three years for which statistics arc available, increased by an annual growth rate of 37% on the UK market and 27% on other EU markets. The abolition of the Community tariff quota is projected for 1996. The Bahamas, Guyana, Jamaica and Trinidad and Tobago supply about 66% of the world exports of rum and arc generally perceived as being competitive in the sector.
A new banana regime has been established by the EU and came into operation in July 1993. Up to 1993 the EU market was compartmentalised with certain Member States maintaining quotas or import prohibitions to preserve markets for their 'traditional' suppliers, while Germany, Denmark, Ireland and the Benelux countries imported most of their bananas from Central America, Ecuador and Colombia. These mechanisms were inconsistent with the 1992 Single European Market. The difficulty in finding a mechanism which continued to give special access to the traditional suppliers within a single market for bananas was compounded by the need to devise a regime that could be justified under GATT rules, particularly in a year when the UR negotiations were coming to a head. In the event, after complaints from several Latin American producers, a GATT tribunal found the regime unlawful, a decision which led to an improvement in quotas for the Latin American producers, some technical adjustments to the licensing system and that was instrumental in the application by the EU for a GATT waiver for its Lomé trade provisions.
The new regime depends on the use of tariff quotas and differential tariff rates to maintain markets for the ACP suppliers vis-à-vis the more price competitive 'dollar' banana producers of Central America. Ecuador and Colombia. EU supplies - from Martinique, Guadeloupe, the Canaries. Algarve and Crete - arc not restricted. Quotas based on 'traditional' imports from
152 StBa/Eurostat Caribbean ACP countries. 1995
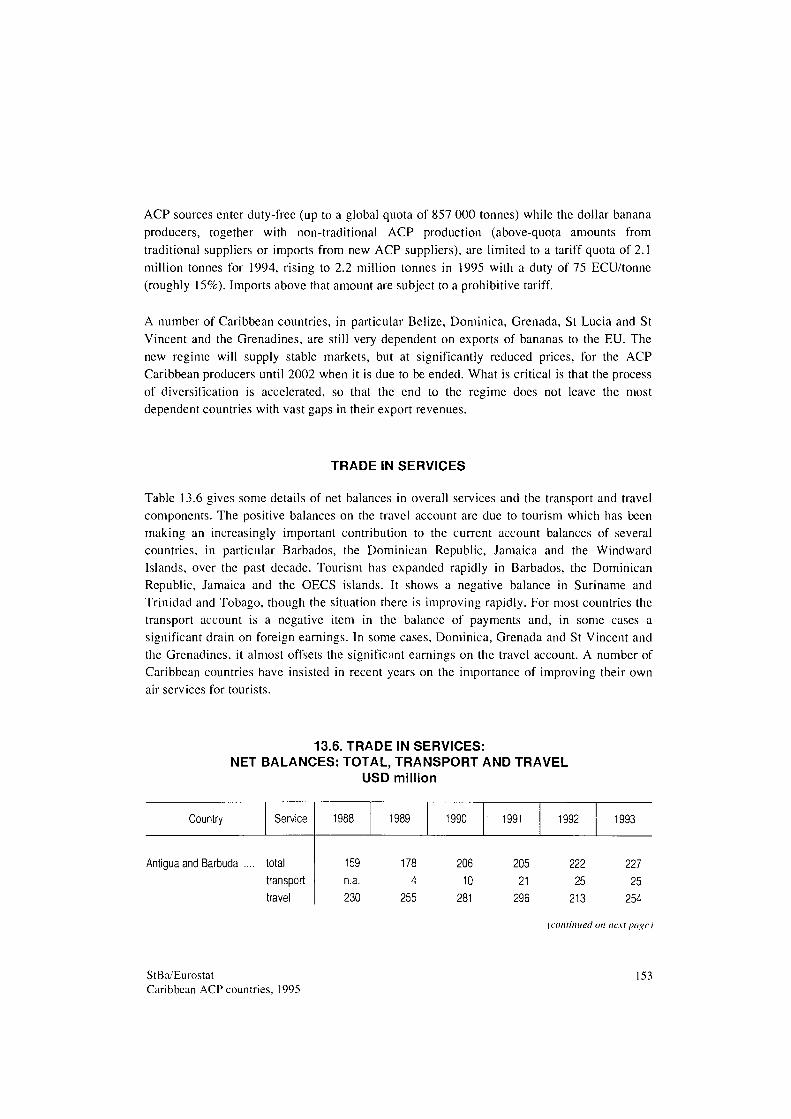
ACP sources enter duty-free (up to a global quota of 857 000 tonnes) while the dollar banana producers, together with non-traditional ACP production (above-quota amounts from traditional suppliers or imports from new ACP suppliers), are limited to a tariff quota of 2.1 million tonnes for 1994, rising to 2.2 million tonnes in 1995 with a duty of 75 ECU/tonnc (roughly 15%). Imports above that amount are subject to a prohibitive tariff.
A number of Caribbean countries, in particular Belize, Dominica, Grenada, St Lucia and St Vincent and the Grenadines, are still very dependent on exports of bananas to the EU. The new regime will supply stable markets, but at significantly reduced prices, for the ACP Caribbean producers until 2002 when it is due to be ended. What is critical is that the process of diversification is accelerated, so that the end to the regime does not leave the most dependent countries with vast gaps in their export revenues.
TRADE IN SERVICES
Table 13.6 gives some details of net balances in overall services and the transport and travel components. The positive balances on the travel account are due to tourism which has been making an increasingly important contribution to the current account balances of several countries, in particular Barbados, the Dominican Republic, Jamaica and the Windward Islands, over the past decade. Tourism has expanded rapidly in Barbados, the Dominican Republic, Jamaica and the OECS islands. It shows a negative balance in Suriname and Trinidad and Tobago, though the situation there is improving rapidly. For most countries the transport account is a negative item in the balance of payments and, in some cases a significant drain on foreign earnings. In some cases, Dominica, Grenada and St Vincent and the Grenadines, it almost offsets the significant earnings on the travel account. A number of Caribbean countries have insisted in recent years on the importance of improving their own air services for tourists.
13.6. TRADE IN SERVICES: NET BALANCES: TOTAL, TRANSPORT AND TRAVEL
USD million
Country
Antigua and Barbuda ....
Service
total transport travel
1988
159 n.a. 230
1989
178 4
255
1990
206 10
281
1991
205 21
296
1992
222 25
213
1993
227 25
254
(continued on next page)
StBa/Eurostat Caribbean ACP countries, 1995
153
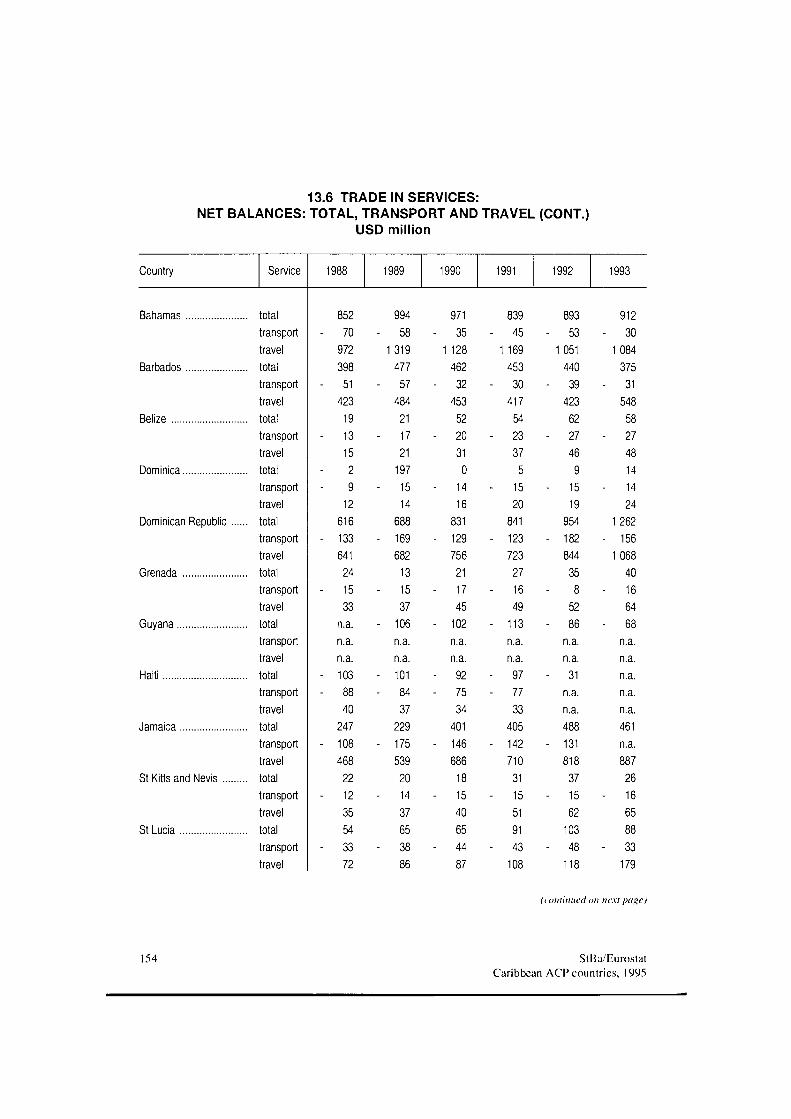
13.6 TRADE IN SERVICES: NET BALANCES: TOTAL, TRANSPORT AND TRAVEL (CONT.)
USD million
Country
Bahamas
Barbados
Belize
Dominica
Dominican Republic
Grenada
Guyana
Haiti
Jamaica
St Kitts and Nevis
St Lucia
Service
total transport travel total transport travel total transport travel total transport travel total transport travel total transport travel total transpor travel total transport travel total transport travel total transport travel total transport travel
1988
852 - 70
972 398
- 51 423 19
- 13 15 2 9
12 616
- 133 641 24
- 15 33
n.a. n.a. n.a.
- 103 - 88
40 247
- 108 468 22
- 12 35 54
- 33 72
1989
994 - 58
1319 477
- 57 484 21
- 17 21
197 - 15
14 688
- 169 682 13
- 15 37
- 106 n.a. n.a.
- 101 - 84
37 229
- 175 539 20
- 14 37 65
- 38 86
1990
971 - 35
1 128 462
- 32 453 52
- 20 31 0
- 14 16
831 - 129
756 21
- 17 45
- 102 n.a. n.a.
- 92 - 75
34 401
- 146 686 18
- 15 40 65
- 44 87
1991
839 - 45
1 169 453
- 30 417 54
- 23 37 5
- 15 20
841 - 123
723 27
- 16 49
- 113 n.a. n.a.
- 97 - 77
33 405
- 142 710 31
- 15 51 91
- 43 108
1992
893 - 53
1051 440
- 39 423 62
- 27 46 9
- 15 19
954 - 182
844 35 8
52 - 86
n.a. n.a.
- 31 n.a. n.a. 488
- 131 818 37
- 15 62
103 - 48
118
1993
912 - 30
1084 375
- 31 548 58
- 27 48 14
- 14 24
1262 - 156
1068 40
- 16 64
- 68 n.a. n.a. n.a. n.a. n.a. 461 n.a. 887 26
- 16 65 88
- 33 179
(continued on next page)
154 StBa/Eurostat Caribbean ACP countries, 1995
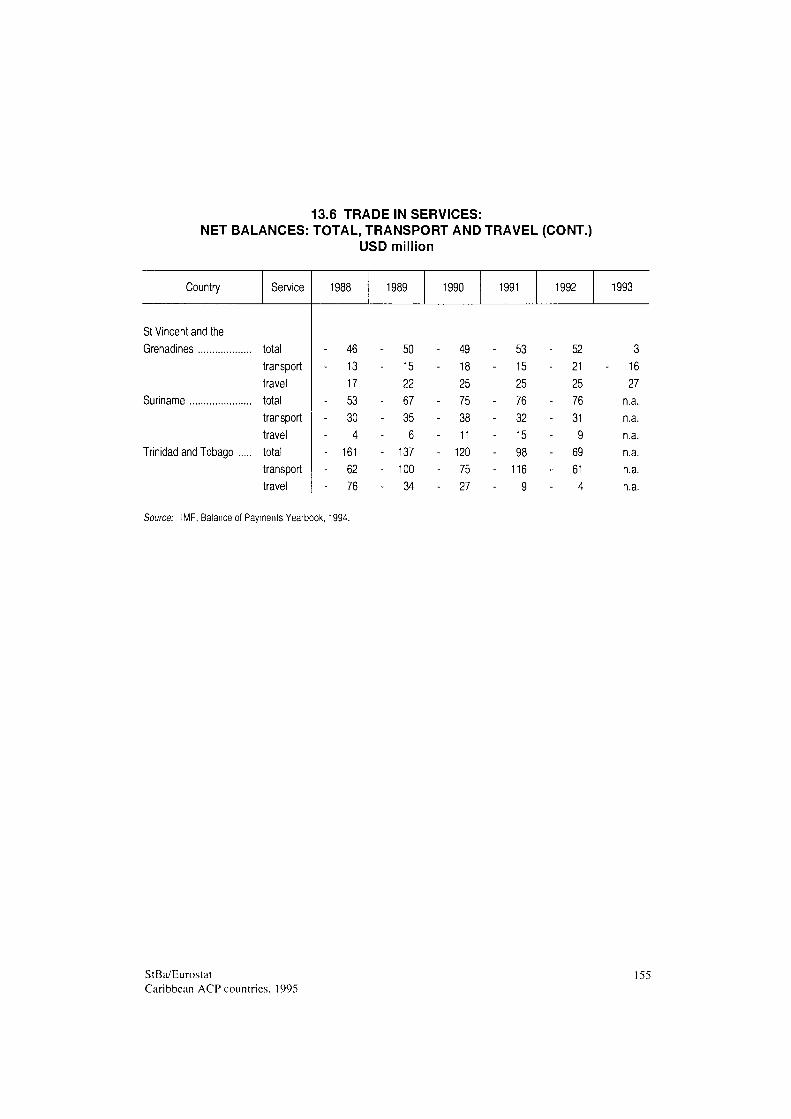
13.6 TRADE IN SERVICES: NET BALANCES: TOTAL, TRANSPORT AND TRAVEL (CONT.)
USD million
Country
St Vincent and the Grenadines
Suriname
Trinidad and Tobago
Service
total transport travel total transport travel total transport travel
1988
- 46 - 13
17 - 53 - 30
4 - 161 - 62 - 76
1989
- 50 - 15
22 - 67 - 35
6 - 137 - 100 - 34
1990
- 49 - 18
25 - 75 - 38 - 11 - 120 - 75 - 27
1991
- 53 - 15
25 - 76 - 32 - 15 - 98 - 116
9
1992
- 52 - 21
25 - 76 - 31
9 - 69 - 61
4
1993
3 - 16
27 n.a. n.a. n.a. n.a. n.a. n.a.
Source: IMF, Balance of Payments Yearbook, 1994.
StBa/Eurostat Caribbean ACP countries. 1995
155
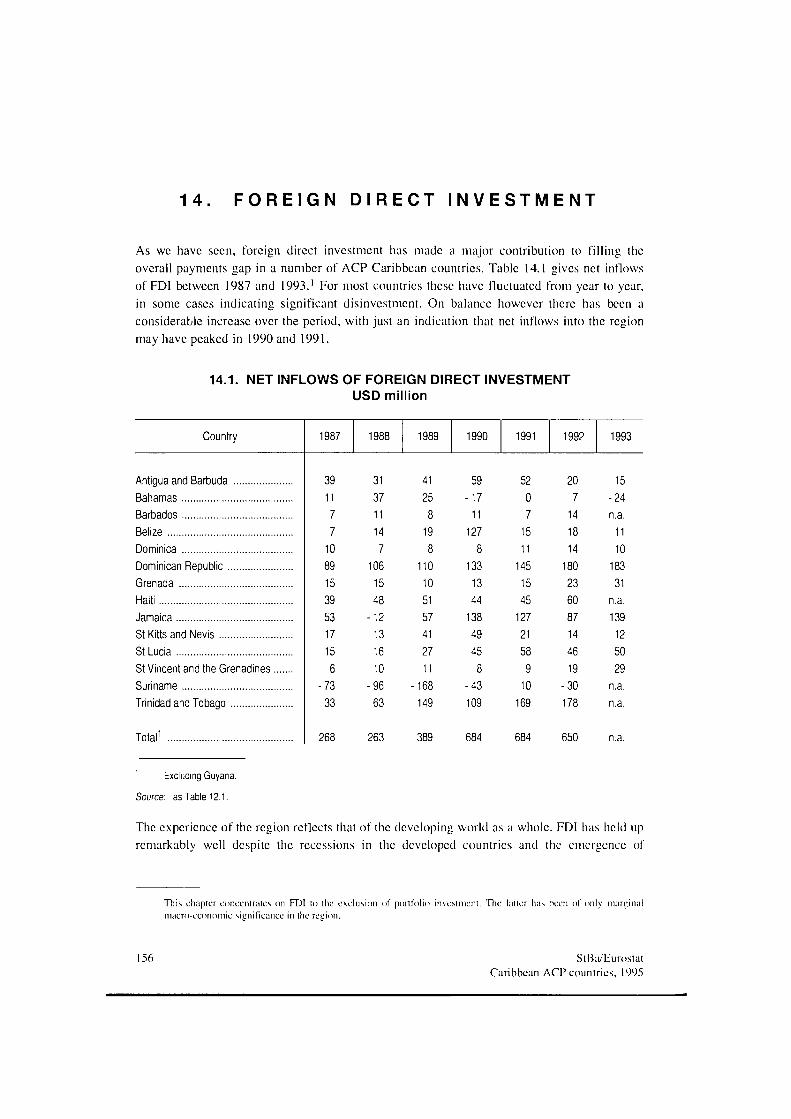
1 4 . F O R E I G N D I R E C T I N V E S T M E N T
As we have seen, foreign direct investment has made a major contribution to filling the overall payments gap in a number of ACP Caribbean countries. Table 14.1 gives net inflows of FDI between 1987 and 1993.' For most countries these have fluctuated from year to year, in some cases indicating significant disinvestment. On balance however there has been a considerable increase over the period, with just an indication that net inflows into the region may have peaked in 1990 and 1991.
14.1. NET INFLOWS OF FOREIGN DIRECT INVESTMENT USD million
Country 1987 1988 1989 1990 1991 1992 1993
Antigua and Barbuda Bahamas Barbados Belize Dominica Dominican Republic Grenada Haiti Jamaica St Kitts and Nevis St Lucia St Vincent and the Grenadines. Suriname Trinidad and Tobago
Total1
39 11 7 7 10 89 15 39 53 17 15 6 73 33
31 37 11 14 7
106 15 48 -12 13 16 10 -96 63
41 25 8 19 8
110 10 51 57 41 27 11
-168 149
59 -17 11 127 8
133 13 44 138 49 45 8
-43 109
52 0 7 15 11 145 15 45 127 21 58 9 10 169
20 7 14 18 14 180 23 60 87 14 46 19 -30 178
15 -24 n.a. 11 10 183 31
n.a. 139 12 50 29
n.a. n.a.
268 263 389 684 684 650 n.a.
Excluding Guyana.
Source: as Table 12.1.
The experience of the region reflects that of the developing world as a whole. FDI has held up remarkably well despite the recessions in the developed countries and the emergence of
This chapter concentrâtes un FDI to the exclusion ol' portfolio investment. 'Die latter has heen ol only marginal macro-economic significance in lhe region.
156 StBa/Eurostat Caribbean ACP countries, 1995
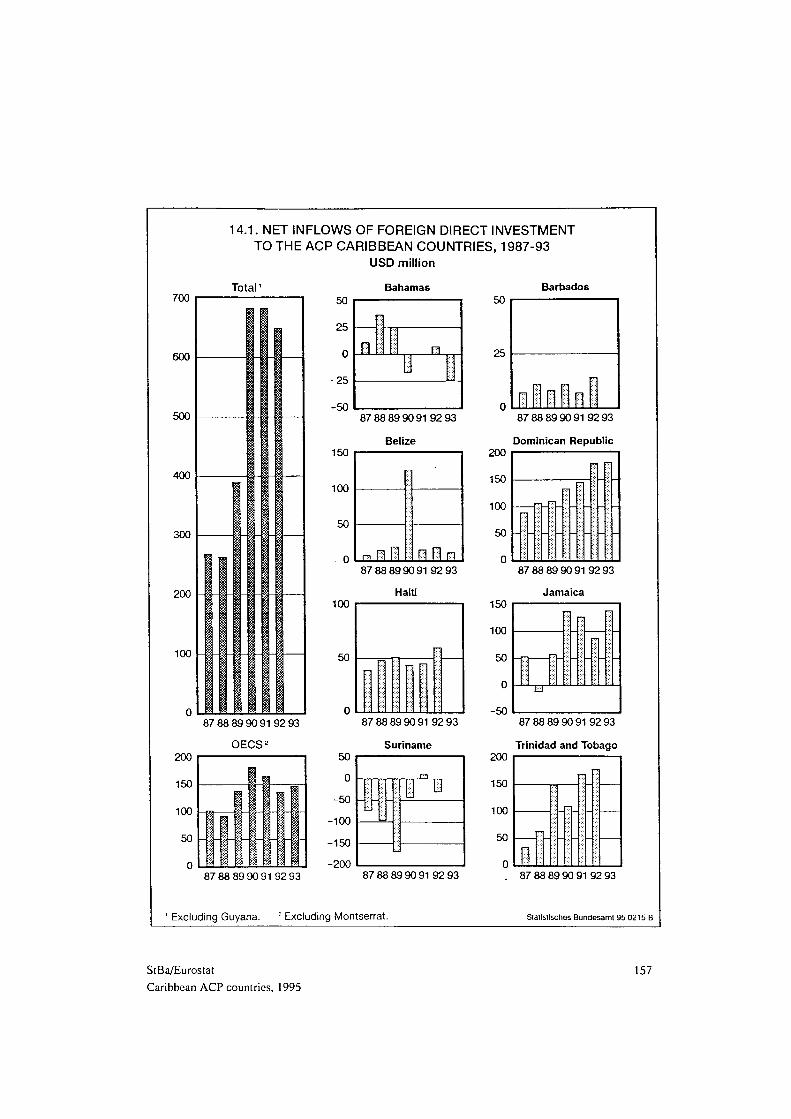
700
600
500
400
300
200
14.1. NET INFLOWS OF FOREIGN DIRECT INVESTMENT TO THE ACP CARIBBEAN COUNTRIES, 1987-93
USD million
Total '
87 88 89 90 91 92 93
OECS2
87 88 89 90 91 92 93
Bahamas 50
25
0
-25
-50
150
100
50
F
JLI I _M .
1 |
87 88 89 90 91 92 93
Belize
r
nil ! H i 87 88 89 90 91 92 93
Haiti 100
50
87 88 89 90 91 92 93
Suriname
m
;:
1 ®
87 88 89 90 91 92 93
Barbados 50
25
H I i 11 200
150
100
50
0
150
100
50
0
-50
200
150
100
50
0
87 88 89 90 91 92 93
Dominican Republic
8788 89 90 919293
Jamaica
87 88 89 90 91 92 93
Trinidad and Tobago
π 1
π Π
- : —
Excluding Guyana. 2 Excluding Montserrat.
87 88 89 90 91 92 93
Statistisches Bundesamt 95 0215 Β
StBa/Eurostat Caribbean ACP countries, 1995
157
Eastern and Central Europe, and the efforts of those countries to attract investment. On balance, however, compared with the third world as a whole. South and East Asia have attracted FDI flows disproportionate to the size of their economics.
The main driving force behind FDI is 'globalisation': there has been a break-down in the relevance of traditional national markets as transnational companies seek to establish production facilities where costs are low, the regulatory and fiscal frameworks are benign and the political framework is predictable, in order to service regional or even world markets. It is part and parcel of this new order that parts for a single product may be fabricated in many different countries, and indeed that the product itself may undergo a number of manufacturing processes in different countries. Of course the transnational corporations (TNCs) must take into account the costs of trade barriers on intra-company trade. They must also take into account the benefits of a large domestic market for the product in the country of its final processing.
On both these scores the Caribbean countries fare badly. Domestic markets arc very small. And there are still significant tariffand non-tariff barriers on trade, even within Caricom, and even more so vis-à-vis the Caricom countries, the non-Caricom islands and the Caribbean mainland.
To offset some of these problems a number of Caribbean countries have established export processing zones (EPZs). These allow trade to take place unburdened by import barriers on material inputs or semi-processed goods or export restrictions and taxes which still exist in some countries. Their establishment was boosted by the 'Special Access Programme' whereby apparel and metal manufactures are admitted to the US market on favourable tariff terms if they are fabricated from US-produced steel or cloth. In these cases US firms have been attracted by low wages in the Caribbean region, though East and South Asian firms have also been attracted, in their case as a way to circumvent the MultiFibre Arrangement quotas on their exports of apparel to North America.
As of the middle of 1989, there were already 18 EPZs in the Dominican Republic, nine in Barbados, seven in Jamaica and two in Haiti. By the end of 1992 there were 27 in the Dominican Republic, holding a total 404 companies, primarily engaged in manufacturing and of that, largely, clothing. The zones have generally helped the process of export diversification, though there have been widespread criticisms that (i) they have failed to promote skills, and (ii) there has been minimal vertical integration with the local economy. Part of the reason for the latter is the lack of financial incentives to buy local inputs or sell on local markets, problems that arc being attacked by a number of fiscal derogations for local firms who trade with firms inside the EPZs.
Other than Haiti where the per capita income is the lowest in the region and which in any event has recently been the object of a trade embargo, the Dominican Republic is the only country with a market in excess of 5 million. Not surprisingly that market has attracted
158 StBa/Eurostat Caribbean ACP countries, 1995
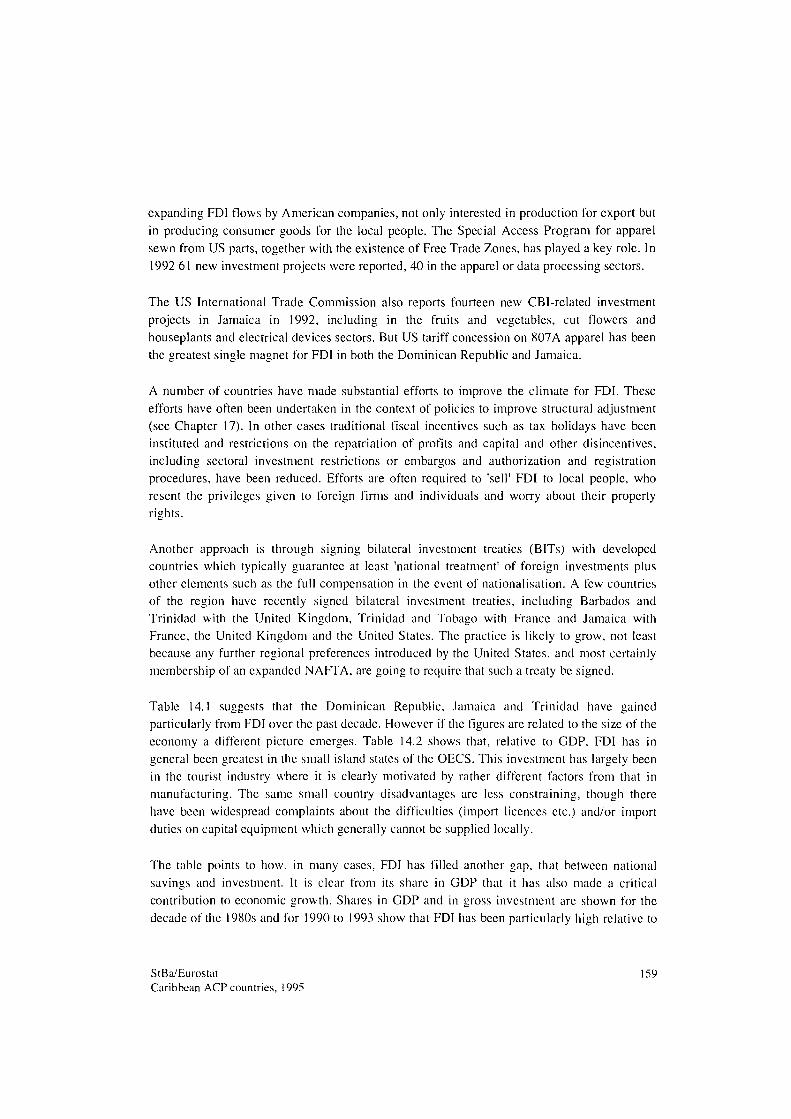
expanding FDI flows by American companies, not only interested in production for export but in producing consumer goods for the local people. The Special Access Program for apparel sewn from US parts, together with the existence of Free Trade Zones, has played a key role. In 1992 61 new investment projects were reported, 40 in the apparel or data processing sectors.
The US International Trade Commission also reports fourteen new CBI-related investment projects in Jamaica in 1992, including in the fruits and vegetables, cut flowers and houseplants and electrical devices sectors. But US tariff concession on 807A apparel has been the greatest single magnet for FDI in both the Dominican Republic and Jamaica.
A number of countries have made substantial efforts to improve the climate for FDI. These efforts have often been undertaken in the context of policies to improve structural adjustment (see Chapter 17). In other cases traditional fiscal incentives such as tax holidays have been instituted and restrictions on the repatriation of profits and capital and other disincentives, including sectoral investment restrictions or embargos and authorization and registration procedures, have been reduced. Efforts are often required to 'sell' FDI to local people, who resent the privileges given to foreign firms and individuals and worry about their property rights.
Another approach is through signing bilateral investment treaties (BITs) with developed countries which typically guarantee at least 'national treatment' of foreign investments plus other elements such as the full compensation in the event of nationalisation. A few countries of the region have recently signed bilateral investment treaties, including Barbados and Trinidad with the United Kingdom, Trinidad and Tobago with France and Jamaica with France, the United Kingdom and the United States. The practice is likely to grow, not least because any further regional preferences introduced by the United States, and most certainly membership of an expanded NAFTA, are going to require that such a treaty be signed.
Table 14.1 suggests that the Dominican Republic, Jamaica and Trinidad have gained particularly from FDI over the past decade. However if the figures are related to the size of the economy a different picture emerges. Table 14.2 shows that, relative to GDP, FDI has in general been greatest in the small island states of the OECS. This investment has largely been in the tourist industry where it is clearly motivated by rather different factors from that in manufacturing. The same small country disadvantages arc less constraining, though there have been widespread complaints about the difficulties (import licences etc.) and/or import duties on capital equipment which generally cannot be supplied locally.
The table points to how, in many cases, FDI has filled another gap, that between national savings and investment. It is clear from its share in GDP that it has also made a critical contribution to economic growth. Shares in GDP and in gross investment arc shown for the decade of the 1980s and for 1990 to 1993 show that FDI has been particularly high relative to
StBa/Eurostat 159 Caribbean ACP countries, 1995
gross investment in the small island states, Belize. And recently this was also the case in Guyana.
14.2. FOREIGN DIRECT INVESTMENT AND GROSS INVESTMENT
Country Foreign direct investment
% of GDP 980-891990-92 1993
% of gross investment 1980-891990-92 1993
Gross investment % of GDP
1980-891990-92 1993
Antigua and Barbuda Bahamas Barbados Belize Dominica Dominican Republic Grenada1
Guyana Haiti Jamaica St Kitts and Nevis1
St Lucia1
St Vincent and the Grenadines1. Suriname Trinidad and Tobago
12.4 0.3 0.3
-0.2 2.6
1 3.9 0.4 0.4 0.1 8.9
11.4 3
-0.7 0.7
8.9 0
0.9 3.8 5.5 2.1 8.1
12.9 1.9 2.8
18.5 13.5 4.3
-0.4 2.6
3.0 n.a. n.a. 2.1 5.1 2.2 3.0 n.a. n.a. 3.5 5.4 9.2
10.9 n.a. n.a.
31.4 1.7 1.5
-0.9 8.1 4.3
10.7 1.4 2.7 0.5
23.7 45.1 9.9
-3.3 3.1
37.1 n.a. 5.7
12.8 16.6 9.5
22.4 33.3 28.9 13.9 41.6 53.8 13.7 2.3
20.6
n.a. n.a. n.a. 35.0 37.2 n.a. n.a. n.a. n.a. 10.0 n.a. n.a. n.a. n.a. n.a.
39.5 17.4 19.5 23.5 32.1 23.4 36.5 29.6 14.7 20.8 37.6 25.3 30.4 21.1 22.7
24 n.a. 15.9 29.8 33.2 22,0 36.1 38.7
6.6 20.1 44.5 25.1 31.3 17.7 12.6
n.a. n.a. 8.5
31.4 26.9 n.a. 31.7 53.7 8.1
34.7 39.6 24.6 35.1 23.2 13.6
For 1993, net foreign investment but in earlier years outward FDI was negligible.
It is generally the small island economies that have shown the highest GDP growth rates and FDI must take much of the credit (see Chapter 2). But these have also been the countries where the overall investment rate has been high.' During the 1980s total gross investment was about 30% or more of GDP in Antigua and Barbuda, Dominica, Grenada and St Kitts and Nevis, as well as Guyana. FDI makes a direct contribution to gross investment. It may also stimulate local entrepreneurs to invest through joint ventures or through creating new opportunities for complementary projects and vice versa. (Alternatively foreign investment may substitute for domestic investment by appropriating the most promising projects and discouraging competition.) Of course there have been other factors supporting growth in these countries - the favoured treatment of banana imports on the EU market though the new banana regime has been less helpful in recent years, advantageous natural conditions for the
Of course there are many other factors affecting GDP growth, of which expons, labour force growth and the stock and growth in 'human capital' are only some of the most important.
160 StBa/Eurostat Caribbean ACP countries. 1995
growth of tourism, strong public programmes of investment in human capital and, generally, sound macro-economic policies. But high FDI does not necessarily imply high overall investment - witness Trinidad and Tobago in the 1990s. Similarly high overall investment may take place with little contribution from abroad. Barbados, Suriname and, at least in the 1980s, the Dominican Republic are cases in point.
At least the countries which have experienced more moderate, though positive, growth in the 1980s, the Bahamas, Barbados, the Dominican Republic and Jamaica, show relatively low gross investment/GDP ratios as well as low rates of FDI in GDP. As for the countries experiencing negative growth in the 1980s, Guyana, Haiti, Suriname and Trinidad and Tobago, the investment/GDP and FDI/GDP ratios are not unambiguously lower than the previous group. Growth performance is not only influenced by the investment rate, but also on the composition and the 'quality' of the investment. High rates of public sector investment may 'crowd out' private investment - sometimes in the Caribbean public sector enterprises compete directly with the private sector - to the extent that total investment is reduced. Public investment may generate, at least in the short- to medium term, less economic growth than the same value of private investment. Many countries in the region have suffered economic crises which have led to low rates of return and often bankruptcy. Natural disasters, such as hurricanes, can have a similar impact.
StBa/Eurostat 161 Caribbean ACP countries. 1995
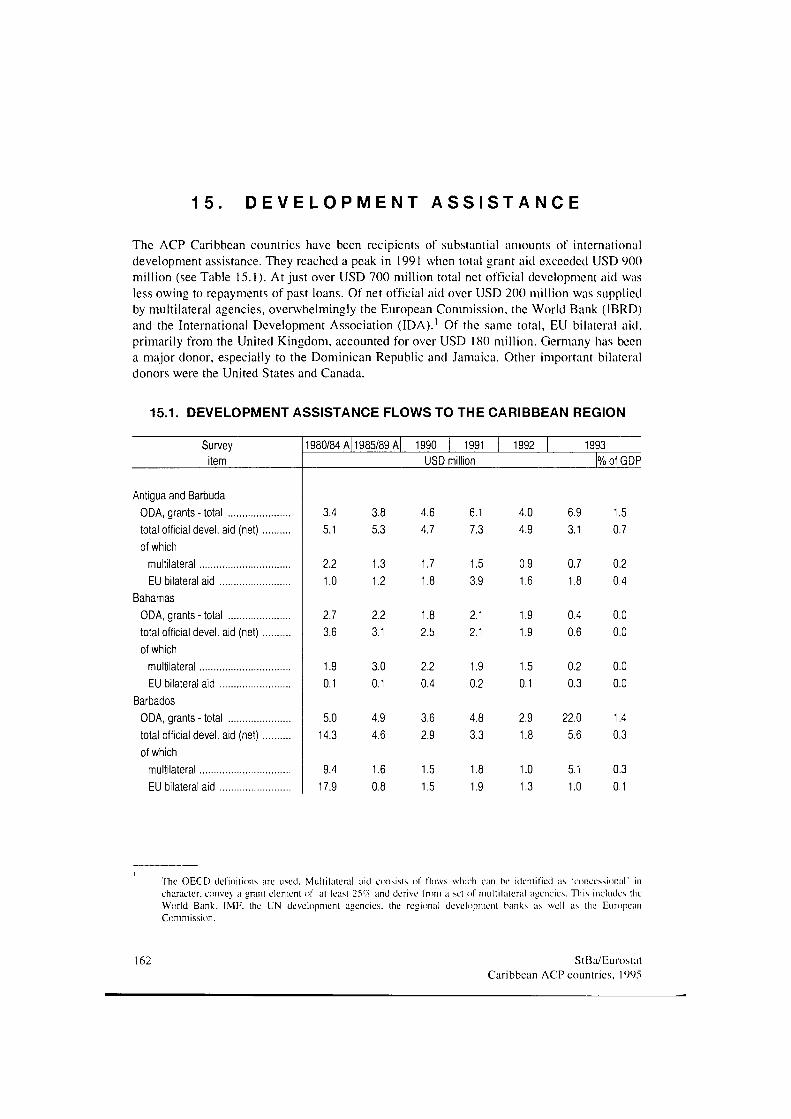
1 5 . D E V E L O P M E N T A S S I S T A N C E
The ACP Caribbean countries have been recipients of substantial amounts of international development assistance. They reached a peak in 1991 when total grant aid exceeded USD 900 million (see Table 15.1). At just over USD 700 million total net official development aid was less owing to repayments of past loans. Of net official aid over USD 200 million was supplied by multilateral agencies, overwhelmingly the European Commission, the World Bank (IBRD) and the International Development Association (IDA).1 Of the same total, EU bilateral aid. primarily from the United Kingdom, accounted for over USD 180 million. Germany has been a major donor, especially to the Dominican Republic and Jamaica. Other important bilateral donors were the United States and Canada.
15.1. DEVELOPMENT ASSISTANCE FLOWS TO THE CARIBBEAN REGION
Survey item
1980/84 A 1985/89 A 1990 1991 1992 1993 USD million % of GDP
Antigua and Barbuda ODA, grants - total total official devel. aid (net) of which
multilateral EU bilateral aid
Bahamas ODA, grants - total total official devel. aid (net) of which
multilateral EU bilateral aid
Barbados ODA, grants-total total official devel. aid (net) of which
multilateral EU bilateral aid
3.4 5.1
2.2 1.0
2.7 3.6
1.9 0.1
5.0 14.3
9.4 17.9
3.8 5.3
1.3 1.2
2.2 3.1
3.0 0.1
4.9 4.6
1.6 0.8
4.6 4.7
1.7
1.8 2.5
2.2 0.4
3.6 2.9
1.5 1.5
6.1 7.3
1.5 3.9
2.1 2.1
1.9 0.2
4.8 3.3
1.8 1.9
4.0 4.9
0.9 1.6
1.9 1.9
1.5 0.1
2.9 1.8
1.0 1.3
6.9 3.1
0.7 1.8
0.4 0.6
0.2 0.3
22.0 5.6
5.1 1.0
1.5 0.7
0.2 0.4
0.0 0.0
0.0 0.0
1.4 0.3
0.3 0.1
The OECD definitions are used. Multilateral aid consists of Hows which can he identified as 'concessionar in character, convey a grani element of at least 25r/r and derive from a sel of multilateral agencies. This includes the World Bank. IMF. the UN development agencies, the regional development hanks as well as the European Commission.
162 StBa/Eurostat Caribbean ACP countries, 1995
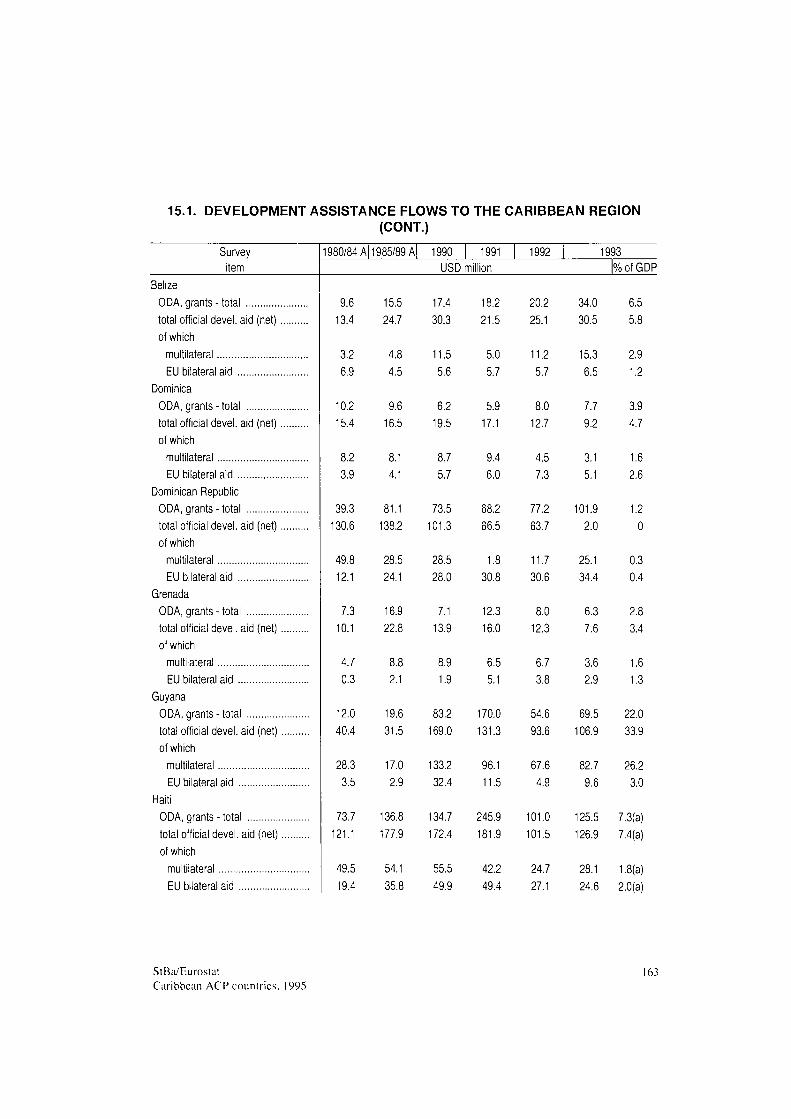
15.1. DEVELOPMENT ASSISTANCE FLOWS TO THE CARIBBEAN REGION (CONT.)
Survey item
Belize ODA, grants - total total official devel. aid (net). of which
multilateral EU bilateral aid
Dominica ODA, grants - total total official devel. aid (net). of which
multilateral EU bilateral aid
Dominican Republic ODA, grants - total total official devel. aid (net). of which
multilateral EU bilateral aid
Grenada ODA, grants - total total official devel. aid (net). of which
multilateral EU bilateral aid
Guyana ODA, grants - total total official devel. aid (net) of which
multilateral EU bilateral aid
Haiti ODA, grants-total total official devel. aid (net) of which
multilateral EU bilateral aid
1980/84 A 1985/89 A 1990 1991 1992 1993 USD million % of GDP
9.6 13.4
3.2 6.9
10.2 15.4
8.2 3.9
39.3 130.6
49.8 12.1
7.3 10.1
4.7 0.3
12.0 40.4
28.3 3.5
73.7 121.1
49.5 19.4
15.5 24.7
4.8 4.5
9.6 16.5
81.1 138.2
28.5 24.1
16.9 22.8
2.1
19.6 31.5
17.0 2.9
136.8 177.9
54.1
35.8
17.4
30.3
11.5 5.6
6.2 19.5
8.7 5.7
73.5 101.3
28.5 28.0
7.1 13.9
8.9 1.9
83.2 169.0
133.2 32.4
134.7 172.4
55.5 49.9
18.2 21.5
5.0 5.7
5.9 17.1
9.4 6.0
68.2 66.5
1.8 30.8
12.3 16.0
6.5 5.1
170.0 131.3
96.1 11.5
245.9 181.9
42.2 49.4
20.2 25.1
11.2 5.7
8.0 12.7
4.5 7.3
77.2 63.7
11.7 30.6
8.0 12.3
6.7 3.8
54.6 93.6
67.6 4.9
101.0 101.5
24.7 27.1
34.0 30.5
15.3 6.5
7.7 9.2
3.1 5.1
101.9 2.0
25.1 34.4
6.3 7.6
3.6 2.9
69.5 106.9
82.7 9.6
6.5 5.8
2.9 1.2
3.9 4.7
1.6 2.6
1.2 0
0.3 0.4
2.8 3.4
1.6 1.3
22.0 33.9
26.2 3.0
125.5 7.3(a) 126.9 7.4(a)
28.1 1.8(a) 24.6 2.0(a)
StBa/Eurostat Caribbean ACP countries. 1995
163
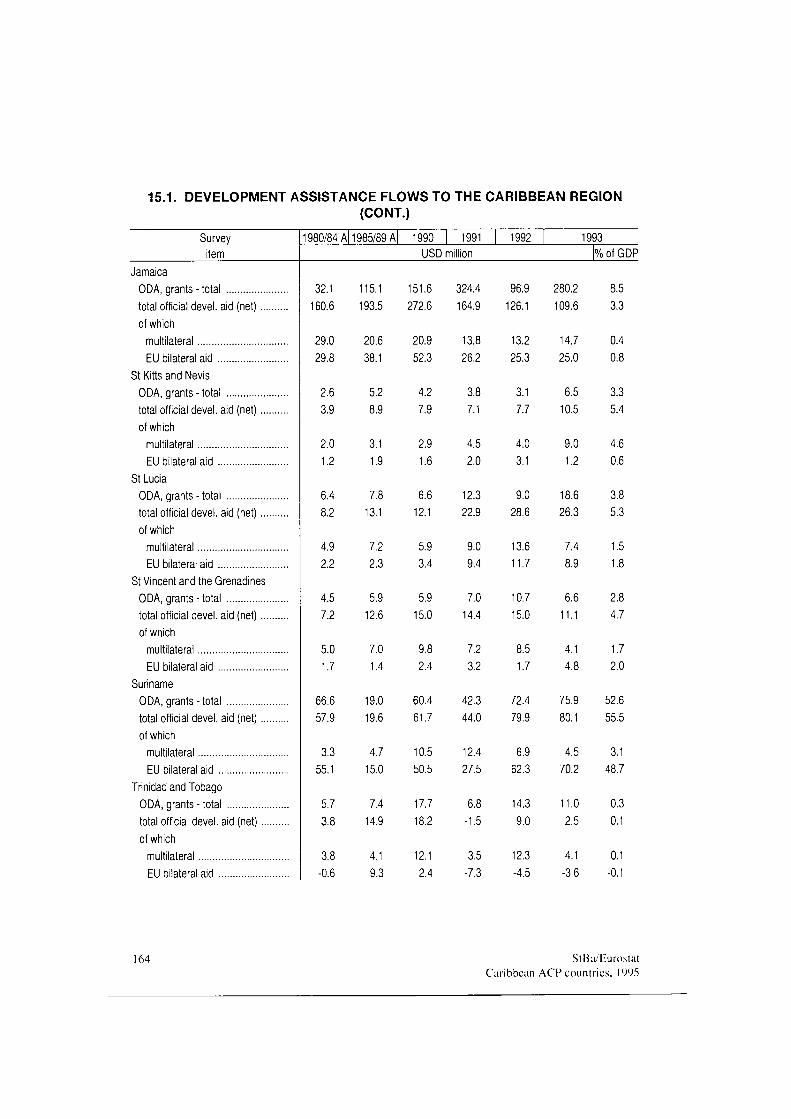
15.1. DEVELOPMENT ASSISTANCE FLOWS TO THE CARIBBEAN REGION (CONT.)
Survey item
Jamaica ODA, grants-total total official devel. aid (net) of which
multilateral EU bilateral aid
St Kitts and Nevis ODA, grants - total total official devel. aid (net) of which
multilateral EU bilateral aid
St Lucia ODA, grants - total total official devel. aid (net) of which
multilateral EU bilateral aid
St Vincent and the Grenadines ODA, grants-total total official devel. aid (net) of which
multilateral EU bilateral aid
Suriname ODA, grants - total total official devel. aid (net) of which
multilateral EU bilateral aid
Trinidad and Tobago ODA, grants - total total official devel. aid (net) of which
multilateral EU bilateral aid
1980/84 A 1985/89 A
32.1 160.6
29.0 29.8
2.6 3.9
2.0 1.2
6.4 8.2
4.9 2.2
4.5 7.2
5.0 1.7
66.6 57.9
3.3 55.1
5.7 3.8
3.8 -0.6
115.1 193.5
20.6 38.1
5.2 8.9
3.1 1.9
7.8 13.1
7.2 2.3
5.9 12.6
7.0 1.4
19.0 19.6
47 15.0
7.4 14.9
4.1 9.3
1990 USD
151.6 272.6
20.9 52.3
4.2 7.9
2.9 1.6
6.6 12.1
5.9 3.4
5.9 15.0
9.8 2.4
60.4 61.7
10.5 50.5
17.7 18.2
12.1 2.4
1991 million
324.4 164.9
13.8 26.2
3.8 7.1
4.5 2.0
12.3 22.9
9.0 9.4
7.0 14.4
7.2 3.2
42.3 44.0
12.4 27.5
6.8 -1.5
3.5 -7.3
1992
96.9 126.1
13.2 25.3
3.1 7.7
4.0 3.1
9.0 28.6
13.6 11.7
10.7 15.0
8.5 1.7
72.4 79.9
6.9 62.3
14.3 9.0
12.3 -4.5
1993
280.2 109.6
14.7 25.0
6.5 10.5
9.0 1.2
18.6 26.3
7.4 8.9
6.6 11.1
4.1 4.8
75.9 80.1
4.5 70.2
11.0 2.5
4.1 -3.6
% of GDP
8.5 3.3
0.4 0.8
3.3 5.4
4.6 0.6
3.8 5.3
1.5 1.8
2.8 4.7
1.7 2.0
52.6 55.5
3.1 48.7
0.3 0.1
0.1 -0.1
164 StBa/Eurostat Caribbean ACP countries. 1995
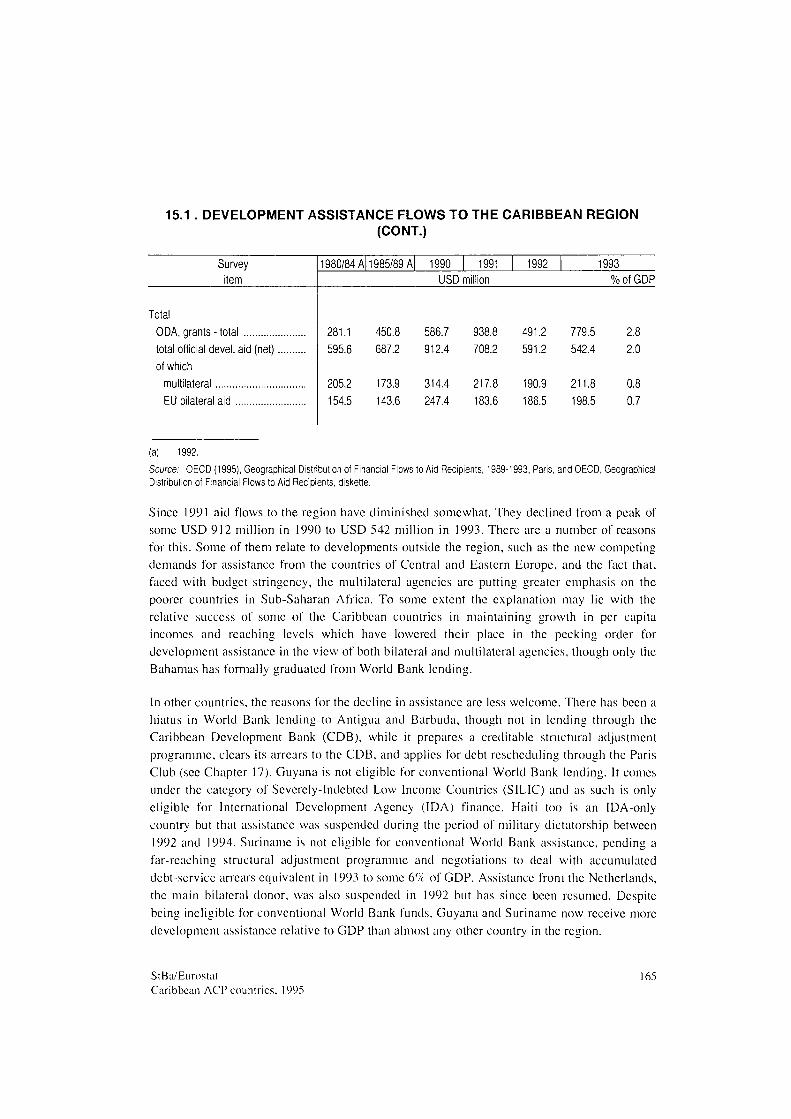
15.1 . DEVELOPMENT ASSISTANCE FLOWS TO THE CARIBBEAN REGION (CONT.)
Survey item
1980/84 A 1985/89 A 1990 1991 1992 1993 USD million % of GDP
Total ODA, grants - total total official devel. aid (net). of which
multilateral EU bilateral aid
281.1 595.6
205.2 154.5
450.8 687.2
173.9 143.6
586.7 912.4
314.4 247.4
938.8 708.2
217.8 183.6
491.2 591.2
190.9 186.5
779.5 542.4
211.8 198.5
2.8 2.0
0.8 0.7
(a) 1992.
Source: OECD (1995), Geographical Distribution of Financial Flows to Aid Recipients, 1989-1993, Paris, and OECD, Geographical Distribution of Financial Flows to Aid Recipients, diskette.
Since 1991 aid flows to the region have diminished somewhat. They declined from a peak of some USD 912 million in 1990 to USD 542 million in 1993. There are a number of reasons for this. Some of them relate to developments outside the region, such as the new competing demands for assistance from the countries of Central and Eastern Europe, and the fact that, faced with budget stringency, the multilateral agencies are putting greater emphasis on the poorer countries in Sub-Saharan Africa. To some extent the explanation may lie with the relative success of some of the Caribbean countries in maintaining growth in per capita incomes and reaching levels which have lowered their place in the pecking order for development assistance in the view of both bilateral and multilateral agencies, though only the Bahamas has formally graduated from World Bank lending.
In other countries, the reasons for the decline in assistance arc less welcome. There has been a hiatus in World Bank lending to Antigua and Barbuda, though not in lending through the Caribbean Development Bank (CDB), while it prepares a creditable structural adjustment programme, clears its arrears to the CDB, and applies for debt rescheduling through the Paris Club (sec Chapter 17). Guyana is not eligible for conventional World Bank lending. It comes under the category of Severely-Indebted Low Income Countries (SILIC) and as such is only eligible for International Development Agency (IDA) finance. Haiti too is an IDA-only country but that assistance was suspended during the period of military dictatorship between 1992 and 1994. Suriname is not eligible for conventional World Bank assistance, pending a far-reaching structural adjustment programme and negotiations to deal with accumulated debt-service arrears equivalent in 1993 to some 6% of GDP. Assistance from the Netherlands, the main bilateral donor, was also suspended in 1992 but has since been resumed. Despite being ineligible for conventional World Bank funds, Guyana and Suriname now receive more development assistance relative to GDP than almost any other country in the region.
StBa/Eurostat Caribbean ACP countries. 1995
165
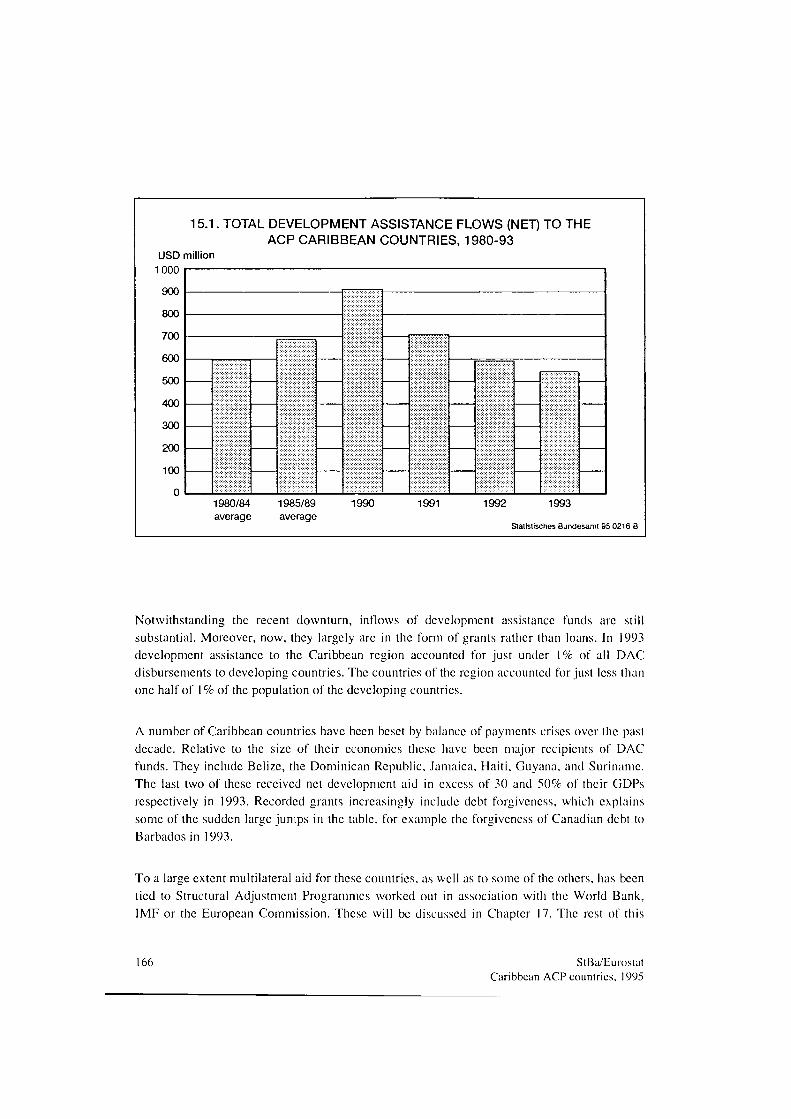
15.1. TOTAL DEVELOPMENT ASSISTANCE FLOWS (NET) TO THE ACP CARIBBEAN COUNTRIES, 1980-93
USD million
1 000
900
800
700
600
500
400
300
200
100
o 1980/84 1985/89 1990 1991 1992 1993 average average
Statistisches Bundesamt 95 0216 Β
Notwithstanding the recent downturn, inflows of development assistance funds are still substantial. Moreover, now, they largely are in the form of grants rather than loans. In 1993 development assistance to the Caribbean region accounted for just under 1% of all DAC disbursements to developing countries. The countries of the region accounted for just less than one half of 1 % of the population of the developing countries.
A number of Caribbean countries have been beset by balance of payments crises over the past decade. Relative to the size of their economics these have been major recipients of DAC funds. They include Belize, the Dominican Republic, Jamaica, Haiti, Guyana, and Suriname. The last two of these received net development aid in excess of 30 and 50% of their GDPs respectively in 1993. Recorded grants increasingly include debt forgiveness, which explains some of the sudden large jumps in the tabic, for example the forgiveness of Canadian debt to Barbados in 1993.
To a large extent multilateral aid for these countries, as well as to some of the others, has been tied to Structural Adjustment Programmes worked out in association with the World Bank, IMF or the European Commission. These will be discussed in Chapter 17. The rest of this
166 StBa/Eurostat Caribbean ACP countries, 1995
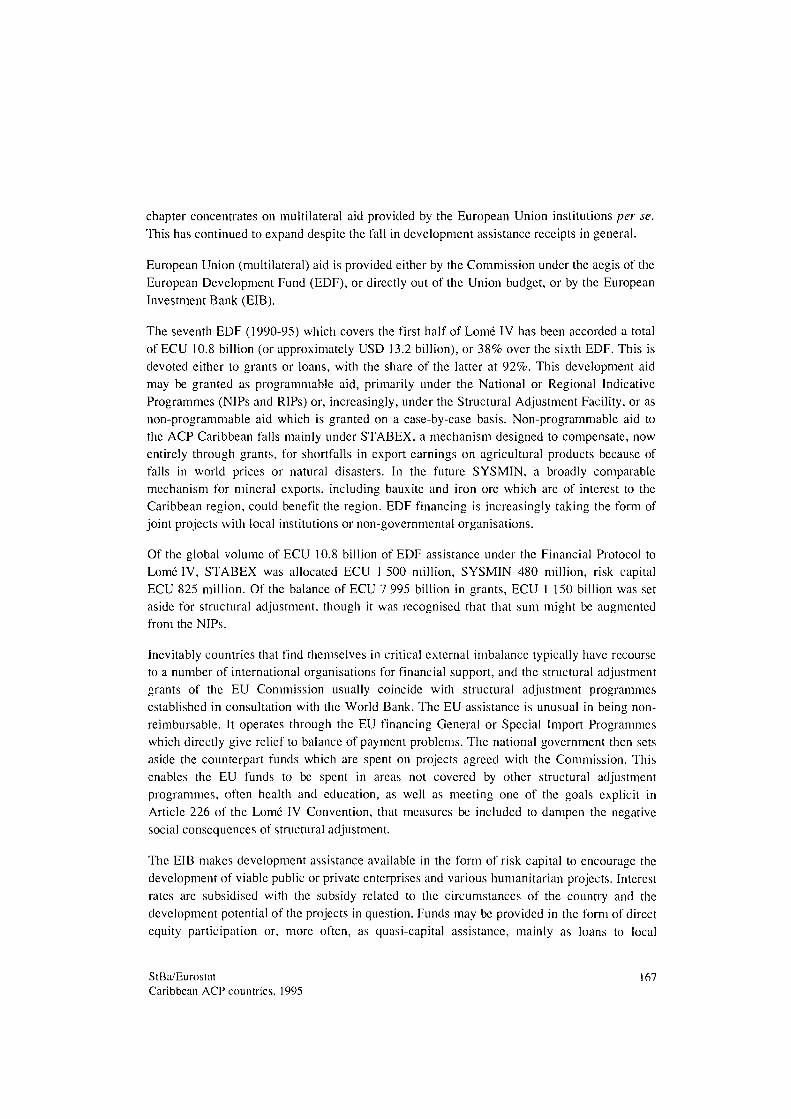
chapter concentrates on multilateral aid provided by the European Union institutions per se. This has continued to expand despite the fall in development assistance receipts in general.
European Union (multilateral) aid is provided either by the Commission under the aegis of the European Development Fund (EDF), or directly out of the Union budget, or by the European Investment Bank (EIB).
The seventh EDF (1990-95) which covers the first half of Lomé IV has been accorded a total of ECU 10.8 billion (or approximately USD 13.2 billion), or 38% over the sixth EDF. This is devoted either to grants or loans, with the share of the latter at 92%. This development aid may be granted as programmable aid, primarily under the National or Regional Indicative Programmes (NIPs and RIPs) or, increasingly, under the Structural Adjustment Facility, or as non-programmable aid which is granted on a case-by-case basis. Non-programmable aid to the ACP Caribbean falls mainly under STABEX, a mechanism designed to compensate, now entirely through grants, for shortfalls in export earnings on agricultural products because of falls in world prices or natural disasters. In the future SYSMIN, a broadly comparable mechanism for mineral exports, including bauxite and iron ore which are of interest to the Caribbean region, could benefit the region. EDF financing is increasingly taking the form of joint projects with local institutions or non-governmental organisations.
Of the global volume of ECU 10.8 billion of EDF assistance under the Financial Protocol to Lomé IV, STABEX was allocated ECU 1 500 million, SYSMIN 480 million, risk capital ECU 825 million. Of the balance of ECU 7 995 billion in grants, ECU 1 150 billion was set aside for structural adjustment, though it was recognised that that sum might be augmented from the NIPs.
Inevitably countries that find themselves in critical external imbalance typically have recourse to a number of international organisations for financial support, and the structural adjustment grants of the EU Commission usually coincide with structural adjustment programmes established in consultation with the World Bank. The EU assistance is unusual in being nonreimbursable. It operates through the EU financing General or Special Import Programmes which directly give relief to balance of payment problems. The national government then sets aside the counterpart funds which are spent on projects agreed with the Commission. This enables the EU funds to be spent in areas not covered by other structural adjustment programmes, often health and education, as well as meeting one of the goals explicit in Article 226 of the Lomé IV Convention, that measures be included to dampen the negative social consequences of structural adjustment.
The EIB makes development assistance available in the form of risk capital to encourage the development of viable public or private enterprises and various humanitarian projects. Interest rates are subsidised with the subsidy related to the circumstances of the country and the development potential of the projects in question. Funds may be provided in the form of direct equity participation or. more often, as quasi-capital assistance, mainly as loans to local
StBa/Eurostat 167 Caribbean ACP countries. 1995
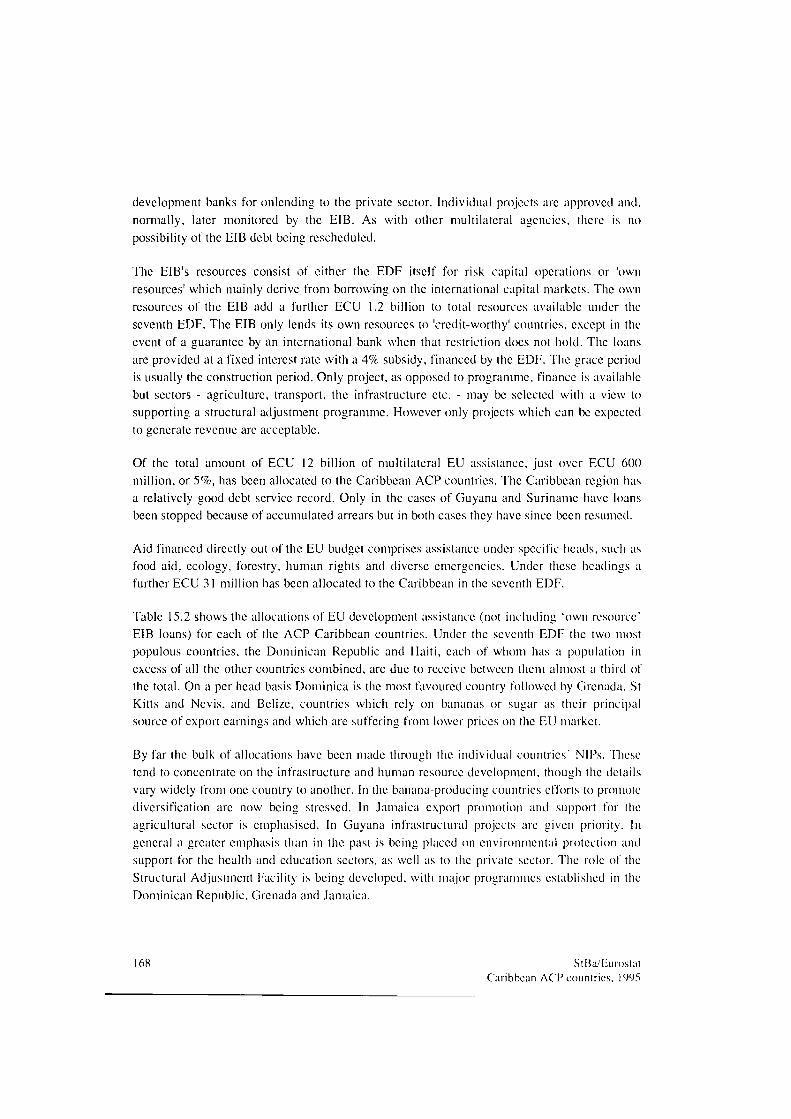
development banks for onlending to the private sector. Individual projects arc approved and. normally, later monitored by the EIB. As with other multilateral agencies, there is no possibility of the EIB debt being rescheduled.
The EIB's resources consist of cither the EDF itself for risk capital operations or 'own resources' which mainly derive from borrowing on the international capital markets. The own resources of the EIB add a further ECU 1.2 billion to total resources available under the seventh EDF. The EIB only lends its own resources to 'credit-worthy' countries, except in the event of a guarantee by an international bank when that restriction docs not hold. The loans are provided at a fixed interest rate with a 4% subsidy, financed by the EDF. The grace period is usually the construction period. Only project, as opposed to programme, finance is available but sectors - agriculture, transport, the infrastructure etc. - may be selected with a view to supporting a structural adjustment programme. However only projects which can be expected to generate revenue arc acceptable.
Of the total amount of ECU 12 billion of multilateral EU assistance, just over ECU 600 million, or 5%, has been allocated to the Caribbean ACP countries. The Caribbean region has a relatively good debt service record. Only in the cases of Guyana and Suriname have loans been stopped because of accumulated arrears but in both cases they have since been resumed.
Aid financed directly out of the EU budget comprises assistance under specific heads, such as food aid, ecology, forestry, human rights and diverse emergencies. Under these headings a further ECU 31 million has been allocated to the Caribbean in the seventh EDF.
Table 15.2 shows the allocations of EU development assistance (not including "own resource' EIB loans) for each of the ACP Caribbean countries. Under the seventh EDF the two most populous countries, the Dominican Republic and Haiti, each of whom has a population in excess of all the other countries combined, are due to receive between them almost a third of the total. On a per head basis Dominica is the most favoured country followed by Grenada, St Kitts and Nevis, and Belize, countries which rely on bananas or sugar as their principal source of export earnings and which are suffering from lower prices on the EU market.
By far the bulk of allocations have been made through the individual countries' NIPs. These tend to concentrate on the infrastructure and human resource development, though the details vary widely from one country to another. In the banana-producing countries efforts to promote diversification are now being stressed. In Jamaica export promotion and support for the agricultural sector is emphasised. In Guyana infrastructural projects are given priority. In general a greater emphasis than in the past is being placed on environmental protection and support for the health and education sectors, as well as to the private sector. The role of the Structural Adjustment Facility is being developed, with major programmes established in the Dominican Republic. Grenada and Jamaica.
168 StBa/Eurostat Caribbean ACP countries, 1995
15.2. TOTAL RESOURCES ALLOCATED TO THE ACP CARIBBEAN UNDER SUCCESSIVE EUROPEAN DEVELOPMENT FUNDS*
(ECU million)
Country 1976-80 1981-85 1986-90 1991-95
Antigua and Barbuda Bahamas Barbados Belize Dominica Dominican Republic Grenada Guyana Haiti Jamaica St Kitts and Nevis St Lucia St Vincent and the Grenadines . Suriname Trinidad and Tobago
Regional1
Total1
EU budget 5 year NIP other EDF+EIB
2.1 1.8 2.7 4.1 9.5
2.5 16.0
21.1 1.7 4.4 3.6
18.0 21.6
10.0
119.1 1.2
93.9 24.0
2.8 2.1 3.7 8.5 8.5
9.6 53.6
39.4 3.2 6.7 8.0
22.4 45.7
33.9
248.1 1.7
134.0 112.4
6.0 25.0 5.0
15.9 11.5 0.0
10.7 26.8 32.4 87.5 5.0 8.0 9.9
27.3 32.4
47.2
350.6 34.5
198.0 118.1
4.5 3.9 5.5
15.0 11.3
134.0 11.8 37.9
162.3 91.2 3.5 6.5 6.5
27.0 70.5
42.0
633.4 31.0
393.0 209.4
The Dominican Republic and Haiti only joined the ACP group in 1989. Includes small allocations to Montserrat.
Source: European Commission, EU-ACP Cooperation, 1993.
The RIP covers the 15 ACP countries. It concentrates on the promotion and support for regional cooperation. The sectors involved will likely include trade, tourism, transport and telecommunications.
Because of the lags between the establishment of an EDF, the agreement with the beneficiary countries of a NIP and possibly a Structural Adjustment grant, the programming of the projects and the actual disbursement of funds, several EDF cycles are currently being
StBa/Eurostat Caribbean ACP countries, 1995
169
managed at any one time. EDF V was only closed at the end of 1993 and the balance of funds transferred to EDF VII. These lags also mean considerable apparent shortfalls in actual disbursements relative to allocations over any period. Data on disbursements over the period 1989 to 1993 are shown in Table 15.3.
15.3. EDF PAYMENTS BY PRINCIPAL INSTRUMENT USD million
Survey item 1990 1991 1992 1993
Antigua and Barbuda NIP
Bahamas NIP
Barbados NIP
Belize NIP
Dominica of which NIP STABEX
Dominican Republic .. of which NIP SAF
Grenada of which NIP STABEX
Guyana of which NIP SAF
Haiti Jamaica
NIP St Kitts and Nevis
NIP
0.4 0.3 0.9 0.8 0.1 0.0 0.8 0.0 1.7
0.9 0.8 0.5 0.4 0.3 0.1 2.4 0.9 3.8
0.6 0.6 1.0 1.0 0.6 0.6 4.6 4.0 1.9
0.5 0.5 0.4 0.4 1.4 0.8 5.7 4.7 1.4
0.5 0.5 0.8 0.8 1.6 0.7 6.7 4.3 1.6
0.7 0.0 0.0
0.0 0.0 3.2
1.4 0.9 6.1
5.7 0.0 0.0 4.2 0.7 0.7 0.1
1.0 1.5 0.0
0.0 0.0 2.8
0.8 0.9
28.5
11.2 0.0 0.0 7.3 4.3 0.8 0.6
0.5 0.0 0.0
0.0 0.0 3.2
0.7 2.5
18.5
4.0 0.0 0.0 7.7 6.1 2.1 2.1
0.0 1.0
12.9
10.9 0.0 0.8
0.1 0.0 7.1
2.5 0.0 1.0
12.5 10.5 0.5 0.5
0.1 0.0
16.4
1.4 0.2 1.6
1.1 0.0
13.9
1.4 3.6 1.1
11.1 8.1 0.0 0.0
(continued on next page)
170 StBa/Eurostat Caribbean ACP countries. 1995
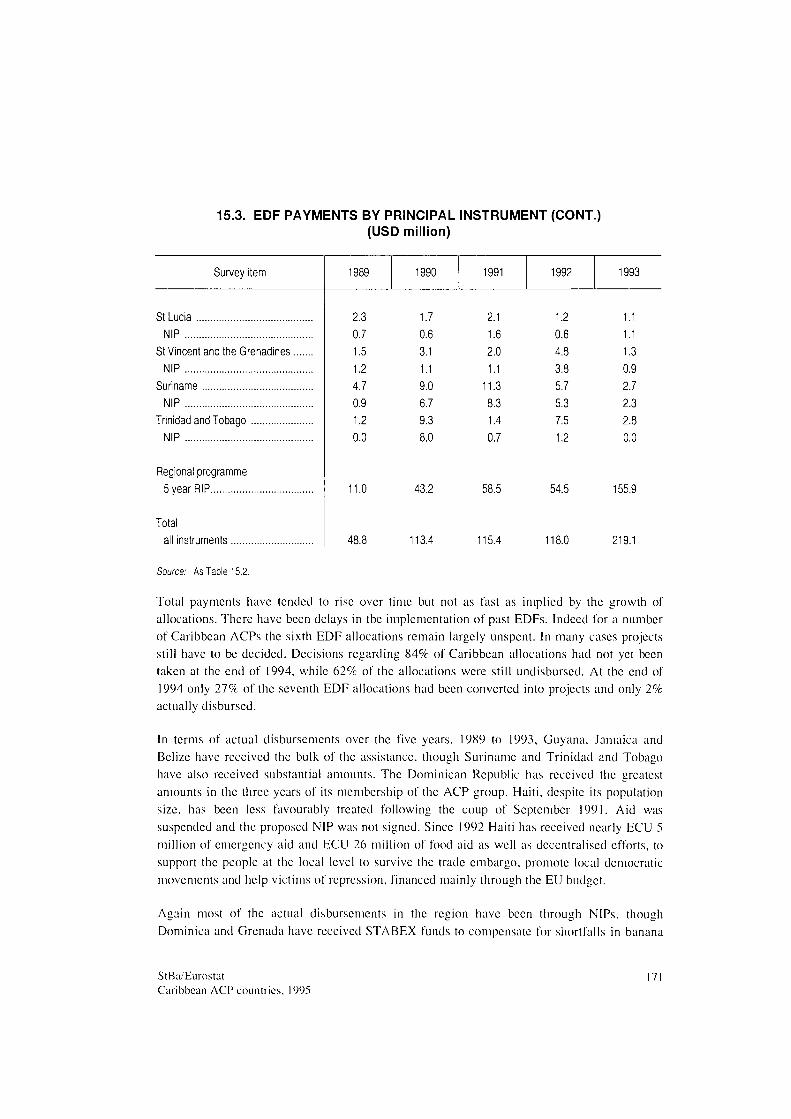
15.3. EDF PAYMENTS BY PRINCIPAL INSTRUMENT (CONT.) (USD million)
Survey item 1990 1991 1992 1993
St Lucia NIP
St Vincent and the Grenadines. NIP
Suriname NIP
Trinidad and Tobago NIP
Regional programme 5 year RIP
Total all instruments
2.3 0.7 1.5 1.2 4.7 0.9 1.2 0.0
11.0
48.8
1.7 0.6 3.1 1.1 9.0 6.7 9.3 8.0
43.2
13.4
2.1 1.6 2.0 1.1
11.3 8.3 1.4 0.7
58.5
115.4
1.2 0.6 4.8 3.8 5.7 5.3 7.5 1.2
54.5
118.0
1.1 1.1 1.3 0.9 2.7 2.3 2.8 0.0
155.9
219.1
Source: As Table 15.2.
Total payments have tended to rise over time but not as fast as implied by the growth of allocations. There have been delays in tbe implementation of past EDFs. Indeed for a number of Caribbean ACPs the sixth EDF allocations remain largely unspent. In many cases projects still have to be decided. Decisions regarding 84% of Caribbean allocations had not yet been taken at the end of 1994, while 62% of the allocations were still undisbursed. At the end of 1994 only 27% of the seventh EDF allocations had been converted into projects and only 2% actually disbursed.
In terms of actual disbursements over the five years, 1989 to 1993, Guyana, Jamaica and Belize have received the bulk of the assistance, though Suriname and Trinidad and Tobago have also received substantial amounts. The Dominican Republic has received the greatest amounts in the three years of its membership of the ACP group. Haiti, despite its population size, has been less favourably treated following the coup of September 1991. Aid was suspended and the proposed NIP was not signed. Since 1992 Haiti has received nearly ECU 5 million of emergency aid and ECU 26 million of food aid as well as decentralised efforts, to support the people at the local level to survive the trade embargo, promote local democratic movements and help victims of repression, financed mainly through the EU budget.
Again most of the actual disbursements in the region have been through NIPs, though Dominica and Grenada have received STABEX funds to compensate for shortfalls in banana
StBa/Eurostat Caribbean ACP countries. 1995
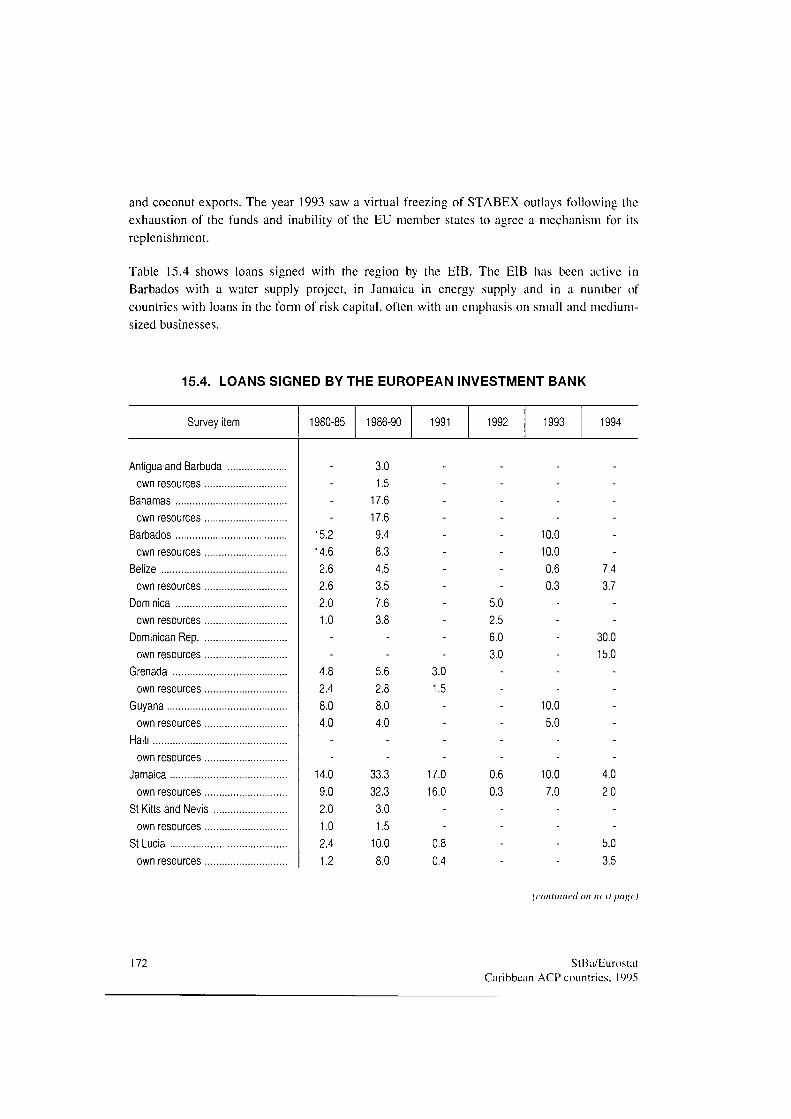
and coconut exports. The year 1993 saw a virtual freezing of STABEX outlays following the exhaustion of the funds and inability of the EU member states to agree a mechanism for its replenishment.
Table 15.4 shows loans signed with the region by the EIB. The EIB has been active in Barbados with a water supply project, in Jamaica in energy supply and in a number of countries with loans in the form of risk capital, often with an emphasis on small and medium-sized businesses.
15.4. LOANS SIGNED BY THE EUROPEAN INVESTMENT BANK
Survey item 1980-85 1986-90 1991 1992 1993 1994
Antigua and Barbuda own resources
Bahamas own resources
Barbados own resources
Belize own resources
Dominica own resources
Dominican Rep own resources
Grenada own resources
Guyana own resources
Haiti own resources
Jamaica own resources
St Kitts and Nevis own resources
St Lucia own resources
----
15.2 14.6 2.6 2.6 2.0 1.0
--
4.8 2.4 8.0 4.0
14.0 9.0 2.0 1.0 2.4 1.2
3.0 1.5
17.6 17.6 9.4 8.3 4.5 3.5 7.6 3.8
--
5.6 2.8 8.0 4.0
33.3 32.3 3.0 1.5
10.0 8.0
------------
3.0 1.5
--
17.0 16.0
--
0.8 0.4
--------
5.0 2.5 6.0 3.0
----
0.6 0.3
----
----
10.0 10.0 0.6 0.3
------
10.0 5.0
10.0 7.0
----
------
7.4 3.7
--
30.0 15.0
----
4.0 2.0
--
5.0 3.5
(continued on next page)
172 StBa/Eurostat Caribbean ACP countries, 1995
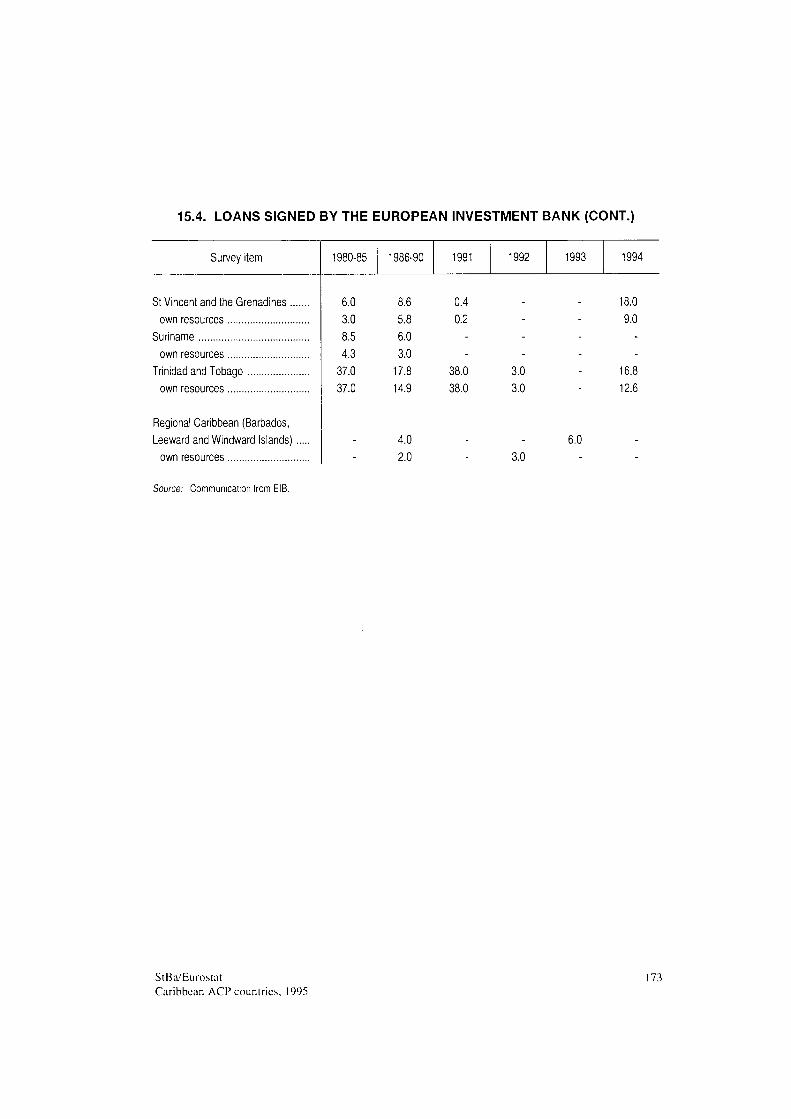
15.4. LOANS SIGNED BY THE EUROPEAN INVESTMENT BANK (CONT.)
Survey item 1980-85 1986-90 1991 1992 1993 1994
St Vincent and the Grenadines ... own resources
Suriname own resources
Trinidad and Tobago own resources
Regional Caribbean (Barbados, Leeward and Windward Islands)
own resources
6.0 3.0 8.5 4.3
37.0 37.0
-
8.6 5.8 6.0 3.0
17.8 14.9
4.0 2.0
0.4 0.2
--
38.0 38.0
-
----
3.0 3.0
3.0
18.0 9.0
16.8 12.6
6.0
Source: Communication from EIB.
StBa/Eurostat Caribbean ACP countries, 1995
173
16. F O R E I G N D E B T
Frequent recourse to official and commercial borrowing over the 1970s and 1980s has left the ACP Caribbean region with a debt Overhang' of some USD 14 billion. This has not greatly changed since 1990. but all but trebled from 1980 to 1990. Table 16.1 shows that the Dominican Republic, Jamaica, Guyana and Trinidad and Tobago arc the most indebted. These countries accounted for about three quarters of the total. However they are among the larger countries. Haiti, though, has a relatively small debt. The low standard of living there has meant that it has been eligible for grant assistance in those years when the political situation has not deterred the major international institutions altogether.
A better way of looking at the weight of debt on the economy as a whole is through the dcbl-GDP ratio. This is also given in Table 16.1. It shows that the overall debt ratio has fallen from 58% in 1985 to 45% in 1993. In the case of the OECS it has risen from 26 to 41%. The rise has been sharp since 1991, not only because of debt increase but also falls in GDP growth due to hurricanes and the weakness of banana prices.
The table makes clear that the seriously-indebted countries arc Guyana. Dominica and Jamaica. The situation in Guyana has improved marginally since 1990 but is still unsustainable in the medium term. The continuing parlous situation is evident from its debt-GDP ratio of over 500% and debt-GNP ratio of over 750%. The Dominican Republic and Jamaica have both managed to reduce their debt ratios, in both cases by roughly half since 1985. The debt ratio for Jamaica however is still relatively high. The ratio for Dominica has suddenly jumped to an alarming level. Most of the debt is concessional and one would not expect to see the same proportional rise in servicing requirements.
Conventional debt service ratios, those arc the ratios of interest and repayments to exports of goods and services, are one measure of the running costs of debt relative to other (though not all) current foreign earnings. A major problem (but an advantage in other respects) in using these ratios is their ex post nature. If the interest on debts is rescheduled or the debtor falls into arrears, the debt service ratio falls but in a sense the future weight of debt service on the economy increases. That is why the World Bank has estimated ratios on the basis of projected debt service payments discounted to the present.' These ratios arc presented in Table 16.2.
The World Bank debt dalabank shows significant discrepancies with the OECD dalabank used for Tabic 16.1. 'Hie former is based on a debtor reporting system, while Ihe latter is based on creditor reporting. 'Hie main differences arise (i) from debt cancellation arte rescheduling transactions, reported by creditors when they lake place but debtors may report them when the arrangements are made, (ii) from interest arrears, reported by creditors when they are capitalised, but debtors report the cumulative stock of arrears at the end of the reporting period and (iii) debi writeoffs, which are reported by creditors, but which do not enter debtor records, at least for some lime.
174 StBa/Eurostat Caribbean ACP countries. 1995
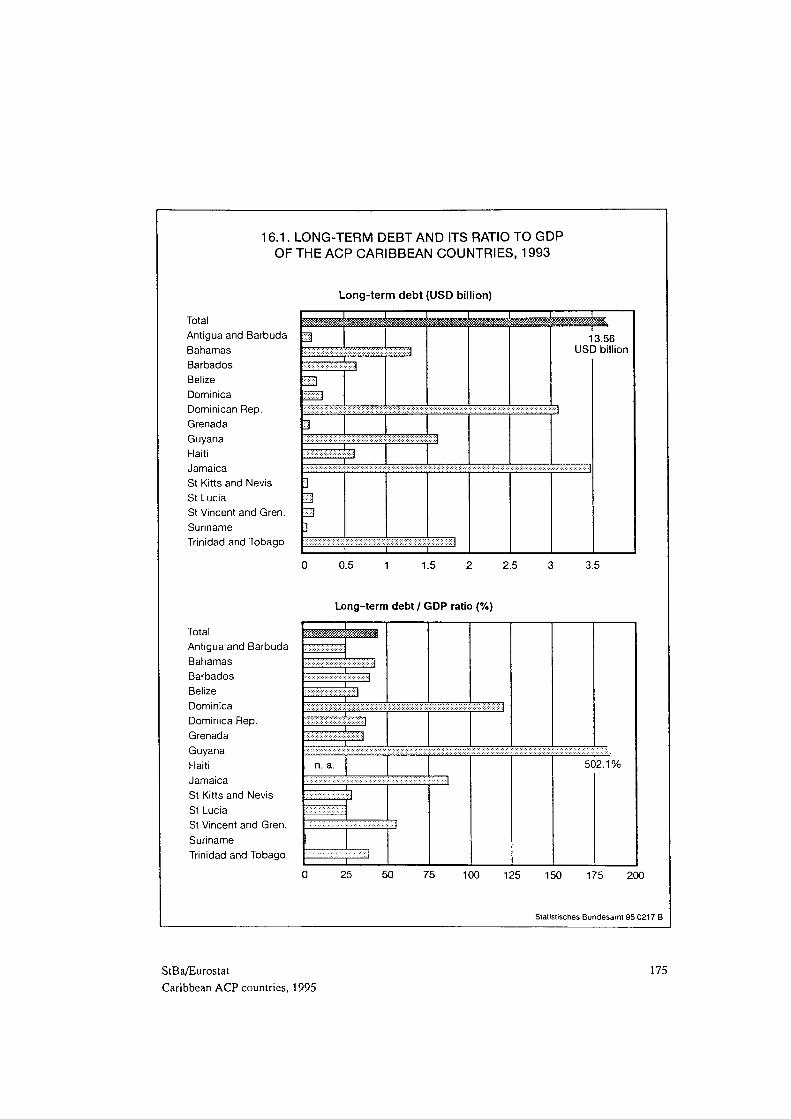
16.1. LONGTERM DEBT AND ITS RATIO TO GDP
OF THE ACP CARIBBEAN COUNTRIES, 1993
Longterm debt (USD billion)
Total Antigua and Barbuda
Barbados Belize
Dominica
Dominican Rep. Grenada
Guyana
Haiti
Jamaica St Kitts and Nevis
St Lucia
St Vincent and Gren.
Suriname
Trinidad and Tobago
I
img8sm8®Mm* mmgm wsmmmmsmmmsmi^s^sismzm. m
ι , ■;■■■--<:-Μ
m
" " ' " " J 13.56
USD hillinn
I
3 ■■ ι
:/·.■:.·,: ·.·. ι ι
■ι
3
m m Ì
■ ■ * : . : · . ; : . ■ ■ ■ , : \
ι I I
0.5 1.5 2.5 3.5
Longterm debt / GDP ratio (%)
Total
Antigua and Barbuda
Bahamas
Barbados
Belize
Dominica
Dominica Rep.
Grenada
Guyana
Haiti
Jamaica
St Kitts and Nevis
St Lucia
St Vincent and Gren.
Suriname
Trinidad and Tobago
:??^^^^%?Ç^^^
,,,,,,, ,,,
.,": . ' " , '
·... π·.,' ■i,:·/'■■:■:¥::
τ " I
I . .; .·; I ,
,¥:'|
I
n. a.
Λ
I
! I
ι
I
5C 2.1%
25 50 75 100 125 150 175 200
Stallstisches Bundesamt 95 0217 Β
StBa/Eurostat
Caribbean ACP countries, 1995
175
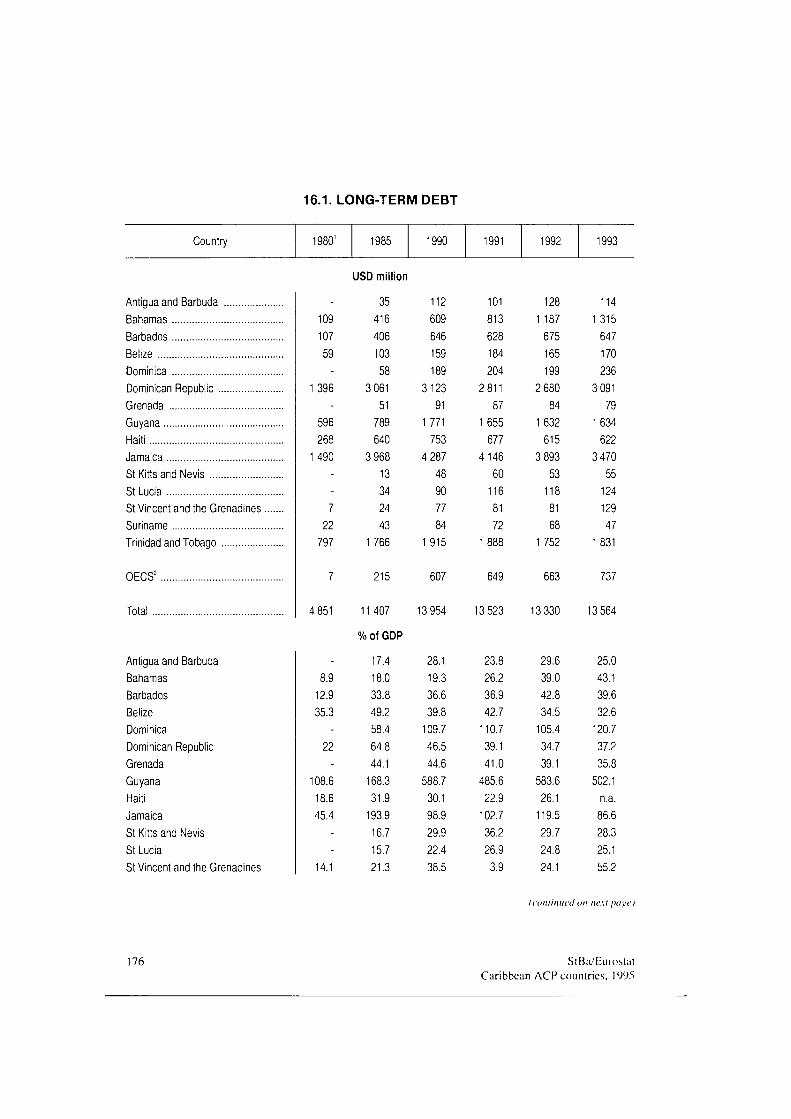
16.1. LONG-TERM DEBT
Country
Antigua and Barbuda Bahamas Barbados Belize Dominica Dominican Republic Grenada Guyana Haiti Jamaica St Kitts and Nevis St Lucia St Vincent and the Grenadines Suriname Trinidad and Tobago
OECS2
Total
Antigua and Barbuda Bahamas Barbados Belize Dominica Dominican Republic Grenada Guyana Haiti Jamaica St Kitts and Nevis St Lucia St Vincent and the Grenadines
1980'
109 107 59
-1396
-596 268
1 490
7 22
797
7
4 851
-8.9
12.9 35.3
-22
-108.6 18.6 45.4
--
14.1
1985
USD million
35 416 406 103 58
3 061 51
789 640
3 968 13 34 24 43
1766
215
11407
% of GDP
17.4 18.0 33.8 49.2 58.4 64.8 44.1
168.3 31.9
193.9 16.7 15.7 21.3
1990
112 609 646 159 189
3123 91
1771 753
4 287 48 90 77 84
1915
607
13 954
28.1 19.3 36.6 39.8
109.7 46.5 44.6
588.7 30.1 98.9 29.9 22.4
38.5
1991
101 813 628 184 204
2 811 87
1655 677
4146 60
116 81 72
1888
649
13 523
23.8 26.2 36.9 42.7
110.7 39.1 41.0
485.6 22.9
102.7 36.2 26.9 3.9
1992
128 1 187
675 165 199
2 680 84
1632 615
3 893 53
118 81 68
1 752
663
13 330
29.6 39.0 42.8 34.5
105.4 34.7 39.1
583.6 26.1
119.5 29.7 24.8 24.1
1993
114 1315
647 170 236
3 091 79
1634 622
3470 55
124 129 47
1831
737
13 564
25.0 43.1 39.6 32.6
120.7 37.2 35.8
502.1 n.a. 86.6 28.3 25.1 55.2
(continued on next poge)
176 StBa/Eurostat Caribbean ACP countries. 1995
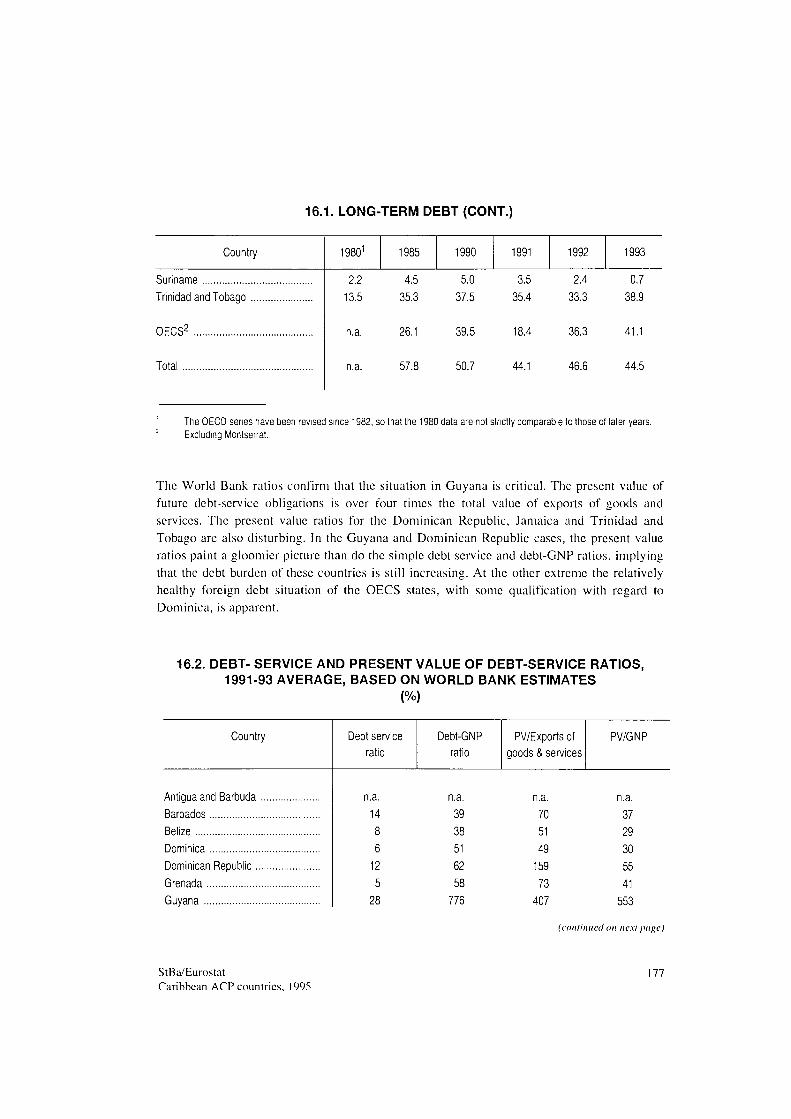
16.1. LONG-TERM DEBT (CONT.)
Country
Suriname Trinidad and Tobago
OECS2
Total
19801
2.2 13.5
n.a.
n.a.
1985
4.5 35.3
26.1
57.8
1990
5.0 37.5
39.5
50.7
1991
3.5 35.4
18.4
44.1
1992
2.4 33.3
36.3
46.6
1993
0.7 38.9
41.1
44.5
The OECD series have been revised since 1982, so that the 1980 data are not strictly comparable to those oí later years. Excluding Montserrat.
The World Bank ratios confirm that the situation in Guyana is critical. The present value of future debt-service obligations is over four times the total value of exports of goods and services. The present value ratios for the Dominican Republic, Jamaica and Trinidad and Tobago are also disturbing. In the Guyana and Dominican Republic cases, the present value ratios paint a gloomier picture than do the simple debt service and debt-GNP ratios, implying that the debt burden of these countries is still increasing. At the other extreme the relatively healthy foreign debt situation of the OECS states, with some qualification with regard to Dominica, is apparent.
16.2. DEBT- SERVICE AND PRESENT VALUE OF DEBT-SERVICE RATIOS, 1991-93 AVERAGE, BASED ON WORLD BANK ESTIMATES
(%)
Country
Antigua and Barbuda Barbados Belize Dominica Dominican Republic Grenada Guyana
Debt service ratio
Debt-GNP ratio
PV/Exports of goods & services
PV/GNP
n.a. n.a. n.a. n a 14 39 70 37 8 38 51 29 6 51 49 30
12 62 159 55 5 58 73 41
28 776 407 553
(continued on next page)
StBa/Eurostat Caribbean ACP countries, 1995
177
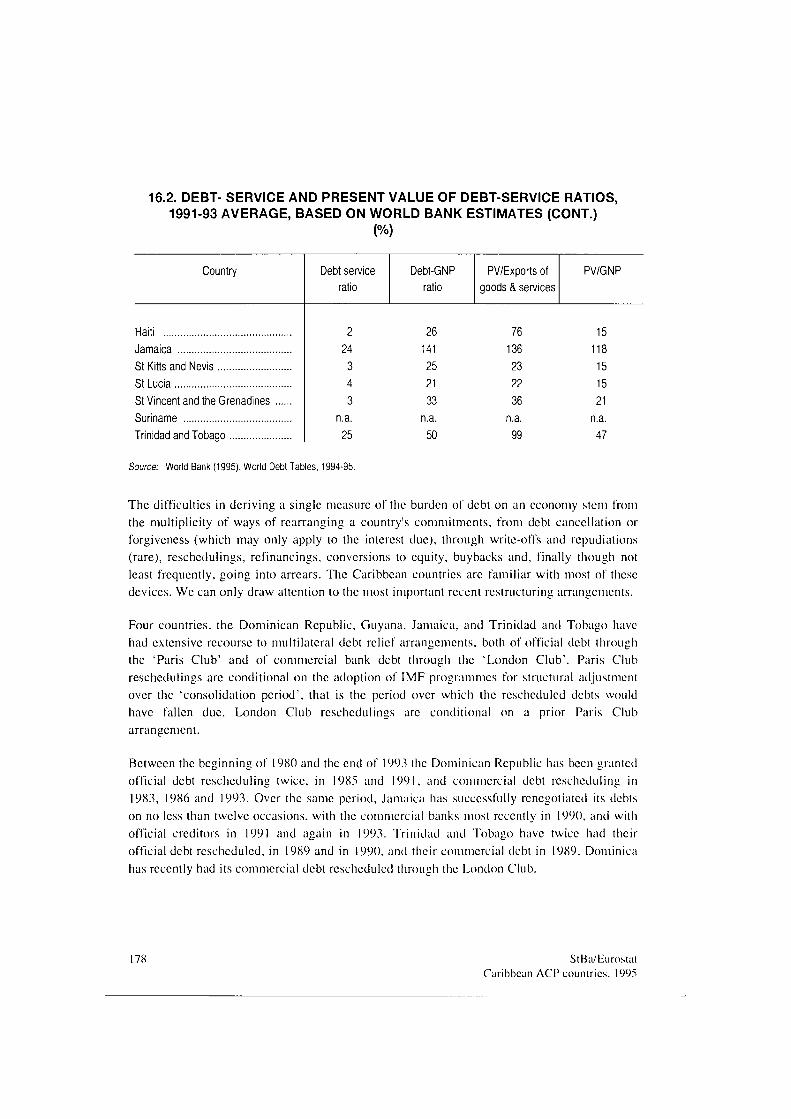
16.2. DEBT- SERVICE AND PRESENT VALUE OF DEBT-SERVICE RATIOS, 1991-93 AVERAGE, BASED ON WORLD BANK ESTIMATES (CONT.)
(%)
Country
Haiti Jamaica St Kitts and Nevis St Lucia St Vincent and the Grenadines Suriname Trinidad and Tobago
Debt service ratio
Debt-GNP ratio
PV/Exports of goods & services
PV/GNP
2 26 76 15 24 141 136 118 3 25 23 15 4 21 22 15 3 33 36 21
n.a. n.a. n.a. n.a. 25 50 99 47
Source: World Bank (1995), World Debt Tables, 1994-95.
The difficulties in deriving a single measure of the burden of debt on an economy stem from the multiplicity of ways of rearranging a country's commitments, from debt cancellation or forgiveness (which may only apply to the interest due), through write-offs and repudiations (rare), reschedulings, refinancings, conversions to equity, buybacks and, finally though not least frequently, going into arrears. The Caribbean countries arc familiar with most of these devices. We can only draw attention to the most important recent restructuring arrangements.
Four countries, the Dominican Republic, Guyana, Jamaica, and Trinidad and Tobago have had extensive recourse to multilateral debt relief arrangements, both of official debt through the 'Paris Club' and of commercial bank debt through the 'London Club'. Paris Club reschedulings arc conditional on the adoption of IMF programmes for structural adjustment over the 'consolidation period', that is the period over which the rescheduled debts would have fallen due. London Club reschedulings arc conditional on a prior Paris Club arrangement.
Between the beginning of 1980 and the end of 1993 the Dominican Republic has been granted official debt rescheduling twice, in 1985 and 1991, and commercial debt rescheduling in 1983, 1986 and 1993. Over the same period, Jamaica has successfully renegotiated its debts on no less than twelve occasions, with the commercial banks most recently in 1990. and with official creditors in 1991 and again in 1993. Trinidad and Tobago have twice had their official debt rescheduled, in 1989 and in 1990. and their commercial debt in 1989. Dominica has recently had its commercial debt rescheduled through the London Club.
178 StBa/Eurostat Caribbean ACP countries, 1995
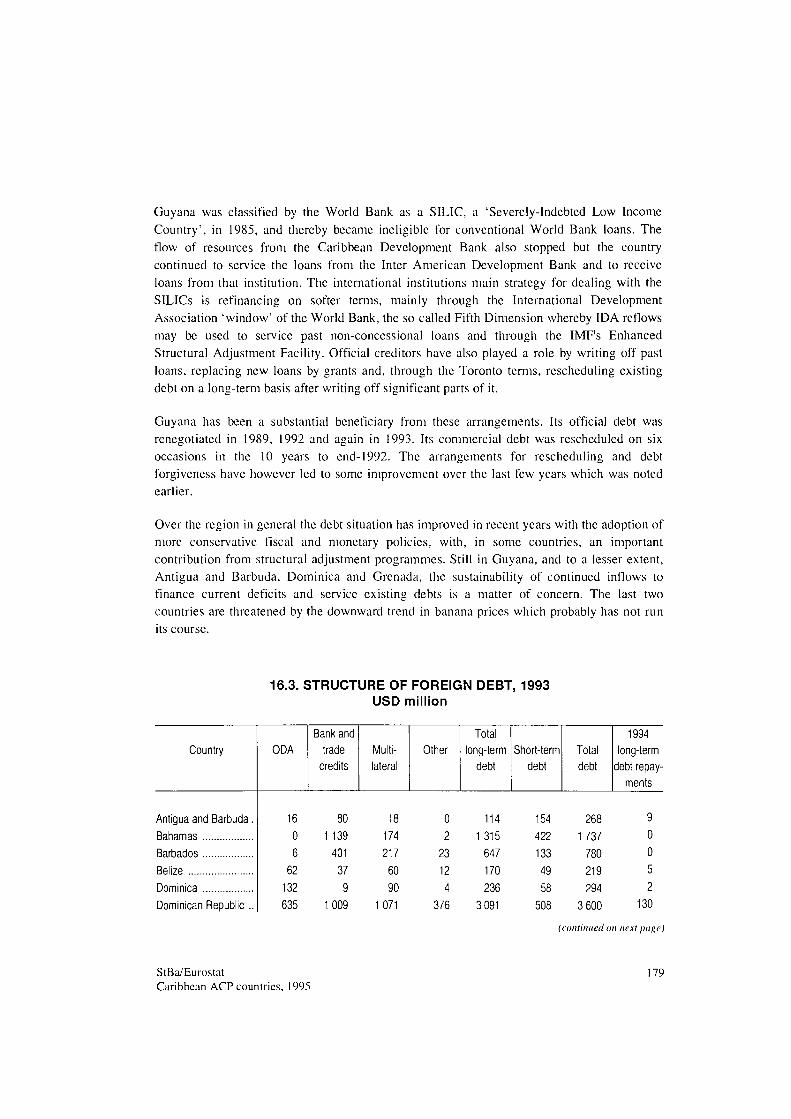
Guyana was classified by the World Bank as a SILIC, a 'Severely-Indebted Low Income Country', in 1985, and thereby became ineligible for conventional World Bank loans. The flow of resources from the Caribbean Development Bank also stopped but the country continued to service the loans from the Inter American Development Bank and to receive loans from that institution. The international institutions main strategy for dealing with the SILICs is refinancing on softer terms, mainly through the International Development Association 'window' of the World Bank, the so-called Fifth Dimension whereby IDA reflows may be used to service past non-concessional loans and through the IMF's Enhanced Structural Adjustment Facility. Official creditors have also played a role by writing off past loans, replacing new loans by grants and, through the Toronto terms, rescheduling existing debt on a long-term basis after writing off significant parts of it.
Guyana has been a substantial beneficiary from these arrangements. Its official debt was renegotiated in 1989, 1992 and again in 1993. Its commercial debt was rescheduled on six occasions in the 10 years to end-1992. The arrangements for rescheduling and debt forgiveness have however led to some improvement over the last few years which was noted earlier.
Over the region in general the debt situation has improved in recent years with the adoption of more conservative fiscal and monetary policies, with, in some countries, an important contribution from structural adjustment programmes. Still in Guyana, and to a lesser extent, Antigua and Barbuda, Dominica and Grenada, the sustainability of continued inflows to finance current deficits and service existing debts is a matter of concern. The last two countries are threatened by the downward trend in banana prices which probably has not run its course.
16.3. STRUCTURE OF FOREIGN DEBT, 1993 USD million
Country
Antigua and Barbuda. Bahamas Barbados Belize Dominica Dominican Republic ..
ODA
16 0 6
62 132 635
Bank and trade
credits
80 1 139
401 37 9
1009
Multilateral
18 174 217 60 90
1071
Other
0 2
23 12 4
376
Total long-term
debt
114 1315
647 170 236
3 091
Short-term debt
154 422 133 49 58
508
Total debt
268 1737
780 219 294
3 600
1994 long-term
debt repayments
9 0 0 5 2
130
(continued on next page)
StBa/Eurostat Caribbean ACP countries, 1995
179
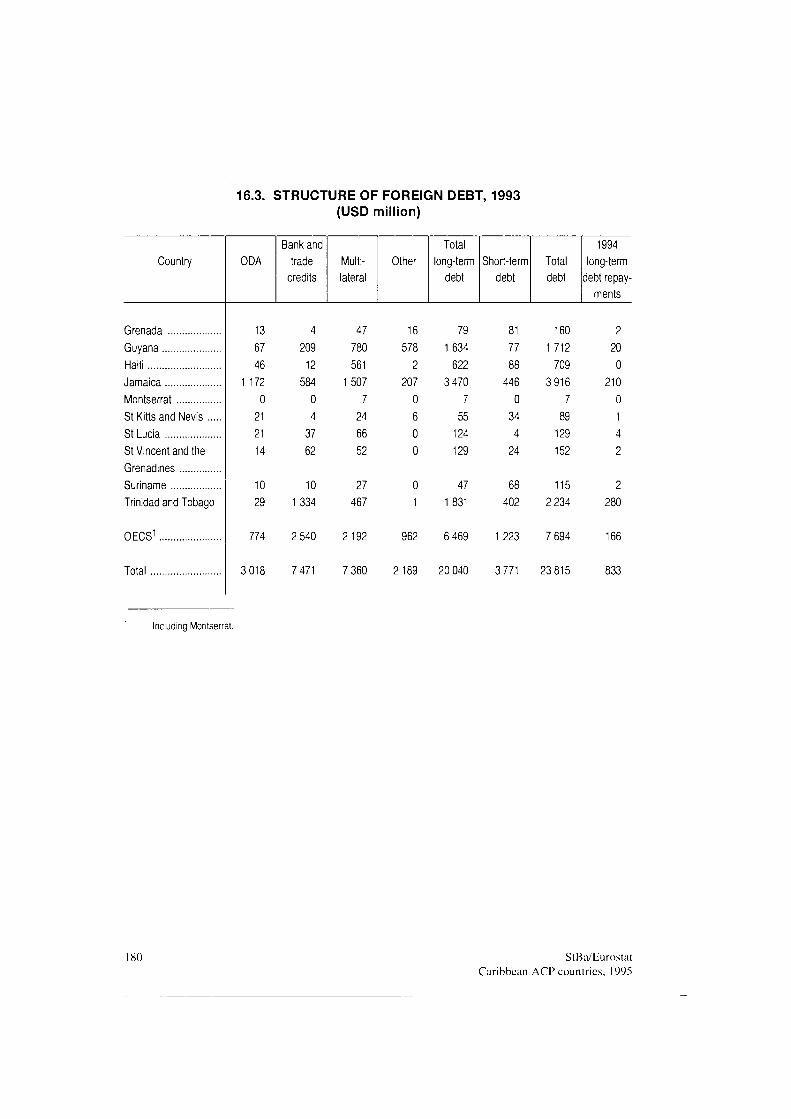
16.3. STRUCTURE OF FOREIGN DEBT, 1993 (USD million)
Country ODA Bank and
trade credits
Multilateral
Other Total
long-term debt
Short-term debt
Total debt
1994 long-term
debt repayments
Grenada Guyana Haiti Jamaica Montserrat St Kitts and Nevis ... St Lucia St Vincent and the Grenadines Suriname Trinidad and Tobago
OECS1
Total
13 67 46
1 172 0 21 21 14
10 29
774
3018
4 209 12
584 0 4 37 62
10 1334
2 540
7 471
47 780 561
1507 7 24 66 52
27 467
2192
7 360
16 578 2
207 0 6 0 0
79 1634 622
3 470 7 55 124 129
0 47
1 1 831
962 6 469
2189 20 040
81 77 88 446 0 34 4 24
160 1 712 709
3916 7 89 129 152
68 115
402 2 234
1 223 7 694
3 771 23 815
2 20 0
210 0 1 4 2
2
280
166
833
Including Montserrat.
180 StBa/Eurostat Caribbean ACP countries, 1995
17. ECONOMIC SYSTEMS, POLICIES AND STRUCTURAL ADJUSTMENT IN THE
CARIBBEAN ACP COUNTRIES
The 1970s and 1980s were difficult years for the Caribbean countries. Three massive increases in oil prices (if we stretch that period to include the Gulf War), unstable, and in most cases, secularly declining prices for their commodity exports, successive recessions in the developed countries, culminating in the deepest slump since the thirties between 1989 and 1992. The last was particularly acute in their main export markets of North America.
The Caribbean countries as a group had problems in managing these adverse conditions successfully, at least until the end of the 1980s. The response to the sharp adverse movements in the terms of trade was typically recourse to foreign currency borrowing. To a large extent the negative impact of terms of trade shocks on employment and growth were countered by expansive fiscal and monetary policies financed either by inflationary money creation or further borrowing. The goal was to protect living standards on the assumption that the external environment would improve later, but the outcome was a further deterioration of economic performance.
Even after the second oil crisis of 1978-79, most of the Caribbean countries pressed ahead with their expansionist policies. They continued to pump up demand and extend their official and, increasingly, commercial bank debt. Of course this crude generalisation covers a spectrum of differentiated responses.
To what extent differences in the economic systems which prevailed in different countries can explain differential policy responses is not obvious but they certainly played a role. Throughout the 1970s and most of the 1980s several countries, including Jamaica, Guyana, Suriname and Trinidad and Tobago maintained highly centralised regimes with a dominant and interventionist public sector. A comprehensive system of price control was maintained, the private sectors were beset by detailed regulation and often investments were restricted to prevent competition for public enterprises, tariffs were maintained at highly protective levels, foreign exchange was strictly rationed and exports often subjected to licensing. Under these circumstances it was not surprising that generally the private sector saved more than it invested and the public sector invested more than it saved. Where there was not a clear competition between private and public investment, as in some of the OECS states, overall investment was higher and, as suggested earlier, investment rates in the Caribbean have generally been closely correlated with growth rates.
Another problem that this set of policies gave rise to was an overvalued exchange rate. Between 1980 and 1985, the REER had increased 28% in the case of Barbados, 34% for Belize, 52% for Guyana, and 62% for Suriname (see Table 17.1). The Dominican Republic
StBa/Eurostat 181 Caribbean ACP countries. 1995
and Jamaica depreciated their grossly overvalued currencies from 1982 onwards, but in Jamaica's case the REER crept up again, rising 15r/r between 1985 and 1989. These high REERs were obviously inimical to investment, exports and growth, and the diversification of the structure of production. Five countries (the Dominican Republic. Guyana, Haiti. Jamaica and Trinidad and Tobago) have now moved to a floating rate system but most of the others continue to suffer from overvalued exchange rates.
In Jamaica gross investment in the 1980s was low with evidence of the 'crowding out', as well as, at least in the earlier part of the period, the positive discouragement of private investment by the public sector. External borrowing had led to an external debt to GDP ratio of over 200% in 1985. Low growth rates led to a reassessment of policies in the mid-1980s and new fiscal stringency. But the damage to the economic structure had been done and Jamaica was not in a position to benefit from the upturn in the global situation.
The economic situation, together with specific political factors, led to a massive disinvestment by foreign companies in the mainstay bauxite sector. Indeed the peak output reached in the mid-1970s has never been regained. A Standby Arrangement and an Extended Fund Facility (EFF) negotiated with the IMF in 1977 and 1978 were terminated in 1978 before their completion dates, and another EFF negotiated in 1981 was also prematurely ended, in each case because the targets set were not consistent with the government's economic and social priorities.
The experiences of Antigua and Barbuda, the Dominican Republic, Grenada, Guyana, Suriname and Trinidad and Tobago, though different in many details, bear the same hallmarks of overcxpansion of demand, loose fiscal policies and swollen budget deficits, low growth rates, decline in manufacturing output and excessive foreign borrowing.
However not all the Caribbean countries can be put in the same boat. St Lucia, in particular, generally maintained balanced fiscal and monetary policies and sectoral programmes that have offset worsening terms of trade through productivity growth. The public finances have been well managed. Domestic and external debt has been controlled. Belize and St Vincent and the Grenadines have on the whole also experienced good economic management.
The second half of the 1980s saw some major reversals in the policy stance of a number of countries. More prudent fiscal and monetary policies have been followed, payments on external arrears are being made up and exchange rates and exchange controls have been liberalised. The overvaluation of REERs has largely been corrected (see Table 17.1). Many countries have set in train, cither independently or in negotiation with the international financial institutions, structural adjustment programmes.
182 StBa/Eurostat Caribbean ACP countries. 1995
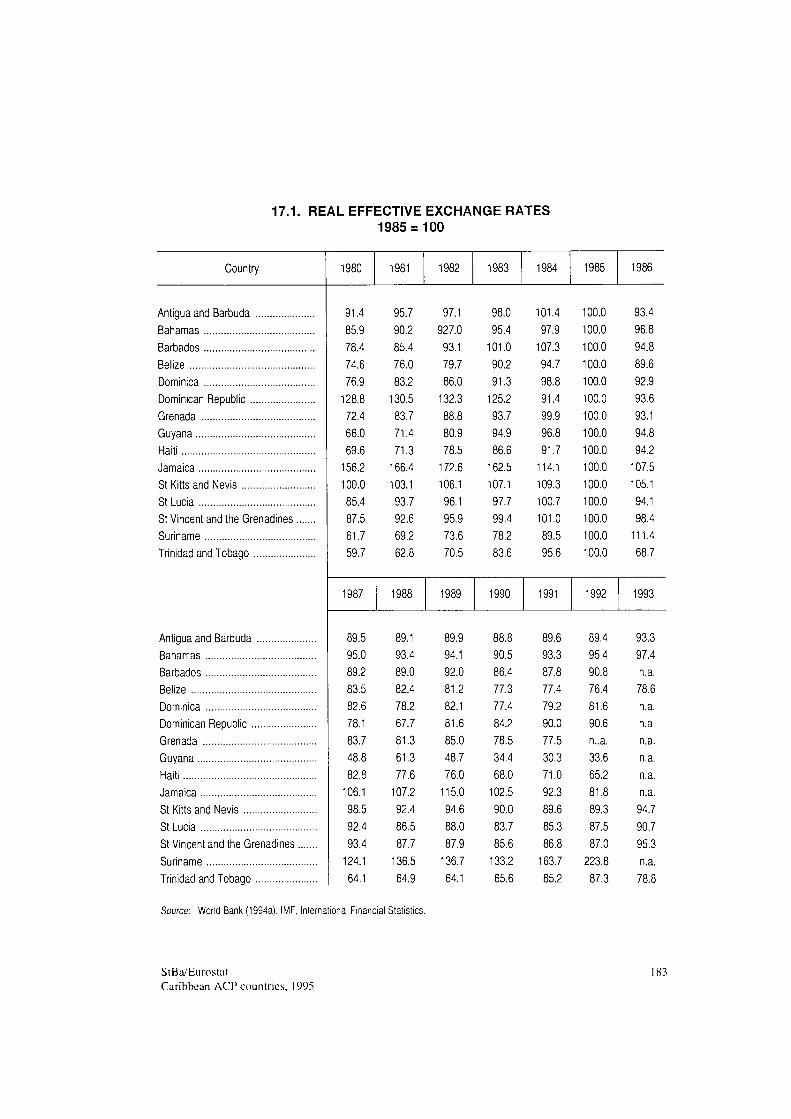
17.1. REAL EFFECTIVE EXCHANGE RATES 1985 = 100
Country 1980 1981 1982 1983 1984 1985 1986
Antigua and Barbuda Bahamas Barbados Belize Dominica Dominican Republic Grenada Guyana Haiti Jamaica St Kitts and Nevis St Lucia St Vincent and the Grenadines . Suriname Trinidad and Tobago
91.4 85.9 78.4 74.6 76.9
128.8 72.4 66.0 69.6
156.2 100.0 85.4 87.5 61.7 59.7
1987
Antigua and Barbuda Bahamas Barbados Belize Dominica Dominican Republic Grenada Guyana Haiti Jamaica St Kitts and Nevis St Lucia St Vincent and the Grenadines Suriname Trinidad and Tobago
95.7 90.2 85.4 76.0 83.2
130.5 83.7 71.4 71.3
166.4 103.1 93.7 92.6 69.2 62.8
97.1 927.0 93.1 79.7 86.0
132.3 88.8 80.9 78.5
172.6 106.1 96.1 95.9 73.6 70.5
98.0 95.4
101.0 90.2 91.3
125.2 93.7 94.9 86.6
162.5 107.1 97.7 99.4 78.2 83.6
101.4 97.9
107.3 94.7 98.8 91.4 99.9 96.8 91.7
114.1 109.3 100.7 101.0 89.5 95.6
100.0 100.0 100.0 100.0 100.0 100.0 100.0 100.0 100.0 100.0 100.0 100.0 100.0 100.0 100.0
1989 1990 1991 1992
93.4 96.8 94.8 89.6 92.9 93.6 93.1 94.8 94.2
107.5 105.1 94.1 98.4
111.4 68.7
1993
89.5 95.0 89.2 83.5 82.6 78.1 83.7 48.8 82.8
106.1 98.5 92.4 93.4
124.1 64.1
89.1 93.4 89.0 82.4 78.2 67.7 81.3 61.3 77.6
107.2 92.4 86.5 87.7
136.5 64.9
89.9 94.1 92.0 81.2 82.1 81.6 85.0 48.7 76.0
115.0 94.6 88.0 87.9
136.7 64.1
88.8 90.5 86.4 77.3 77.4 84.2 78.5 34.4 68.0
102.5 90.0 83.7 85.6
133.2 65.6
89.6 93.3 87.8 77.4 79.2 90.0 77.5 30.3 71.0 92.3 89.6 85.3 86.8
163.7 85.2
89.4 95.4 90.8 76.4 81.6 90.6 n..a. 33.6 65.2 81.8 89.3 87.5 87.0
223.8 87.3
93.3 97.4 n.a. 78.6 n.a. n.a. n.a. n.a. n.a. n.a. 94.7 90.7 95.3 n.a. 78.8
Source: World Bank (1994a); IMF, International Financial Statistics.
StBa/Eurostat Caribbean ACP countries, 1995
183
The Dominican Republic implemented a stabilization programme in 1990. Improved revenue collection and tight expenditure controls have led to rough balance in the government budget. Monetary policy has been strict. These policies have succeeded in sharp reductions in the inflation rate and a recovery in economic growth. Money market liberalisation has attracted capital inflows, including those from emigrants. External payments arrears have been largely eliminated, despite weak export prices for ferro-nickel, sugar and gold and silver, which have damaged export earnings and the trade balance.
However the policies required for comprehensive structural adjustment are not yet in place. In 1991 a Paris Club rescheduling of USD 927 million of debt was followed by a debt reduction agreed by the commercial banks. The remaining debt was to be covered by bond issues , including one backed by the US Treasury. Nevertheless in 1992 the agreement for a USD 400 million Extended Fund Facility with the IMF was suspended in 1993 because of the failure to meet fiscal targets.
Jamaica has experienced very slow growth since 1990. This is largely blamed on the austere monetary policies which have been in place for four years. After the total liberalisation of the foreign exchange market in 1991, the Jamaican dollar fell sharply and this resulted in a surge of inflation. A 77% inflation rate was recorded in 1992. The inflation rate is still high, but had dropped to 39% in the first half of 1994 over the corresponding period in 1993. A tough income and redundancy policy in the public sector and expenditure cuts have led to a public-sector surplus. External debt has been brought down through rescheduling. The current account seems to be moving into surplus with the help of strong bauxite and aluminium prices. While the tourist industry has been marking time, emigrant remittances have increased with recovery in Europe and the United States.
On the adjustment side some progress has been made. The elimination of excise duties on agricultural imports will force far-reaching changes in the non-competitive farm sector, particularly in dairy and poultry products. Privatisation is continuing and promises to radically improve the international competitiveness of the sugar industry (though hitherto undisclosed liabilities of sugar estates and the state airline mean that there will be little gain to the public purse). The 1994/95-1996/97 Public Sector Investment Programme emphasise the development of infrastructure to assist private sector investment.
In Guyana GDP growth has averaged 8% over the period 1991 to 1994, helped by the sharp fall in the REER. But the cost of an undervalued exchange rate has been high inflation. The depreciation has helped the trade balance with exports of sugar, rice, bauxite and gold all strong. Moreover Guyana has been helped by favourable world commodity prices.
The Economic Reconstruction Programme (ERP) of 1988 incorporates a range of structural reforms. The ERP is far from having been completed. Nevertheless there has been a
184 StBa/Eurostat Caribbean ACP countries. 1995
resurgence of agricultural output in response to the reforms, including the liberalization of the exchange rate regime, export and price controls, the elimination of the parallel markets in rice and sugar.
However FDI inflows have been disappointing. The economic climate is not yet such as to give confidence to potential investors. The past experience of default on debt servicing, the continued ineligibility for conventional World Bank funds and the explosion of the current account deficit since pressure from the debt overhang was removed through debt reduction and rescheduling have all contributed to uncase.
In Trinidad and Tobago the adjustment programme initiated by the IMF when it agreed a Standby Arrangement and a Compensatory and Contingency Facility in 1988 is still in effect and the government has taken steps to accelerate progress. The authorities are pressing ahead with the liberalisation of the economy and privatization programme. Trade reform to reduce tariffand other barriers to imports, other than agricultural products, was taken a step ahead in January 1995. The exchange rate has held relatively steady since it was floated in April 1993. Progress has been made in reducing the debt service obligations with two Paris Club reschedulings in 1989 and 1990. Since then, with the resumption of official and private lending on conventional terms, a decision has been made not to seek a further IMF agreement.
Among the other larger states of the region, Haiti has only recently had US AID and World Bank lending resumed after the restoration of democratic government. In Barbados, the government has put on hold the agreed IMF Enhanced Surveillance Programme, and the associated SAP. while it reviews its situation. Reserves have benefited from high recent sugar prices and strong tourism receipts. The current account is now in surplus. Various reforms arc planned, most importantly in the tax area.
Grenada has suffered from serious weakness in the world nutmeg market and has tried, so far unsuccessfully, to agree a stabilisation plan with the only other producer, Indonesia. Deteriorating public finances and dependency on nutmegs and bananas have led to the accumulation of foreign currency debt and arrears have built up. In consultation with the EU Commission an SAP has been agreed.
Among the other smaller islands, Dominica's high debt-GDP and debt service ratios arc cause for concern. Its medium-term economic strategy is focused on fiscal reform and diversification of production. In the other OECS countries, as well as in the Bahamas and Belize, the macro-economy in terms of inflation, the fiscal balance and the external accounts, arc less preoccupying. But to the extent these countries arc dependent on banana exports, diversification is urgent. The present EU banana regime is scheduled to end in 2002 with little prospect that it will be renewed. In any event the outlook for banana prices docs not look promising.
StBa/Eurostat 185 Caribbean ACP countries, 1995
Suriname must be regarded as a special case. Unwilling to accept the conditionally, i.e. a tough SAP, they have eschewed assistance from the international financing organisations. Meanwhile the economy has continued to deteriorate. Some efforts at structural reform have been undertaken, but perhaps the most important, reform of the exchange rate system and elimination of the parallel market failed to work. The REER has been grossly overvalued. Recently the central bank effected a devaluation though not, by any means, sufficiently to reach a realistic rate. Nevertheless some progress has been made in restoring the financial credibility of the government. The budget deficit has been reduced from 65% of GDP in 1982 to 5 to 10% in recent years. Much more needs to be done.
In most Caribbean countries major steps have been taken to confront their problems of fiscal imbalance, structural inflexibilities and excessive recourse to foreign borrowing. There is a new emphasis on using public capital expenditure, not to replace private sector investment, but as a catalyst for it. In the allocation of public expenditure, higher priorities have been given to human resource development. There has been widespread liberalisation of price and foreign exchange markets.
Yet, as we saw in Chapter 13, prospects for exports are not encouraging. Certainly there has been some substantial increases in world commodity prices over the past two years, and these have included sugar, ore and metal prices, but these must be viewed as essentially cyclical responses to recovery in Europe and the United States. The higher prices could be sustained for some time by a significant upturn in growth in Japan, but cannot be envisaged as permanent.
Many of the economies of the ACP Caribbean still depend to a large extent on trade preferences. It is not clear how much sugar could be sold on the world market even at current prices. Certainly there would be little hope of the banana producers surviving in the free world market. In any event trade preferences make an unreliable platform for export growth in a world of falling tariff and non-tariff barriers. The preferences will be gradually eroded, perhaps not so gradually in the case of bananas since the regime is due to come to an abrupt end at the end of 2002. The chances of finding new markets for bananas in the US or elsewhere will not be easy, given the fact that outside Belize, and to some extent Jamaica, the cost advantages of flat, large-scale plantations are unavailable. Clearly diversification into other export-orientated sectors is required. However that is no easy task. Tourism is one clear alternative. At present the Caribbean islands have a proven comparative advantage, but that sector is likely to become increasingly competitive in the years to come.
The problems should not be minimised. The ACP Caribbean region, except perhaps the Dominican Republic and Haiti, suffer the particular problems of small States. They arc vulnerable to natural disasters, in the case of the region, particularly to hurricanes. Because they depend largely on a few export commodities they are particularly susceptible to swings in the terms of trade. They lack a sufficiently large domestic market to warrant establishing
186 StBa/Eurostat Caribbean ACP countries, 1995
plants where that is an important factor - although it must be said that modern technology is rapidly reducing the 'minimum efficient scale'. They require proportionately more overhead capital in the form of ports and airports, roads, hospitals, civil servants and so forth. Similarly for the increasingly crucial specialized training and education, unit costs arc high or even prohibitive. All this makes diversification more difficult.
StBa/Eurostat 187 Caribbean ACP countries. 1995

B I B L I O G R A P H Y
ABECOR(1994) Abecor Country Report: Caricom - Belize, Guyana, Jamaica, Leeward Islands, Trinidad & Tobago and Windward Islands. London (Barclays Bank Economic Department).
ABECOR (1995) Abecor Country Report: Caribbean Financial Centres & Bermuda. Bahamas, Barbados, Bermuda, Cayman Islands, Netherlands Antilles & Aruba. London (Barclays Bank Economic Department).
Bank of Jamaica (1994) Balance of Payments of Jamaica 1993. Kingston (Bank of Jamaica).
Baumann, R. (1993) Integration and Trade Diversion. In: Ccpal Review. No 51, 133-147.
Box. B. (Ed.) (1994) South American Handbook 1995. 71st Edition. Lincolnwood (Passport Books).
Bryan, A.T. ( 1994) Beyond NAFTA: Caricom Dilemma. In: Caribbean Affairs, Vol. 7, No 1, 90-104.
Cameron. S. / Box, B. (1994) Carribbcan Islands Handbook 1995. 6th Edition. Bath (Trade & Travel Pubi.).
Caribbean Development Bank (1994) Annual Report 1993. Barbados (CDB).
Caribbean Tourism Organization ( 1993) Caribbean Tourism Statistical Report 1992. Barbados (CTO).
Caricom Perspective (1993) Country Profile - The Bahamas. In: Caricom Perspective, Nos 58 & 59. 3 1-55.
Central Bank of Barbados (1994) 1993 Annual Report. Bridgetown (CBB).
Central Bank of Barbados (1994) Balance of Payments of Barbados 1994 (Data to 1993). Bridgetown (CBB)
StBa/Eurostat 189 Caribbean ACP countries. 1995
Central Bank of Belize (1993) Eleventh Annual Report and Accounts 1992. Belize City (Central Bank of Belize).
Deutsch-Südamerikanische Bank (1994) Kurzbericht über Lateinamerika. Nr. 1/94. Frankfurt/Main (Gruppe Dresdner Bank).
Eastern Caribbean Central Bank (1993) A Proposed Economic Development Strategy for the OECS/ECCB Arca. o.O.
Eastern Caribbean Central Bank (1994) Report and Statement of Accounts. For the Financial Year ended 31 March 1994. o.O.
Europa Publications (Ed.) (1994) South America, Central America and the Caribbean 1995. 5th Edition. London (Europa Publications Ltd).
Europa Publications (Ed.) (1994) The Europa World Yearbook 1994. Vol. I and Vol. II. London (Europa Publications Ltd).
European Commission - Directorate General for Development (1994) EU - ACP Cooperation. Brussels (The Courier ACP - EU).
Fischer, B. / Gleich, von A. / Grabcndorff, W. (Eds.) (1994) Latin America's Competitive Position in the Enlarged European Market. Baden-Baden (Nomos Verlagsgescllschaft).
Gleich, von A. / Krumwiedc. H.-W. / Noite. D. / Sangmeister, H. (1994) Lateinamerika Jahrbuch 1994. Institut für Ibcroamcrika-Kundc. Lateinamerika Jahrbuch Band 3. Frankfurt / Main (Vcrvucrt Verlag).
Intcr-Amcrican Development Bank (1994) Annual Report 1993. Washington, D.C. (IADB).
McKcc. D.L. (1994) Growth Potential in Small Island Economics. In: Caribbean Affairs, Vol. 7, No I, 105-117.
Nuhn.H. (1995) Neue Entwicklungen im EU-Banancnkonflikt. In: Geographische Rundschau. Jg. 47. Heft 3. 197-199
190 StBa/Eurostat Caribbean ACP countries. 1995
Ratter, B.M.W. (1994)
Fischfang, Meeresverschmutzung und Politik. Konflikte zwischen großräumigen Um
weltschutzzielen und nationalen Seerechtsgrenzen in der Karibik. In: Geographische
Rundschau, Jg. 46. Nr. 12, 698705.
République de la France Ministère de la Coopération (1993)
Situation Économique et Financière des Etats d'Afrique de Γ Ocean Indien et des
Caraïbes en 1992: Perspectives d'Évolution. Edition 1993. Paris (Ministère de la
Coopération).
The Courier (1994)
Country Report: St Lucia. In: The Courier, No 148, 2136.
The Courier (1994)
Country Report: St Vincent and the Grenadines. In: The Courier, No 148, 3756.
The Economist Intelligence Unit (1993)
Country Profile: Dominican Republic, Haiti, Puerto Rico 1993/94. London (EIU).
The Economist Intelligence Unit (1994)
Country Profile: Belize. Bahamas, Bermuda, Cayman Islands, Turks and Caicos
199495. London (EIU).
The Economist Intelligence Unit (1994)
Country Profile: Guyana, Windward and Leeward Islands 199495. London (EIU).
The Economist Intelligence Unit (1994)
Country Profile: Jamaica, Barbados 199495. London (EIU).
The Economist Intelligence Unit (1994)
Country Profile: Trinidad and Tobago, Suriname. Netherlands Antilles, Aruba
199495. London (EIU).
The Economist Intelligence Unit (1994)
Country Report: Cuba, Dominican Republic, Haiti, Puerto Rico. Nos 14. London
(EIU).
The Economist Intelligence Unit (1995)
Country Report: Cuba, Dominican Republic. Haiti. Puerto Rico. No 1. London (EIU).
The Economist Intelligence Unit (1995)
Country Report: Jamaica, Belize. Bahamas. Bermuda. Barbados. No 1. London (EIU).
StBa/Eurostat Caribbean ACP countries. 1995
The Economist Intelligence Unit (1995) Country Report: Trinidad and Tobago. Guyana, Suriname, Netherlands Antilles, Aruba, Windward and Leeward Islands. No 1. London (EIU).
United Nations - Economic Commission for Latin America and the Caribbean (1994) Economic Survey of Latin America and the Caribbean 1992. Vol. I, Santiago del Chile (UN-ECLAC).
United Nations - Economic Commission for Latin America and the Caribbean (1994) Preliminary Overview of the Latin American and Caribbean Economy 1994. In: Notas Sobre la Economia y el Desarollo, No 566/567. Santiago del Chile (UN-ECLAC).
United Nations - Economie Commission for Latin America and the Caribbean (1994) Open Regionalism in Latin America and the Caribbean - Economic Integration as a Contribution to Changing Production Patterns with Social Equity. In: Notas Sobre la Economia y el Desarollo, No 555. Santiago del Chile (UN-ECLAC).
United Nations - Economie Commission for Latin America and the Caribbean (1994) ECLAC Proposes: Policies to Improve Linkages with the Global Economy. In: Notas Sobre la Economia y el Desarollo, No 556. Santiago del Chile (UN-ECLAC).
United Nations - Economie Commission for Latin America and the Caribbean (1995) Statistical Yearbook for Latin America and the Caribbean. 1994 edition. Santiago del Chile (UN-ECLAC).
Wilkic, J.W. (1993) Statistical Abstract of Latin America, Vol. 30. Parts 1 and 2. Los Angeles (University of California).
Willmore, L. (1994) Export Processing in the Caribbean: The Jamaican Experience. In: Ccpal Review. No 52, April 1994.91-104.
World Bank (1993) Caribbean Region. Current Economic Situation, Regional Issues, and Capital Flows. 1992. Washington, DC (World Bank).
World Bank (1993) Country Briefs. Vol. 2: Latin America and the Caribbean. Washington, DC (World Bank), 903-966.
World Bank ( 1994) Caribbean Countries - Policies for Private Sector Development. Washington, DC (World Bank).
192 StBa/Eurostat Caribbean ACP countries. 1995


European Commission
Country profile — Caribbean ACP countries
Luxembourg: Office for Official Publications of the European Communities
1996 — 192 pp.. ill., graph.. — 17 χ 24 cm
ISBN 9282761533
Price (excluding VAT) in Luxembourg: ECU 12
This regional profile deals with the 15 Caribbean countries with which the European Union conducts
a wide range of economic and development cooperation policies under the Lomé Agreement.
General economic growth in the Caribbean ACP countries has been rather disappointing since 1980,
with the region's gross domestic product rising by a modest 0.8% per annum between 1980 and 1993.
Unfavourable price trends for the main products exported by Caribbean countries, the recession suf
fered by the western industrial nations at the beginning of the 1990s, changes in international terms of
trade, internal political conflicts, bad weather conditions and, last but not least, only partial success in
broadening their export basis were all determining factors explaining the weakness of the Caribbean
economy. It is solely because of the strong resurgence of tourism, the most important factor in the re
gion's economy, that initial estimates for 1994 predict slightly higher growth in GDP of between 1.5
and 2%.
The dovetailing of foreign trade exchanges by the Caribbean countries with western industrialized na
tions can be seen in their existing trade relations. In 199293. 47% of total goods exports went to North
America and 22% to the EU. whilst 41% of the goods imported into the Caribbean ACP countries
came from North America and a further 20% from the EU. A similarly high level of dependency exis
ted in the field of services. The Caribbean tourist trade, which in some countries is a much larger
foreign exchange earner than goods exports, virtually owes its existence to American and European
holidaymakcrs.
The economic outlook for the Caribbean is uncertain given the rather downbeat mediumterm trade
prospects, and it is still heavily dependent upon the economic development of its main foreign trade
partners. In view of the changes in international terms of trade since the conclusion of the last Uruguay
Round. Mexico's entry into NAFTA, and the constraints expected to be imposed upon preferential ac
cess to the EU market with the expiry of Lome IV and the revision of the EU's common agricultural
policy, the export prospects for a whole series of important export products (clothing, sugar, bananas,
rice) arc looking rather bleak. Economic diversification has become a matter of the utmost urgency in
almost every country, in order for them to achieve lasting economic growth in the future and avert the
threat of dwindling trade Hows. In this respect, the establishment of further export free zones, the in
creased cultivation of nontraditional agricultural export products, ccotourism. offshore banking and
computer services could all turn out to be promising niches with worldwide markets.
In the field of regional economic integration, the Caribbean countries need to raise their sights beyond
the Caribbean community (Caricom). which was set up in 1973 with the aim of developing a common
Caribbean trade and customs policy and now numbers 13 of the 15 ACP Caribbean countries. The op
portunities for economic development offered by this economic community are too limited due to the
extremely small internal markets of its member States. It was for this reason that all the Caribbean
countries present at the last summit meeting of American States in Miami in December 1994 expres
sed an interest in joining an enlarged NAFTA. At the present moment, it is not possible to give a final
answer to the question as to how this could be squared with their existing status as ACP countries and
with the conditions of the Lome Convention. It is. however, more than likely that if they were to join
NAFTA, the EL) would have to redefine its economic relations with the Caribbean ACP countries.

Venta · Salg · Verkauf · Πωλήσεις · Sales · Vente · Vendita · Verkoop · Venda · Myynti · Försäljning
BELGIQUE/BELGIË IRELAND NORGE ISRAEL
Moniteur belge/ Belgisch Staatsblad
Rue de Louvain 42/Leuvenseweg 42 B1000 Bruxelles/B1000 Brussel Tel (02)512 00 26 Fax (02)511 01 84
Jean De Lannoy
Avenue du Roi 202/Konmqslaan 202 B1060 Bruxelles/B1060 Brussel Tel. (02)538 51 69 Fax (02)538 08 41
Autres d is t n buteurs/ Overige verkooppunten:
Librairie européenne/ Europese boekhandel
Rue de la Loi 244/Welsiraa! 244 B1040 Bruxelles/B1040 Brussel Tel (02)231 04 35 Fax (02)735 08 60
Document delivery:
Credoc
Rue de la Montagne 34/Bergstraal 34 Baile 11, Bus 11 B1000 BruxellesiB1000 Brussel Tel (02)511 69 41 Fax (02) 513 31 95
J. H. Schultz Information A/S
Herstedvang 1012 DK2620 Albertslund Tlf 43 63 23 00 Fax (Sales) 43 63 19 69 Fax (Management) 43 63 19 49
DEUTSCHLAND
Bundesanzeiger Verlag
Postfach 10 05 34 D50445 Koin Tel {02 21)20 290 Fax (02 21)2 02 92 78
GREECE/ΕΛΛΑΔΑ
G.C. Elettheroudakis SA
Internalional Bookslore Nikis Street 4 GR10563 Alnens Tel (01)322 63 23 Fax 323 98 21
MundiPrensa Libros, SA
Castellò 37 E28001 Madrid Tel (91) 431 33 99 (Libros)
431 32 22 (Suscripciones) 435 36 37 (Dirección)
Fax (91)575 39 98
Boletín Oficial del Estado
Trafalgar. 2729 E28071 Madrid Tel (91) 538 22 95 Fax (91) 538 23 49
Sucursal:
Libreria Internacional AEDOS
Conscio dc Cíenlo, 391 E08009 Barcelona Tel (93) 488 34 92 Fax (93)487 76 59
Librería de la Generalität de Catalunya
Rambla deis Esludis, 118 (Palau Me E08002 Barcelona Tel (93) 302 68 35 Tel (93) 302 64 62 Fax (93)302 12 99
FRANCE
Journal officiel Service des publications des Communautés européennes
26 rue Desaix F75727 Paris Cedex 15 Tel (1)40 58 77 01/31 Fax (1) 40 58 77 00
Government Supplies Agency
45 Harcourt Road Dublin 2 Tel (1)66 13 111 Fax (1)47 52 760
ITALIA
Licosa SpA
Via Duca di Calabria 1 Casella postale 552 150125 Firenze Tel (055)64 54 15 Fax 64 12 57
GRANDDUCHE DE LUXEMBOURG
Messageries du livre
5. rue Raiffeisen L2411 Luxembourg Tel 40 10 20 Fax 49 06 61
NEDERLAND
SDU Servicecentrum Uitgeverijen
Postbus 20014 2500 EA sGravenhage Tel (070)37 89 880 Fax(070) 37 B9 7B3
OSTERREICH
Manz'sche Verlagsund Universitätsbuchhandlung
Kohlmarkt 16 A1014 Wien Tei (1)531 610 Fax(1) 531 61181
Document delivery:
Wirtschaftskammer
Wiedner Hauptstraße A1045 Wien Tel (0222)501054356 Fax (0222)50206297
Imprensa Nacional — Casa da Moeda, EP
Rua Marquês Sa da Bandeira, 16A P1099 Lisboa Codex Tel (01) 353 03 99 Fax (01) 353 02 94/38401 32
Distribuidora de Livros Bertrand, Ld.*
Grupo Bertrand, SA
Rua das Terras dos Vaies. 4A Apartado 37 P2700 Amadora Codex Tel (01) 49 59 050 Fax 49 60 255
SUOMI/FINLAND
Akateeminen Kirjakauppa
Akademiska Bokhandeln Pohjoisesplanadi 39 / Norra esplanaden 39 PL /PB !28 FIN0010I Helsinki/Helsingfors Tel (90) 121 4322 Fax(90)121 44 35
BTJ AB
Traktorvagen 11 Box 200 S221 00 lund Tel (046) 18 00 00 Fax (046) 18 01 25
UNITED KINGDOM
HMSO Books (Agency section)
HMSO Publications Centre 51 Nine Elms Lane London SW8 5DR Tel (0171)873 9090 Fax (0171) 873 8463
ICELAND
BOKABUD LARUSAR BLÓNOAL
Skólavordustig, 2 IS101 Reykjavik Tel 551 56 50 Fax 552 55 60
NIC Info a/s
Boks 6512 Etterstad 0606 Oslo Tel (22)57 33 34 Fax (22) 68 19 01
SCHWEIZ'SUISSE/SVIZZERA
OSEC
Stamplenbachstrañe 85 CH8035 Zurich Tel. (01)365 54 49 Fax(01)365 54 11
BALGARIJA
Europress Klassica BK Ltd
66, bd Vitosha BG1463 Sofia Tel/Fax (2) 52 74 75
CESKA REPUBLIKA
Havelkova 22 CZ130 00 Praha 3 Tel/Fax (2) 24 22 94 33
HRVATSKA
Mediatrade
Ρ Hatza 1 HR4100 Zagreb Tel/Fax (041)43 03 92
MAGYARORSZAG
EuroInfoService
Europa Haz Margìlszigel H1I38 Budapest Tel 'Fax (1)111 6061. (1)111 62 16
POLSKA
Business Foundation
ul Krucza 38/42 PL00512 Warszawa Tel (2)621 99 93.628 28 82 International FaxSPhone (039) 12 00 77
ROMANIA
Euromedia
65, Slrada Dionisie Lupu RO701B4 Bucuresti Tel/Fax 1 31 29 646
9,60 letiya Oktyabrya Avenue 117312 Moscow Tel/Fax (095) 135 52 27
SLOVAKIA
Slovak Technical Library
Nam slobody 19 SLO812 23 Bratislava 1 Tel (7) 52 204 52 Fax (7) 52 957 85
CYPRUS
Cyprus Chamber of Commerce and Industry
Chamber Building 38 Gnvas Dhigenis Ave 3 Deligiorgis Street PO Box 1455 Nicosia Tel (2) 44 95 00. 46 23 12 Fax (2) 36 10 44
MALTA
Miller Distributors Ltd
PO Box 25 Malta International Airport LOA 05 Malta Tel 66 44 88 Fax 67 67 99
TURKIYE
Pres AS
Dunya Infoici TR80050Tunellstanbul Tel (1)251 91 90/251 96 96 Fax (1)251 91 97
Roy International
17. Shimon Halarssi Street P O B 13056 61130 Tel Aviv Tel (3) 546 14 23 Fax (3) 546 14 42
Subagent for the Palestinian Authority:
INDEX Information Services
PO Box 19502 Jerusalem Tel (2)27 16 34 Fax (2)27 12 19
EGYPT/ MIDDLE EAST
Middle East Observer
41 Shenf Si Cairo Tel/Fax (2) 393 97 32
UNITED STATES OF AMERICA/ CANADA
UNIPUB
4611F Assembly Drive Lanham, MD 207064391 Tel Toll Free (800) 274 48 88 Fax (301)459 00 56
Subscriptions only Uniquement abonnements
Renouf Publishing Co. Ltd 1294 Algoma Road Ollawa. Ontario K1B 3W8 Tel. (613)741 43 33 Fax (613)741 54 39
Hunter Publications
58AGipps Street Collinrjwood Victona 3066 Tel (3)9417 53 61 Fax(3)9419 71 54
Procurement Services Int. (PSIJapan)
Kyoku Dome Postal Code 102 Tokyo Kojimachi Posi Office Tel (03)32 34 69 21 Fax (03)32 34 69 15
Subagent:
Kinokuniya Company Ltd Journal Department
PO Box 55 Chitóse Tokyo 156 Tel (03)34 390124
SOUTH and EAST ASIA
Legal Library Services Ltd
Orchard PO Box 0523 Singapore 9123 Tel 243 24 98 Fax 243 24 79
SOUTH AFRICA
Saffo
5th Floor, Export House Cnr Maude & Wesl Streets Sandlon 2146 Tel.(011)8833737 Fax (011) 8836569
ANDERE LANDER OTHER COUNTRIES AUTRES PAYS
Office des publications officielles des Communautés européennes
2, rue Mercier L2985 Luxembourg Tel 29 291 Telex PUBOF LU 1324 b Fax 48 85 73, 48 68 17
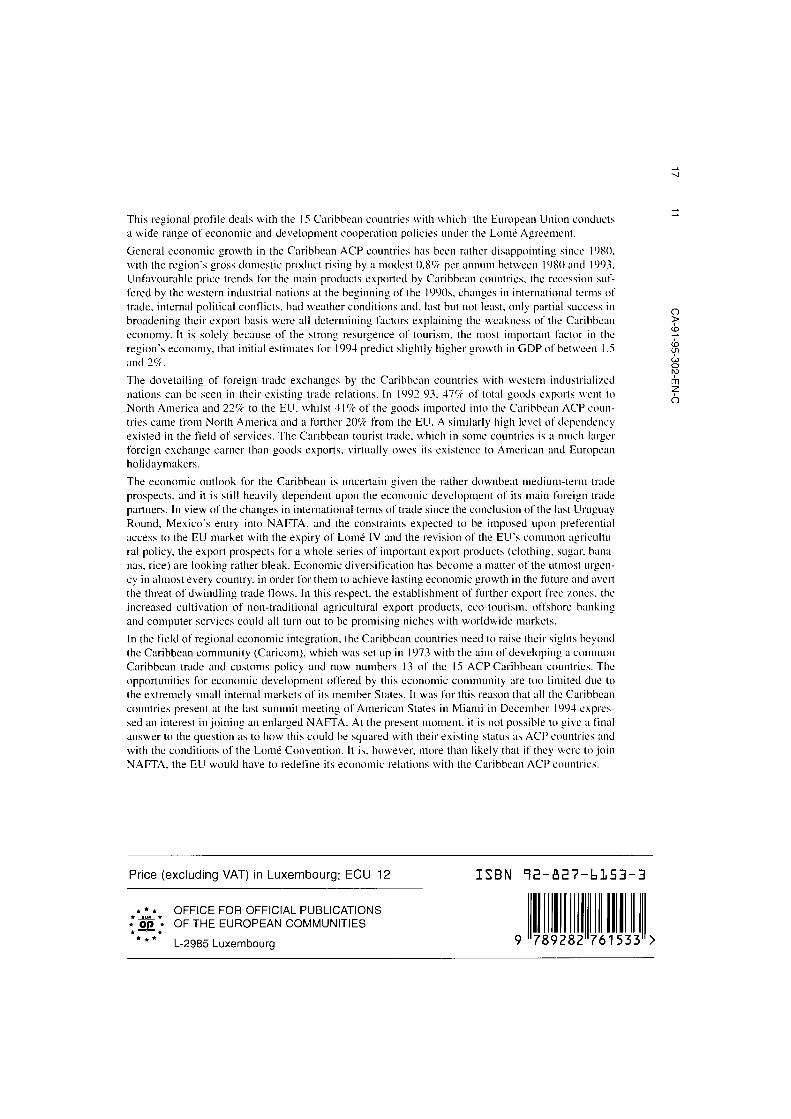
ro
O
This regional profile deals with the 15 Caribbean countries with which the European Union conducts "̂
a wide range of economic and development cooperation policies under the Lomé Agreement.
General economic growth in the Caribbean ACP countries has been rather disappointing since 1980.
with the region's gross domestic product rising by a modest 0.8% per annum between 1980 and 1993.
Unfavourable price trends for the main products exported by Caribbean countries, the recession suf
fered by the western industrial nations at the beginning of the 1990s, changes in international terms of
trade, internal political conflicts, bad weather conditions and. last but not least, only partial success in 0
broadening their export basis were all determining factors explaining the weakness of the Caribbean >
economy. It is solely because of the strong resurgence of tourism, the most important factor in the -f-
region's economy, that initial estimates for 1994 predict slightly higher growth in GDP of between 1.5 S
and 2%. " g
The dovetailing of foreign trade exchanges by the Caribbean countries with western industrialized
nations can be seen in their existing trade relations. In 199293. 47% of total goods exports went to
North America and 22% to the EU, whilst 41% of the goods imported into the Caribbean ACP coun
tries came from North America and a further 20% from the EU. A similarly high level of dependency
existed in the field of services. The Caribbean tourist trade, which in some countries is a much larger
foreign exchange earner than goods exports, virtually owes its existence to American and European
holidaymakers.
The economic outlook for the Caribbean is uncertain given the rather downbeat mediumterm trade
prospects, and it is still heavily dependent upon the economic development of its main foreign trade
partners. In view of the changes in international terms of trade since the conclusion of the last Uruguay
Round, Mexico's entry into NAFTA, and the constraints expected to be imposed upon preferential
access to the EU market with the expiry of Lomé IV and the revision of the EU's common agricultu
ral policy, the export prospects for a whole series of important export products (clothing, sugar, bana
nas, rice) are looking rather bleak. Economic diversification has become a matter of the utmost urgen
cy in almost every country, in order for them to achieve lasting economic growth in the future and avert
the threat of dwindling trade flows. In this respect, the establishment of further export free /.ones, the
increased cultivation of nontraditional agricultural export products, ecotourism, offshore banking
and computer services could all turn out to be promising niches with worldwide markets.
In the field of regional economic integration, the Caribbean countries need to raise their sights beyond
the Caribbean community (Caricom). which was set up in 1973 with the aim of developing a common
Caribbean trade and customs policy and now numbers 13 of the 15 ACP Caribbean countries. The
opportunities for economic development offered by this economic community are too limited due lo
the extremely small internal markets of its member States. It was for this reason that all the Caribbean
countries present at the last summit meeting of American States in Miami in December 1994 expres
sed an interest in joining an enlarged NAFTA. At the present moment, it is not possible to give a final
answer to the question as to how this could be squared with their existing status as ACP countries and
with the conditions of the Lomé Convention. It is. however, more than likely that if they were to join
NAFTA, the EU would have to redefine its economic relations with the Caribbean ACP countries.
Price (excluding VAT) in Luxembourg: ECU 12 I S B N Τ Ε η Ε 7 ^ 1 5 3 3
* * * OFFICE FOR OFFICIAL PUBLICATIONS * Og** OF THE EUROPEAN COMMUNITIES
L2985 Luxembourg 789282"761533