Steve Brainerd Statistical Risks
24
1/26/03 Statistical Risks Steve Brainerd 1 OHSU OGI Class ECE-580-DOE :Statistical Process Control and Design of Experiments Steve Brainerd Statistical Risks • Since we have to estimate µ and σ from samples and make decisions, we have chances for errors. • In statistical inference tests we define these as Errors or risks. • What these risks really mean and how to interpret them tend to generate confusion. • I will attempt to explain them and hopefully give you an understanding of what they mean and not add to any confusion!
Transcript of Steve Brainerd Statistical Risks
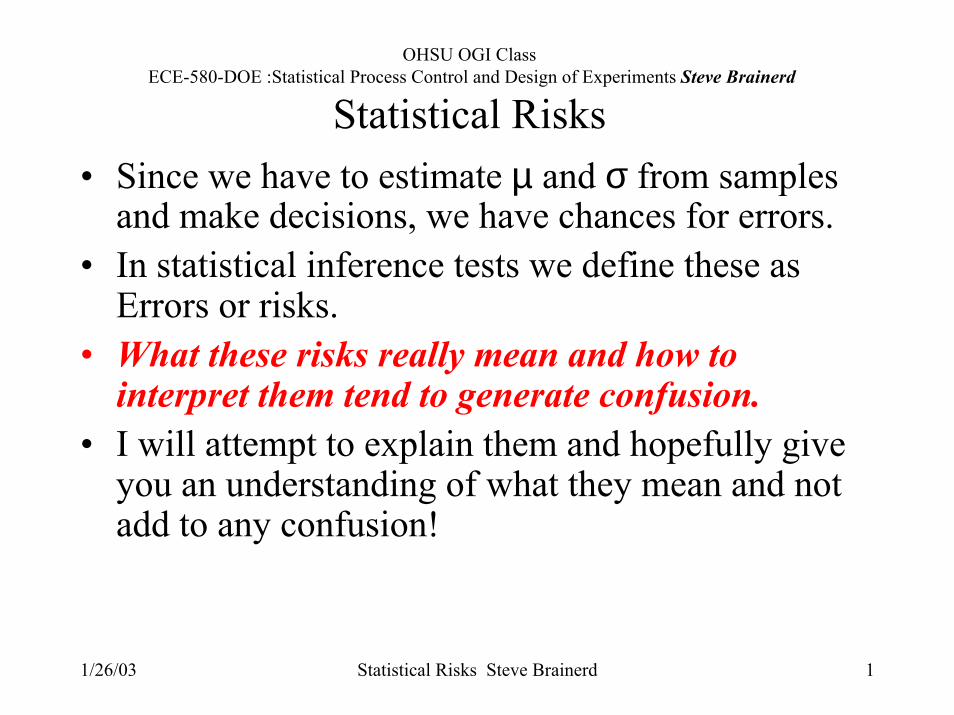
1/26/03 Statistical Risks Steve Brainerd 1
OHSU OGI Class ECE-580-DOE :Statistical Process Control and Design of Experiments Steve Brainerd
Statistical Risks• Since we have to estimate µ and σ from samples
and make decisions, we have chances for errors.• In statistical inference tests we define these as
Errors or risks.• What these risks really mean and how to
interpret them tend to generate confusion.• I will attempt to explain them and hopefully give
you an understanding of what they mean and not add to any confusion!
1/26/03 Statistical Risks Steve Brainerd 2
OHSU OGI Class ECE-580-DOE :Statistical Process Control and Design of Experiments Steve Brainerd
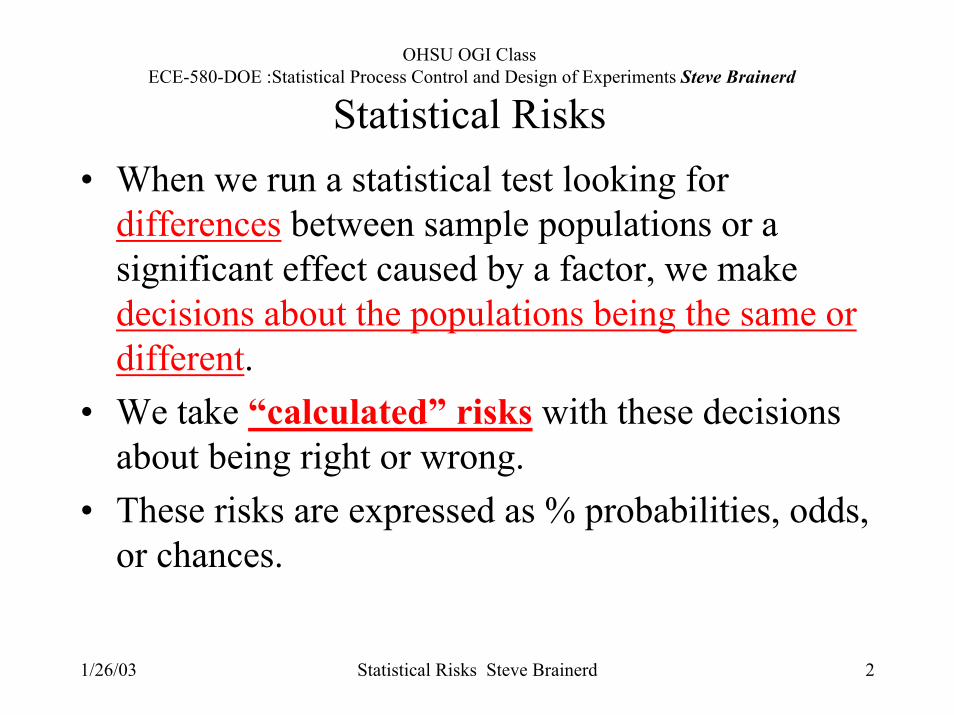
Statistical Risks• When we run a statistical test looking for
differences between sample populations or a significant effect caused by a factor, we make decisions about the populations being the same or different.
• We take “calculated” risks with these decisions about being right or wrong.
• These risks are expressed as % probabilities, odds, or chances.
1/26/03 Statistical Risks Steve Brainerd 3
OHSU OGI Class ECE-580-DOE :Statistical Process Control and Design of Experiments Steve Brainerd
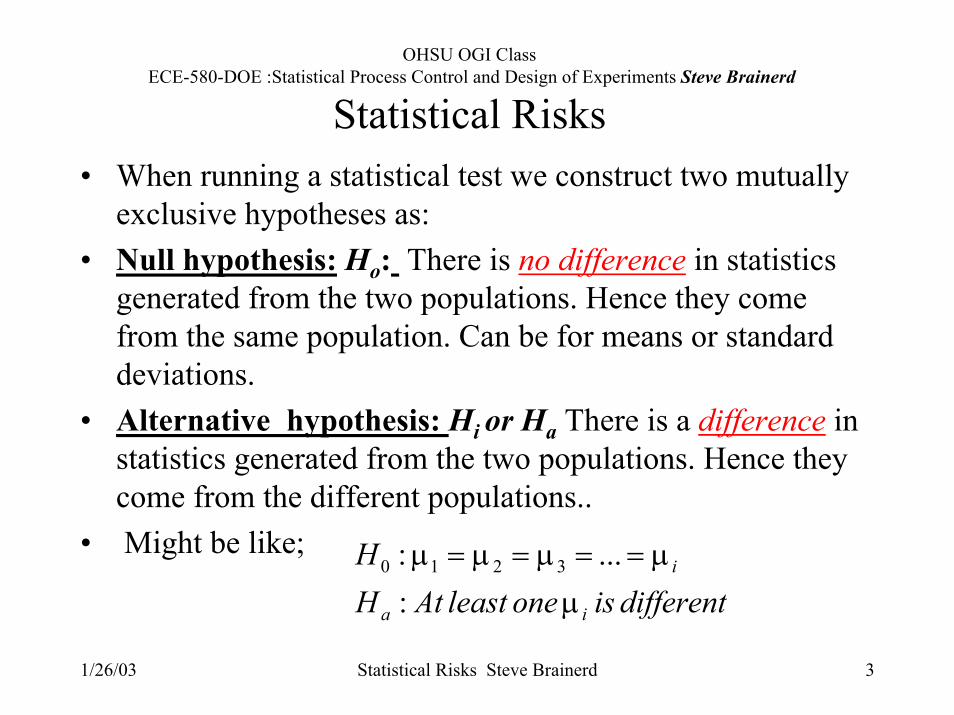
Statistical Risks• When running a statistical test we construct two mutually
exclusive hypotheses as:• Null hypothesis: Ho: There is no difference in statistics
generated from the two populations. Hence they come from the same population. Can be for means or standard deviations.
• Alternative hypothesis: Hi or Ha There is a difference in statistics generated from the two populations. Hence they come from the different populations..
• Might be like;
differentisoneleastAtHH
ia
i
µµµµµ
:...: 3210 ====
1/26/03 Statistical Risks Steve Brainerd 4
OHSU OGI Class ECE-580-DOE :Statistical Process Control and Design of Experiments Steve Brainerd
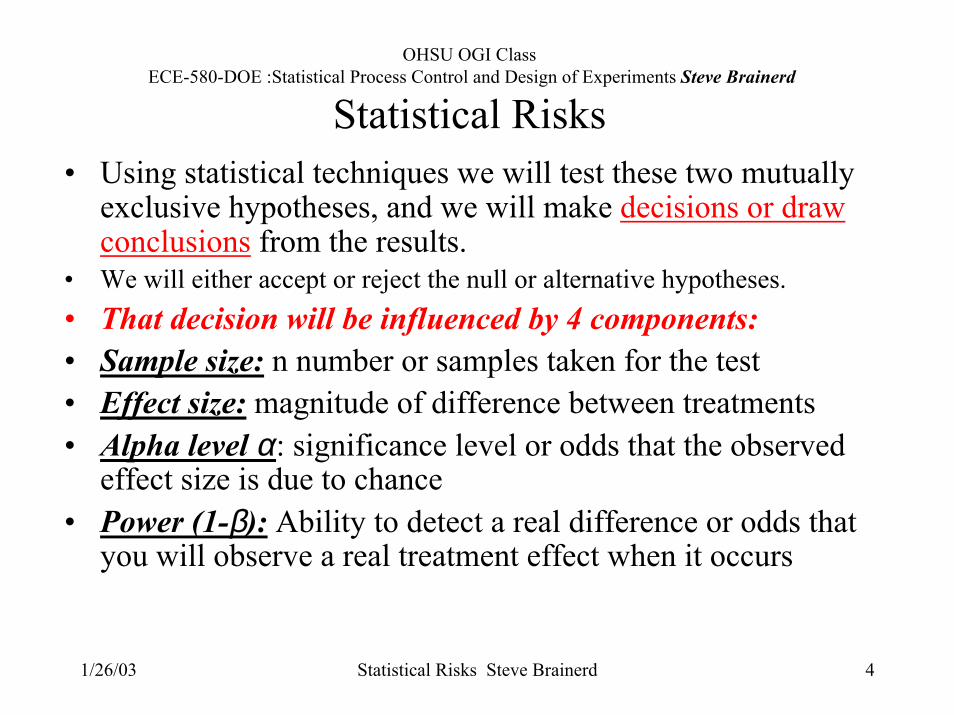
Statistical Risks• Using statistical techniques we will test these two mutually
exclusive hypotheses, and we will make decisions or draw conclusions from the results.
• We will either accept or reject the null or alternative hypotheses.• That decision will be influenced by 4 components:• Sample size: n number or samples taken for the test• Effect size: magnitude of difference between treatments • Alpha level α: significance level or odds that the observed
effect size is due to chance• Power (1-β): Ability to detect a real difference or odds that
you will observe a real treatment effect when it occurs
1/26/03 Statistical Risks Steve Brainerd 5
OHSU OGI Class ECE-580-DOE :Statistical Process Control and Design of Experiments Steve Brainerd
Statistical Risks
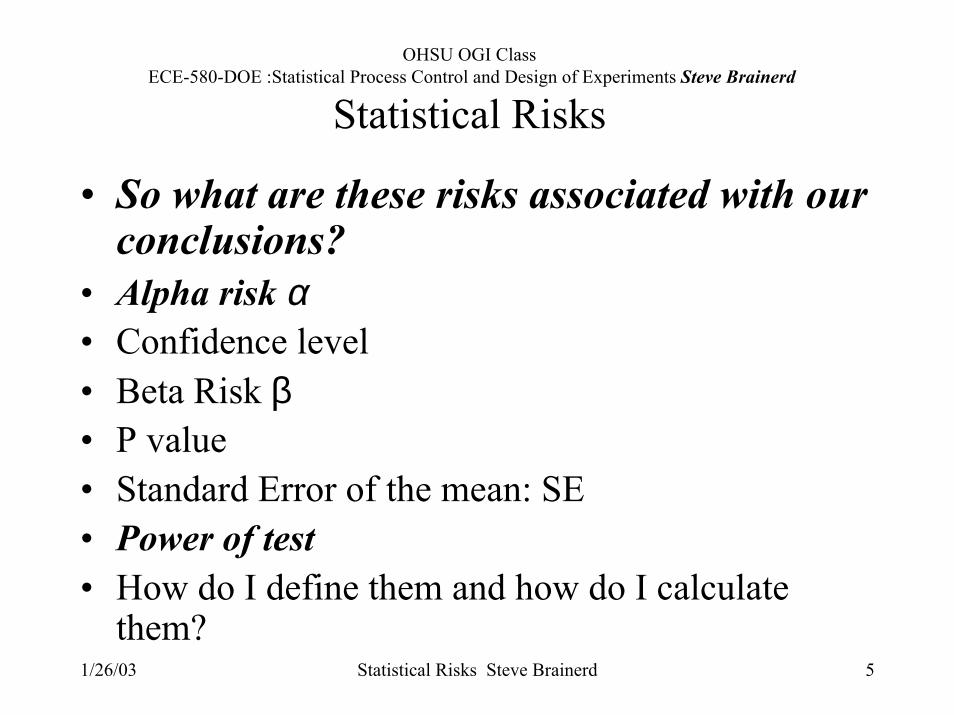
• So what are these risks associated with our conclusions?
• Alpha risk α • Confidence level• Beta Risk β• P value• Standard Error of the mean: SE• Power of test• How do I define them and how do I calculate
them?
1/26/03 Statistical Risks Steve Brainerd 6
OHSU OGI Class ECE-580-DOE :Statistical Process Control and Design of Experiments Steve Brainerd
Statistical Risks
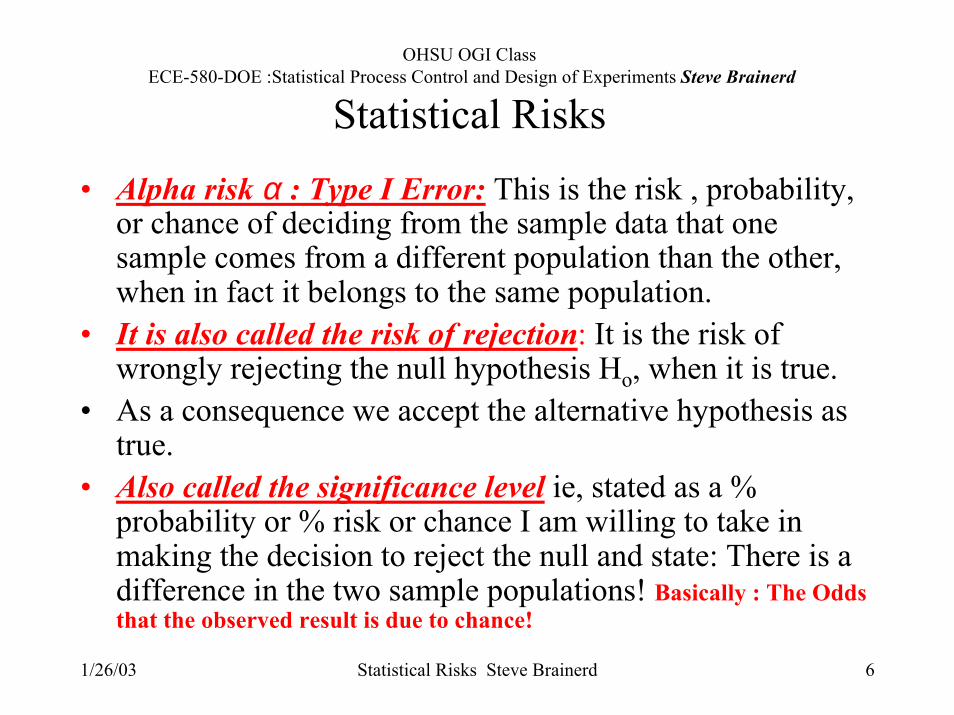
• Alpha risk α : Type I Error: This is the risk , probability, or chance of deciding from the sample data that one sample comes from a different population than the other, when in fact it belongs to the same population.
• It is also called the risk of rejection: It is the risk of wrongly rejecting the null hypothesis Ho, when it is true.
• As a consequence we accept the alternative hypothesis as true.
• Also called the significance level ie, stated as a % probability or % risk or chance I am willing to take in making the decision to reject the null and state: There is a difference in the two sample populations! Basically : The Odds that the observed result is due to chance!
1/26/03 Statistical Risks Steve Brainerd 7
OHSU OGI Class ECE-580-DOE :Statistical Process Control and Design of Experiments Steve Brainerd
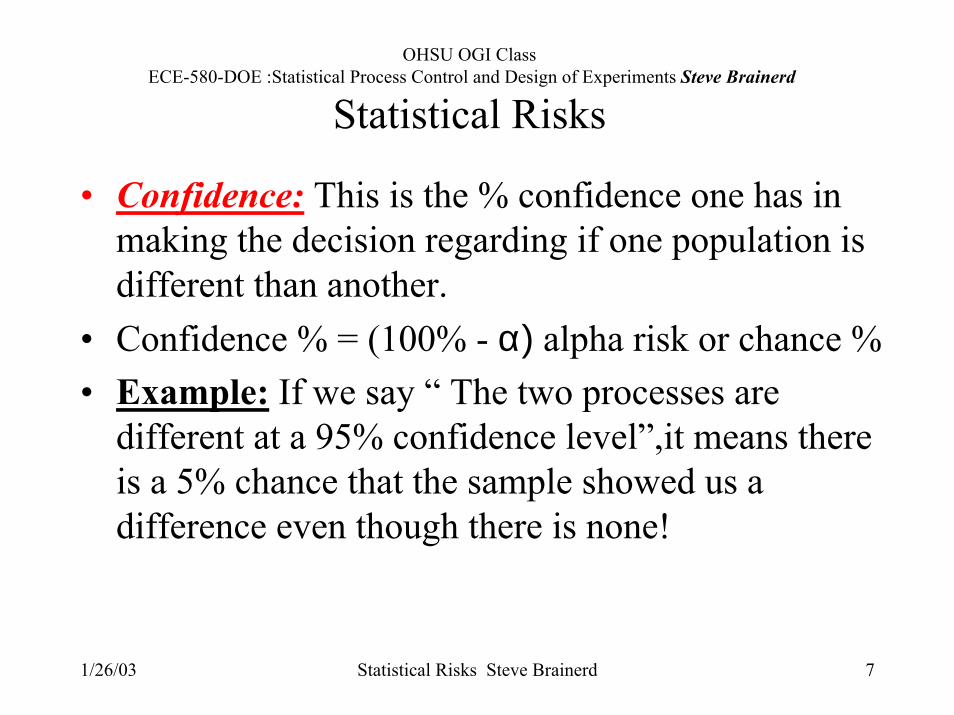
Statistical Risks
• Confidence: This is the % confidence one has in making the decision regarding if one population is different than another.
• Confidence % = (100% - α) alpha risk or chance %• Example: If we say “ The two processes are
different at a 95% confidence level”,it means there is a 5% chance that the sample showed us a difference even though there is none!
1/26/03 Statistical Risks Steve Brainerd 8
OHSU OGI Class ECE-580-DOE :Statistical Process Control and Design of Experiments Steve Brainerd
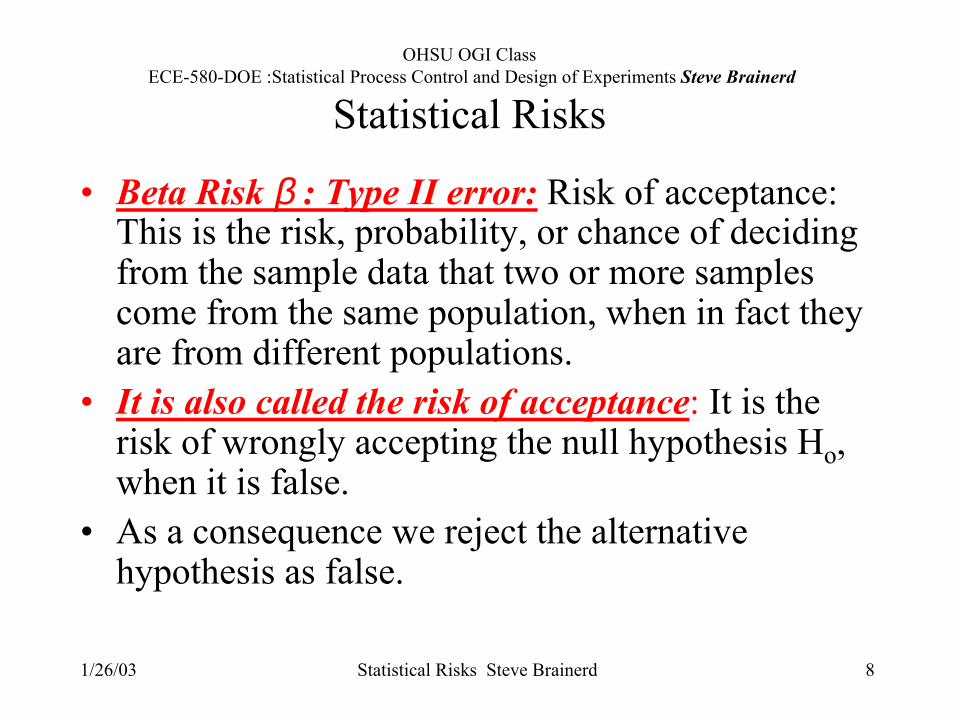
Statistical Risks
• Beta Risk β : Type II error: Risk of acceptance: This is the risk, probability, or chance of deciding from the sample data that two or more samples come from the same population, when in fact they are from different populations.
• It is also called the risk of acceptance: It is the risk of wrongly accepting the null hypothesis Ho, when it is false.
• As a consequence we reject the alternative hypothesis as false.
1/26/03 Statistical Risks Steve Brainerd 9
OHSU OGI Class ECE-580-DOE :Statistical Process Control and Design of Experiments Steve Brainerd
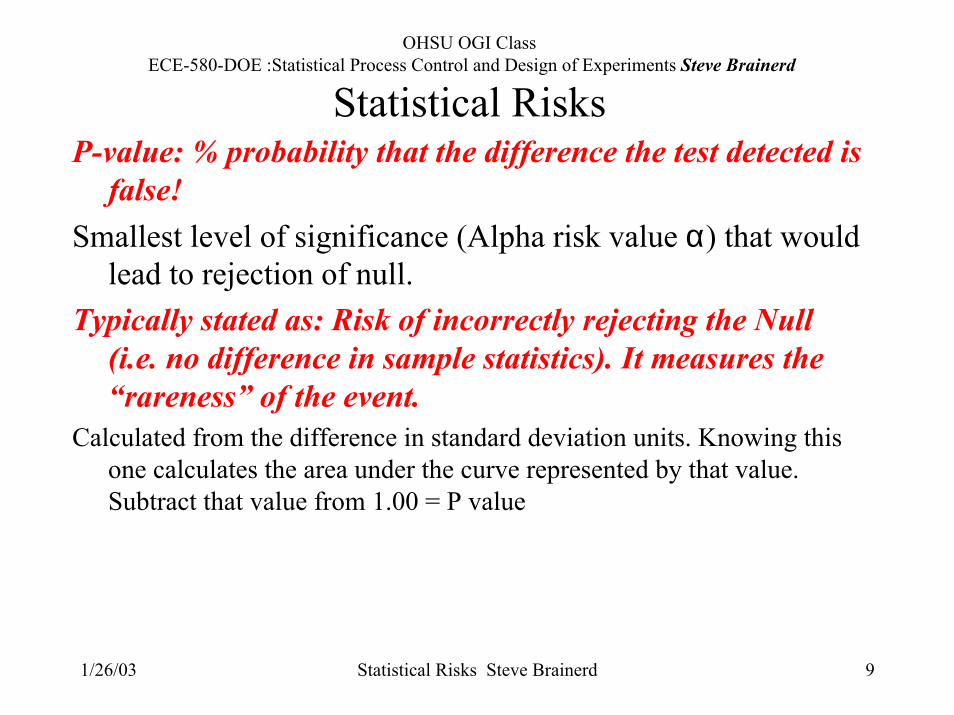
Statistical RisksP-value: % probability that the difference the test detected is
false!Smallest level of significance (Alpha risk value α) that would
lead to rejection of null.Typically stated as: Risk of incorrectly rejecting the Null
(i.e. no difference in sample statistics). It measures the “rareness” of the event.
Calculated from the difference in standard deviation units. Knowing this one calculates the area under the curve represented by that value. Subtract that value from 1.00 = P value
1/26/03 Statistical Risks Steve Brainerd 10
OHSU OGI Class ECE-580-DOE :Statistical Process Control and Design of Experiments Steve Brainerd
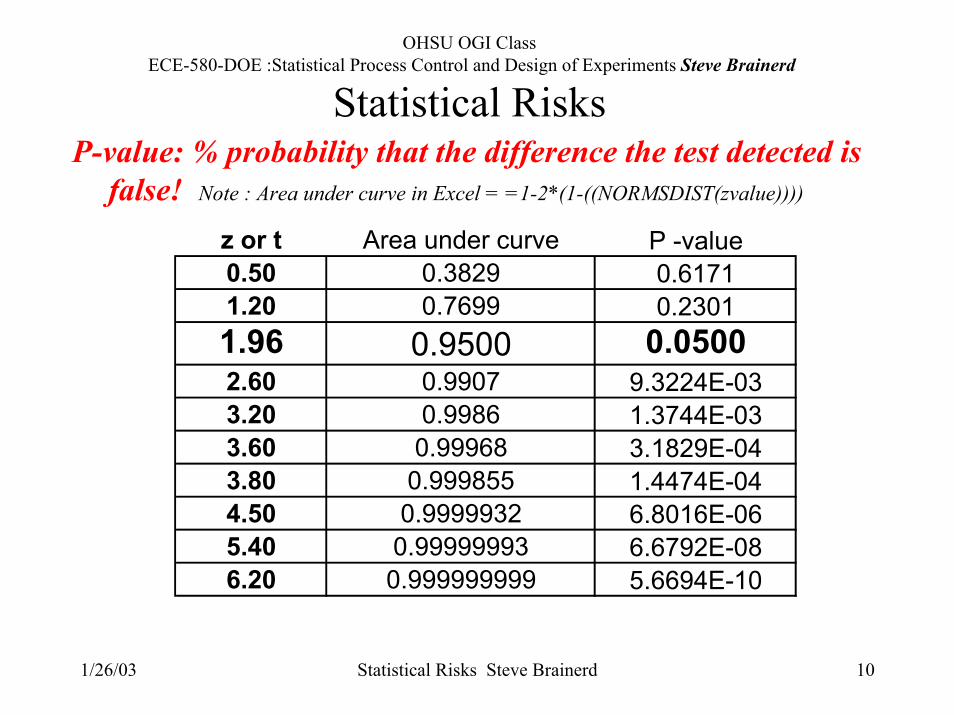
Statistical RisksP-value: % probability that the difference the test detected is
false! Note : Area under curve in Excel = =1-2*(1-((NORMSDIST(zvalue))))
z or t Area under curve P -value0.50 0.3829 0.61711.20 0.7699 0.23011.96 0.9500 0.05002.60 0.9907 9.3224E-033.20 0.9986 1.3744E-033.60 0.99968 3.1829E-043.80 0.999855 1.4474E-044.50 0.9999932 6.8016E-065.40 0.99999993 6.6792E-086.20 0.999999999 5.6694E-10
1/26/03 Statistical Risks Steve Brainerd 11
OHSU OGI Class ECE-580-DOE :Statistical Process Control and Design of Experiments Steve Brainerd
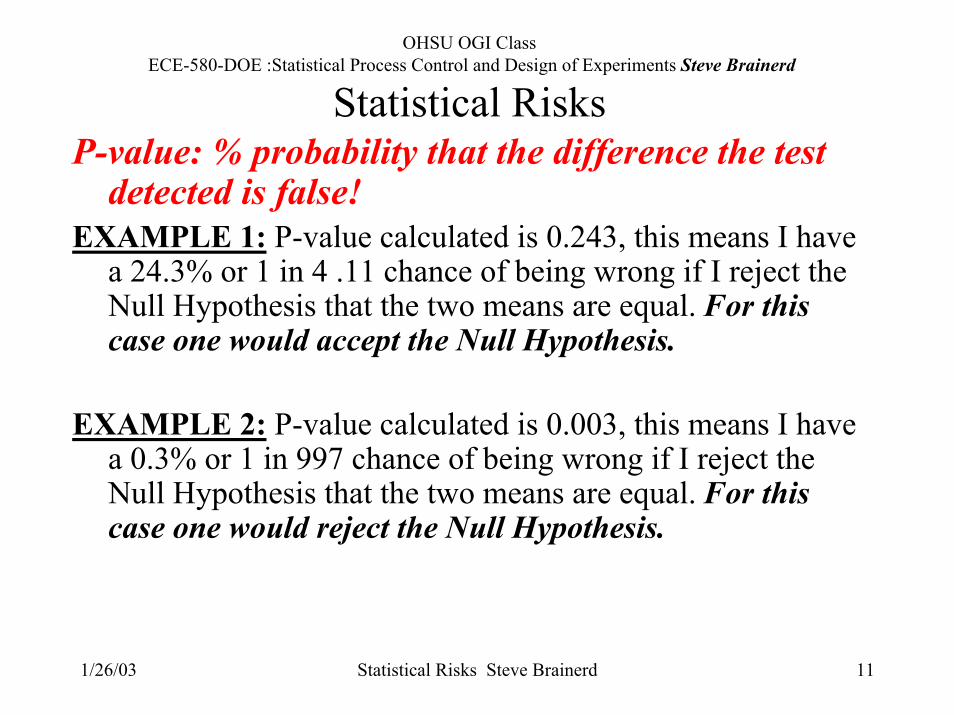
Statistical RisksP-value: % probability that the difference the test
detected is false!EXAMPLE 1: P-value calculated is 0.243, this means I have
a 24.3% or 1 in 4 .11 chance of being wrong if I reject the Null Hypothesis that the two means are equal. For this case one would accept the Null Hypothesis.
EXAMPLE 2: P-value calculated is 0.003, this means I have a 0.3% or 1 in 997 chance of being wrong if I reject the Null Hypothesis that the two means are equal. For this case one would reject the Null Hypothesis.
1/26/03 Statistical Risks Steve Brainerd 12
OHSU OGI Class ECE-580-DOE :Statistical Process Control and Design of Experiments Steve Brainerd
Statistical Risks
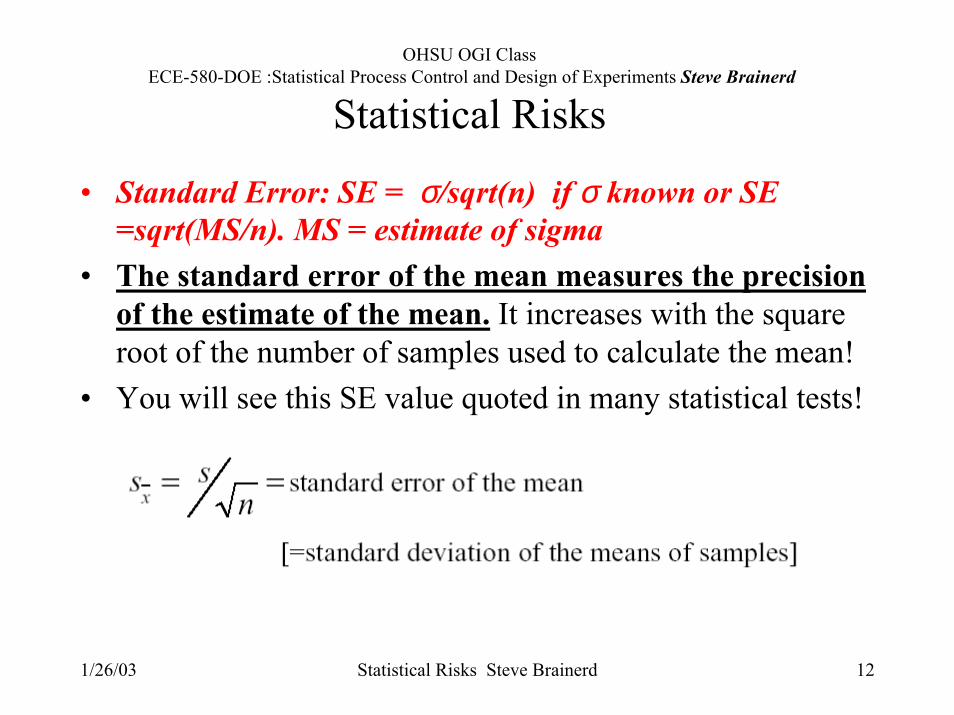
• Standard Error: SE = σ/sqrt(n) if σ known or SE =sqrt(MS/n). MS = estimate of sigma
• The standard error of the mean measures the precision of the estimate of the mean. It increases with the square root of the number of samples used to calculate the mean!
• You will see this SE value quoted in many statistical tests!
1/26/03 Statistical Risks Steve Brainerd 13
OHSU OGI Class ECE-580-DOE :Statistical Process Control and Design of Experiments Steve Brainerd
Statistical Risks
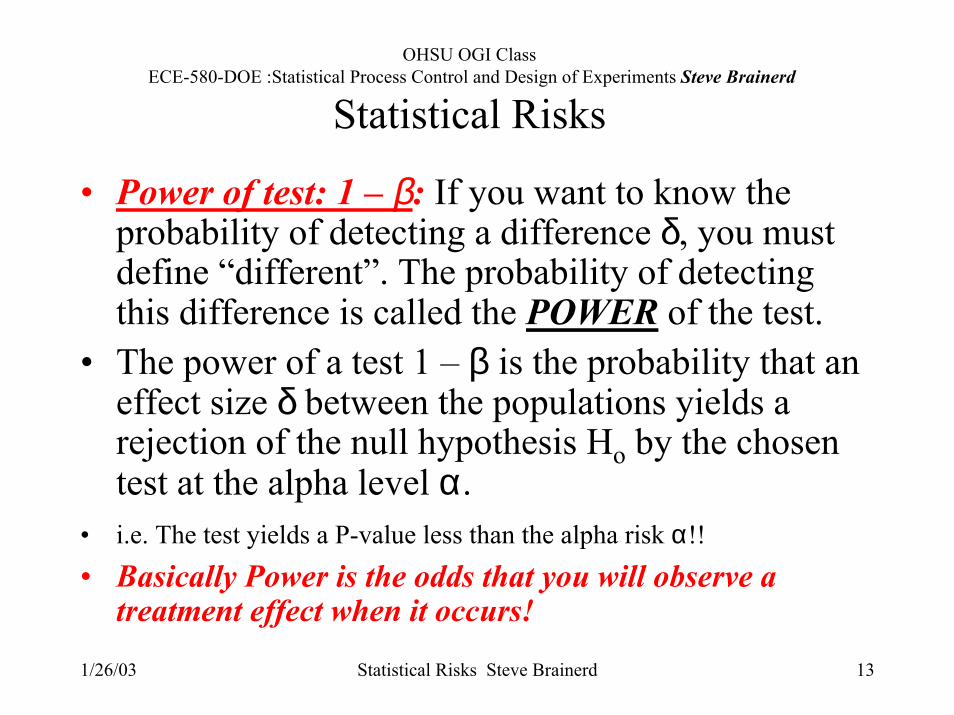
• Power of test: 1 – β: If you want to know the probability of detecting a difference δ, you must define “different”. The probability of detecting this difference is called the POWER of the test.
• The power of a test 1 – β is the probability that an effect size δ between the populations yields a rejection of the null hypothesis Ho by the chosen test at the alpha level α.
• i.e. The test yields a P-value less than the alpha risk α!!• Basically Power is the odds that you will observe a
treatment effect when it occurs!
1/26/03 Statistical Risks Steve Brainerd 14
OHSU OGI Class ECE-580-DOE :Statistical Process Control and Design of Experiments Steve Brainerd
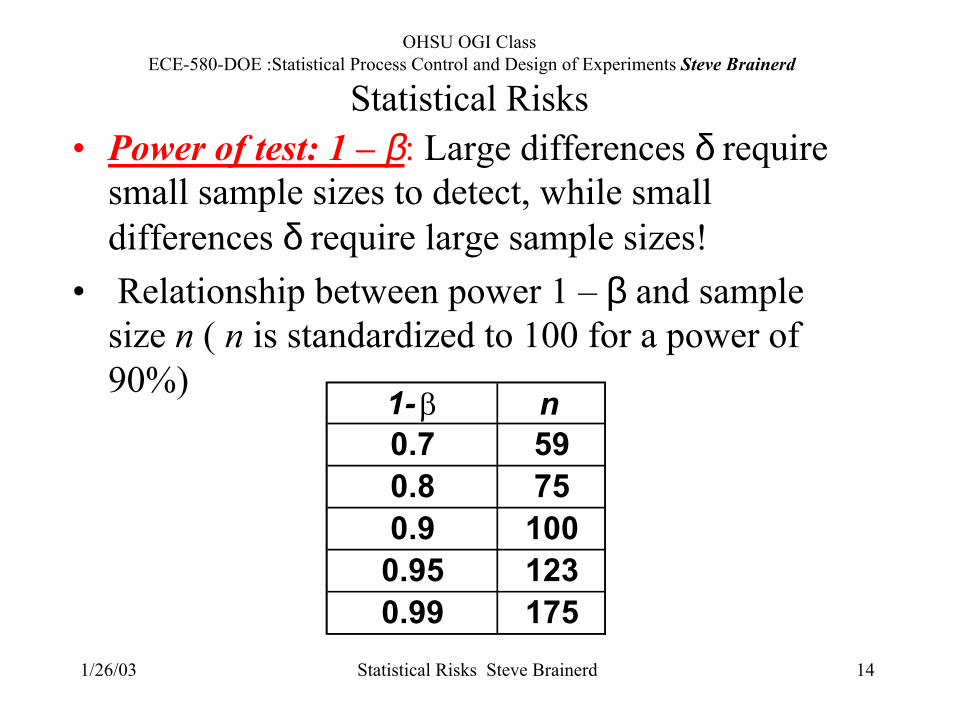
Statistical Risks• Power of test: 1 – β: Large differences δ require
small sample sizes to detect, while small differences δ require large sample sizes!
• Relationship between power 1 – β and sample size n ( n is standardized to 100 for a power of 90%) 1- β n
0.7 590.8 750.9 100
0.95 1230.99 175
1/26/03 Statistical Risks Steve Brainerd 15
OHSU OGI Class ECE-580-DOE :Statistical Process Control and Design of Experiments Steve Brainerd
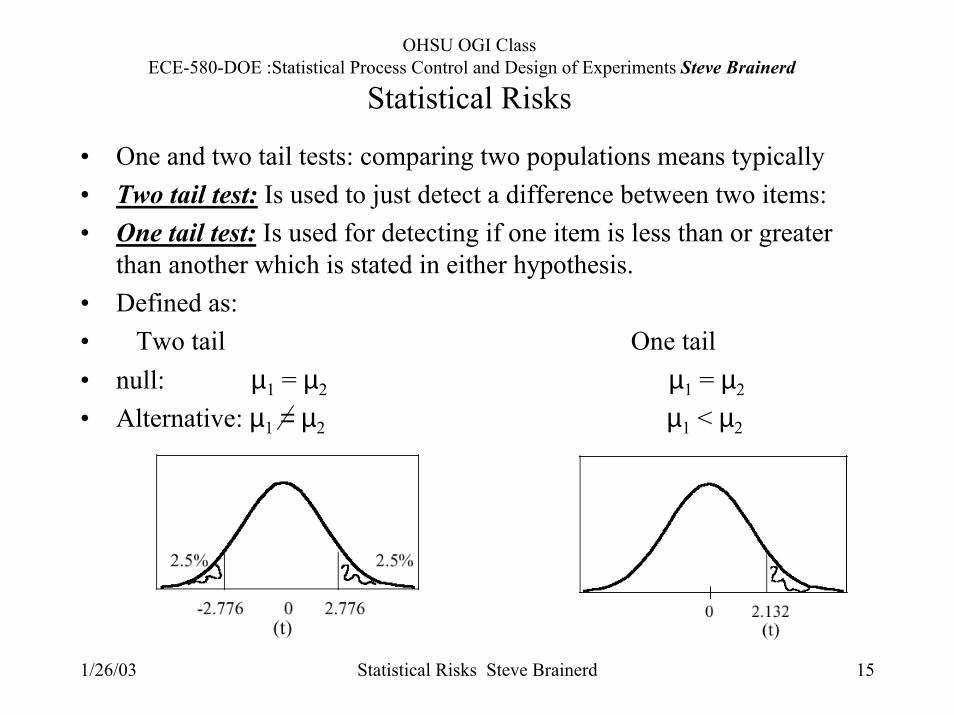
Statistical Risks
• One and two tail tests: comparing two populations means typically• Two tail test: Is used to just detect a difference between two items: • One tail test: Is used for detecting if one item is less than or greater
than another which is stated in either hypothesis.• Defined as:• Two tail One tail• null: µ1 = µ2 µ1 = µ2
• Alternative: µ1 = µ2 µ1 < µ2
1/26/03 Statistical Risks Steve Brainerd 16
OHSU OGI Class ECE-580-DOE :Statistical Process Control and Design of Experiments Steve Brainerd
Statistical Risks
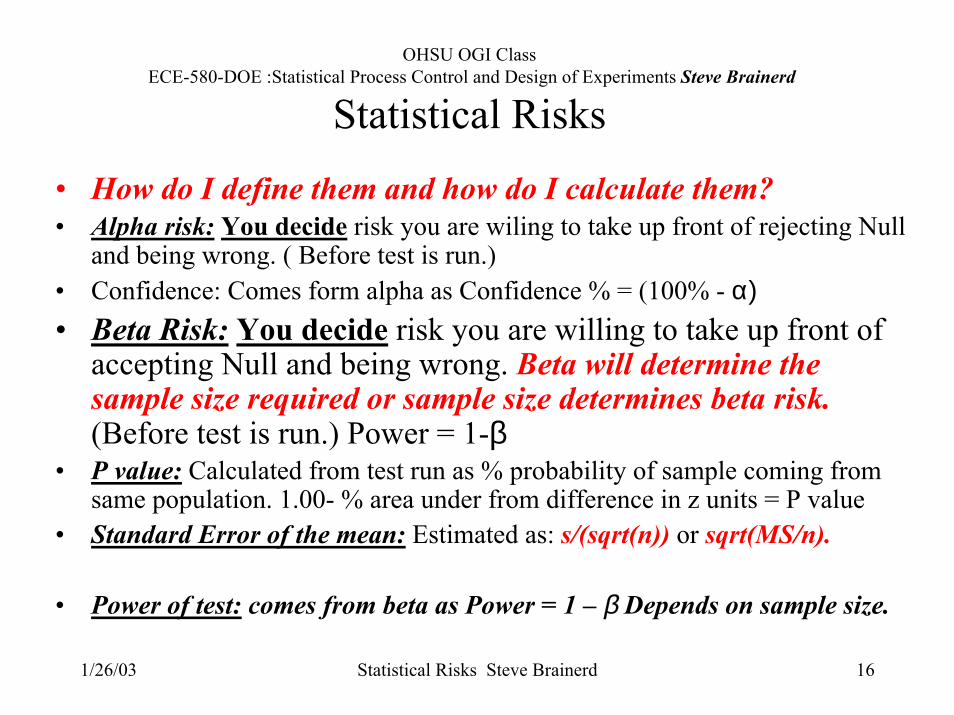
• How do I define them and how do I calculate them?• Alpha risk: You decide risk you are wiling to take up front of rejecting Null
and being wrong. ( Before test is run.)• Confidence: Comes form alpha as Confidence % = (100% - α)• Beta Risk: You decide risk you are willing to take up front of
accepting Null and being wrong. Beta will determine the sample size required or sample size determines beta risk.(Before test is run.) Power = 1-β
• P value: Calculated from test run as % probability of sample coming fromsame population. 1.00- % area under from difference in z units = P value
• Standard Error of the mean: Estimated as: s/(sqrt(n)) or sqrt(MS/n).
• Power of test: comes from beta as Power = 1 – β Depends on sample size.
1/26/03 Statistical Risks Steve Brainerd 17
OHSU OGI Class ECE-580-DOE :Statistical Process Control and Design of Experiments Steve Brainerd
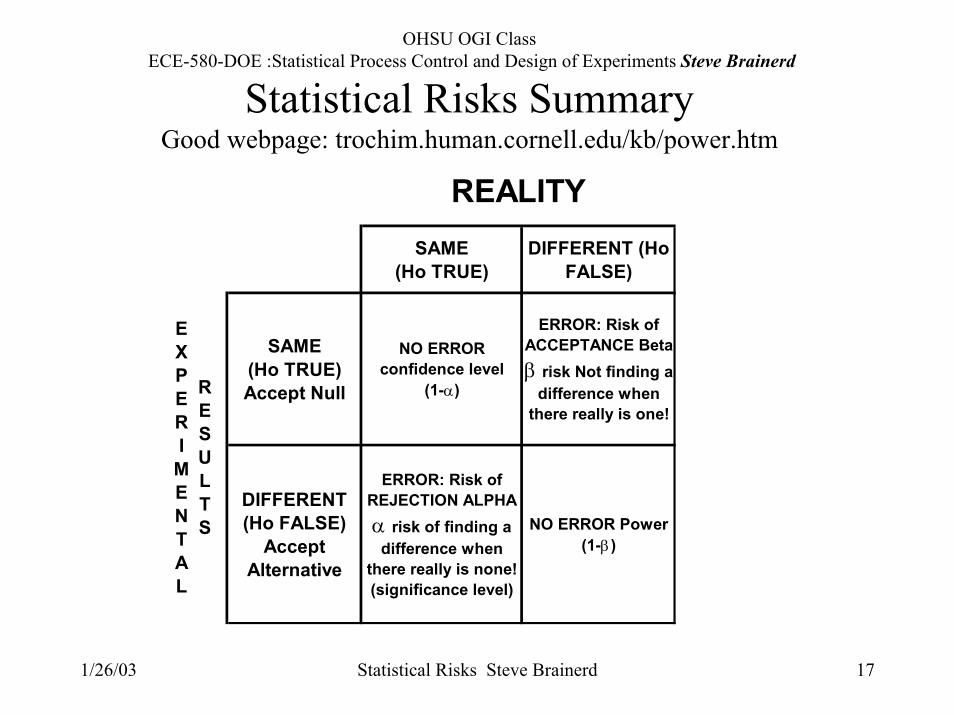
Statistical Risks SummaryGood webpage: trochim.human.cornell.edu/kb/power.htm
SAME (Ho TRUE)
DIFFERENT (Ho FALSE)
SAME (Ho TRUE) Accept Null
NO ERROR confidence level
(1-α)
ERROR: Risk of ACCEPTANCE Beta β risk Not finding a
difference when there really is one!
DIFFERENT (Ho FALSE)
Accept Alternative
ERROR: Risk of REJECTION ALPHA α risk of finding a difference when
there really is none! (significance level)
NO ERROR Power (1-β)
EXPERI
MENTAL
RESULTS
REALITY
1/26/03 Statistical Risks Steve Brainerd 18
OHSU OGI Class ECE-580-DOE :Statistical Process Control and Design of Experiments Steve Brainerd
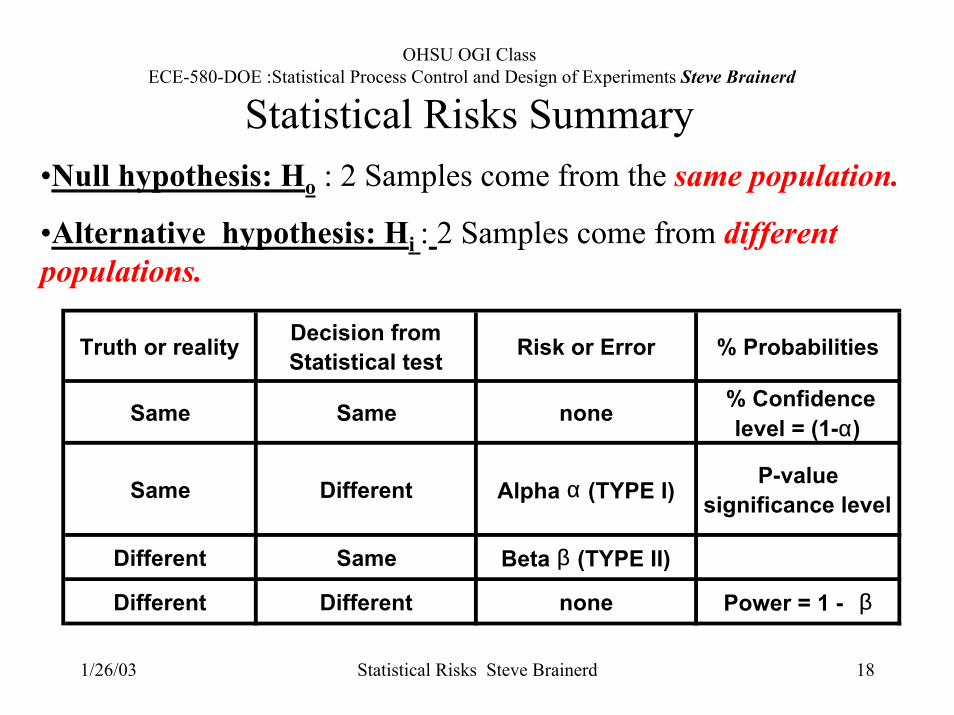
Statistical Risks Summary•Null hypothesis: Ho : 2 Samples come from the same population.
•Alternative hypothesis: Hi : 2 Samples come from different populations.
Truth or reality Decision from Statistical test Risk or Error % Probabilities
Same Same none % Confidence level = (1-α)
Same Different Alpha α (TYPE I) P-value significance level
Different Same Beta β (TYPE II)
Different Different none Power = 1 - β
1/26/03 Statistical Risks Steve Brainerd 19
OHSU OGI Class ECE-580-DOE :Statistical Process Control and Design of Experiments Steve Brainerd
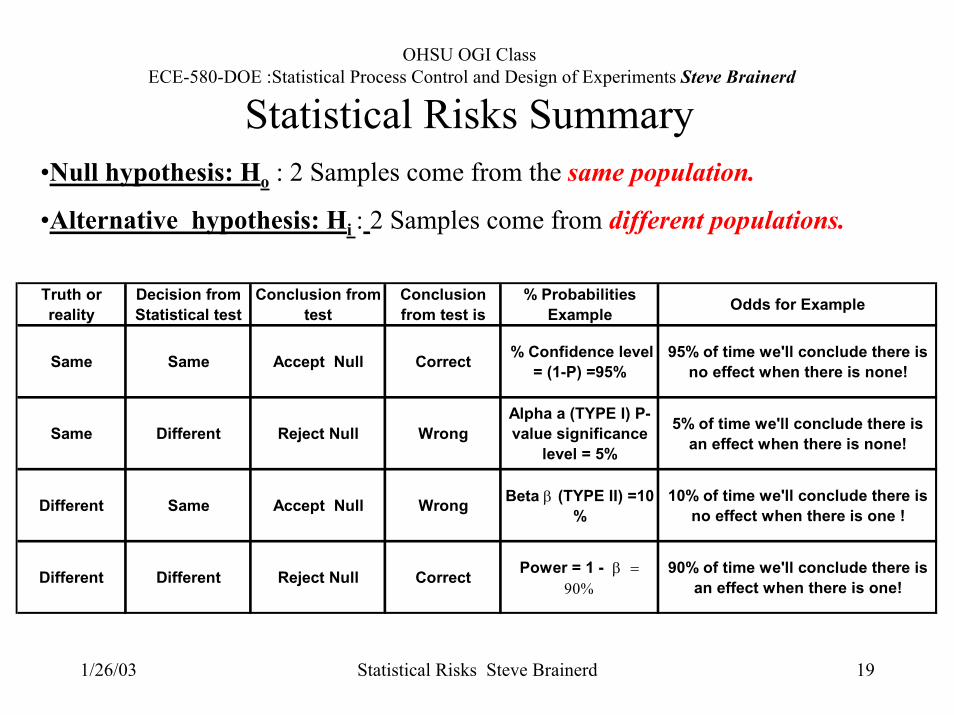
Statistical Risks Summary•Null hypothesis: Ho : 2 Samples come from the same population.
•Alternative hypothesis: Hi : 2 Samples come from different populations.
Truth or reality
Decision from Statistical test
Conclusion from test
Conclusion from test is
% Probabilities Example Odds for Example
Same Same Accept Null Correct % Confidence level = (1-P) =95%
95% of time we'll conclude there is no effect when there is none!
Same Different Reject Null WrongAlpha a (TYPE I) P-value significance
level = 5%
5% of time we'll conclude there is an effect when there is none!
Different Same Accept Null Wrong Beta β (TYPE II) =10 %
10% of time we'll conclude there is no effect when there is one !
Different Different Reject Null Correct Power = 1 - β = 90%
90% of time we'll conclude there is an effect when there is one!
1/26/03 Statistical Risks Steve Brainerd 20
OHSU OGI Class ECE-580-DOE :Statistical Process Control and Design of Experiments Steve Brainerd
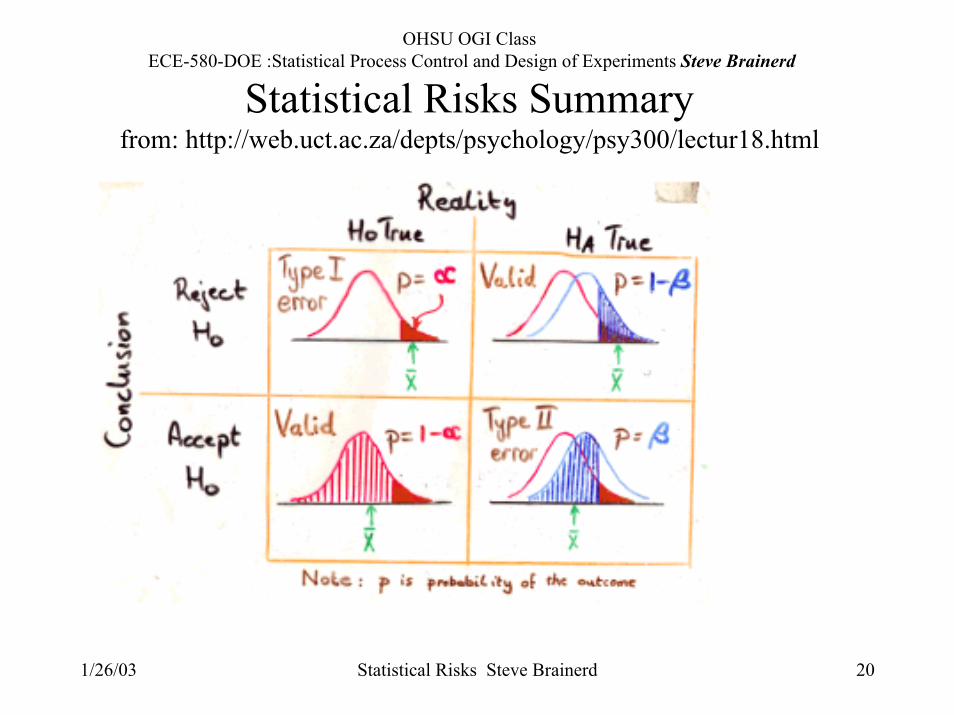
Statistical Risks Summaryfrom: http://web.uct.ac.za/depts/psychology/psy300/lectur18.html
1/26/03 Statistical Risks Steve Brainerd 21
OHSU OGI Class ECE-580-DOE :Statistical Process Control and Design of Experiments Steve Brainerd
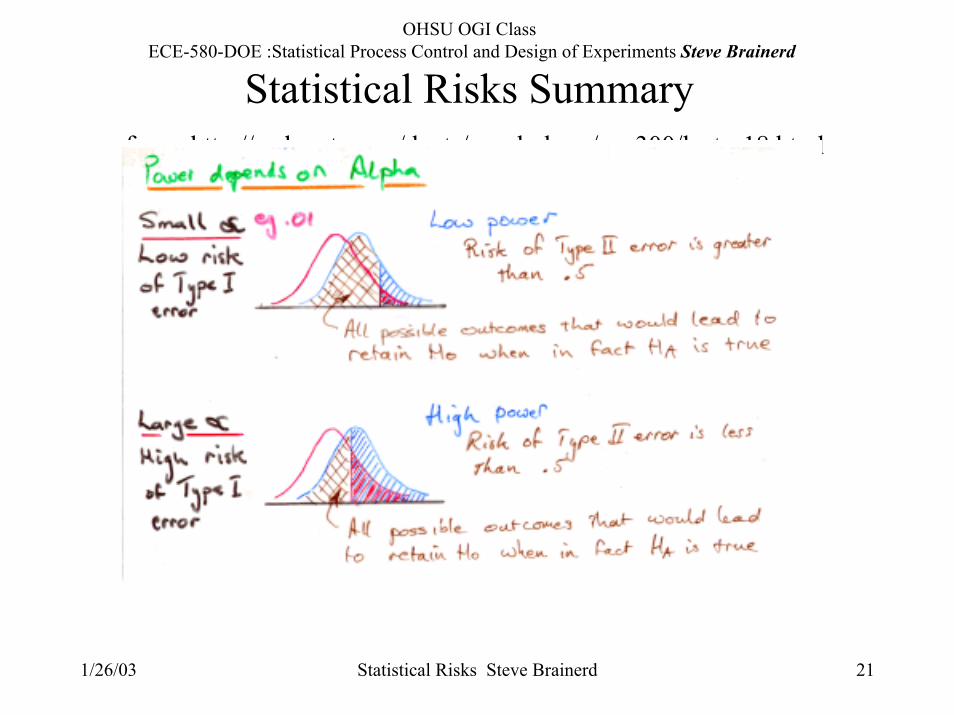
Statistical Risks Summaryfrom: http://web.uct.ac.za/depts/psychology/psy300/lectur18.html
1/26/03 Statistical Risks Steve Brainerd 22
OHSU OGI Class ECE-580-DOE :Statistical Process Control and Design of Experiments Steve Brainerd
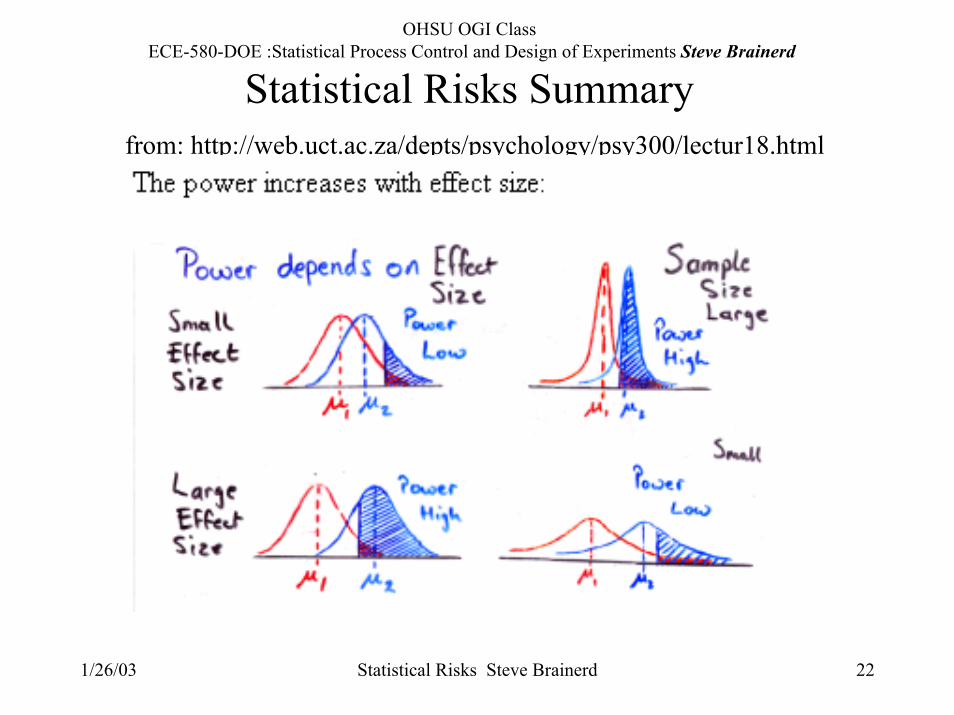
Statistical Risks Summaryfrom: http://web.uct.ac.za/depts/psychology/psy300/lectur18.html
1/26/03 Statistical Risks Steve Brainerd 23
OHSU OGI Class ECE-580-DOE :Statistical Process Control and Design of Experiments Steve Brainerd
Statistical Risks Summaryfrom: http://trochim.human.cornell.edu/kb/power.htm
•The lower the α, the lower the power; the higher the α, the higher the power
•The lower the α, the less likely it is that you will make a Type I Error (i.e., reject the null when it’s true)
• The lower the α, the more "rigorous" the test
• An α of .01 (compared with .05 or .10) means the researcher is being relatively careful, s/he is only willing to risk being wrong 1 in a 100 times in rejecting the null when it’s true (i.e., saying there’s an effect when there really isn’t)
• An α of .01 (compared with .05 or .10) limits one’s chances of ending up in the bottom row, of concluding that the program has an effect. This means that both your statistical power and the chances of making a Type I Error are lower.
1/26/03 Statistical Risks Steve Brainerd 24
OHSU OGI Class ECE-580-DOE :Statistical Process Control and Design of Experiments Steve Brainerd
Statistical Risks Summaryfrom: http://trochim.human.cornell.edu/kb/power.htm
•An α of .01 means you have a 99% chance of saying there is no difference when there in fact is no difference (being in the upper left box)
• Increasing α (e.g., from .01 to .05 or .10) increases the chances of making a Type I Error (i.e., saying there is a difference when there is not), decreases the chances of making a Type II Error (i.e., saying there is no difference when there is) and decreases the rigor of the test
• Increasing α (e.g., from .01 to .05 or .10) increases power because one will be rejecting the null more often (i.e., accepting the alternative) and, consequently, when the alternative is true, there is a greater chance of accepting it (i.e., power)