Statistical Analysis Plan GEL - ClinicalTrials.gov
73
Statistical Analysis Plan Study Code D589SC00001 Edition Number 4 Date 29 September 2017 A 52-week, double-blind, randomised, multi-centre, parallel-group, Phase III study in patients 12 years and older with asthma, evaluating the efficacy and safety of Symbicort® (budesonide/formoterol) Turbuhaler® 160/4.5 μg ‘as needed’ compared with terbutaline Turbuhaler® 0.4 mg ‘as needed’ and with Pulmicort® (budesonide) Turbuhaler® 200 μg twice daily plus terbutaline Turbuhaler® 0.4 mg ‘as needed’
Transcript of Statistical Analysis Plan GEL - ClinicalTrials.gov

Statistical Analysis Plan
Study Code D589SC00001Edition Number 4Date 29 September 2017
A 52-week, double-blind, randomised, multi-centre, parallel-group, Phase III study in patients 12 years and older with asthma, evaluating the efficacy and safety of Symbicort® (budesonide/formoterol) Turbuhaler® 160/4.5 μg ‘as needed’ compared with terbutaline Turbuhaler® 0.4 mg ‘as needed’ and with Pulmicort® (budesonide) Turbuhaler® 200 μg twice daily plus terbutaline Turbuhaler® 0.4 mg ‘as needed’


Statistical Analysis Plan Study Code D589SC00001Edition Number 4Date 29 September 2017
4
TABLE OF CONTENTS PAGE
TITLE PAGE............................................................................................1
SIGNATURE OF STUDY STATISTICIAN.............................................2SIGNATURE OF GLOBAL PRODUCT STATISTICIAN .......................3
TABLE OF CONTENTS..........................................................................4LIST OF ABBREVIATIONS ...................................................................8
AMENDMENT HISTORY.....................................................................101. STUDY DETAILS..................................................................................11
1.1 Study objectives...................................................................................... 111.1.1 Primary objective ....................................................................................111.1.2 Secondary objectives...............................................................................111.1.3 Safety objective.......................................................................................121.1.4 Exploratory objectives ............................................................................121.1.5 China submission....................................................................................12
1.2 Study design ........................................................................................... 131.3 Number of patients..................................................................................17
2. ANALYSIS SETS ..................................................................................182.1 Definition of analysis sets ....................................................................... 182.1.1 All patients analysis set ...........................................................................182.1.2 Full analysis set.......................................................................................182.1.3 Safety analysis set ...................................................................................182.2 Violations and deviations ........................................................................ 19
3. PRIMARY AND SECONDARY VARIABLES......................................203.1 General considerations for outcome variables.......................................... 203.1.1 Definition of baseline..............................................................................203.1.2 Definition of end of treatment .................................................................223.1.3 Timing of weeks for the purpose of assessing weekly asthma control
status.......................................................................................................223.1.3.1 Allocation of study days to weeks ...........................................................223.1.3.2 Weeks that are cut short ..........................................................................233.1.3.3 Consecutive days spanning multiple weeks .............................................233.1.4 Valid maintenance and ‘as-needed’ medication turns ..............................233.1.5 Timing of maintenance and ‘as needed’ medication and allocation to
day/night period ......................................................................................23
Statistical Analysis Plan Study Code D589SC00001Edition Number 4Date 29 September 2017
5
3.1.6 Visit windowing......................................................................................253.1.7 Definition of completing treatment and completing study........................25
3.2 Primary variable...................................................................................... 253.3 Demography and patient characteristics ..................................................253.3.1 Demography, weight, height and lung function .......................................253.3.2 Medical, asthma and smoking history......................................................26
3.4 Efficacy variables....................................................................................263.4.1 Diary-based outcomes .............................................................................263.4.1.1 Daily variables: PEF, asthma symptoms, nighttime awakenings and
‘as needed’ medication use......................................................................263.4.1.2 Daily composite end-points.....................................................................273.4.1.3 Weekly composite end-points .................................................................283.4.1.4 eDiary compliance ..................................................................................303.4.2 Asthma exacerbations .............................................................................303.4.2.1 Definitions of exacerbations....................................................................303.4.2.2 Time-to-event variables for exacerbations ...............................................313.4.2.3 Time-to-censoring for exacerbations .......................................................323.4.2.4 Number of severe and moderate or severe asthma exacerbations, and
annual exacerbation rate..........................................................................323.4.3 Administration of additional steroids for asthma and long-term poor
asthma control.........................................................................................323.4.4 Total inhaled steroid load ........................................................................333.4.5 Number of days with systemic GCS treatment due to asthma ..................343.4.6 Time to study-specific asthma-related discontinuation.............................343.4.7 Lung function variables...........................................................................343.4.8 Patient reported outcomes .......................................................................353.4.8.1 Asthma Control Questionnaire – 5-item Version (ACQ-5) ......................353.4.8.2 Asthma Quality of Life Questionnaire – Standardised Version
(AQLQ(S)) .............................................................................................363.5 Safety variables....................................................................................... 373.5.1 Vital signs...............................................................................................373.5.2 Physical examination ..............................................................................373.5.3 Pregnancy ...............................................................................................373.5.4 Adverse events (including Serious Adverse Events) ................................383.5.4.1 Collection of AEs and SAEs ...................................................................383.5.4.2 Definition of adverse event leading to discontinuation of investigational
product (DAE) ........................................................................................393.5.4.3 AEs representing potential β2 agonist effects and AEs representing
potential ICS effects................................................................................393.5.4.4 Other significant adverse events (OAEs) .................................................393.5.4.5 Adverse events data handling ..................................................................393.6 Other variables........................................................................................40
Statistical Analysis Plan Study Code D589SC00001Edition Number 4Date 29 September 2017
6
3.6.1 Concomitant medications ........................................................................403.6.2 Discontinuation/withdrawal from the study .............................................403.6.3 Compliance of study maintenance medication.........................................414. ANALYSIS METHODS.........................................................................41
4.1 General principles ................................................................................... 414.2 Analysis methods....................................................................................434.2.1 Patient disposition...................................................................................434.2.2 Demography data and patient characteristics ........................................... 434.2.3 Treatment exposure.................................................................................444.2.4 Concomitant medications ........................................................................444.2.5 Primary analysis: well-controlled asthma weeks......................................444.2.6 Secondary efficacy analyses....................................................................464.2.6.1 Asthma exacerbations .............................................................................464.2.6.2 Additional steroids for asthma.................................................................474.2.6.3 Steroid load.............................................................................................484.2.6.4 Discontinuation due to study specific asthma related events ....................484.2.6.5 Lung function measurements...................................................................494.2.6.6 Patient reported outcomes .......................................................................494.2.6.7 Electronic diary variables........................................................................504.2.6.8 Maintenance medication compliance and ‘as needed’ medication use......514.2.7 Safety analysis ........................................................................................524.2.8 Subgroup, supportive and sensitivity analyses .........................................524.2.8.1 Subgroup analysis ...................................................................................524.2.8.2 Supportive analysis: individual components of well-controlled asthma
weeks......................................................................................................554.2.8.3 Supportive analysis: removing individual components of well-controlled
asthma weeks ..........................................................................................554.2.8.4 Sensitivity analysis: the ‘as needed’ component of well-controlled asthma
weeks......................................................................................................554.2.8.5 Sensitivity analysis: effect of missing diary observations on well-
controlled asthma weeks .........................................................................565. INTERIM ANALYSES ..........................................................................57
6. CHANGES OF ANALYSIS FROM PROTOCOL ..................................586.1 Morning PEF on Day 1 occurs before randomisation...............................58
6.2 Baseline measurement for ACQ/AQLQ/FEV1/FVC on visit 3 only ........586.3 Exclusion of analysis on partly-controlled weeks ....................................58
6.4 Amendment to daytime/nighttime periods for ‘as needed’ medication.....587. REFERENCES .......................................................................................59
8. APPENDIX 1: METHOD FOR CALCULATING PREDICTED NORMAL FEV1 .....................................................................................60
Statistical Analysis Plan Study Code D589SC00001Edition Number 4Date 29 September 2017
7
8.1 Equation for calculating predicted multi-ethnic predicted normal FEV1...608.2 Lookup table for final term......................................................................61
9. APPENDIX 2: IDENTIFICATION OF ADDITIONAL STEROID MEDICATIONS FOR ANALYSES .......................................................65
10. APPENDIX 3: POTENTIAL CLASS EFFECTS Β2-AGONISTS AND POTENTIAL ICS EFFECTS ..................................................................67
LIST OF TABLES
Table 1 Study Plan detailing the procedures............................................15
Table 2 Subgroups ..................................................................................54
LIST OF FIGURES
Figure 1 Study Flow Chart .......................................................................14
Statistical Analysis Plan Study Code D589SC00001Edition Number 4Date 29 September 2017
8
LIST OF ABBREVIATIONS
Abbreviation or special term
Explanation
ACQ-5 Asthma Control Questionnaire 5-item version
AE Adverse event
ANCOVA Analysis of covariance
AQLQ(S) Asthma Quality of Life Questionnaire (Standardised version)
BID Twice daily
CSR Clinical study report
DAE Adverse event leading to discontinuation
(e)CRF (Electronic) Case report form
EU European Union
FAS Full analysis set
FCS Fully conditional specification
FDA (United States) Food and Drug Administration
FEV1 Forced expiratory volume in one second
FVC Forced vital capacity
GCS Glucocorticosteroid
GEE Generalised estimating equation
GINA Global Initiative for Asthma
GLI Global Lung Function Initiative
ICH International Conference on Harmonisation (of Technical Requirements for Registration of Pharmaceuticals for Human Use)
ICS Inhaled (gluco)corticosteroid
IP Investigational product
IVRS/IWRS Interactive voice/web response system
LTRA Leukotriene antagonist
MAR Missing at random
MID Minimal important difference
MMRM Mixed model repeated measures
MNAR Missing not at random
NI Non-inferiority
OAE Other significant adverse event
Statistical Analysis Plan Study Code D589SC00001Edition Number 4Date 29 September 2017
9
Abbreviation or special term
Explanation
PEF Peak expiratory flow
PN Predicted normal
SABA Short-acting β-agonist
SAE Serious adverse event
SAP Statistical analysis plan
TUM Turbuhaler usage monitor
vs versus

Statistical Analysis Plan Study Code D589SC00001Edition Number 4Date 29 September 2017
10
AMENDMENT HISTORY
Date Brief description of change
05 June 2014 N/A (Version 1.0)
17 November 2016 Version 1.1AstraZeneca comments incorporated. 5 out of 7 days of eDiary completion were required to be eligible for a well-controlled asthma week (this condition is not needed for the evaluation of a not well-controlled asthma week). Morning PEF on the day of randomisation excluded from baseline PEF calculation. Baseline measurements for FEV1, FVC, ACQ-5 and AQLQ(S) to only use measurements at visit 3. Exclusion of analysis of partly-controlled asthma weeks. The daytime and nighttime periods for ‘as needed’ medicationwas amended.
11 December 2016 Version 1.11AstraZeneca updates prior to release to Phastar
09 February 2017 Version 1.12Updated by Phastar pre-BDR1
18 April 2017 Version 1.2Updated by Phastar following BDR1 comments review meeting
17 May 2017 Version 1.3Updated by Phastar following AstraZeneca review and SYGMA 2 BDR1
05 July 2017 Version 1.4Updated by Phastar following BDR2 comments review meeting
22 August 2017 Version 1.5Updated by Phastar following AstraZeneca review and SYGMA 2 BDR2 comments review meeting. Sensitivity analysis for handling the missing data in well-controlled asthma weeks was added.
12 September 2017 Version 1.6Updated by AstraZeneca to review updates.
18 September 2017 Version 2Updated by AstraZeneca to review updates.
21 September 2017 Version 3Updated by AstraZeneca to incorporate history of severe exacerbations as a covariate in exacerbation models.
29 September 2017 Version 4Updated by AstraZeneca to correct the categorisation of the subgroup average use of SABA per day during run-in period.

Statistical Analysis Plan Study Code D589SC00001Edition Number 4Date 29 September 2017
11
1. STUDY DETAILS
1.1 Study objectives1.1.1 Primary objective
Primary Objective: Outcome Measure:
To demonstrate that Symbicort Turbuhaler 160/4.5 μg ‘as needed’ is superior to terbutaline Turbuhaler 0.4 mg ‘as needed’.
Evaluation of asthma control as measured by well-controlled asthma weeks as the primary variable.
1.1.2 Secondary objectives
Secondary Objective: Outcome Measure:
To evaluate the relative efficacy of Symbicort Turbuhaler 160/4.5 μg ‘as needed’ and Pulmicort Turbuhaler 200 μg twice daily plus terbutaline Turbuhaler 0.4 mg ‘as needed’.
Evaluation of asthma control as measured by well-controlled asthma weeks as the primary variable.
To evaluate the efficacy of Symbicort Turbuhaler 160/4.5 μg as compared to both:terbutaline Turbuhaler 0.4 mg ‘as needed’, andPulmicort Turbuhaler 200 μg twice daily plus terbutaline Turbuhaler 0.4 mg ‘as needed’.
Secondary variables:Annual severe asthma exacerbation rateAnnual moderate or severe asthma exacerbationrate Time to first severe asthma exacerbationTime to first moderate or severe asthma exacerbationTime to additional steroids for asthmaTime to asthma related discontinuationAverage change from baseline in pre-dose FEV1
Average change from baseline in post-doseFEV1
Average change from baseline in Asthma Control Questionnaire (ACQ-5)Average change from baseline in Asthma Quality of Life Questionnaire; standard version (AQLQ(S))Average change from baseline in Morning PEFAverage change from baseline in Evening PEFAverage change from baseline in symptom scoreAverage change from baseline in number ofinhalations of ‘as needed’ medicationPercentage of controller use days
Statistical Analysis Plan Study Code D589SC00001Edition Number 4Date 29 September 2017
12
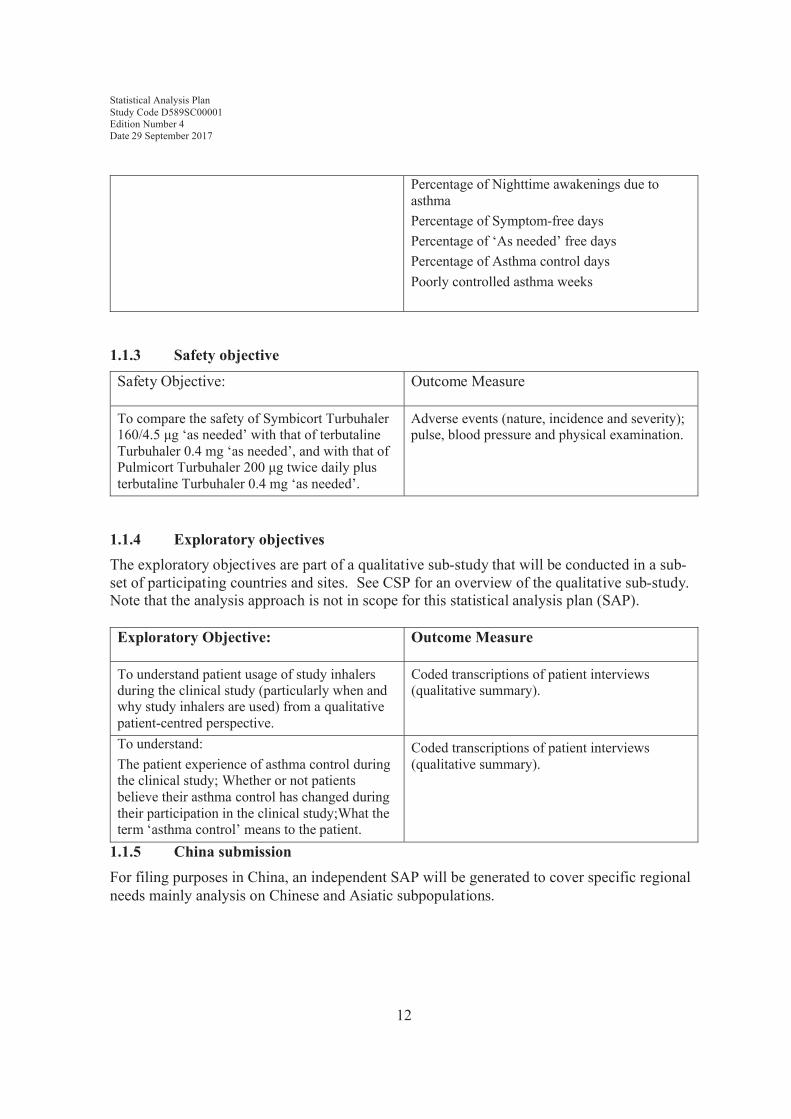
Percentage of Nighttime awakenings due to asthmaPercentage of Symptom-free daysPercentage of ‘As needed’ free daysPercentage of Asthma control daysPoorly controlled asthma weeks
1.1.3 Safety objective
Safety Objective: Outcome Measure
To compare the safety of Symbicort Turbuhaler 160/4.5 μg ‘as needed’ with that of terbutaline Turbuhaler 0.4 mg ‘as needed’, and with that of Pulmicort Turbuhaler 200 μg twice daily plus terbutaline Turbuhaler 0.4 mg ‘as needed’.
Adverse events (nature, incidence and severity); pulse, blood pressure and physical examination.
1.1.4 Exploratory objectivesThe exploratory objectives are part of a qualitative sub-study that will be conducted in a sub-set of participating countries and sites. See CSP for an overview of the qualitative sub-study. Note that the analysis approach is not in scope for this statistical analysis plan (SAP).
Exploratory Objective: Outcome Measure
To understand patient usage of study inhalersduring the clinical study (particularly when and why study inhalers are used) from a qualitative patient-centred perspective.
Coded transcriptions of patient interviews(qualitative summary).
To understand:The patient experience of asthma control during the clinical study; Whether or not patients believe their asthma control has changed during their participation in the clinical study;What the term ‘asthma control’ means to the patient.
Coded transcriptions of patient interviews(qualitative summary).
1.1.5 China submissionFor filing purposes in China, an independent SAP will be generated to cover specific regional needs mainly analysis on Chinese and Asiatic subpopulations.
Statistical Analysis Plan Study Code D589SC00001Edition Number 4Date 29 September 2017
13
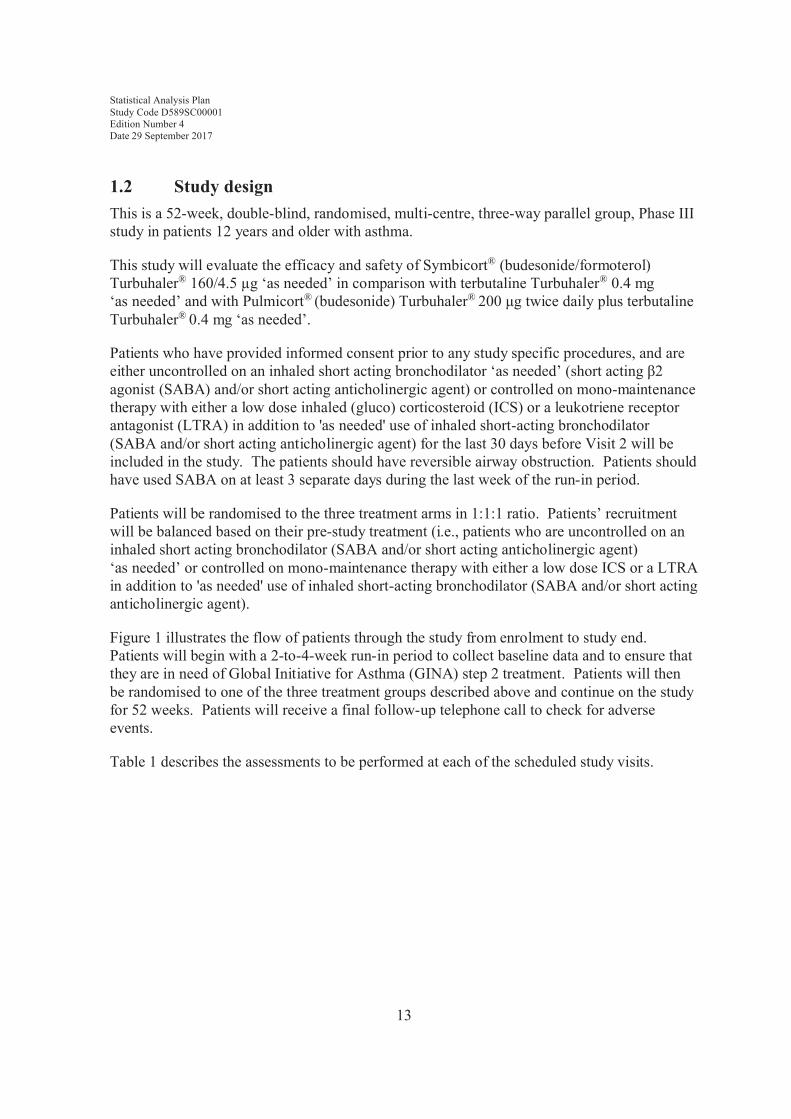
1.2 Study designThis is a 52-week, double-blind, randomised, multi-centre, three-way parallel group, Phase III study in patients 12 years and older with asthma.
This study will evaluate the efficacy and safety of Symbicort® (budesonide/formoterol) Turbuhaler® 160/4.5 μg ‘as needed’ in comparison with terbutaline Turbuhaler® 0.4 mg ‘as needed’ and with Pulmicort® (budesonide) Turbuhaler® 200 μg twice daily plus terbutaline Turbuhaler® 0.4 mg ‘as needed’.
Patients who have provided informed consent prior to any study specific procedures, and are either uncontrolled on an inhaled short acting bronchodilator ‘as needed’ (short acting β2agonist (SABA) and/or short acting anticholinergic agent) or controlled on mono-maintenance therapy with either a low dose inhaled (gluco) corticosteroid (ICS) or a leukotriene receptor antagonist (LTRA) in addition to 'as needed' use of inhaled short-acting bronchodilator (SABA and/or short acting anticholinergic agent) for the last 30 days before Visit 2 will be included in the study. The patients should have reversible airway obstruction. Patients should have used SABA on at least 3 separate days during the last week of the run-in period.
Patients will be randomised to the three treatment arms in 1:1:1 ratio. Patients’ recruitment will be balanced based on their pre-study treatment (i.e., patients who are uncontrolled on an inhaled short acting bronchodilator (SABA and/or short acting anticholinergic agent)‘as needed’ or controlled on mono-maintenance therapy with either a low dose ICS or a LTRA in addition to 'as needed' use of inhaled short-acting bronchodilator (SABA and/or short acting anticholinergic agent).
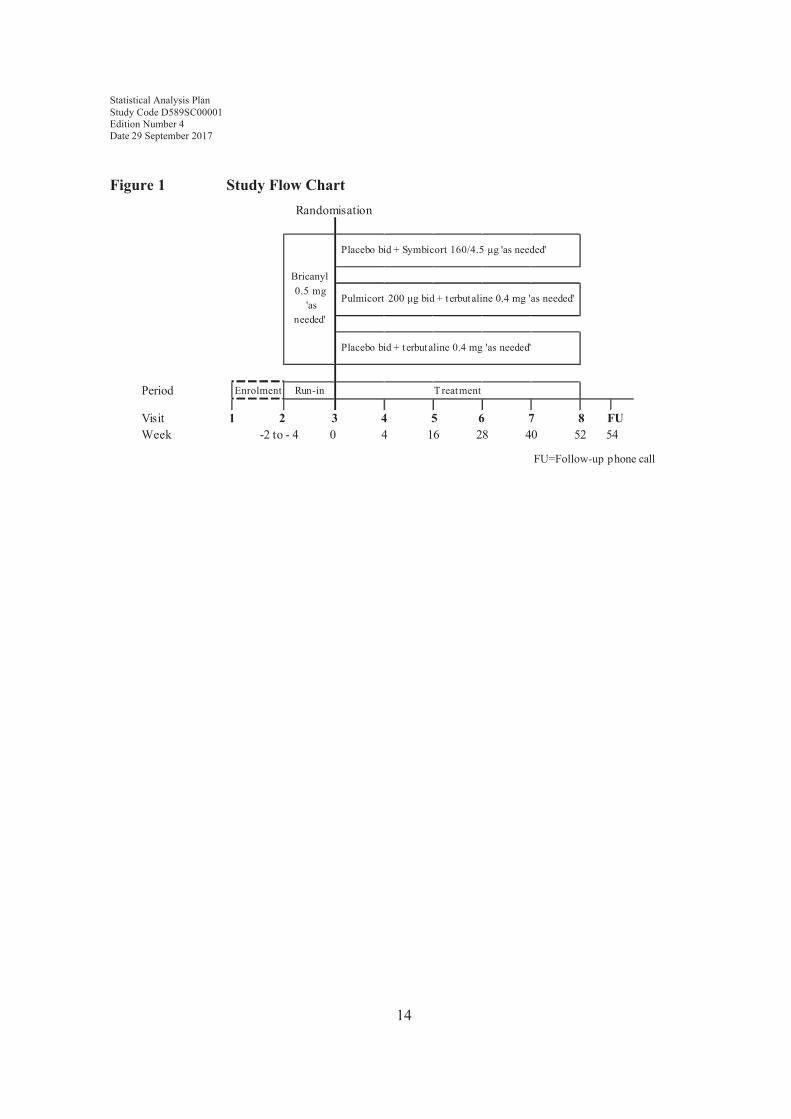
Figure 1 illustrates the flow of patients through the study from enrolment to study end. Patients will begin with a 2-to-4-week run-in period to collect baseline data and to ensure that they are in need of Global Initiative for Asthma (GINA) step 2 treatment. Patients will then be randomised to one of the three treatment groups described above and continue on the study for 52 weeks. Patients will receive a final follow-up telephone call to check for adverse events.
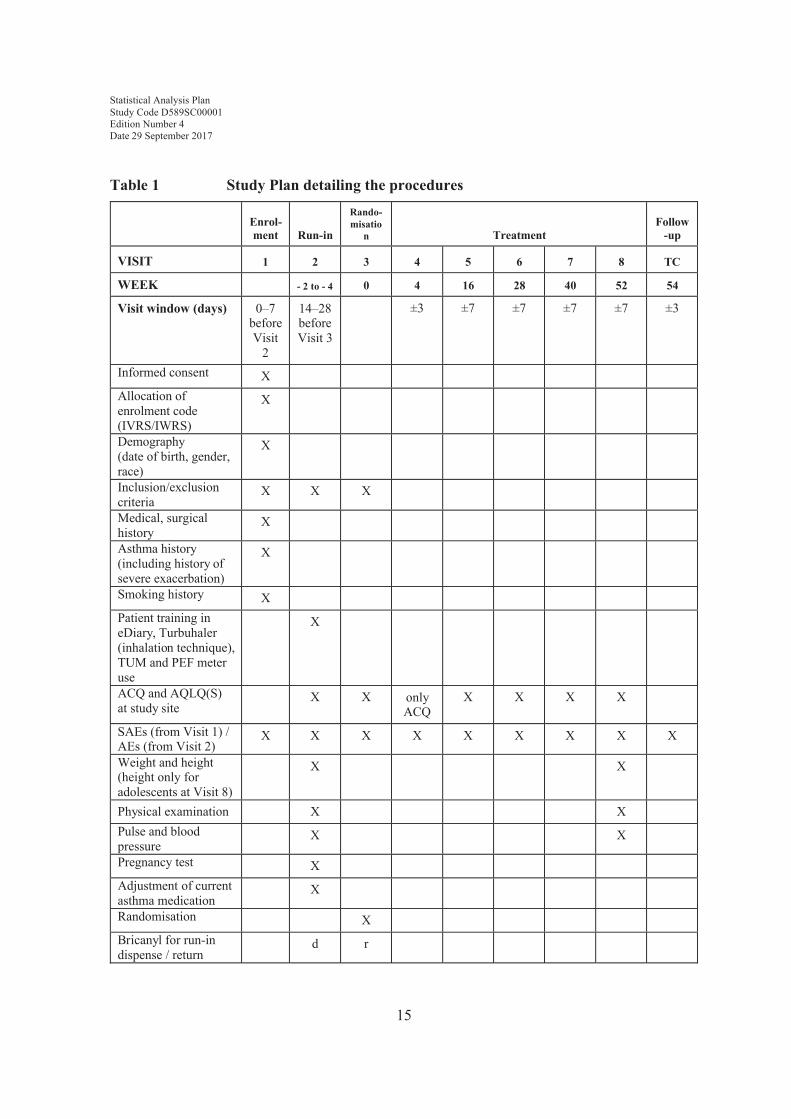
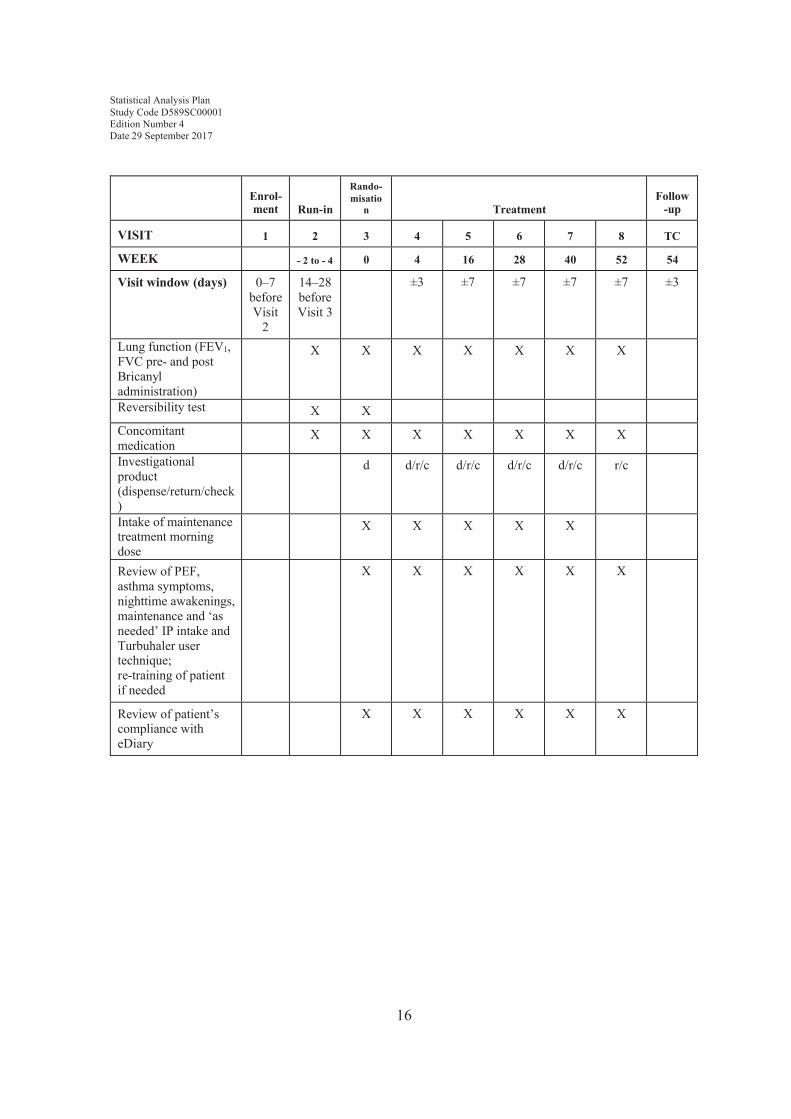
Table 1 describes the assessments to be performed at each of the scheduled study visits.
Statistical Analysis Plan Study Code D589SC00001Edition Number 4Date 29 September 2017
14
Figure 1 Study Flow Chart
Period Enrolment Run-in
VisitWeek
FU=Follow-up phone call
1 2 3 4 5 6 7 8 FU -2 to - 4 0 4 16 28 40 52 54
Randomisation
Bricanyl 0.5 mg
'as needed'
Placebo bid + Symbicort 160/4.5 μg 'as needed'
Pulmicort 200 μg bid + terbutaline 0.4 mg 'as needed'
Placebo bid + terbutaline 0.4 mg 'as needed'
T reatment
Statistical Analysis Plan Study Code D589SC00001Edition Number 4Date 29 September 2017
15
Table 1 Study Plan detailing the procedures
Enrol-ment Run-in
Rando-misatio
n TreatmentFollow
-up
VISIT 1 2 3 4 5 6 7 8 TC
WEEK - 2 to - 4 0 4 16 28 40 52 54
Visit window (days) 0–7 before Visit
2
14–28 before Visit 3
±3 ±7 ±7 ±7 ±7 ±3
Informed consent XAllocation of enrolment code (IVRS/IWRS)
X
Demography (date of birth, gender, race)
X
Inclusion/exclusion criteria
X X X
Medical, surgical history
X
Asthma history (including history of severe exacerbation)
X
Smoking history XPatient training in eDiary, Turbuhaler (inhalation technique), TUM and PEF meter use
X
ACQ and AQLQ(S)at study site
X X only ACQ
X X X X
SAEs (from Visit 1) /AEs (from Visit 2)
X X X X X X X X X
Weight and height(height only for adolescents at Visit 8)
X X
Physical examination X XPulse and blood pressure
X X
Pregnancy test XAdjustment of current asthma medication
X
Randomisation XBricanyl for run-in dispense / return
d r
Statistical Analysis Plan Study Code D589SC00001Edition Number 4Date 29 September 2017
16
Enrol-ment Run-in
Rando-misatio
n TreatmentFollow
-up
VISIT 1 2 3 4 5 6 7 8 TC
WEEK - 2 to - 4 0 4 16 28 40 52 54
Visit window (days) 0–7 before Visit
2
14–28 before Visit 3
±3 ±7 ±7 ±7 ±7 ±3
Lung function (FEV1, FVC pre- and post Bricanyl administration)
X X X X X X X
Reversibility test X XConcomitant medication
X X X X X X X
Investigational product (dispense/return/check)
d d/r/c d/r/c d/r/c d/r/c r/c
Intake of maintenance treatment morning dose
X X X X X
Review of PEF, asthma symptoms, nighttime awakenings, maintenance and ‘as needed’ IP intake and Turbuhaler user technique; re-training of patient if needed
X X X X X X
Review of patient’s compliance with eDiary
X X X X X X
Statistical Analysis Plan Study Code D589SC00001Edition Number 4Date 29 September 2017
17
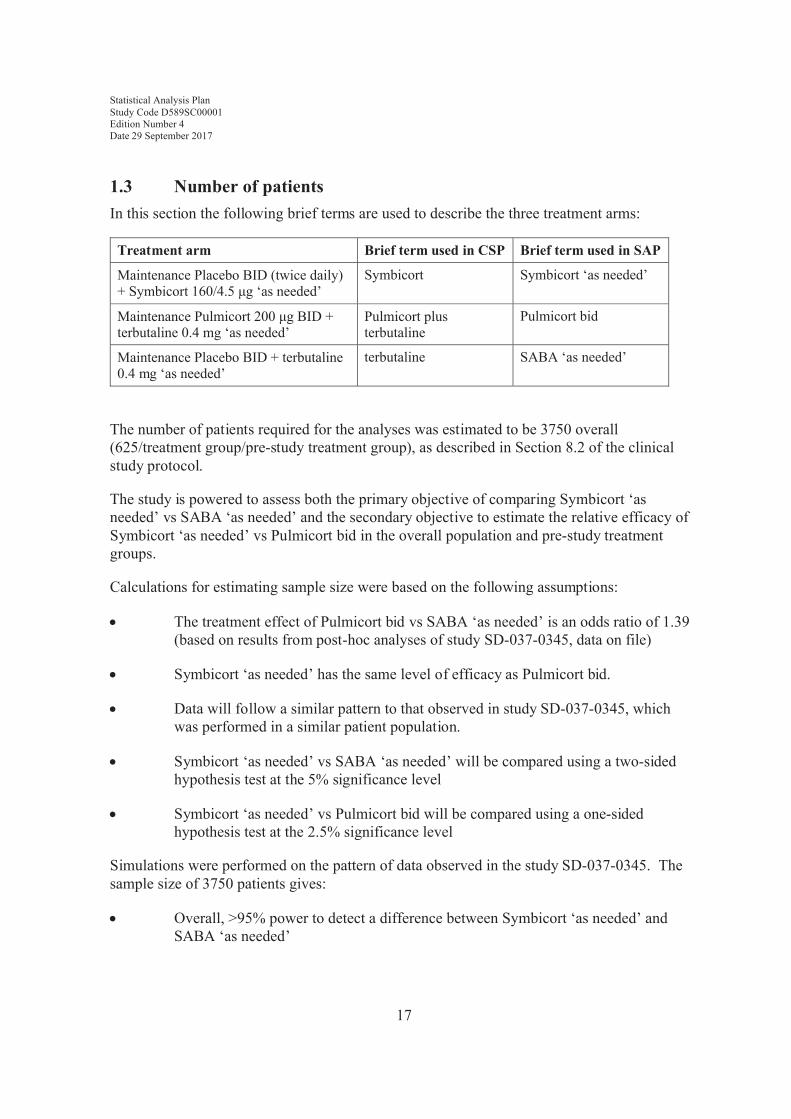
1.3 Number of patientsIn this section the following brief terms are used to describe the three treatment arms:
Treatment arm Brief term used in CSP Brief term used in SAP
Maintenance Placebo BID (twice daily) + Symbicort 160/4.5 μg ‘as needed’
Symbicort Symbicort ‘as needed’
Maintenance Pulmicort 200 μg BID + terbutaline 0.4 mg ‘as needed’
Pulmicort plus terbutaline
Pulmicort bid
Maintenance Placebo BID + terbutaline 0.4 mg ‘as needed’
terbutaline SABA ‘as needed’
The number of patients required for the analyses was estimated to be 3750 overall (625/treatment group/pre-study treatment group), as described in Section 8.2 of the clinical study protocol.
The study is powered to assess both the primary objective of comparing Symbicort ‘as needed’ vs SABA ‘as needed’ and the secondary objective to estimate the relative efficacy of Symbicort ‘as needed’ vs Pulmicort bid in the overall population and pre-study treatment groups.
Calculations for estimating sample size were based on the following assumptions:
! The treatment effect of Pulmicort bid vs SABA ‘as needed’ is an odds ratio of 1.39 (based on results from post-hoc analyses of study SD-037-0345, data on file)
! Symbicort ‘as needed’ has the same level of efficacy as Pulmicort bid.
! Data will follow a similar pattern to that observed in study SD-037-0345, which was performed in a similar patient population.
! Symbicort ‘as needed’ vs SABA ‘as needed’ will be compared using a two-sided hypothesis test at the 5% significance level
! Symbicort ‘as needed’ vs Pulmicort bid will be compared using a one-sided hypothesis test at the 2.5% significance level
Simulations were performed on the pattern of data observed in the study SD-037-0345. The sample size of 3750 patients gives:
! Overall, >95% power to detect a difference between Symbicort ‘as needed’ and SABA ‘as needed’
Statistical Analysis Plan Study Code D589SC00001Edition Number 4Date 29 September 2017
18
! Overall 90% power to achieve non-inferiority (NI) of Symbicort ‘as needed’ vs Pulmicort bid with a pre-defined non-inferiority limit of 0.8 - i.e., the lower 95% confidence interval of the odds ratio for Symbicort ‘as needed’ compared to Pulmicort bid is ≥0.8.
Since it is also important to estimate the treatment effects within each of the pre-study treatments (see Section 4.1 for description) the sample size assessments were also done assuming that 1875 were recruited in each group and this gives:
! 80% power to detect a difference between Symbicort ‘as needed’ and SABA‘as needed’
! 80% power to achieve non-inferiority of Symbicort ‘as needed’ vs Pulmicort bidwith a pre-defined NI limit of 0.78 - i.e., the lower 95% confidence interval of the odds ratio for Symbicort compared to Pulmicort bid is ≥0.78.
2. ANALYSIS SETS
2.1 Definition of analysis sets2.1.1 All patients analysis set
This analysis set comprises all patients screened for the study and will be used for reporting of patient disposition and enrolment failures.
2.1.2 Full analysis setAll patients randomised and receiving any investigational product will be included in the full analysis set, irrespective of their protocol adherence and continued participation in the study. Patients will be analysed according to their randomised treatment.
The efficacy analysis set will be based on the ‘full analysis set’ in line with the ICH E9 guideline.
For any patient randomised more than once into the study, only data relating to the initial randomised period will be included in the full analysis set for summary tables. Data relating to subsequent randomised periods will be described in the clinical study report (CSR).
2.1.3 Safety analysis setAll patients receiving any investigational product will be included in the safety analysis population. Patients will be classified according to the treatment they actually received. If a patient has a wrong kit id, then the treatment they actually received will be determined based on which treatment was used the most.

Statistical Analysis Plan Study Code D589SC00001Edition Number 4Date 29 September 2017
19
All patients should be allocated to the safety analysis set prior to DBL, however the classification of treatment received, will not be determined until after unblinding, and will be documented. All safety summaries will be based on this analysis set.
For any patient randomised more than once into the study, only data relating to the initial randomised period will be included in the safety analysis set for summary tables. Data relating to subsequent randomised periods will be described in the CSR.
2.2 Violations and deviationsImportant protocol deviations will be listed and summarised by randomised treatment groupand discussed in the CSR. None of the deviations will lead to any patients being excluded from any of the analysis sets described in Section 2.1. A per-protocol analysis excluding patients with significant protocol deviation is not planned.
The following violations of inclusion criteria will be considered important protocol deviations when the study physician or principal investigator make a decision to discontinue the patient from the study due to one or more of these criteria. They will be identified using the CRIT and TERM case report form (CRF) modules.
! Diagnosis of asthma according to GINA criteria based on symptoms with adocumented history of at least 6 months prior to Visit 1.
! Patients who are in need of GINA (2012) step 2 treatment:
∀ uncontrolled on inhaled short-acting bronchodilator(s) ‘as needed’ (SABA and/or short acting anticholinergic agent) as judged by the investigator for the last 30 days before Visit 2, or
∀ controlled on mono-maintenance therapy - with low stable dose ICS (≤ 400 μg budesonide per day or corresponding dose of other ICS) (see Appendix E for conversion) or LTRA - in addition to 'as needed' use of inhaled short-acting bronchodilator(s) (SABA and/or short acting anticholinergic agent), as judged by the investigator for the last 30 days prior to Visit 2
! Based on lung function tests at Visit 2, patients pre-treated with
∀ an inhaled short acting bronchodilator only should have pre-bronchodilatorFEV1 ≥ 60 % of predicted normal (PN) and post-bronchodilator FEV1 ≥ 80 %PN according to the European Respiratory Society (ERS) guidelines (Quanjeret al 2012)
∀ low dose ICS or LTRA medication in addition to inhaled short-actingbronchodilator(s) should have pre-bronchodilator FEV1 ≥80 % PN according to the ERS guidelines
Statistical Analysis Plan Study Code D589SC00001Edition Number 4Date 29 September 2017
20
! Reversible airway obstruction according to a reversibility test performed at Visit 2 defined as an increase in FEV1 ≥12% and ≥200 ml relative to baseline, after inhalation of 1 mg Bricanyl Turbuhaler.
The following violations of exclusion criteria will be considered important protocol deviations. They will be identified using the CRIT eCRF module only.
! Medical history of life- threatening asthma including intubation and intensive care unit admission
! Any significant disease or disorder which, in the opinion of the investigator, may either put the patient at risk because of participation in the study, or may influence the results of the study, or the patient’s ability to participate in the study
See the CSP Sections 3.1 and 3.2 for full definitions of the inclusion and exclusion criteria.
In addition to the programmatic determination of the deviations above, monitoring notes or summaries will be reviewed to determine any important post entry protocol deviations that are not identifiable via programming, and to check that those identified via programming are correctly classified. The final classification will be made prior to database lock. There are two types of non-programmable important protocol deviation:
! Cases with severe noncompliance with study protocol potentially affecting primary endpoint as identified by study team physician during medical monitoring. Any case of a patient randomised twice in error will be considered as severe non-compliance.
! Wrong allocation of Kit I.D – Patient received investigational product (IP) from different treatment arm than assigned via interactive voice response system (IVRS)
Due to treatment blinding, it will not be possible to identify if the wrong kit is different from the randomised treatment until after DBL.
All randomised patients who failed any inclusion/exclusion criteria will be listed along with details of the failed criteria. This information will also be summarised in terms of the number (%) of patient failing any of the inclusion/exclusion criteria and will be based on the FAS.
3. PRIMARY AND SECONDARY VARIABLES
3.1 General considerations for outcome variables3.1.1 Definition of baselineUnless otherwise specified, the following general principles apply for determining the baseline for daily diary variables and for variables collected during scheduled visits.

Statistical Analysis Plan Study Code D589SC00001Edition Number 4Date 29 September 2017
21
Daily diary variables
The baseline value for morning PEF, evening PEF, asthma symptom score (day, night and total), % nighttime awakenings and % asthma control days, will be defined as the mean (or percentage) of the non-missing measurements taken during the last 10 days of the run-in period. Only evaluable days (defined as those with diary data recorded) will contribute to the denominator for baseline. The defined period for these parameters will not include any eDiary data collected on the morning of Day 1.
% Symptom free daysThe % of symptom free days will be calculated over the 10 days prior to randomisation. Days where eDiary are completed only in the morning or evening and there are no symptoms in the available period, or days in this period with no data recorded will not be included in the denominator.
‘As needed’medication
‘As needed’ medication at baseline is Bricanyl Turbuhaler 0.5 mg. Its baseline value isdefined as average number of uses per day in the 10 days prior to randomisation during therun-in period. Each day for baseline will begin at 07:00 and end at 06:59:59 on the following day. It includes the last measurement taken on the morning of randomisation (prior to the first dose of maintenance medication, or 06:59:59, whichever is earlier).
% ‘As needed’-free days
‘As needed’-free days at baseline is defined as number of days with no ‘as needed’ medication use (a day and a night) in the 10 days prior to randomisation during the run-in period. Percent ‘as needed’-free days at baseline will then be calculated as the number of ‘as- needed’-freedays at baseline divided by 10 multiplied by 100. Each day is calculated in the same way as the day calculation for ‘as needed’ medication in the previous section.
Other efficacy data collected at scheduled visits
The baseline value for variables collected during scheduled visits will be defined as the last measured value prior to first dose of IP on Visit 3 only. I.e., no data from earlier visits will be used if Visit 3 data are missing.
Baseline will be calculated using this method for the following variables:
! lung function variables:

Statistical Analysis Plan Study Code D589SC00001Edition Number 4Date 29 September 2017
22
∀ FEV1 (L), pre- and post-bronchodilator
∀ FEV1 % of predicted normal, pre- and post-bronchodilator
∀ FVC (L), pre- and post-bronchodilator
Note: baseline post-bronchodilator values are calculated post-bricanyl, but before first dose of randomised treatment.
Efficacy data with no visit information
Baseline for variables that did not include visit information will be defined as the last measured value prior to first dose of IP. Baseline will be calculated using this method for the following variables:
! Patient-reported outcomes:
∀ ACQ-5 score
∀ AQLQ(S) score
Safety data (vital signs and physical examination) and height
The baseline for vital signs (pulse rate and blood pressure), physical examination measurements and height is defined as the value recorded at Visit 2. If the Visit 2 record is missing, then baseline will be left as missing.
3.1.2 Definition of end of treatment
The end of treatment assessment is defined as the last available non-missing assessment, defined as Visit 4, 5, 6, 7 or 8, regardless of time on study.
3.1.3 Timing of weeks for the purpose of assessing weekly asthma control status
3.1.3.1 Allocation of study days to weeksThe timing of the starts and ends of weeks will be based on the first day that the investigational product (IP) was taken by the patient. The first day of ‘Week 1’ will be the first day the patient has taken IP. For the purpose of this SAP, this day shall be referred to as ‘Day 1’ and denote the start of ‘Week 11’.
1 This represents a minor difference from the study protocol, where the start of the randomised treatment period is referred to as ‘Week 0’.
Statistical Analysis Plan Study Code D589SC00001Edition Number 4Date 29 September 2017
23
3.1.3.2 Weeks that are cut short If a week is cut short by early termination (e.g. by withdrawal of patient consent) or by Visit 8 taking place earlier than the start of Week 52, and there are fewer than 5 evaluable days in the week then the week will be regarded as missing for the purposes of the analysis of weekly asthma control. This rule applies unless asthma control status can be unequivocally determined for the whole week using only the data from the days up till the date at which the patient ceased to be in the study (for example, if the patient has already had a nighttimeawakening earlier in the week due to asthma, that week will be regarded as not well-controlled). Please see Section 3.2 for the definition of a well-controlled asthma week.
3.1.3.3 Consecutive days spanning multiple weeks
The protocol describes several criteria for evaluating composite endpoints including a condition being met for two consecutive days in the week. Only days within the week in question will be considered for this condition. In circumstances where the condition occurs for two consecutive days, but these days fall in different weeks, the condition will not be considered to have been met in either week.
3.1.4 Valid maintenance and ‘as-needed’ medication turns
The use of maintenance and ‘as needed’ medication will be captured via the Turbuhaler Usage Monitor (TUM). This device is fitted to the Turbuhaler and records the timing of each turn of the inhaler.
A two-stage approach will be applied to exclude turns from the TUM which are considered impossible.
(i) Turns taking place within ≤1 second of the previous turn
(ii) The number of turns per day per inhaler will be limited to the number of available doses in each inhaler (120 ‘as-needed’, 200 maintenance).
Additional sensitivity analysis may be presented if appropriate, such as using a capping rule of 12 and 30 doses/day to maintenance and as needed medication, respectively.
3.1.5 Timing of maintenance and ‘as needed’ medication and allocation to day/night period
The timing of medication for the purposes of defining a well-controlled asthma week is described in Section 3.4.1.3. This section refers to the timing of medication for the purposes of evaluating exposure, compliance and secondary efficacy variables.
Statistical Analysis Plan Study Code D589SC00001Edition Number 4Date 29 September 2017
24
‘As needed’ use (as recorded by the TUM) will be allocated to daytime and nighttime periods in the following way:
! Start of the daytime period is defined as the time when the patient takes their morning maintenance dose (between 04:00:00-11:59:59). If the patient takes their morning maintenance dose before or after this time interval, or if there is no recorded morning maintenance dose the start of the daytime period will be set to the average of the recorded morning maintenance doses (between 04:00:00-11:59:59) across the trial for that patient. The end of the daytime period will be set one second prior to the start of the nighttime period.
! Start of the nighttime period is defined as the time when the patient takes their evening maintenance dose (between 18:00:00-23:59:59). If the patient takes their evening maintenance dose before or after this time interval, or if there is no recorded evening maintenance dose the start of the nighttime period will be set to the average of the recorded evening maintenance doses (between 18:00:00 -23:59:59) across the trial for that patient. The end of the nighttime period will be set one second prior to the start of the daytime period.
For analyses where full days are assessed they are defined as a day followed by a night, with the start of each day defined by the start of the daytime period described above.
On the treatment start day, only those ‘as needed’ medications taken after the first maintenance medication (any time after 00:00:00) will be considered to be in the randomised treatment period. Any ‘as needed’ medication taken prior to the first maintenance will be considered ‘run-in’ medication. If there is no maintenance medication on the treatment start day, then 12pm will be considered the end of run-in and start of the randomised treatment period. However, only those run-in ‘as needed’ medications recorded up to 06:59:59 will be included in baseline calculations.
On the treatment end day, only medications up to 18:59:59 will be included in the randomised treatment period
For the purpose of calculating steroid load, maintenance medication will be assigned to each study day using the same windows as defined for the ‘as needed’ medication above.
For the purpose of study treatment compliance, and exposure, maintenance medication will be assigned to each study day if it occurs anytime from 4am on that study day until 3:59:59am on the following day (or 18:59:59 for the treatment end day). On treatment start day the start of the window will 00:00:00 instead of 04:00:00.
A low proportion of data collected via the TUM were found to have a timestamp outside of the run-in period or the randomised treatment period. These records are excluded from all analysis.
Statistical Analysis Plan Study Code D589SC00001Edition Number 4Date 29 September 2017
25
3.1.6 Visit windowing Details of the method for programming visit windowing is shown in Error! Reference source not found..
3.1.7 Definition of completing treatment and completing study.
A patient will be considered as completing treatment and completing the study if they have not discontinued the study prematurely according to the TERM (Termination) module.
3.2 Primary variableThe primary efficacy variable for this analysis will be well-controlled asthma weeks, a composite end-point derived from daily patient eDiary data, the asthma exacerbation(EXACASI) and medication (MED) modules on the CRF, and data from the TUM.
The definition and method for deriving the primary variable is given in Section 3.4.1.3 below.
3.3 Demography and patient characteristics3.3.1 Demography, weight, height and lung functionThe following demographic data will be collected at enrolment (Visit 1):
! Date of birth
! Gender
! Race/ethnicity/ethnic population
Race and ethnicity information will be collected as per AstraZeneca standards using the standard race and ethnicity categories stipulated in FDA guidance. However, for the purposes of calculating multi-ethnic predicted normal values of FEV1 (Quanjer et al 2012), a different categorisation of ethnicity is required. This variable is collected as “ethnic population” in the SC (subject characteristics) module of the eCRF. See Section 3.4.7 for further details on the calculation of predicted normal FEV1.
Weight in kilogram and height in cm will be measured at Visit 2. For adolescents (i.e.,patients aged less than 18 years at the date of informed consent), height will additionally be measured at Visit 8. Body mass index [weight in kg / (height in m2)] will be categorised as (<25, ≥25 and <30 and ≥ 30).
Age at date of informed consent (in terms of whole years lived) will be derived using date of birth and date of consent. It will be categorised (≥12 and <18, ≥18 and <50, ≥50 and <65, ≥65 and <85 and ≥ 85 years of age).
Region will be defined as follows:
Statistical Analysis Plan Study Code D589SC00001Edition Number 4Date 29 September 2017
26
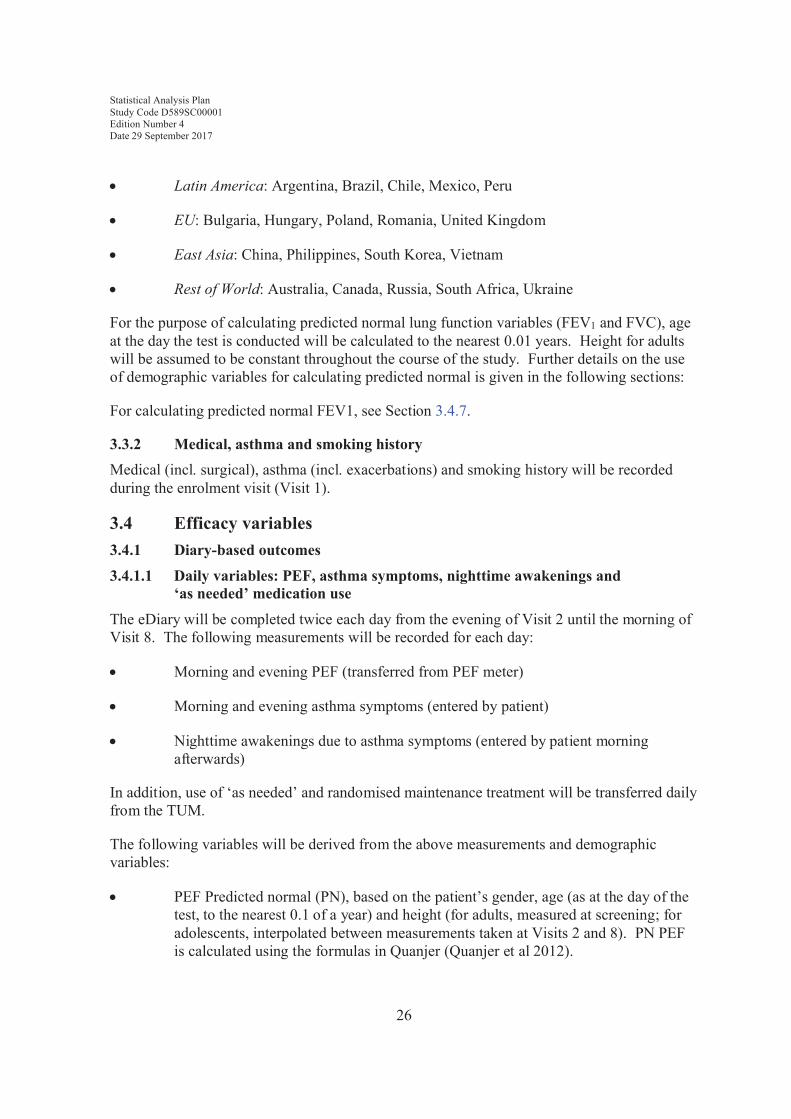
! Latin America: Argentina, Brazil, Chile, Mexico, Peru
! EU: Bulgaria, Hungary, Poland, Romania, United Kingdom
! East Asia: China, Philippines, South Korea, Vietnam
! Rest of World: Australia, Canada, Russia, South Africa, Ukraine
For the purpose of calculating predicted normal lung function variables (FEV1 and FVC), age at the day the test is conducted will be calculated to the nearest 0.01 years. Height for adults will be assumed to be constant throughout the course of the study. Further details on the use of demographic variables for calculating predicted normal is given in the following sections:
For calculating predicted normal FEV1, see Section 3.4.7.
3.3.2 Medical, asthma and smoking historyMedical (incl. surgical), asthma (incl. exacerbations) and smoking history will be recorded during the enrolment visit (Visit 1).
3.4 Efficacy variables3.4.1 Diary-based outcomes
3.4.1.1 Daily variables: PEF, asthma symptoms, nighttime awakenings and ‘as needed’ medication use
The eDiary will be completed twice each day from the evening of Visit 2 until the morning of Visit 8. The following measurements will be recorded for each day:
! Morning and evening PEF (transferred from PEF meter)
! Morning and evening asthma symptoms (entered by patient)
! Nighttime awakenings due to asthma symptoms (entered by patient morning afterwards)
In addition, use of ‘as needed’ and randomised maintenance treatment will be transferred daily from the TUM.
The following variables will be derived from the above measurements and demographic variables:
! PEF Predicted normal (PN), based on the patient’s gender, age (as at the day of the test, to the nearest 0.1 of a year) and height (for adults, measured at screening; for adolescents, interpolated between measurements taken at Visits 2 and 8). PN PEF is calculated using the formulas in Quanjer (Quanjer et al 2012).

Statistical Analysis Plan Study Code D589SC00001Edition Number 4Date 29 September 2017
27
! Total asthma symptom score (sum of daytime and nighttime scores)
! Percentage of nighttime awakenings (over the whole randomised treatment period, excluding any days with no morning eDiary recorded).
The following change-from-baseline variables will be calculated:
! Mean change from baseline over the whole treatment randomised period in morning and evening PEF, morning, night and total daily asthma symptom score and number of ‘as needed’ medication uses per day (morning, night and total means over whole randomised treatment period)
If multiple eDiary records occur within 1 morning or evening (PEF/asthma symptoms/nighttime awakenings only), only the recording with the earliest completion timeshould be used in analysis. If no time is available and multiple eDiary records share the same date for a particular patient, then the diary record with the worst total score will be used.
For the derivation of total daily asthma symptom score, if either day or night are missing, then the daily symptom score is set to missing.
For total and night mean number of ‘as needed’ medication uses, the final day of treatment will not be included as part of the randomised treatment period. This is due to the patients returning their TUM prior to the final evening. Similarly, PEF and symptom data collected via the diary on the morning of Day 1 and the evening of the final day of treatment will not be included as part of the randomised treatment period. The total asthma symptom score will therefore not be calculated for either of these study days.
3.4.1.2 Daily composite end-pointsNB: When a definition refers to “a day and night”, this should be taken to mean a night and the subsequent day, i.e., the period from one evening maintenance treatment to the evening maintenance treatment on the next day.
Where a value for an individual criterion is missing, the composite end-point is defined as missing, unless it can be unequivocally determined as non-missing through the other, non-missing criteria.
Symptom-free days
A symptom-free day is defined as the fulfilment of both of the following criteria:
! A day and night with no asthma symptoms (i.e.: asthma symptom score=0)
! A night with no awakenings due to asthma symptoms

Statistical Analysis Plan Study Code D589SC00001Edition Number 4Date 29 September 2017
28
Asthma-control days
An asthma control day is defined as the fulfilment of all of the following criteria:
! A day and night with no asthma symptoms (i.e., asthma symptom score=0)
! A night with no awakenings due to asthma symptoms
! A day and night with no use of ‘as needed’ medication
Percentage of symptom-free days and asthma-control days will be calculated over the wholerandomised treatment period (excluding any days without any eDiary data recorded).
Percentage of ‘As needed’-free days
An ‘as needed’-free day is defined as a day and night with no use of ‘as needed’ medication.
Percentage of ICS controller use days
An ICS controller use day is defined as a study day (day or night) with use of a controller medication containing ICS (including Pulmicort, Symbicort and any other additional prescribed inhaled corticosteroid). Controller use will be defined as the ‘as needed’ use for the Symbicort treatment arm, the maintenance use for the Pulmicort plus terbutaline treatment arm, and any additional prescribed inhaled corticosteroid which is applicable for all treatment arms.
3.4.1.3 Weekly composite end-pointsWell-controlled asthma week (primary outcome variable)
The well-controlled asthma week variable has three possible values: well-controlled, not well-controlled and missing.
A week will be considered as a well-controlled asthma week if both conditions below are fulfilled:
! A) Two or more of the following criteria are fulfilled:
∀ No more than 2 days with a daily asthma symptom score >1
∀ No more than 2 days of ‘as needed’ medication use, up to a maximum of 4 occasions per week (multiple occasions per day should be regarded as separate occasions)
∀ Morning PEF ≥80% of PN every day
! B) Both of the following criteria are fulfilled:
Statistical Analysis Plan Study Code D589SC00001Edition Number 4Date 29 September 2017
29
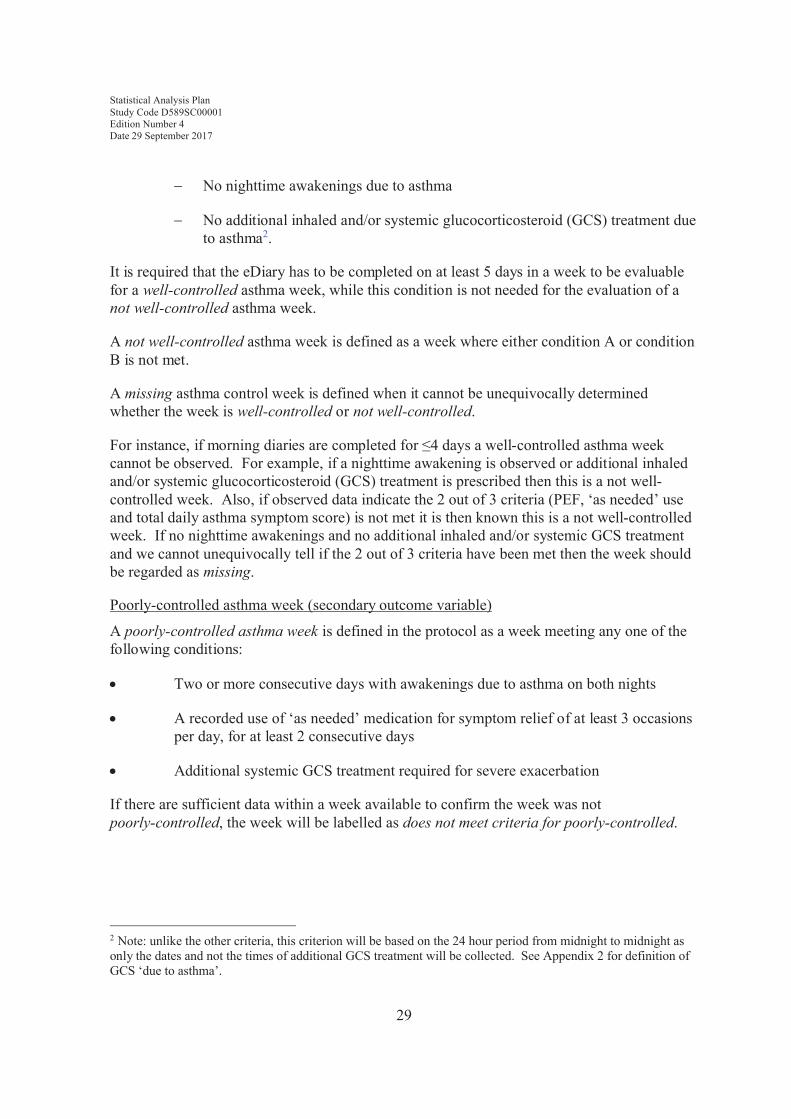
∀ No nighttime awakenings due to asthma
∀ No additional inhaled and/or systemic glucocorticosteroid (GCS) treatment due to asthma2.
It is required that the eDiary has to be completed on at least 5 days in a week to be evaluablefor a well-controlled asthma week, while this condition is not needed for the evaluation of anot well-controlled asthma week.
A not well-controlled asthma week is defined as a week where either condition A or condition B is not met.
A missing asthma control week is defined when it cannot be unequivocally determined whether the week is well-controlled or not well-controlled.
For instance, if morning diaries are completed for ≤4 days a well-controlled asthma week cannot be observed. For example, if a nighttime awakening is observed or additional inhaled and/or systemic glucocorticosteroid (GCS) treatment is prescribed then this is a not well-controlled week. Also, if observed data indicate the 2 out of 3 criteria (PEF, ‘as needed’ use and total daily asthma symptom score) is not met it is then known this is a not well-controlledweek. If no nighttime awakenings and no additional inhaled and/or systemic GCS treatment and we cannot unequivocally tell if the 2 out of 3 criteria have been met then the week should be regarded as missing.
Poorly-controlled asthma week (secondary outcome variable)
A poorly-controlled asthma week is defined in the protocol as a week meeting any one of the following conditions:
! Two or more consecutive days with awakenings due to asthma on both nights
! A recorded use of ‘as needed’ medication for symptom relief of at least 3 occasions per day, for at least 2 consecutive days
! Additional systemic GCS treatment required for severe exacerbation
If there are sufficient data within a week available to confirm the week was not poorly-controlled, the week will be labelled as does not meet criteria for poorly-controlled.
2 Note: unlike the other criteria, this criterion will be based on the 24 hour period from midnight to midnight as only the dates and not the times of additional GCS treatment will be collected. See Appendix 2 for definition of GCS ‘due to asthma’.
Statistical Analysis Plan Study Code D589SC00001Edition Number 4Date 29 September 2017
30
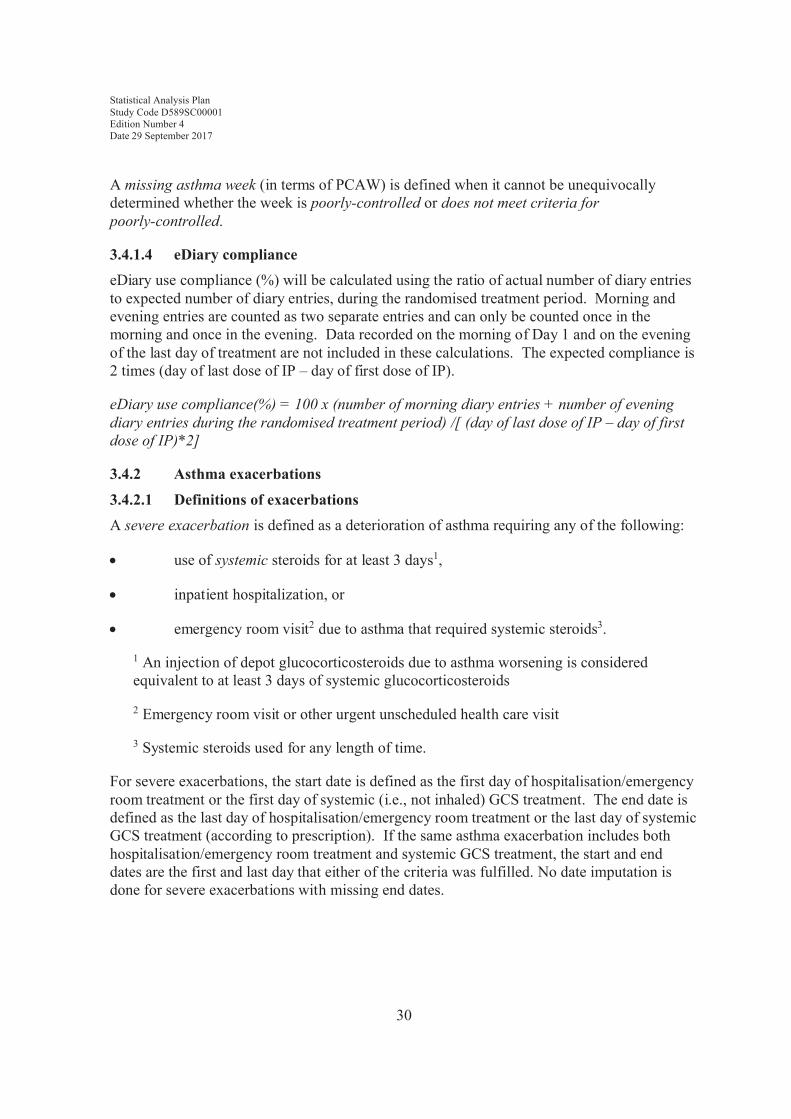
A missing asthma week (in terms of PCAW) is defined when it cannot be unequivocally determined whether the week is poorly-controlled or does not meet criteria for poorly-controlled.
3.4.1.4 eDiary complianceeDiary use compliance (%) will be calculated using the ratio of actual number of diary entries to expected number of diary entries, during the randomised treatment period. Morning and evening entries are counted as two separate entries and can only be counted once in the morning and once in the evening. Data recorded on the morning of Day 1 and on the evening of the last day of treatment are not included in these calculations. The expected compliance is 2 times (day of last dose of IP – day of first dose of IP).
eDiary use compliance(%) = 100 x (number of morning diary entries + number of evening diary entries during the randomised treatment period) /[ (day of last dose of IP – day of first dose of IP)*2]
3.4.2 Asthma exacerbations
3.4.2.1 Definitions of exacerbationsA severe exacerbation is defined as a deterioration of asthma requiring any of the following:
! use of systemic steroids for at least 3 days1,
! inpatient hospitalization, or
! emergency room visit2 due to asthma that required systemic steroids3.
1 An injection of depot glucocorticosteroids due to asthma worsening is considered equivalent to at least 3 days of systemic glucocorticosteroids
2 Emergency room visit or other urgent unscheduled health care visit
3 Systemic steroids used for any length of time.
For severe exacerbations, the start date is defined as the first day of hospitalisation/emergency room treatment or the first day of systemic (i.e., not inhaled) GCS treatment. The end date is defined as the last day of hospitalisation/emergency room treatment or the last day of systemic GCS treatment (according to prescription). If the same asthma exacerbation includes both hospitalisation/emergency room treatment and systemic GCS treatment, the start and end dates are the first and last day that either of the criteria was fulfilled. No date imputation is done for severe exacerbations with missing end dates.
Statistical Analysis Plan Study Code D589SC00001Edition Number 4Date 29 September 2017
31
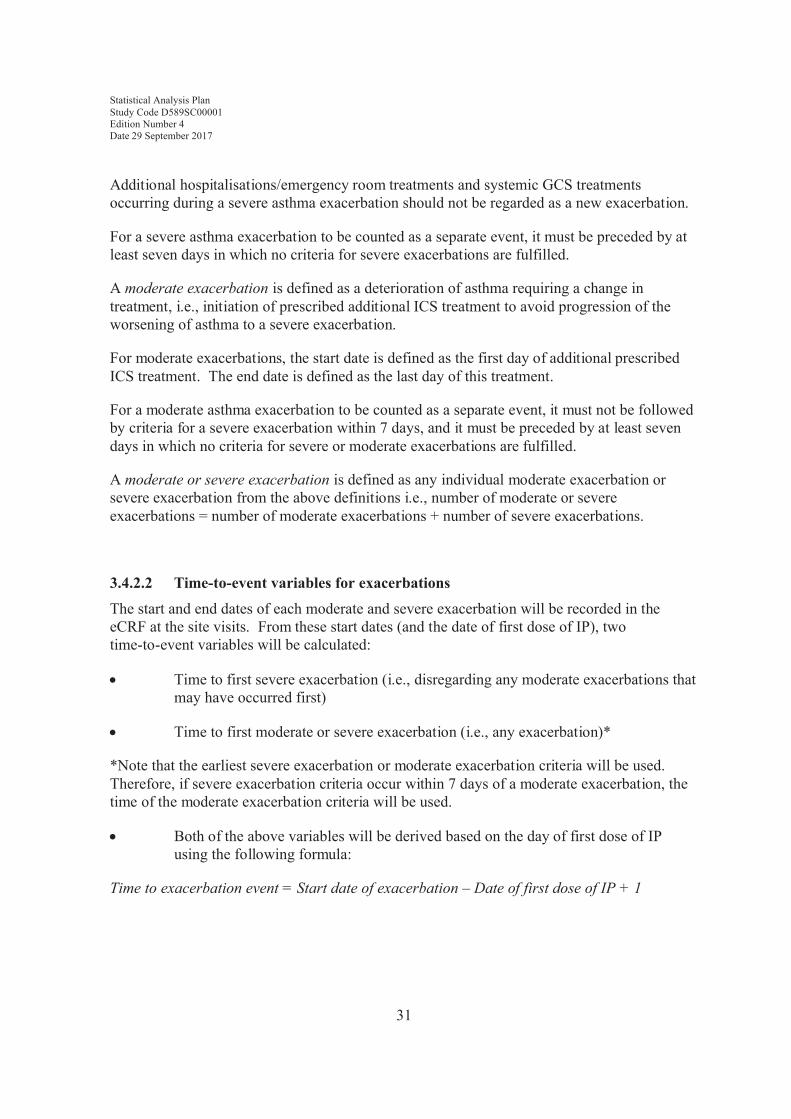
Additional hospitalisations/emergency room treatments and systemic GCS treatments occurring during a severe asthma exacerbation should not be regarded as a new exacerbation.
For a severe asthma exacerbation to be counted as a separate event, it must be preceded by at least seven days in which no criteria for severe exacerbations are fulfilled.
A moderate exacerbation is defined as a deterioration of asthma requiring a change in treatment, i.e., initiation of prescribed additional ICS treatment to avoid progression of the worsening of asthma to a severe exacerbation.
For moderate exacerbations, the start date is defined as the first day of additional prescribed ICS treatment. The end date is defined as the last day of this treatment.
For a moderate asthma exacerbation to be counted as a separate event, it must not be followed by criteria for a severe exacerbation within 7 days, and it must be preceded by at least seven days in which no criteria for severe or moderate exacerbations are fulfilled.
A moderate or severe exacerbation is defined as any individual moderate exacerbation or severe exacerbation from the above definitions i.e., number of moderate or severe exacerbations = number of moderate exacerbations + number of severe exacerbations.
3.4.2.2 Time-to-event variables for exacerbations
The start and end dates of each moderate and severe exacerbation will be recorded in the eCRF at the site visits. From these start dates (and the date of first dose of IP), twotime-to-event variables will be calculated:
! Time to first severe exacerbation (i.e., disregarding any moderate exacerbations that may have occurred first)
! Time to first moderate or severe exacerbation (i.e., any exacerbation)*
*Note that the earliest severe exacerbation or moderate exacerbation criteria will be used. Therefore, if severe exacerbation criteria occur within 7 days of a moderate exacerbation, the time of the moderate exacerbation criteria will be used.
! Both of the above variables will be derived based on the day of first dose of IP using the following formula:
Time to exacerbation event = Start date of exacerbation – Date of first dose of IP + 1
Statistical Analysis Plan Study Code D589SC00001Edition Number 4Date 29 September 2017
32
3.4.2.3 Time-to-censoring for exacerbationsPatients not having any asthma exacerbation will be considered as censored at their latest follow up date. Latest follow-up date is defined as the end date of dosing if available, otherwise date of termination if available, otherwise last visit date.
Maximum follow-up time for a patient is approximately 52 weeks, defined as the time from first dose of IP to the date of Visit 8.
Time to censoring is then calculated as follows:
Time to censoring = Date of latest follow-up date– Date of first dose if IP + 1
This derivation will be applied independently to both the analyses of time to first severe exacerbation and for time to first moderate or severe exacerbation.
3.4.2.4 Number of severe and moderate or severe asthma exacerbations, and annual exacerbation rate
The total number of severe, and moderate or severe asthma exacerbations during the randomised treatment period will be calculated for each patient.
In order to account for varying lengths of follow-up (due to discontinuation, loss to follow-up, or minor differences in the timing of Visit 8), the annual exacerbation rate will be presented for the purposes of summary statistics. This will be calculated as follows:
Study level: annual exacerbation rate = Σ Number of exacerbations*365.25 / Σ (Latest follow-up date – Date of first dose of IP+ 1)
3.4.3 Administration of additional steroids for asthma and long-term poor asthma control.
Data on additional inhaled and systemic steroids prescribed for exacerbations will be collected via the EXACASI eCRF module. Data on additional inhaled corticosteroids prescribed for poor asthma control will be collected via the MED module as per the table in Appendix 2. Data on additional steroid use are used in part to evaluate the weekly composite endpoints (see Section 3.4.1.3)
Additional ICS and systemic GCS prescribed on the day of IP discontinuation for an asthma exacerbation will be considered as during the randomised treatment period. If prescribed for any other reason, they will be considered as during the follow-up period (See Appendix 2).
Time to administration of additional steroids for asthma will be calculated as the time from first dose of IP until the start date of administration of additional steroids for asthma i.e.,:
Statistical Analysis Plan Study Code D589SC00001Edition Number 4Date 29 September 2017
33
Time to first additional steroid administration = Start Date of administration of additional steroids – Date of first dose of IP+ 1
Time to censoring will be defined as for censoring for asthma exacerbations (see Section 3.4.2.3).
The administration of additional steroids for long-term poor asthma control will be calculated, and is a subset of the additional steroids for asthma. Additional steroids for long-term poorasthma control can be identified from the EXACASI and MED CRF modules as per the table in Appendix 2.
3.4.4 Total inhaled steroid loadTotal inhaled steroid load (total ICS dose) during the randomised treatment period will be calculated for each patient as the sum of the cumulative doses of maintenance ICS (budesonide), ‘as needed’ ICS as part of Symbicort (budesonide), and additional prescribed inhaled corticosteroids of any type.
For calculation purposes, the dose for ‘as needed’ ICS part of the Symbicort arm will be the delivered dose, 160μg. The maintenance ICS part of the Pulmicort arm will be converted from the metered dose, 200μg, to 160μg, the delivered dose. For additional ICS, the dose, as recorded by the investigators in the eCRF will be used.
Any dose that was recorded during the randomised treatment period will be included in summaries of overall steroid load. Doses which are not in μg should be converted to μgbefore being summed. For additional prescribed inhaled corticosteroids, 100% compliance will be assumed.
Data on IP usage will be recorded via the TUM, while additional prescribed inhaled corticosteroids will be collected via the appropriate CRF module, and can be identified as per the table in Appendix 2.
To account for differences in the length of follow-up, a time-standardised variable, mean daily ICS dose, will be estimated.
Total ICS: Mean daily ICS dose = Total ICS dose / (Date of last dose of IP – Date of first dose of IP + 1)
The mean daily ICS dose will also be calculated separately for IP [maintenance ICS (budesonide), ‘as needed’ ICS as part of Symbicort (budesonide)] and additionally prescribed ICS. Also, additionally prescribed ICS will be separated by individual ICS medications.
IP: Mean daily ICS dose = Total ICS dose (IP only) / (Date of last dose of IP – Date of first dose of IP + 1)

Statistical Analysis Plan Study Code D589SC00001Edition Number 4Date 29 September 2017
34
Additional ICS: Mean daily ICS dose = Total ICS dose (Additional only) / (Date of last dose of IP – Date of first dose of IP + 1)
In addition, the proportion of days prescribed additional ICS will be calculated as:
Proportion of days prescribed additional ICS = Number of days for which additional ICS were prescribed/ (Date of last dose of randomised study drug – Date of first dose of IP + 1)
If there is no available end date for additional ICS, then it will be assumed that it continues until IP discontinuation.
3.4.5 Number of days with systemic GCS treatment due to asthma
The number of days with systemic GCS due to asthma will be recorded via the eCRF MED module (identified as per the table in Appendix 2) at each visit. The total number of days recorded during randomised treatment will then be calculated for each patient.
3.4.6 Time to study-specific asthma-related discontinuationThe following criteria will lead to discontinuation from the study due to asthma related events:
! A severe asthma exacerbation with duration for more than 3 weeks
! Two severe asthma exacerbations during 3 months
! Three severe asthma exacerbations in total during the study
For patients who experience one of these events (and thus are discontinued from the study), time to discontinuation due to any of the specified asthma related events will be calculated as:
Time to study-specific asthma-related discontinuation = Date of study termination due to any asthma-related event – Date of first dose of IP+ 1
Time to censoring will be defined as for censoring for asthma exacerbations (see Section 3.4.2.3), with the exception that only patients who discontinued the study for any reason other than one of the pre-defined asthma-related events will be censored as of their discontinuation date.
3.4.7 Lung function variablesThe following lung function measurements will be calculated at Visits 2, 3 (baseline), 4, 5, 6, 7 and 8, at two time-points per visit (pre- and post-bronchodilator):
! FEV1 (L)
! FEV1 % of predicted normal
Statistical Analysis Plan Study Code D589SC00001Edition Number 4Date 29 September 2017
35
! FVC (L)
In addition, a treatment average will be calculated within subject as the average of Visits 4 to 8 (one value per visit, further described in Appendix 4: Visit Windowing). Change frombaseline for each of these three variables, for both time-points will also be calculated for Visits 4, 5, 6, 7, 8 and the treatment average. Please refer to Section 3.1.1 for the baselinedefinition.
FEV1 predicted normal will be derived using the patient’s age (to the nearest 0.01 years, at the time of the visit), height (for adults, measured at screening; for adolescents, interpolated between measurements taken at Visits 2 and 8) and ethnic population, following the Global Lung Initiative (GLI) 2012 lung function regression equations (Quanjer et al 2012). Full details of how this method is applied can be found in Appendix 1 on page 60.
Percentage of predicted normal FEV1 is then calculated as follows:
FEV1 (% of PN) = 100 × (FEV1 (actual) / FEV1 (predicted))
3.4.8 Patient reported outcomes
3.4.8.1 Asthma Control Questionnaire – 5-item Version (ACQ-5)The 5-item version of the ACQ questionnaire contains five questions on patients’ symptoms, which are assessed on a 7-point scale from 0 (representing good control) to 6 (representing poor control). The ACQ-5 score is the mean score of all questions for which responses are provided. A minimum of 4 out of 5 questions must be answered for a valid ACQ-5 score.
The ACQ-5 is conducted at Visits 2, 3, 4, 5, 6, 7 and 8, with score evaluated at each visit. Change from baseline for Visits 4, 5, 6, 7 and 8 (individual visits, treatment average across Visits 4 to 8, and end of treatment) will also be calculated (baseline calculated as described in Section 3.1.1).
The following categorical outcome variables will be calculated based on ACQ-5 score at the end of treatment (as defined in Section 3.1.2):
! Asthma control at end of study: ACQ-5 score at end of treatment < 0.75, ≥ 0.75
! Patient improved: ΔBL(ACQ-5 score) at end of treatment ≤ –0.5
! Patient unchanged: ΔBL(ACQ-5 score) at end of treatment ϵ (–0.5, 0.5)
! Patient worsened: ΔBL(ACQ-5 score) at end of treatment ≥ 0.5
where ΔBL(x) means “Change from baseline in x”.
Note: Patient improved/unchanged/worsened responses are based on a minimal important difference (MID) of 0.5.

Statistical Analysis Plan Study Code D589SC00001Edition Number 4Date 29 September 2017
36
If more than one ACQ-5 is completed on any day, the questionnaire with the worst score (highest mean value) will be used in the analysis. This applies to both baseline and post-baseline assessments.
3.4.8.2 Asthma Quality of Life Questionnaire – Standardised Version (AQLQ(S))The AQLQ(S) includes 32 questions relating to 4 distinct domains:
! activity limitation (11 questions; minimum 7 questions required for a valid score)
! symptoms (12 questions; minimum 8)
! emotional function (5 questions; minimum 3)
! exposure to environmental stimuli (4 questions; minimum 3)
Each question is answered on a 7-point scale ranging from 1 to 7 with lower values representing more severe impairment.
For each of the four domains, a domain score is calculated as the mean score of all its constituent items. An overall score across the whole questionnaire is calculated as the mean score of all 32 items. In case of any missing answers, the overall score is calculated as a weighted mean of the domain scores, with the nominal fraction of items in each domain as weights. If one or more domains are missing, the overall score is also missing. (Note: when there are no missing answers, this method is equivalent to the average response of all 32 questions taken individually).
The four domain scores and an overall score will be calculated for Visits 2, 3, 5, 6, 7 and 8(individual visits, and treatment average across Visits 5 to 8). Change from baseline for all four domain scores and the overall score will be calculated for Visits 5, 6, 7 and 8, treatment average and end of treatment (baseline calculated as described in Section 3.1.1).
The following categorical outcome variables will be calculated based on overall AQLQ(S) score at the end of treatment (as defined in Section 3.1.2):
! Patient improved: ΔBL(AQLQ(S) score) at end of treatment ≥ 0.5
! Patient unchanged: ΔBL(AQLQ(S) score) at end of treatment ∈ (–0.5, 0.5)
! Patient worsened: ΔBL(AQLQ(S) score) at end of treatment ≤ –0.5
where ΔBL(x) means “Change from baseline in x”.
Note: Patient improved/unchanged/worsened responses are based on a minimal important difference (MID) of 0.5.
Statistical Analysis Plan Study Code D589SC00001Edition Number 4Date 29 September 2017
37
If more than one AQLQ(S) is completed on any day, the questionnaire with the worst overall score (lowest mean value) will be used for the analysis. This applies to both baseline and post-baseline assessments.
3.5 Safety variables3.5.1 Vital signs
The following vital signs measurements will be conducted at Visits 2 and 8 (or when thepatient withdraws from the study):
! Pulse rate
! Systolic blood pressure
! Diastolic blood pressure
Vital signs measurements will also be conducted in the event of an early withdrawal from the study. Change from baseline for all three parameters will be defined as the difference between measurements at End of treatment (as per Section 3.1.2) and Visit 2 (as per Section 3.1.1 above).
3.5.2 Physical examinationThe following physical examination assessments will be made at Visits 2 and 8 (or when the patient withdraws from study):
! General appearance
! Respiratory
! Cardiovascular
! Abdomen
! Head and neck (including head, ears, eyes, nose and throat)
3.5.3 Pregnancy
Results of the dipstick pregnancy test for female patients aged ≤60 years at Visit 2 will be recorded.
Pregnancies that occur during the remainder of the study will lead to the patient being withdrawn from the study (see Section 3.6.2).
Statistical Analysis Plan Study Code D589SC00001Edition Number 4Date 29 September 2017
38
3.5.4 Adverse events (including Serious Adverse Events)3.5.4.1 Collection of AEs and SAEs
Adverse Events (AEs) will be collected from Visit 2 throughout the randomised treatment period and including the follow-up period until the last telephone follow-up, or the last contact.
Serious Adverse Events (SAEs) will be recorded from the time of informed consent (Visit 1).
The following assessments will be collected for each AE:
! AE (verbatim)
! The date when the AE started and stopped
! Maximum intensity (mild/moderate/severe)
! Whether the AE is serious or not
! Investigator causality rating against the IP (yes or no)
! Action taken with regard to investigational product
! AE caused patient’s withdrawal from study (yes or no)
! Outcome
In addition, the following variables will be collected for SAEs:
! Date AE met criteria for serious AE
! Date Investigator became aware of serious AE
! Reason that AE became serious
! Date of hospitalisation
! Date of discharge
! Probable cause of death
! Date of death
! Autopsy performed
! Causality assessment in relation to Study procedure(s)
Statistical Analysis Plan Study Code D589SC00001Edition Number 4Date 29 September 2017
39
! Causality assessment in relation to Other medication
! Description of AE
3.5.4.2 Definition of adverse event leading to discontinuation of investigational product (DAE)
Adverse events where “Action taken with regard to investigational product” is answered “discontinued” will be defined as DAEs and reported separately (in addition to being reported as general AEs).
3.5.4.3 AEs representing potential β2 agonist effects and AEs representing potential ICS effects
Summary tables of AEs representing potential β2 agonist effects and AEs representing potential ICS effects will be produced. These AEs are defined in Appendix 3.
3.5.4.4 Other significant adverse events (OAEs)During the evaluation of the AE data, an AstraZeneca medically qualified expert will review the list of AEs that were not reported as SAEs and DAEs. Based on the expert’s judgement, significant adverse events of particular clinical importance may, after consultation with the Global Patient Safety Physician, be considered OAEs and reported as such in the Clinical Study Report. A similar review of vital signs data will be performed for identification of OAEs.
OAEs will be reported in a separate table (in addition to being reported as general AEs).
3.5.4.5 Adverse events data handlingAdverse events will be reported as occurring during the run-in period if the start date is on or after the first date of run-in medication, and prior to the first dose of randomised medication.
Adverse events will be considered as occurring during the randomised treatment period if the onset date is on or after the date of first dose of randomised study medication and onset is not later than one day after the last day of randomised treatment.
Adverse events that start during the run-in period but continue and become serious adverse events during the randomised treatment period will be reported in both run-in and also in the randomised treatment period.
Adverse events will be considered as occurring during the follow-up period if the onset date is later than one day after the last day of randomised treatment.
If an AE has a missing onset date, then, unless the stop date of the AE indicates otherwise, this will be considered as occurring during the randomised treatment period. Similarly, if an AE has a partial onset date, then unless the partial onset date or the stop date indicates otherwise, this will be considered as occurring during the randomised treatment period.
Statistical Analysis Plan Study Code D589SC00001Edition Number 4Date 29 September 2017
40
3.6 Other variables3.6.1 Concomitant medications
Concomitant inhaled and systemic asthma treatment as prescribed in response to moderate or severe exacerbations or long-term poor asthma control treatment will be recorded in the EXACASI and MED modules as per Section 3.4.3 above.
Other concomitant, which is considered necessary for the patient’s safety and wellbeing, may be given at the discretion of the Investigator and recorded in the appropriate sections of the eCRF.
Additional ICS and systemic GCS prescribed on the day of IP discontinuation for an asthma exacerbation will be considered as during the randomised treatment period, otherwise they will be considered as during the follow-up period (See Appendix 2). All other concomitant medication prescribed on the day of IP discontinuation will be counted as during the randomised treatment period unless the reason is ‘disease under study’ where it will be considered as follow-up.
3.6.2 Discontinuation/withdrawal from the studyOn leaving the study, either at the scheduled end of treatment and subsequent follow-up, or following early withdrawal from the study, or at such time when the patient is considered to be lost to follow-up, the date and reason for leaving the study will be recorded.
Patients may be discontinued from IP in the following situations:
! Patient decision. The patient is at any time free to discontinue treatment, without prejudice to further treatment
! Adverse Event
! Severe non-compliance with the study protocol
! Safety reason as judged by the investigator and/or AstraZeneca
! Pregnancy
! Development of any of the following study specific criteria for discontinuation:
∀ A severe asthma exacerbation with duration of more than 3 weeks
∀ Two severe asthma exacerbations within a period of 3 months
∀ Three severe asthma exacerbations in total during the study.
Statistical Analysis Plan Study Code D589SC00001Edition Number 4Date 29 September 2017
41
3.6.3 Compliance of study maintenance medication Summary statistics about maintenance medication compliance will be produced. The expected number of maintenance medications is two per day for each day of the randomised treatment period, other than the final day, when only one maintenance medication is expected to be taken.
Compliance for maintenance medication (%) will be calculated for each patient as:
(Total actual maintenance inhalations/Total expected maintenance inhalations)*100.
Total expected maintenance inhalations = number of days in the randomised treatment period*2 – 1.
Other compliance metrics includes the proportion of study days where each patient used no doses, 1-2 doses only, 2 doses only, and more than 2 doses.
For the purpose of graphical representation, the proportion of study days where patients used ≥1 inhalation will also be calculated per week as follows:
! Derive the percentage per day as number of patients who took at least 1 inhalation divided by the number of patients still in the randomised treatment period on the respective study day.
! For each week take a mean of the percentages for the 7 days of the week.
4. ANALYSIS METHODS
4.1 General principlesAll tests will be 2-sided and at 5% level of significance unless otherwise stated. The primary efficacy variable will be controlled for multiplicity, whereas no adjustments will be made for multiplicity for secondary efficacy variables.
Unless otherwise specified, for all statistical analyses, missing at random (MAR) will be assumed.
In addition, the analyses described below, all variables will be summarised descriptively, as appropriate.
For efficacy analysis, the following general principles guide the statistical hypotheses to be tested:
! The three treatment groups in the study (with short names defined for clarity) are as follows:
Statistical Analysis Plan Study Code D589SC00001Edition Number 4Date 29 September 2017
42
∀ Symbicort Turbuhaler 160/4.5μg ‘as needed’ with no maintenance treatment (Symbicort ‘as needed’)
∀ Pulmicort Turbuhaler 200μg twice daily ‘maintenance’ plus terbutaline Turbuhaler 0.4mg ‘as needed’ (Pulmicort bid)
∀ terbutaline Turbuhaler 0.4mg ‘as needed’ with no maintenance treatment (SABA ‘as needed’)
! Patients will be stratified at recruitment on the basis of their prescribed treatment prior to the study. For analysis purposes, pre-treatment is derived from the MEDENT (Asthma medication at entry) module. The two stratification groups are as follows:
∀ Uncontrolled on BD
∀ Controlled on ICS or LTRA
! For the purpose of this SAP, the treatment that a patient has been randomised to for the duration of the study will be referred to simply as ‘randomised treatment’; treatment prescribed to a patient prior to the study will be referred to as ‘pre-study treatment’.
! The purpose of the trial is to compare the Symbicort ‘as needed’ group with the other two treatment groups, which should both be considered ‘control’ groups for two different purposes as described below.
∀ The purpose of comparing Symbicort ‘as needed’ with SABA ‘as needed’ is to determine the superiority of the former over the latter.
∀ Conversely, the purpose of comparing Symbicort ‘as needed’ with Pulmicortplus terbutaline is to determine the non-inferiority of the former as compared to the latter.
For non-inferiority analyses, the non-inferiority limit for the lower bound of the two-sided 95% confidence interval will be 80% (i.e., non-inferiority will be concluded if the lower two-sided 95% confidence interval of the odds ratio for Symbicort ‘as needed’ compared toPulmicort bid plus terbutaline is ≥80%).
These two hypotheses will be tested sequentially for the primary endpoint: if superiority is not concluded for the first comparison, then no formal statistical inference will be made from the non-inferiority comparison, but p-values will still be presented.

Statistical Analysis Plan Study Code D589SC00001Edition Number 4Date 29 September 2017
43
If superiority of Symbicort ‘as needed’ compared with SABA ‘as needed’ is not concluded for the primary endpoint, then no further formal statistical inference will be made for any of the secondary endpoints, but p-values will still be presented.
Unless otherwise stated all efficacy and safety analyses will be conducted using the “randomised treatment period” which begins at date of first dose of investigational product (maintenance or ‘as needed’ study medication). It ends at the end date of dosing if available, otherwise date of termination if available, otherwise last visit date.
Selected analyses on the well-controlled asthma weeks endpoint use the “52 week study period” which begins at date of first dose and ends at 52 weeks. All full weeks post IP discontinuation up to and including 52 weeks will have a missing value for the well-controlled asthma weeks endpoint.
The number of patient years each patient contributes will be calculated as
Number of patient treatment years = (End of randomised treatment period – Start of randomised treatment period + 1)/ 365.25
For all efficacy analysis with visit as a covariate, end of treatment should be excluded from the analysis unless otherwise stated. The scheduled 52 week visit (defined by windowing as Visit 8) should be included.
4.2 Analysis methods4.2.1 Patient dispositionPatient disposition will be summarised using the All Patients analysis set. The number of patients who were enrolled, run-in and not run-in will be summarised. The number and percentage of patients within each treatment group will be presented by the following categories; randomised, not randomised (and reasons), randomised who received study treatment, randomised who did not receive study treatment (and reasons), completed.
A separate table will present the number and percentage of patients randomised to each treatment group, by country. This table will be based on the Full analysis set.
A Kaplan-Meier graph will be generated to show the time to IP discontinuation by randomised treatment group using the Full analysis set. This will be the time from first dose of IP to time of IP discontinuation or completion (whatever occurs first).
4.2.2 Demography data and patient characteristics Age, gender, race, ethnic group and region will be summarised by treatment group and by treatment and pre-treatment group for the full analysis set. Baseline characteristics will be summarised by treatment for the full analysis set. These include previous disease-related treatments, medical and surgical histories, and the eDiary variables. eDiary variables include morning and evening PEF, total asthma symptom score. ‘as needed’ inhalations, nighttime
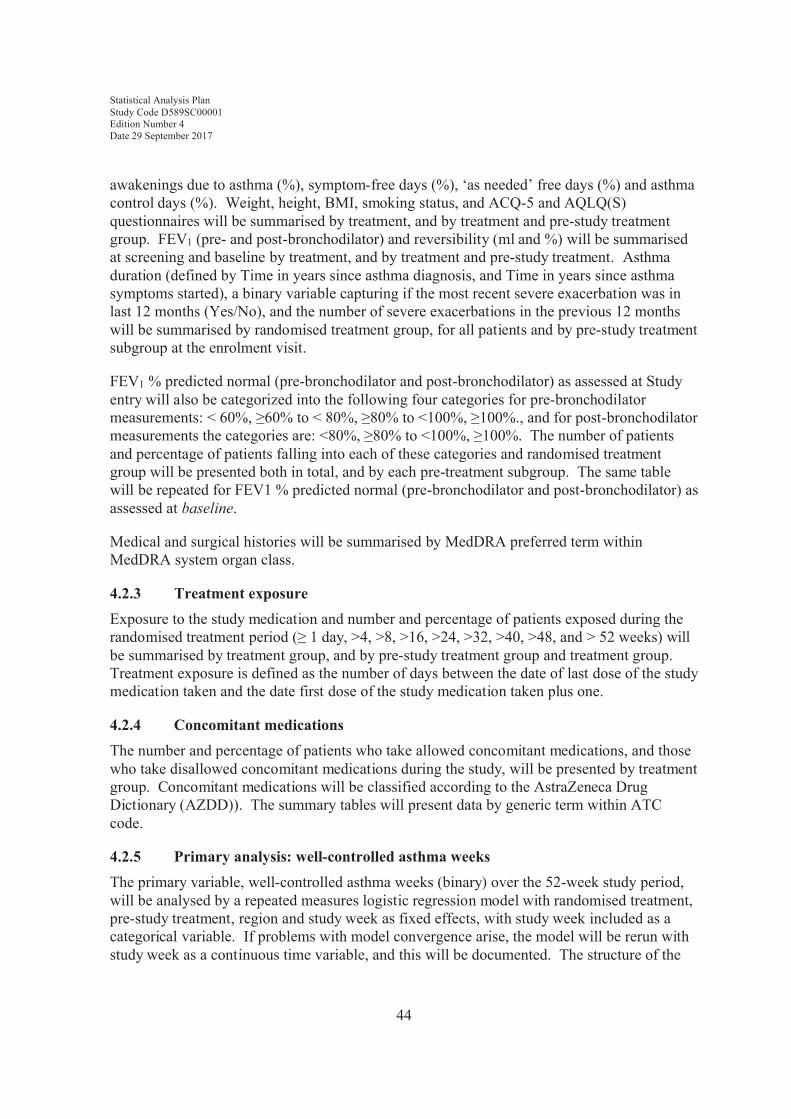
Statistical Analysis Plan Study Code D589SC00001Edition Number 4Date 29 September 2017
44
awakenings due to asthma (%), symptom-free days (%), ‘as needed’ free days (%) and asthma control days (%). Weight, height, BMI, smoking status, and ACQ-5 and AQLQ(S)questionnaires will be summarised by treatment, and by treatment and pre-study treatment group. FEV1 (pre- and post-bronchodilator) and reversibility (ml and %) will be summarised at screening and baseline by treatment, and by treatment and pre-study treatment. Asthma duration (defined by Time in years since asthma diagnosis, and Time in years since asthma symptoms started), a binary variable capturing if the most recent severe exacerbation was in last 12 months (Yes/No), and the number of severe exacerbations in the previous 12 months will be summarised by randomised treatment group, for all patients and by pre-study treatmentsubgroup at the enrolment visit.
FEV1 % predicted normal (pre-bronchodilator and post-bronchodilator) as assessed at Study entry will also be categorized into the following four categories for pre-bronchodilator measurements: < 60%, ≥60% to < 80%, ≥80% to <100%, ≥100%., and for post-bronchodilator measurements the categories are: <80%, ≥80% to <100%, ≥100%. The number of patients and percentage of patients falling into each of these categories and randomised treatment group will be presented both in total, and by each pre-treatment subgroup. The same table will be repeated for FEV1 % predicted normal (pre-bronchodilator and post-bronchodilator) as assessed at baseline.
Medical and surgical histories will be summarised by MedDRA preferred term within MedDRA system organ class.
4.2.3 Treatment exposureExposure to the study medication and number and percentage of patients exposed during the randomised treatment period (≥ 1 day, >4, >8, >16, >24, >32, >40, >48, and > 52 weeks) will be summarised by treatment group, and by pre-study treatment group and treatment group. Treatment exposure is defined as the number of days between the date of last dose of the studymedication taken and the date first dose of the study medication taken plus one.
4.2.4 Concomitant medicationsThe number and percentage of patients who take allowed concomitant medications, and those who take disallowed concomitant medications during the study, will be presented by treatment group. Concomitant medications will be classified according to the AstraZeneca Drug Dictionary (AZDD)). The summary tables will present data by generic term within ATC code.
4.2.5 Primary analysis: well-controlled asthma weeksThe primary variable, well-controlled asthma weeks (binary) over the 52-week study period, will be analysed by a repeated measures logistic regression model with randomised treatment, pre-study treatment, region and study week as fixed effects, with study week included as a categorical variable. If problems with model convergence arise, the model will be rerun with study week as a continuous time variable, and this will be documented. The structure of the
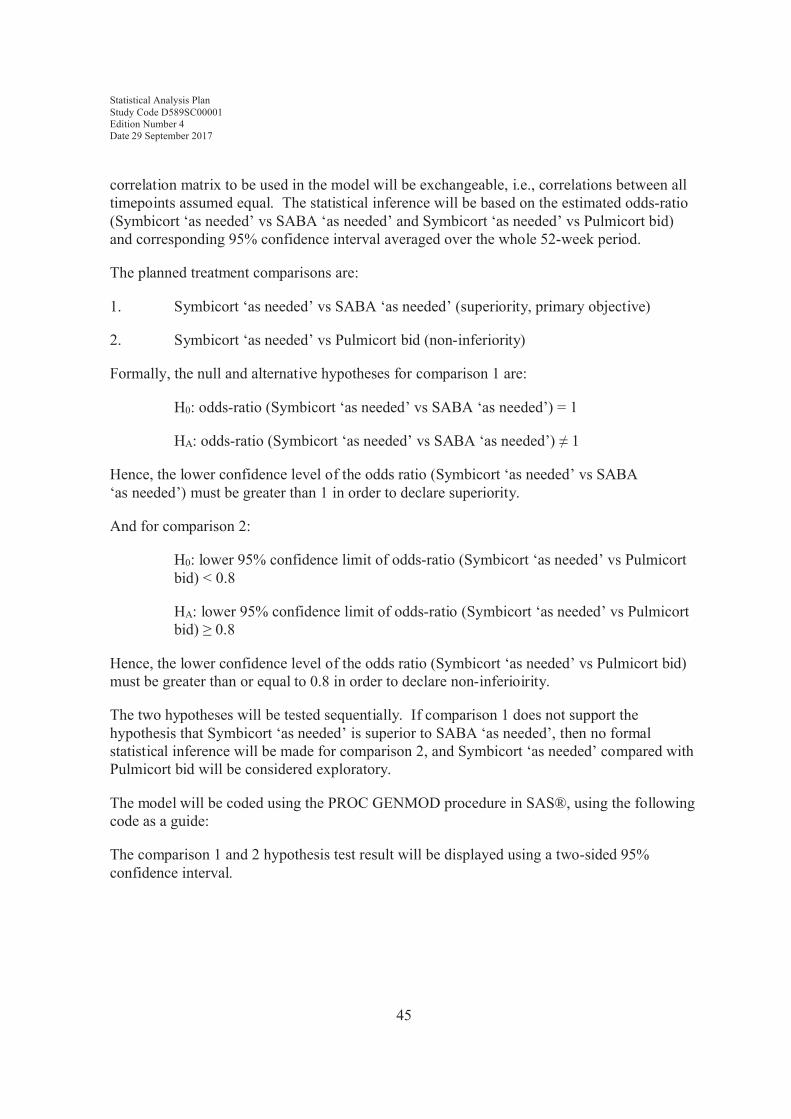
Statistical Analysis Plan Study Code D589SC00001Edition Number 4Date 29 September 2017
45
correlation matrix to be used in the model will be exchangeable, i.e., correlations between all timepoints assumed equal. The statistical inference will be based on the estimated odds-ratio (Symbicort ‘as needed’ vs SABA ‘as needed’ and Symbicort ‘as needed’ vs Pulmicort bid) and corresponding 95% confidence interval averaged over the whole 52-week period.
The planned treatment comparisons are:
1. Symbicort ‘as needed’ vs SABA ‘as needed’ (superiority, primary objective)
2. Symbicort ‘as needed’ vs Pulmicort bid (non-inferiority)
Formally, the null and alternative hypotheses for comparison 1 are:
H0: odds-ratio (Symbicort ‘as needed’ vs SABA ‘as needed’) = 1
HA: odds-ratio (Symbicort ‘as needed’ vs SABA ‘as needed’) ≠ 1
Hence, the lower confidence level of the odds ratio (Symbicort ‘as needed’ vs SABA ‘as needed’) must be greater than 1 in order to declare superiority.
And for comparison 2:
H0: lower 95% confidence limit of odds-ratio (Symbicort ‘as needed’ vs Pulmicortbid) < 0.8
HA: lower 95% confidence limit of odds-ratio (Symbicort ‘as needed’ vs Pulmicortbid) ≥ 0.8
Hence, the lower confidence level of the odds ratio (Symbicort ‘as needed’ vs Pulmicort bid) must be greater than or equal to 0.8 in order to declare non-inferioirity.
The two hypotheses will be tested sequentially. If comparison 1 does not support the hypothesis that Symbicort ‘as needed’ is superior to SABA ‘as needed’, then no formal statistical inference will be made for comparison 2, and Symbicort ‘as needed’ compared with Pulmicort bid will be considered exploratory.
The model will be coded using the PROC GENMOD procedure in SAS®, using the following code as a guide:
The comparison 1 and 2 hypothesis test result will be displayed using a two-sided 95% confidence interval.
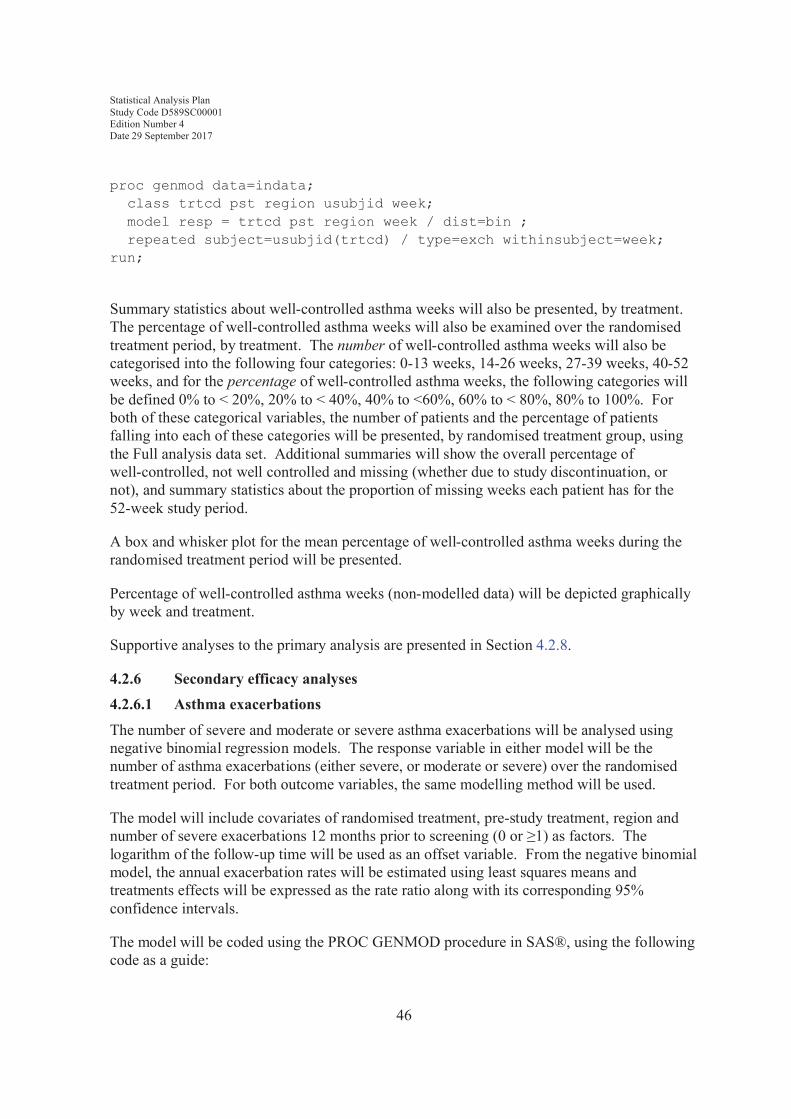
Statistical Analysis Plan Study Code D589SC00001Edition Number 4Date 29 September 2017
46
proc genmod data=indata; class trtcd pst region usubjid week; model resp = trtcd pst region week / dist=bin ; repeated subject=usubjid(trtcd) / type=exch withinsubject=week;run;
Summary statistics about well-controlled asthma weeks will also be presented, by treatment. The percentage of well-controlled asthma weeks will also be examined over the randomised treatment period, by treatment. The number of well-controlled asthma weeks will also be categorised into the following four categories: 0-13 weeks, 14-26 weeks, 27-39 weeks, 40-52 weeks, and for the percentage of well-controlled asthma weeks, the following categories will be defined 0% to < 20%, 20% to < 40%, 40% to <60%, 60% to < 80%, 80% to 100%. For both of these categorical variables, the number of patients and the percentage of patients falling into each of these categories will be presented, by randomised treatment group, using the Full analysis data set. Additional summaries will show the overall percentage of well-controlled, not well controlled and missing (whether due to study discontinuation, or not), and summary statistics about the proportion of missing weeks each patient has for the 52-week study period.
A box and whisker plot for the mean percentage of well-controlled asthma weeks during the randomised treatment period will be presented.
Percentage of well-controlled asthma weeks (non-modelled data) will be depicted graphically by week and treatment.
Supportive analyses to the primary analysis are presented in Section 4.2.8.
4.2.6 Secondary efficacy analyses4.2.6.1 Asthma exacerbations
The number of severe and moderate or severe asthma exacerbations will be analysed using negative binomial regression models. The response variable in either model will be the number of asthma exacerbations (either severe, or moderate or severe) over the randomised treatment period. For both outcome variables, the same modelling method will be used.
The model will include covariates of randomised treatment, pre-study treatment, region and number of severe exacerbations 12 months prior to screening (0 or ≥1) as factors. The logarithm of the follow-up time will be used as an offset variable. From the negative binomial model, the annual exacerbation rates will be estimated using least squares means and treatments effects will be expressed as the rate ratio along with its corresponding 95% confidence intervals.
The model will be coded using the PROC GENMOD procedure in SAS®, using the following code as a guide:

Statistical Analysis Plan Study Code D589SC00001Edition Number 4Date 29 September 2017
47
proc genmod data=indata; class trtcd pst region; model nexac = trtcd pst region / dist=negbin offset=logfup;run;
The rate ratio estimates together with the corresponding two-sided 95% confidence interval will be shown in a Forest plot.
Time to first severe and time to first moderate or severe asthma exacerbation will be analysed by Cox proportional hazards models. For both outcome variables, randomised treatment, pre-study treatment, region and number of severe exacerbations 12 months prior to screening(0, or ≥1) will be included as factors. The hazard ratio and its corresponding 95% confidence interval will be estimated from the model. Reverse Kaplan-Meier plots for time to first severe exacerbation and time to first severe or moderate exacerbation will be included. For patients without any exacerbations, the censoring time will be the time to discontinuation/completion.
The Cox proportional hazards model will be coded using PROC PHREG in SAS®, using the following code as a guide:
proc phreg data=indata;class trtcd pst region;model texac*censor(0) = trtcd pst region;run;
Summary statistics will be calculated about severe exacerbations and moderate or severe exacerbations in terms of exacerbation frequencies and rate, the number of days with an exacerbation. Summary statistics will also be calculated for severe exacerbation types:exacerbation requiring hospitalisation, exacerbation requiring GCS treatment for at least 3 days, and exacerbation requiring both emergency room visit and systemic steroids.
A table presenting the total number of moderate or severe exacerbations, and the total number and percentage whether these events were preceded by a worsening of asthma symptoms (including type of symptom) will be presented by each randomised treatment group. The same table will also include number of patients and percentage where a worsening in eDiary deterioration of symptoms for at least 2 days was observed.
The two weeks before and after the start of a severe exacerbation and moderate or severe exacerbation will be examined further by calculating mean PEF, and mean ‘as needed’ inhaler use every day in this period and plotting the treatment means over the 4 week period.
4.2.6.2 Additional steroids for asthmaTime to the administration of additional steroids for asthma will be analysed by a Cox proportional hazards model with randomised treatment, pre-study treatment and region as factors. The hazard ratio and its corresponding 95% confidence interval will be estimated from the model (as with time to first asthma exacerbations in Section 4.2.6.1).
Statistical Analysis Plan Study Code D589SC00001Edition Number 4Date 29 September 2017
48
A Kaplan-Meier plot for time to first additional steroids for asthma will be displayed by treatment.
An additional table presenting “Additional steroids for asthma and for long-term poor asthma control” will also be produced and this table will summarise the following variables: at least one administration of additional steroids (binary variable), Total number of days of additional steroids for patients who had been prescribed additional steroids for at least one day , at least one administration of additional ICS (binary variable), and Total number of days of additional ICS, by each randomised treatment group for patients who had been prescribed additional ICS for at least one day. For the binary variables, number of patients and percentage will be presented and for the two other variables, descriptive summary statistics will be produced.
4.2.6.3 Steroid load
The mean daily ICS (IP only, additional ICS and total, in μg) and the number of days with systemic GCS due to asthma will be presented descriptively by randomised treatment. A line graph will examine the change in mean daily inhaled steroid load over the randomised treatment period, by study week. In addition, a box and whisker plot presenting the mean daily ICS dose during the randomised treatment period, by each randomised treatment group will be produced. Within each treatment group there will be three different boxes presented: the first box representing the total ICS, the second box presenting the IP only ICS, and the third box presenting additional ICS use.
4.2.6.4 Discontinuation due to study specific asthma related events
Time to study discontinuation due to study specific asthma related events will be analysed by Cox proportional hazards model with randomised treatment, pre-study treatment and region as factors. The hazard ratio and its corresponding 95% confidence interval will be estimated from the model (as with time to first asthma exacerbations in Section 4.2.6.1).
Summary statistics alone will be presented if the number of study-specific asthma related discontinuations is considered to be too small to enable a meaningful statistical analysis.
In addition, the number of patients and the percentage of patients meeting a study specific asthma related discontinuation criterion, will be presented by randomised treatment group for the full analysis set (FAS). The table will include both the total and also each of the three discontinuation criteria: Severe asthma exacerbation with duration for more than 3 weeks, Two severe asthma exacerbations during 3 months, and Three severe asthma exacerbations during the study.
Forest plots will be produced based on the hazard ratios for the following secondary endpoints: Time to first severe asthma exacerbation, time to first moderate or severe asthma exacerbation, time to additional steroids for asthma, and time to asthma related discontinuation.
Statistical Analysis Plan Study Code D589SC00001Edition Number 4Date 29 September 2017
49
4.2.6.5 Lung function measurementsThe treatment effect for change from baseline in FEV1 (measured in litres) will be estimated using a mixed model repeated measures (MMRM) analysis. Pre- and post-bronchodilator FEV1 will be analysed in separate models, using the same modelling method.
For each model (pre- and post-bronchodilator) measurements of the outcome variable will be taken at Visits 4, 5, 6, 7 and 8. Terms for randomised treatment, pre-study treatment, region, visit and (randomised treatment*visit) will be included as fixed effects. Patient will be included as a random effect. Baseline FEV1 will be included as a continuous covariate. Visit will be fitted as an unordered categorical variable, and the variance-covariance matrix will be assumed to be unstructured. The model will be coded using the PROC MIXED procedure in SAS® using the following code as a guide:
proc mixed data=indata;class trtcd pst region visit;model chg = trtcd pst region visit trtcd*visit base /ddfm=KR;repeated visit / subject=usubjid type=un;
run;
If the procedure does not converge then a compound symmetric variance-covariance matrix will be used instead (replacing type=un with type=cs in the above code).
Kenward-Roger denominator degrees of freedom will be used (Kenward and Roger 1997).
This model will be used to give an overall assessment of the treatment effect as well as 95% confidence intervals. Separate treatment effects per visit will be presented.
Summary statistics will be presented by treatment for pre- and post-bronchodilator FEV1 (L), FEV1 (% of predicted normal) and FVC (L) (including change from baseline in those variables) by visit and across all the visits in the trial. Graphical plots of the FEV1 above variables over time will also be presented using model estimates.
4.2.6.6 Patient reported outcomesACQ-5 and AQLQ(S) will be analysed in the same way as FEV1 using MMRM analysis.
Responder variables based on a clinical improvement in ACQ-5 and AQLQ(S) of MID at end of treatment compared to baseline and the responder variable ACQ-5 < 0.75 at end of treatment will be analysed using logistic regression models. For each outcome variable, the model will include randomised treatment, pre-study treatment and region as factors, and baseline ACQ-5 or AQLQ(S) score (whichever matches the outcome variable in question) as a continuous covariate. From the logistic regression model, treatment effects will be estimated by odds-ratio and its corresponding 95% confidence interval. The model will be coded using the PROC LOGISTIC procedure in SAS® using the following code as a guide:

Statistical Analysis Plan Study Code D589SC00001Edition Number 4Date 29 September 2017
50
proc logistic data=indata; class trtcd pst region; model resp = trtcd pst region base;run;
In addition, the proportion of patients who had a clinical worsening or no clinically meaningful difference in ACQ-5 and AQLQ(S) based on MID at end of treatment compared to baseline will be reported.
Translation issues were identified in some versions of the ACQ-5/AQLQ(S) questionnaires in some countries. Any patient who completed an ACQ-5 questionnaire with a translation issue will be excluded from all ACQ-5 analysis. Any patient who completed an AQLQ(S)questionnaire with a translation issue will be excluded from all AQLQ(S) analyses. A document listing all ACQ-5/AQLQ(S) versions with translation issues will be provided.
The number and percentage of patients complying with ACQ-5 and AQLQ(S) questionnaires will be presented by randomised treatment group, both overall and by each study visit on-treatment.
Graphical plots of change from baseline ACQ-5 and AQLQ(S) over time will also be presented using model estimates.
4.2.6.7 Electronic diary variablesChange from baseline in PEF averaged over the randomised treatment period will be analysed using analysis of covariance (ANCOVA) models. Morning and evening PEF will be analysed using separate models, following the same modelling method. Change from baseline will be calculated as the difference between the mean of all non-missing measurements during the randomised treatment period and baseline.
The ANCOVA models will include randomised treatment, pre-study treatment and region as categorical factors, and the mean PEF value during run-in as a continuous covariate. Least squared means by randomised treatment group and differences in least squared means (between randomised treatment groups) along with corresponding 95% confidence intervals will be estimated. The model will be coded using the PROC GLM procedure in SAS® using the following code as a guide:
proc glm data=indata; class trtcd pst region; model chg = trtcd pst region base;run;
The change from baseline in asthma symptom score (day, night, total) and number of ‘as needed’ medication occasions (day, night, total), percentage of nighttime awakening(s) due to asthma symptoms, percentage of symptom-free days, percentage of asthma-control
Statistical Analysis Plan Study Code D589SC00001Edition Number 4Date 29 September 2017
51
days, percentage of ‘as needed’-free days, and percentage of controller use days will be analysed using ANCOVA models following the same method3.
Poorly controlled asthma weeks will be analysed using summary statistics by randomised treatment group. The proportion of poorly-controlled asthma weeks will also be examined over the randomised treatment period, by treatment. The number of poorly-controlled asthma weeks will also be categorised into the following four categories: 0-13 weeks, 14-26 weeks, 27-39 weeks, 40-52 weeks, and for the percentage of well-controlled asthma weeks, the following categories will be defined 0% to < 20%, 20% to < 40%, 40% to <60%, 60% to < 80%, 80% to 100%. For both of these categorical variables the number of patients and the percentage of patients falling into each of these categories will be presented, by randomised treatment group, using the Full analysis data set.
Summary statistics about the compliance of the eDiary will be collected by time of day (morning/evening). Descriptive statistics for eDiary compliance will be presented by each randomised treatment group, in total and also by morning compliance and evening compliance presented separately. The percentage of patients having a compliance ≥80% will also be presented by each randomised treatment group, in total and also by morning compliance and evening compliance presented separately.
Descriptive summary statistics for the eDiary variables will also be presented by randomised treatment group for baseline period and randomised treatment period, respectively.
4.2.6.8 Maintenance medication compliance and ‘as needed’ medication use
Summary statistics about maintenance medication compliance will be produced. See Section3.6.3 for metrics. To examine changes in compliance over time, the proportion of days where patients used ≥1 inhalation will be plotted over the randomised treatment period by week. Mean maintenance medication use per day will be depicted graphically by week and treatment.
Summary statistics about high use of ‘as needed’ medication (>8 and >12 inhalations on one day) will be produced.
Summary statistics about ‘as needed’ medication use and change from baseline in ‘as needed’ medication use will be produced. Change from baseline in ‘as needed’ medication use will be analysed using ANCOVA models. Day, night and total ‘as needed’ use will be analysed using separate models, following the same modelling method. Change from baseline will be calculated as the difference between the mean of all days during the randomised treatment period and the mean of all days during the last 10 days of the run-in period.
The ANCOVA models will include randomised treatment, pre-study treatment and region as categorical factors and baseline as needed medication use.as a continuous covariate. Baseline as needed medication use definition is specified in Section 3.1. Least squared means by
Statistical Analysis Plan Study Code D589SC00001Edition Number 4Date 29 September 2017
52
randomised treatment group and differences in least squared means (between randomised treatment groups) along with corresponding 95% confidence intervals will be estimated.
4.2.7 Safety analysisSafety variables will be presented descriptively by actual given treatment and pre-study treatment; no formal statistical hypothesis testing will be conducted.
The following safety variables will be summarised:
! Vital signs (pulse rate, systolic blood pressure, diastolic blood pressure)
∀ Raw measurements (Visits 2, 8 and end of treatment)
∀ Change from baseline (Visit 2 to end of treatment)
! Physical examination (general appearance, respiratory, cardiovascular, abdomen, head/neck)
∀ Baseline vs last scheduled observation on treatment (shift table)
Summary tables of adverse events, SAEs, DAEs and OAEs during the randomised treatment period and adverse events during run-in and follow-up will be produced. The summary outputs on AE categories and AE/SAE/DAE frequencies and incidence rate will also be presented by pre-study treatment category. The incidence rate is defined as the number of patients who have experienced the event per 100 patient treatment years. Number of events and event rates for AEs and SAEs will also be presented. Event rates are defined as the total number of events across all patients in the treatment group per 100 patient treatment years. Additionally, common AEs defined as those with a frequency >= 2% in any treatment group will be tabulated. Common SAEs and AEs leading to discontinuation defined as those with a frequency >= 0.2% in any treatment group will also be tabulated. Summary tables of AEs representing potential β2 agonist effects and AEs representing potential ICS effects will be produced. A listing for deaths, SAEs and DAEs will be generated.
For the subgroup of adolescent patients (≥ 12 and < 18 years of age at enrolment), absolute values and change from baseline in height will be summarised descriptively by treatment group.
4.2.8 Subgroup, supportive and sensitivity analysesFor all supportive analyses, if the model does not converge, then just summary statistics will be presented.
4.2.8.1 Subgroup analysis

Statistical Analysis Plan Study Code D589SC00001Edition Number 4Date 29 September 2017
53
Pre-study treatment:
The treatment effect will be investigated in the 2 subgroups as defined by pre-study treatment to assess the consistency of the treatment effect across subgroups. An interaction effect will be evaluated for the following efficacy variables: well-controlled asthma weeks, severe exacerbations rate, time-to severe exacerbation, moderate or severe exacerbations rate, time-to moderate or severe exacerbation, time-to additional steroids, PEF, asthma symptom score, nighttime awakening, ACQ-5 and FEV1 pre- bronchodilator. For total inhaled steroid load, and time to asthma related discontinuation, descriptive statistics by treatment group will be presented by pre-study treatment category.
The treatment-by-pre-study treatment interaction term will be used to explore the consistency of the treatment effect across pre-study treatment subgroup categories in the below models. The interaction p-value from the Type III sums of squares test will be presented. Forest plots presenting the overall and pre-study treatment subgroup categories treatment effects and their associated 95% CI will be generated.
For well-controlled asthma weeks, severe exacerbation rate, time-to first severe exacerbation, moderate or severe exacerbations rate, time-to moderate or severe exacerbation, time-to additional steroids, PEF, asthma symptom score and nighttime awakening, similar models to the overall population will be carried out but adding treatment-by-pre-study treatment interaction as factor into the model.
For ACQ and FEV1 pre- bronchodilator, similar models to the overall population will be carried out but adding treatment-by-pre-study treatment, pre-study treatment-by-visit, and treatment-by-visit-by- pre-study treatment. The 3-way interaction will be used to estimate the least squares mean of the treatment effect and its corresponding 95% CI by visit.
Well-controlled asthma weeks and severe asthma exacerbations:
For well-controlled asthma weeks and severe exacerbations, the consistency of treatment effect will also be examined with regards to sex, age, severe exacerbations 12 months prior to enrolment, baseline ACQ-5, asthma onset, smoking, region, baseline post-bronchodilator FEV1 PN and average use of SABA per day during run-in period. This will be done by including a (subgroup*randomised treatment) interaction term in the models.
Forest plots presenting the rate ratios estimates and their associated 95% CI by subgroup: pre-study treatment category will be provided.
Subgroup analysis on exacerbations will not be conducted on an individual subgroup if less than 20 exacerbations were experienced in the respective subgroup.
Subgroups are described in Table 2.
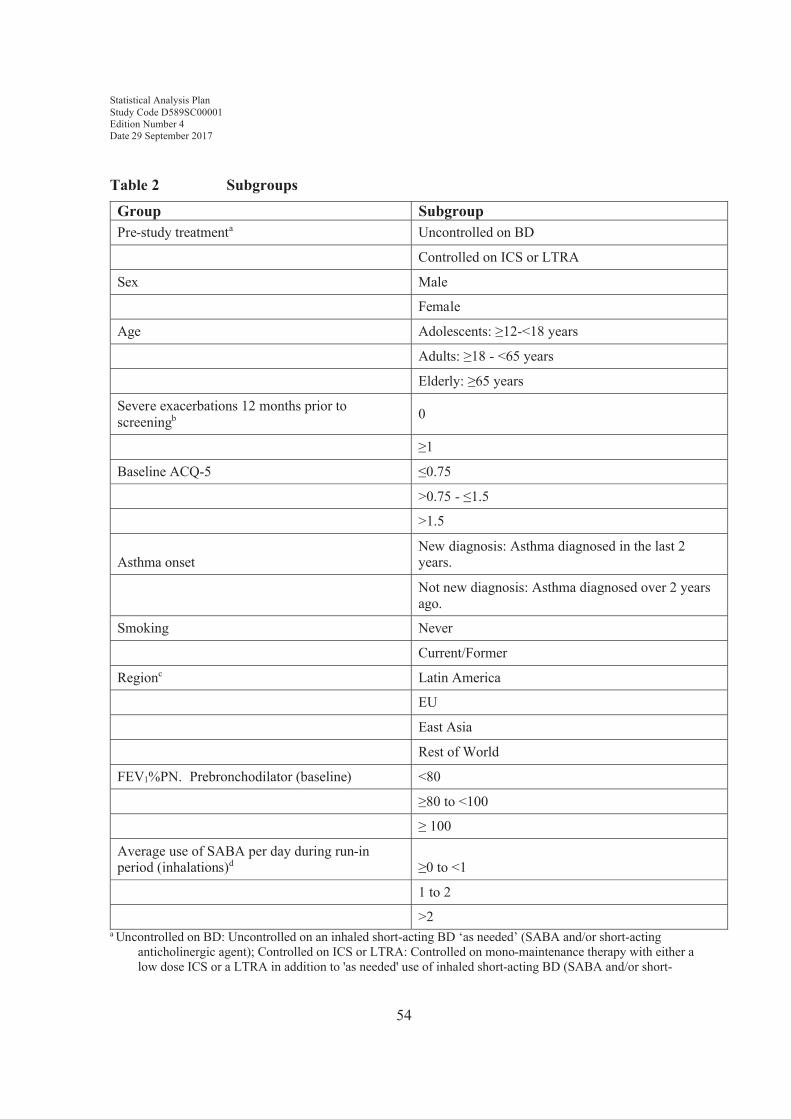
Statistical Analysis Plan Study Code D589SC00001Edition Number 4Date 29 September 2017
54
Table 2 Subgroups
Group SubgroupPre-study treatmenta Uncontrolled on BD
Controlled on ICS or LTRA
Sex Male
Female
Age Adolescents: ≥12-<18 years
Adults: ≥18 - <65 years
Elderly: ≥65 years
Severe exacerbations 12 months prior to screeningb 0
≥1
Baseline ACQ-5 ≤0.75
>0.75 - ≤1.5
>1.5
Asthma onset New diagnosis: Asthma diagnosed in the last 2 years.
Not new diagnosis: Asthma diagnosed over 2 years ago.
Smoking Never
Current/Former
Regionc Latin America
EU
East Asia
Rest of World
FEV1%PN. Prebronchodilator (baseline) <80
≥80 to <100
≥ 100
Average use of SABA per day during run-in period (inhalations)d ≥0 to <1
1 to 2
>2a Uncontrolled on BD: Uncontrolled on an inhaled short-acting BD ‘as needed’ (SABA and/or short-acting
anticholinergic agent); Controlled on ICS or LTRA: Controlled on mono-maintenance therapy with either a low dose ICS or a LTRA in addition to 'as needed' use of inhaled short-acting BD (SABA and/or short-
Statistical Analysis Plan Study Code D589SC00001Edition Number 4Date 29 September 2017
55
acting anticholinergic agent). This will be defined according to the data recorded in the Asthma medication, at entry form (MEDENT).
b Severe exacerbation definition at baseline is different to the study definition.c See Section 3.1 for a list of countries in each region. dThe day of randomisation is not included in this calculation
4.2.8.2 Supportive analysis: individual components of well-controlled asthma weeksThe analysis described in Section 4.2.5 will be repeated for each component of the definition of well-controlled asthma weeks separately, namely:
! No more than 2 days with a daily asthma symptom score >1
! No more than 2 days of ‘as needed’ medication use, up to a maximum of 4 occasions per week (multiple occasions per day should be regarded as separate occasions)
! Morning PEF≥80% of PN every day
! No nighttime awakenings due to asthma
! No additional inhaled and/or systemic GCS treatment due to asthma
These analyses will be accompanied by summary tables of the outcomes across all weeks as well as graphs for each component separately week-by-week.
4.2.8.3 Supportive analysis: removing individual components of well-controlled asthma weeks
The analysis described in Section 4.2.5 will be repeated with each component separately removed from the definition of well-controlled asthma weeks i.e., we will assume the removed criteria has been fulfilled. Therefore, when one of the first three components are removed, the algorithm text for well-controlled asthma weeks in Section 3.4.1.3 “Two or more of the following criteria are fulfilled” will be replaced by “One or more of the following criteria are fulfilled”.
These analyses will be displayed as a graph showing response rates for each component separately week-by-week.
4.2.8.4 Sensitivity analysis: the ‘as needed’ component of well-controlled asthma weeks
An important consideration when interpreting the results of the comparison of Symbicort ‘as needed’ to Pulmicort bid is the extent to which the primary endpoint is driven by ‘as needed’ medication use. A key component of the primary endpoint is the use of ‘as needed’ medication which is confounded with the different treatment regimes. In particular, the use of Pulmicort maintenance treatment may result in a higher proportion of

Statistical Analysis Plan Study Code D589SC00001Edition Number 4Date 29 September 2017
56
well-controlled weeks, due to less ‘as needed’ medication use, even if overall asthma control is truly similar to Symbicort as needed treatment (as all Symbicort use is counted as ‘as needed’ medication).
The following sensitivity analysis is planned:
Effect of changing the threshold for the ‘as needed’ component to less stringent criteria.
The analysis described in Section 4.2.5 will be repeated with the ‘as needed’ component changed to incorporate less stringent criteria of the number of days and number of inhalation occasions.
Less stringent criteria: No more than 5 days of ‘as needed’ medication use, up to a maximum of 14 occasions per week (multiple occasions per day should be regarded as separate occasions).
4.2.8.5 Sensitivity analysis: effect of missing diary observations on well-controlled asthma weeks
A histogram will be produced to show the proportion of patients that had an evaluable week (i.e., not missing) from weeks 1 to 52 using the 52-week study period.
An important practical concern in a study where the primary analysis relies on patient diary data is the potential for elements of the diary to be unavailable.
The following 4 sensitivity analyses will be performed to assess the robustness to variations of the missing data assumptions on the primary efficacy variable:
(a) The primary (protocol specified) analysis will be repeated but with additional covariates included in the model (baseline ACQ-5, baseline FEV1, sex, and age). This model will be fit using an autoregressive correlation matrix. Prior to this analysis, missing covariate values will be imputed by single imputation using the fully conditional specification (FCS) approach (White, Royston and Wood 2011), using the information from other covariate values and the first 2 weeks of well-controlled asthma weeks values. Each treatment group will have its missing data imputed separately.
(b) Multiple imputation analysis will be employed to impute the missing data, this assumes that the data are MAR. Each treatment group will have its missing data imputed separately. The imputation will be performed using the FCS approach, 100 times, and a seed of 24127 will be used. Logistic regression models will be used to impute each missing week, using the information of the 2 preceding and 2 subsequent weeks and the additional covariates (pre-study treatment, region, baseline FEV1, baseline ACQ-5, sex and age factors). Each imputed dataset will be analysed as per the primary analysis as specified in Section 4.2.5. The final inferences will be derived by averaging point estimates and combining within- and
Statistical Analysis Plan Study Code D589SC00001Edition Number 4Date 29 September 2017
57
between-imputation variability using Rubin’s rules (Rubin, 1987). Note that within each iteration, missing covariate values for baseline FEV1 and baseline ACQ-5 will be imputed using the FCS approach, using the information from other covariate values and values from the first 2 weeks of well-controlled asthma weeks.
(c) Multiple imputation tipping point analysis under the missing not at random (MNAR) assumption will be conducted. For patients in the Symbicort ‘as needed’ group, this method will impute missing values post study discontinuation assuming they were less likely to be well-controlled than as implied under the MARassumption. The imputed datasets from (b) will be used, after setting the monotone imputations of the Symbicort ‘as needed’ group back to missing. These missing values will then be re-imputed using sequential logistic regression with the previous two weeks and the baseline covariates pre-study treatment, region, baseline FEV1, baseline ACQ-5, sex and age). An adjustment will be made to the log-odds of the WCAW to the Symbicort ‘as needed’ group using the MNAR option in SAS. A seed of 24127 will be used.
The adjustment will be included by adding a shift parameter (delta) in the constant of the linear predictor function to penalize the probability of being WCAW for the Symbicort ‘as needed’ treatment arm. No MNAR adjustment will be made in the SABA ‘as needed’or Pulmicort (bid) arms. The adjustment will be made at every week post study discontinuation. The procedure will be repeated by decreasing the delta in steps of -0.05 until the tipping point are found or an adjustment of -3 is reached. The tipping point is the smallest delta at which the Symbicort ‘as needed’ vs SABA ‘as needed’ comparison is not statistically significant. The Symbicort ‘as needed’ vs Pulmicort bid comparison will be calculated using the delta from the tipping point of the Symbicort ‘as needed’ vs SABA ‘as needed’ comparison.
(d) The analysis described in Section 4.2.5 will be repeated, but the algorithm will be modified so that the eDiary has to be completed for all 7 days in a week to evaluable for a well-controlled asthma week.
5. INTERIM ANALYSES
No interim analysis is planned.
Statistical Analysis Plan Study Code D589SC00001Edition Number 4Date 29 September 2017
58
6. CHANGES OF ANALYSIS FROM PROTOCOL
6.1 Morning PEF on Day 1 occurs before randomisationDuring the review process of this SAP, it was noted that the morning PEF assessment is scheduled to take place before randomisation, therefore should not contribute to any outcome measurements during the randomised treatment period. In light of this, the following adjustments have been made:
! Morning PEF on Day 1 will not be included in the last of the 10 days’ worth of run-in results for the purpose of calculating baseline (see Section 3.1.1)
! For the purpose of evaluating well-controlled asthma weeks for Week 1, thecriterion based on morning PEF will only take six days’ worth of measurements into account (i.e., Days 2-7). The full seven days’ worth of measurements will be used from Week 2 onwards (see Section 3.4.1.3)
6.2 Baseline measurement for ACQ/AQLQ/FEV1/FVC on visit 3 only Baseline value for ACQ-5, AQLQ(S), FEV1 and FVC were defined as the last measured value prior to randomisation (usually Visit 3, but may occasionally be Visit 2 or an unscheduled visit). However, for patients entering the study as controlled on ICS or LTRA, measurements of these variables taken at Visit 2 are expected to be considerably different to the values measured at Visit 3, therefore screening values for these variables were not to be used. In light of this, the following adjustments have been made:
! The baseline value for ACQ-5, AQLQ(S), FEV1 and FVC will be defined as the last measured value prior to randomisation on Visit 3 only. For ACQ-5 and AQLQ(S), unscheduled assessments up to 2 days prior to Visit 3 are also acceptable for baseline.
6.3 Exclusion of analysis on partly-controlled weeks No analysis will be conducted on the partly-controlled asthma weeks endpoint as it is not considered clinically meaningful.
6.4 Amendment to daytime/nighttime periods for ‘as needed’ medication
For both the baseline period and the randomised treatment period, the algorithm described in Section 3.1.4, which was not described in detail in the CSP, will be used.
6.5 Amendment to incorporate severe exacerbations 12 months prior to screening in exacerbation models
Statistical Analysis Plan Study Code D589SC00001Edition Number 4Date 29 September 2017
59
The number of severe exacerbations 12 months prior to screening (0 or ≥1) was added as a categorical covariate to the exacerbation statistical models; annual severe exacerbation rate, annual moderate or severe exacerbation rate, time to severe exacerbation rate, and time to moderate or severe exacerbation rate.
7. REFERENCES
Quanjer et al 2012Quanjer PH, Stanojevic S, Cole TJ, Baur X, Hall GL, Culver BH, et al. Multi-ethnic reference values for spirometry for the 3-95-yr age range: the global lung function 2012 equations. Eur Respir J 2012;40(6):1324-43.
Kenward and Roger 1997Kenward MG and Roger JH. Small sample inference for fixed effects from restricted maximum likelihood. Biometrics 1997; 53: 983–997
White, Royston and Wood 2011White IR, Royston P, Wood AM. Multiple imputation using chained equations: Issues and guidance for practice. Statistics in Medicine 2011; 30(4):377-99
Rubin, 1987Rubin DB. Multiple Imputation for Nonresponse in Surveys. Wiley: New York, 1987
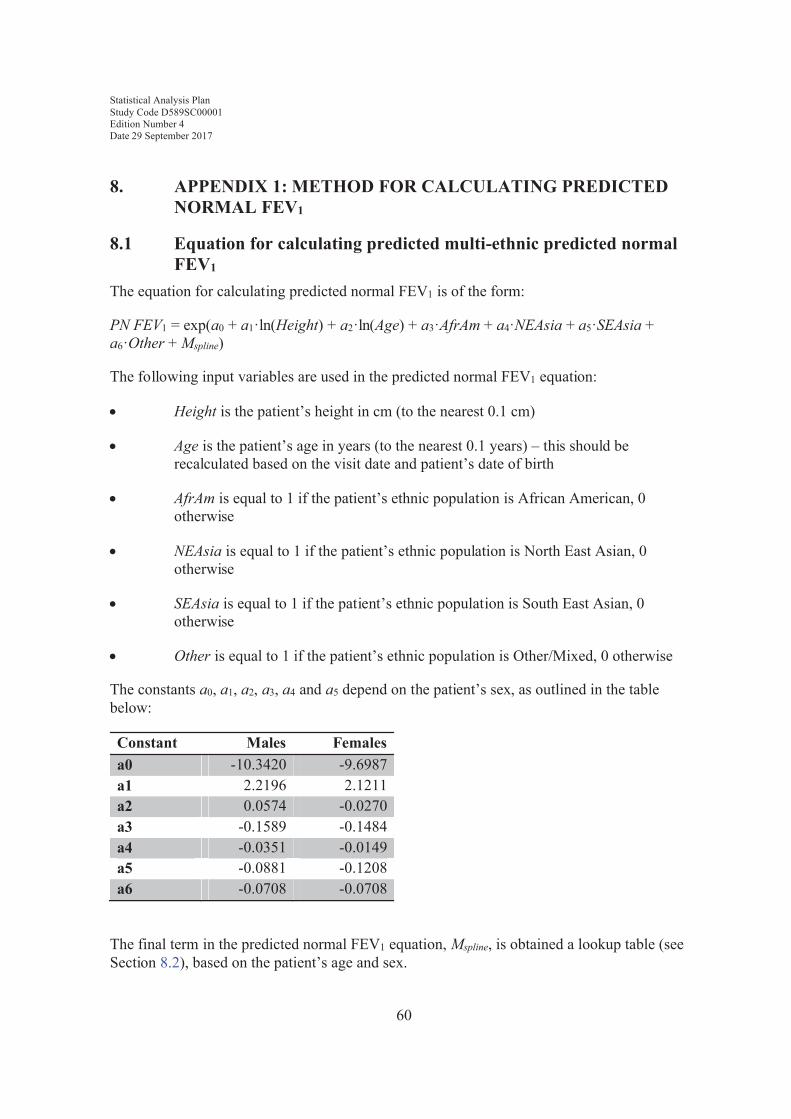
Statistical Analysis Plan Study Code D589SC00001Edition Number 4Date 29 September 2017
60
8. APPENDIX 1: METHOD FOR CALCULATING PREDICTED NORMAL FEV1
8.1 Equation for calculating predicted multi-ethnic predicted normal FEV1
The equation for calculating predicted normal FEV1 is of the form:
PN FEV1 = exp(a0 + a1·ln(Height) + a2·ln(Age) + a3·AfrAm + a4·NEAsia + a5·SEAsia + a6·Other + Mspline)
The following input variables are used in the predicted normal FEV1 equation:
! Height is the patient’s height in cm (to the nearest 0.1 cm)
! Age is the patient’s age in years (to the nearest 0.1 years) – this should be recalculated based on the visit date and patient’s date of birth
! AfrAm is equal to 1 if the patient’s ethnic population is African American, 0 otherwise
! NEAsia is equal to 1 if the patient’s ethnic population is North East Asian, 0 otherwise
! SEAsia is equal to 1 if the patient’s ethnic population is South East Asian, 0 otherwise
! Other is equal to 1 if the patient’s ethnic population is Other/Mixed, 0 otherwise
The constants a0, a1, a2, a3, a4 and a5 depend on the patient’s sex, as outlined in the table below:
Constant Males Femalesa0 -10.3420 -9.6987a1 2.2196 2.1211a2 0.0574 -0.0270a3 -0.1589 -0.1484a4 -0.0351 -0.0149a5 -0.0881 -0.1208a6 -0.0708 -0.0708
The final term in the predicted normal FEV1 equation, Mspline, is obtained a lookup table (see Section 8.2), based on the patient’s age and sex.
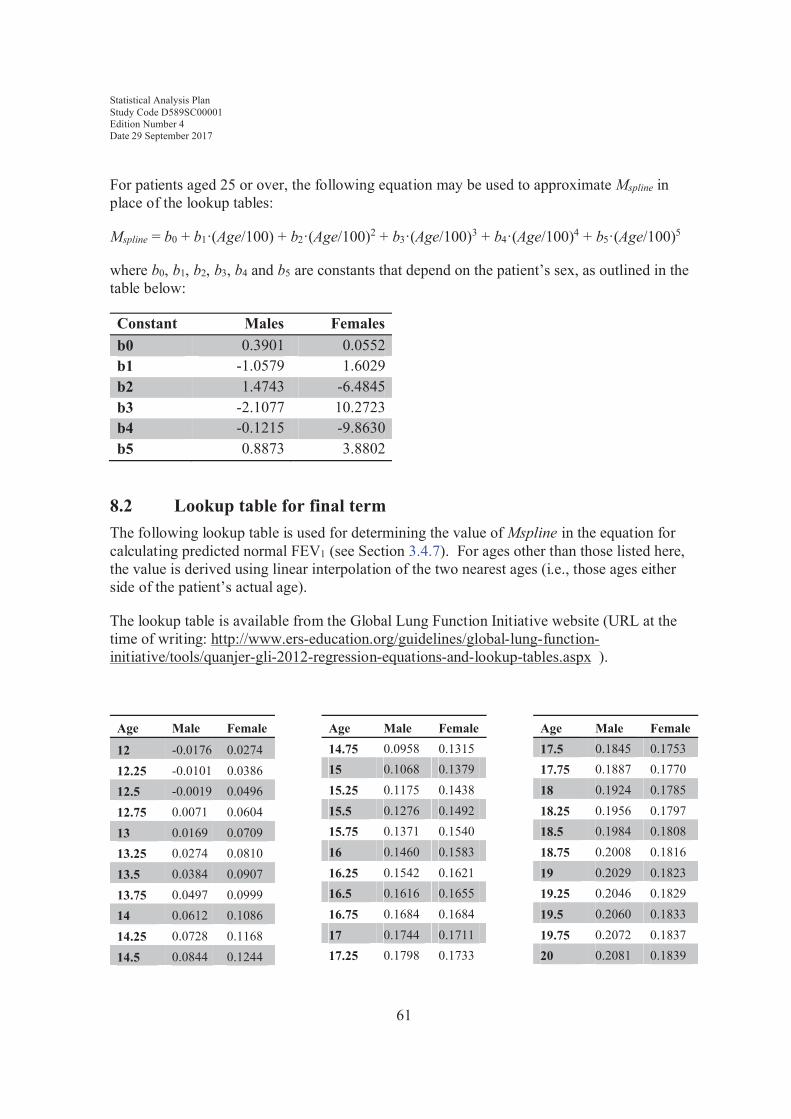
Statistical Analysis Plan Study Code D589SC00001Edition Number 4Date 29 September 2017
61
For patients aged 25 or over, the following equation may be used to approximate Mspline in place of the lookup tables:
Mspline = b0 + b1·(Age/100) + b2·(Age/100)2 + b3·(Age/100)3 + b4·(Age/100)4 + b5·(Age/100)5
where b0, b1, b2, b3, b4 and b5 are constants that depend on the patient’s sex, as outlined in the table below:
Constant Males Femalesb0 0.3901 0.0552b1 -1.0579 1.6029b2 1.4743 -6.4845b3 -2.1077 10.2723b4 -0.1215 -9.8630b5 0.8873 3.8802
8.2 Lookup table for final termThe following lookup table is used for determining the value of Mspline in the equation for calculating predicted normal FEV1 (see Section 3.4.7). For ages other than those listed here, the value is derived using linear interpolation of the two nearest ages (i.e., those ages either side of the patient’s actual age).
The lookup table is available from the Global Lung Function Initiative website (URL at the time of writing: http://www.ers-education.org/guidelines/global-lung-function-initiative/tools/quanjer-gli-2012-regression-equations-and-lookup-tables.aspx ).
Age Male Female
12 -0.0176 0.027412.25 -0.0101 0.038612.5 -0.0019 0.049612.75 0.0071 0.060413 0.0169 0.070913.25 0.0274 0.081013.5 0.0384 0.090713.75 0.0497 0.099914 0.0612 0.108614.25 0.0728 0.116814.5 0.0844 0.1244
Age Male Female14.75 0.0958 0.131515 0.1068 0.137915.25 0.1175 0.143815.5 0.1276 0.149215.75 0.1371 0.154016 0.1460 0.158316.25 0.1542 0.162116.5 0.1616 0.165516.75 0.1684 0.168417 0.1744 0.171117.25 0.1798 0.1733
Age Male Female17.5 0.1845 0.175317.75 0.1887 0.177018 0.1924 0.178518.25 0.1956 0.179718.5 0.1984 0.180818.75 0.2008 0.181619 0.2029 0.182319.25 0.2046 0.182919.5 0.2060 0.183319.75 0.2072 0.183720 0.2081 0.1839

Statistical Analysis Plan Study Code D589SC00001Edition Number 4Date 29 September 2017
62
Age Male Female20.25 0.2087 0.184120.5 0.2090 0.184220.75 0.2092 0.184221 0.2091 0.184121.25 0.2089 0.184021.5 0.2084 0.183821.75 0.2079 0.183522 0.2071 0.183222.25 0.2063 0.182822.5 0.2053 0.182322.75 0.2042 0.181823 0.2030 0.181223.25 0.2016 0.180623.5 0.2002 0.179923.75 0.1987 0.179224 0.1970 0.178524.25 0.1954 0.177724.5 0.1936 0.176924.75 0.1918 0.176125 0.1899 0.175325.25 0.1880 0.174525.5 0.1861 0.173725.75 0.1841 0.172926 0.1821 0.172126.25 0.1801 0.171326.5 0.1781 0.170526.75 0.1760 0.169727 0.1739 0.169027.25 0.1718 0.168227.5 0.1697 0.167427.75 0.1677 0.166628 0.1656 0.165828.25 0.1635 0.165028.5 0.1615 0.164228.75 0.1594 0.163429 0.1574 0.162529.25 0.1554 0.1617
Age Male Female29.5 0.1534 0.160829.75 0.1514 0.159930 0.1495 0.159030.25 0.1475 0.158130.5 0.1455 0.157230.75 0.1436 0.156231 0.1417 0.155331.25 0.1397 0.154331.5 0.1378 0.153331.75 0.1359 0.152332 0.1340 0.151232.25 0.1321 0.150132.5 0.1302 0.149032.75 0.1283 0.147933 0.1265 0.146733.25 0.1246 0.145633.5 0.1227 0.144433.75 0.1209 0.143134 0.1190 0.141834.25 0.1172 0.140634.5 0.1153 0.139234.75 0.1135 0.137935 0.1116 0.136535.25 0.1097 0.135135.5 0.1078 0.133735.75 0.1059 0.132236 0.1040 0.130836.25 0.1021 0.129236.5 0.1001 0.127736.75 0.0982 0.126237 0.0962 0.124637.25 0.0943 0.123037.5 0.0923 0.121437.75 0.0903 0.119738 0.0883 0.118038.25 0.0863 0.116438.5 0.0843 0.1147
Age Male Female38.75 0.0823 0.112939 0.0803 0.111239.25 0.0782 0.109439.5 0.0762 0.107639.75 0.0742 0.105840 0.0721 0.104040.25 0.0700 0.102240.5 0.0680 0.100340.75 0.0659 0.098541 0.0638 0.096641.25 0.0617 0.094741.5 0.0596 0.092841.75 0.0575 0.090942 0.0554 0.088942.25 0.0533 0.087042.5 0.0511 0.085042.75 0.0490 0.083043 0.0469 0.081143.25 0.0448 0.079143.5 0.0427 0.077143.75 0.0406 0.075144 0.0386 0.073144.25 0.0365 0.071044.5 0.0344 0.069044.75 0.0323 0.067045 0.0302 0.065045.25 0.0281 0.063045.5 0.0261 0.060945.75 0.0240 0.058946 0.0219 0.056846.25 0.0198 0.054846.5 0.0177 0.052746.75 0.0156 0.050747 0.0135 0.048647.25 0.0114 0.046547.5 0.0093 0.044547.75 0.0072 0.0424

Statistical Analysis Plan Study Code D589SC00001Edition Number 4Date 29 September 2017
63
Age Male Female48 0.0050 0.040348.25 0.0029 0.038248.5 0.0007 0.036148.75 -0.0015 0.033949 -0.0036 0.031849.25 -0.0058 0.029749.5 -0.0080 0.027549.75 -0.0103 0.025450 -0.0125 0.023250.25 -0.0147 0.021050.5 -0.0170 0.018850.75 -0.0193 0.016651 -0.0216 0.014451.25 -0.0239 0.012251.5 -0.0262 0.009951.75 -0.0285 0.007752 -0.0309 0.005452.25 -0.0332 0.003252.5 -0.0356 0.000952.75 -0.0380 -0.001453 -0.0404 -0.003753.25 -0.0428 -0.006153.5 -0.0453 -0.008453.75 -0.0478 -0.010854 -0.0502 -0.013154.25 -0.0527 -0.015554.5 -0.0552 -0.017954.75 -0.0578 -0.020355 -0.0603 -0.022755.25 -0.0629 -0.025255.5 -0.0654 -0.027655.75 -0.0680 -0.030156 -0.0706 -0.032656.25 -0.0732 -0.035056.5 -0.0759 -0.037556.75 -0.0785 -0.040157 -0.0812 -0.0426
Age Male Female57.25 -0.0839 -0.045157.5 -0.0866 -0.047757.75 -0.0893 -0.050358 -0.0920 -0.052958.25 -0.0947 -0.055558.5 -0.0975 -0.058158.75 -0.1002 -0.060759 -0.1030 -0.063459.25 -0.1058 -0.066059.5 -0.1086 -0.068759.75 -0.1114 -0.071460 -0.1143 -0.074160.25 -0.1171 -0.076860.5 -0.1199 -0.079560.75 -0.1228 -0.082261 -0.1257 -0.085061.25 -0.1286 -0.087861.5 -0.1315 -0.090561.75 -0.1344 -0.093362 -0.1373 -0.096162.25 -0.1402 -0.098962.5 -0.1431 -0.101862.75 -0.1461 -0.104663 -0.1490 -0.107563.25 -0.1519 -0.110363.5 -0.1549 -0.113263.75 -0.1578 -0.116164 -0.1608 -0.119064.25 -0.1638 -0.121964.5 -0.1667 -0.124964.75 -0.1697 -0.127865 -0.1727 -0.130865.25 -0.1757 -0.133865.5 -0.1786 -0.136865.75 -0.1816 -0.139866 -0.1846 -0.142866.25 -0.1876 -0.1458
Age Male Female66.5 -0.1906 -0.148866.75 -0.1936 -0.151967 -0.1966 -0.155067.25 -0.1996 -0.158067.5 -0.2026 -0.161167.75 -0.2056 -0.164268 -0.2086 -0.167468.25 -0.2116 -0.170568.5 -0.2147 -0.173668.75 -0.2177 -0.176869 -0.2207 -0.179969.25 -0.2237 -0.183169.5 -0.2267 -0.186369.75 -0.2298 -0.189570 -0.2328 -0.192670.25 -0.2358 -0.195870.5 -0.2388 -0.199170.75 -0.2418 -0.202371 -0.2449 -0.205571.25 -0.2479 -0.208771.5 -0.2509 -0.212071.75 -0.2539 -0.215272 -0.2569 -0.218472.25 -0.2599 -0.221772.5 -0.2630 -0.224972.75 -0.2660 -0.228273 -0.2690 -0.231573.25 -0.2720 -0.234773.5 -0.2750 -0.238073.75 -0.2780 -0.241374 -0.2810 -0.244574.25 -0.2840 -0.247874.5 -0.2869 -0.251174.75 -0.2899 -0.254375 -0.2929 -0.257675.25 -0.2959 -0.260975.5 -0.2989 -0.2642
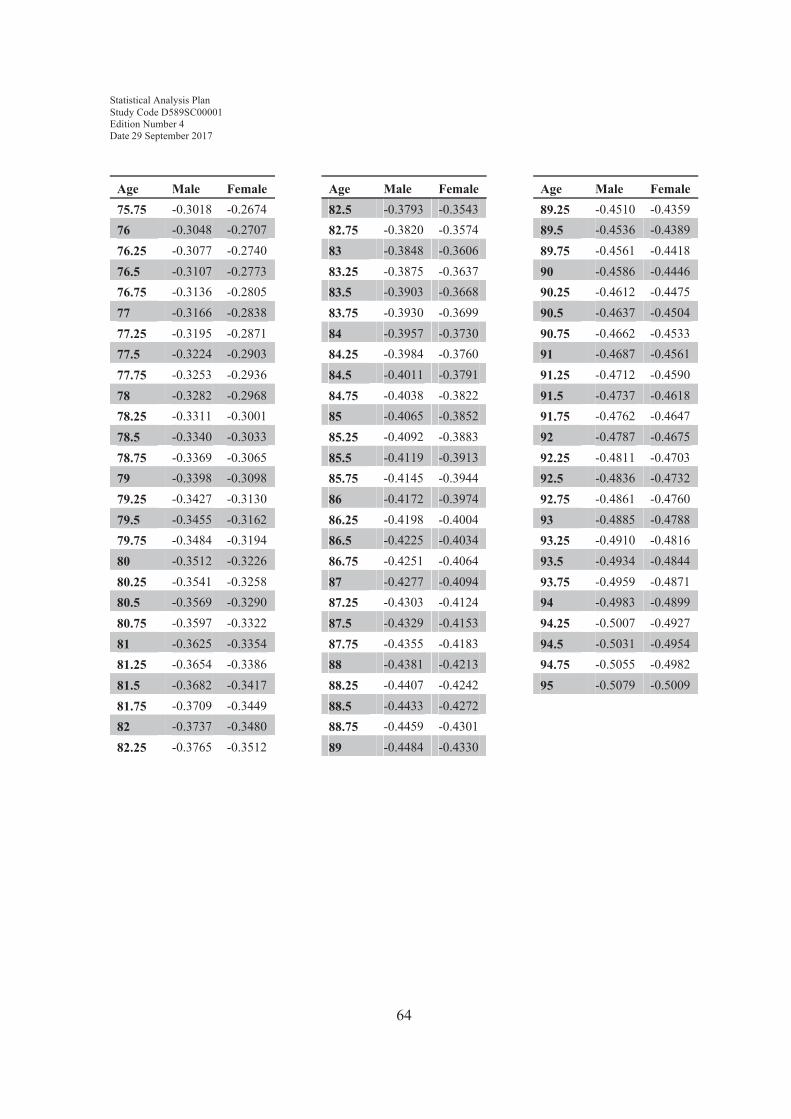
Statistical Analysis Plan Study Code D589SC00001Edition Number 4Date 29 September 2017
64
Age Male Female75.75 -0.3018 -0.267476 -0.3048 -0.270776.25 -0.3077 -0.274076.5 -0.3107 -0.277376.75 -0.3136 -0.280577 -0.3166 -0.283877.25 -0.3195 -0.287177.5 -0.3224 -0.290377.75 -0.3253 -0.293678 -0.3282 -0.296878.25 -0.3311 -0.300178.5 -0.3340 -0.303378.75 -0.3369 -0.306579 -0.3398 -0.309879.25 -0.3427 -0.313079.5 -0.3455 -0.316279.75 -0.3484 -0.319480 -0.3512 -0.322680.25 -0.3541 -0.325880.5 -0.3569 -0.329080.75 -0.3597 -0.332281 -0.3625 -0.335481.25 -0.3654 -0.338681.5 -0.3682 -0.341781.75 -0.3709 -0.344982 -0.3737 -0.348082.25 -0.3765 -0.3512
Age Male Female82.5 -0.3793 -0.354382.75 -0.3820 -0.357483 -0.3848 -0.360683.25 -0.3875 -0.363783.5 -0.3903 -0.366883.75 -0.3930 -0.369984 -0.3957 -0.373084.25 -0.3984 -0.376084.5 -0.4011 -0.379184.75 -0.4038 -0.382285 -0.4065 -0.385285.25 -0.4092 -0.388385.5 -0.4119 -0.391385.75 -0.4145 -0.394486 -0.4172 -0.397486.25 -0.4198 -0.400486.5 -0.4225 -0.403486.75 -0.4251 -0.406487 -0.4277 -0.409487.25 -0.4303 -0.412487.5 -0.4329 -0.415387.75 -0.4355 -0.418388 -0.4381 -0.421388.25 -0.4407 -0.424288.5 -0.4433 -0.427288.75 -0.4459 -0.430189 -0.4484 -0.4330
Age Male Female89.25 -0.4510 -0.435989.5 -0.4536 -0.438989.75 -0.4561 -0.441890 -0.4586 -0.444690.25 -0.4612 -0.447590.5 -0.4637 -0.450490.75 -0.4662 -0.453391 -0.4687 -0.456191.25 -0.4712 -0.459091.5 -0.4737 -0.461891.75 -0.4762 -0.464792 -0.4787 -0.467592.25 -0.4811 -0.470392.5 -0.4836 -0.473292.75 -0.4861 -0.476093 -0.4885 -0.478893.25 -0.4910 -0.481693.5 -0.4934 -0.484493.75 -0.4959 -0.487194 -0.4983 -0.489994.25 -0.5007 -0.492794.5 -0.5031 -0.495494.75 -0.5055 -0.498295 -0.5079 -0.5009

9. APPENDIX 2: IDENTIFICATION OF ADDITIONAL STEROID MEDICATIONS FOR ANALYSES
Relevant SAP section
Parameter Source of data
3.4.3 Additional steroids for asthma*
1a. Inhaled corticosteroids as recorded on the EXACASI module1b. MED module with ATC codes R03BA or R03AK and reason is either ‘Disease under study’ or ‘Protocol defined exacerbation of disease under study’.1c. MED module with ATC codes R03BA or R03AK and Therapy reason is ’Adverse event’ and Reason for therapy text in the MED module contains the word ’asthma’ or ’astma’. (Note each letter in asthma/astma should be allowed to be in upper/lower case)1d. MED module with ATC codes R03BA or R03AK and Therapy reason is ’Other’ and ”Reason for therapy contains the word ’asthma’ or ’astma’ (Note each letter in asthma/astma should be allowed to be in upper/lower case)2a. Long term poor asthma control as recorded on the EXACASI module2b. MED module where ATC code is either R03BA or R03AK and reason is ‘Additional inhaled Budesonide for long term poor asthma control.’3. Systemic corticosteroids given for an exacerbation as per the EXACASI module4a. Systemic corticosteroids recorded on the MED module where ATC code is H02AB and Therapy reason is ‘Disease under study’ or ‘Protocol defined exacerbation of disease under study’4b . Systemic corticosteroids recorded on the MED module where ATC code is H02AB and Therapy reason is ’Adverse event’ and Reason for therapy text in the MED module contains the word ’asthma’ or ’astma'. (Note each letter in asthma/astma should be allowed to be in upper/lower case)4c .Systemic corticosteroids recorded on the MED module where ATC code is H02AB and Therapy reason is ’Other’ and Reason for therapy text contains the word ’asthma’ (Note each letter in asthma/astma should be allowed to be in upper/lower case)
3.4.3 Additional inhaled steroids for long term asthma control
2a or 2b as above
65
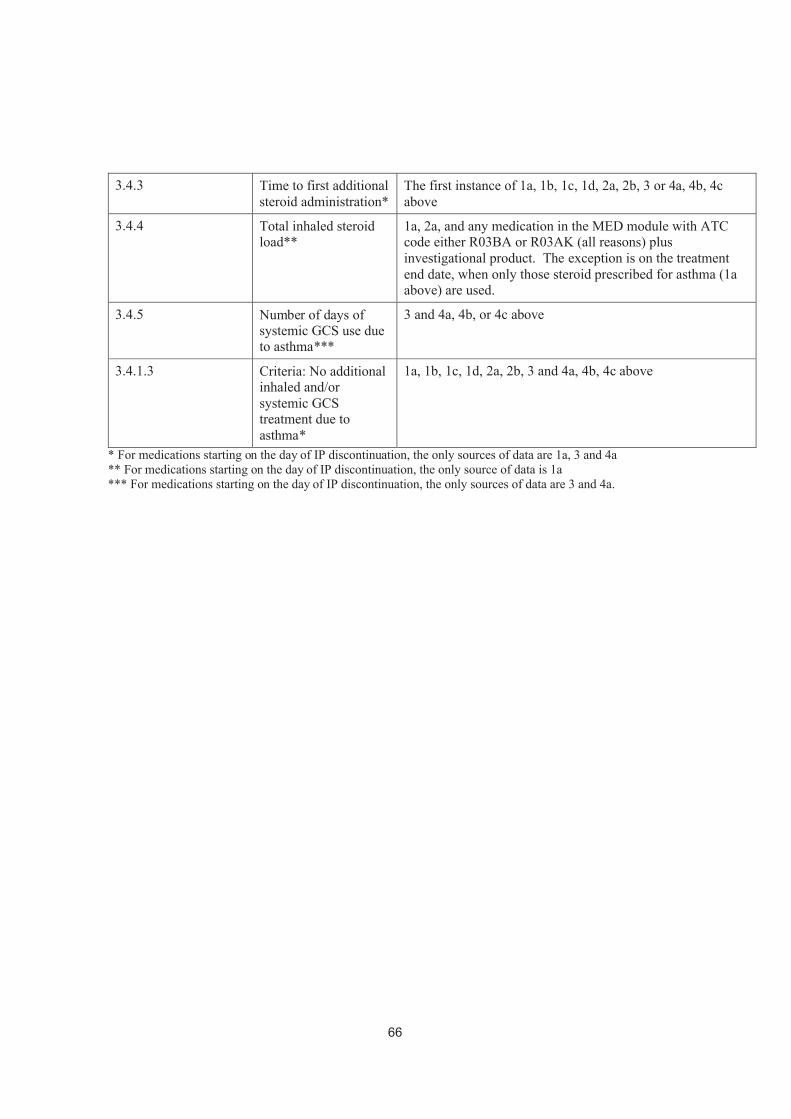
3.4.3 Time to first additional steroid administration*
The first instance of 1a, 1b, 1c, 1d, 2a, 2b, 3 or 4a, 4b, 4cabove
3.4.4 Total inhaled steroid load**
1a, 2a, and any medication in the MED module with ATC code either R03BA or R03AK (all reasons) plus investigational product. The exception is on the treatment end date, when only those steroid prescribed for asthma (1a above) are used.
3.4.5 Number of days of systemic GCS use due to asthma***
3 and 4a, 4b, or 4c above
3.4.1.3 Criteria: No additional inhaled and/or systemic GCS treatment due to asthma*
1a, 1b, 1c, 1d, 2a, 2b, 3 and 4a, 4b, 4c above
* For medications starting on the day of IP discontinuation, the only sources of data are 1a, 3 and 4a** For medications starting on the day of IP discontinuation, the only source of data is 1a*** For medications starting on the day of IP discontinuation, the only sources of data are 3 and 4a.
66
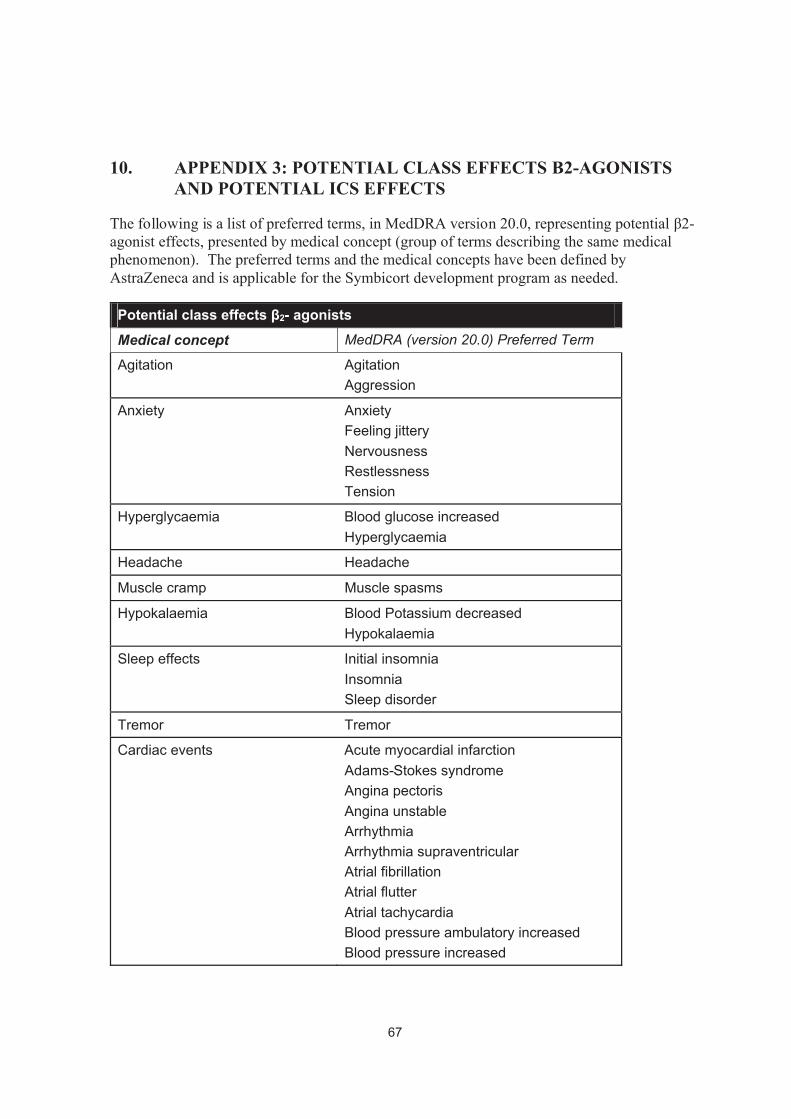
10. APPENDIX 3: POTENTIAL CLASS EFFECTS Β2-AGONISTS AND POTENTIAL ICS EFFECTS
The following is a list of preferred terms, in MedDRA version 20.0, representing potential β2-agonist effects, presented by medical concept (group of terms describing the same medical phenomenon). The preferred terms and the medical concepts have been defined by AstraZeneca and is applicable for the Symbicort development program as needed.
Potential class effects β2- agonistsMedical concept MedDRA (version 20.0) Preferred Term
Agitation AgitationAggression
Anxiety AnxietyFeeling jitteryNervousnessRestlessnessTension
Hyperglycaemia Blood glucose increasedHyperglycaemia
Headache Headache
Muscle cramp Muscle spasms
Hypokalaemia Blood Potassium decreasedHypokalaemia
Sleep effects Initial insomniaInsomniaSleep disorder
Tremor Tremor
Cardiac events Acute myocardial infarctionAdams-Stokes syndromeAngina pectorisAngina unstableArrhythmiaArrhythmia supraventricularAtrial fibrillationAtrial flutterAtrial tachycardiaBlood pressure ambulatory increasedBlood pressure increased
67

Blood pressure systolic increasedExtrasystolesHeart rate increasedHypertensionPalpitationsSinus tachycardiaSupraventricular extrasystolesSupraventricular tachyarrhythmiaSupraventricular tachycardiaTachyarrhythmiaTachycardiaVentricular extrasystoles
The following list is of preferred terms, in MedDRA version 20.0, representing potential ICSeffects, presented by location and medical concept (group of terms describing the same medical phenomenon). The preferred terms and the medical concepts have been defined by AstraZeneca and is applicable for the Symbicort development program as needed.
Potential Class effectsInhaled corticosteroids
Location Medical concept MedDRA (version 20.0) Preferred Term
Local steroid effects Candidiasis Candida infectionOral candidiasisOropharyngeal candidiasis
Voice effects AphoniaDysphonia
Systemic steroid effects Adrenal suppression Addison´s diseaseAdrenal insufficiencyAdrenal suppressionAdrenocortical insufficiency acuteBlood cortisol decreasedCortisol free urine decreasedSecondary adrenocortical insufficiencyUrine cortisol/creatinine ratio decreased
Diabetes control Diabetes mellitusDiabetes mellitus inadequate control
68
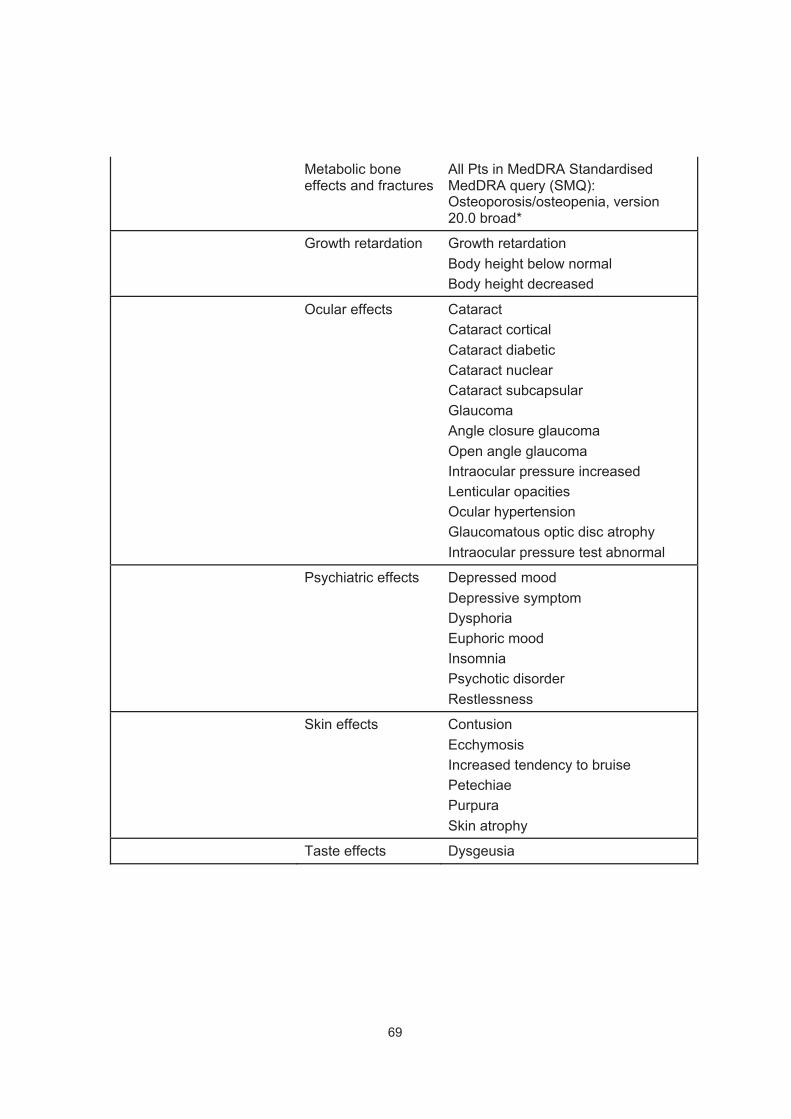
Metabolic bone effects and fractures
All Pts in MedDRA Standardised MedDRA query (SMQ): Osteoporosis/osteopenia, version 20.0 broad*
Growth retardation Growth retardationBody height below normalBody height decreased
Ocular effects CataractCataract corticalCataract diabeticCataract nuclearCataract subcapsularGlaucomaAngle closure glaucomaOpen angle glaucomaIntraocular pressure increasedLenticular opacitiesOcular hypertensionGlaucomatous optic disc atrophyIntraocular pressure test abnormal
Psychiatric effects Depressed moodDepressive symptomDysphoriaEuphoric moodInsomniaPsychotic disorderRestlessness
Skin effects ContusionEcchymosisIncreased tendency to bruisePetechiaePurpuraSkin atrophy
Taste effects Dysgeusia
69
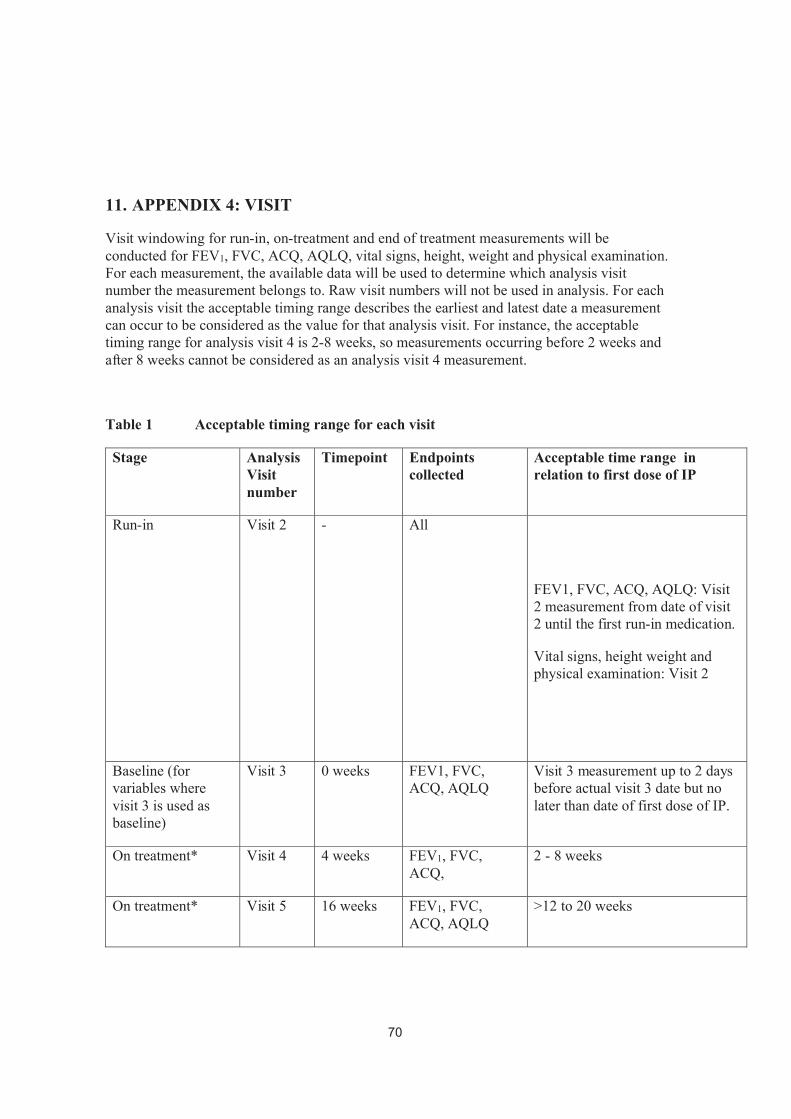
11. APPENDIX 4: VISIT
Visit windowing for run-in, on-treatment and end of treatment measurements will be conducted for FEV1, FVC, ACQ, AQLQ, vital signs, height, weight and physical examination. For each measurement, the available data will be used to determine which analysis visit number the measurement belongs to. Raw visit numbers will not be used in analysis. For each analysis visit the acceptable timing range describes the earliest and latest date a measurement can occur to be considered as the value for that analysis visit. For instance, the acceptable timing range for analysis visit 4 is 2-8 weeks, so measurements occurring before 2 weeks and after 8 weeks cannot be considered as an analysis visit 4 measurement.
Table 1 Acceptable timing range for each visit
Stage Analysis Visit number
Timepoint Endpoints collected
Acceptable time range in relation to first dose of IP
Run-in Visit 2 - All
FEV1, FVC, ACQ, AQLQ: Visit 2 measurement from date of visit 2 until the first run-in medication.
Vital signs, height weight and physical examination: Visit 2
Baseline (for variables where visit 3 is used as baseline)
Visit 3 0 weeks FEV1, FVC, ACQ, AQLQ
Visit 3 measurement up to 2 days before actual visit 3 date but no later than date of first dose of IP.
On treatment* Visit 4 4 weeks FEV1, FVC, ACQ,
2 - 8 weeks
On treatment* Visit 5 16 weeks FEV1, FVC, ACQ, AQLQ
>12 to 20 weeks
70

On treatment* Visit 6 28 weeks FEV1, FVC, ACQ, AQLQ
>24 to 32 weeks
On treatment* Visit 7 40 weeks FEV1, FVC, ACQ, AQLQ
>36 to 44 weeks
On treatment Visit 8 52 weeks All, apart from height which is collected for adolescents only.
≥48 weeks
Acceptable upper range for measurements:
FEV1, FVC: date of analysis visit 8 and no later than the day after IP discontinuation.
ACQ, AQLQ, vital signs, height (adolescents only), weight and physical examination: no later than 7 days after IP discontinuation.
End of treatment Visit 9 - All, apart from height which is collected for adolescents only.
End of treatment can occur anytime between Visit 3 and one day after IP discontinuation for all patients who took at least one dose of IP.
Acceptable upper range for measurements:
FEV1, FVC: date of analysis visit 8 and no later than the day after IP discontinuation.
ACQ, AQLQ, vital signs, height (adolescents only), weight and physical examination: no later than 7 days after IP discontinuation.
*If a patient discontinues IP early, all measurements up to and including the day after IP discontinuation can be considered for on-treatment values.
Rules for FEV1, FVC, vital signs, height, weight and physical examination:
71
1. Measurements from unscheduled visits (visit number with decimals of format X.0X or with a module occurrence number>1000) will not be used in the analysis. The rational for this is that normally an unscheduled visit is made in connection to an asthma exacerbation or AE, and assessments at such visits will not be representative of scheduled visits. There are cases when a measurement cannot be completed at the scheduled visits. In these cases the patient returns on another timepoint to complete the assessment. In these cases the scheduled visit number is used in combination with a recording of the actual assessment date. Such an assessment will not be considered unscheduled and can be included in the analysis.
2. The order of selecting measurements for each visit is specified below. Visit timepoint is the CSP specified timepoint, as in CSP Table 1, i.e. visit 4 timepoint is 4 weeks.Note that a scheduled visit inside another scheduled visits timing window will beconsidered for analysis, e.g. a visit 4 occurring in visit 5 window (10-22 weeks). Also note that if there is more than one non-missing observation at same date, the one with the lowest module occurrence number should be used as that should be the original measurement. Refer to Table 1 for acceptable timing range.
Rules for ACQ and AQLQ:1. Unlike the other parameters, ACQ and AQLQ should not be measured on
unscheduled visits in connection to for example and AE or exacerbation. It has been decided not to consider the visit numbers for analysis of ACQ and AQLQ, but to only look at the assessment date in relation to the date of first dose of IP, according to the the acceptable timing range in Table 1.
2. AQLQ(S) should not be assessed on visits 4, and hence no assessment should be selected for analysis visit 4.
3. If there is more than one non-missing observation of ACQ and AQLQ at the same date the worse assessment should be used. Which assessment is worse is based on the total score. For ACQ a higher total score is worse, and for AQLQ a lower total score is worse.
Run-in analysis visit:
1. Use scheduled visit 2 if available and within acceptable visit 2 timing range. Include assessments recorded as visit 2 even if before visit 2 date and or after until day of run-in medication
2. If more than one scheduled visit 2 in acceptable visit 2 timing range use earliest scheduled visit.
Baseline visit (for variables where baseline is based on visit 3)If more than one scheduled visit 3 in acceptable visit 3 timing range use earliest scheduled visit.
On-treatment analysis visits 4 to 7
72

1. Use closest scheduled visit to visit timepoint if within visit acceptable timing range and at most one day after IP discontinuation if patient is a non-completer. If 2 or more scheduled visits from visit timepoint are equidistant (and not more than 1 day after IP discontinuation if patient is a non-completer) use earlier visit.
2. Use closest other scheduled visit if within visit acceptable range and at most one day after IP discontinuation if patient is a non-completer. If 2 or more scheduled visits from visit timepoint are equidistant (and not more than 1 day after IP discontinuation if patient is a non-completer) use earlier visit.
End of treatment analysis visit for FEV1 and FVC
If a visit 8 measurement according to visit windows is missing, use last available non-missing measurement made at a scheduled visit but no later than one day after IP discontinuation.
End of treatment analysis visit for other variables
Other variables include ACQ, AQLQ, vital signs, height (adolescents only), weight and physical examination.
If a visit 8 measurement according to visit windows is missing, use last available non-missing measurement made at a scheduled visit but no later than 7 days after IP discontinuation. For ACQ and AQLQ, the assessment does not have to be scheduled, since it was decided not to consider the visit numbers for analysis of ACQ and AQLQ.
On-treatment analysis visit 8
Patients must have completed at least 48 weeks on IP to have a visit 8 measurement. For these patients their visit 8 measurements will be the same as their end of treatment measurements.
Treatment average
Treatment average is derived as an average within subject from the values derived according to the rules above for each analysis visit. For assessments that are not to be made on each visit, only planned visits will be included. Hence, for example, AQLQ(S) should not be assessed on visits 4, and hence the treatment average will be derived from the results for analysis visits 5-8.
73