An introduction to circular dichroism spectroscopy...An introduction to circular dichroism...
15
An introduction to circular dichroism spectroscopy Circular dichroism (CD) is the difference in the absorption of left‐handed circularly polarised light (L‐CPL) and right‐handed circularly polarised light (R‐CPL) and occurs when a molecule contains one or more chiral chromophores (light‐absorbing groups). Circular dichroism = ΔA(λ) = A(λ) LCPL ‐ A(λ) RCPL , where λ is the wavelength Circular dichroism (CD) spectroscopy is a spectroscopic technique where the CD of molecules is measured over a range of wavelengths. CD spectroscopy is used extensively to study chiral molecules of all types and sizes, but it is in the study of large biological molecules where it finds its most important applications. A primary use is in analysing the secondary structure or conformation of macromolecules, particularly proteins as secondary structure is sensitive to its environment, temperature or pH, circular dichroism can be used to observe how secondary structure changes with environmental conditions or on interaction with other molecules. Structural, kinetic and thermodynamic information about macromolecules can be derived from circular dichroism spectroscopy. Measurements carried out in the visible and ultra‐violet region of the electro‐magnetic spectrum monitor electronic transitions, and, if the molecule under study contains chiral chromophores then one CPL state will be absorbed to a greater extent than the other and the CD signal over the corresponding wavelengths will be non‐zero. A circular dichroism signal can be positive or negative, depending on whether L‐CPL is absorbed to a greater extent than R‐ CPL (CD signal positive) or to a lesser extent (CD signal negative). An example circular dichroism spectrum of a sample with multiple CD peaks is shown below, demonstrating how CD varies as a function of wavelength, and that a CD spectrum may exhibit both positive and negative peaks. Circular dichroism spectra are measured using a circular dichroism spectrometer, such as the Chirascan, which is a highly specialised derivative of an ordinary absorption spectrometer. CD
Transcript of An introduction to circular dichroism spectroscopy...An introduction to circular dichroism...
An introduction to circular dichroism spectroscopy
Circular dichroism (CD) is the difference in the absorption of left‐handed circularly polarised
light (L‐CPL) and right‐handed circularly polarised light (R‐CPL) and occurs when a molecule
contains one or more chiral chromophores (light‐absorbing groups).
Circular dichroism = ΔA(λ) = A(λ)LCPL ‐ A(λ)RCPL, where λ is the wavelength
Circular dichroism (CD) spectroscopy is a spectroscopic technique where the CD of molecules is
measured over a range of wavelengths. CD spectroscopy is used extensively to study chiral
molecules of all types and sizes, but it is in the study of large biological molecules where it
finds its most important applications. A primary use is in analysing the secondary structure or
conformation of macromolecules, particularly proteins as secondary structure is sensitive to its
environment, temperature or pH, circular dichroism can be used to observe how secondary
structure changes with environmental conditions or on interaction with other molecules.
Structural, kinetic and thermodynamic information about macromolecules can be derived from
circular dichroism spectroscopy.
Measurements carried out in the visible and ultra‐violet region of the electro‐magnetic
spectrum monitor electronic transitions, and, if the molecule under study contains chiral
chromophores then one CPL state will be absorbed to a greater extent than the other and the
CD signal over the corresponding wavelengths will be non‐zero. A circular dichroism signal can
be positive or negative, depending on whether L‐CPL is absorbed to a greater extent than R‐
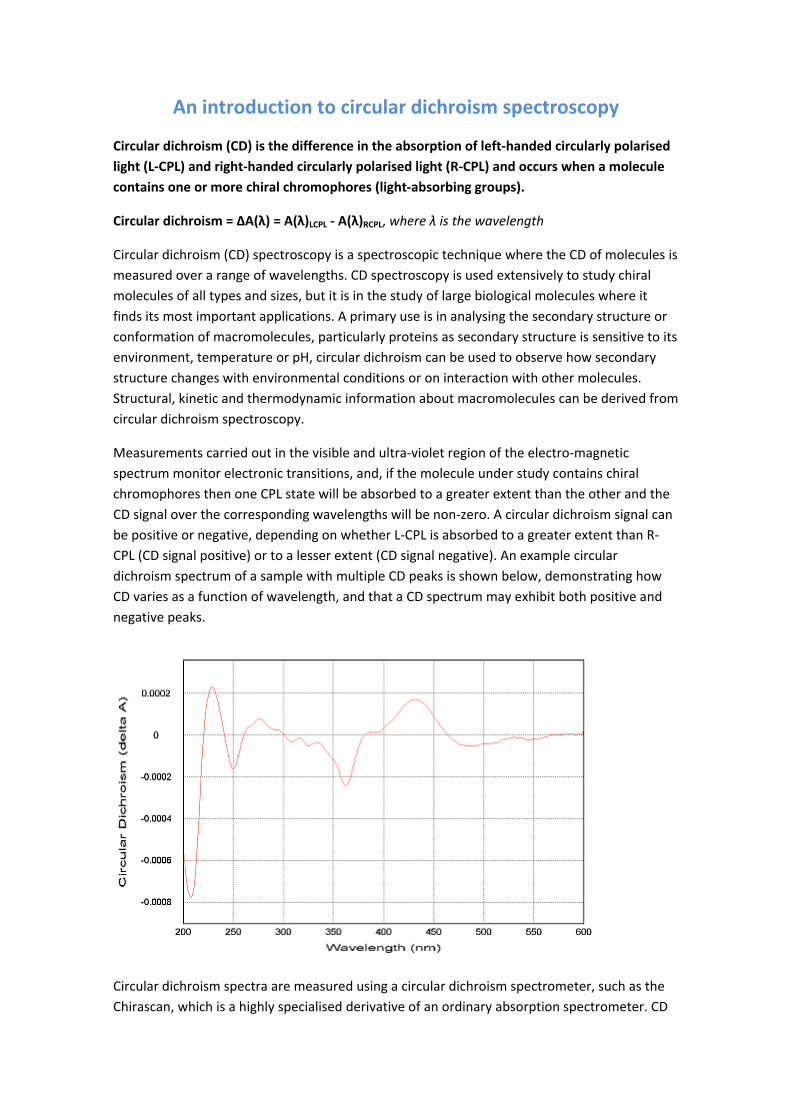
CPL (CD signal positive) or to a lesser extent (CD signal negative). An example circular
dichroism spectrum of a sample with multiple CD peaks is shown below, demonstrating how
CD varies as a function of wavelength, and that a CD spectrum may exhibit both positive and
negative peaks.
Circular dichroism spectra are measured using a circular dichroism spectrometer, such as the
Chirascan, which is a highly specialised derivative of an ordinary absorption spectrometer. CD
spectrometers measure alternately the absorption of L‐ and R‐CPL, usually at a frequency of
50kHz, and then calculate the circular dichroism signal.
1. Understanding Circular Dichroism
The basics of polarisation
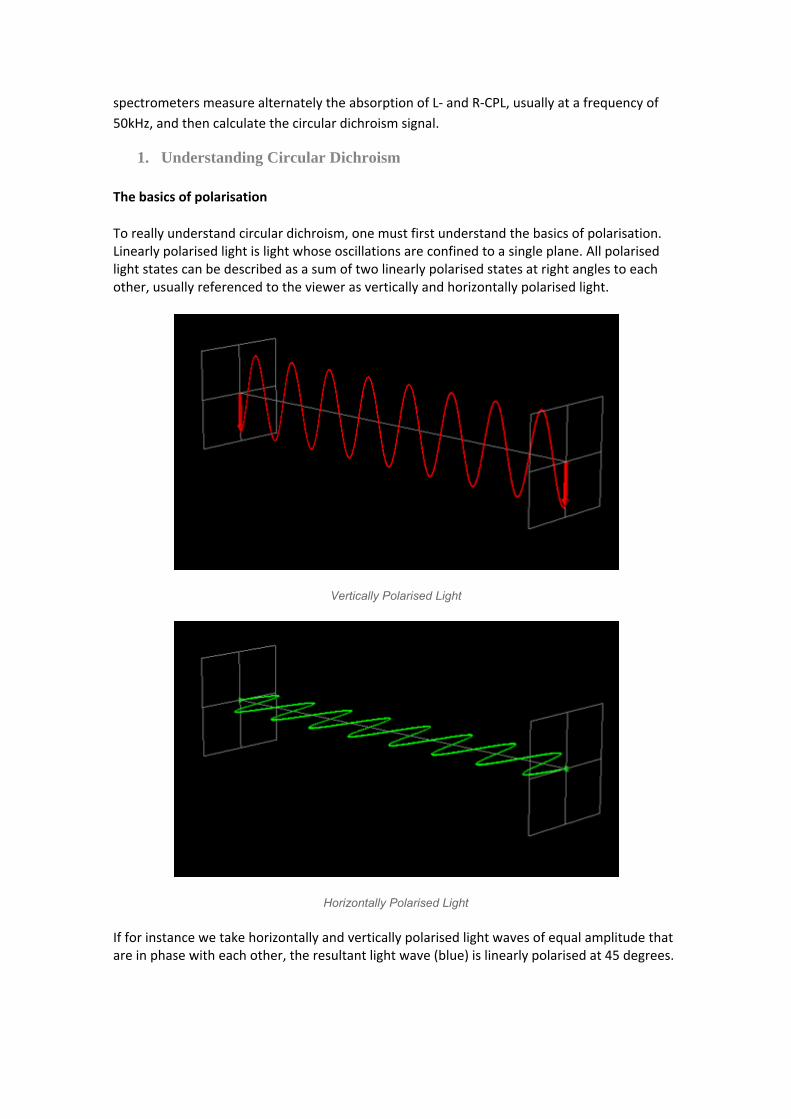
To really understand circular dichroism, one must first understand the basics of polarisation. Linearly polarised light is light whose oscillations are confined to a single plane. All polarised light states can be described as a sum of two linearly polarised states at right angles to each other, usually referenced to the viewer as vertically and horizontally polarised light.
Vertically Polarised Light
Horizontally Polarised Light
If for instance we take horizontally and vertically polarised light waves of equal amplitude that are in phase with each other, the resultant light wave (blue) is linearly polarised at 45 degrees.
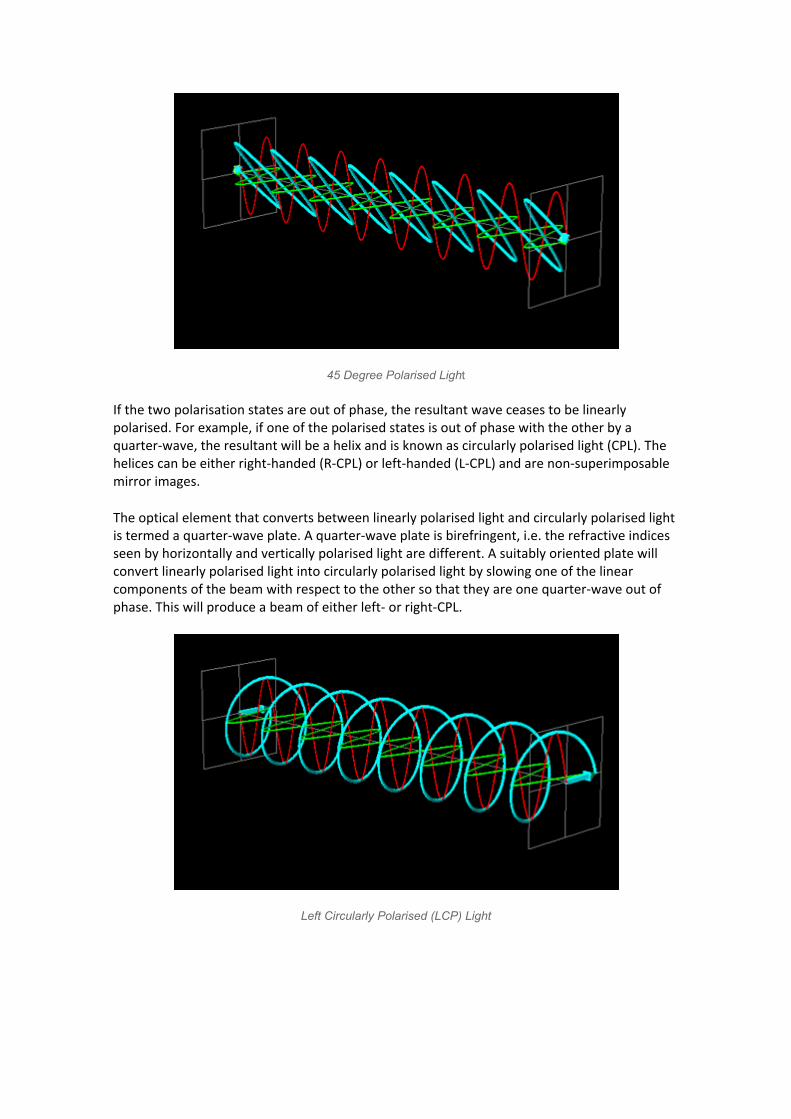
45 Degree Polarised Light
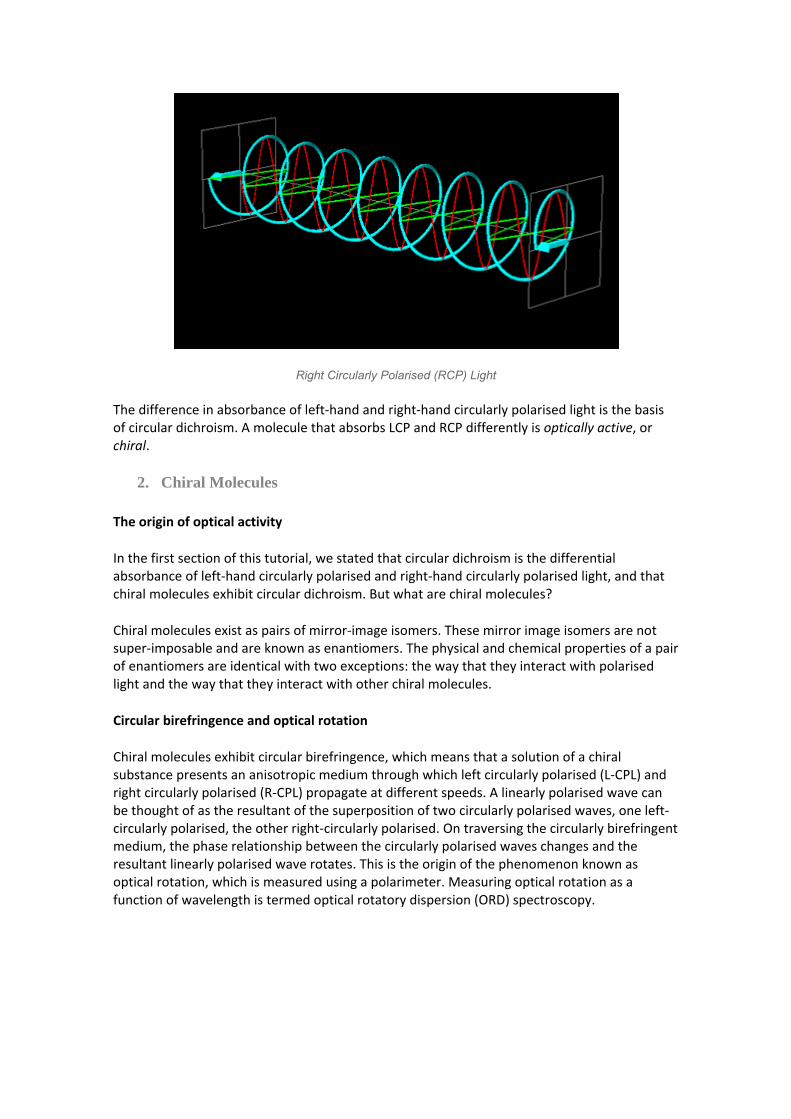
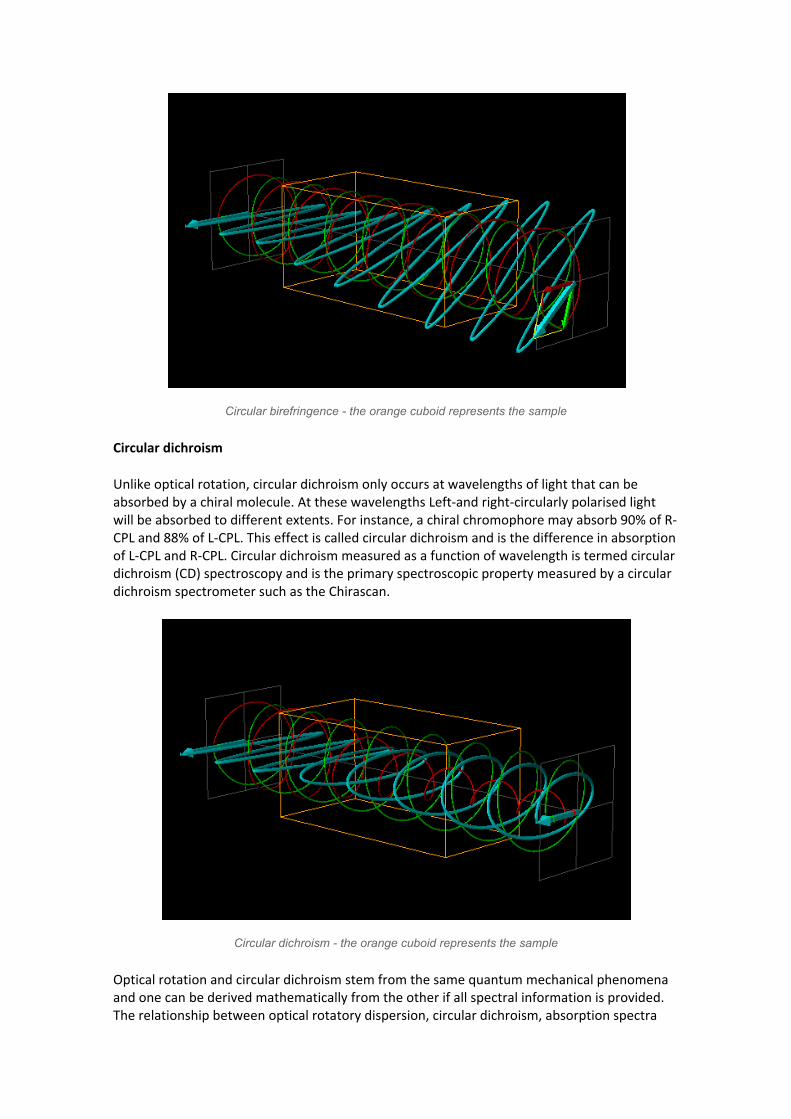
If the two polarisation states are out of phase, the resultant wave ceases to be linearly polarised. For example, if one of the polarised states is out of phase with the other by a quarter‐wave, the resultant will be a helix and is known as circularly polarised light (CPL). The helices can be either right‐handed (R‐CPL) or left‐handed (L‐CPL) and are non‐superimposable mirror images.
The optical element that converts between linearly polarised light and circularly polarised light is termed a quarter‐wave plate. A quarter‐wave plate is birefringent, i.e. the refractive indices seen by horizontally and vertically polarised light are different. A suitably oriented plate will convert linearly polarised light into circularly polarised light by slowing one of the linear components of the beam with respect to the other so that they are one quarter‐wave out of phase. This will produce a beam of either left‐ or right‐CPL.
Left Circularly Polarised (LCP) Light
Right Circularly Polarised (RCP) Light
The difference in absorbance of left‐hand and right‐hand circularly polarised light is the basis of circular dichroism. A molecule that absorbs LCP and RCP differently is optically active, or chiral.
2. Chiral Molecules
The origin of optical activity
In the first section of this tutorial, we stated that circular dichroism is the differential absorbance of left‐hand circularly polarised and right‐hand circularly polarised light, and that chiral molecules exhibit circular dichroism. But what are chiral molecules?
Chiral molecules exist as pairs of mirror‐image isomers. These mirror image isomers are not super‐imposable and are known as enantiomers. The physical and chemical properties of a pair of enantiomers are identical with two exceptions: the way that they interact with polarised light and the way that they interact with other chiral molecules.
Circular birefringence and optical rotation
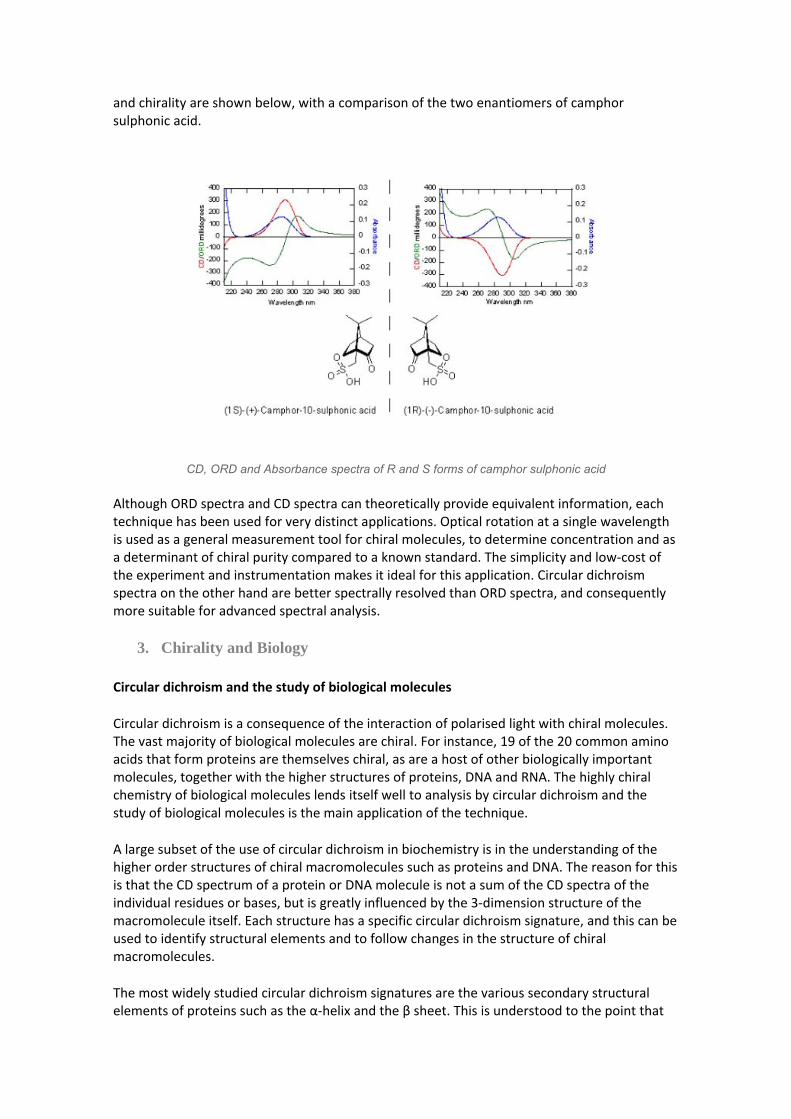
Chiral molecules exhibit circular birefringence, which means that a solution of a chiral substance presents an anisotropic medium through which left circularly polarised (L‐CPL) and right circularly polarised (R‐CPL) propagate at different speeds. A linearly polarised wave can be thought of as the resultant of the superposition of two circularly polarised waves, one left‐circularly polarised, the other right‐circularly polarised. On traversing the circularly birefringent medium, the phase relationship between the circularly polarised waves changes and the resultant linearly polarised wave rotates. This is the origin of the phenomenon known as optical rotation, which is measured using a polarimeter. Measuring optical rotation as a function of wavelength is termed optical rotatory dispersion (ORD) spectroscopy.
Circular birefringence - the orange cuboid represents the sample
Circular dichroism
Unlike optical rotation, circular dichroism only occurs at wavelengths of light that can be absorbed by a chiral molecule. At these wavelengths Left‐and right‐circularly polarised light will be absorbed to different extents. For instance, a chiral chromophore may absorb 90% of R‐CPL and 88% of L‐CPL. This effect is called circular dichroism and is the difference in absorption of L‐CPL and R‐CPL. Circular dichroism measured as a function of wavelength is termed circular dichroism (CD) spectroscopy and is the primary spectroscopic property measured by a circular dichroism spectrometer such as the Chirascan.
Circular dichroism - the orange cuboid represents the sample
Optical rotation and circular dichroism stem from the same quantum mechanical phenomena and one can be derived mathematically from the other if all spectral information is provided. The relationship between optical rotatory dispersion, circular dichroism, absorption spectra
and chirality are shown below, with a comparison of the two enantiomers of camphor sulphonic acid.
CD, ORD and Absorbance spectra of R and S forms of camphor sulphonic acid
Although ORD spectra and CD spectra can theoretically provide equivalent information, each technique has been used for very distinct applications. Optical rotation at a single wavelength is used as a general measurement tool for chiral molecules, to determine concentration and as a determinant of chiral purity compared to a known standard. The simplicity and low‐cost of the experiment and instrumentation makes it ideal for this application. Circular dichroism spectra on the other hand are better spectrally resolved than ORD spectra, and consequently more suitable for advanced spectral analysis.
3. Chirality and Biology
Circular dichroism and the study of biological molecules
Circular dichroism is a consequence of the interaction of polarised light with chiral molecules. The vast majority of biological molecules are chiral. For instance, 19 of the 20 common amino acids that form proteins are themselves chiral, as are a host of other biologically important molecules, together with the higher structures of proteins, DNA and RNA. The highly chiral chemistry of biological molecules lends itself well to analysis by circular dichroism and the study of biological molecules is the main application of the technique.
A large subset of the use of circular dichroism in biochemistry is in the understanding of the higher order structures of chiral macromolecules such as proteins and DNA. The reason for this is that the CD spectrum of a protein or DNA molecule is not a sum of the CD spectra of the individual residues or bases, but is greatly influenced by the 3‐dimension structure of the macromolecule itself. Each structure has a specific circular dichroism signature, and this can be used to identify structural elements and to follow changes in the structure of chiral macromolecules.
The most widely studied circular dichroism signatures are the various secondary structural elements of proteins such as the α‐helix and the β sheet. This is understood to the point that
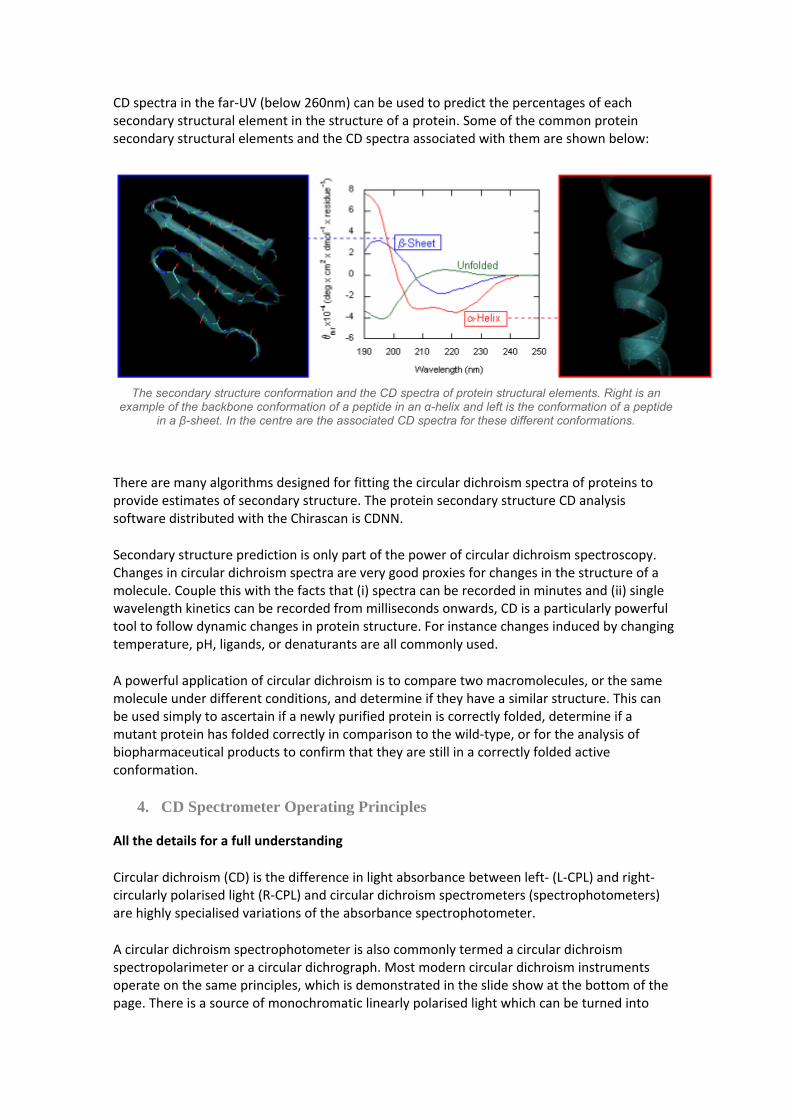
CD spectra in the far‐UV (below 260nm) can be used to predict the percentages of each secondary structural element in the structure of a protein. Some of the common protein secondary structural elements and the CD spectra associated with them are shown below:
The secondary structure conformation and the CD spectra of protein structural elements. Right is an example of the backbone conformation of a peptide in an α-helix and left is the conformation of a peptide
in a β-sheet. In the centre are the associated CD spectra for these different conformations.
There are many algorithms designed for fitting the circular dichroism spectra of proteins to provide estimates of secondary structure. The protein secondary structure CD analysis software distributed with the Chirascan is CDNN.
Secondary structure prediction is only part of the power of circular dichroism spectroscopy. Changes in circular dichroism spectra are very good proxies for changes in the structure of a molecule. Couple this with the facts that (i) spectra can be recorded in minutes and (ii) single wavelength kinetics can be recorded from milliseconds onwards, CD is a particularly powerful tool to follow dynamic changes in protein structure. For instance changes induced by changing temperature, pH, ligands, or denaturants are all commonly used.
A powerful application of circular dichroism is to compare two macromolecules, or the same molecule under different conditions, and determine if they have a similar structure. This can be used simply to ascertain if a newly purified protein is correctly folded, determine if a mutant protein has folded correctly in comparison to the wild‐type, or for the analysis of biopharmaceutical products to confirm that they are still in a correctly folded active conformation.
4. CD Spectrometer Operating Principles
All the details for a full understanding
Circular dichroism (CD) is the difference in light absorbance between left‐ (L‐CPL) and right‐circularly polarised light (R‐CPL) and circular dichroism spectrometers (spectrophotometers) are highly specialised variations of the absorbance spectrophotometer.
A circular dichroism spectrophotometer is also commonly termed a circular dichroism spectropolarimeter or a circular dichrograph. Most modern circular dichroism instruments operate on the same principles, which is demonstrated in the slide show at the bottom of the page. There is a source of monochromatic linearly polarised light which can be turned into
either left‐ or right‐circularly polarised light by passing it through a quarter‐wave plate whose unique axis is at 45 degrees to the linear polarisation plane as described in the section about polarised light.
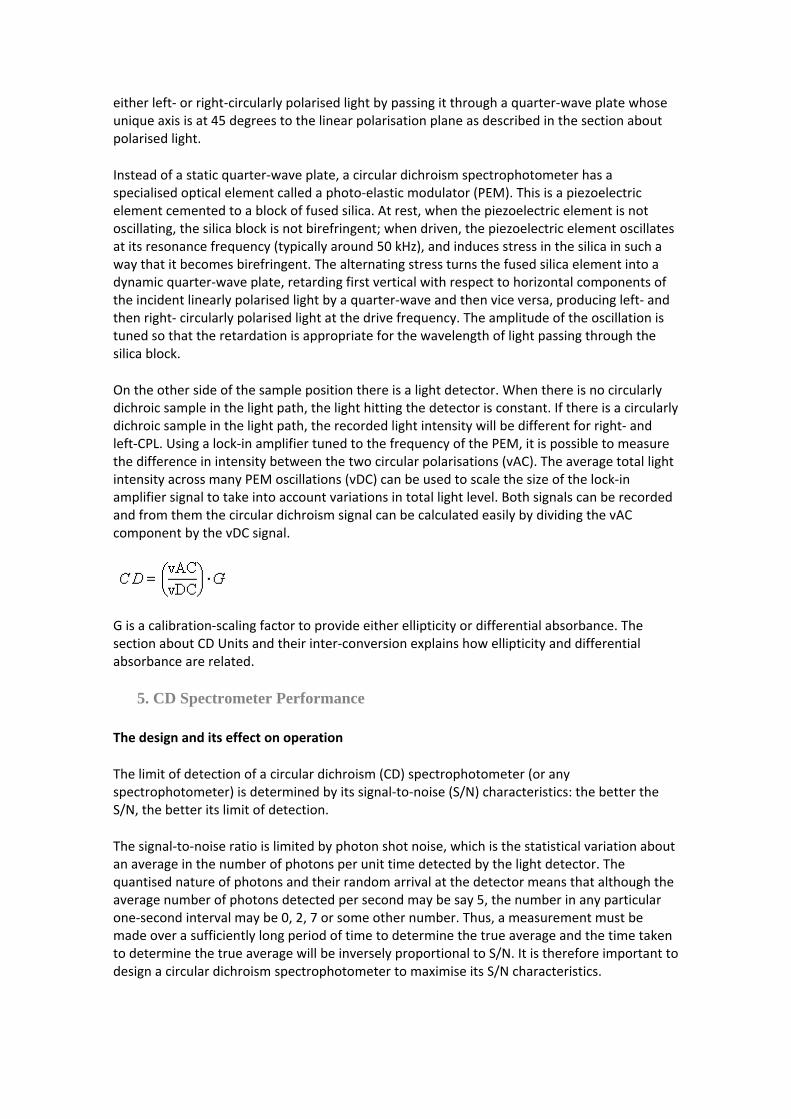
Instead of a static quarter‐wave plate, a circular dichroism spectrophotometer has a specialised optical element called a photo‐elastic modulator (PEM). This is a piezoelectric element cemented to a block of fused silica. At rest, when the piezoelectric element is not oscillating, the silica block is not birefringent; when driven, the piezoelectric element oscillates at its resonance frequency (typically around 50 kHz), and induces stress in the silica in such a way that it becomes birefringent. The alternating stress turns the fused silica element into a dynamic quarter‐wave plate, retarding first vertical with respect to horizontal components of the incident linearly polarised light by a quarter‐wave and then vice versa, producing left‐ and then right‐ circularly polarised light at the drive frequency. The amplitude of the oscillation is tuned so that the retardation is appropriate for the wavelength of light passing through the silica block.
On the other side of the sample position there is a light detector. When there is no circularly dichroic sample in the light path, the light hitting the detector is constant. If there is a circularly dichroic sample in the light path, the recorded light intensity will be different for right‐ and left‐CPL. Using a lock‐in amplifier tuned to the frequency of the PEM, it is possible to measure the difference in intensity between the two circular polarisations (vAC). The average total light intensity across many PEM oscillations (vDC) can be used to scale the size of the lock‐in amplifier signal to take into account variations in total light level. Both signals can be recorded and from them the circular dichroism signal can be calculated easily by dividing the vAC component by the vDC signal.
G is a calibration‐scaling factor to provide either ellipticity or differential absorbance. The section about CD Units and their inter‐conversion explains how ellipticity and differential absorbance are related.
5. CD Spectrometer Performance
The design and its effect on operation
The limit of detection of a circular dichroism (CD) spectrophotometer (or any spectrophotometer) is determined by its signal‐to‐noise (S/N) characteristics: the better the S/N, the better its limit of detection.
The signal‐to‐noise ratio is limited by photon shot noise, which is the statistical variation about an average in the number of photons per unit time detected by the light detector. The quantised nature of photons and their random arrival at the detector means that although the average number of photons detected per second may be say 5, the number in any particular one‐second interval may be 0, 2, 7 or some other number. Thus, a measurement must be made over a sufficiently long period of time to determine the true average and the time taken to determine the true average will be inversely proportional to S/N. It is therefore important to design a circular dichroism spectrophotometer to maximise its S/N characteristics.
A general relationship between the contributing factors to the signal‐to‐noise in an optical spectrometer can be written as:
where Q = detector quantum efficiency, I = light intensity, t = time scale of the measurement.
From this it is apparent there are three ways to improve the signal‐to‐noise of a circular dichroism spectrophotometer: increase the intensity of the incident linearly‐polarised monochromatic light, increase the quantum efficiency of the detector, or spend more time collecting and averaging data points.
The first two factors, light intensity and detector performance, are those that can be influenced by the design of a circular dichroism spectrophotometer and work together to lower the last factor, the time required to carry out a measurement. The higher the light throughput and better the detector efficiency, the less time it takes to collect quality data or, equally, the higher the quality of data that can be collected in time‐limited experiments such as stopped‐flow measurements.
Increasing the intensity of the incident light is the main avenue for increasing the performance of circular dichroism spectrophotometers and this finds its ultimate expression in the use of synchrotron light‐sources for CD spectroscopy. Synchrotron facilities provide tremendous light intensity across a very wide spectral range of wavelengths but access to them is expensive and limited and their use is restricted to the more cutting‐edge applications of circular dichroism. For the vast majority of CD experiments, a high‐intensity bench‐top source is the only practical option: Applied Photophysics Chirascan™ has been designed from the ground up to maximise the light throughput from its Xe arc‐lamp source to the sample.
The Chirascan™ monochromator uses two synthetic, single‐crystal quartz prisms instead of the diffraction gratings that most people are familiar with from normal absorbance spectrophotometers. Quartz prisms are more efficient than diffraction gratings for a very wide range of wavelengths, particularly in the UV. Quartz is also birefringent and the prisms not only disperse light into the component wavelengths but also, because of their birefringence, disperse the linearly polarised components, one of which is selected for conversion to circularly polarised light. A further advantage of prisms is they do not pass second‐order multiples of the desired wavelength, which is a major source of stray‐light in grating‐based monochromators.
Unlike the dispersion of a grating, which is linear and highly customisable, the dispersion of a prism is non‐linear and is set by the properties of the prism material. Consequently the optics and mechanics of a prism monochromator have to be more complex than a grating monochromator, with the need to constantly vary the slit‐width as a function of wavelength to maintain a constant band‐pass, and a complex relationship between prism movement and wavelength. However, the large wavelength dispersion in the UV means that wider slits can be used even at a small spectral band‐pass, which means greater light collection efficiency throughout the UV region. The large majority of circular dichroism applications are carried out in the UV and it is at these wavelengths that the characteristics of a prism are a major advantage.
In addition to the high intensity to improve signal‐to‐noise, the light from the monochromator must have a very low stray‐light content and a very high purity of linear polarisation to provide accurate measurements. All of these three key elements have been optimised in the Chirascan™ circular dichroism spectrophotometer and have been achieved by key design features of the Chirascan™ monochromator.
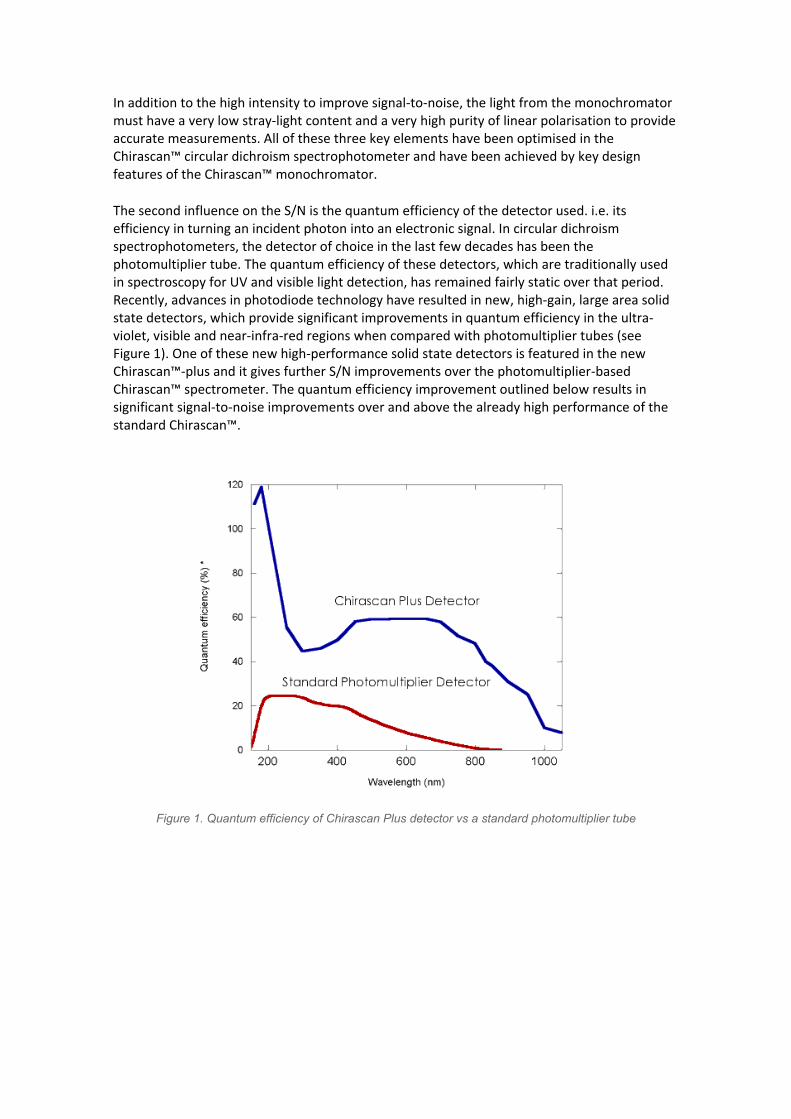
The second influence on the S/N is the quantum efficiency of the detector used. i.e. its efficiency in turning an incident photon into an electronic signal. In circular dichroism spectrophotometers, the detector of choice in the last few decades has been the photomultiplier tube. The quantum efficiency of these detectors, which are traditionally used in spectroscopy for UV and visible light detection, has remained fairly static over that period. Recently, advances in photodiode technology have resulted in new, high‐gain, large area solid state detectors, which provide significant improvements in quantum efficiency in the ultra‐violet, visible and near‐infra‐red regions when compared with photomultiplier tubes (see Figure 1). One of these new high‐performance solid state detectors is featured in the new Chirascan™‐plus and it gives further S/N improvements over the photomultiplier‐based Chirascan™ spectrometer. The quantum efficiency improvement outlined below results in significant signal‐to‐noise improvements over and above the already high performance of the standard Chirascan™.
Figure 1. Quantum efficiency of Chirascan Plus detector vs a standard photomultiplier tube
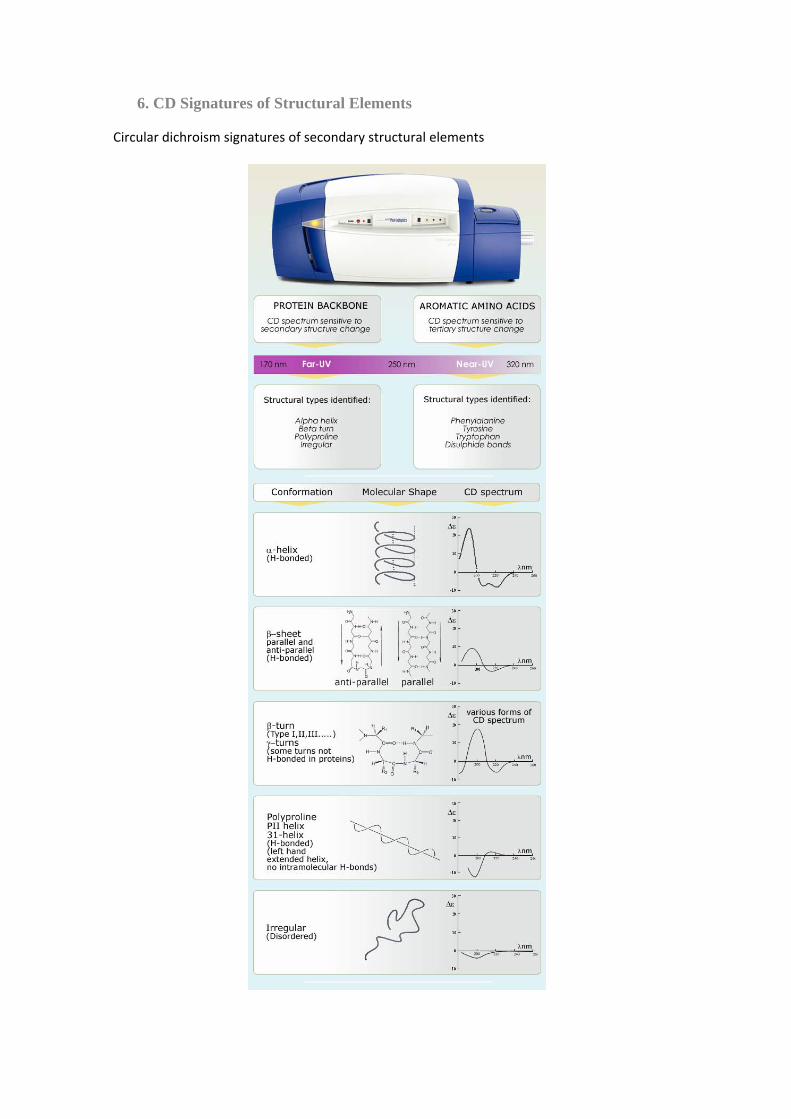
6. CD Signatures of Structural Elements
Circular dichroism signatures of secondary structural elements
7. CD Units & Conversions
All relationships explained Circular dichroism (CD) is usually understood and actually measured as the differential absorbance of left (ALCP) and right circularly polarised (ARCP) light, and so can be expressed as:
ΔA= ALCP ‐ ARCP
Taking into account cell pathlength and compound concentration, we can arrive at a molar circular dichroism (Δε).
Δε =εLCP ‐εRCP = ΔA/(C x l)
Where εLCP and εRCP are the molar extinction coefficients for LCP and RCP light respectively, C= molar concentration, and l = pathlength in centimeters.
Another important unit is mean residue molar circular dichroism ΔεMR. This is a unit specific for proteins, and reports the molar circular dichroism for individual protein residues instead of whole protein molecules. This allows easy comparison of different proteins with vastly different molecule weights. There are two ways to calculate this depending on how much information is known about the protein.
The concentration of protein (C) in molar is multiplied by the number of amino acids (N) in the protein to provide the mean residue concentration (CMR):
CMR = C x N
ΔεMR= ΔA/(CMR x l)
An estimate can be determined for CMR if the sequence of the protein isn't known, using the average amino acid residue weight of 113 daltons, and the concentration of protein (P) in gL‐1
CMR = P/113
ΔA and Δε are the most intuitive units for many biochemists, as they are derived from the familiar concept of UV/Vis absorbance spectroscopy, and it is also how modern CD instruments actually measure circular dichroism. CD can also be expressed as degrees of ellipticity (θ), which is a legacy of polarimetry, and such units are frequently used in the literature. In the context of modern CD spectroscopy, these units are archaic and can be confusing. The relationship between ΔA and θ are explained below.
The description of ellipticity is somewhat more complex than ΔA. Linearly polarised light when passed through a circular dichroic sample will become elliptically polarised. Elliptically polarised light is light that is not fully circular polarised, but instead is elliptical in shape. This is because the circular polarised components of the original linear polarised light are now not of equal magnitudes due to differential absorbance (circular dichroism). The effect is demonstrated below:
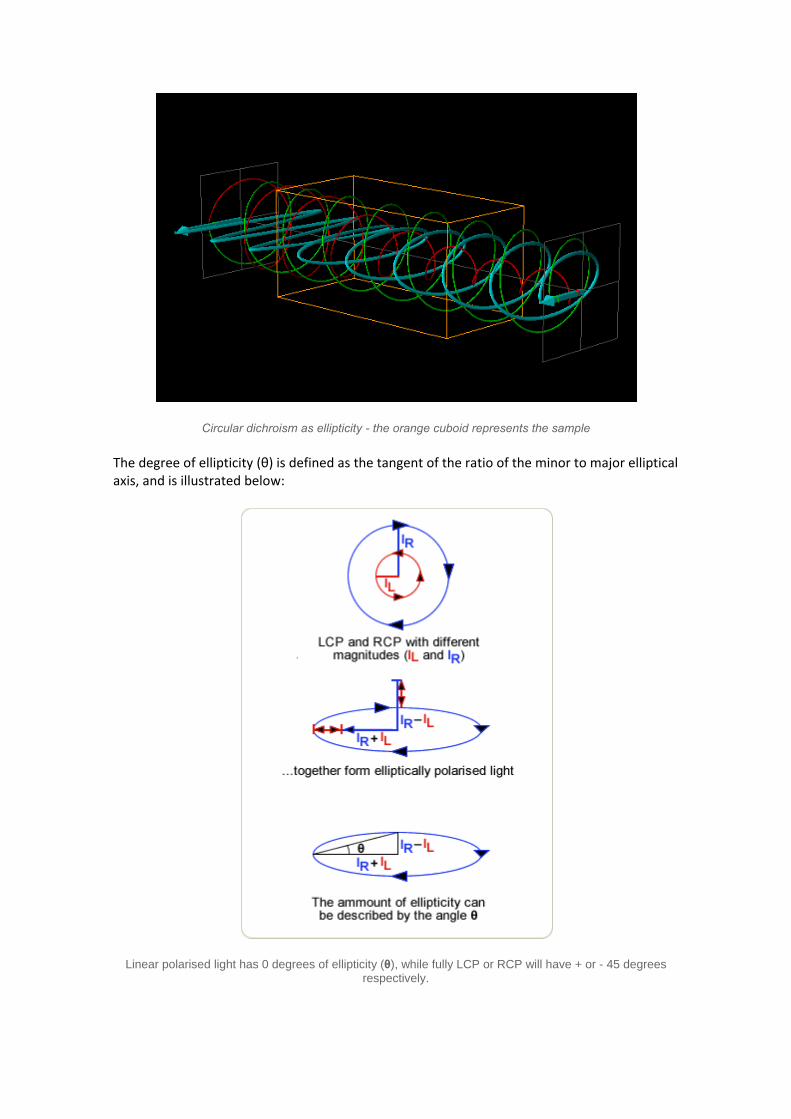
Circular dichroism as ellipticity - the orange cuboid represents the sample
The degree of ellipticity (θ) is defined as the tangent of the ratio of the minor to major elliptical axis, and is illustrated below:
Linear polarised light has 0 degrees of ellipticity (θ), while fully LCP or RCP will have + or - 45 degrees respectively.
The advantage of circular dichroism ellipticity as a measurement unit is that it is more easily related to optical rotation measurements and polarimetry. Both ellipticity and optical rotation are measurements of changes in polarisation state of a linear polarised analyzer beam, and both have the same units and similar amplitudes for a given sample. This similarity aids in comparison of optical rotation and circular dichroism measurements, a useful ability when circular dichroism spectroscopy first started to be widely used, back in the 1960's.
Fortunately it is very easy to inter‐convert between θ and ΔA:
ΔA = θ/32.982
Note: Due to the small size of many measurements, θ is often quoted as millidegrees (m˚) or 1/1000 of a degree.
Molar ellipticity can be manipulated in the same way as ΔA. For instance taking into account concentration and cell pathlength according to Beer Lamberts law, we can derive a measurement of molar ellipticity [θ]. Following polarimetric conventions, molar ellipticity is reported in degrees cm2 dmol–1, or degrees M‐1 m‐1 which are equivalent units as shown below.
Molar ellipticity can be calculated using the following equation:
[θ] = 100xθ/(Cxl)
C is the concentration in molar, and l the cell pathlength in cm. The factor of 100 converts to pathlength in meters.
Molar Circular dichroism and molar ellipticity can be converted directly by:
Δε = [θ]/3298.2
This factor is a hundred fold larger than between raw absorbance and ellipticity due to the conversion between molar extinction defining pathlengths in centimeters and ellipticity having pathlength defined in meters.
Another important unit is mean residue ellipticity [θ]MR. This is a unit specific for proteins, and reports the molar ellipticity for individual protein residues instead of whole protein molecules. This allows easy comparison of different proteins with vastly different molecule weights. There are two ways to calculate this depending on how much information is known about the protein.
The concentration or protein (C) in molar is multiplied by the number of amino acids (N) in the protein to provide the mean residue concentration (CMR):
CMR = C x N
[θ]MR= 100xθ/(CMR x l)
An estimate can be determined for CMR if the sequence of the protein isn't known, using the average amino acid residue weight of 113 daltons, and the concentration of protein (P) in gL‐1
CMR = P/113
Fortunately the Pro‐Data software for Chirascan can convert easily between all these units, with a minimum of user intervention.
We at Applied Photophysics hope that you have found the tutorial in circular dichroism a useful resource. If you want to find out more about Applied Photophysics' range of circular dichroism spectrometers, then please contact [email protected].