(5) ROSENGARTEN CORPORATION Pro forma balance sheet after 25% sales increase ($)(Δ,$)($)(Δ,$)...
23
(5) ROSENGARTEN CORPORATION Pro forma balance sheet after 25% sales increase ($) (Δ,$) ($) (Δ,$) Assets Liabilities and Owner's Equity Current assets Current liabilites Cash $200 $40 A/P $375 $75 A/R 550 110 Notes payable 100 0 Inventory 750 150 Total $475 $75 Total $1,500 $300 Long-term debt $800 $0 Fixed assets Owner's equity Net plant and Common stock $800 $0 equipment $2,250 $450 Retained earnings 1,100 110 Total $1,910 $110 Total 1
-
date post
19-Dec-2015 -
Category
Documents
-
view
216 -
download
1
Transcript of (5) ROSENGARTEN CORPORATION Pro forma balance sheet after 25% sales increase ($)(Δ,$)($)(Δ,$)...
1
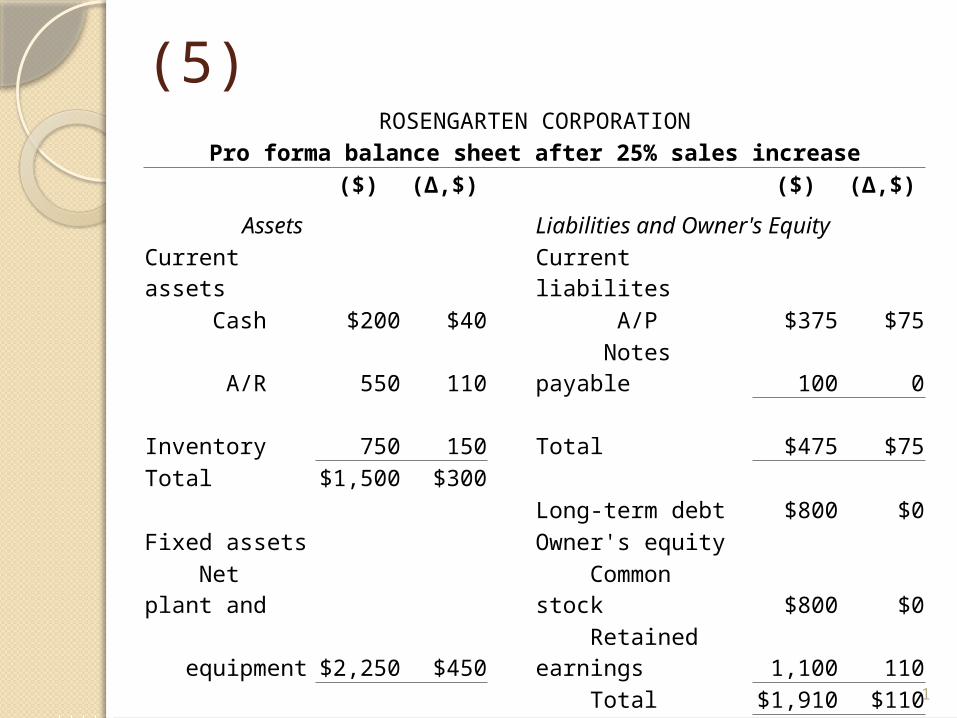
(5)ROSENGARTEN CORPORATION
Pro forma balance sheet after 25% sales increase($) (Δ,$) ($) (Δ,$)
Assets Liabilities and Owner's Equity
Current assets Current liabilites Cash $200 $40 A/P $375 $75
A/R 550 110 Notes payable 100 0 Inventory 750 150 Total $475 $75Total $1,500 $300
Long-term debt $800 $0Fixed assets Owner's equity Net plant and Common stock $800 $0 equipment $2,250 $450 Retained earnings 1,100 110
Total $1,910 $110
Total assets $3,750 $750Total liabilities and shareholder's equity $3,185 $185External financing needed $565
2
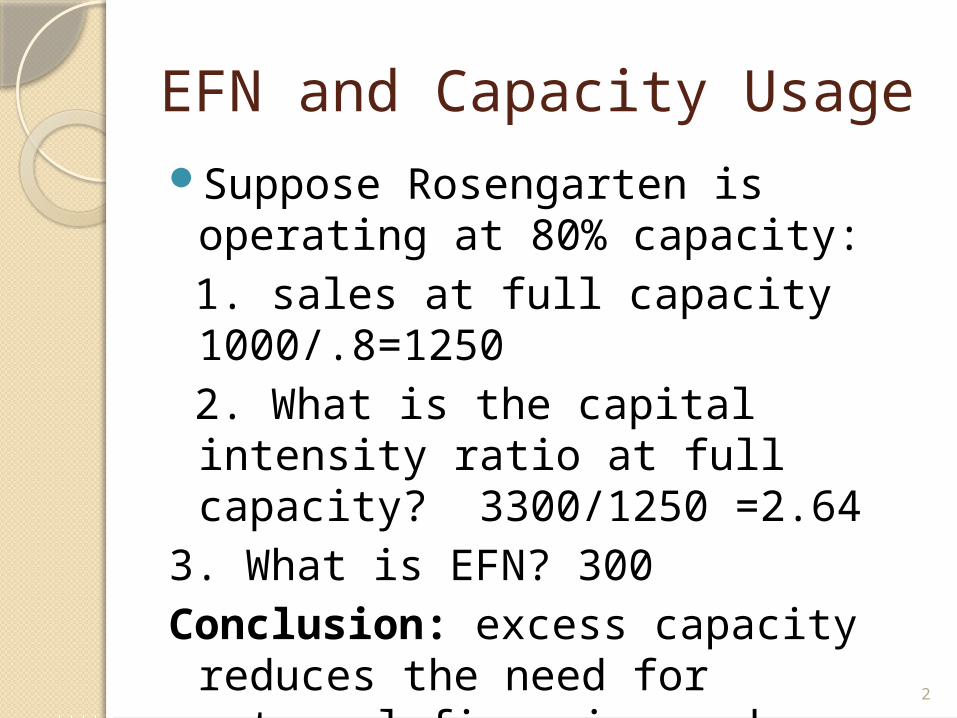
EFN and Capacity UsageSuppose Rosengarten is
operating at 80% capacity: 1. sales at full capacity
1000/.8=1250 2. What is the capital intensity
ratio at full capacity? 3300/1250 =2.64
3. What is EFN? 300Conclusion: excess capacity
reduces the need for external financing and capital intensity ratio
http://www.potashcorp.com/stakeholder_communications/2010/09/07/774/

SOME LESSONS FROM CAPITAL MARKET HISTORYHTTP://WWW.YOUTUBE.COM/WATCH?V=MZJMTCYMO9G
Chapter 12
3
Chapter OverviewReturn of an investment: arithmetic
and geometric
The variability of returns
Efficiency of capital markets
4
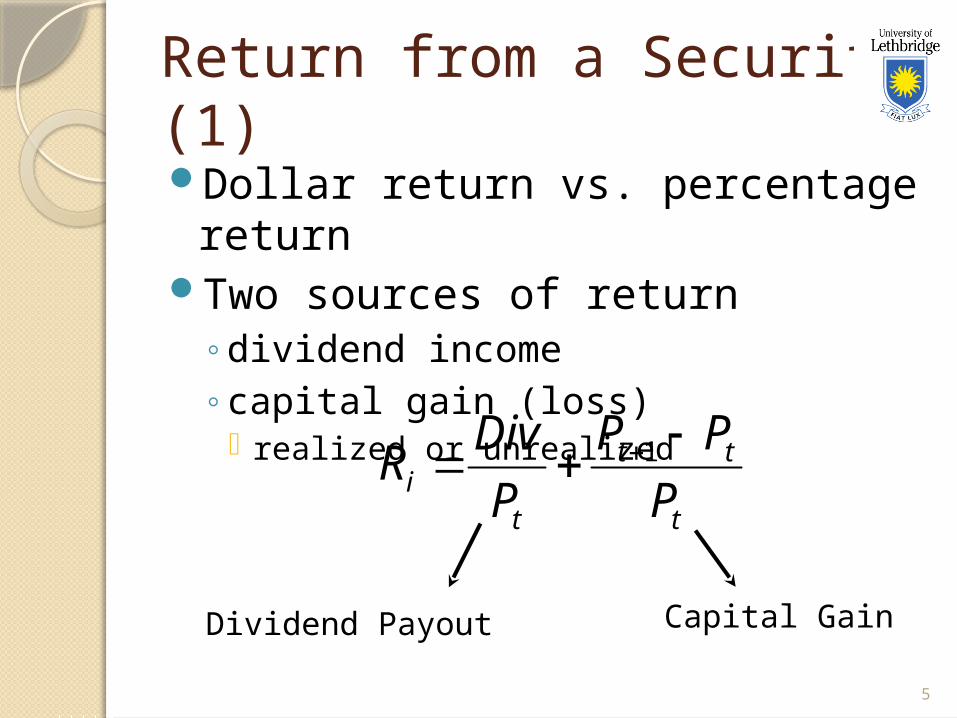
Return from a Security (1)Dollar return vs. percentage
returnTwo sources of return
◦dividend income◦capital gain (loss)
realized or unrealized
5
Dividend Payout Capital Gain
t
tt
ti P
PP
P
DivR
1
MeanAssume the distribution is normal
Mean return - the most likely return
A measure of centrality
Best estimator of future expected returns
6
The First LessonThe difference between T-bills and
other investment classes can be interpreted as a measure of the excess return on the risky asset
7
Risk premium = the excess return required from an investment in a risky asset over a risk-free investment
Arithmetic vs. Geometric Averages (1)
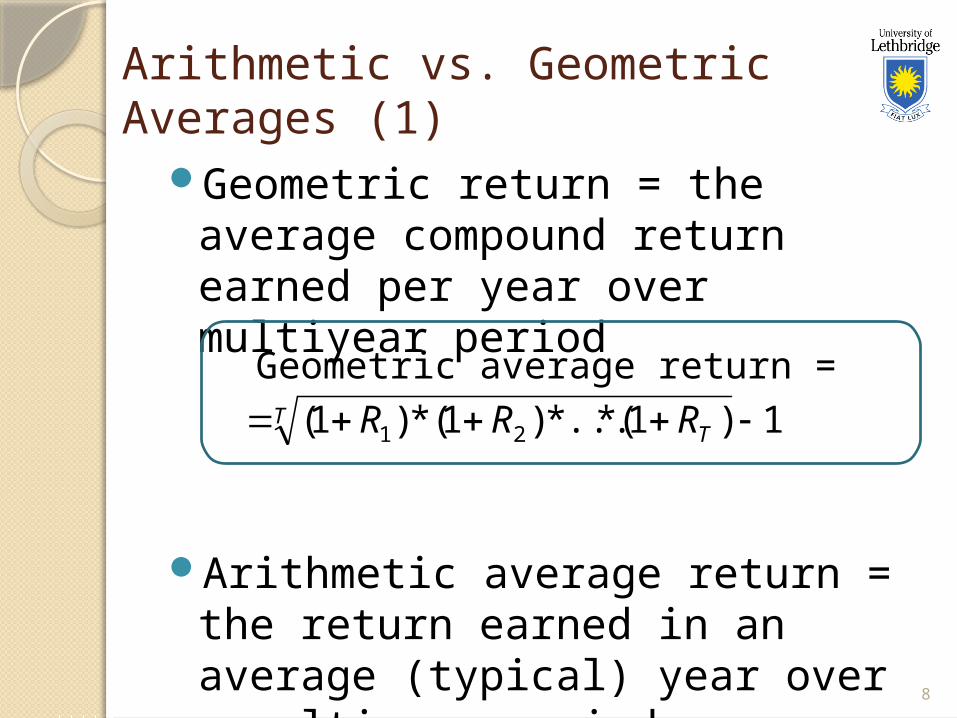
Geometric return = the average compound return earned per year over multiyear period
Arithmetic average return = the return earned in an average (typical) year over a multiyear period
8
Geometric average return = 1)1(*...*)1(*)1( 21 T
TRRR
Arithmetic vs. Geometric Averages (2)The geometric average tells what an
investor has earned per year on average, compounded annually.
The geometric average is smaller than the arithmetic (exception: 0 variability in returns)
Geom. average ≈ arithmetic average – Var/2
9
Which Average to Use? Geometric mean is appropriate for
making investment statements about past performance and for estimating returns over more than 1 period
Arithmetic mean is appropriate for making investment statements in a forward-looking context and for estimating average return over 1 period horizon
10
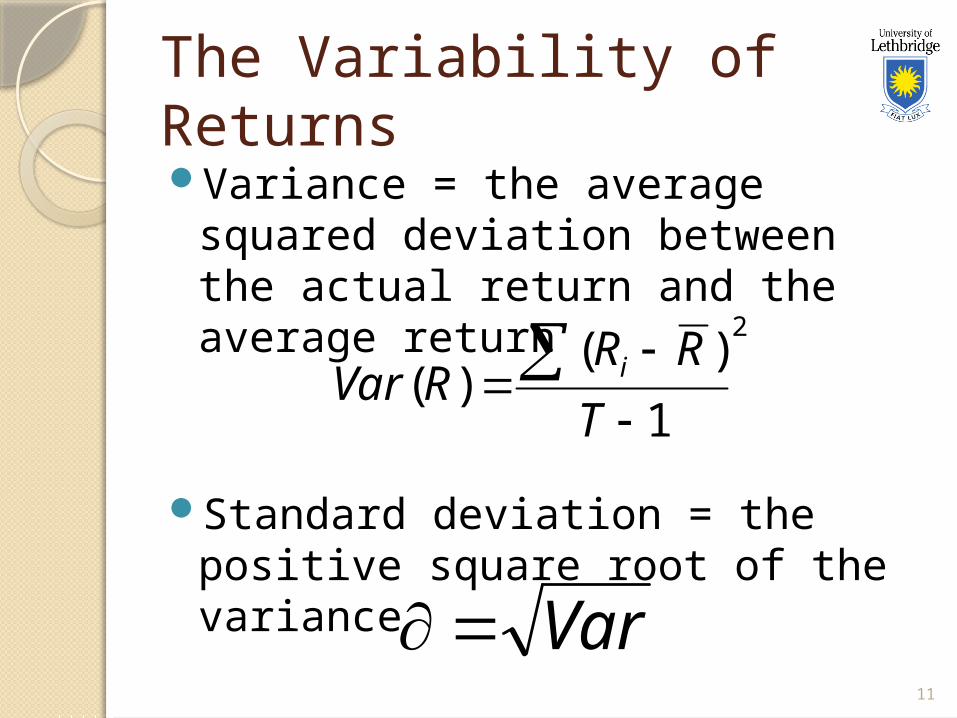
The Variability of ReturnsVariance = the average squared
deviation between the actual return and the average return
Standard deviation = the positive square root of the variance
11
2
1
)()(
T
RRRVar i
Var
Standard DeviationMeasure of dispersion of the
returns’ distribution
Used as a measure of risk
Can be more easily interpreted than the variance because the standard deviation is expressed in the same units as observations
12
The Normal Distribution (1)A symmetric, bell-shaped
frequency distribution
Can be completely described by the mean and standard deviation
13
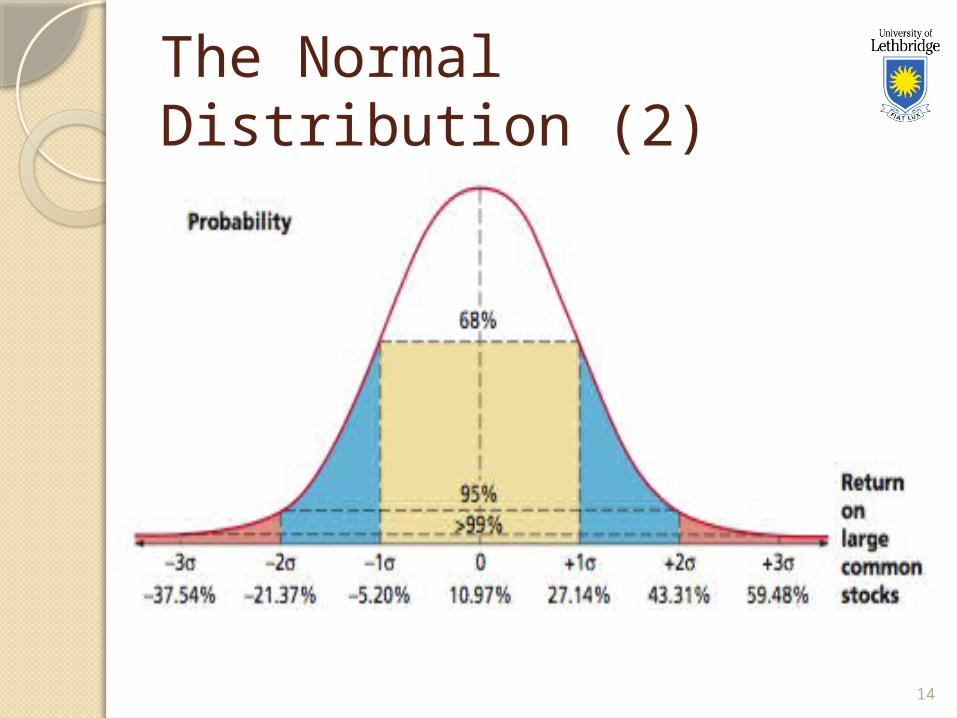
The Normal Distribution (2)
14
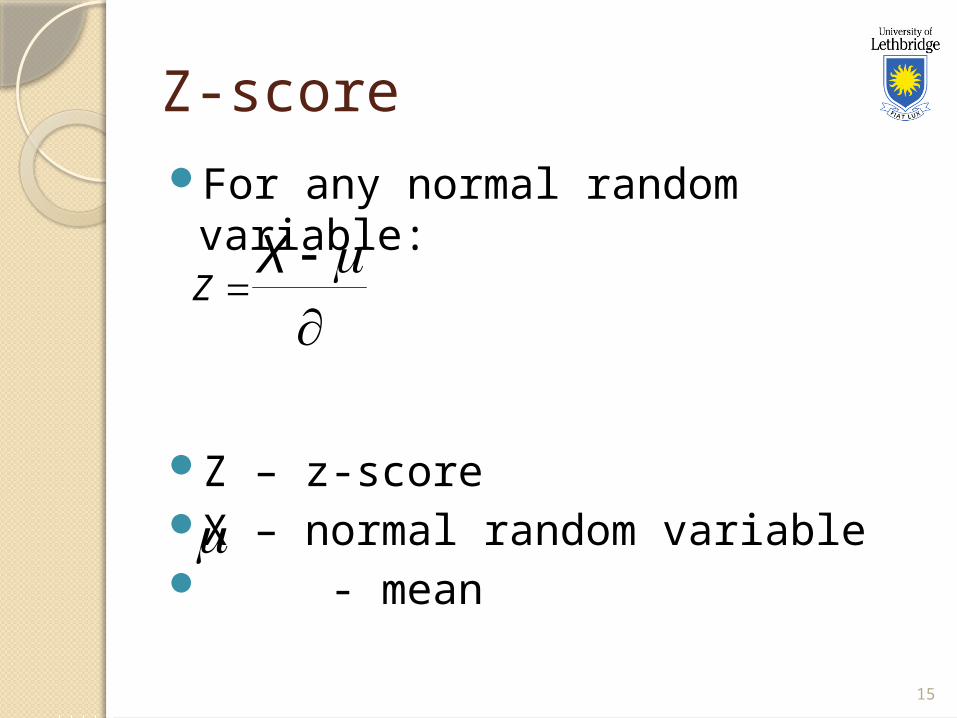
Z-scoreFor any normal random variable:
Z – z-scoreX – normal random variable - mean
15
X
Z
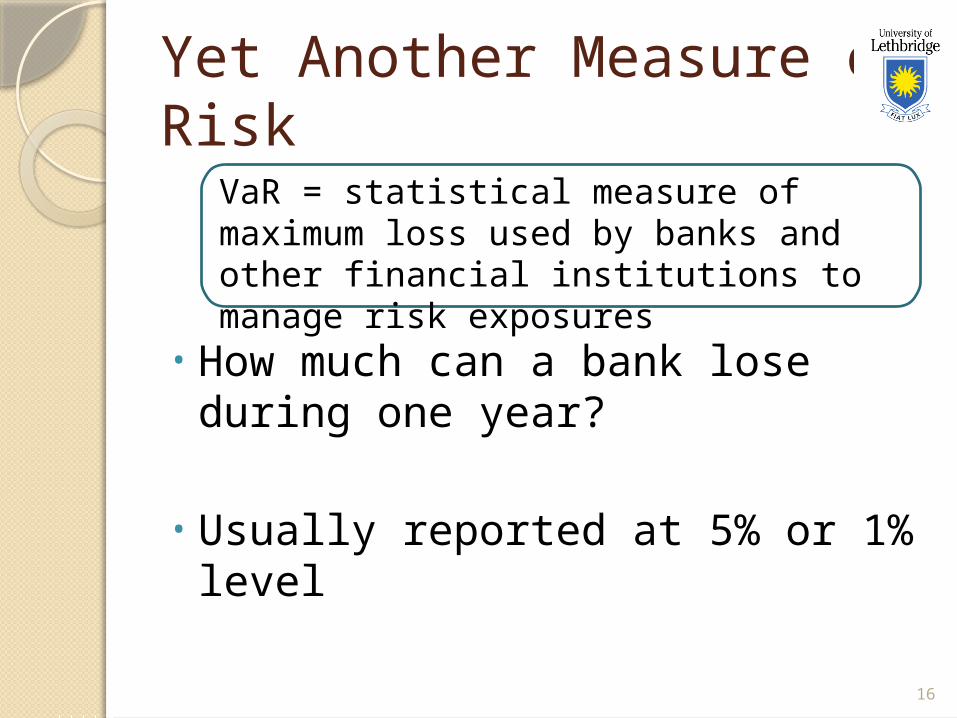
Yet Another Measure of Risk
• How much can a bank lose during one year?
• Usually reported at 5% or 1% level
16
VaR = statistical measure of maximum loss used by banks and other financial institutions to manage risk exposures

The Second LessonThe greater the potential reward
the greater the risk
Which types of securities have higher potential reward?
17
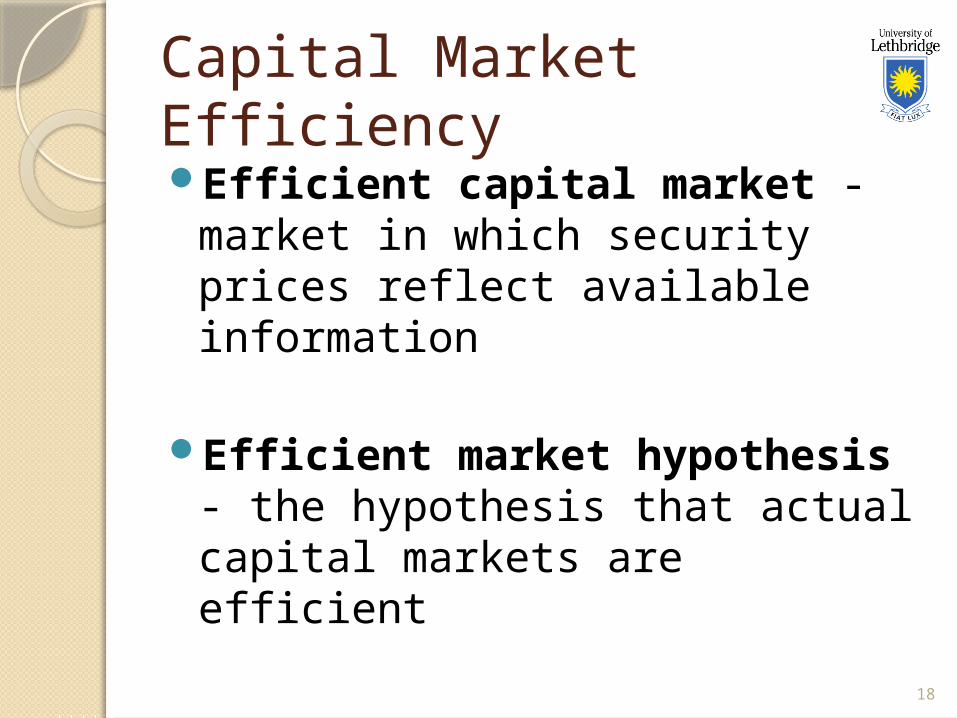
Capital Market EfficiencyEfficient capital market -
market in which security prices reflect available information
Efficient market hypothesis - the hypothesis that actual capital markets are efficient
18
What assumptions imply efficient capital market?1. Large number of profit-
maximizing participants analyze and value securities
2. New information about the securities come in random fashion
3. Profit-maximizing investors adjust security price rapidly to reflect the effect of new information
19
Forms of Market EfficiencyWeak form – the current price of
a stock reflects its own past prices
Semistrong form – all public information is reflected in stock price
Strong form – all information (private and public) is reflected in stock prices
20
Weak Form EfficiencyCurrent stock price reflects all security
market informationYou should gain little from the use of
any trading rule that decides whether to buy/sell security based on the passed security market data
Major markets (TSX, NYSE, NASDAQ) are at least weak form efficient
January effect
21
Semistrong Form EfficiencyMutual fund managers have no special
ability to beat the market
Event studies (IPO, stock splits) support the semistrong hypothesis
Quarterly earnings surprise – test results indicate abnormal returns during 13-26 weeks following the announcement of large unanticipated earnings change (earnings surprise) in a company 22
Strong Form EfficiencyNo group of investors has access to
private information that will allow them to consistently experience above average profits
Evidence shows that corporate insiders and stock exchange specialists are able to derive above-average profits
23