EUROSYSTEM Special Conference Paper - bankofgreece.gr · In this stage, the return on equity breaks...
43
BANK OF GREECE EUROSYSTEM Special Conference Paper Special Conference Paper FEBRUARY 2011 Analysis of the Albanian banking system in a risk-performance framework Irini kalluci 8
-
Upload
hoangkhuong -
Category
Documents
-
view
218 -
download
0
Transcript of EUROSYSTEM Special Conference Paper - bankofgreece.gr · In this stage, the return on equity breaks...
BANK OF GREECE
EUROSYSTEM
Special Conference PaperSpecial Conference Paper
FEBRUARY 2011
Analysis of the Albanian banking system in a risk-performance framework
Irini kalluci
8
BANK OF GREECE Economic Research Department – Special Studies Division 21, Ε. Venizelos Avenue GR-102 50 Athens Τel: +30210-320 3610 Fax: +30210-320 2432 www.bankofgreece.gr Printed in Athens, Greece at the Bank of Greece Printing Works. All rights reserved. Reproduction for educational and non-commercial purposes is permitted provided that the source is acknowledged. ISSN 1792-6564
Editorial
On 19-21 November 2009, the Bank of Greece co-organised with the Bank of
Albania the 3rd Annual South-Eastern European Economic Research Workshop held at its
premises in Athens. The 1st and 2nd workshops were organised by the Bank of Albania
and took place in Tirana in 2007 and 2008, respectively. The main objectives of these
workshops are to further economic research in South-Eastern Europe (SEE) and extend
knowledge of the country-specific features of the economies in the region. Moreover, the
workshops enhance regional cooperation through the sharing of scientific knowledge and
the provision of opportunities for cooperative research.
The 2009 workshop placed a special emphasis on three important topics for central
banking in transition and small open SEE economies: financial and economic stability;
banking and finance; internal and external vulnerabilities. Researchers from central banks
participated, presenting and discussing their work.
The 4th Annual SEE Economic Research Workshop was organised by the Bank of
Albania and took place on 18-19 November 2010 in Tirana. An emphasis was placed
upon the lessons drawn from the global crisis and its effects on the SEE macroeconomic
and financial sectors; adjustment of internal and external imbalances; and the new
anchors for economic policy.
The papers presented, with their discussions, at the 2009 SEE Workshop are being
made available to a wider audience through the Special Conference Paper Series of the
Bank of Greece.
Here we present the paper by Irini Kalluci (Bank of Albania).
February, 2011
Altin Tanku (Bank of Albania) Sophia Lazaretou (Bank of Greece) (on behalf of the organisers)

ANALYSIS OF THE ALBANIAN BANKING SYSTEM IN A RISK-PERFORMANCE FRAMEWORK
Irini Kalluci Bank of Albania
ABSTRACT The banking industry is the most important element of the Albanian financial system and therefore it requires more attention when it comes to financial analysis. This paper handles theoretically and analytically some indicators of risk and performance, and for the first time ever, it presents a methodology for measuring a risk index for the Albanian banking system. Its aim is not simply to analyse some financial indicators or measures of risk and return, but, more importantly, to suggest some indicators and a risk index that may be helpful to supervisors during their work.
Keywords: banking system, financial ratio analysis, DuPont model, risk index. JEL Classification: G21, G32
Acknowlegments: I would like to acknowledge helphul discussions with the workshop partcipants. I am mostly grateful to my discussants Rajna Hoxholli and Sofika Note for their constructive comments that helped me to improve the paper. The views expressed here are those of the author and do not necessarily reflect those of the Bank of Greece and the Bank of Albania. I alone am responsible for the remaining errors and omissions.
Correspondence: Irini Kalluci Research Department, Sheshi “Skënderbej”, No.1, Tirana, Albania. Tel: ++355 42 222 152 Email: [email protected]

1. Introduction
Recently, as a consequence of the difficulties financial markets have been
experiencing since 2007, more attention has been dedicated to issues concerning the
safety and stability of the financial system as a whole and notably the banking sector, as
its cornerstone, in particular. The measures for tougher supervision and greater caution
regarding banks’ risk-performance analysis have increased. This analysis is helpful and
of a great interest for all stakeholders, and not only for the regulators and supervisors.
Differing from the traditional method of analysing banking indicators, as used in annual
supervision reports, this paper provides additional elements, seen from a different
perspective, for the Albanian banking system.
The paper is as follows. Section 2 decomposes the ROE ratio by using the modified
DuPont model and identifies the factors affecting this indicator. In Section 3, a matrix of
indicators useful for the financial analysis of the banking system is constructed. Section 4
presents the methodology applied and assess, for the first time ever, a Risk Index for the
Albanian banking system, based on the model firstly developed by Hannan and Hanweck
(1988) and then applied by several authors. Section 5 concludes.
2. Financial ratios analysis using the modified DuPont model
Measuring and analysing the ratios that provide a clear picture of a banks’ financial
position is becoming more and more important, most notably when efforts to preserve
financial stability are at the fore. Furthermore, a preliminary analysis of the financial
indicators gives a picture of the banking sector and can highlight weaknesses which could
reveal themselves in the future.
2.1. The DuPont Model at a glance
The starting point for the measurement of a financial indicator and the analysis of
an enterprise (or industry) is the rate of return on equity (ROE), which shows the
profitability provided over a certain period from the shareholders’ point of view.
7
The DuPont Model established since 1919, is broadly used nowadays by almost all
industries and acts as the basic model whereby a detailed analysis of the return on equity
and the factors that affect it, is made possible. The reason why this model has persisted
over time relates to the fact that it serves two main purposes. First, it allows us to perform
an analysis of the components that affect profitability and make a comparison between
two businesses and/or with the industry aggregate. And, second, it facilitates trend
analysis which is useful for detecting the source of a shift in profitability and taking
corrective action before it is too late (Walker 2007). Or, as Jablonsky and Barsky (2001)
succinctly put it, “The DuPont model is a way of visualizing the information so that
everyone can see it.”
The DuPont model breaks ROE down into several components by following three
stages:
First stage
In this stage, the return on equity breaks down into two elements, i.e. the return on
assets (ROA) and financial leverage (or the so called equity multiplier - EM):
ROE = ROA * EM (1)
Second stage
The second stage of ROE decomposition consists of breaking down ROA into two other
components, respectively profit margin (PM) and asset utilization (AU):
ROA = PM * AU (2)
Third stage
At this stage some new ratios are created, starting from the components of the numerator
or the denominator of the indicators generated in the previous stages and adapted to the
specific characteristics of each industry.
2.2 The methodology of decomposing ROE
Cole (1972) was the first that adapted and applied the DuPont model for banks. The
banking system operates like any other industry in a regulated, supervised and
competitive market. It has its own products and services that distinguish it from other
8
industries. The financial statements of the banking sector also differ from those of other
sectors, with regard to the peculiarities that characterize banking activity. As a
consequence, the financial or economic ratios of efficiency and performance of banking
operations take on another meaning when they are calculated for this sector.
Cole (1972) deemed that there are other more realistic ways for banks to measure
performance than just net income growth or net income per share. He suggested another
indicator that might be used, namely the ratio of the return on shareholders’ equity, as the
basic element where all financial analyses originate and expand. As may be seen in
equation (3), this ratio shows the net income generated from the capital invested in the
bank. A high value of ROE usually indicates a more stable and safe positon of the bank.
But a higher value of this indicator may be caused by a lower level of shareholders’
equity (which is not a preferable situation) or by a higher level of net income for that
period. On the other hand, simultaneous negative values of shareholders’ equity and net
income would result in positive values of ROE, i.e.
BVEEATROE ==
equity of Book valuesafter taxe Earnings
(3)
In these circumstances, in order to avoid the misleading picture that the return on
equity may draw sometimes, the indicator that measures how efficiently the shareholders’
equity is used, may be broken down into two components (EM and ROA)1. ROA is
decomposed into two further elements (PM and AU), i.e.2
BVETAEM ==
equity of Book valueassets Total
(4)
The equity multiplier (EM) indicates the total assets the banks have available per
unit of equity invested by the shareholders. It is the inverse of the book value of equity to
total assets ratio which shows the level of banks’ capitalization. In effect, EM provides
the necessary information for the financial leverage of the bank, while the ratio (1-1/EM),
i.e, debt/total assets, shows the level of the bank’s liabilities. A higher value of the equity
1 See equation (1). 2 See equation (2).
9
multiplier indicates that the bank is financed more by debt (which means that the banking
sector is accepting more deposits but it has also more opportunities for generating
income).
The return on assets (ROA) may be expressed as:
Earnings after taxesTotal assets
EATROATA
= = (5)
ROA indicator shows how effectively the bank’s assets are used to generate higher
income. A higher value of ROA confirms that the bank has appropriately formed its
assets portfolio, contributing to higher financial results.
It is better to look at both the financial ratios ROA and ROE. Even though they
differ from each other and they express different things, they both remain two indicators
of management efficiency towards generating income from the money invested by the
shareholders and the total investments made in assets, as well. ROE does not provide an
indication for the bank’s financing through borrowing, whereas ROA does. This is why
both indicators complement each other.
Several authors have decomposed ROA into two important elements in order to
make financial analysis deeper and identify its determinant factors:
Earnings after taxesTotal operating incomes
EATPMTOI
= = (6)
and
TATOIAU ==
assets Total incomes operating Total (7)
Profit margin shows the relationship between the earnings after taxes and the total
operating income of the banking system. Cole (1972) suggests breaking down the
numerator of the ratio into income and expenses components and expressing it as a
proportion of total operating income, in order to identify which of those items contributes
more to profit margin.
10
While the second element, namely the asset utilization ratio (AU), shows the
connection between total operating income and total (average) assets, it creates an
indicator of gross return on average assets.
In this paper, we try to perform a more detailed analysis of the return on assets by
using a combination of two models, i.e. the one suggested by Koch and MacDonald
(2002), and the other suggested by Vensel et al. (2004). Both models can be considered
extensions and modifications of the DuPont model. More indicators than those included
in the DuPont model can now be assessed, presenting thus a more comprehensive
framework for the analysis of the factors that affect the banking system’s profitability.
Initially, Koch and MacDonald (2002) formulate ROE indicator as a combination
of ROA and EM. Afterwards, they break it down into two indicators, one for the bank’s
ability to generate income and the other for the ability to control expenses, as the
following equation shows:
ROA = AU – ER (8)
where AU is the above-mentioned asset utilization ratio and ER stands for the
expense ratio. While the first indicator (AU) operates as an approximation of income
management, the second one (ER) expresses the quality of expenses management.
Following equation (8), the indicators of AU and ER3 may be broken down into:
TANIRIR
TATOIAU +
== (9)
and
ER = TA
TOE = TA
TLLPNIEIE +++ (10)
The components of both total operating income and expenses as a proportion of
average total assets, after some transformations, form some important indicators that
should be further analysed. Thus, ROA may be written as:
ROA = AU –ER =TA
TLLPNNIINIITA
TLLPNIENIRIEIR −−+=
−−−+− )()( (11)
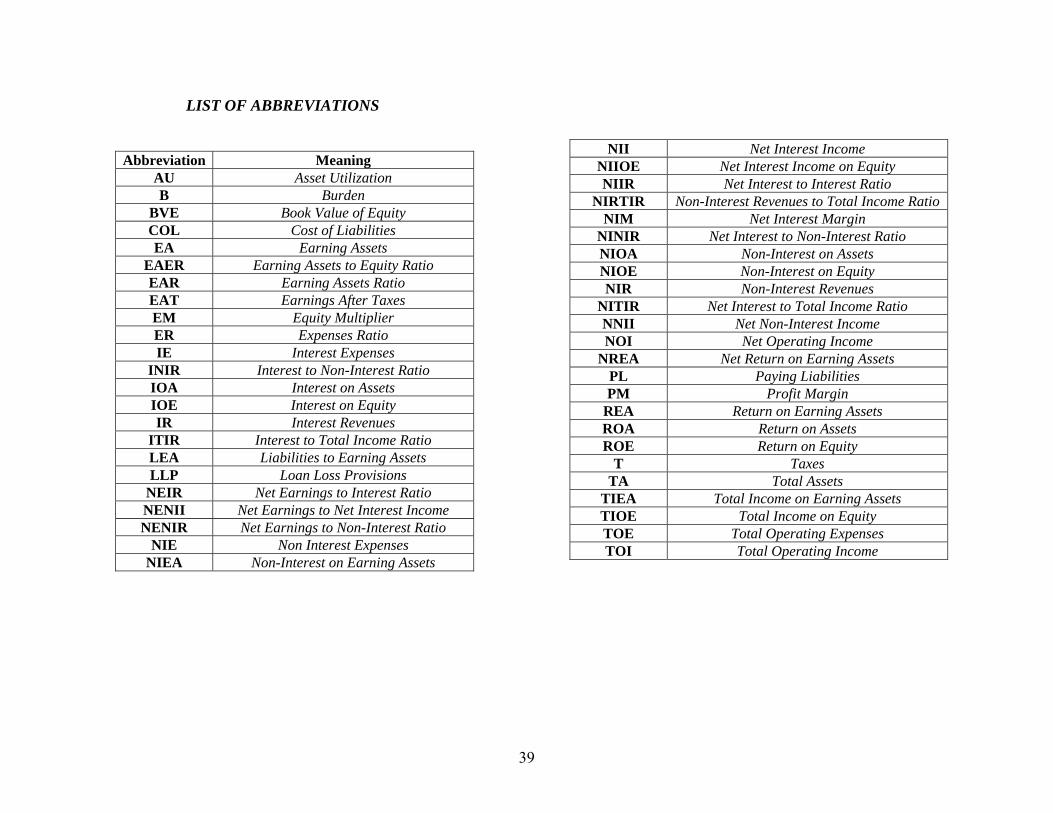
3 For the meaning of the acronyms used, see the List of Abbreviations at the end of the paper.
11
The respective ratios may thus be transformed into:
EARNIMTAEA
EANII
TANII ** == (12)
and
TANNIIB = =
TANIENIR − (13)
EAR ratio is an important indicator of banks’ efficiency and investment strategies as
it shows the proportion of the total assets invested in income-generating assets. The
bank’s burden for not covering non-interest expenses by non-interest income (B) shows
the degree to which operating expenses are managed. Usually, it takes negative values as
non-interest income (income from commissions, operations with securities, foreign
exchange operations, etc.) does not cover non-interest expenses (personnel costs, other
administrative expenses, rents, etc.). Net interest margin (NIM) is another important
factor that measures the efficiency of bank intermediation and expresses the net income
generated by each unit of assets invested in income earning activities. Since this indicator
measures the main source of a bank’s returns, it should be analysed in more details, as
follows:
LEACOLREAEAPL
PLIE
EAIRNIM ** −=−= (14)
REA expresses the average returns on earning assets (in gross terms, before
expenses’ deduction) by giving an average rate for the interest earned on investments in
loans, government securities or shares. COL may be considered as the average cost of the
borrowed funds, as it shows the ratio of interest expenses to interest paid liabilities. The
last indicator (LEA) measures the intensity of bank investment (i.e. the proportion of
interest paid liabilities invested in earning assets).
Finally, ROA and ROE may be expressed as:
12
ROA = (REA-COL*LEA) * EAR + B - TAT
TALLP
− (15)
ROE = [(REA-COL*LEA) * EAR + B -TAT
TALLP
− ] * EM (16)
2.3 Performance analysis of the Albanian banking system using the modified DuPont model
Table 1 presents the developments of ROE and ROA in Albania over the last four
years, compared to some other regional countries, as of December of each year (if not
otherwise specified).
As may be seen from the data, Albania ranks among the countries with the highest
return on equity, which indicates high efficiency in the usage of equity capital. At the
same time, it may be said that the rate of return on assets is satisfactory and comparable
to other countries of the region – a finding that provides further support for the view that
the Albanian banking system has achieved satisfactory financial results in the last years,
as a consequence of investing in activities with high profitability. However, in 2008, both
indicators have fallen significantly. If these figures are analysed at a diaggregated level
(individual banks), the results show that the number of banks with a negative return on
assets and on equity doubled at the end of 2008 (the number of banks with negative
earnings after taxes increased from 4 at the end of 2007 to 8 at the end of 2008).4
The analysis of the trend behaviour as shown by the indicators over the last years
presents a clear view of the domestic financial conditions. The changes that occurred in
the Albanian banking system in recent years covering privatizations, acquisitions by
foreign banks, mergers, important regulatory changes and supervisory strengthening by
introducing stricter regulatory requirements, the widening of the variety of products and
services provided and the increased competition in the market have undoubtedly affected
the over time behaviour of the indicators.
4 See Figures 7 and 8.
13
Table 2 presents the decomposition of the return on equity and the return on assets
ratios, according first to the DuPont model and then according to the models suggested by
Koch and MacDonald (2002) and Vensel et al. (2004). The data used are taken from
financial statements of the Albanian banking system.5 The balance sheet items, i.e. total
assets, shareholders’ equity, earning assets, paying liabilities are averaged, while the
profit and loss statement items are on a cumulative basis for the whole year.
ROE fluctuates over the period under review, but it has generally remained at the
level of 19-23% during the years from 2001 to 2007. We may, however, note a sharp
decline in 2008. This drop - if we simply look at equation (3) - is affected by the decrease
in net income that characterized the banking system throughout 2008, compared to the
previous year (in the period 2003-2007 net income exhibited an upward trend and an
averaged growth of 21% per year). The banking system’s earnings after taxes for 2008
were 7.3 billion leks, representing an annual decline of 26.5%. By contrast, the average
shareholders’ equity increased, but its pace of growth varied through the years, with an
average of 19% in the period 2002-2008. The annual increase in shareholders’ equity was
31.6% at the end of 2008. Apparently, these two phenomena affected ROE’s decline.
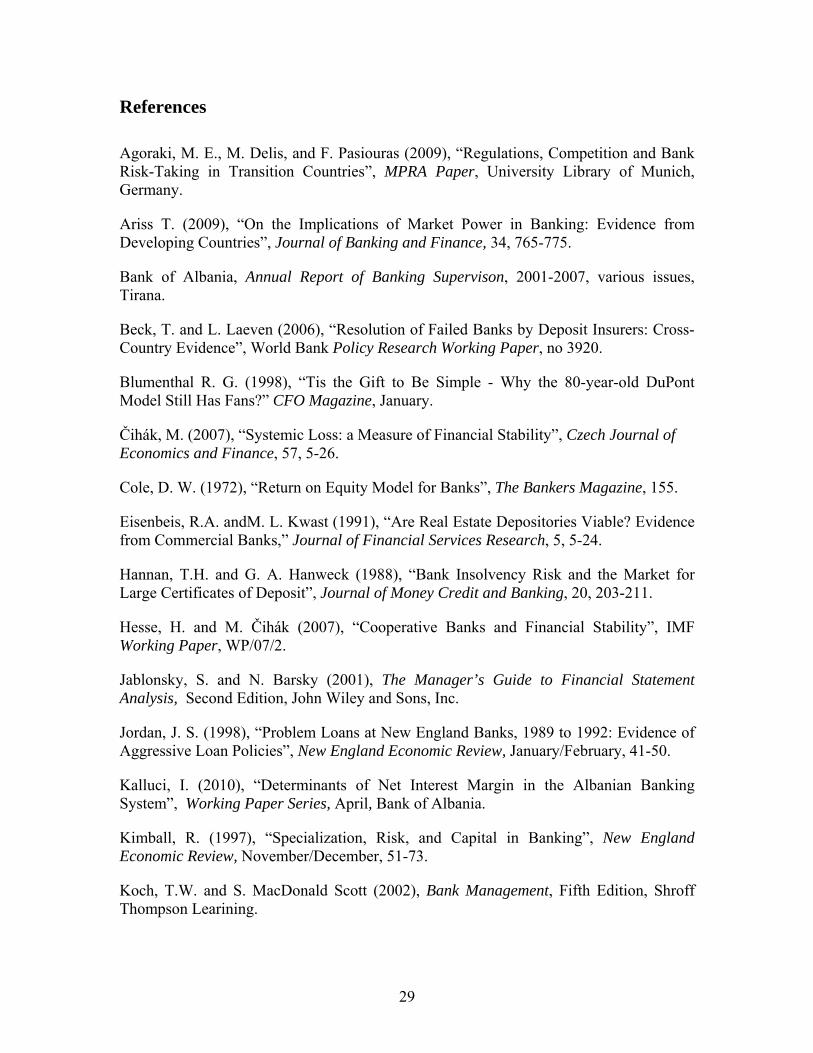
However, let us have a look in more detail at the components that cause ROE to
decline (see Figure 1). Profit margin (earnings after taxes/total operating income)
increased continuously from 2003 suffering however an evident decline in 2008. This
was one of the main factors that caused ROE to fall. Contributing factors were the annual
fall in earning after taxes by 26.5% and the annual increase by the same rate (26.5%) in
total income. A decline in profit margin implies that a smaller part of total income (after
the deduction of expenses) remained at the shareholders’ disposal (to be distributed in the
form of dividends) or at the bank’s disposal (to be re-invested).
Meanwhile, a slight increase in asset utilization from 8.24% in 2007 to 8.76% in
2008 is visible. Since this ratio shows small variability through the years (it fluctuated
between 8% and 9% between 2002 and 2007), it is not expected to significantly affect the
return on equity.
5 Table 5 presents a reduced form of the profit and loss statement of the Albanian banking system through the years 2001-2008, with some transformations for adapting it to the models of statements used by foreign authors in their analysis of the return on equity.
14
The equity multiplier6 (EM) continues its downward trend in 2008 that started in
2005. This phenomenon has been induced by the faster annual increase in the
shareholders’ equity (averaging 28% over 2005-2008, compared to the average annual
increase in assets by 19% over the same period). The value of the equity multiplier at the
end of 2008 shows that assets cover more than 12 times the invested capital. The annual
increase in shareholders’ equity by about 32% for the year 2008 is a further proof of the
measures taken by the banks to improve their capitalization and their management in
times of difficulty. As mentioned in Section 2.2, the equity multiplier (EM) is used to
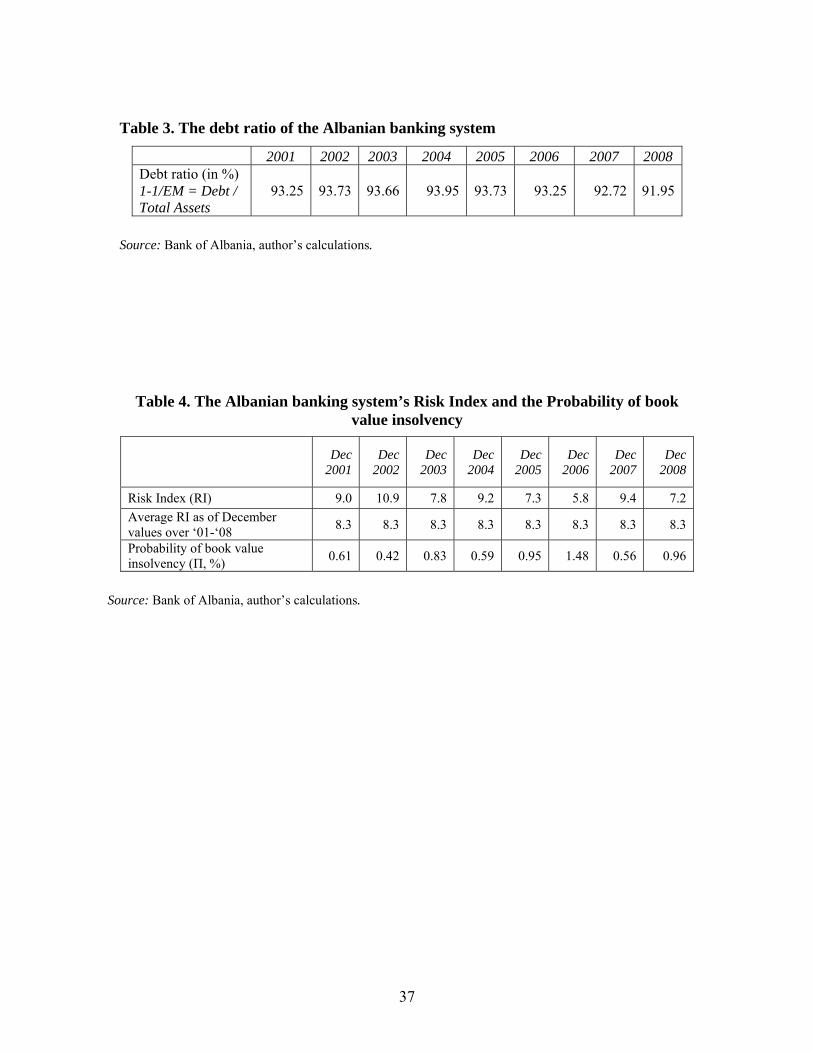
calculate another important element, namely the debt ratio of the banking system (see
Table 3). The debt ratio has generally been stable implying that the liabilities and total
assets have increased by the same rate over the period in question. However, the indicator
has experienced a slight decrease in 2007-2008. This may be explained by the fact that
the banks preferred to rely more on the capital invested by the shareholders than on debt,
as the latter has become more expensive and scarce during the current financial turmoil.
Summing up, we may conclude that the decrease of ROE in 2008 was mainly
caused by the fall in profit margin and the equity multiplier.
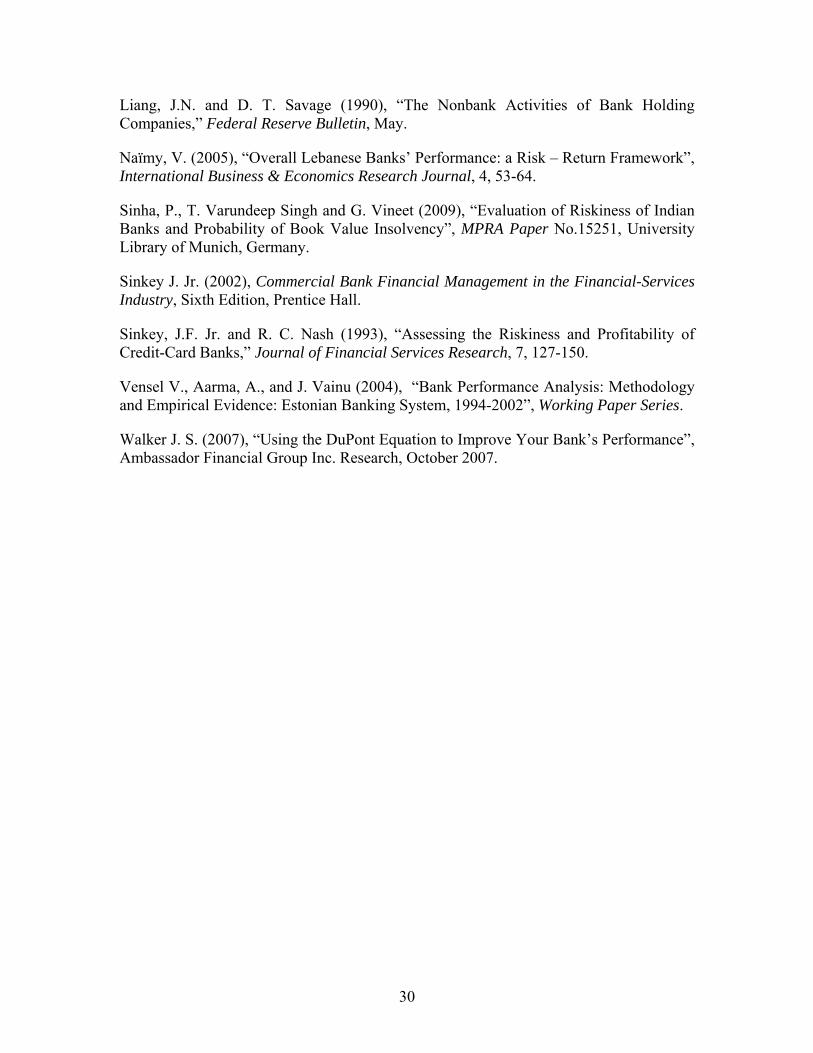
Next, we proceed with the decomposition of the return on assets ratio to identify the
components that determine it and, notably, its decline in 2008 (see Figure 2). The rate of
return on assets (ROA) for the Albanian banking system was satisfactory in the last years.
Generally, this indicator stood at the interval of 1.2-1.6% in 2001-2007; however, in 2008
it dropped rapidly to 0.9%. Looking at the trend behaviour of total revenues and
expenditures as a percentage of total assets, both have moved in the same direction but
not by the same degree. In 2008, there was an increase in both revenues and expenditures
but apparently expenditure increased more than revenue, thus causing both net income
and the return on assets to decline.
Furthermore, by performing another transformation of ROA (see Table 2), we
obtain the results presented in Figure 3. Net interest margin (NIM) is an indicator of the
bank’s efficiency in the sense of an effective financial intermediation. During the period
under study, this indicator has generally displayed a positive trend implying that the
6 In the Annual Report of Supervison, this concept is referred as “Financial Leverage”.
15
Albanian banking system has generated a higher net interest income as a proportion of
earning assets. But, in 2008, it experienced a fall in net interest margins. While for the
years 2005-2007, the annual increase of net interest income was higher than that of
earning assets (which resulted in higher net interest margins), the trend was overturned in
2008, and net interest income increased by only 12%, whereas the annual change in
earning assets was 18%, resulting in lower levels of the NIM rate. This development
demands a more detailed analysis in order to identify, from an accounting perspective, the
elements that affected it (see later in this paper).
The Albanian banking system has seen to be efficient as far it concerns assets’
investment. On average, its earning assets comprise more than 90% of its total assets in
the years 2001-2008. EAR indicator decreased slightly during 2008. The later is evidence
of the decline in ROE and ROA.
As expected, the banking system burden is negative. The banks have not been able
to generate enough non-interest revenues to cover non-interest expenses. Furthermore,
net non-interest income7, which has been negative, continuously worsened due to several
factors. First, net income from other activities increased continuously, while the principal
items of revenues and expenses from this category were the revenues and expenses from
commissions and foreign exchange activities. Thus, it may be said that this item
positively affected net non-interest income. On the other hand, operating expenses also
increased and contributed to a worsening of the already negative net income from non-
interest activities. It should be mentioned that operating expenses in 2008 continued to
increase as they had done in the previous years (by 23.5%) due to the continuous
widening of the range of activities and the geographical expansion of the banking system,
where personnel expenses comprise about 40% of the operating expenses.
The ratio of loan loss provisions to total assets remained low (less than 0.5%)
between 2001 and 2007, but in 2008 it sharply increased to 1.05%, as a consequence of
deterioration in the quality of the loan portfolio. The high growth of loan loss provisions
over 2008 (more than 1.4 times than that of 2007), as a result of the loan portfolio
7 It is calculated as follows: net income from other activities + net extraordinary income – operating expenses. Another way of calculation is: Non-interest income – Non-interest expenses (refer toTable 5).
16
deterioration and the measures taken by the banking system to put aside reserves under
circumstances of increasing uncertainty, exceeded the increase in the average total assets
(19%), thus negatively affecting the return on assets.
Tax paid by banks comprised on average only 0.5% of the total assets, and fell to
0.2% in 2008, positively affecting the return on assets. The drop in the absolute value was
caused by the fall in earnings before taxes.
In conclusion, net interest margin generally shows a positive trend over the sample
period, with a slight reversal in 2008. In order to explain its trend behaviour, it is
necessary to analyse the components of net interest margin (see equation 14 and Figure
4).
The return on earning assets (REA) is a way of measuring the average interest
earned on profitable assets by the banking system. This indicator increased in the recent
years, signalling that domestic banks started to invest in higher return (but also more
risky) activities. Despite this increase, the return on invested funds has remained almost
at the same levels as at the beginning of the sample period.
The cost of borrowed funds (COL) also increased in the last three years of the
sample, but, compared to the starting point, i.e. 2001, it declined by 1 percentage point.
The major share of interest expenses went to interest paid to customers (for time
deposits). These expenses increased not only as a consequence of the rise in the absolute
value of liabilities, but also because interest rates increased notably in the later years
(either because of a gradual rise of the policy rate since 2005 or of the policy of banks to
call the attention of their depositors to seasonal offers).
The ratio of paying liabilities to earning assets (LEA) was not so volatile. In 2008, a
slight increase took place, but generally, over the whole sample period more than 90% of
interest bearing assets was financed by interest paying liabilities.
Finally, it should be noted that the decrease in net interest margin during 2008
results from the fact that the higher return on earning assets (REA) has not successfully
managed to cover the negative effect of the increase in the cost of liabilities (COL) and in
the ratio of earning assets financed by the paying liabilities (LEA).
17
3. Matrix analysis of banking system performance
An alternative way of analysing financial ratios is through the matrix approach
presented by Vensel et al. (2004). These authors introduce a different treatment of
financial indicators of the Estonian banking system, by creating a matrix for the analysis
of these indicators. In this section, we present the structure of the financial ratios’ matrix
based on the work by Vensel et al. with some differences as the matrix is adapted to the
Albanian case.
3.1 Methodology
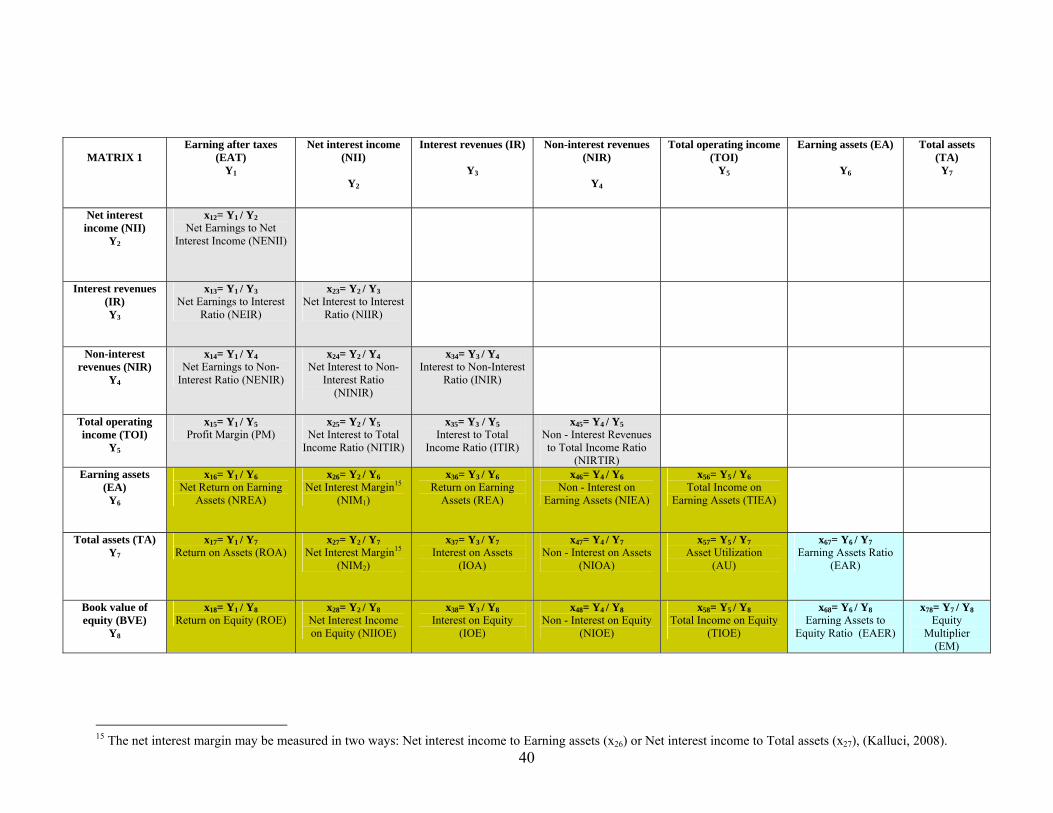
Vensel et al. (2004) note that starting from n quantitative indicators Yi (i=1,2,....n),
it is possible to define n2-n qualitative indicators xi (financial ratios),
YjYixi = (i, j= 1,2,...n; i≠j) (17)
By the combination of these n quantitative indicators, we form a (n x n) matrix
which is also called the matrix model, i.e.
X =
nnnn
n
n
xxx
xxxxxx
....................
....
....
21
22221
11211
= {xij} (18)
This is a symmetric matrix where the symmetric elements with respect to the main
diagonal are reciprocal to each other (xij ratios are reciprocal to xji ratios) and it comprises
of two triangular symmetric matrices: the matrix of effectiveness and the inverse matrix
of effectiveness. The financial information needed for the analysis is presented in the
matrix of effectiveness (the elements down the diagonal), without thus needing to
calculate all financial ratios. The main idea of presenting this matrix is the introduction
and the analysis of the interrelations among different financial indicators.
All the quantitative indicators that are analyzed and used for defining other
financial ratios so far may be divided into two groups according to their economic
meaning, namely:
18
1. the input indicators of banking activity, obtained from the bank balance sheets.
The reason why these indicators are called “inputs” is that they generate and
improve financial results. The indicators included in this group are: total assets
(TA), the book value of equity (BVE), earning assets (EA), paying liabilities
(PL), etc.
2. the output indicators of banking activity, obtained from the bank’s income
statement. The reason why these indicators are called “outputs” is that they are
results of the inputs’ usage. The indicators included in this group are: earning
after taxes (EAT), total operating income (TOI), net interest income (NII),
interest revenues (IR), non-interest revenues (NIR), etc.
The combination of these two initial groups of indicators forms the effectiveness
matrix of financial indicators for the banking system, which comprises three partial
matrices:
(i) a triangular matrix called “output matrix”, whose elements present proportions
between two output indicators;
(ii) a triangular matrix called “input matrix”, whose elements present proportions
between two input indicators; and
(iii) a quadrate matrix called “output-input matrix”, whose elements present
proportions between an output and an input indicator.
3.2 Some explanations of the meaning of financial ratios in the “Output” Matrix
As discussed above, the partial “output matrix” presents proportions among items
of the income statement. A lower value of NENII shows that earnings after taxes
comprise a smaller part of net interest income, an undesirable situation that indicates
higher operating expenses or loan loss provisions which reduce earnings after taxes. A
higher NIIR ratio signifies that a higher proportion of interest revenues remain at the
bank’s disposal, after interest expenses are deduced. INIR, ITIR and NIRTIR tell us the
way total operating income is allocated between interest and non-interest revenues.
Generally speaking, a higher value of profit margin (PM) is preferable, as it shows that
19
after the deduction of all expenses, the net results (earning after taxes) comprise a
considerable proportion of total operating income.
In the partial “input matrix”, a higher EAR indicator is preferred, since this implies
that a larger part of assets are invested in profitable activities. As concerns the equity
multiplier (EM), the higher is, the more banks depend on borrowing for financing their
actitivies.
The partial “output-input matrix” presents proportions among items of the income
statement and the balance sheet, and, in general, higher values for the qualitative
indicators are preferred. In this case, we can support that the utilization of input indicators
has been effective and has generated high results.
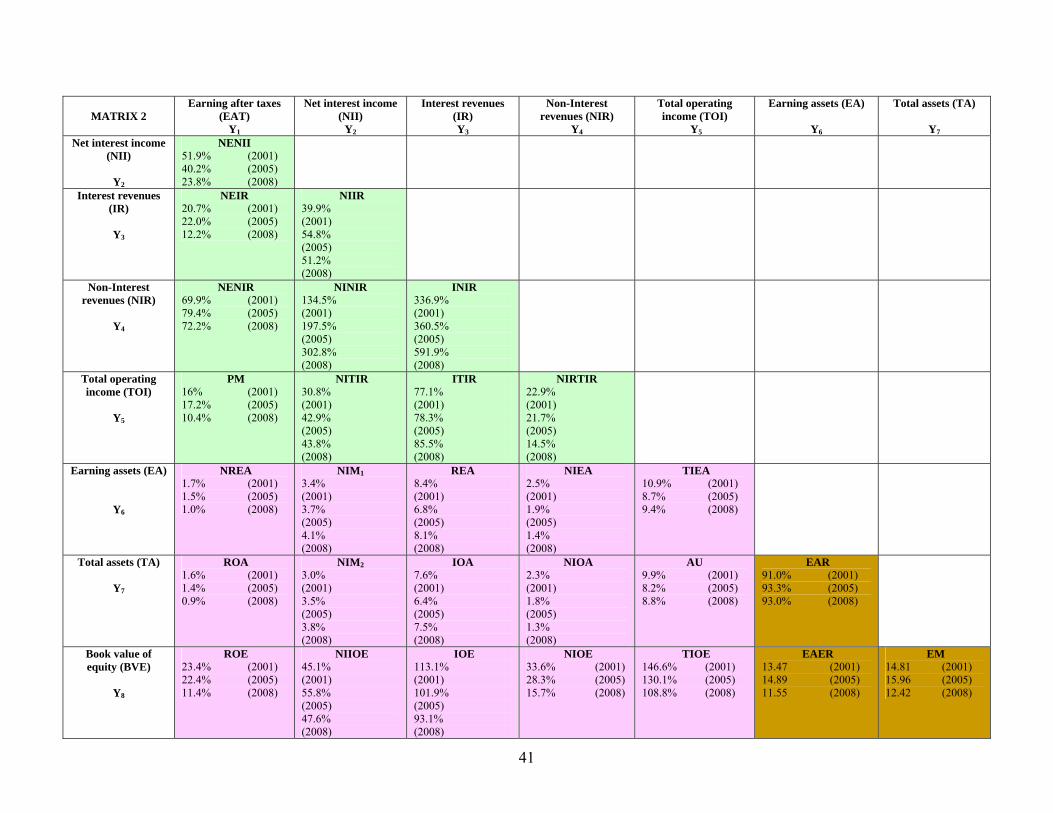
3.3 Matrix analysis of the Albanian banking system performance
Once the matrix has been created and a range of financial ratios have been
calculated, we are now able to assess the performance of the banking system. Unlike the
modified DuPont model, we can create more financial ratios and present them in a
summary making comparison simpler. In matrix no.2, 28 financial indicators are
presented for the years 2001, 2005 and 2008. Thus, a range of matrices may be formed,
with indicators for different years that may be compared with each other.
In the “output matrix”, x15 – PM (profit margin) is the leading element which may
be written as a combination of some other ratios:
x15 = x12 * x23 * x34 * x45 (19)
or,
PM = NENII*NIIR*INIR*NIRTIR = TOINIR
NIRIR
IRNII
NIIEAT *** =
TOIEAT (20)
Based on the above interrelations, we may establish diverse combinations that may
be used to identify the factors that affect a certain element of the matrix (or affect its
increase or decrease compared to a given period).
20
For instance, if PM08 / PM01 = 0.652, this may be expressed as a combination of the
growth rates of each PM component during the period 2001-2008 (refer to equation 19
and matrix no.2), respectively:
01
08
01
08
01
08
01
08
01
08
NIRTIRNIRTIR*
INIRINIR*
NIIRNIIR*
NENIINENII
PMPM
= = 0.459*1.281*1.757*0.631 = 0.652 (21)
Here, we note that the element which accounts for most of the decline in PM over
2001-2008 is NENII indicator. Subsequently, we may proceed with the decomposition of
the latter into its components in an attempt to analyse in more detail the situation and the
motives that may have caused it.
In the “input matrix”, x68 – EAER (earning asset to equity ratio) is the leading
element which may be written as a combination of two input indicators:
x68 = x67 * x78 (22)
or,
EAER = EAR*EM = BVETA
TAEA * =
BVEEA (23)
Similarly, we can analyse the factors that affect the decrease in EAER (over 2001-
2008) to discover that the leading cause of this drop is the equity multiplier (EM).
Finally, in the “output-input matrix”, x18 – ROE (return on equity) is the leading
element which may be written as a combination of:
x18 = x12 * x23 * x34 * x45 * x56 * x67 * x78 (24)
or,
ROE = NENII*NIIR*INIR*NIRTIR*TIEA*EAR*EM=
=BVETA
TAEA
EATOI
TOINIR
NIRIR
IRNII
NIIEAT ****** =
BVEEAT (25)
Again, the elements that explain ROE’s fall may be identified as follows:
01
08
01
08
01
08
01
08
01
08
01
08
01
08
01
08
EMEM*
EAREAR*
TIEATIEA*
NIRTIRNIRTIR*
INIRINIR*
NIIRNIIR*
NENIINENII
ROEROE
= =
21
=0.459*1.281*1.757*0.631*0.866*1.021*0.839= 0.484 (26)
As noted above, the decrease in NENII has been the most important factor causing
ROE to decline in 2008, compared to 2001. Other factors that have also affected
negatively ROE are NIRTIR, TIEA and EM.
4. The risk index
Generall speaking, financial theory views returns as being related to risk, as higher
risk needs to be compensated by higher returns in order to be undertaken by risk-averse
shareholders. In the previous section we analyse the performance of the Albanian banking
system. Now, we move to compute the risk that this system encounters while performing
its intermediary activity. Banks face risks, such as credit risk, interest rate risk, liquidity
risk, exchange rate risk, operational risk, etc. Aside from developing specific indicators to
measure each of the above risks, a “Risk Index” can also be created that encompasses all
types of risk in a single index.
4.1 Methodology
The Risk Index, also known in the literature as Z-statistic, Z-index or Z-score, is an
indicator of the overall level of risk that banks face. Recently, this index, which is a
measure of the soundness and stability of the financial institutions, has become more
important. The risk index is inversely related to the probability of the book value of
insolvency of these institutions. Different versions of calculation are found in the
literature for individual banks or groups of banks (grouped by ownership or by their
activities) or for a country’s banking system. The index was first performed by Hannan
and Hanweck (1988)8, who derived the probability of the book value insolvency9 (i.e. the
probability that the bank’s losses in a certain period exceed the book value of the bank’s
equity, or the probability that the assets value of the bank becomes lower than the value
of its liabilities).
8 The index was then applied by Liang and Savage (1990), Eisenberg and Kwast (1991), Sinkey and Nash (1993), Nash and Sinkey (1997), Naïmy (2005), among others. 9 In terms of book and not market value.
22
The Risk Index is provided by a combination of the return on assets ratio (ROA),
the equity multiplier (EM) and the standard deviation of ROA. Its empirical form is given
by:
RI =
+ΟΑR
CAPROAEσ
)( (27)
where
RI is the Risk Index (also called Z-statistic, Z-index or Z-score);
E(ROA) is the average (expected) return on assets;
CAP = EM-1 is the equity to asset ratio and
σROA is the ROA’s standard deviation.
The probability of the book value insolvency (Π) is measured by:
Π = 2*21RI
(28)
The risk index (Z-score) is the number of standard deviations below the mean by
which the bank’s (or the banking system’s) profit would have to decline in order to
eliminate equity (see Eisenberg and Kwast 1991). Thus, it expresses the ability of the
bank to absorb losses.
It should be noted that a value or interval that serves as benchmark for the risk
index (i.e. for detecting whether a banking system or a bank is in a safe or a risky
position) does not exist. Instead, its trend behaviour is analysed. Specifically, an upward
trend indicates a favourable development whereas a downward trend signals a negative
development. For example, Jordan (1998) distinguishes the Z-scores between surviving
and failed banks in New England over the period 1989-1992 which was a period of
excess difficulty for the country’s banking industry. He reached the conclusion that the
group of banks which survived had a higher average value of the Z-index (13.33) and
consequently a lower probability of the book value insolvency, compared to the banks
that failed (Z=8.71). Beck and Leaven (2006) also measured the Z-scores for 57 countries
and found differences among them. They calculated an average Z-score for the period
1997-2003 of nearly 50 for the United States, but only of 2 for Korea and 11.6 for
23
Albania, while the average Z-score of all 57 countries was 24. More recently, Hesse and
Čihák (2007) calculated the risk index for individual banks of 29 advanced and emerging
OECD countries in the 1994-2004 period, and concluded that cooperative banks had
higher index values (the group average score for these banks was 59.6) than savings
banks (55.4) and commercial ones (46.5), implying that the first type of banks are more
stable. Finally, Čihák (2007), using a group of 29 countries, 12 of which have
experienced systemic banking crises, found that banks in difficulty were characterized by
significantly lower Z-scores (Z=32) than other banks (Z=89).
The international evidence shows that risk index values vary by countries and/or
bank type. Therefore, when the risk index is calculated for the Albanian banking system,
it will be discussed on the basis of its trend behaviour without taking into account its
absolute value. A lower value implies a riskier bank, and a high value signals a safe one.
Since the index value is inversely related to the probability of book value insolvency, a
higher value means a lower probability to face a bank solvency difficulty.
If a bank or a banking system is characterized by a high return on assets, a high
level of capitalization and a low volatility of ROA, then the bank or the banking system is
considered safe, that is it has a higher risk index. It is interesting to note that the index
includes all these components, because each of them has a special connotation: ROA
indicator is regarded as the best measure of bank’s performance (as it is discussed in the
previous section); its volatility is seen a standard measure of risk in finance; and the
capitalization level represents a standard for the banks’ stability and safety.
4.2 Computation of the risk index for the Albanian banking system
To the best of our knowledge, the risk index for the Albanian banking system has
been calculated in very few papers10 and only within the context of a cross-country
comparison. It should be emphasized that differences may be found between the approach
we present here and the ones that applied by other authors. This is chiefly due to the
different time periods selected. Moreover, the data used by other authors in their studies
covers only a limited sample of Albanian banks, namely only those whose financial
statements are available in Bankscope. For the first time ever, in this paper, a risk index is 10 See, Beck and Leaven (2006), Ariss (2009) and Agoraki et al. (2009).
24
calculated for the whole Albanian banking system and a complete time series of its values
is obtained for the period from December 2001 to June 2009. The data used are on a
quarterly basis and they were collected separately for each individual bank. Then, in
order to calculate the required indicators which are components of the index, they were
aggregated for the whole system using the weighted averages of the individual data (the
weighting factor is the share of each bank’s assets to total banks assets).
Two methods of calculating average ROA and its standard deviation – which are
used in the index’s measurement – are found in the literature. The first one calculates the
expected (average) value as the average value of ROA during a given time period, from
which the standard deviation of the values during the same period can be derived. This
method is appropriate in the case when the risk index is calculated over a time period for
a particular bank or a banking system.
The second method is to calculate the average value of ROA at a specific point of
time using the weighted average of individual bank ROAs; the standard deviation is then
the standard deviation across banks. This method is more appropriate when we need to
create a time series of the risk index and view the banking system as a whole, made up of
individual banks, whose asset shares act as weighting elements in computing average
ROA and its standard deviation at this certain point.
Since our main purpose is to calculate the risk index and to create a series of data
points in order to identify its trend behaviour, we apply the second method. However,
future users of this risk measure may try to calculate the index value for a time period,
following the explanations of the first method mentioned above.
The expected value of the system’s ROA for each quarter is calculated as a
weighted average of each bank’s ROA11 at the end of the quarter, weighted by the share
of each bank’s assets to the total banks’ assets at the end of the respective period, i.e.
E(ROA) t = Σ(ROAit * wit) (29)
11 Usually, in calculating the expected value, the probabilities of a specific situation occuring are used as weighting factors. Since the probability distribution of future (predicted) values is missing, it is supposed that the expected value of the system’s ROA may be approximated by the weighted average of all current ROAs for each bank.
25
where
E(ROA)t is the banking system’s average (expected) return on assets at quarter t;
ROAit is the return on assets of the bank i at the t-th quarter on an annual basis;
wit is the share of bank i assets to the banking system’s total assets at quarter t;
i stands for the i-th bank and t for the t-th quarter.
The standard deviation is calculated according to
σ (ROA) t = ittit wROAEROA *])([ 2−Σ (30)
Table 4 displays the risk index obtained and the probability of the book value
insolvency for the Albanian banking system during the years 2001-2008. As is evident,
the risk index fluctuated over time, but its average level during 2001-2008 reached 8.3 if
we take into account the December values. At the end of 2008, the index’s value was
lower than the average of the last eight years. In the first quarter of 2009, the value of the
risk index declined to 5.1 reflecting the problems that financial markets worldwide
encountered. Thus, the riskiness of the Albanian banking system increased. However, in
the second quarter of 2009, we notice an improvement of the index, thus signalling a
more optimistic situation. This is in line with the forecast for an upturn in banking
activity and a reversion of the public confidence in the banking system.
Generally speaking, the equity/asset ratio has been increasing over time, positively
affected the value of the risk index. The element that caused the index to decrease was the
weighted average ROA of the system, which fell rapidly, notably in the three quarters
prior to the second quarter of 2009. There is an improvement in average ROA of the
system causing the index to increase. In addition, the higher volatility of ROA
contributed to the deterioration of the risk index at the end of 2008 and in the first quarter
of 2009. As for the second quarter, the standard deviation decreased, which is reflected in
the risk index’s improvement (see Figure 5).
However, the probability the banking system’s equity would turn negative is low,
fluctuating between 1 and 2% over the period under study. Despite the increase in the
probability of the book value insolvency during the global financial crisis (as a
26
consequence of the decline in the risk index), its modest value may not be considered a
disturbing element for the Albanian banking system (see Figure 6).
5. Conclusions
During the recent years, the Albanian banking system has been characterized by a
fast expansion of its activity, as is evident by the increase in total assets, the expansion of
the loan portfolio, deposit collection, the variety of products and services provided, the
increased competition, the earnings after taxes and by other quantitative and qualitative
indicators. During the period 2001-2007, the domestic banking system mostly generated
high rates of return on equity and on assets, ranking among the first countries in the
region. This testifies once more to the fact that Albanian banks engaged in risky
activities, thus generating higher returns. However, in 2008, when the global economy
was overcome by the financial crisis, the Albanian banking system started to show signs
of a slowdown and deterioration in financial indicators. The return on equity declined
significantly owing to a decline in its two main components, namely the equity multiplier
and the return on assets ratio. The latter fell as a consequence of the fall in net interest
margin and in the earning assets ratio, as well as a consequence of the banks being unable
to cover non-interest expenses by non-interest income and the rise in the loan loss
provisions to total assets ratio. Net interest margin fell during 2008 as a result of the
increase in the cost of borrowed funds and earning assets financed by paying liabilities.
This paper also presents, for the first time ever, a quarterly time series of the risk
index calculated for the whole Albanian banking system over the period December 2001
to June 2009. This index exhibits high values over the period under review, largely
supported by the high returns on assets and a well capitalized banking system, as well as
by low ROA volatility. Nevertheless, as the global financial crisis culminated, the risk
index for the Albanian banking system deteriorated too.
This paper, being more than a simple technical exercise, aims at bringing to the
scene some new financial indicators for the Albanian banking system that measure risk
and performance. This will facilitate the periodic analyses of the banking system that
supervisors perform.
27

Future research may focus on the enrichment of these new indicators’ series and on
the identification of the factors that affect ROE and ROA by using more sophisticated
econometric models. Furthermore, as far as it concerns the risk index, tests on the quality
of this index should be employed. Finally, the extension of the index’s time series may
enable its assessment over a certain time period rather than at specific quarters.
28
References
Agoraki, M. E., M. Delis, and F. Pasiouras (2009), “Regulations, Competition and Bank Risk-Taking in Transition Countries”, MPRA Paper, University Library of Munich, Germany.
Ariss T. (2009), “On the Implications of Market Power in Banking: Evidence from Developing Countries”, Journal of Banking and Finance, 34, 765-775.
Bank of Albania, Annual Report of Banking Supervison, 2001-2007, various issues, Tirana.
Beck, T. and L. Laeven (2006), “Resolution of Failed Banks by Deposit Insurers: Cross-Country Evidence”, World Bank Policy Research Working Paper, no 3920.
Blumenthal R. G. (1998), “Tis the Gift to Be Simple - Why the 80-year-old DuPont Model Still Has Fans?” CFO Magazine, January.
Čihák, M. (2007), “Systemic Loss: a Measure of Financial Stability”, Czech Journal of Economics and Finance, 57, 5-26.
Cole, D. W. (1972), “Return on Equity Model for Banks”, The Bankers Magazine, 155.
Eisenbeis, R.A. andM. L. Kwast (1991), “Are Real Estate Depositories Viable? Evidence from Commercial Banks,” Journal of Financial Services Research, 5, 5-24.
Hannan, T.H. and G. A. Hanweck (1988), “Bank Insolvency Risk and the Market for Large Certificates of Deposit”, Journal of Money Credit and Banking, 20, 203-211.
Hesse, H. and M. Čihák (2007), “Cooperative Banks and Financial Stability”, IMF Working Paper, WP/07/2.
Jablonsky, S. and N. Barsky (2001), The Manager’s Guide to Financial Statement Analysis, Second Edition, John Wiley and Sons, Inc.
Jordan, J. S. (1998), “Problem Loans at New England Banks, 1989 to 1992: Evidence of Aggressive Loan Policies”, New England Economic Review, January/February, 41-50.
Kalluci, I. (2010), “Determinants of Net Interest Margin in the Albanian Banking System”, Working Paper Series, April, Bank of Albania.
Kimball, R. (1997), “Specialization, Risk, and Capital in Banking”, New England Economic Review, November/December, 51-73.
Koch, T.W. and S. MacDonald Scott (2002), Bank Management, Fifth Edition, Shroff Thompson Learining.
29
Liang, J.N. and D. T. Savage (1990), “The Nonbank Activities of Bank Holding Companies,” Federal Reserve Bulletin, May.
Naïmy, V. (2005), “Overall Lebanese Banks’ Performance: a Risk – Return Framework”, International Business & Economics Research Journal, 4, 53-64.
Sinha, P., T. Varundeep Singh and G. Vineet (2009), “Evaluation of Riskiness of Indian Banks and Probability of Book Value Insolvency”, MPRA Paper No.15251, University Library of Munich, Germany.
Sinkey J. Jr. (2002), Commercial Bank Financial Management in the Financial-Services Industry, Sixth Edition, Prentice Hall.
Sinkey, J.F. Jr. and R. C. Nash (1993), “Assessing the Riskiness and Profitability of Credit-Card Banks,” Journal of Financial Services Research, 7, 127-150.
Vensel V., Aarma, A., and J. Vainu (2004), “Bank Performance Analysis: Methodology and Empirical Evidence: Estonian Banking System, 1994-2002”, Working Paper Series.
Walker J. S. (2007), “Using the DuPont Equation to Improve Your Bank’s Performance”, Ambassador Financial Group Inc. Research, October 2007.
30
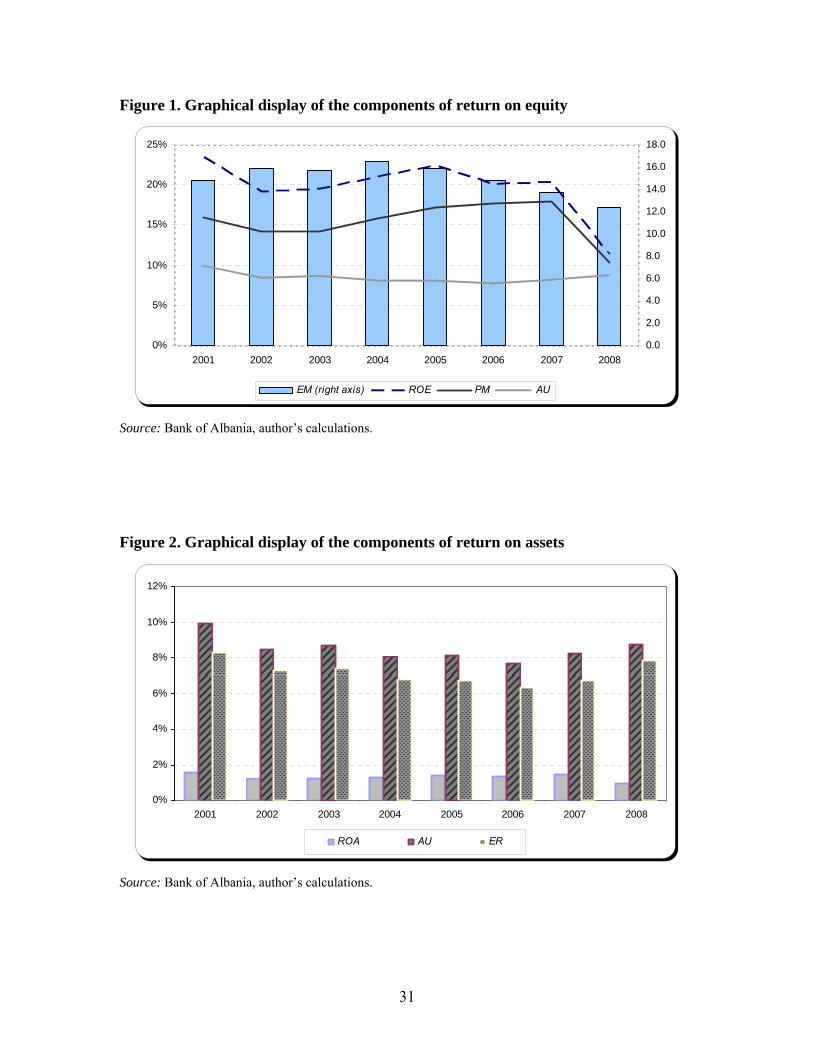
Figure 1. Graphical display of the components of return on equity
0%
5%
10%
15%
20%
25%
2001 2002 2003 2004 2005 2006 2007 20080.0
2.0
4.0
6.0
8.0
10.0
12.0
14.0
16.0
18.0
EM (right axis) ROE PM AU
Source: Bank of Albania, author’s calculations.
Figure 2. Graphical display of the components of return on assets
0%
2%
4%
6%
8%
10%
12%
2001 2002 2003 2004 2005 2006 2007 2008
ROA AU ER
Source: Bank of Albania, author’s calculations.
31
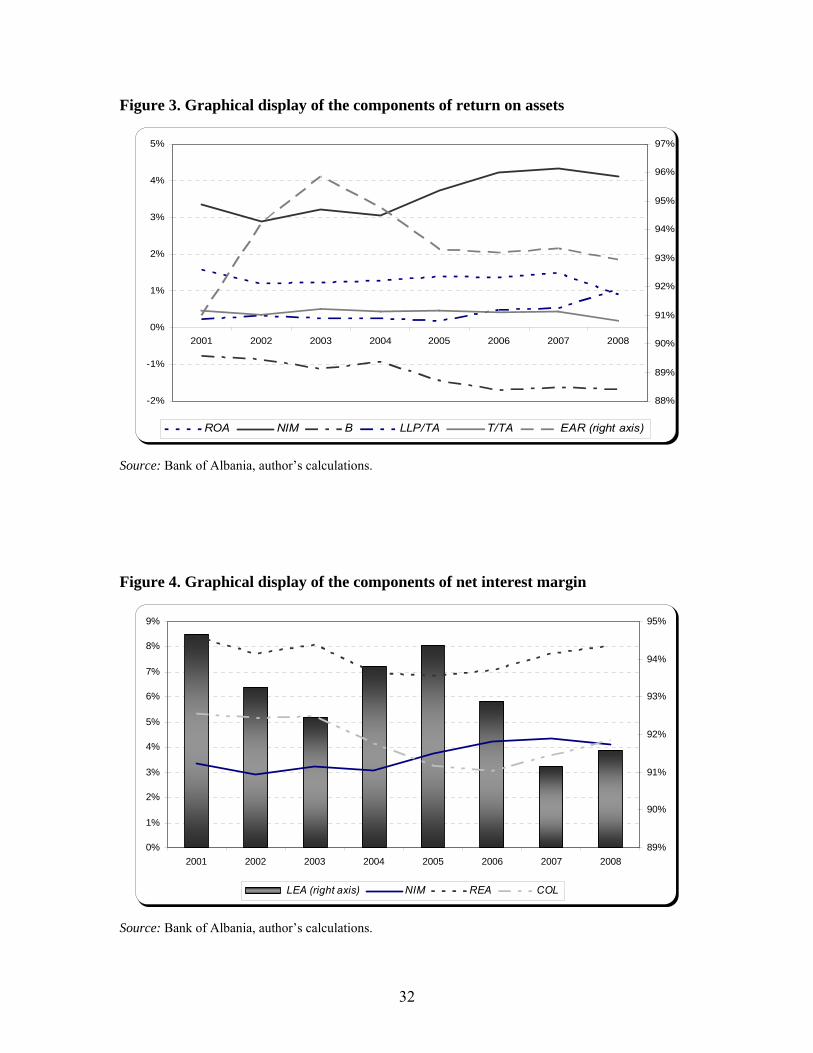
Figure 3. Graphical display of the components of return on assets
-2%
-1%
0%
1%
2%
3%
4%
5%
2001 2002 2003 2004 2005 2006 2007 2008
88%
89%
90%
91%
92%
93%
94%
95%
96%
97%
ROA NIM B LLP/TA T/TA EAR (right axis)
Source: Bank of Albania, author’s calculations.
Figure 4. Graphical display of the components of net interest margin
0%
1%
2%
3%
4%
5%
6%
7%
8%
9%
2001 2002 2003 2004 2005 2006 2007 200889%
90%
91%
92%
93%
94%
95%
LEA (right axis) NIM REA COL
Source: Bank of Albania, author’s calculations.
32
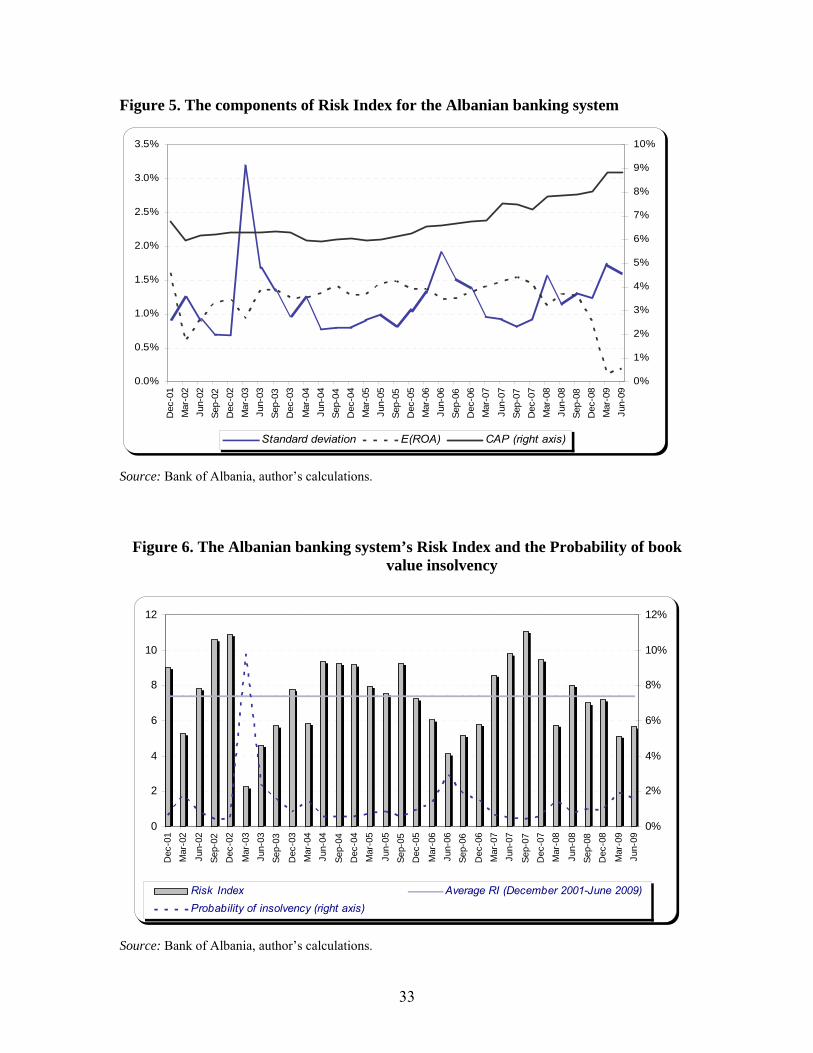
Figure 5. The components of Risk Index for the Albanian banking system
0.0%
0.5%
1.0%
1.5%
2.0%
2.5%
3.0%
3.5%
Dec
-01
Mar
-02
Jun-
02Se
p-02
Dec
-02
Mar
-03
Jun-
03Se
p-03
Dec
-03
Mar
-04
Jun-
04Se
p-04
Dec
-04
Mar
-05
Jun-
05Se
p-05
Dec
-05
Mar
-06
Jun-
06Se
p-06
Dec
-06
Mar
-07
Jun-
07Se
p-07
Dec
-07
Mar
-08
Jun-
08Se
p-08
Dec
-08
Mar
-09
Jun-
09
0%
1%
2%
3%
4%
5%
6%
7%
8%
9%
10%
Standard deviation E(ROA) CAP (right axis)
Source: Bank of Albania, author’s calculations.
Figure 6. The Albanian banking system’s Risk Index and the Probability of book value insolvency
0
2
4
6
8
10
12
Dec
-01
Mar
-02
Jun-
02Se
p-02
Dec
-02
Mar
-03
Jun-
03Se
p-03
Dec
-03
Mar
-04
Jun-
04
Sep-
04D
ec-0
4M
ar-0
5
Jun-
05Se
p-05
Dec
-05
Mar
-06
Jun-
06Se
p-06
Dec
-06
Mar
-07
Jun-
07
Sep-
07D
ec-0
7M
ar-0
8
Jun-
08Se
p-08
Dec
-08
Mar
-09
Jun-
09
0%
2%
4%
6%
8%
10%
12%
Risk Index Average RI (December 2001-June 2009)Probability of insolvency (right axis)
Source: Bank of Albania, author’s calculations.
33
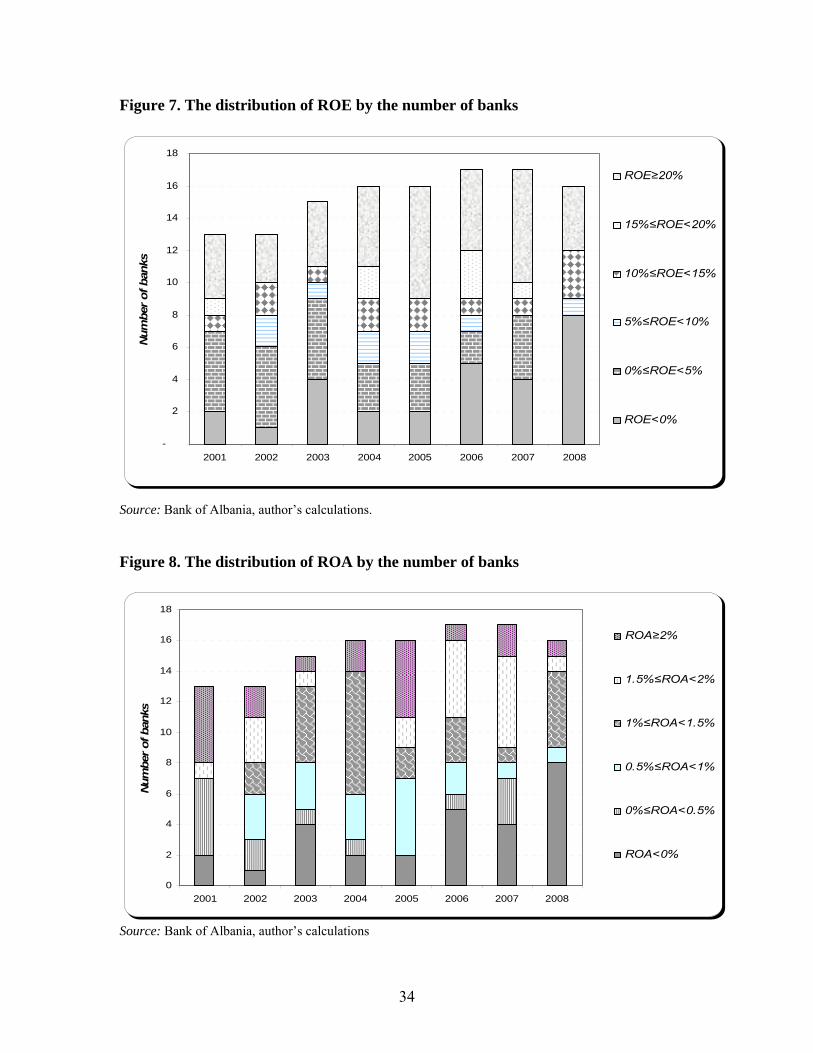
Figure 7. The distribution of ROE by the number of banks
-
2
4
6
8
10
12
14
16
18
2001 2002 2003 2004 2005 2006 2007 2008
Num
ber
of b
anks
ROE≥20%
15%≤ROE<20%
10%≤ROE<15%
5%≤ROE<10%
0%≤ROE<5%
ROE<0%
Source: Bank of Albania, author’s calculations.
Figure 8. The distribution of ROA by the number of banks
0
2
4
6
8
10
12
14
16
18
2001 2002 2003 2004 2005 2006 2007 2008
Num
ber
of b
anks
ROA≥2%
1.5%≤ROA<2%
1%≤ROA<1.5%
0.5%≤ROA<1%
0%≤ROA<0.5%
ROA<0%
Source: Bank of Albania, author’s calculations
34
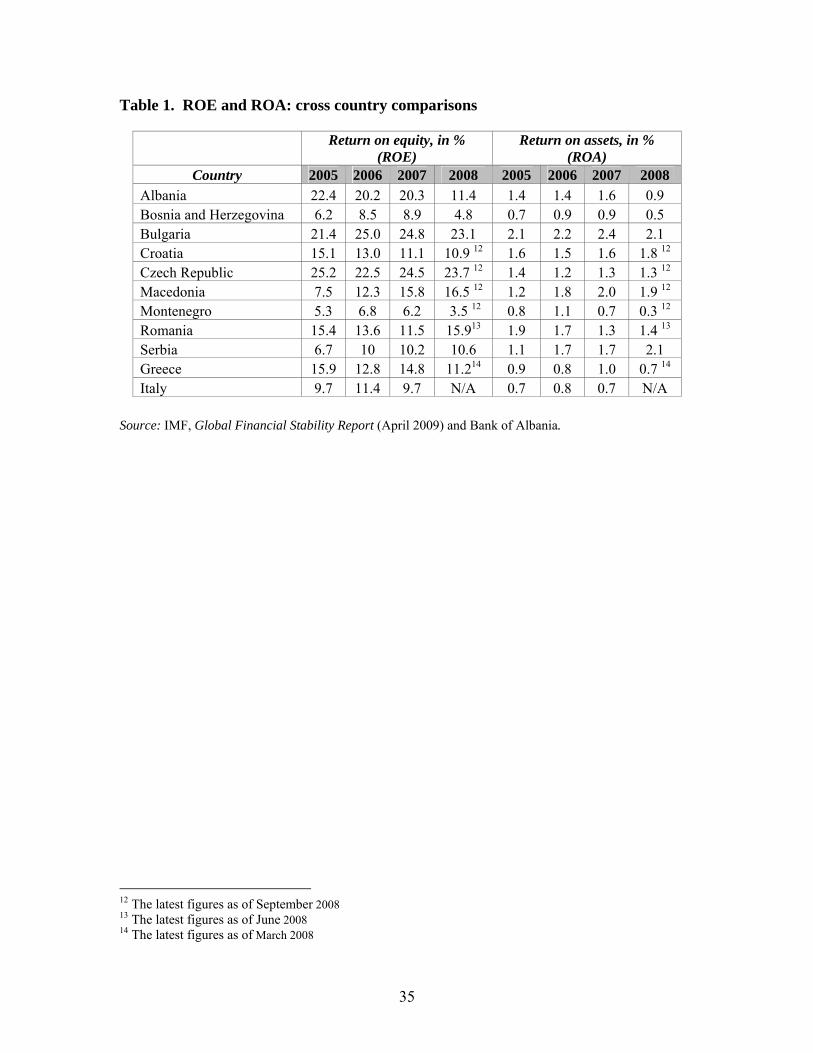
Table 1. ROE and ROA: cross country comparisons
Return on equity, in %
(ROE) Return on assets, in %
(ROA) Country 2005 2006 2007 2008 2005 2006 2007 2008
Albania 22.4 20.2 20.3 11.4 1.4 1.4 1.6 0.9 Bosnia and Herzegovina 6.2 8.5 8.9 4.8 0.7 0.9 0.9 0.5 Bulgaria 21.4 25.0 24.8 23.1 2.1 2.2 2.4 2.1 Croatia 15.1 13.0 11.1 10.9 12 1.6 1.5 1.6 1.8 12
Czech Republic 25.2 22.5 24.5 23.7 12 1.4 1.2 1.3 1.3 12
Macedonia 7.5 12.3 15.8 16.5 12 1.2 1.8 2.0 1.9 12
Montenegro 5.3 6.8 6.2 3.5 12 0.8 1.1 0.7 0.3 12
Romania 15.4 13.6 11.5 15.913 1.9 1.7 1.3 1.4 13
Serbia 6.7 10 10.2 10.6 1.1 1.7 1.7 2.1 Greece 15.9 12.8 14.8 11.214 0.9 0.8 1.0 0.7 14
Italy 9.7 11.4 9.7 N/A 0.7 0.8 0.7 N/A
Source: IMF, Global Financial Stability Report (April 2009) and Bank of Albania.
12 The latest figures as of September 2008 13 The latest figures as of June 2008 14 The latest figures as of March 2008
35
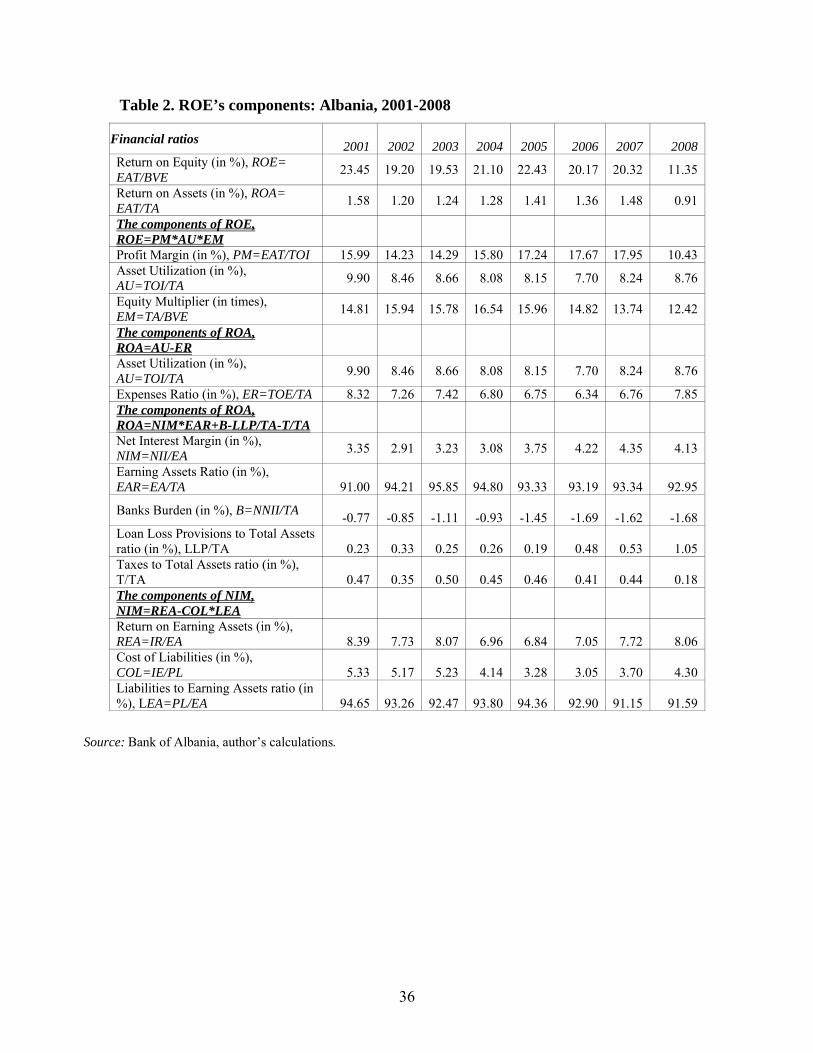
Table 2. ROE’s components: Albania, 2001-2008
Financial ratios 2001
2002
2003
2004
2005
2006
2007
2008
Return on Equity (in %), ROE= EAT/BVE 23.45 19.20 19.53 21.10 22.43 20.17 20.32 11.35
Return on Assets (in %), ROA= EAT/TA 1.58 1.20 1.24 1.28 1.41 1.36 1.48 0.91
The components of ROE, ROE=PM*AU*EM
Profit Margin (in %), PM=EAT/TOI 15.99 14.23 14.29 15.80 17.24 17.67 17.95 10.43 Asset Utilization (in %), AU=TOI/TA 9.90 8.46 8.66 8.08 8.15 7.70 8.24 8.76
Equity Multiplier (in times), EM=TA/BVE 14.81 15.94 15.78 16.54 15.96 14.82 13.74 12.42
The components of ROA, ROA=AU-ER
Asset Utilization (in %), AU=TOI/TA 9.90 8.46 8.66 8.08 8.15 7.70 8.24 8.76
Expenses Ratio (in %), ER=TOE/TA 8.32 7.26 7.42 6.80 6.75 6.34 6.76 7.85 The components of ROA, ROA=NIM*EAR+B-LLP/TA-T/TA
Net Interest Margin (in %), NIM=NII/EA 3.35 2.91 3.23 3.08 3.75 4.22 4.35 4.13
Earning Assets Ratio (in %), EAR=EA/TA
91.00
94.21
95.85
94.80
93.33
93.19
93.34
92.95
Banks Burden (in %), B=NNII/TA -0.77
-0.85
-1.11
-0.93
-1.45
-1.69
-1.62
-1.68
Loan Loss Provisions to Total Assets ratio (in %), LLP/TA
0.23
0.33
0.25
0.26
0.19
0.48
0.53
1.05
Taxes to Total Assets ratio (in %), T/TA
0.47
0.35
0.50
0.45
0.46
0.41
0.44
0.18
The components of NIM, NIM=REA-COL*LEA
Return on Earning Assets (in %), REA=IR/EA
8.39
7.73
8.07
6.96
6.84
7.05
7.72
8.06
Cost of Liabilities (in %), COL=IE/PL
5.33
5.17
5.23
4.14
3.28
3.05
3.70
4.30
Liabilities to Earning Assets ratio (in %), LEA=PL/EA
94.65
93.26
92.47
93.80
94.36
92.90
91.15
91.59
Source: Bank of Albania, author’s calculations.
36
37
Table 3. The debt ratio of the Albanian banking system
2001 2002 2003 2004 2005 2006 2007 2008 Debt ratio (in %) 1-1/EM = Debt / Total Assets
93.25 93.73 93.66 93.95 93.73 93.25 92.72 91.95
Source: Bank of Albania, author’s calculations.
Table 4. The Albanian banking system’s Risk Index and the Probability of book value insolvency
Dec 2001
Dec 2002
Dec 2003
Dec 2004
Dec 2005
Dec 2006
Dec 2007
Dec 2008
Risk Index (RI) 9.0 10.9 7.8 9.2 7.3 5.8 9.4 7.2 Average RI as of December values over ‘01-‘08 8.3 8.3 8.3 8.3 8.3 8.3 8.3 8.3
Probability of book value insolvency (Π, %) 0.61 0.42 0.83 0.59 0.95 1.48 0.56 0.96
Source: Bank of Albania, author’s calculations.
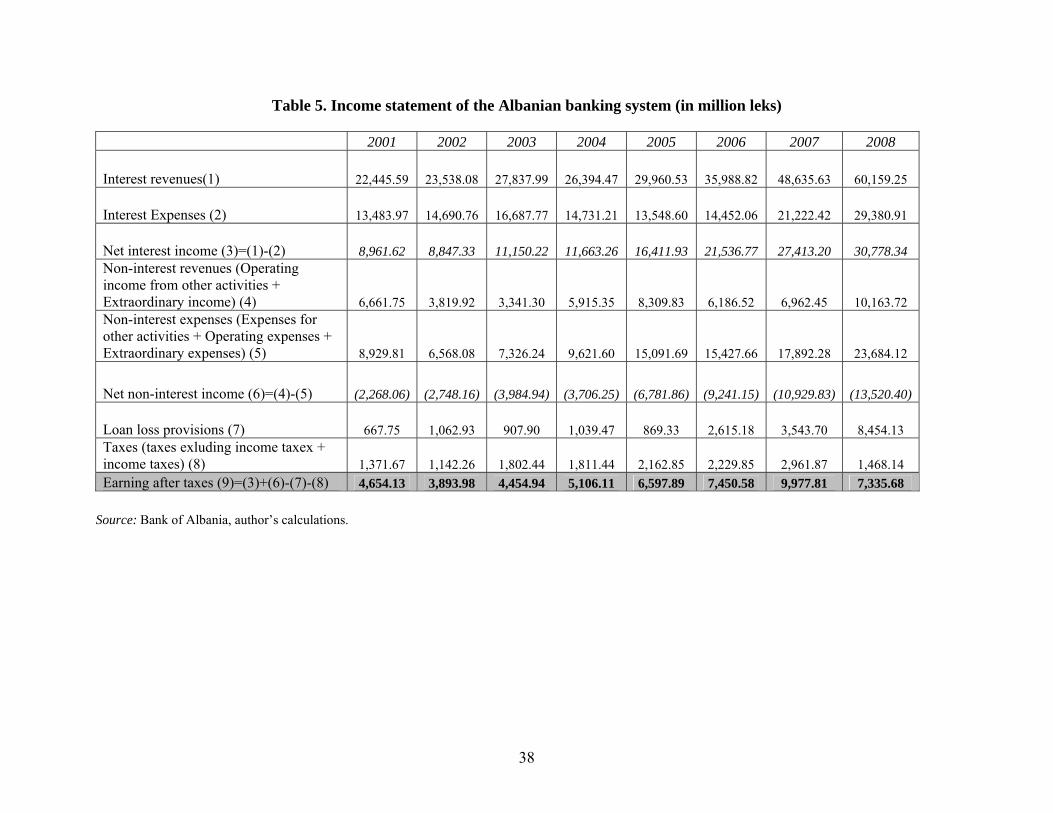
Table 5. Income statement of the Albanian banking system (in million leks)
2001 2002 2003 2004 2005 2006 2007 2008
Interest revenues(1) 22,445.59 23,538.08 27,837.99 26,394.47 29,960.53 35,988.82 48,635.63 60,159.25
Interest Expenses (2) 13,483.97 14,690.76 16,687.77 14,731.21 13,548.60 14,452.06 21,222.42 29,380.91
Net interest income (3)=(1)-(2) 8,961.62 8,847.33 11,150.22 11,663.26 16,411.93 21,536.77 27,413.20 30,778.34Non-interest revenues (Operating income from other activities + Extraordinary income) (4) 6,661.75 3,819.92 3,341.30 5,915.35 8,309.83 6,186.52 6,962.45 10,163.72Non-interest expenses (Expenses for other activities + Operating expenses + Extraordinary expenses) (5) 8,929.81 6,568.08 7,326.24 9,621.60 15,091.69 15,427.66 17,892.28 23,684.12
Net non-interest income (6)=(4)-(5) (2,268.06) (2,748.16) (3,984.94) (3,706.25) (6,781.86) (9,241.15) (10,929.83) (13,520.40)
Loan loss provisions (7) 667.75 1,062.93 907.90 1,039.47 869.33 2,615.18 3,543.70 8,454.13Taxes (taxes exluding income taxex + income taxes) (8) 1,371.67 1,142.26 1,802.44 1,811.44 2,162.85 2,229.85 2,961.87 1,468.14Earning after taxes (9)=(3)+(6)-(7)-(8) 4,654.13 3,893.98 4,454.94 5,106.11 6,597.89 7,450.58 9,977.81 7,335.68
Source: Bank of Albania, author’s calculations.
38
39
LIST OF ABBREVIATIONS
Abbreviation MeaningAU Asset Utilization B Burden
BVE Book Value of Equity COL Cost of Liabilities EA Earning Assets
EAER Earning Assets to Equity Ratio EAR Earning Assets Ratio EAT Earnings After Taxes EM Equity Multiplier ER Expenses Ratio IE Interest Expenses
INIR Interest to Non-Interest Ratio IOA Interest on Assets IOE Interest on Equity IR Interest Revenues
ITIR Interest to Total Income Ratio LEA Liabilities to Earning Assets LLP Loan Loss Provisions
NEIR Net Earnings to Interest Ratio NENII Net Earnings to Net Interest Income NENIR Net Earnings to Non-Interest Ratio
NIE Non Interest Expenses NIEA Non-Interest on Earning Assets
NII Net Interest Income NIIOE Net Interest Income on Equity NIIR Net Interest to Interest Ratio
NIRTIR Non-Interest Revenues to Total Income Ratio NIM Net Interest Margin
NINIR Net Interest to Non-Interest Ratio NIOA Non-Interest on Assets NIOE Non-Interest on Equity NIR Non-Interest Revenues
NITIR Net Interest to Total Income Ratio NNII Net Non-Interest Income NOI Net Operating Income
NREA Net Return on Earning Assets PL Paying Liabilities PM Profit Margin
REA Return on Earning Assets ROA Return on Assets ROE Return on Equity
T Taxes TA Total Assets
TIEA Total Income on Earning Assets TIOE Total Income on Equity TOE Total Operating Expenses TOI Total Operating Income
40
MATRIX 1
Earning after taxes (EAT)
Y1
Net interest income (NII)
Y2
Interest revenues (IR)
Y3
Non-interest revenues (NIR)
Y4
Total operating income (TOI)
Y5
Earning assets (EA)
Y6
Total assets (TA)
Y7
Net interest income (NII)
Y2
x12= Y1 / Y2 Net Earnings to Net
Interest Income (NENII)
Interest revenues (IR) Y3
x13= Y1 / Y3 Net Earnings to Interest
Ratio (NEIR)
x23= Y2 / Y3 Net Interest to Interest
Ratio (NIIR)
Non-interest revenues (NIR)
Y4
x14= Y1 / Y4 Net Earnings to Non-
Interest Ratio (NENIR)
x24= Y2 / Y4 Net Interest to Non-
Interest Ratio (NINIR)
x34= Y3 / Y4 Interest to Non-Interest
Ratio (INIR)
Total operating income (TOI)
Y5
x15= Y1 / Y5 Profit Margin (PM)
x25= Y2 / Y5Net Interest to Total
Income Ratio (NITIR)
x35= Y3 / Y5 Interest to Total
Income Ratio (ITIR)
x45= Y4 / Y5 Non - Interest Revenues to Total Income Ratio
(NIRTIR)
Earning assets (EA)
Y6
x16= Y1 / Y6 Net Return on Earning
Assets (NREA)
x26= Y2 / Y6 Net Interest Margin15
(NIM1)
x36= Y3 / Y6 Return on Earning
Assets (REA)
x46= Y4 / Y6 Non - Interest on
Earning Assets (NIEA)
x56= Y5 / Y6 Total Income on
Earning Assets (TIEA)
Total assets (TA) Y7
x17= Y1 / Y7 Return on Assets (ROA)
x27= Y2 / Y7 Net Interest Margin15
(NIM2)
x37= Y3 / Y7 Interest on Assets
(IOA)
x47= Y4 / Y7 Non - Interest on Assets
(NIOA)
x57= Y5 / Y7 Asset Utilization
(AU)
x67= Y6 / Y7 Earning Assets Ratio
(EAR)
Book value of equity (BVE)
Y8
x18= Y1 / Y8 Return on Equity (ROE)
x28= Y2 / Y8 Net Interest Income on Equity (NIIOE)
x38= Y3 / Y8 Interest on Equity
(IOE)
x48= Y4 / Y8 Non - Interest on Equity
(NIOE)
x58= Y5 / Y8 Total Income on Equity
(TIOE)
x68= Y6 / Y8 Earning Assets to
Equity Ratio (EAER)
x78= Y7 / Y8 Equity
Multiplier (EM)
15 The net interest margin may be measured in two ways: Net interest income to Earning assets (x26) or Net interest income to Total assets (x27), (Kalluci, 2008).
MATRIX 2
Earning after taxes (EAT)
Y1
Net interest income (NII)
Y2
Interest revenues (IR) Y3
Non-Interest revenues (NIR)
Y4
Total operating income (TOI)
Y5
Earning assets (EA)
Y6
Total assets (TA)
Y7
Net interest income (NII)
Y2
NENII 51.9% (2001) 40.2% (2005) 23.8% (2008)
Interest revenues (IR)
Y3
NEIR 20.7% (2001) 22.0% (2005) 12.2% (2008)
NIIR 39.9% (2001) 54.8% (2005) 51.2% (2008)
Non-Interest revenues (NIR)
Y4
NENIR 69.9% (2001) 79.4% (2005) 72.2% (2008)
NINIR 134.5% (2001) 197.5% (2005) 302.8% (2008)
INIR 336.9% (2001) 360.5% (2005) 591.9% (2008)
Total operating income (TOI)
Y5
PM 16% (2001) 17.2% (2005) 10.4% (2008)
NITIR 30.8% (2001) 42.9% (2005) 43.8% (2008)
ITIR 77.1% (2001) 78.3% (2005) 85.5% (2008)
NIRTIR 22.9% (2001) 21.7% (2005) 14.5% (2008)
Earning assets (EA)
Y6
NREA 1.7% (2001) 1.5% (2005) 1.0% (2008)
NIM13.4% (2001) 3.7% (2005) 4.1% (2008)
REA 8.4% (2001) 6.8% (2005) 8.1% (2008)
NIEA 2.5% (2001) 1.9% (2005) 1.4% (2008)
TIEA 10.9% (2001) 8.7% (2005) 9.4% (2008)
Total assets (TA)
Y7
ROA 1.6% (2001) 1.4% (2005) 0.9% (2008)
NIM23.0% (2001) 3.5% (2005) 3.8% (2008)
IOA 7.6% (2001) 6.4% (2005) 7.5% (2008)
NIOA 2.3% (2001) 1.8% (2005) 1.3% (2008)
AU 9.9% (2001) 8.2% (2005) 8.8% (2008)
EAR 91.0% (2001) 93.3% (2005) 93.0% (2008)
Book value of equity (BVE)
Y8
ROE 23.4% (2001) 22.4% (2005) 11.4% (2008)
NIIOE 45.1% (2001) 55.8% (2005) 47.6% (2008)
IOE 113.1% (2001) 101.9% (2005) 93.1% (2008)
NIOE 33.6% (2001) 28.3% (2005) 15.7% (2008)
TIOE 146.6% (2001) 130.1% (2005) 108.8% (2008)
EAER 13.47 (2001) 14.89 (2005) 11.55 (2008)
EM 14.81 (2001) 15.96 (2005) 12.42 (2008)
41

42
Special Conference Papers
3rd South-Eastern European Economic Research Workshop Bank of Albania-Bank of Greece Athens, 19-21 November, 2009
1. Hardouvelis, Gikas, Keynote address: “The World after the Crisis: S.E.E. Challenges & Prospects”, February 2011.
2. Tanku, Altin “Another View of Money Demand and Black Market Premium Relationship: What Can They Say About Credibility?”, February 2011.
3. Kota, Vasilika “The Persistence of Inflation in Albania”, including discussion by Sophia Lazaretou, February 2011.
4. Kodra, Oriela “Estimation of Weights for the Monetary Conditions Index in Albania”, including discussion by Michael Loufir, February 2011.
5. Pisha, Arta “Eurozone Indices: A New Model for Measuring Central Bank Independence”, including discussion by Eugenie Garganas, February 2011.
6. Kapopoulos, Panayotis and Sophia Lazaretou “International Banking and Sovereign Risk Calculus: the Experience of the Greek Banks in SEE”, including discussion by Panagiotis Chronis, February 2011.
7. Shijaku, Hilda and Kliti Ceca “A Credit Risk Model for Albania” including discussion by Faidon Kalfaoglou, February 2011.
8. Kalluci, Irini “Analysis of the Albanian Banking System in a Risk-Performance Framework”, February 2011.
9. Georgievska, Ljupka, Rilind Kabashi, Nora Manova-Trajkovska, Ana Mitreska, Mihajlo Vaskov “Determinants of Lending Rates and Interest Rate Spreads”, including discussion by Heather D. Gibson, February 2011.
10. Kristo, Elsa “Being Aware of Fraud Risk”, including discussion by Elsida Orhan, February 2011.
11. Malakhova, Tatiana “The Probability of Default: a Sectoral Assessment", including discussion by Vassiliki Zakka, February 2011.
12. Luçi, Erjon and Ilir Vika “The Equilibrium Real Exchange Rate of Lek Vis-À-Vis Euro: Is It Much Misaligned?”, including discussion by Dimitrios Maroulis, February 2011.
13. Dapontas, Dimitrios “Currency Crises: The Case of Hungary (2008-2009) Using Two Stage Least Squares”, including discussion by Claire Giordano, February 2011.
43