2nd CFO Forum 19 June 2012 - · PDF fileClients seeking finance ... Current Assets 16.312.698...
39
1 2nd CFO Forum 19 June 2012
-
Upload
nguyenhanh -
Category
Documents
-
view
216 -
download
1
Transcript of 2nd CFO Forum 19 June 2012 - · PDF fileClients seeking finance ... Current Assets 16.312.698...
1
2nd CFO Forum19 June 2012
2
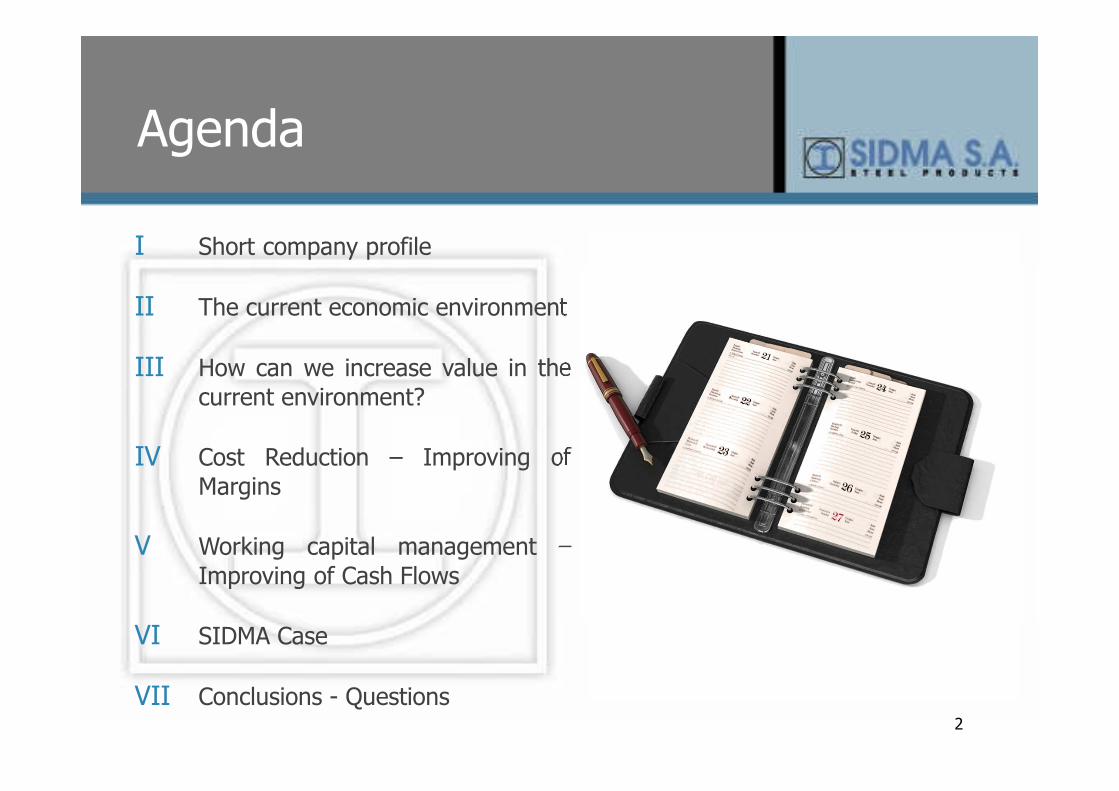
Ι Short company profile
ΙΙ The current economic environment
ΙΙΙ How can we increase value in the
current environment?
ΙV Cost Reduction – Improving of
Margins
V Working capital management –
Improving of Cash Flows
VI SIDMA Case
VII Conclusions - Questions
Agenda
3
Ι. Short Company Profile : 1. Sidma at a Glance
2. Typical Product & Services
3. Geographic Coverage
4
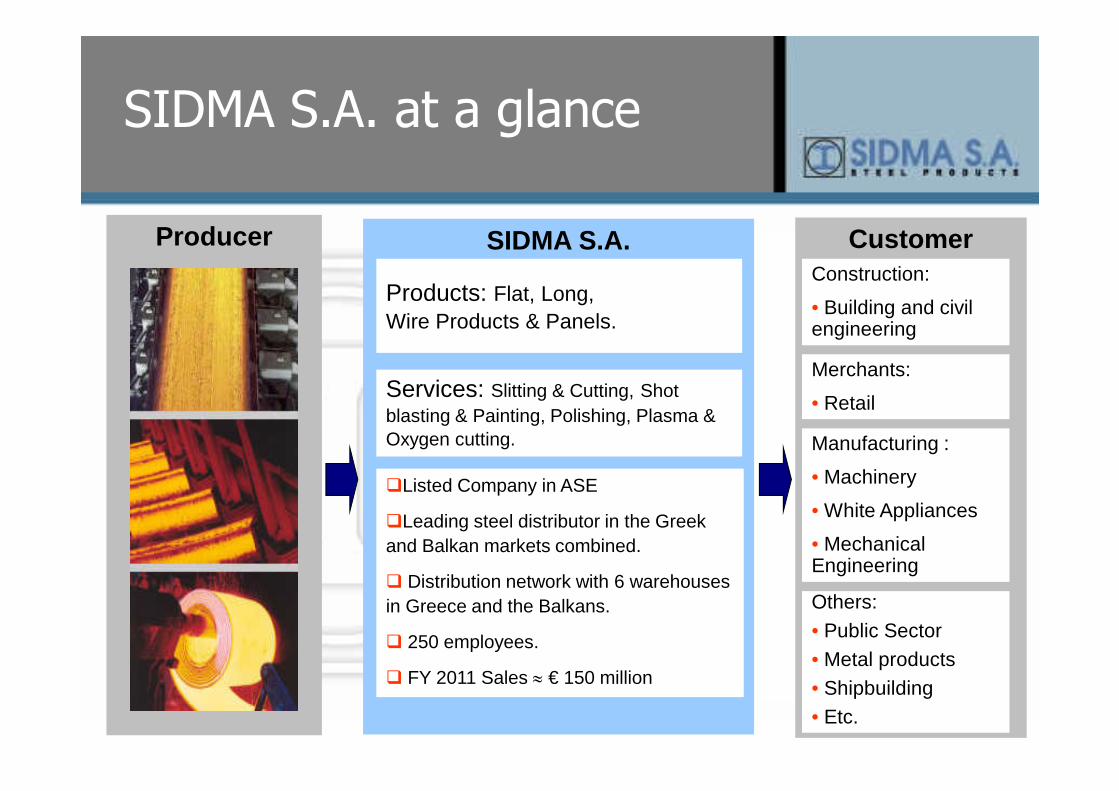
SIDMA S.A. at a glance
Producer SIDMA S.A.
Products: Flat, Long, Wire Products & Panels.
Services: Slitting & Cutting, Shot blasting & Painting, Polishing, Plasma & Oxygen cutting.
�Listed Company in ASE
�Leading steel distributor in the Greek and Balkan markets combined.
� Distribution network with 6 warehouses in Greece and the Balkans.
� 250 employees.
� FY 2011 Sales ≈ € 150 million
CustomerConstruction:
• Building and civil engineering
Manufacturing :
• Machinery
• White Appliances
• Mechanical Engineering
Others:• Public Sector• Metal products• Shipbuilding• Etc.
Merchants:
• Retail
5
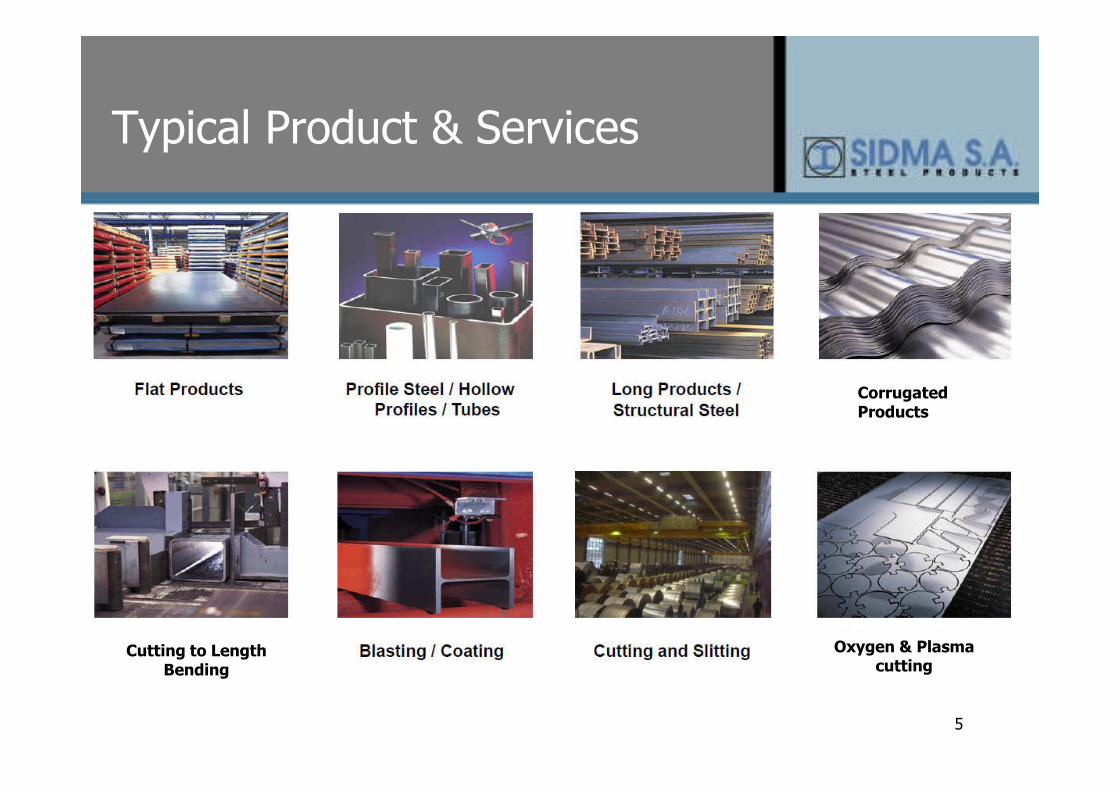
Typical Product & Services
Corrugated Products
Cutting to LengthBending
Oxygen & Plasma cutting
6
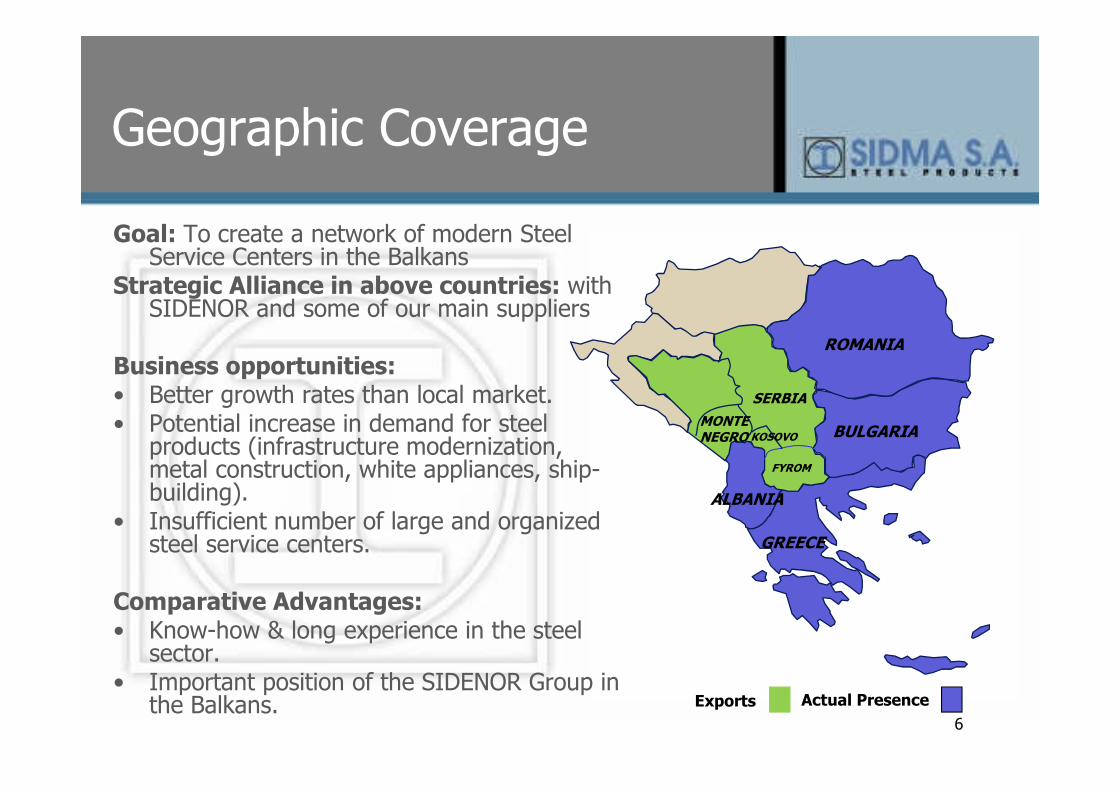
Geographic Coverage
Goal: To create a network of modern Steel Service Centers in the Balkans
Strategic Alliance in above countries: with SIDENOR and some of our main suppliers
Business opportunities:• Better growth rates than local market.• Potential increase in demand for steel
products (infrastructure modernization, metal construction, white appliances, ship-building).
• Insufficient number of large and organized steel service centers.
Comparative Advantages:• Know-how & long experience in the steel
sector.• Important position of the SIDENOR Group in
the Balkans.
ALBANIA
GREECE
BULGARIA
ROMANIA
Actual PresenceExports
FYROM
SERBIA
MONTENEGRO KOSOVO
7
ΙI. Current Economic Environment
1. Euro Area Sovereign Crisis
2. The Impact
8
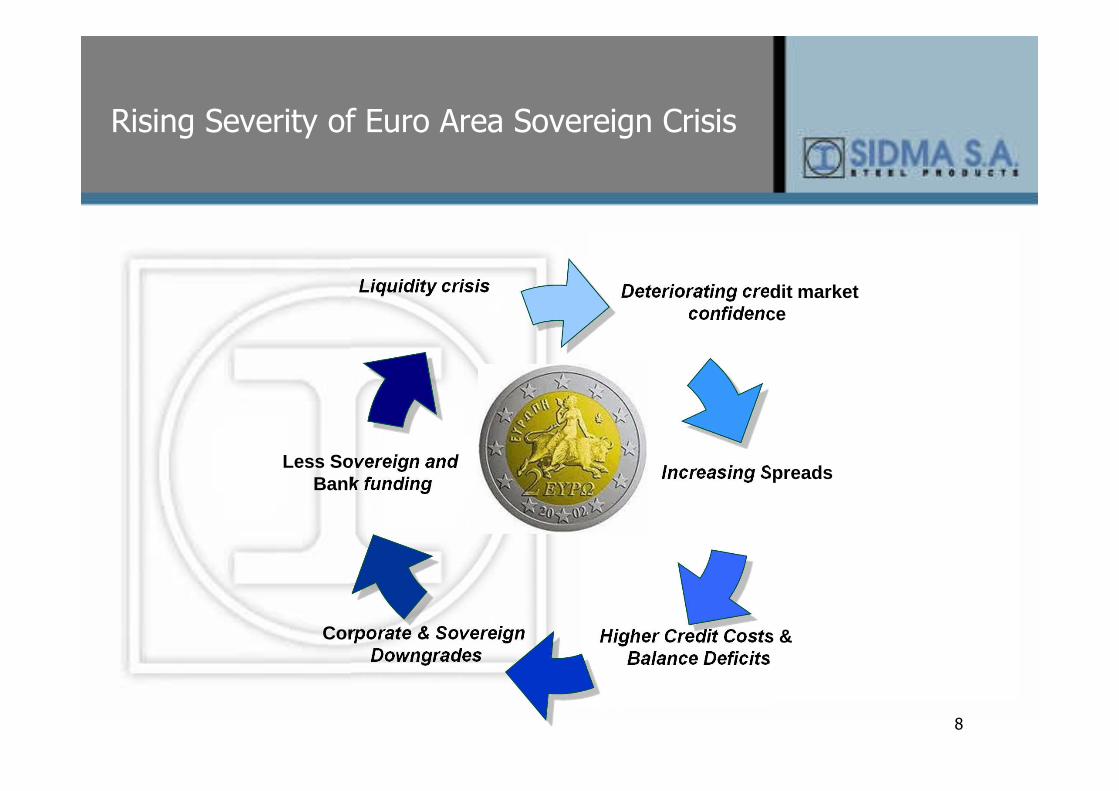
Rising Severity of Euro Area Sovereign Crisis
Increasing Spreads
Higher Credit Costs & Balance Deficits
Corporate & Sovereign Downgrades
Less Sovereign and Bank funding
Liquidity crisis Deteriorating credit market confidence
9
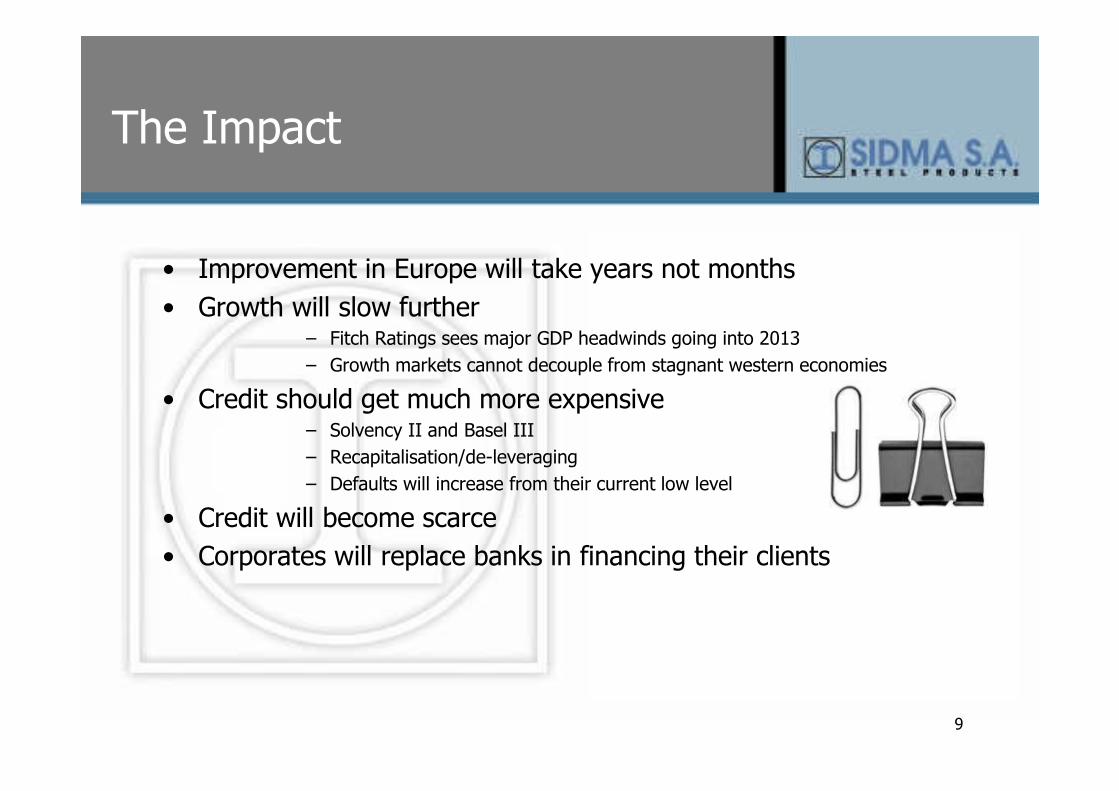
The Impact
• Improvement in Europe will take years not months
• Growth will slow further– Fitch Ratings sees major GDP headwinds going into 2013
– Growth markets cannot decouple from stagnant western economies
• Credit should get much more expensive– Solvency II and Basel III
– Recapitalisation/de-leveraging
– Defaults will increase from their current low level
• Credit will become scarce
• Corporates will replace banks in financing their clients
10
ΙII. Increase Shareholder Value
1. Increase profitability through cost cutting
2. Increase liquidity through Working Capital management
11
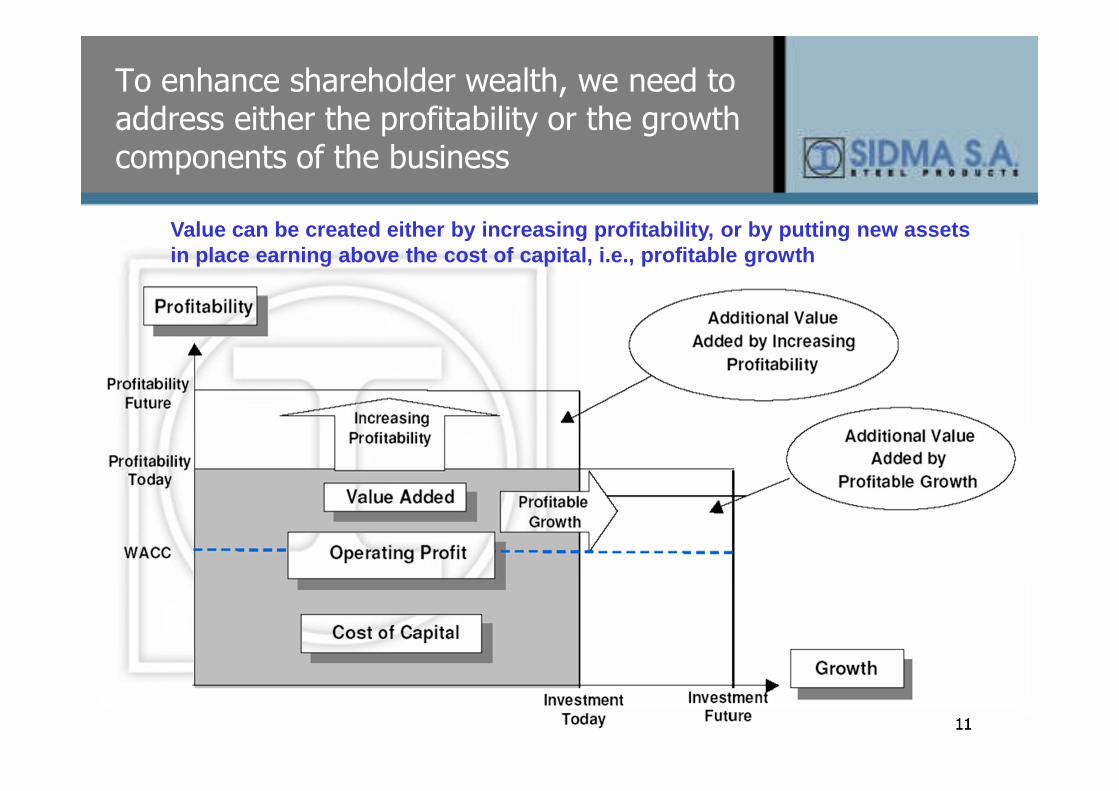
To enhance shareholder wealth, we need to address either the profitability or the growth components of the business
Value can be created either by increasing profitabi lity, or by putting new assets in place earning above the cost of capital, i.e., p rofitable growth
12
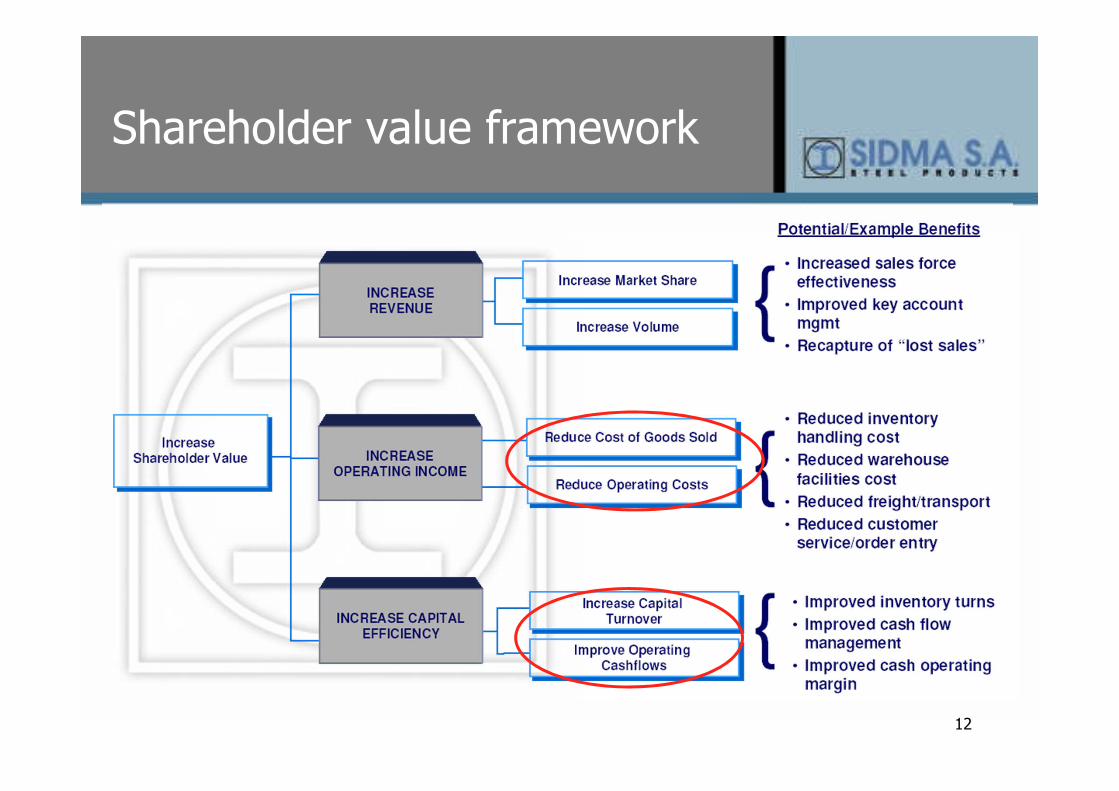
Shareholder value framework
13
IV. Cost Management
14
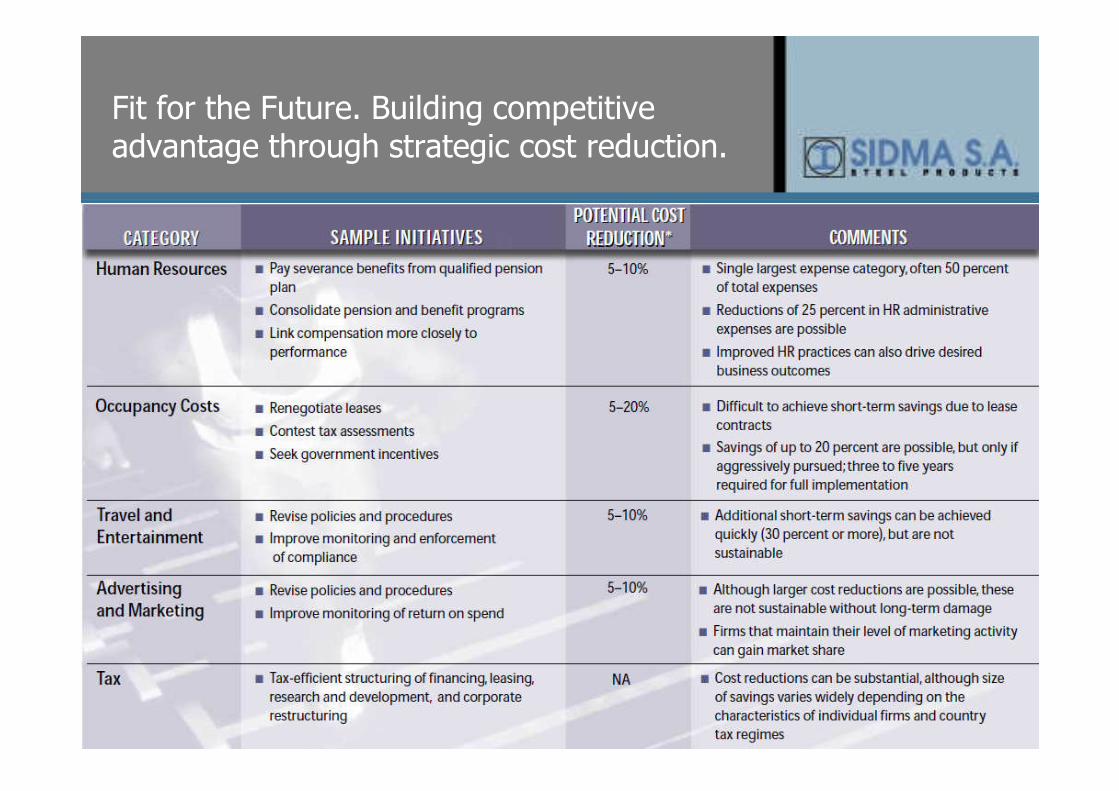
Fit for the Future. Building competitive advantage through strategic cost reduction.
15
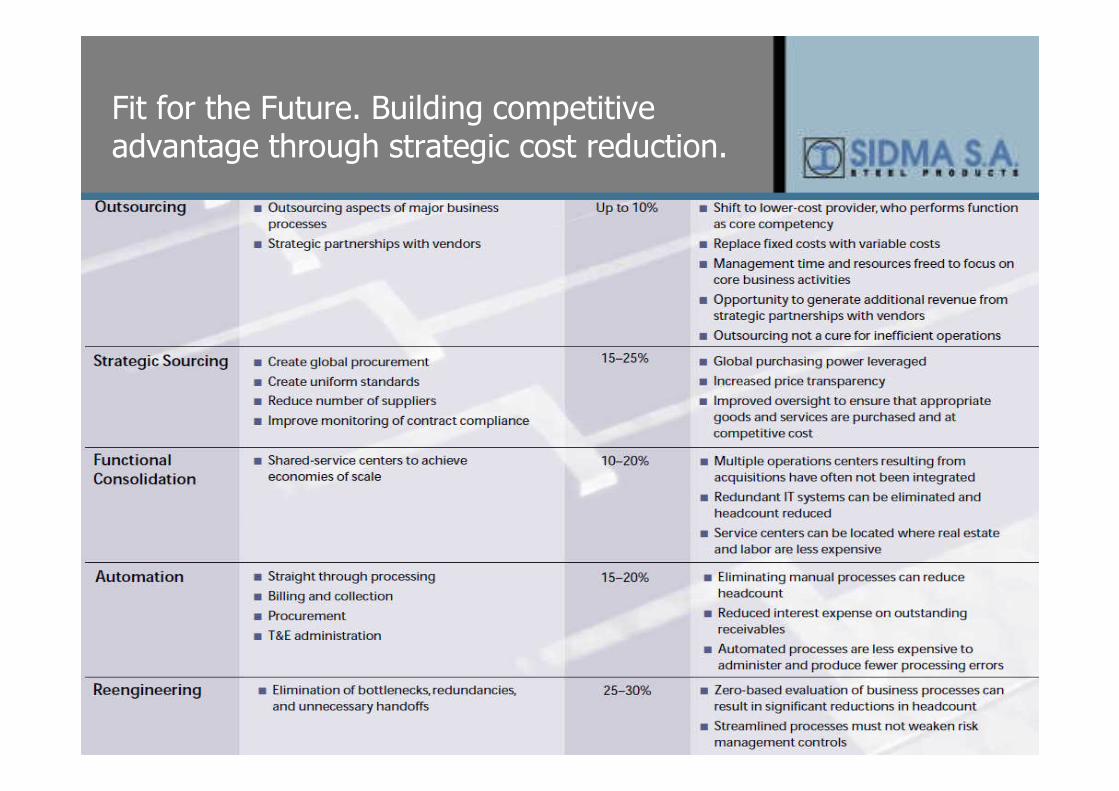
Fit for the Future. Building competitive advantage through strategic cost reduction.
16
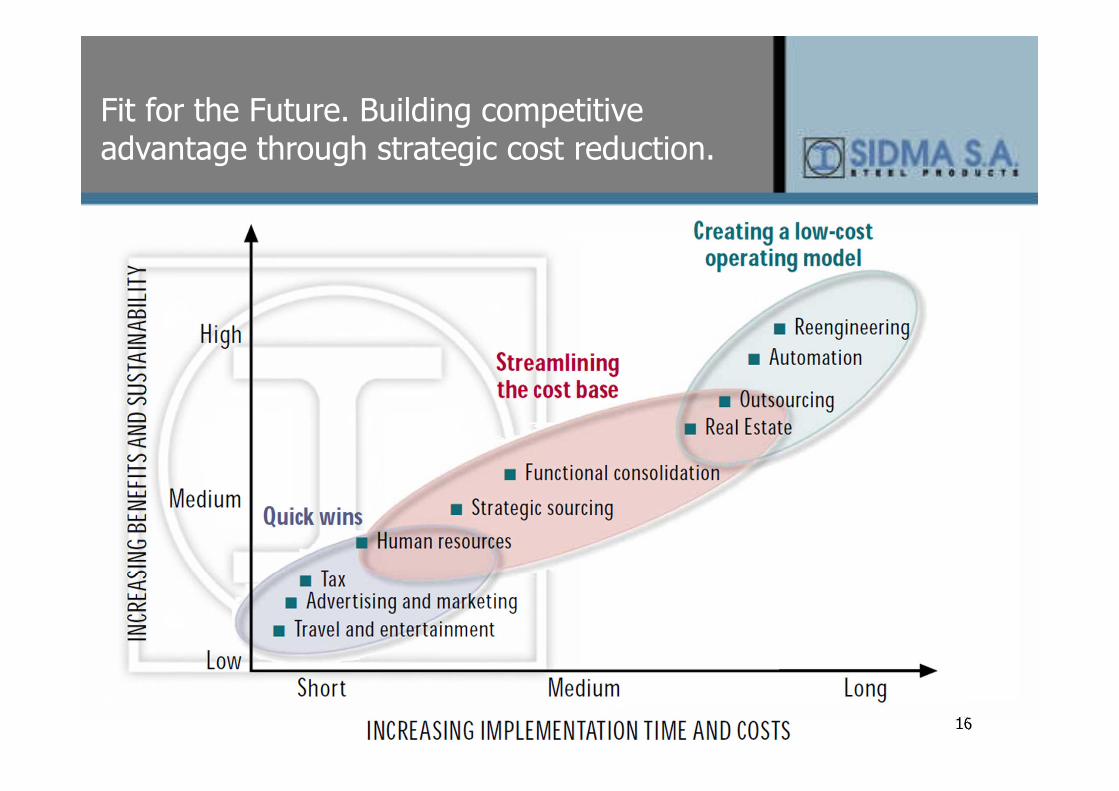
Fit for the Future. Building competitive advantage through strategic cost reduction.
17
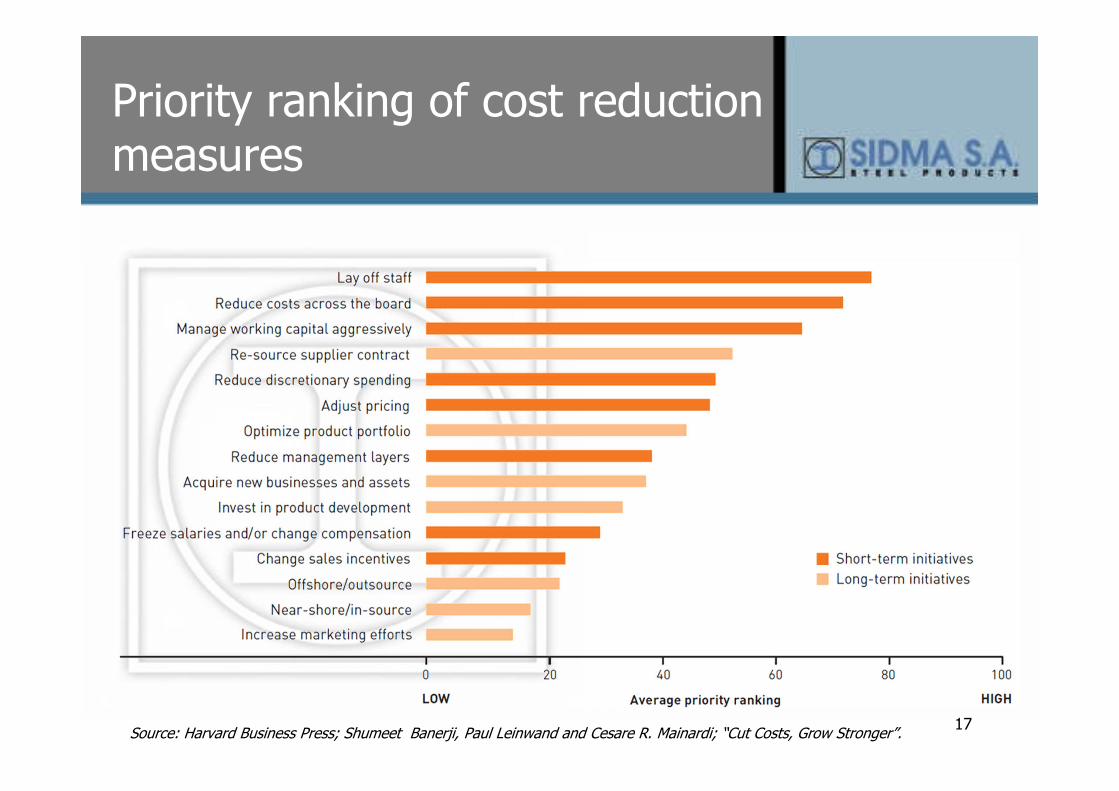
Priority ranking of cost reduction measures
Source: Harvard Business Press; Shumeet Banerji, Paul Leinwand and Cesare R. Mainardi; “Cut Costs, Grow Stronger”.
18
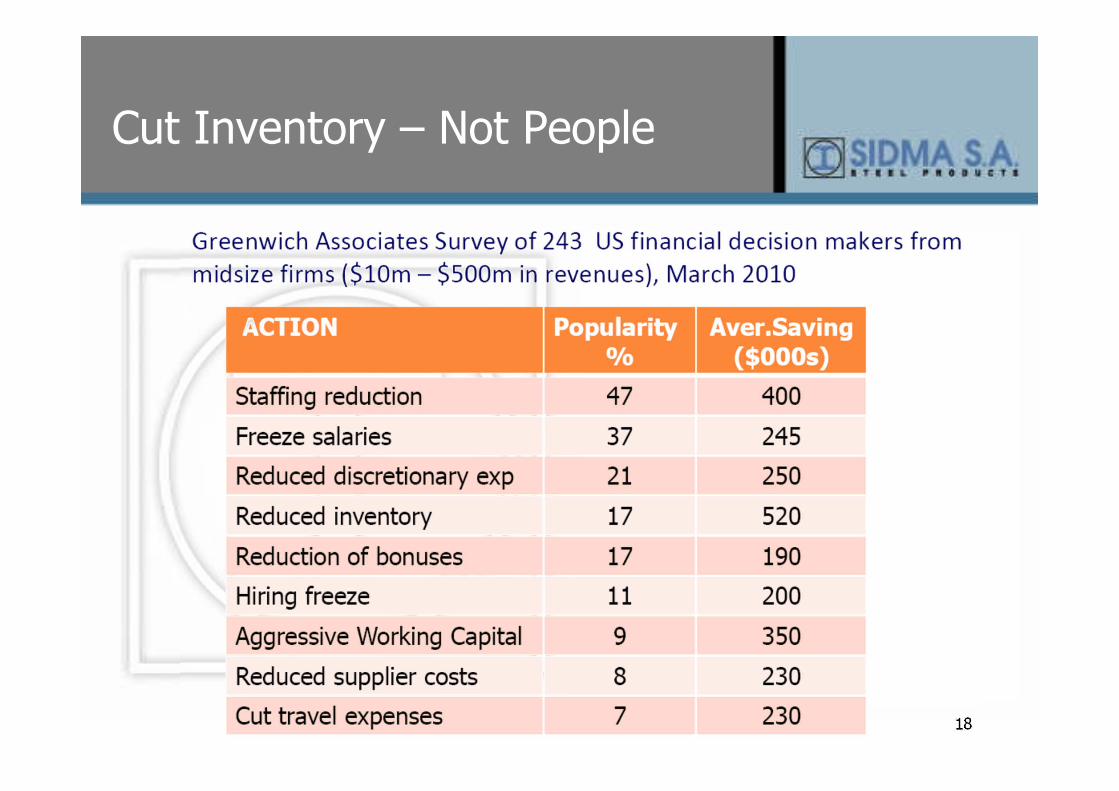
Cut Inventory – Not People

19
Workforce cost reduction – key areas of activity
20
Cost management challenges – Indirect Costs
• Staff and management have limited time and resources to address non-strategic costs.
• No internal benchmark data on purchases.
• Limited negotiating power.
• Lack of expertise and/or tools
• Multiple suppliers and multiple order points.
21
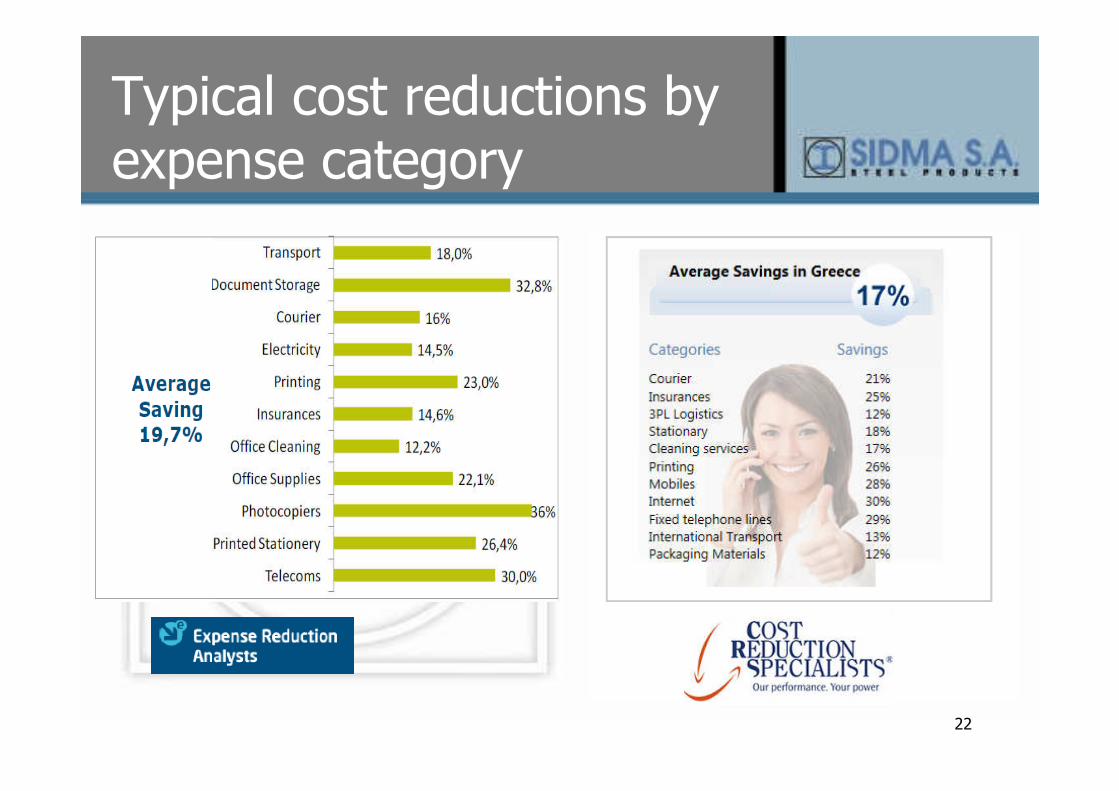
Top 12 Cost Categories
• Logistics & Transport• Courier• Energy• Packaging• Temporary & Outsourced Personnel – HR • Banking and Finance• Telecommunications • Insurance• Printing• Office Supplies• Leasing & Rental• Waste management
22
Typical cost reductions by expense category
23
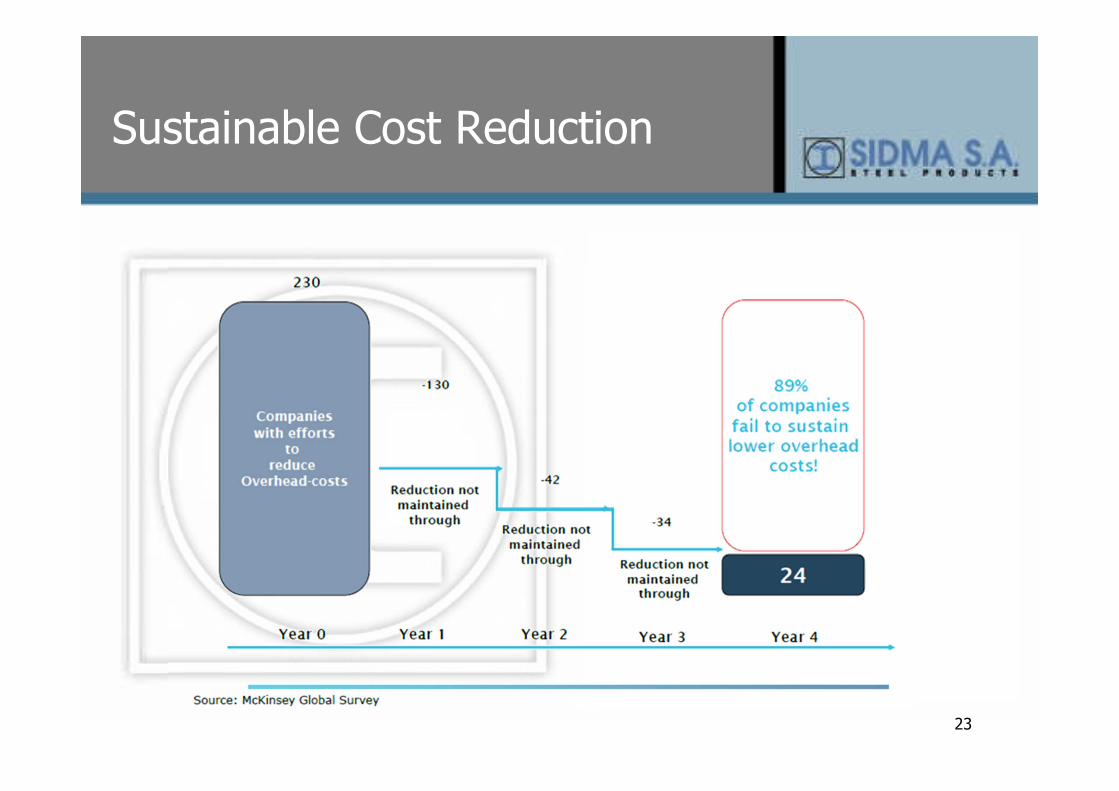
Sustainable Cost Reduction
24
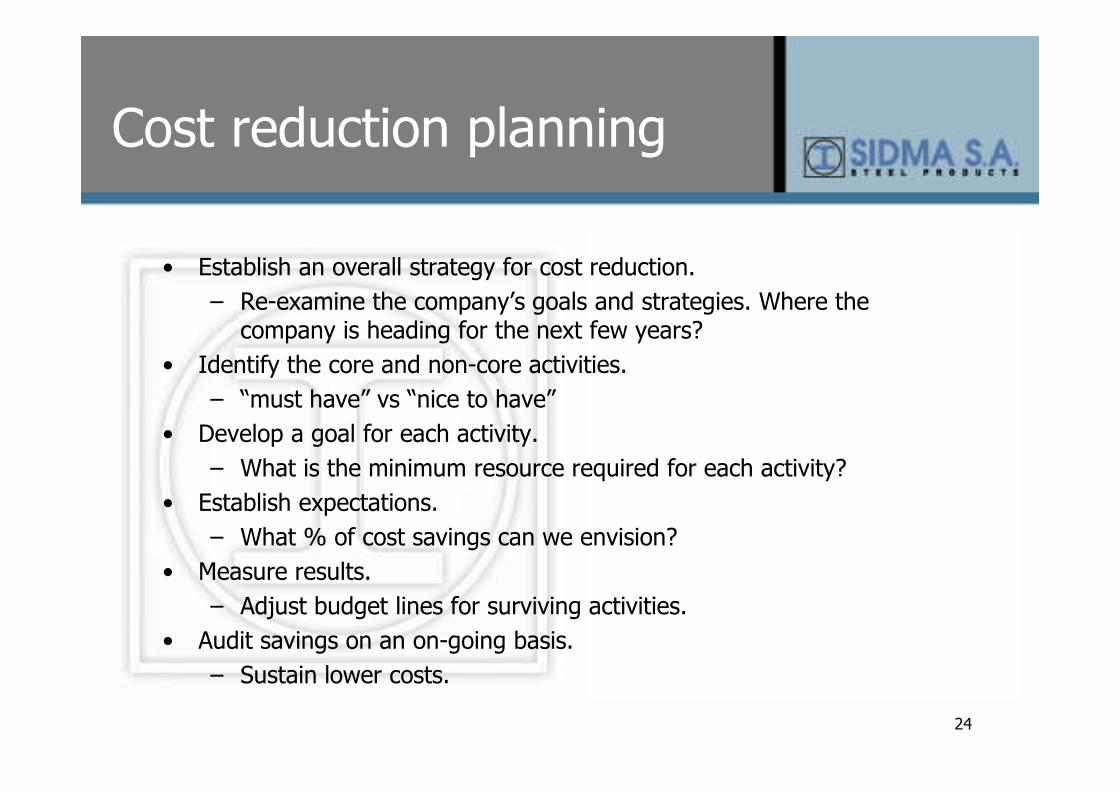
Cost reduction planning
• Establish an overall strategy for cost reduction.
– Re-examine the company’s goals and strategies. Where the company is heading for the next few years?
• Identify the core and non-core activities.
– “must have” vs “nice to have”
• Develop a goal for each activity.
– What is the minimum resource required for each activity?
• Establish expectations.
– What % of cost savings can we envision?
• Measure results.
– Adjust budget lines for surviving activities.
• Audit savings on an on-going basis.
– Sustain lower costs.
25
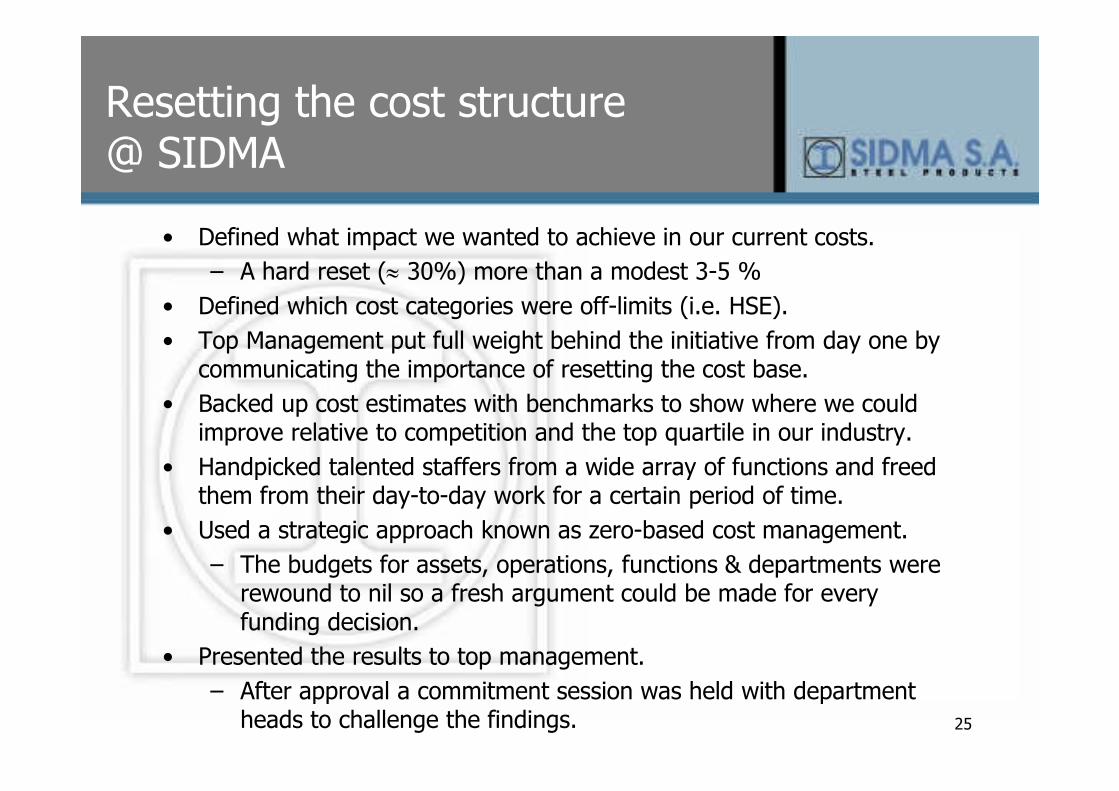
Resetting the cost structure @ SIDMA
• Defined what impact we wanted to achieve in our current costs.
– A hard reset (≈ 30%) more than a modest 3-5 %
• Defined which cost categories were off-limits (i.e. HSE).
• Top Management put full weight behind the initiative from day one by communicating the importance of resetting the cost base.
• Backed up cost estimates with benchmarks to show where we could improve relative to competition and the top quartile in our industry.
• Handpicked talented staffers from a wide array of functions and freed them from their day-to-day work for a certain period of time.
• Used a strategic approach known as zero-based cost management.
– The budgets for assets, operations, functions & departments were rewound to nil so a fresh argument could be made for every funding decision.
• Presented the results to top management.
– After approval a commitment session was held with department heads to challenge the findings.
26
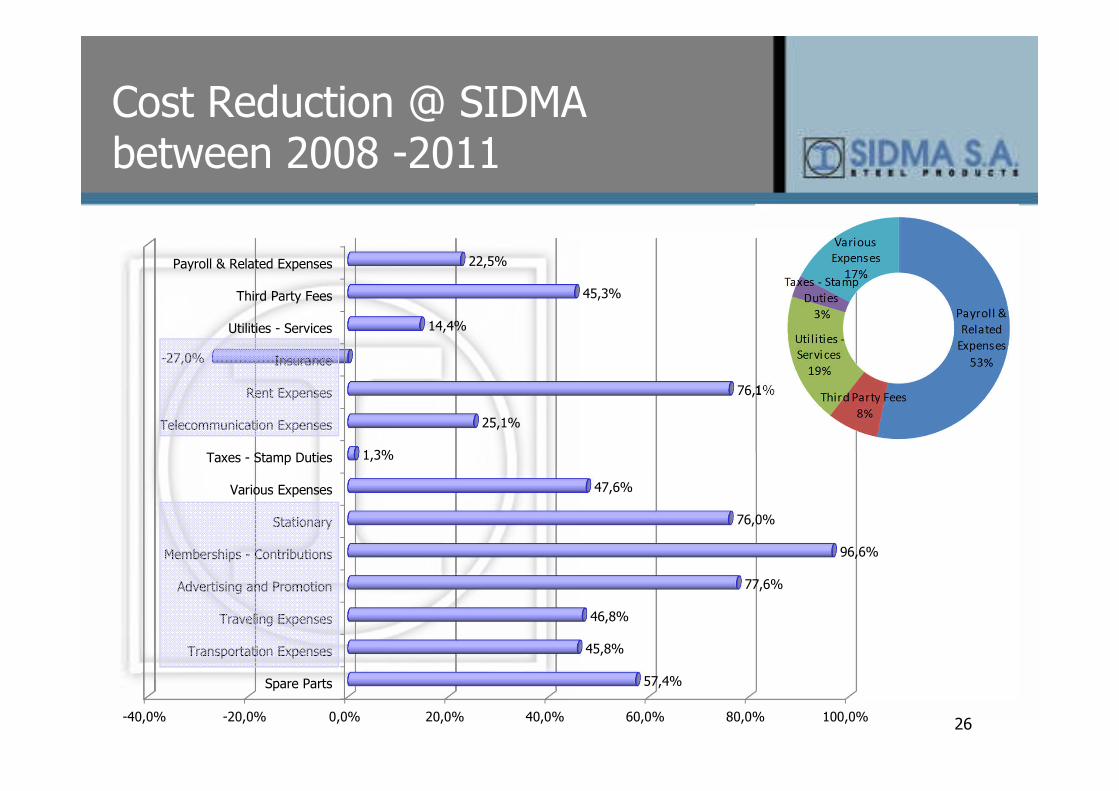
Cost Reduction @ SIDMA between 2008 -2011
-40,0% -20,0% 0,0% 20,0% 40,0% 60,0% 80,0% 100,0%
Spare Parts
Transportation Expenses
Traveling Expenses
Advertising and Promotion
Memberships - Contributions
Stationary
Various Expenses
Taxes - Stamp Duties
Telecommunication Expenses
Rent Expenses
Insurance
Utilities - Services
Third Party Fees
Payroll & Related Expenses
57,4%
45,8%
46,8%
77,6%
96,6%
76,0%
47,6%
1,3%
25,1%
76,1%
-27,0%
14,4%
45,3%
22,5%
27
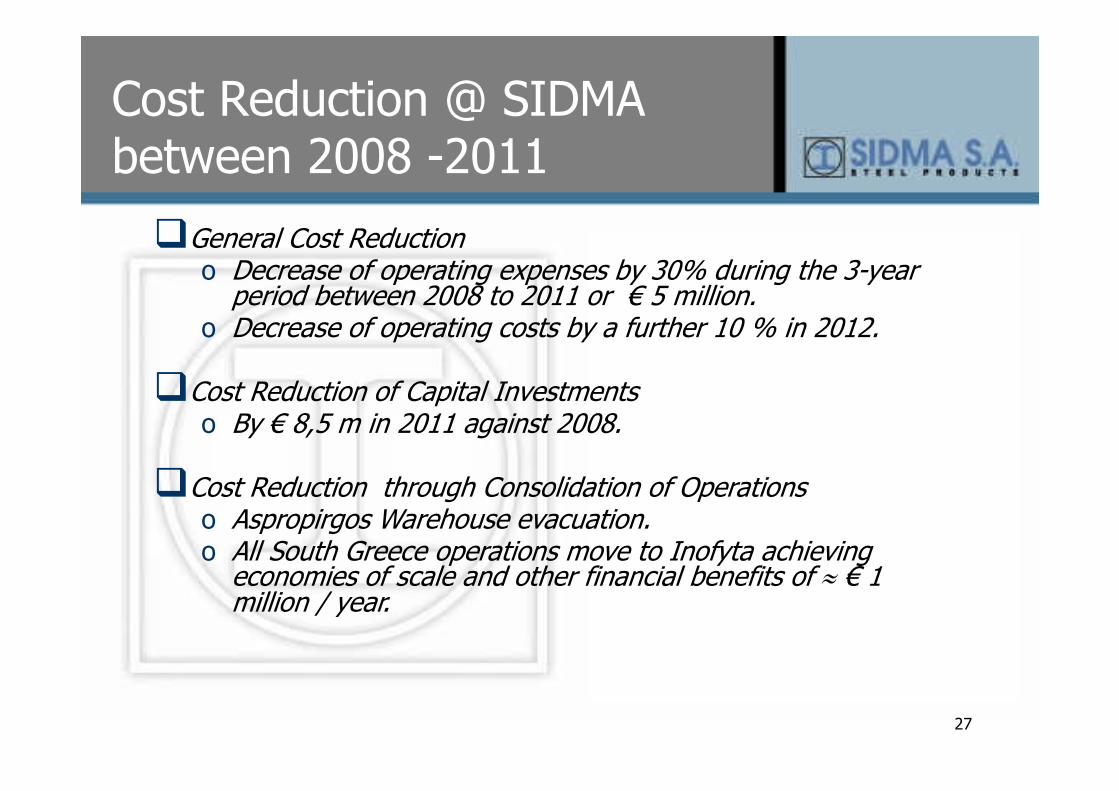
Cost Reduction @ SIDMA between 2008 -2011
�General Cost Reductiono Decrease of operating expenses by 30% during the 3-year
period between 2008 to 2011 or € 5 million. o Decrease of operating costs by a further 10 % in 2012.
�Cost Reduction of Capital Investmentso By € 8,5 m in 2011 against 2008.
�Cost Reduction through Consolidation of Operationso Aspropirgos Warehouse evacuation. o All South Greece operations move to Inofyta achieving
economies of scale and other financial benefits of ≈ € 1 million / year.
28
V. Capital Efficiency
29
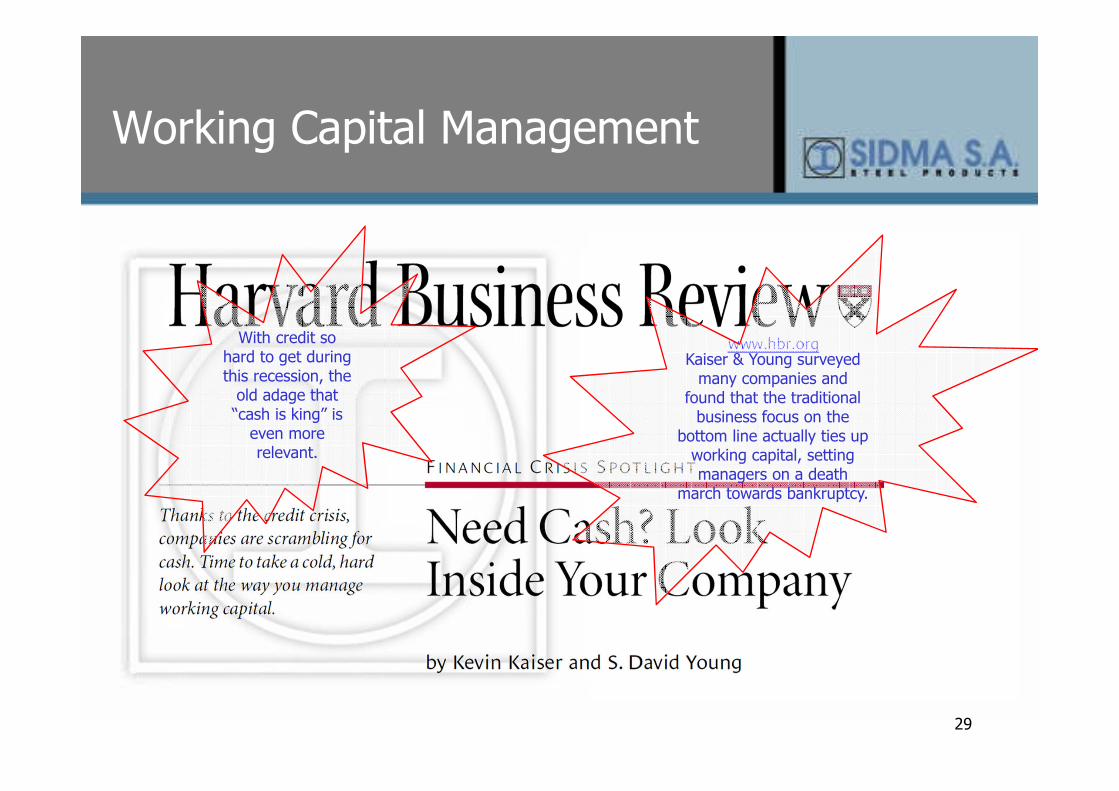
Working Capital Management
With credit so hard to get during this recession, the old adage that “cash is king” is
even morerelevant.
Kaiser & Young surveyed many companies and
found that the traditional business focus on the
bottom line actually ties up working capital, setting managers on a death
march towards bankruptcy.
30
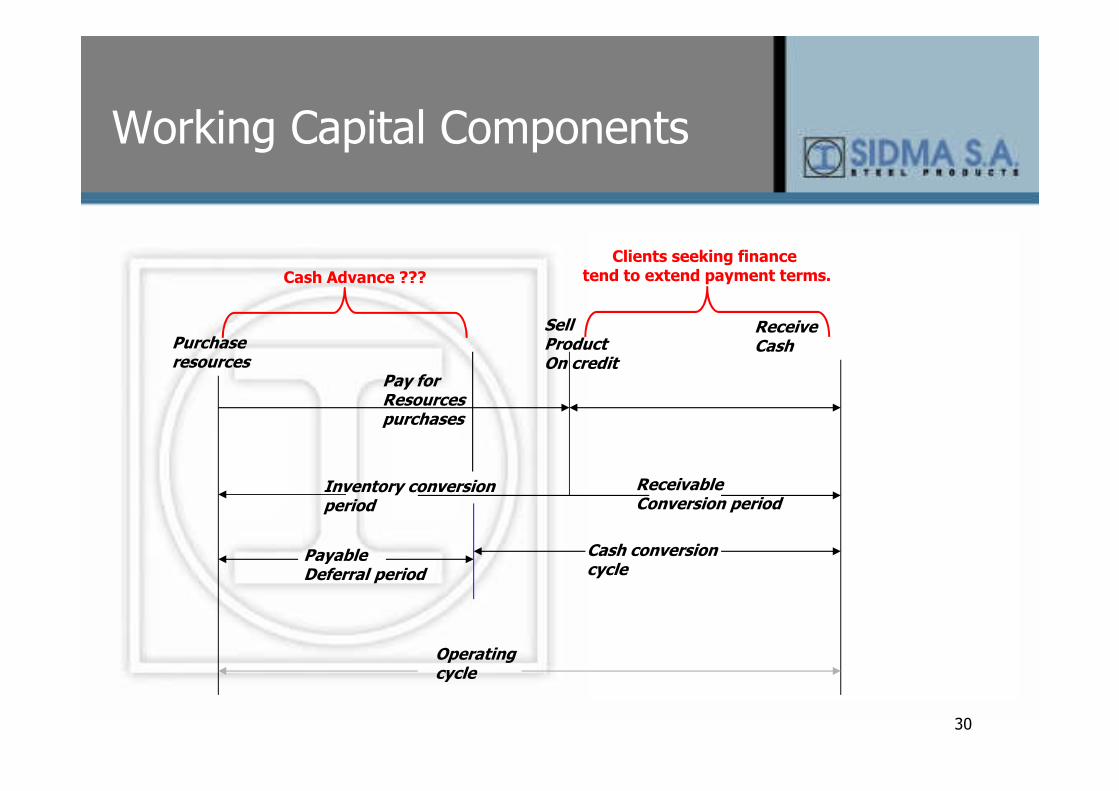
Working Capital Components
Payable Deferral period
Inventory conversionperiod
Cash conversioncycle
Operating cycle
Pay forResourcespurchases
Receive CashPurchase
resources
SellProductOn credit
Receivable Conversion period
Cash Advance ???
Clients seeking financetend to extend payment terms.
31
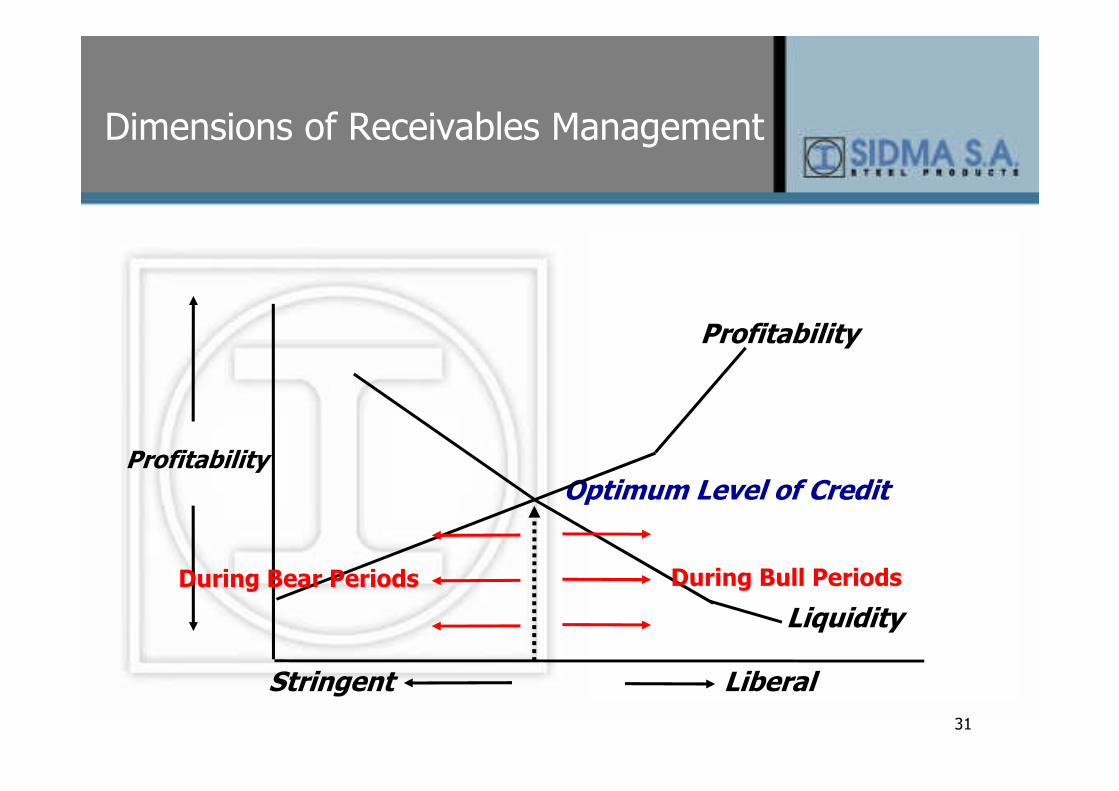
Dimensions of Receivables Management
Profitability
Profitability
Optimum Level of Credit
Liquidity
Stringent Liberal
During Bull PeriodsDuring Bear Periods
32
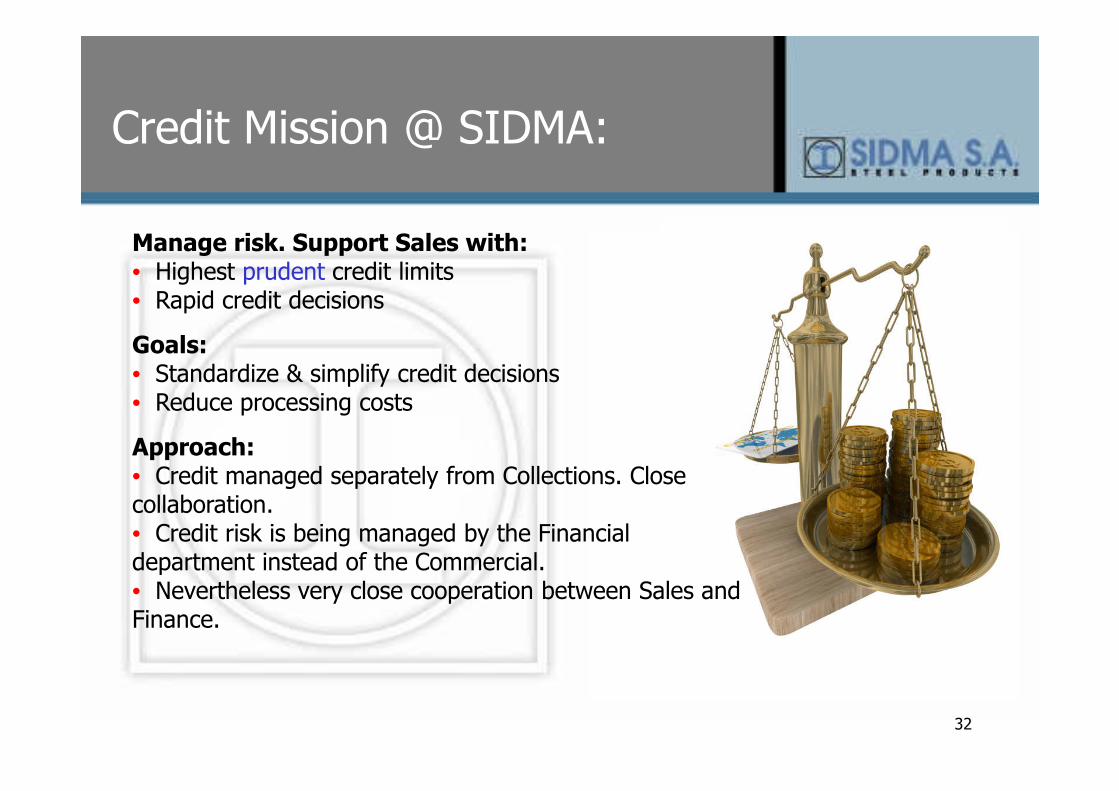
Credit Mission @ SIDMA:
Manage risk. Support Sales with:• Highest prudent credit limits• Rapid credit decisions
Goals: • Standardize & simplify credit decisions• Reduce processing costs
Approach:• Credit managed separately from Collections. Close collaboration.• Credit risk is being managed by the Financial department instead of the Commercial. • Nevertheless very close cooperation between Sales and Finance.
33
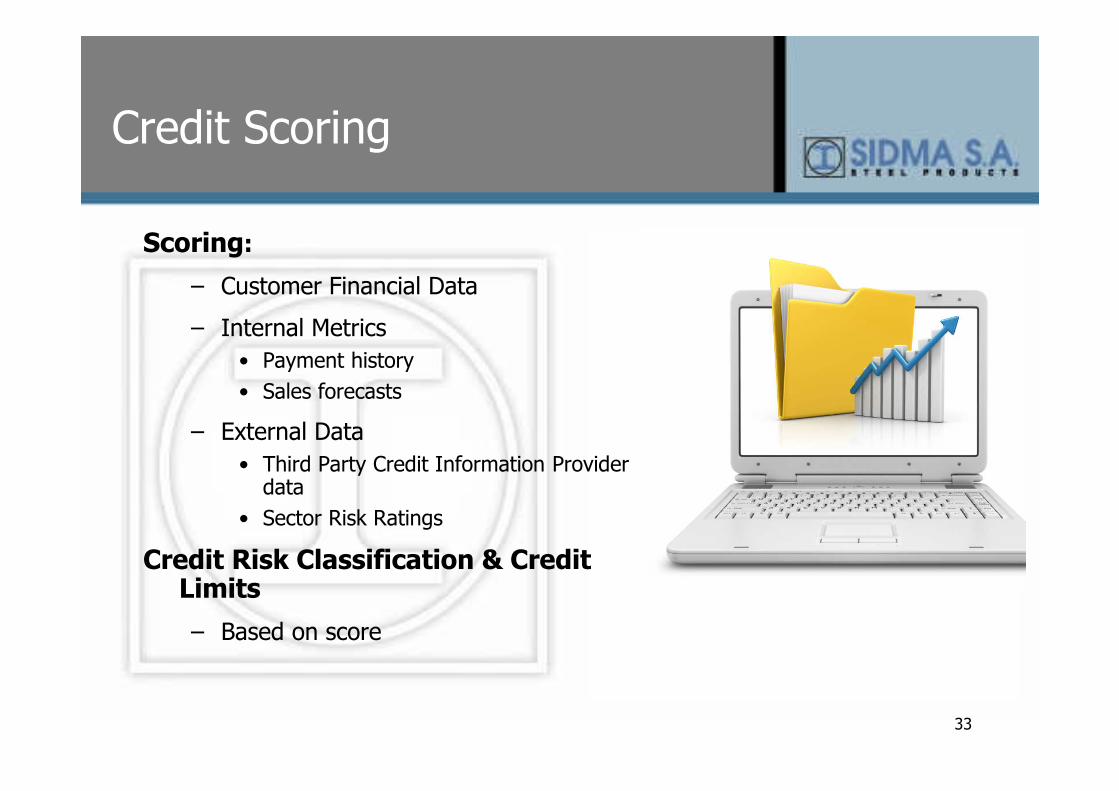
Scoring:
– Customer Financial Data
– Internal Metrics
• Payment history
• Sales forecasts
– External Data
• Third Party Credit Information Provider data
• Sector Risk Ratings
Credit Risk Classification & Credit Limits
– Based on score
Credit Scoring
34
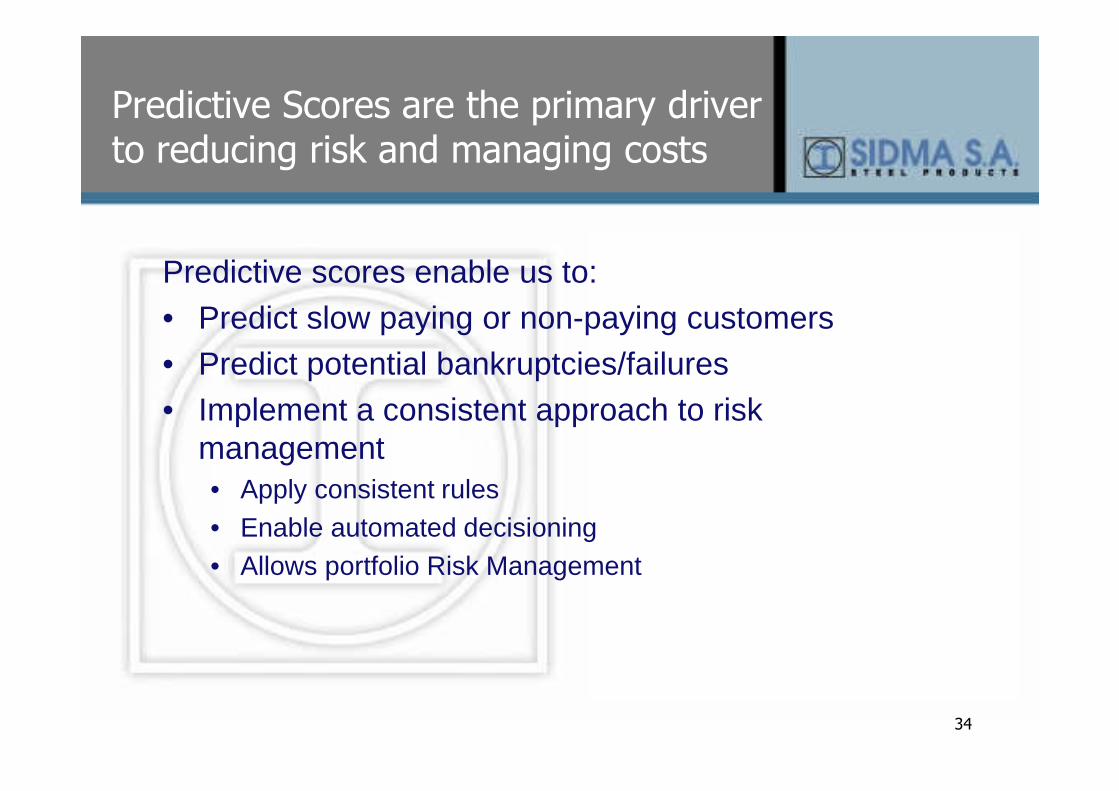
Predictive Scores are the primary driver to reducing risk and managing costs
Predictive scores enable us to:• Predict slow paying or non-paying customers• Predict potential bankruptcies/failures• Implement a consistent approach to risk
management• Apply consistent rules• Enable automated decisioning• Allows portfolio Risk Management
35
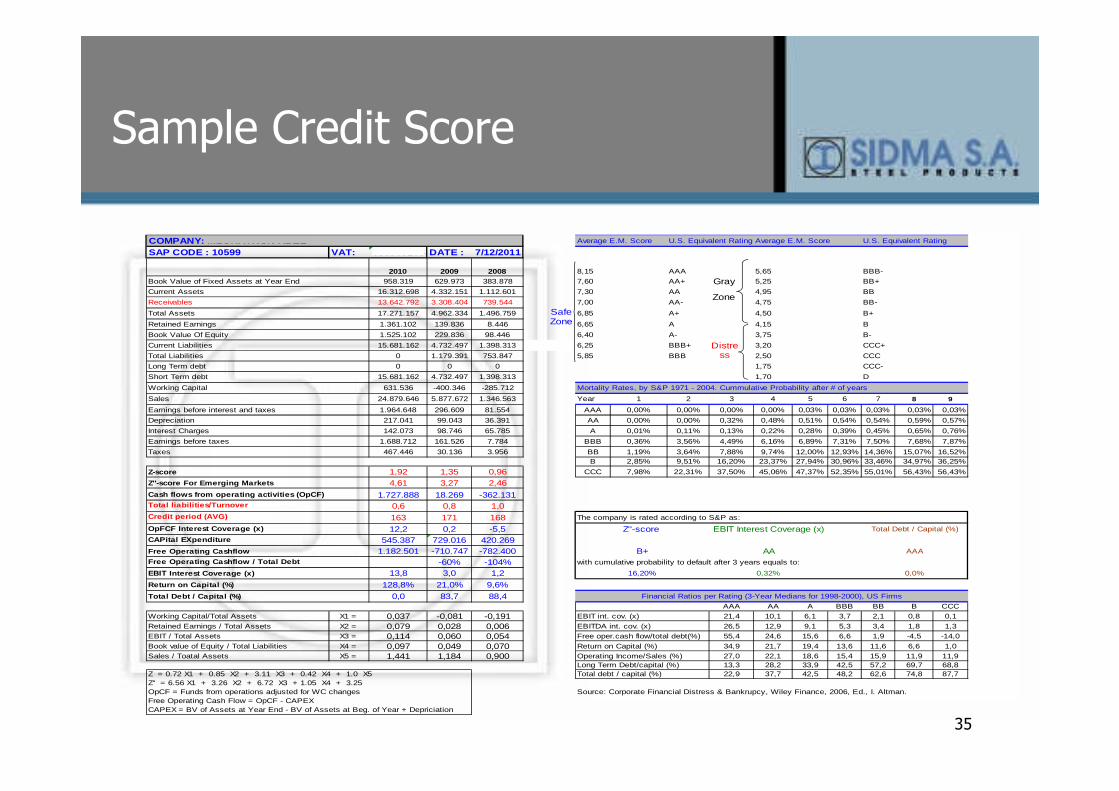
Sample Credit Score
COMPANY: MECHATRON ABEE Average E.M. Score U.S. Equivalent Rating Average E.M. Score U.S. Equivalent Rating
SAP CODE : 10599 VAT: 099709208 DATE : 7/12/2011
2010 2009 2008 8,15 AAA 5,65 BBB-
Book Value of Fixed Assets at Year End 958.319 629.973 383.878 7,60 AA+ 5,25 BB+
Current Assets 16.312.698 4.332.151 1.112.601 7,30 AA 4,95 BB
Receivables 13.642.792 3.308.404 739.544 7,00 AA- 4,75 BB-
Total Assets 17.271.157 4.962.334 1.496.759 6,85 A+ 4,50 B+
Retained Earnings 1.361.102 139.836 8.446 6,65 A 4,15 B
Book Value Of Equity 1.525.102 229.836 98.446 6,40 A- 3,75 B-
Current Liabilities 15.681.162 4.732.497 1.398.313 6,25 BBB+ 3,20 CCC+
Total Liabilities 0 1.179.391 753.847 5,85 BBB 2,50 CCC
Long Term debt 0 0 0 1,75 CCC-
Short Term debt 15.681.162 4.732.497 1.398.313 1,70 D
Working Capital 631.536 -400.346 -285.712
Sales 24.879.646 5.877.672 1.346.563 Year 1 2 3 4 5 6 7 8 9
Earnings before interest and taxes 1.964.648 296.609 81.554 AAA 0,00% 0,00% 0,00% 0,00% 0,03% 0,03% 0,03% 0,03% 0,03%
Depreciation 217.041 99.043 36.391 AA 0,00% 0,00% 0,32% 0,48% 0,51% 0,54% 0,54% 0,59% 0,57%
Interest Charges 142.073 98.746 65.785 A 0,01% 0,11% 0,13% 0,22% 0,28% 0,39% 0,45% 0,65% 0,76%
Earnings before taxes 1.688.712 161.526 7.784 BBB 0,36% 3,56% 4,49% 6,16% 6,89% 7,31% 7,50% 7,68% 7,87%
Taxes 467.446 30.136 3.956 BB 1,19% 3,64% 7,88% 9,74% 12,00% 12,93% 14,36% 15,07% 16,52%B 2,85% 9,51% 16,20% 23,37% 27,94% 30,96% 33,46% 34,97% 36,25%
Z-score 1,92 1,35 0,96 CCC 7,98% 22,31% 37,50% 45,06% 47,37% 52,35% 55,01% 56,43% 56,43%
Z''-score For Emerging Markets 4,61 3,27 2,46Cash flows from operating activities (OpCF) 1.727.888 18.269 -362.131Total liabilities/Turnover 0,6 0,8 1,0Credit period (AVG) 163 171 168 The company is rated according to S&P as:
OpFCF Interest Coverage (x) 12,2 0,2 -5,5CAPital EXpenditure 545.387 729.016 420.269Free Operating Cashflow 1.182.501 -710.747 -782.400Free Operating Cashflow / Total Debt -60% -104% with cumulative probability to default after 3 years equals to:
ΕΒΙΤ Interest Coverage (x) 13,8 3,0 1,2Return on Capital (%) 128,8% 21,0% 9,6%Total Debt / Capital (%) 0,0 83,7 88,4
AAA AA A BBB BB B CCC
Working Capital/Total Assets X1 = 0,037 -0,081 -0,191 EBIT int. cov. (x) 21,4 10,1 6,1 3,7 2,1 0,8 0,1
Retained Earnings / Total Assets X2 = 0,079 0,028 0,006 EBITDA int. cov. (x) 26,5 12,9 9,1 5,3 3,4 1,8 1,3
EBIT / Total Assets X3 = 0,114 0,060 0,054 55,4 24,6 15,6 6,6 1,9 -4,5 -14,0
Book value of Equity / Total Liabilities X4 = 0,097 0,049 0,070 Return on Capital (%) 34,9 21,7 19,4 13,6 11,6 6,6 1,0
Sales / Toatal Assets X5 = 1,441 1,184 0,900 Operating Income/Sales (%) 27,0 22,1 18,6 15,4 15,9 11,9 11,9Long Term Debt/capital (%) 13,3 28,2 33,9 42,5 57,2 69,7 68,8
Z = 0.72 X1 + 0.85 X2 + 3.11 X3 + 0.42 X4 + 1.0 X5 Total debt / capital (%) 22,9 37,7 42,5 48,2 62,6 74,8 87,7Z'' = 6.56 X1 + 3.26 X2 + 6.72 X3 + 1.05 X4 + 3.25OpCF = Funds from operations adjusted for WC changes Source: Corporate Financial Distress & Bankrupcy, Wiley Finance, 2006, Ed., I. Altman.Free Operating Cash Flow = OpCF - CAPEXCAPEX = BV of Assets at Year End - BV of Assets at Beg. οf Year + Depriciation
0,0%
AAAB+
16,20%
Z''-score ΕΒΙΤ Interest Coverage (x)
AA
0,32%
Free oper.cash flow/total debt(%)
Financial Ratios per Rating (3-Year Medians for 1998-2000), US Firms
Mortality Rates, by S&P 1971 - 2004. Cummulative Probability after # of years
Total Debt / Capital (%)
Safe Zone
Gray
Zone
Distress
36
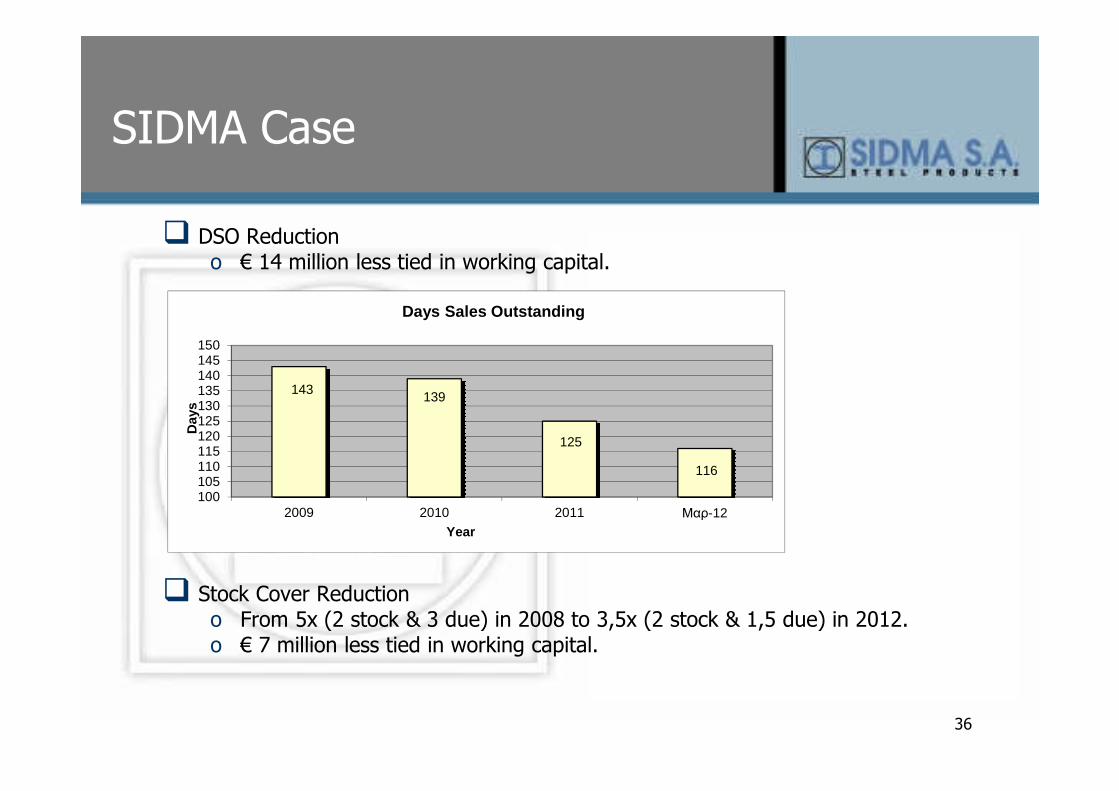
SIDMA Case
� DSO Reductiono € 14 million less tied in working capital.
� Stock Cover Reductiono From 5x (2 stock & 3 due) in 2008 to 3,5x (2 stock & 1,5 due) in 2012.o € 7 million less tied in working capital.
143 139
125
116
100105110115120125130135140145150
2009 2010 2011 Μαρ-12
Day
s
Year
Days Sales Outstanding
37
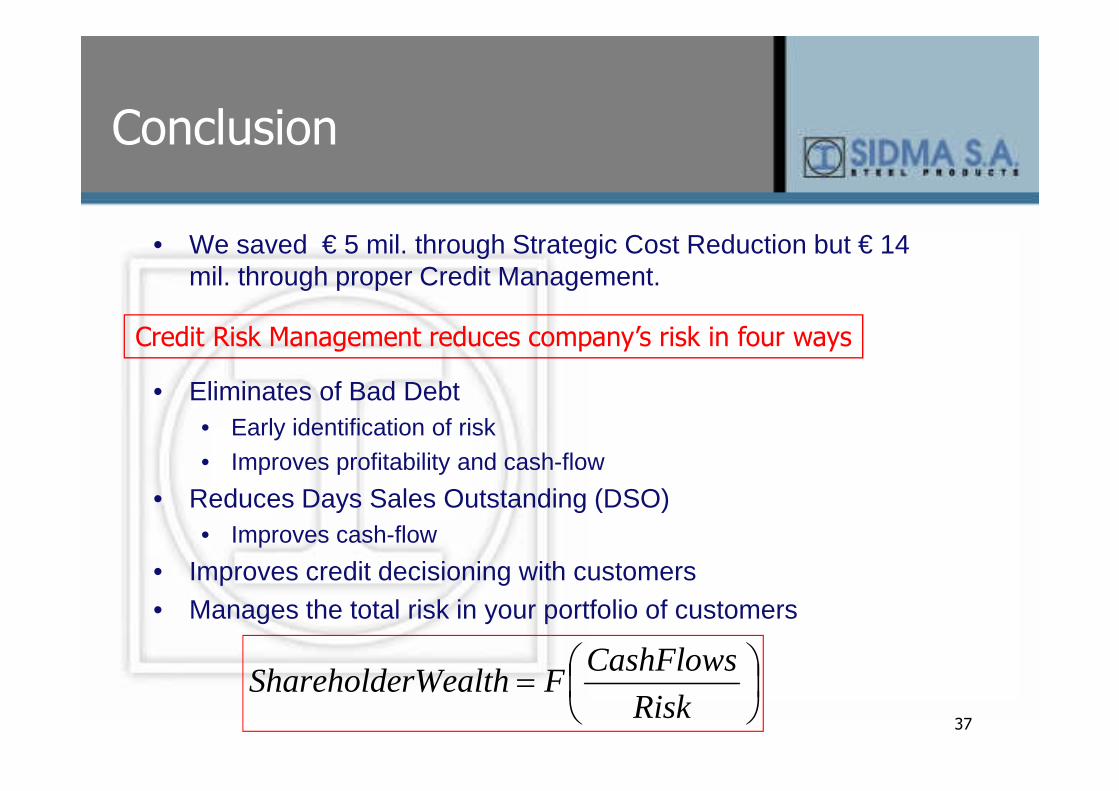
Conclusion
• We saved € 5 mil. through Strategic Cost Reduction but € 14 mil. through proper Credit Management.
• Eliminates of Bad Debt• Early identification of risk• Improves profitability and cash-flow
• Reduces Days Sales Outstanding (DSO)• Improves cash-flow
• Improves credit decisioning with customers• Manages the total risk in your portfolio of customers
Credit Risk Management reduces company’s risk in four ways
=
Risk
CashFlowsFrWealthShareholde
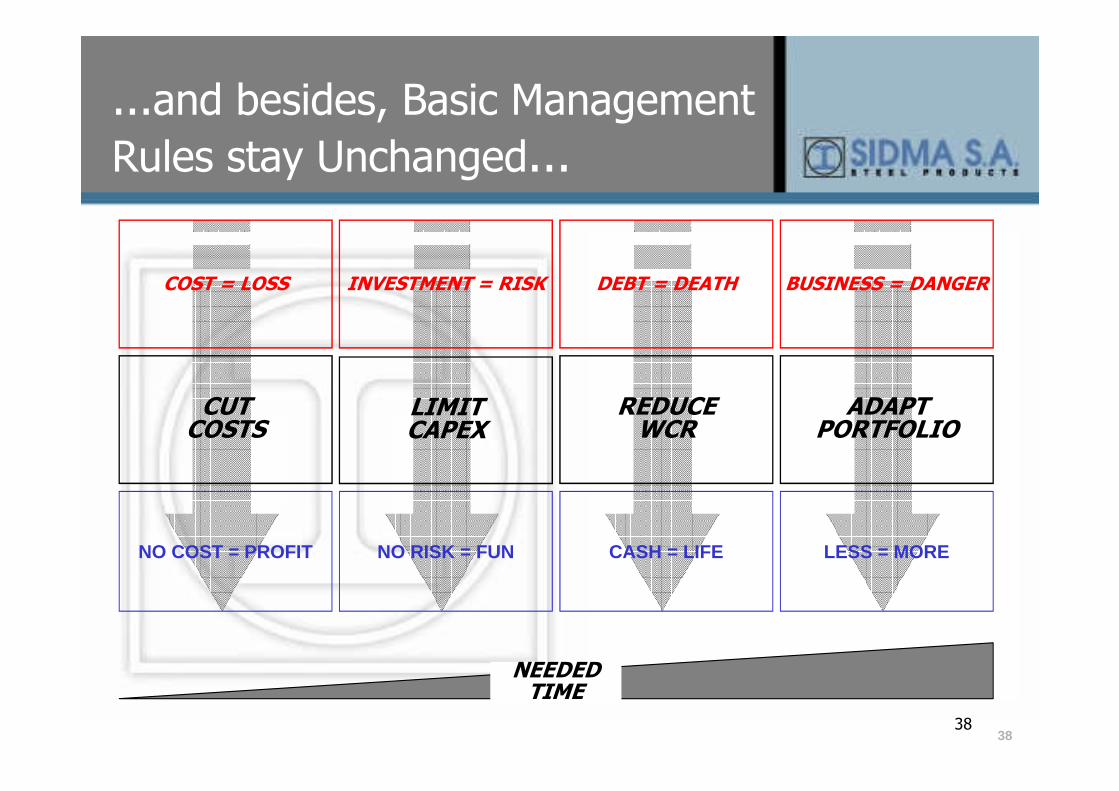
3838
COST = LOSS
CUTCOSTS
NO COST = PROFIT
INVESTMENT = RISK
LIMITCAPEX
NO RISK = FUN
DEBT = DEATH
REDUCE WCR
CASH = LIFE
BUSINESS = DANGER
ADAPTPORTFOLIO
LESS = MORE
NEEDED TIME
...and besides, Basic Management
Rules stay Unchanged...

39
Questions