Sherman Consulting Inc. Driving End-to-End Process Improvement SM Six Sigma for the CPA or CFO...
109
Sherman Consulting Inc. Driving End-to-End Process Improvement SM Six Sigma for the CPA or CFO November 30, 2007 Peter J. Sherman ASQ Certified Quality Engineer Certified Six Sigma Black Belt
-
Upload
rylee-roche -
Category
Documents
-
view
219 -
download
2
Transcript of Sherman Consulting Inc. Driving End-to-End Process Improvement SM Six Sigma for the CPA or CFO...
Sherman Consulting Inc.Driving End-to-End Process Improvement
SM
Six Sigma for the CPA or CFO
November 30, 2007
Peter J. ShermanASQ Certified Quality EngineerCertified Six Sigma Black Belt
2 Sherman Consulting Inc.Driving End-to-End Process Improvement
SM
Agenda
σ Objectivesσ Your Businessσ Six Sigma Overviewσ The Basicsσ DMAIIC Process (Case Study Approach)
Define Analyze Measure Improve Implement Control
σ Six Sigma Action Plan
σ Wrap Up
3 Sherman Consulting Inc.Driving End-to-End Process Improvement
SM
Biography
Peter J. Sherman is an ASQ Certified Quality Engineer and a Certified Six Sigma Black Belt. He has 20 years experience, including serving as Sr. Black Belt for AT&T’s Product Development Group. Mr. Sherman has led Six Sigma initiatives across Product Development, Sales, Fulfillment, Installation, Customer Support, and Billing. He began his career in quality management working in Japan as a visiting M.I.T. Scholar in 1986-87. There he worked with Dr. Edwards Deming, the noted American Quality expert and learned firsthand Japanese quality practices including the Toyota Production System, Quality Circles and Kaizen. Mr. Sherman is lead Instructor at Emory University's Six Sigma Certification Program in Atlanta, Georgia and has been published in various journals including iSixSigma, Hospitals & Health Networks, Solutions (Supplement to Journal of Financial Planning). Mr. Sherman received his Master's in Engineering from M.I.T. and has an MBA from Georgia State University. Mr. Sherman is a member of the ASQ and ISSSP.
4 Sherman Consulting Inc.Driving End-to-End Process Improvement
SM
Objectives
1. Discover the role and value of Six Sigma2. Learn how to conduct the Six Sigma process
and interpret the results through a case study3. Develop and implement a 6σ Action Plan for
your business
5 Sherman Consulting Inc.Driving End-to-End Process Improvement
SM
Your Business
6 Sherman Consulting Inc.Driving End-to-End Process Improvement
SM
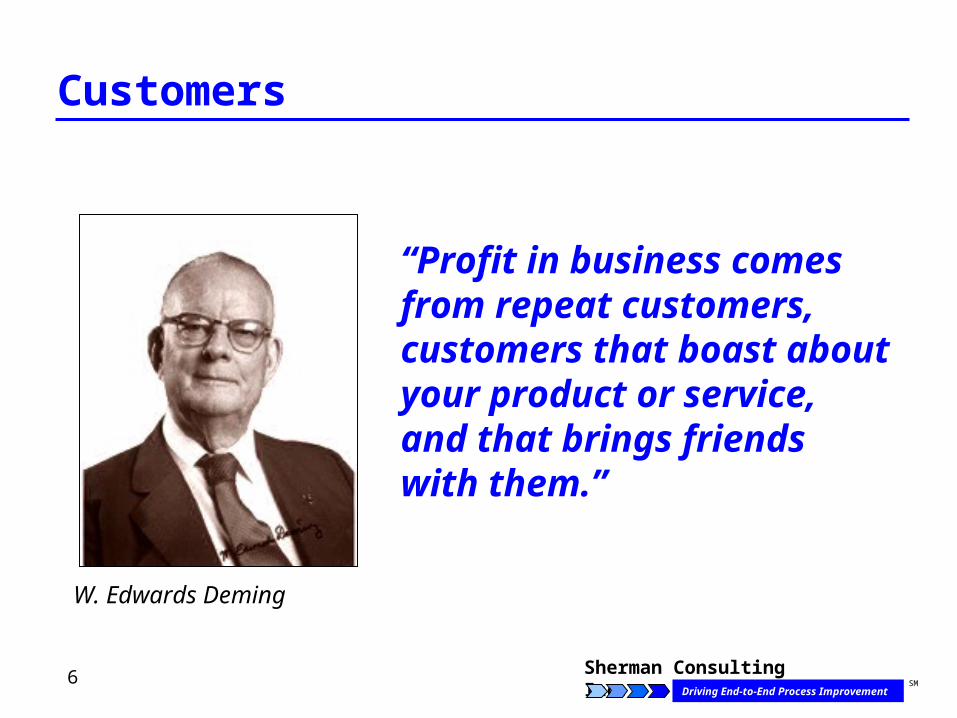
Customers
“Profit in business comes from repeat customers, customers that boast about your product or service, and that brings friends with them.”
W. Edwards Deming
7 Sherman Consulting Inc.Driving End-to-End Process Improvement
SM
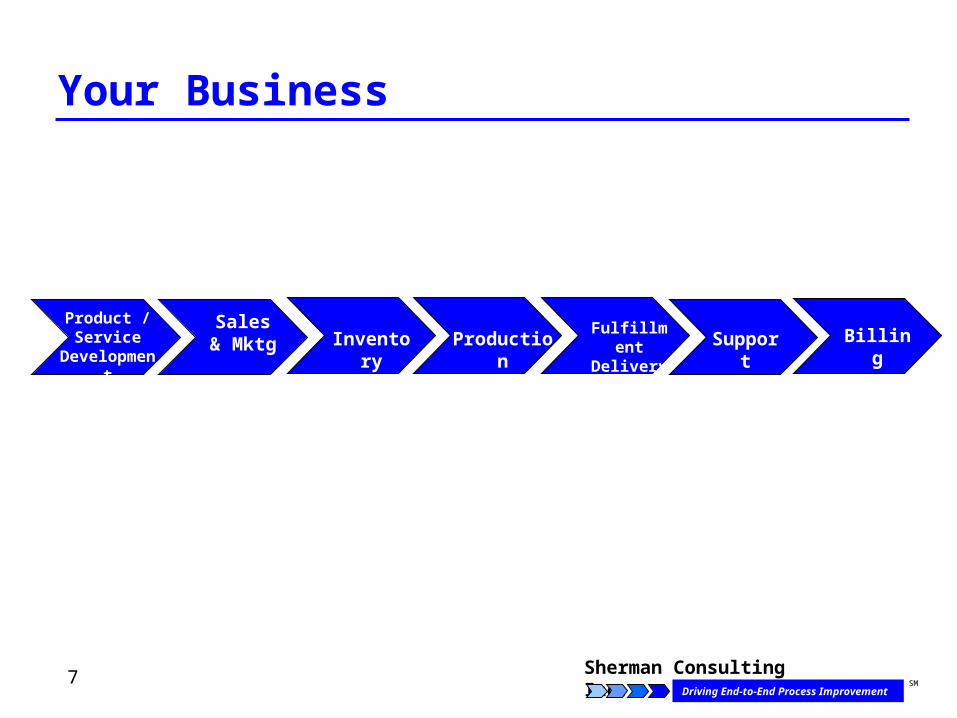
Your Business
Product / Service
Development
Fulfillment Delivery
Sales & Mktg Support BillingProductionInventory
8 Sherman Consulting Inc.Driving End-to-End Process Improvement
SM
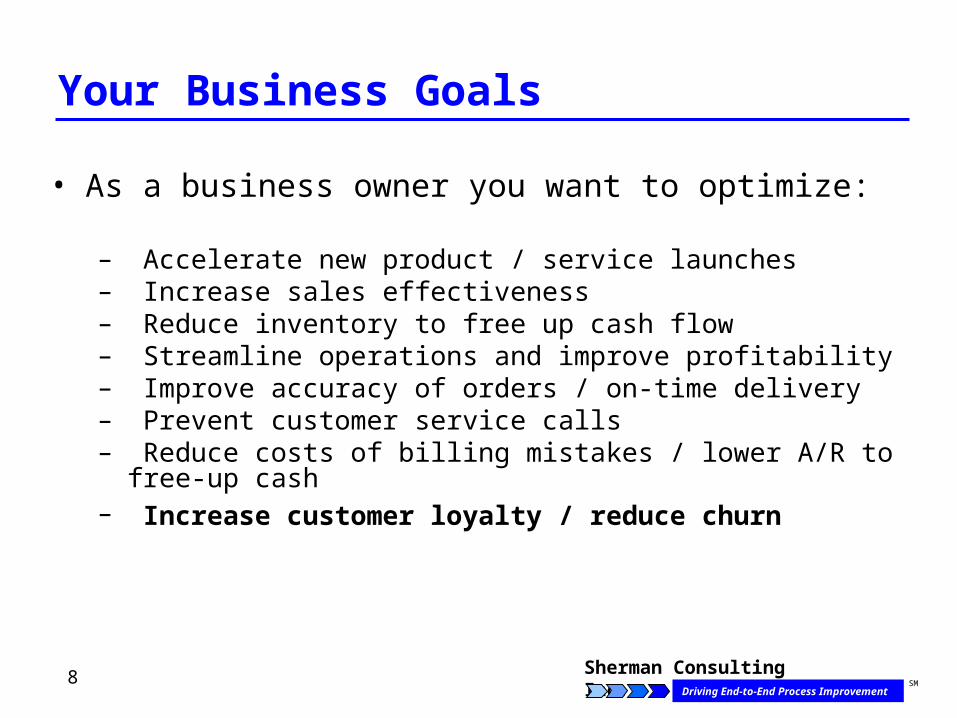
Your Business Goals
• As a business owner you want to optimize:
– Accelerate new product / service launches– Increase sales effectiveness– Reduce inventory to free up cash flow– Streamline operations and improve profitability– Improve accuracy of orders / on-time delivery– Prevent customer service calls – Reduce costs of billing mistakes / lower A/R to free-up cash– Increase customer loyalty / reduce churn
9 Sherman Consulting Inc.Driving End-to-End Process Improvement
SM
Your Comparative Advantage
σ Capital?σ Low-Cost Labor?σ Market shareσ Technology?
It’s how you manage your business processes!
10 Sherman Consulting Inc.Driving End-to-End Process Improvement
SM
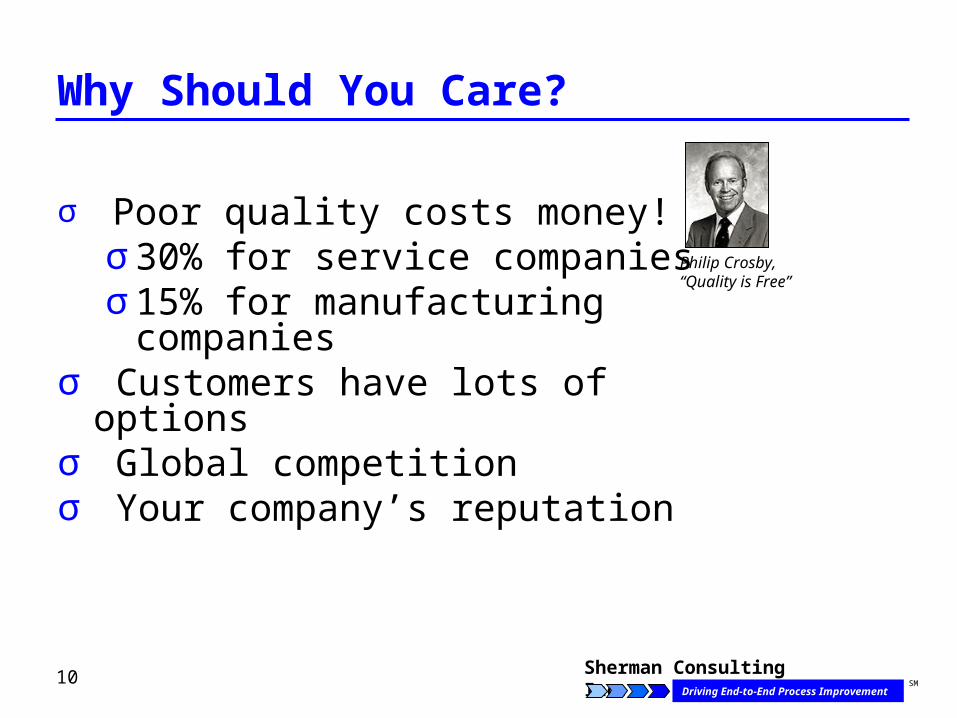
Why Should You Care?
σ Poor quality costs money!σ 30% for service companiesσ 15% for manufacturing companies
σ Customers have lots of options σ Global competitionσ Your company’s reputation
Philip Crosby, “Quality is Free”
11 Sherman Consulting Inc.Driving End-to-End Process Improvement
SM
Six Sigma Overview
12 Sherman Consulting Inc.Driving End-to-End Process Improvement
SM
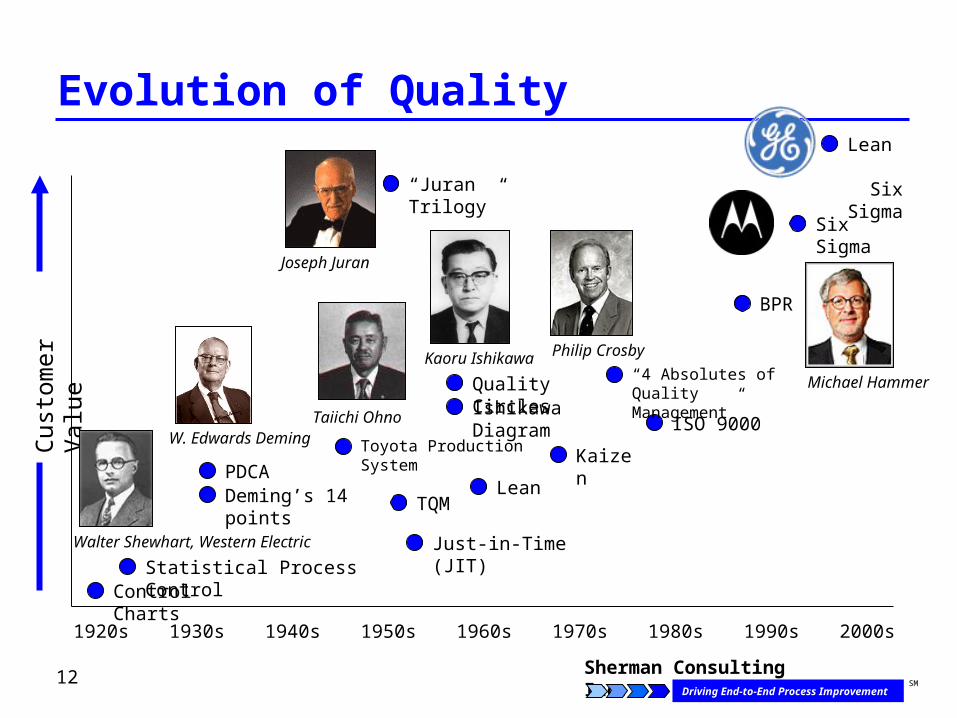
Evolution of Quality
1920s 1930s 1940s 1950s 1960s 1970s 1980s 1990s 2000s
Control Charts
Six Sigma
Cus
tom
er V
alue
TQM
Just-in-Time (JIT)
Kaizen
Statistical Process Control
Walter Shewhart, Western Electric
W. Edwards Deming
Lean Six Sigma
Taiichi Ohno
PDCA
Toyota Production System
ISO 9000
BPR
Lean
Quality Circles
Kaoru Ishikawa
Ishikawa Diagram
Michael Hammer
Joseph Juran
“Juran Trilogy”
Deming’s 14 points
Philip Crosby
“4 Absolutes of Quality Management”

13 Sherman Consulting Inc.Driving End-to-End Process Improvement
SM
What is Six Sigma Level Quality?
The reliability of getting a dial tone every time you pick up a telephone!
14 Sherman Consulting Inc.Driving End-to-End Process Improvement
SM
What is Six Sigma Level Quality?
Knowing your package will be delivered by 10am the next day, guaranteed!
15 Sherman Consulting Inc.Driving End-to-End Process Improvement
SM
What is Six Sigma Level Quality?
Whether you are in Athens, GA or Athens Greece, a Big Mac tastes the same!
16 Sherman Consulting Inc.Driving End-to-End Process Improvement
SM
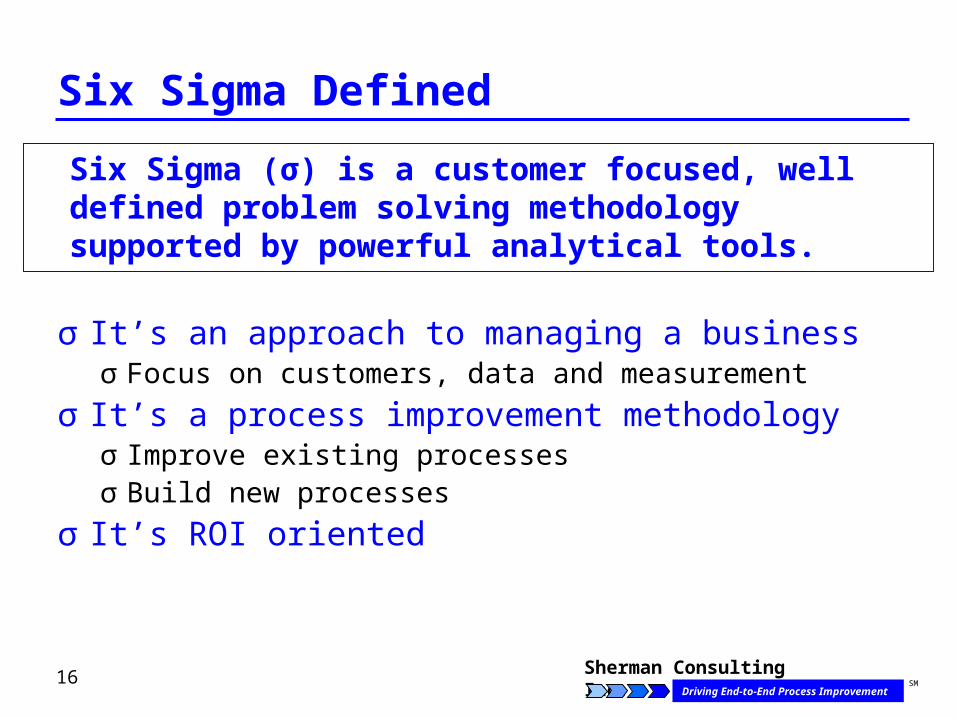
Six Sigma Defined
σ It’s an approach to managing a businessσ Focus on customers, data and measurement
σ It’s a process improvement methodologyσ Improve existing processesσ Build new processes
σ It’s ROI oriented
Six Sigma (σ) is a customer focused, well defined problem solving methodology supported by powerful analytical tools.
17 Sherman Consulting Inc.Driving End-to-End Process Improvement
SM
Six Sigma Defined
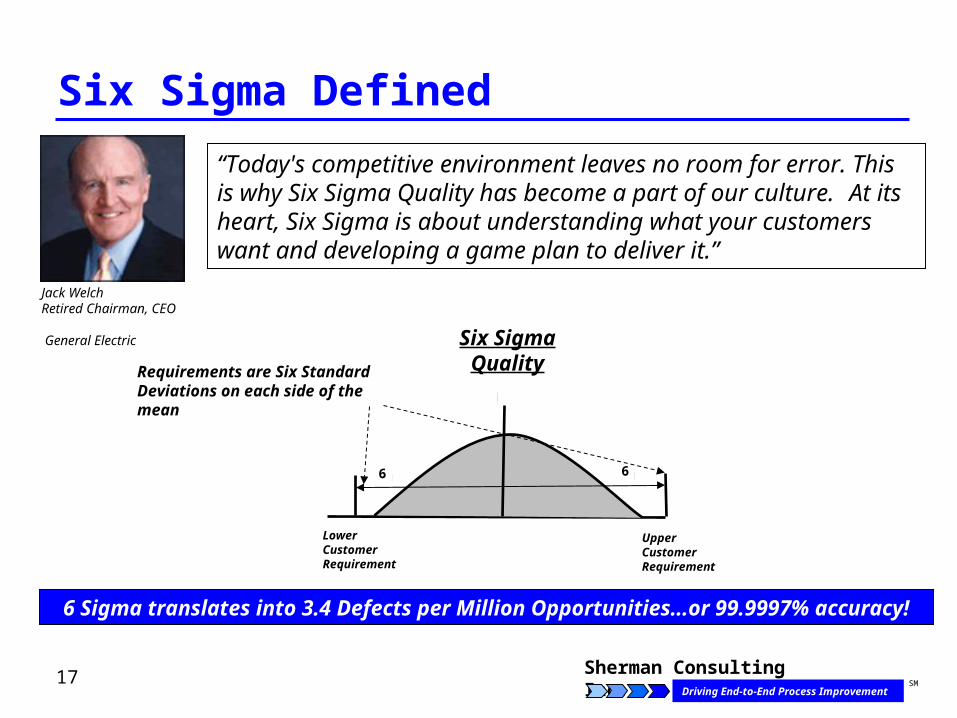
“Today's competitive environment leaves no room for error. This is why Six Sigma Quality has become a part of our culture. At its heart, Six Sigma is about understanding what your customers want and developing a game plan to deliver it.”
Jack Welch Retired Chairman, CEO General Electric
6 Sigma translates into 3.4 Defects per Million Opportunities…or 99.9997% accuracy!
Requirements are Six Standard Deviations on each side of the mean
Upper Customer Requirement
Six Sigma Quality
Lower Customer Requirement
6 6
18 Sherman Consulting Inc.Driving End-to-End Process Improvement
SM
Six Sigma Defined
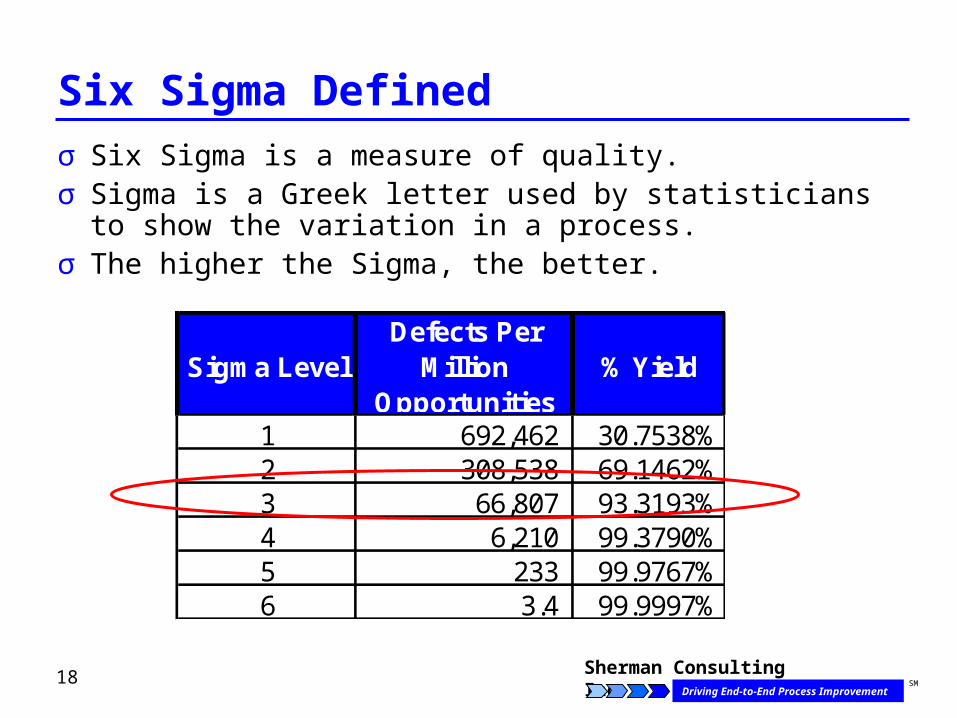
σ Six Sigma is a measure of quality.σ Sigma is a Greek letter used by statisticians to show the
variation in a process. σ The higher the Sigma, the better.
Sigma LevelDefects Per
Million Opportunities
% Yield
1 692,462 30.7538%2 308,538 69.1462%3 66,807 93.3193%4 6,210 99.3790%5 233 99.9767%6 3.4 99.9997%
19 Sherman Consulting Inc.Driving End-to-End Process Improvement
SM
Sigma Level Comparisons
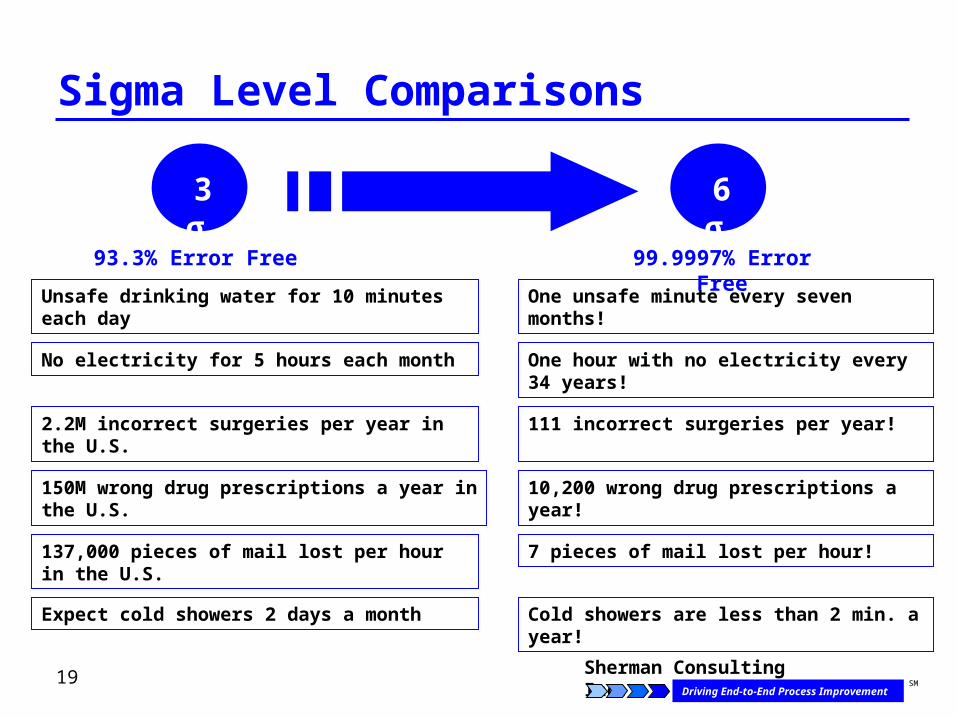
3 σ 6 σ
93.3% Error Free 99.9997% Error Free
Unsafe drinking water for 10 minutes each day One unsafe minute every seven months!
No electricity for 5 hours each month One hour with no electricity every 34 years!
2.2M incorrect surgeries per year in the U.S. 111 incorrect surgeries per year!
137,000 pieces of mail lost per hour in the U.S. 7 pieces of mail lost per hour!
150M wrong drug prescriptions a year in the U.S. 10,200 wrong drug prescriptions a year!
Expect cold showers 2 days a month Cold showers are less than 2 min. a year!
20 Sherman Consulting Inc.Driving End-to-End Process Improvement
SM
Calculating DPMO and Sigma
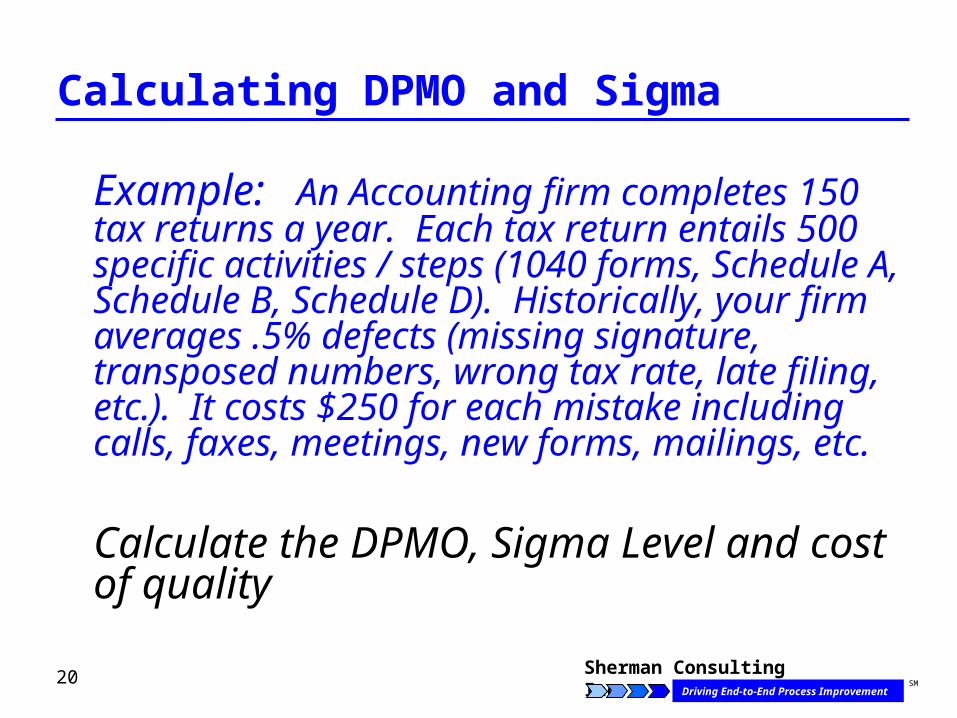
Example: An Accounting firm completes 150 tax returns a year. Each tax return entails 500 specific activities / steps (1040 forms, Schedule A, Schedule B, Schedule D). Historically, your firm averages .5% defects (missing signature, transposed numbers, wrong tax rate, late filing, etc.). It costs $250 for each mistake including calls, faxes, meetings, new forms, mailings, etc.
Calculate the DPMO, Sigma Level and cost of quality
21 Sherman Consulting Inc.Driving End-to-End Process Improvement
SM
Calculating DPMO and Sigma
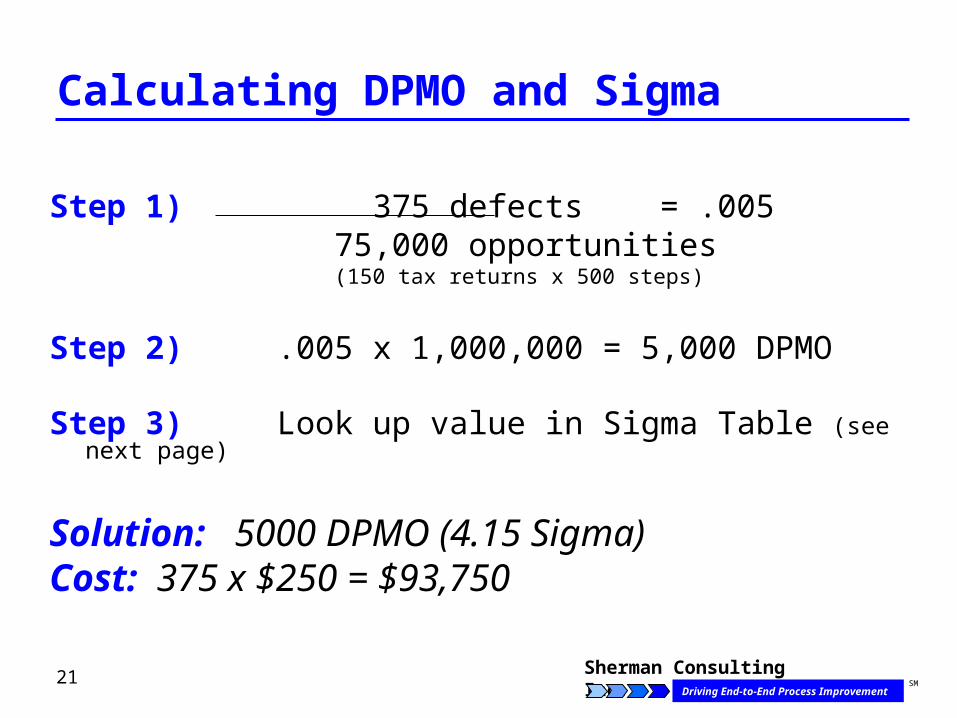
Step 1) 375 defects = .005 75,000 opportunities (150 tax returns x 500 steps)
Step 2) .005 x 1,000,000 = 5,000 DPMO
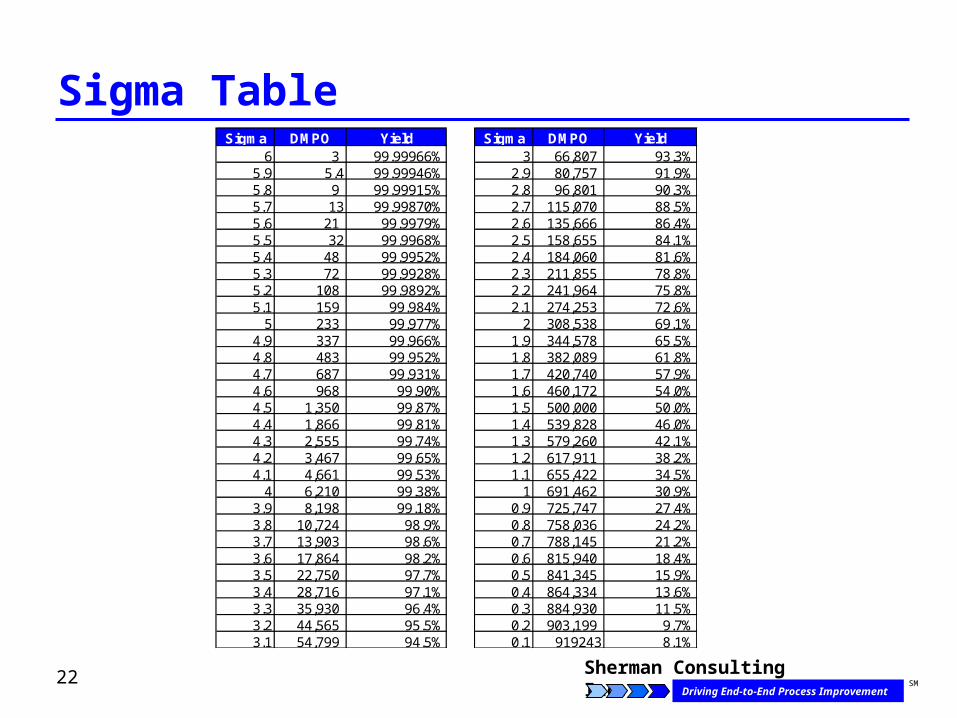
Step 3) Look up value in Sigma Table (see next page)
Solution: 5000 DPMO (4.15 Sigma)Cost: 375 x $250 = $93,750
22 Sherman Consulting Inc.Driving End-to-End Process Improvement
SM
Sigma TableSigma DMPO Yield Sigma DMPO Yield
6 3 99.99966% 3 66,807 93.3%5.9 5.4 99.99946% 2.9 80,757 91.9%5.8 9 99.99915% 2.8 96,801 90.3%5.7 13 99.99870% 2.7 115,070 88.5%5.6 21 99.9979% 2.6 135,666 86.4%5.5 32 99.9968% 2.5 158,655 84.1%5.4 48 99.9952% 2.4 184,060 81.6%5.3 72 99.9928% 2.3 211,855 78.8%5.2 108 99.9892% 2.2 241,964 75.8%5.1 159 99.984% 2.1 274,253 72.6%
5 233 99.977% 2 308,538 69.1%4.9 337 99.966% 1.9 344,578 65.5%4.8 483 99.952% 1.8 382,089 61.8%4.7 687 99.931% 1.7 420,740 57.9%4.6 968 99.90% 1.6 460,172 54.0%4.5 1,350 99.87% 1.5 500,000 50.0%4.4 1,866 99.81% 1.4 539,828 46.0%4.3 2,555 99.74% 1.3 579,260 42.1%4.2 3,467 99.65% 1.2 617,911 38.2%4.1 4,661 99.53% 1.1 655,422 34.5%
4 6,210 99.38% 1 691,462 30.9%3.9 8,198 99.18% 0.9 725,747 27.4%3.8 10,724 98.9% 0.8 758,036 24.2%3.7 13,903 98.6% 0.7 788,145 21.2%3.6 17,864 98.2% 0.6 815,940 18.4%3.5 22,750 97.7% 0.5 841,345 15.9%3.4 28,716 97.1% 0.4 864,334 13.6%3.3 35,930 96.4% 0.3 884,930 11.5%3.2 44,565 95.5% 0.2 903,199 9.7%3.1 54,799 94.5% 0.1 919243 8.1%
23 Sherman Consulting Inc.Driving End-to-End Process Improvement
SM
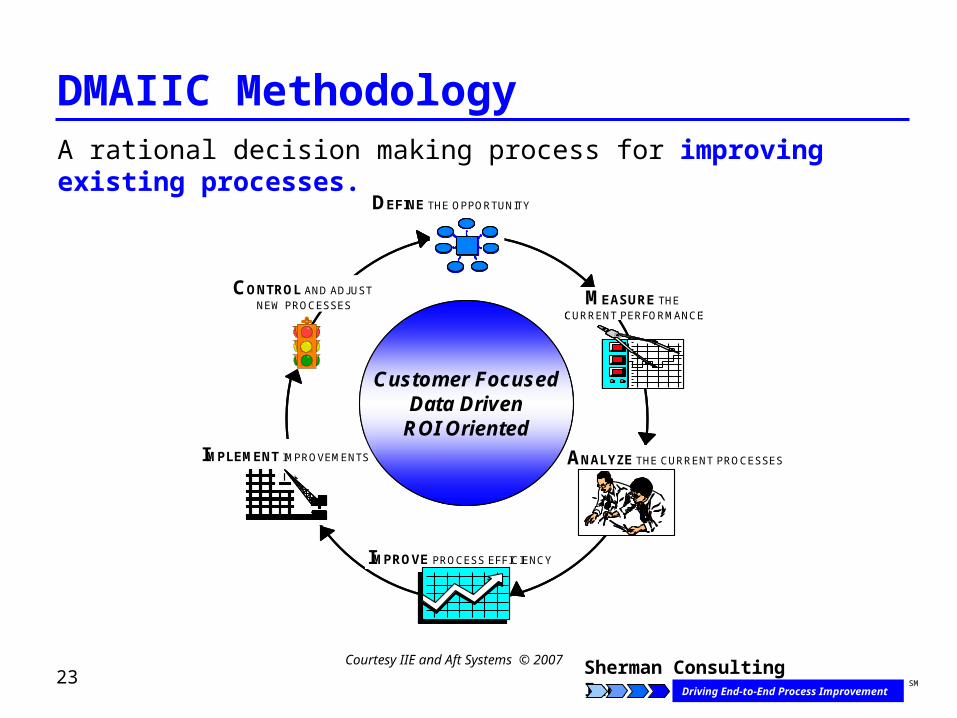
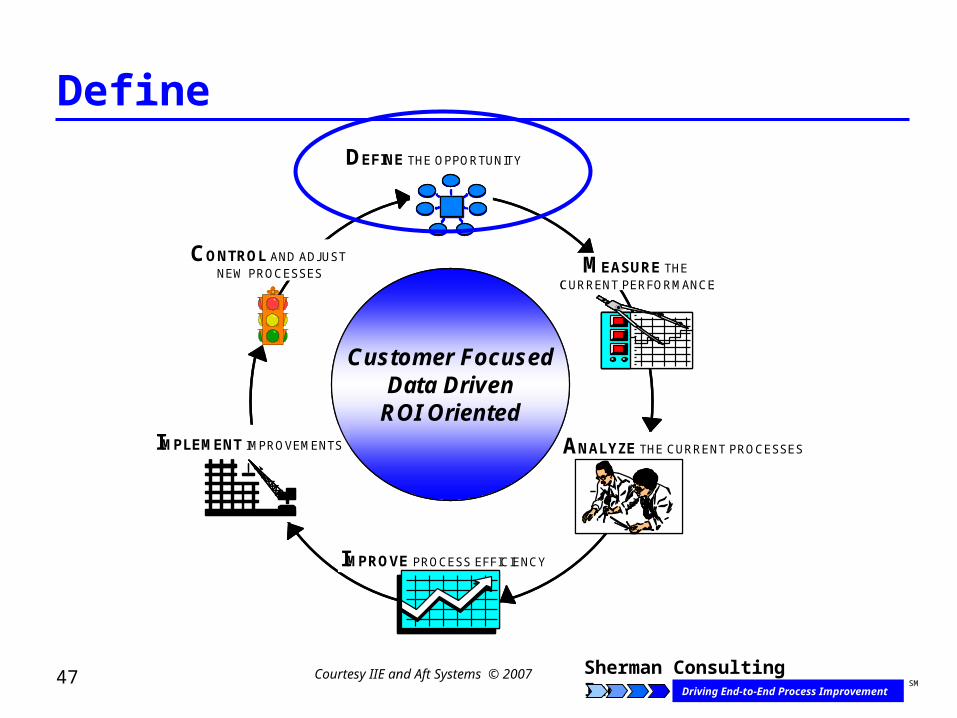
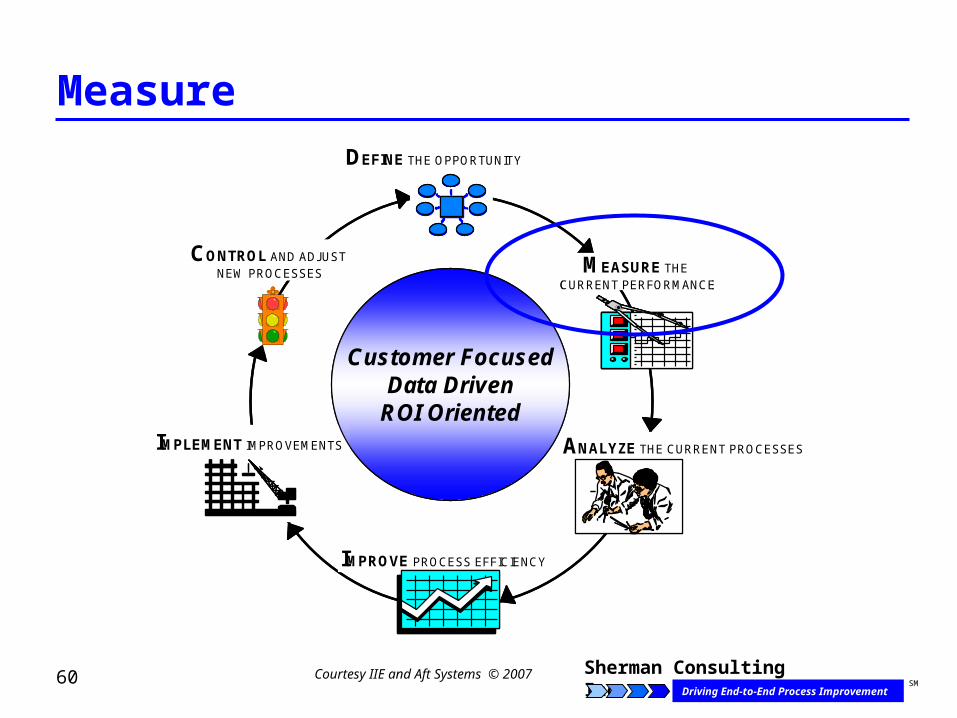
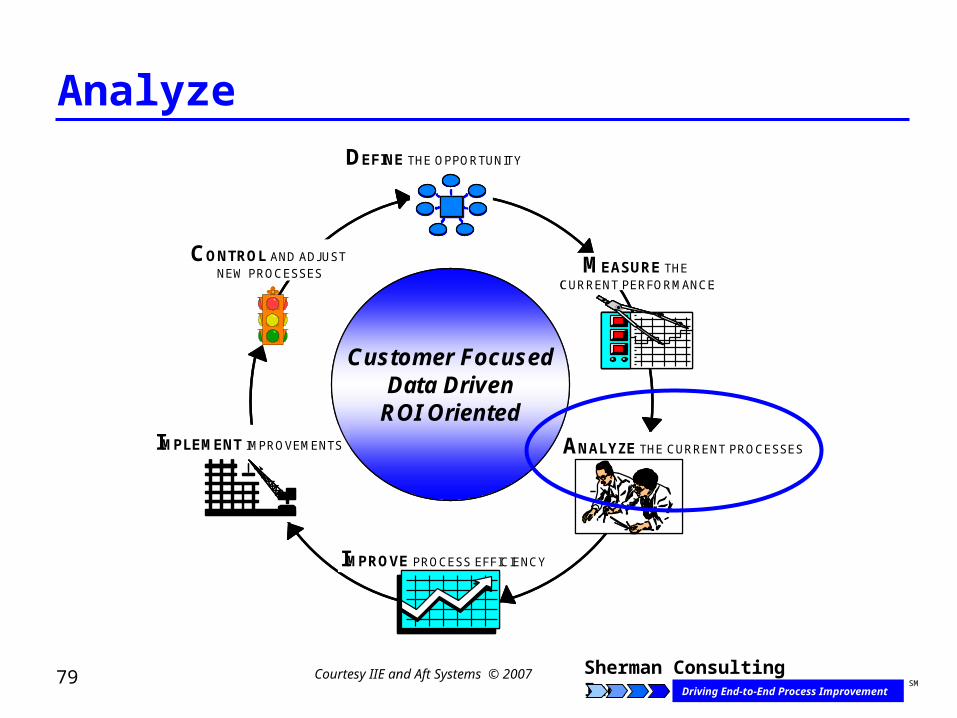
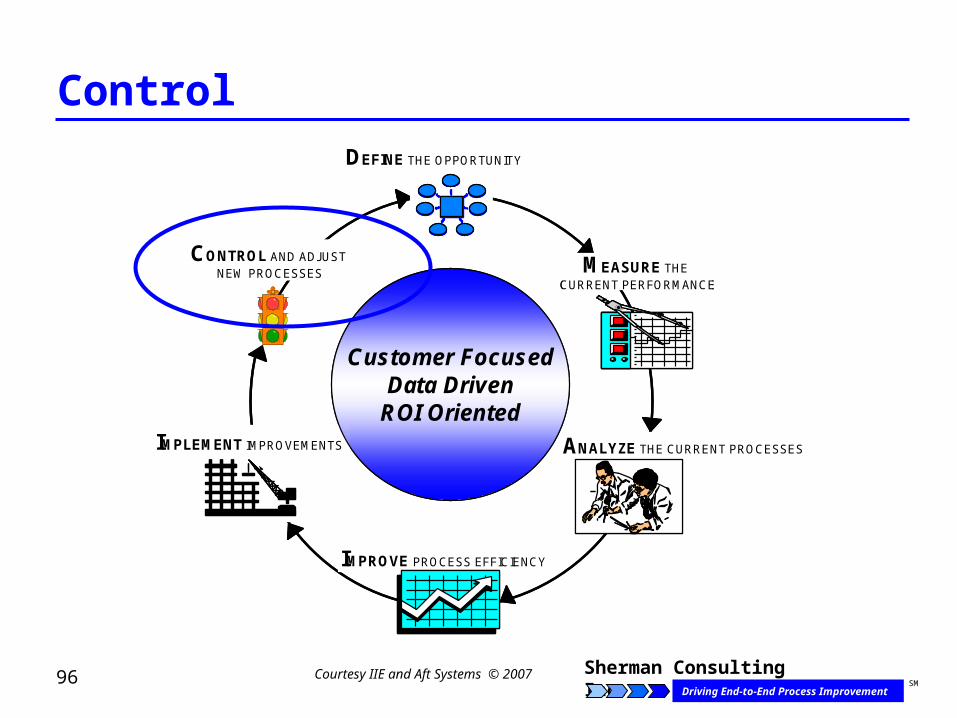
DMAIIC Methodology
MEASURE THE CURRENT PERFORMANCE
DEFINE THE OPPORTUNITY
IMPROVE PROCESS EFFICIENCY
ANALYZE THE CURRENT PROCESSES
CONTROL AND ADJUST NEW PROCESSES
IMPLEMENT IMPROVEMENTS
Customer FocusedData Driven
ROI Oriented
MEASURE THE CURRENT PERFORMANCE
DEFINE THE OPPORTUNITY
IMPROVE PROCESS EFFICIENCY
ANALYZE THE CURRENT PROCESSES
CONTROL AND ADJUST NEW PROCESSES
IMPLEMENT IMPROVEMENTS
Customer FocusedData Driven
ROI Oriented
Courtesy IIE and Aft Systems © 2007
A rational decision making process for improving existing processes.
24 Sherman Consulting Inc.Driving End-to-End Process Improvement
SM
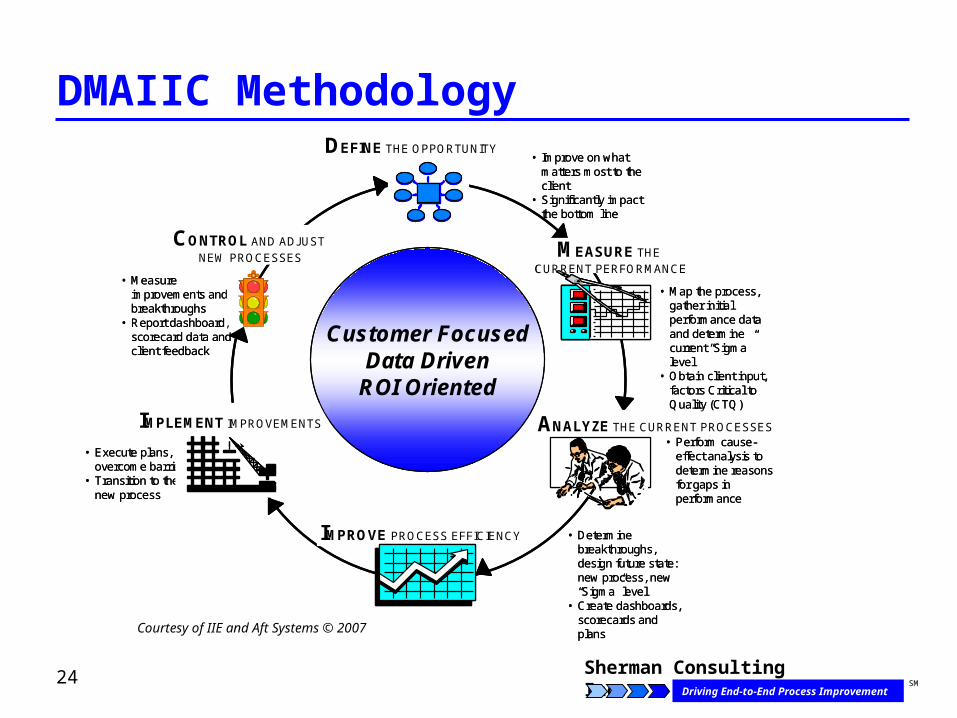
DMAIIC Methodology
• Determine breakthroughs, design future state: new process, new “Sigma” level
• Create dashboards, scorecards and plans
• Execute plans, overcome barriers
• Transition to the new process
MEASURE THE CURRENT PERFORMANCE
DEFINE THE OPPORTUNITY
IMPROVE PROCESS EFFICIENCY
ANALYZE THE CURRENT PROCESSES
CONTROL AND ADJUST NEW PROCESSES
IMPLEMENT IMPROVEMENTS
• Perform cause-effect analysis to determine reasons for gaps in performance
• Map the process, gather initial performance data and determine current “Sigma”level
• Obtain client input, factors Critical to Quality (CTQ)
• Improve on what matters most to the client
• Significantly impact the bottom line
• Measure improvements and breakthroughs
• Report dashboard, scorecard data and client feedback
Customer FocusedData Driven
ROI Oriented
Courtesy of IIE and Aft Systems © 2007
25 Sherman Consulting Inc.Driving End-to-End Process Improvement
SM
DMAIIC Methodology
26 Sherman Consulting Inc.Driving End-to-End Process Improvement
SM
Keys to Successful Six Sigma Implementation
σ Top Management Support and Participation:
Senior management must drive the process through the organization. Elements of this include careful selection of projects, allocation of resources, and decisions based on the measurements.
σ Clearly Defined Projects: Well-defined scope with specific quantitative and measurable improvements.
σ Strong Project Leadership: By Black Belts and Green Belts alike.
27 Sherman Consulting Inc.Driving End-to-End Process Improvement
SM
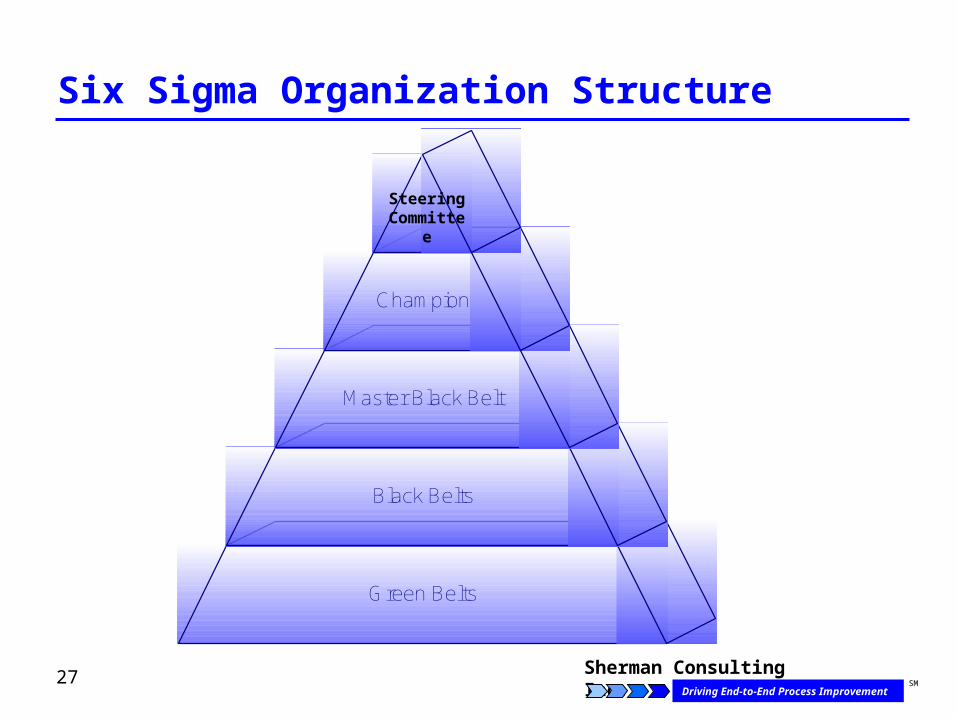
Six Sigma Organization Structure
Green Belts
Black Belts
Master Black Belt
Champion
Steering Committee
28 Sherman Consulting Inc.Driving End-to-End Process Improvement
SM
Six Sigma Organization Roles
σ Steering Committee: Identifies projects / black belts; allocates resources; monitors progress; manages project portfolio; establishes implementation strategy and policies
σ Champions: Provide support, resources and remove road-blocks. Champions have more in-depth understanding of the methods – measurements and interpretation of process measurements.
29 Sherman Consulting Inc.Driving End-to-End Process Improvement
SM
Six Sigma Organization Roles
σ Master Black Belt: Master Black Belts are Six Sigma Quality experts that are responsible for the strategic implementations within an organization. Master Black Belt main responsibilities include training and mentoring of Black Belts and Green Belts; helping to prioritize, select and charter high-impact projects.
σ Black Belt: Are thoroughly trained individuals with expertise in all the analysis tools. Black Belts are expected to lead Six Sigma projects, identify opportunities, and coach / train Green Belts.
σ Green Belt: Green Belts play a key role in the support / execution of Six Sigma projects. Green Belts are also expected to lead smaller projects. Green belts understand concepts of problem solving, data collection, data interpretation, variation, process capability, and cost analysis.
30 Sherman Consulting Inc.Driving End-to-End Process Improvement
SM
The Basics
31 Sherman Consulting Inc.Driving End-to-End Process Improvement
SM
The Basics
σ QA vs QC
σ Understanding Variation
σ Statistics 101
32 Sherman Consulting Inc.Driving End-to-End Process Improvement
SM
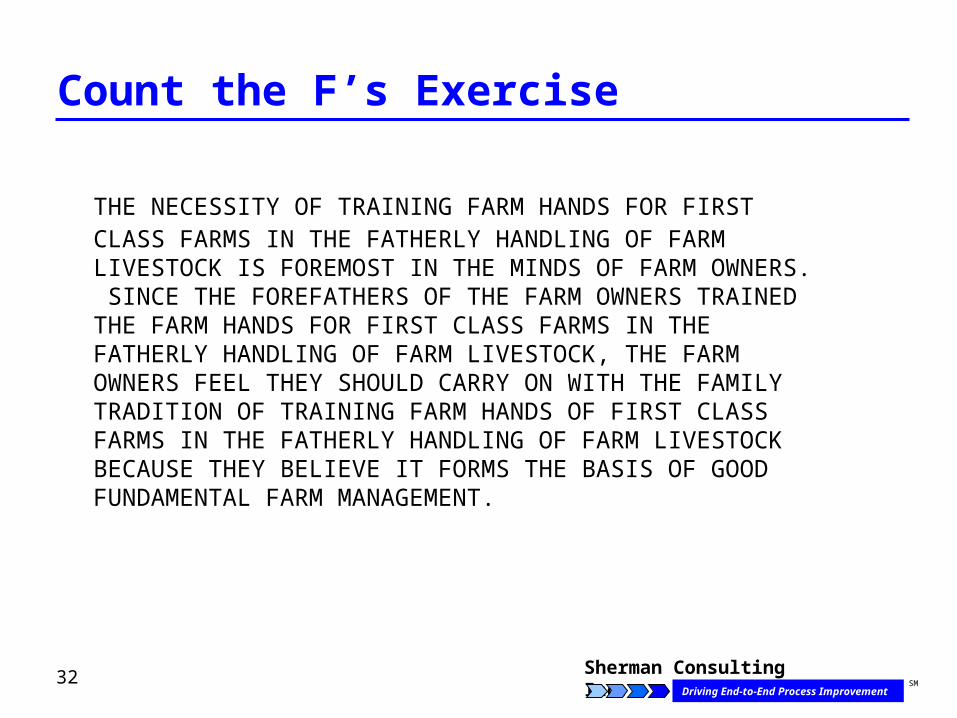
Count the F’s Exercise
THE NECESSITY OF TRAINING FARM HANDS FOR FIRST CLASS FARMS IN THE FATHERLY HANDLING OF FARM LIVESTOCK IS FOREMOST IN THE MINDS OF FARM OWNERS. SINCE THE FOREFATHERS OF THE FARM OWNERS TRAINED THE FARM HANDS FOR FIRST CLASS FARMS IN THE FATHERLY HANDLING OF FARM LIVESTOCK, THE FARM OWNERS FEEL THEY SHOULD CARRY ON WITH THE FAMILY TRADITION OF TRAINING FARM HANDS OF FIRST CLASS FARMS IN THE FATHERLY HANDLING OF FARM LIVESTOCK BECAUSE THEY BELIEVE IT FORMS THE BASIS OF GOOD FUNDAMENTAL FARM MANAGEMENT.
33 Sherman Consulting Inc.Driving End-to-End Process Improvement
SM
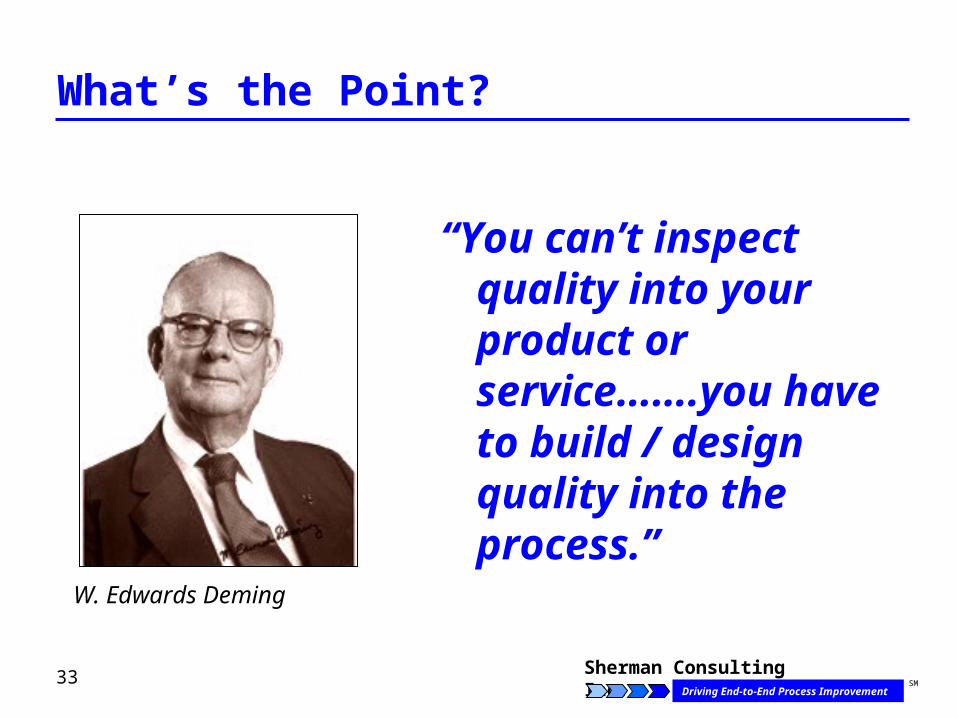
What’s the Point?
“You can’t inspect quality into your product or service…….you have to build / design quality into the process.”
W. Edwards Deming
34 Sherman Consulting Inc.Driving End-to-End Process Improvement
SM
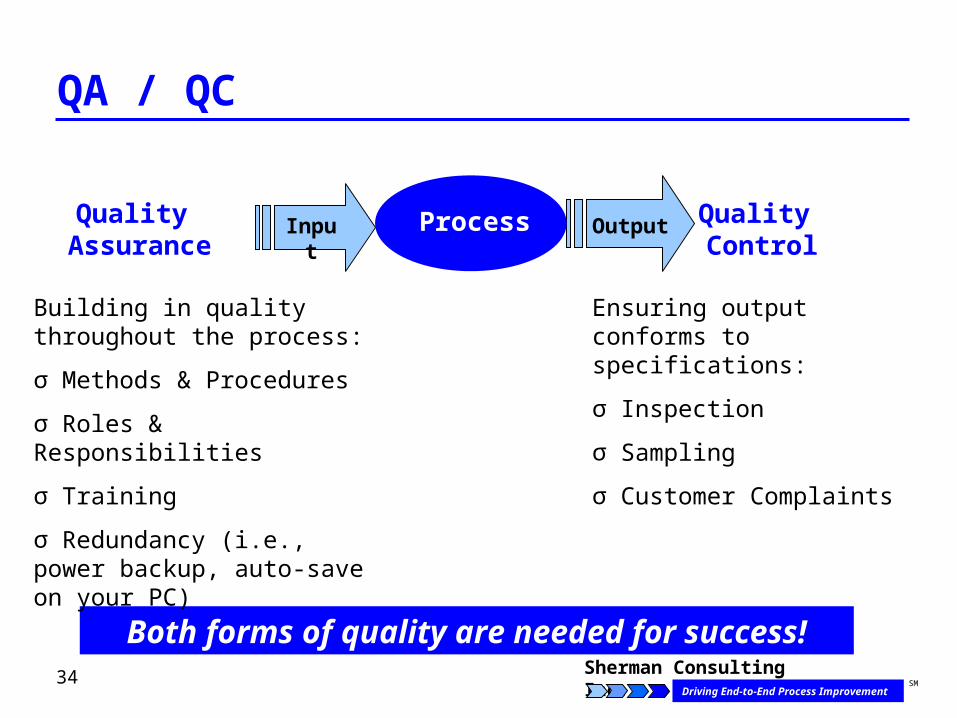
QA / QC
Both forms of quality are needed for success!
Process
Building in quality throughout the process:
σ Methods & Procedures
σ Roles & Responsibilities
σ Training
σ Redundancy (i.e., power backup, auto-save on your PC)
Quality Assurance
Ensuring output conforms to specifications:
σ Inspection
σ Sampling
σ Customer Complaints
Input Output Quality Control
Process
35 Sherman Consulting Inc.Driving End-to-End Process Improvement
SM
Variation
36 Sherman Consulting Inc.Driving End-to-End Process Improvement
SM
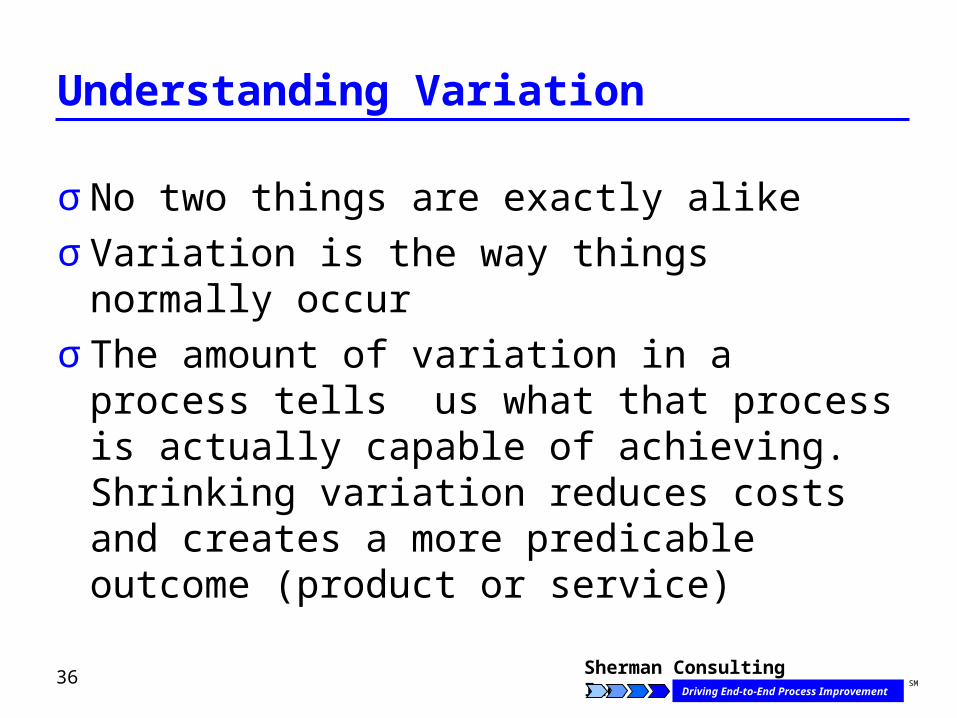
Understanding Variation
σ No two things are exactly alike
σ Variation is the way things normally occur
σ The amount of variation in a process tells us what that process is actually capable of achieving. Shrinking variation reduces costs and creates a more predicable outcome (product or service)
37 Sherman Consulting Inc.Driving End-to-End Process Improvement
SM
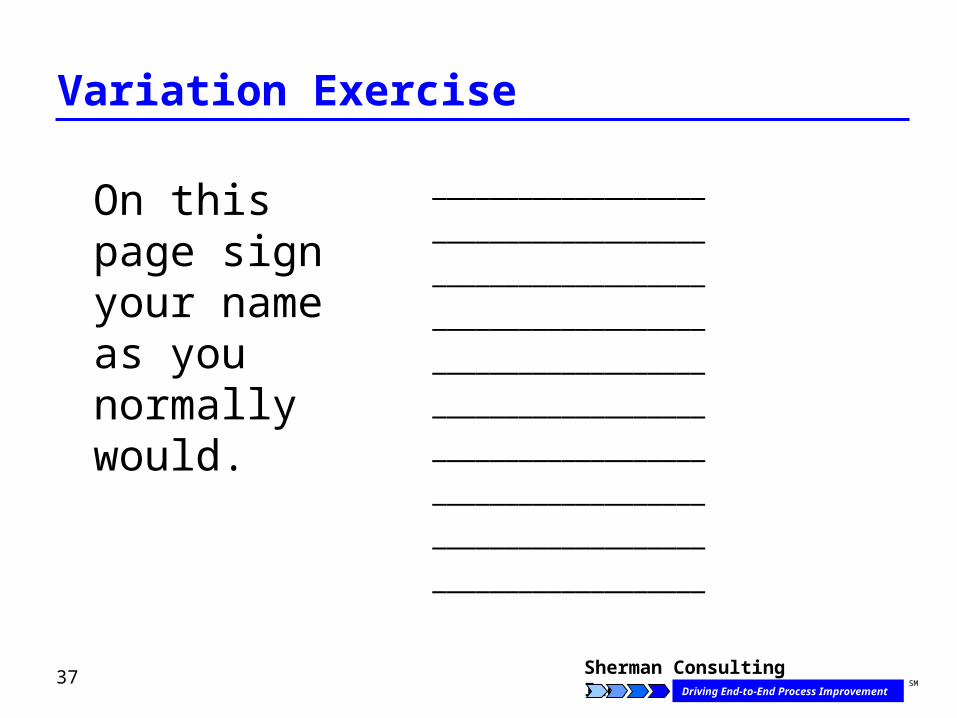
Variation Exercise
On this page sign your name as you normally would.
___________________
___________________
___________________
___________________
___________________
___________________
___________________
___________________
___________________
___________________
38 Sherman Consulting Inc.Driving End-to-End Process Improvement
SM
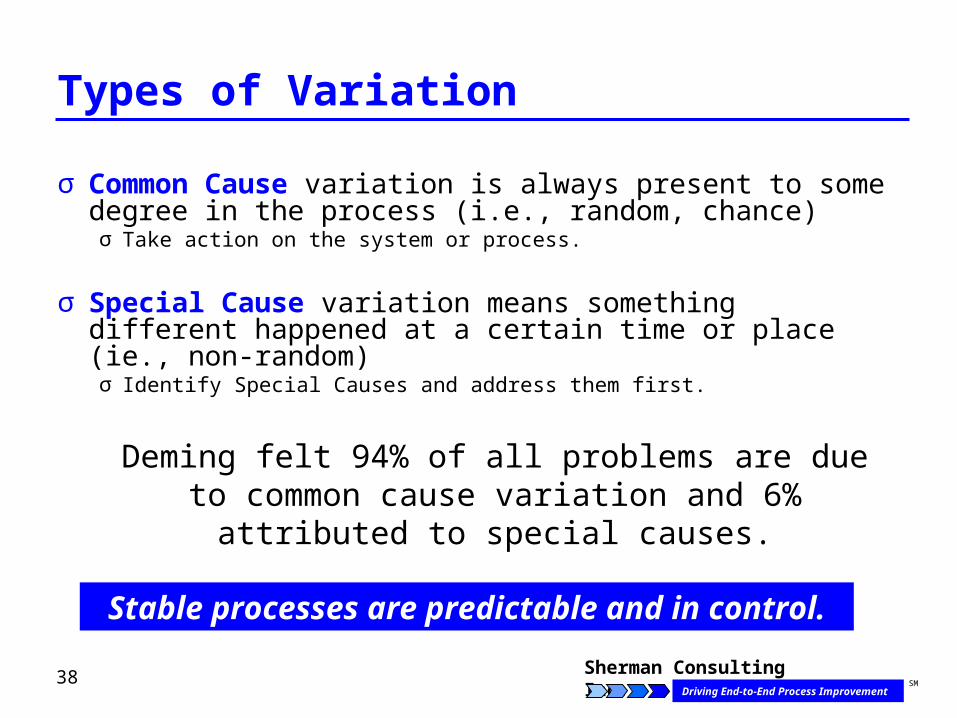
Types of Variation
σ Common Cause variation is always present to some degree in the process (i.e., random, chance)σ Take action on the system or process.
σ Special Cause variation means something different happened at a certain time or place (ie., non-random)σ Identify Special Causes and address them first.
Stable processes are predictable and in control.
Deming felt 94% of all problems are due to common cause variation and 6% attributed to special causes.
39 Sherman Consulting Inc.Driving End-to-End Process Improvement
SM
Statistics Refresher
40 Sherman Consulting Inc.Driving End-to-End Process Improvement
SM
Statistics Refresher
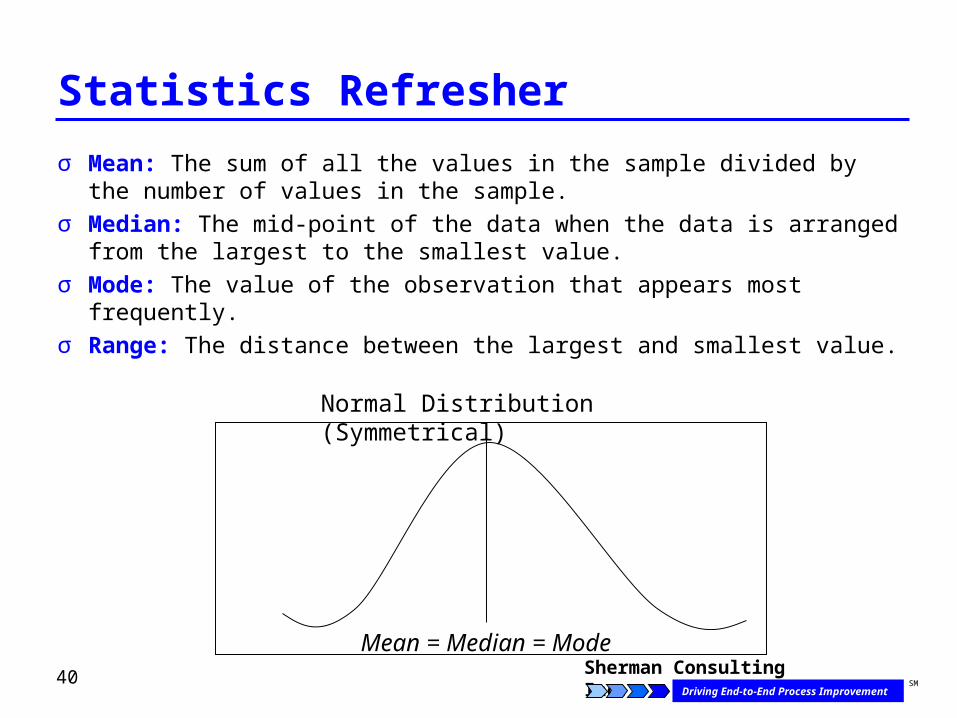
σ Mean: The sum of all the values in the sample divided by the number of values in the sample.
σ Median: The mid-point of the data when the data is arranged from the largest to the smallest value.
σ Mode: The value of the observation that appears most frequently.σ Range: The distance between the largest and smallest value.
Mean = Median = Mode
Normal Distribution (Symmetrical)
41 Sherman Consulting Inc.Driving End-to-End Process Improvement
SM
Statistics Refresher
Example:
A bank generally takes a week to open and process a new account. A random sample of 9 new accounts indicates the following cycle times in days:
5, 8, 6, 5, 10, 4, 7, 5, 12
Find the mean, median, mode and range.
42 Sherman Consulting Inc.Driving End-to-End Process Improvement
SM
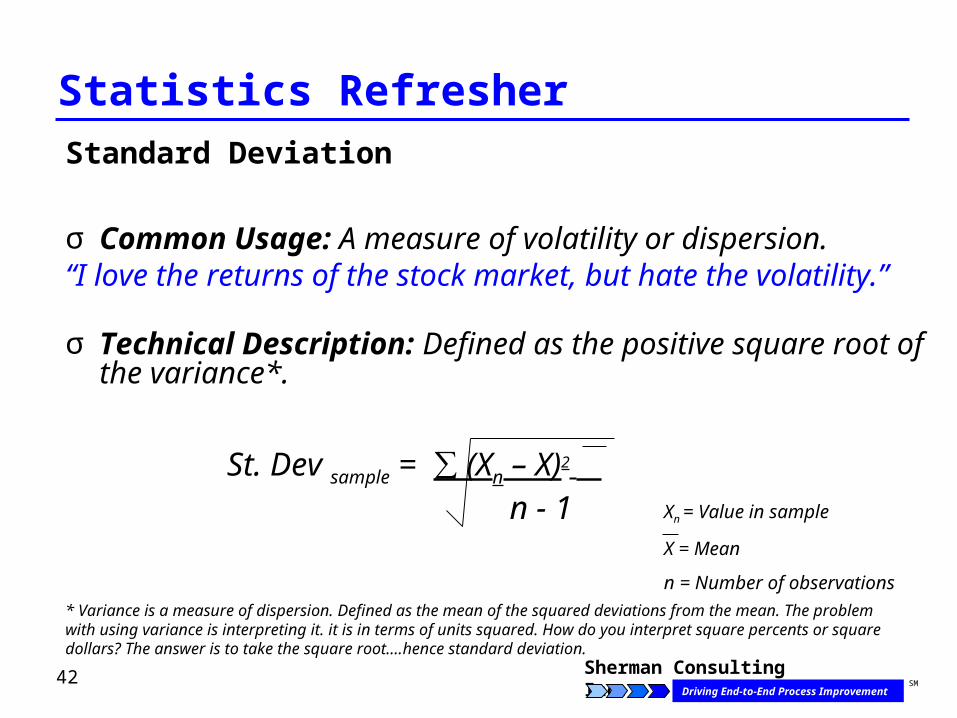
Statistics RefresherStandard Deviation
σ Common Usage: A measure of volatility or dispersion. “I love the returns of the stock market, but hate the volatility.” σ Technical Description: Defined as the positive square root
of the variance*.
* Variance is a measure of dispersion. Defined as the mean of the squared deviations from the mean. The problem with using variance is interpreting it. it is in terms of units squared. How do you interpret square percents or square dollars? The answer is to take the square root….hence standard deviation.
St. Dev sample = ∑ (Xn – X)2 n -
1Xn = Value in sample
X = Mean
n = Number of observations
43 Sherman Consulting Inc.Driving End-to-End Process Improvement
SM
Statistics Refresher
Example:
Over the past 6 months, a CPA firm has averaged 40 hours to complete a business tax return, with a standard deviation of 2 hours. The CPA firm pledges it can complete returns within 36 - 44 hours.
What exactly does this mean? What Standard Deviation (Sigma Level) is the firm performing? How would you interpret this? Show your answer in a graphical form.
44 Sherman Consulting Inc.Driving End-to-End Process Improvement
SM
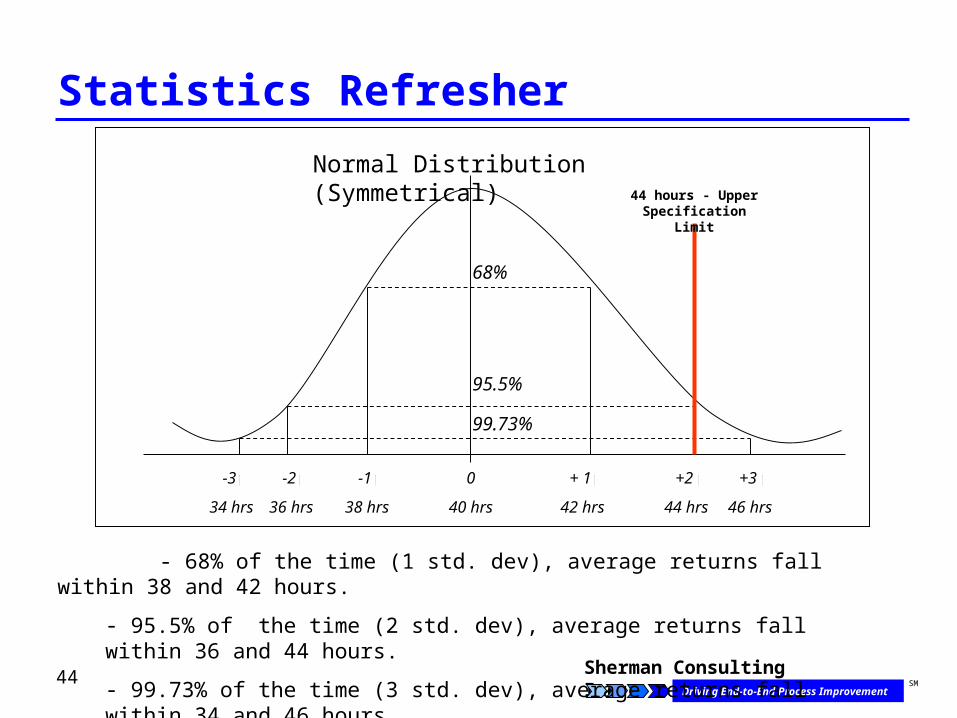
Statistics Refresher
-1
38 hrs
Normal Distribution (Symmetrical)
+2
44 hrs
+ 1
42 hrs
-2
36 hrs
0
40 hrs
-3
34 hrs
+3
46 hrs
68%
95.5%
99.73%
- 68% of the time (1 std. dev), average returns fall within 38 and 42 hours.
- 95.5% of the time (2 std. dev), average returns fall within 36 and 44 hours.
- 99.73% of the time (3 std. dev), average returns fall within 34 and 46 hours.
44 hours - Upper Specification Limit
45 Sherman Consulting Inc.Driving End-to-End Process Improvement
SM
DMAIIC ProcessCase Study
46 Sherman Consulting Inc.Driving End-to-End Process Improvement
SM
Six Sigma Case Study
1. Form teams of four or five
2. Review the case study
3. Select roles within your teams
47 Sherman Consulting Inc.Driving End-to-End Process Improvement
SM
MEASURE THE CURRENT PERFORMANCE
DEFINE THE OPPORTUNITY
IMPROVE PROCESS EFFICIENCY
ANALYZE THE CURRENT PROCESSES
CONTROL AND ADJUST NEW PROCESSES
IMPLEMENT IMPROVEMENTS
Customer FocusedData Driven
ROI Oriented
MEASURE THE CURRENT PERFORMANCE
DEFINE THE OPPORTUNITY
IMPROVE PROCESS EFFICIENCY
ANALYZE THE CURRENT PROCESSES
CONTROL AND ADJUST NEW PROCESSES
IMPLEMENT IMPROVEMENTS
Customer FocusedData Driven
ROI Oriented
Courtesy IIE and Aft Systems © 2007
Define
48 Sherman Consulting Inc.Driving End-to-End Process Improvement
SM
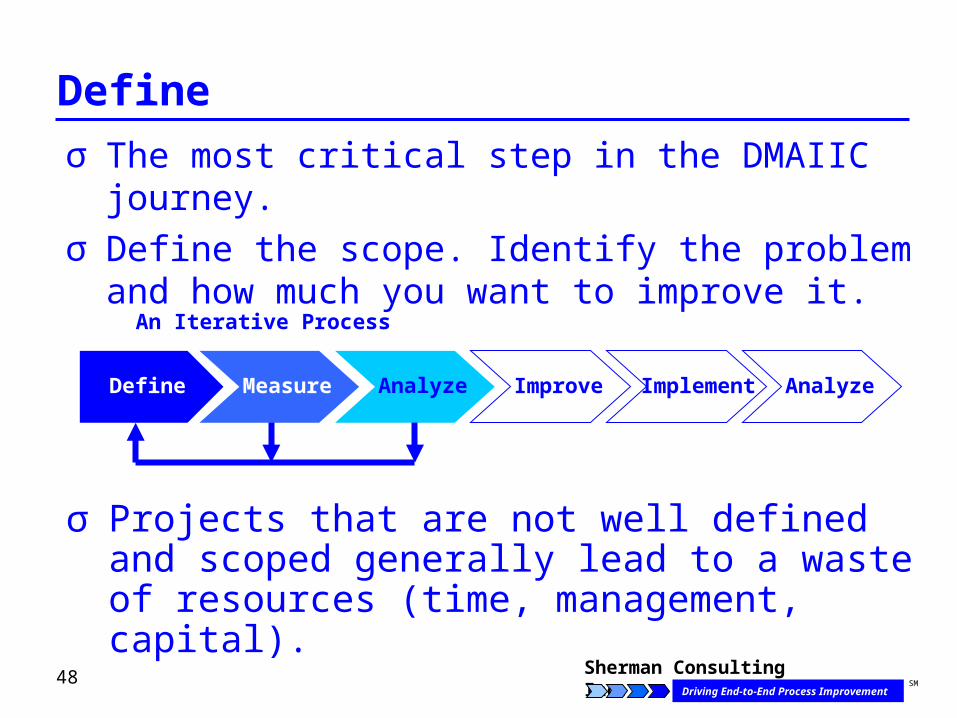
Define
σ The most critical step in the DMAIIC journey.σ Define the scope. Identify the problem and how
much you want to improve it.
σ Projects that are not well defined and scoped generally lead to a waste of resources (time, management, capital).
Define Measure Analyze Improve AnalyzeImplement
An Iterative Process
49 Sherman Consulting Inc.Driving End-to-End Process Improvement
SM
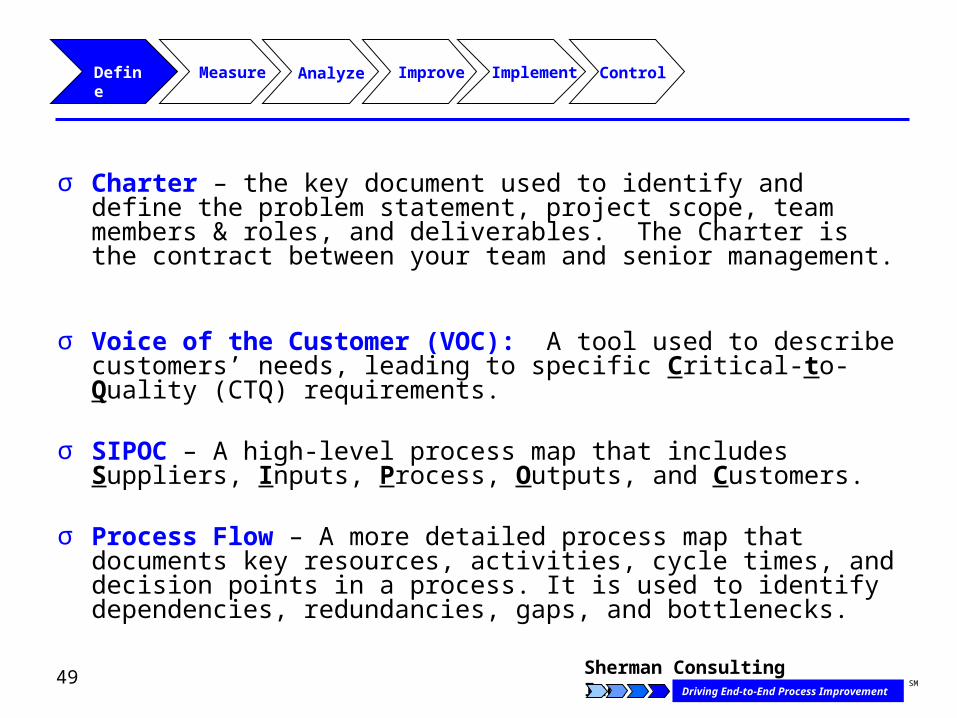
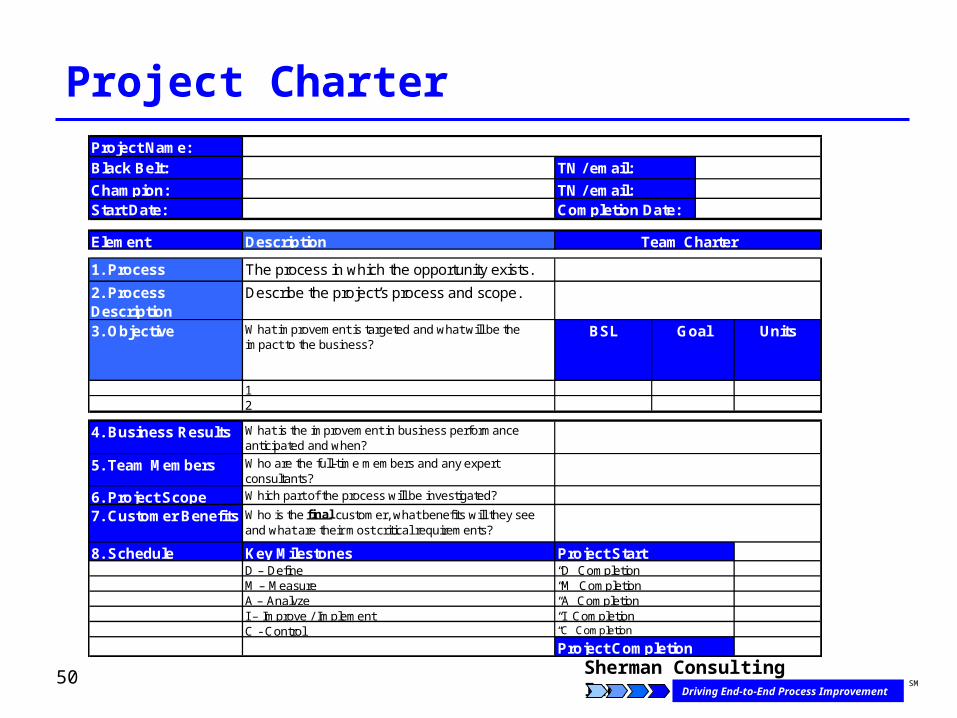
σ Charter – the key document used to identify and define the problem statement, project scope, team members & roles, and deliverables. The Charter is the contract between your team and senior management.
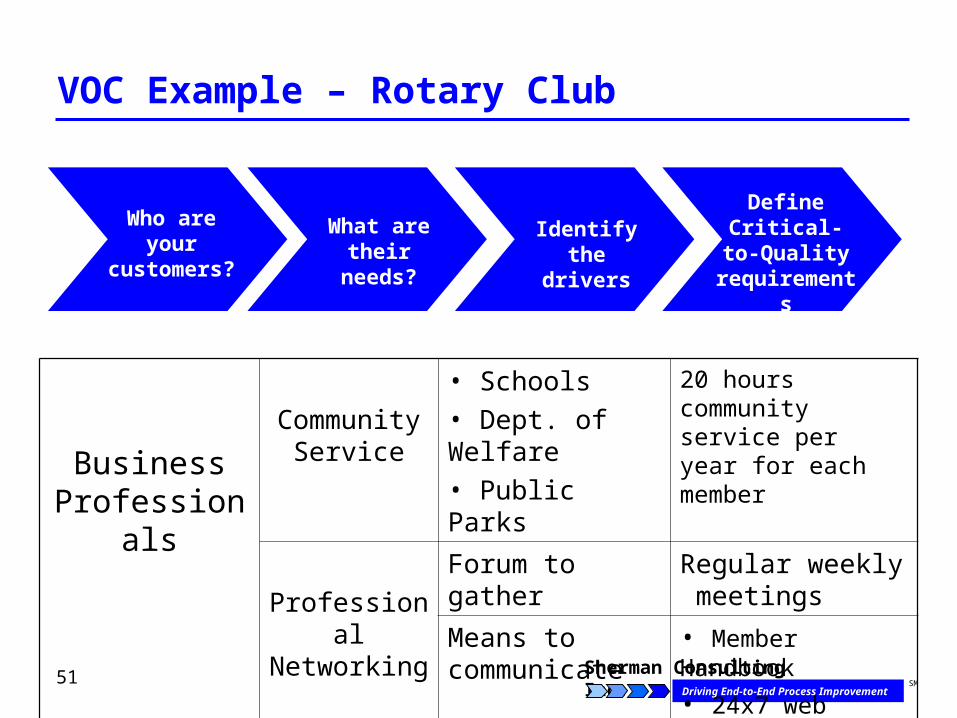
σ Voice of the Customer (VOC): A tool used to describe customers’ needs, leading to specific Critical-to-Quality (CTQ) requirements.
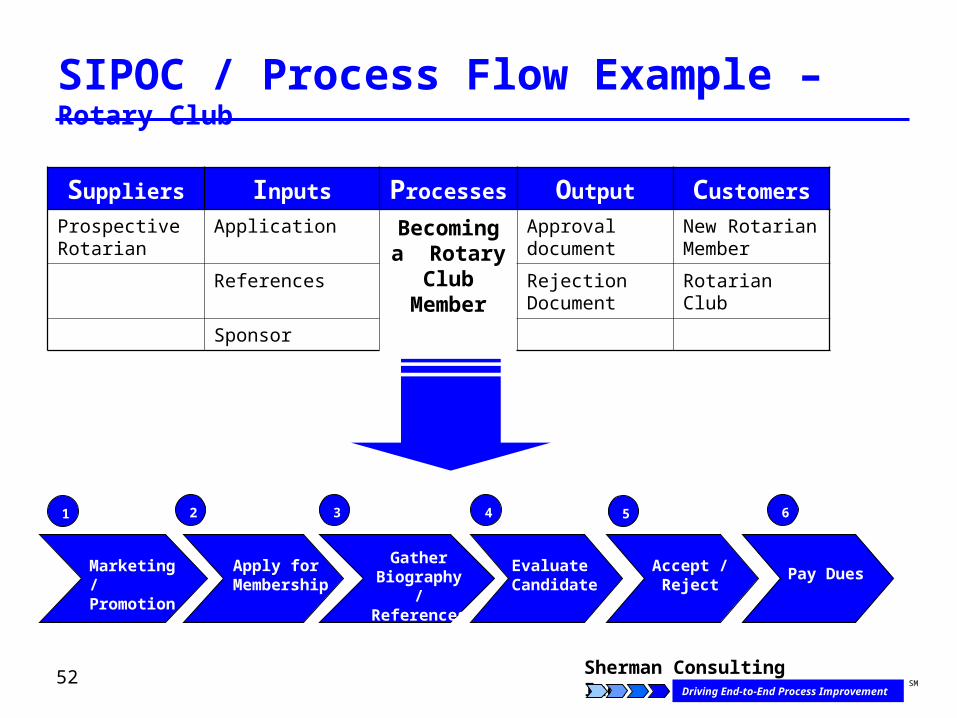
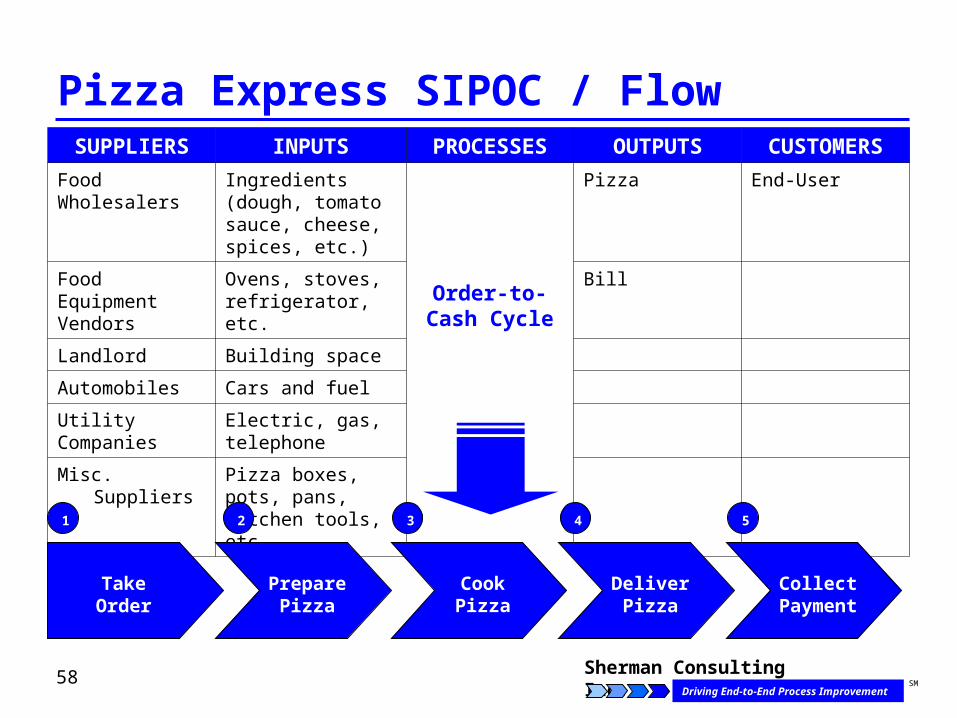
σ SIPOC – A high-level process map that includes Suppliers, Inputs, Process, Outputs, and Customers.
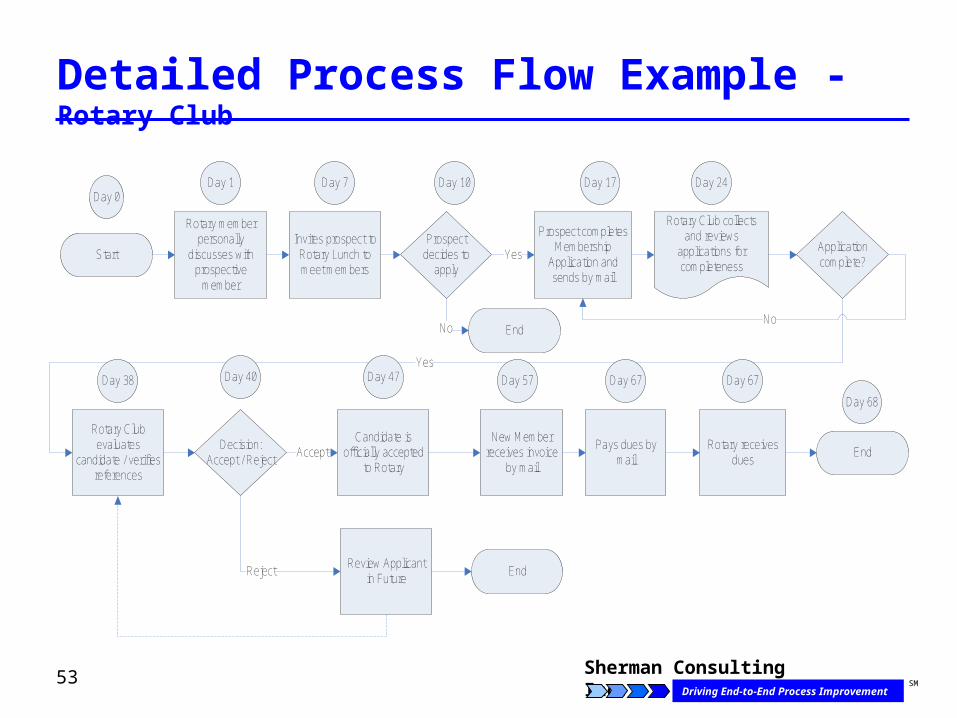
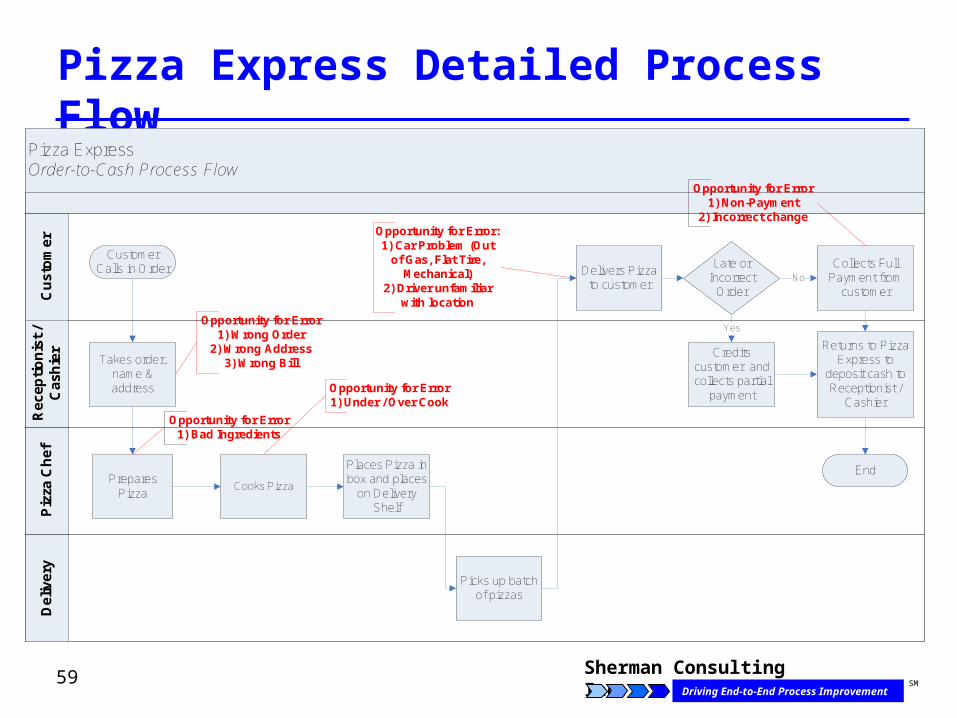
σ Process Flow – A more detailed process map that documents key resources, activities, cycle times, and decision points in a process. It is used to identify dependencies, redundancies, gaps, and bottlenecks.
Define Analyze Measure Improve Implement Control
50 Sherman Consulting Inc.Driving End-to-End Process Improvement
SM
Project CharterProject Name:Black Belt:
Champion:Start Date:
Element Description
1. Process The process in which the opportunity exists.
2. Process Description
Describe the project’s process and scope.
3. Objective What improvement is targeted and what will be the impact to the business?
BSL Units
12
4. Business Results What is the improvement in business performance anticipated and when?
5. Team Members Who are the full-time members and any expert consultants?
6. Project Scope Which part of the process will be investigated?
7. Customer Benefits Who is the final customer, what benefits will they see and what are their most critical requirements?
8. Schedule Key Milestones D – DefineM – MeasureA – AnalyzeI – Improve / ImplementC - Control “C” Completion
Project Completion
“A” Completion“I” Completion
“D” Completion“M” Completion
Project Start
Goal
Completion Date:
Team Charter
TN / email:
TN / email:
51 Sherman Consulting Inc.Driving End-to-End Process Improvement
SM
VOC Example – Rotary Club
Employees
What are their needs?
Who are your
customers?
Identify the drivers
Define Critical-to-
Quality requirements
Business Professionals
Community Service
• Schools• Dept. of Welfare• Public Parks
20 hours community service per year for each member
Professional Networking
Forum to gather Regular weekly meetings
Means to communicate
• Member Handbook
• 24x7 web access
52 Sherman Consulting Inc.Driving End-to-End Process Improvement
SM
SIPOC / Process Flow Example – Rotary Club
Suppliers Inputs Processes Output Customers
Prospective Rotarian
Application Becoming a Rotary
Club Member
Approval document
New Rotarian Member
References Rejection Document
Rotarian Club
Sponsor
Marketing / Promotion
Gather Biography / References
Apply for Membership
Evaluate Candidate
Accept / Reject
Pay Dues
1 2 3 4 5 6
53 Sherman Consulting Inc.Driving End-to-End Process Improvement
SM
Detailed Process Flow Example - Rotary Club
Start
Rotary member personally
discusses with prospective
member
Prospect completes Membership
Application and sends by mail
Rotary Club evaluates
candidate / verifies references
Rotary Club collects and reviews
applications for completeness
Decision: Accept / Reject
Candidate is officially accepted
to Rotary
Review Applicant in Future
Accept
Reject End
New Member receives invoice
by mailEnd
Pays dues by mail
Day 0Day 1
Invites prospect to Rotary Lunch to meet members
Day 7
Prospect decides to
applyYes
No End
Day 10 Day 17
Application complete?
Yes
No
Day 24
Day 38 Day 40 Day 47 Day 57
Rotary receives dues
Day 67 Day 67
Day 68
54 Sherman Consulting Inc.Driving End-to-End Process Improvement
SM
Team Activities
1. State your objective (what are you improving and by how much?)
2. Develop a VOC (identify 1 critical-to-quality requirement)
3. Complete a SIPOC Analysis and High-Level Process Flow
55 Sherman Consulting Inc.Driving End-to-End Process Improvement
SM
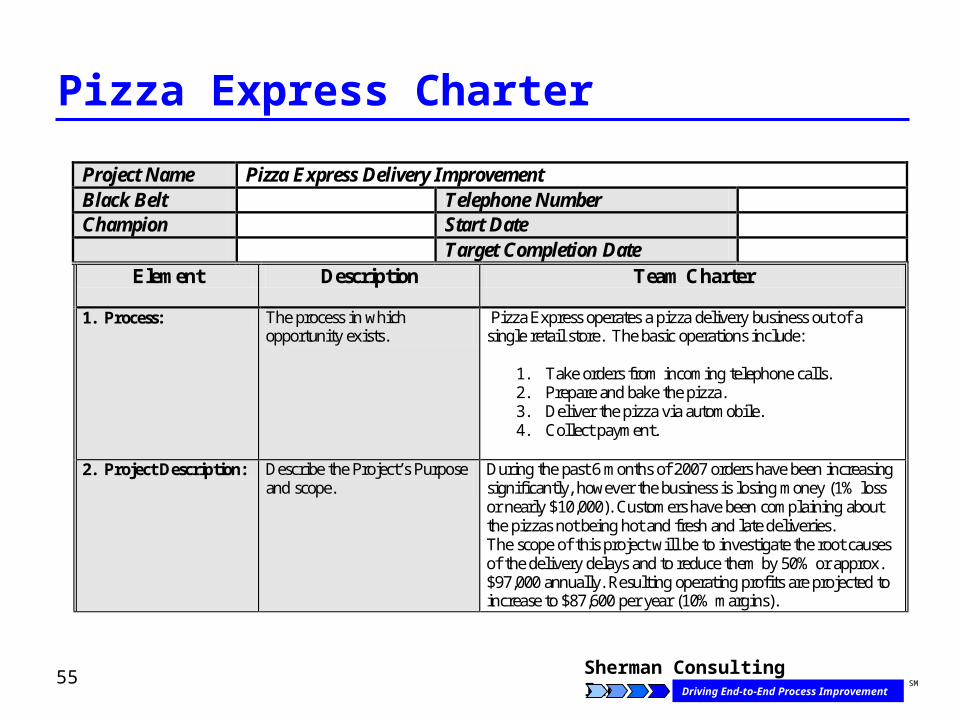
Pizza Express Charter
Project Name Pizza Express Delivery Improvement Black Belt Telephone Number Champion Start Date Target Completion Date
Element Description Team Charter
1. Process: The process in which opportunity exists.
Pizza Express operates a pizza delivery business out of a single retail store. The basic operations include:
1. Take orders from incoming telephone calls. 2. Prepare and bake the pizza. 3. Deliver the pizza via automobile. 4. Collect payment.
2. Project Description: Describe the Project’s Purpose
and scope. During the past 6 months of 2007 orders have been increasing significantly, however the business is losing money (1% loss or nearly $10,000). Customers have been complaining about the pizzas not being hot and fresh and late deliveries. The scope of this project will be to investigate the root causes of the delivery delays and to reduce them by 50% or approx. $97,000 annually. Resulting operating profits are projected to increase to $87,600 per year (10% margins).
56 Sherman Consulting Inc.Driving End-to-End Process Improvement
SM
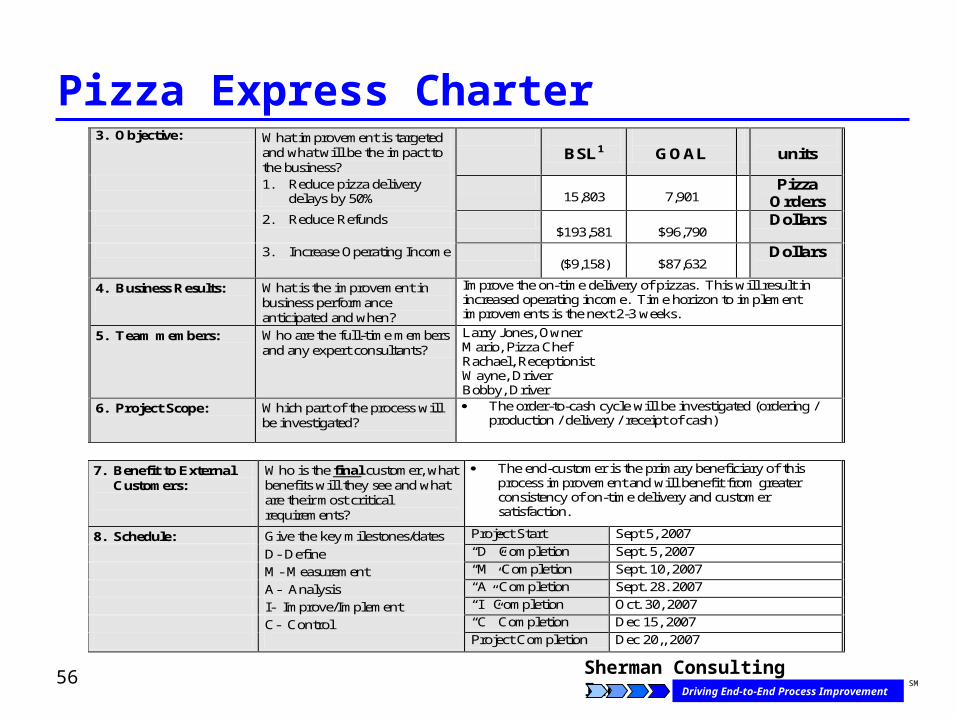
Pizza Express Charter3. Objective: What improvement is targeted
and what will be the impact to the business?
BSL1
GOAL
units
1. Reduce pizza delivery delays by 50%
15,803
7,901
Pizza Orders
2. Reduce Refunds $193,581
$96,790
Dollars
3. Increase Operating Income ($9,158)
$87,632
Dollars
4. Business Results:
What is the improvement in business performance anticipated and when?
Improve the on-time delivery of pizzas. This will result in increased operating income. Time horizon to implement improvements is the next 2-3 weeks.
5. Team members: Who are the full-time members and any expert consultants?
Larry Jones, Owner Mario, Pizza Chef Rachael, Receptionist Wayne, Driver Bobby, Driver
6. Project Scope: Which part of the process will be investigated?
The order-to-cash cycle will be investigated (ordering / production / delivery / receipt of cash)
7. Benefit to External
Customers:
Who is the final customer, what benefits will they see and what are their most critical requirements?
The end-customer is the primary beneficiary of this process improvement and will benefit from greater consistency of on-time delivery and customer satisfaction.
8. Schedule: Give the key milestones/dates Project Start Sept 5, 2007
D- Define “D” Completion Sept. 5, 2007
M- Measurement “M” Completion Sept. 10, 2007
A- Analysis “A” Completion Sept. 28. 2007
I- Improve/Implement “I” Completion Oct. 30, 2007
C- Control “C” Completion Dec 15, 2007
Project Completion Dec 20,, 2007
1 Baseline
57 Sherman Consulting Inc.Driving End-to-End Process Improvement
SM
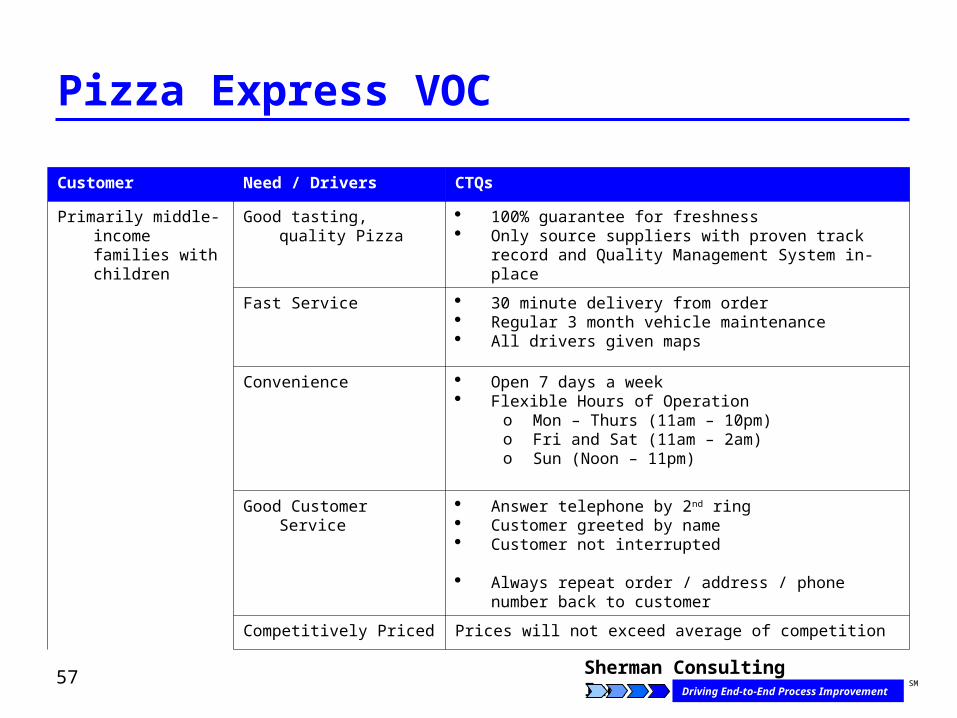
Pizza Express VOC
Customer Need / Drivers CTQs
Primarily middle-income families with children
Good tasting, quality Pizza 100% guarantee for freshness Only source suppliers with proven track record and
Quality Management System in-place
Fast Service 30 minute delivery from order Regular 3 month vehicle maintenance All drivers given maps
Convenience Open 7 days a week Flexible Hours of Operation
o Mon – Thurs (11am – 10pm)o Fri and Sat (11am – 2am) o Sun (Noon – 11pm)
Good Customer Service Answer telephone by 2nd ring Customer greeted by name Customer not interrupted Always repeat order / address / phone number back to
customer
Competitively Priced Prices will not exceed average of competition
58 Sherman Consulting Inc.Driving End-to-End Process Improvement
SM
Pizza Express SIPOC / FlowSUPPLIERS INPUTS PROCESSES OUTPUTS CUSTOMERS
Food Wholesalers
Ingredients (dough, tomato sauce, cheese, spices, etc.)
Order-to-Cash Cycle
Pizza End-User
Food Equipment Vendors
Ovens, stoves, refrigerator, etc.
Bill
Landlord Building space
Automobiles Cars and fuel
Utility Companies Electric, gas, telephone
Misc. Suppliers Pizza boxes, pots, pans, kitchen tools, etc.
Take Order
Prepare Pizza
Cook Pizza
Deliver Pizza
Collect Payment
1 2 3 4 5
59 Sherman Consulting Inc.Driving End-to-End Process Improvement
SM
Pizza Express Detailed Process FlowPizza Express Order-to-Cash Process Flow
Re
cep
tio
nis
t /
Ca
shie
rP
izza
Ch
efD
eliv
ery
Cu
sto
mer
Customer Calls in Order
Takes order, name & address
Prepares Pizza
Cooks Pizza
Places Pizza in box and places
on Delivery Shelf
Picks up batch of pizzas
Delivers Pizza to customer
Collects Full Payment from
customer
Returns to Pizza Express to
deposit cash to Receptionist /
Cashier
Late or Incorrect
Order
Credits customer and collects partial
payment
No
Yes
End
Opportunity for Error1) Wrong Order
2) Wrong Address3) Wrong Bill
Opportunity for Error1) Under / Over Cook
Opportunity for Error1) Bad Ingredients
Opportunity for Error: 1) Car Problem (Out
of Gas, Flat Tire, Mechanical)
2) Driver unfamiliar with location
Opportunity for Error1) Non-Payment
2) Incorrect change
60 Sherman Consulting Inc.Driving End-to-End Process Improvement
SM
MEASURE THE CURRENT PERFORMANCE
DEFINE THE OPPORTUNITY
IMPROVE PROCESS EFFICIENCY
ANALYZE THE CURRENT PROCESSES
CONTROL AND ADJUST NEW PROCESSES
IMPLEMENT IMPROVEMENTS
Customer FocusedData Driven
ROI Oriented
MEASURE THE CURRENT PERFORMANCE
DEFINE THE OPPORTUNITY
IMPROVE PROCESS EFFICIENCY
ANALYZE THE CURRENT PROCESSES
CONTROL AND ADJUST NEW PROCESSES
IMPLEMENT IMPROVEMENTS
Customer FocusedData Driven
ROI Oriented
Courtesy IIE and Aft Systems © 2007
Measure
61 Sherman Consulting Inc.Driving End-to-End Process Improvement
SM
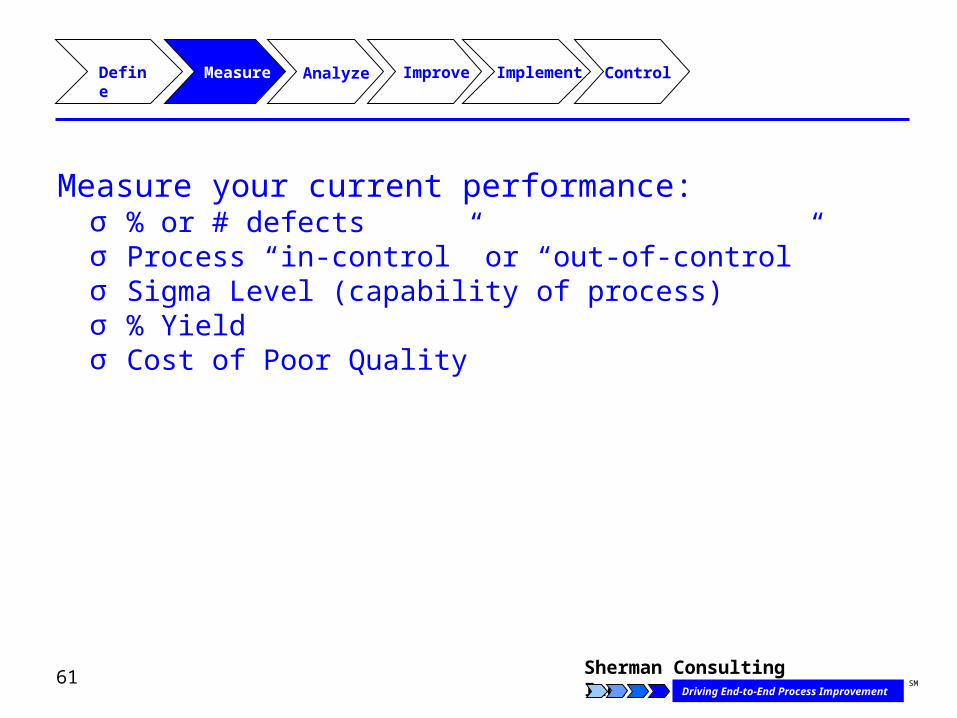
Define Analyze Measure Improve Implement Control
Measure your current performance:σ % or # defectsσ Process “in-control” or “out-of-control”σ Sigma Level (capability of process)σ % Yieldσ Cost of Poor Quality
62 Sherman Consulting Inc.Driving End-to-End Process Improvement
SM
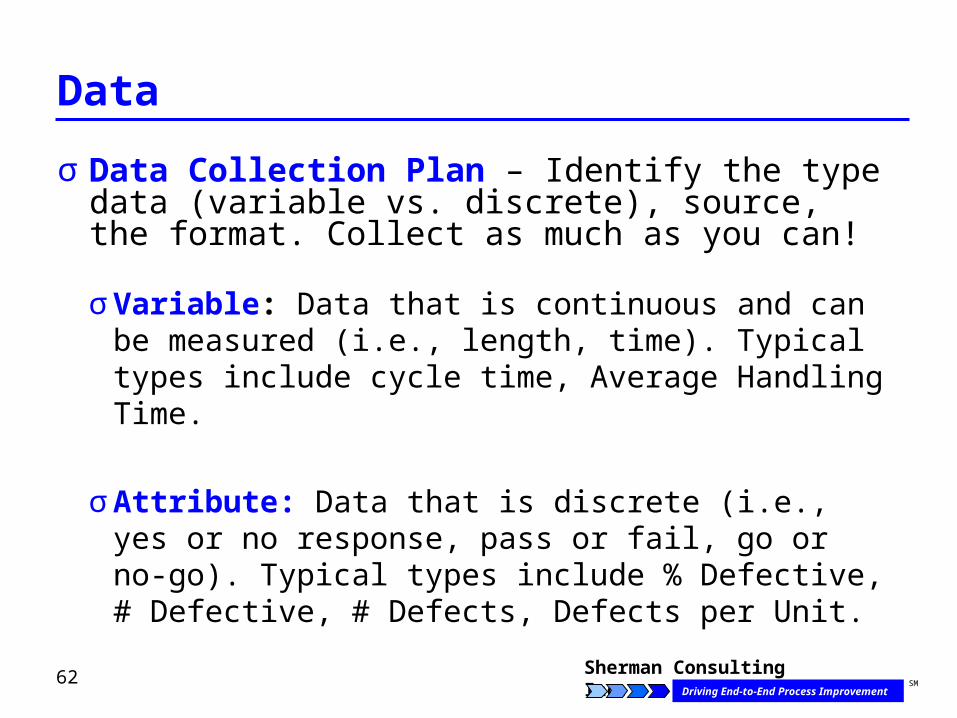
σ Data Collection Plan – Identify the type data (variable vs. discrete), source, the format. Collect as much as you can!
Data
σ Variable: Data that is continuous and can be measured (i.e., length, time). Typical types include cycle time, Average Handling Time.
σ Attribute: Data that is discrete (i.e., yes or no response, pass or fail, go or no-go). Typical types include % Defective, # Defective, # Defects, Defects per Unit.
63 Sherman Consulting Inc.Driving End-to-End Process Improvement
SM
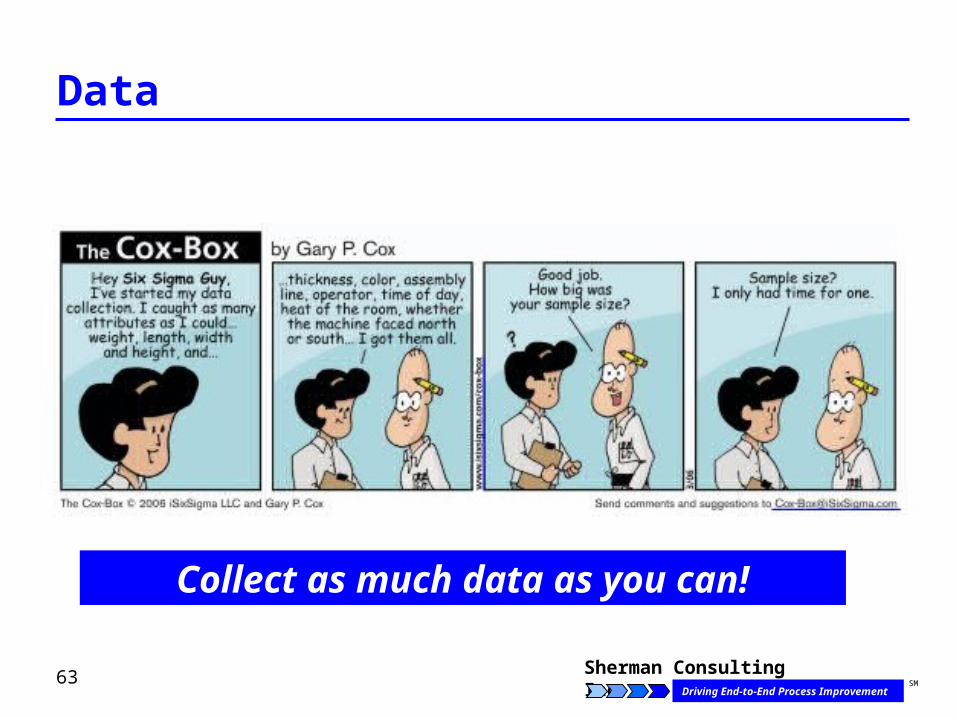
Data
Collect as much data as you can!

64 Sherman Consulting Inc.Driving End-to-End Process Improvement
SM
σ Histogram – a graphical representation of data in a bar chart format. Used to observe the “shape” of data (i.e., normal, bell-shaped vs. skewed).
σ Control Charts – The fundamental statistical tool used in Six Sigma. It shows the amount and type of variation present in the process. Stable processes are predictable and in (statistical) control.
σ Process Capability – the capability of a process to consistently make a product / service that meets a customer specification range (tolerance). Used to predict the performance of a process by comparing the width of process variation to the width of the specified tolerance.
Define Analyze Measure Improve Implement Control
Upper Specification Limit
Lower Specification Limit
X
Design Width
Process Width
A Capable Process
65 Sherman Consulting Inc.Driving End-to-End Process Improvement
SM
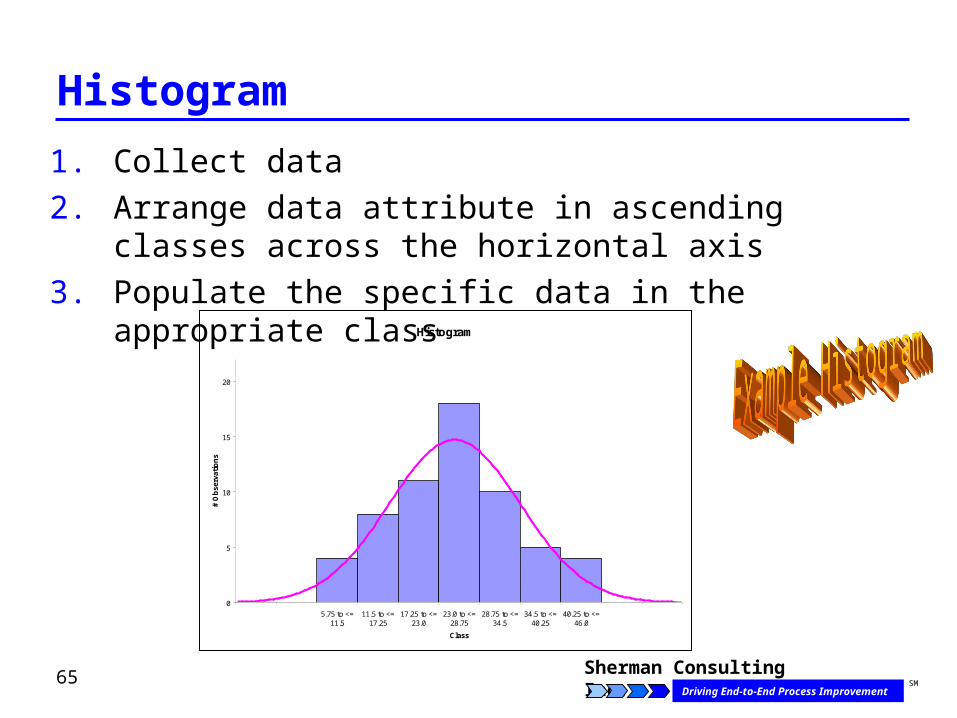
Histogram
1. Collect data
2. Arrange data attribute in ascending classes across the horizontal axis
3. Populate the specific data in the appropriate classHistogram
0
5
10
15
20
5.75 to <=11.5
11.5 to <=17.25
17.25 to <=23.0
23.0 to <=28.75
28.75 to <=34.5
34.5 to <=40.25
40.25 to <=46.0
Class
# O
bse
rvat
ion
s
Normal Distribution Mean = 25.233Std Dev = 9.358KS Test p-value = .4673
66 Sherman Consulting Inc.Driving End-to-End Process Improvement
SM
Control Chart
σ Considered the foundation of Six Sigma statistical analysisσ Shows the amount and type (special or common causes) of
variation in a processσ Indicates if a process is
σ “In-Control” stable, predictableσ “Out-of Control” not stable, special causes exist
67 Sherman Consulting Inc.Driving End-to-End Process Improvement
SM
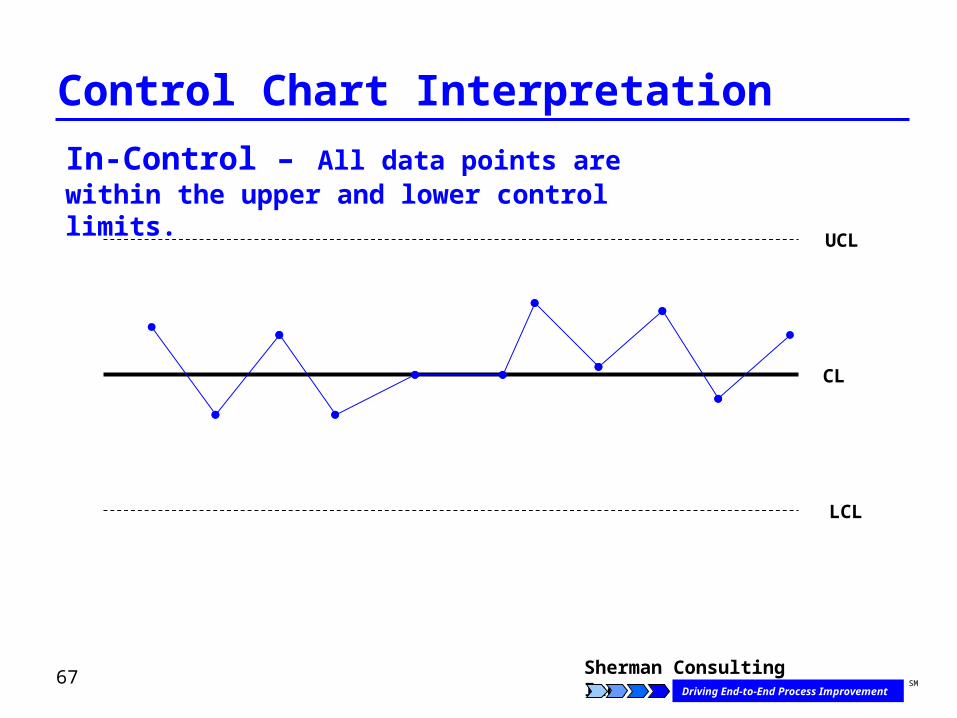
Control Chart Interpretation
UCL
LCL
In-Control – All data points are within the upper and lower control limits.
CL
68 Sherman Consulting Inc.Driving End-to-End Process Improvement
SM
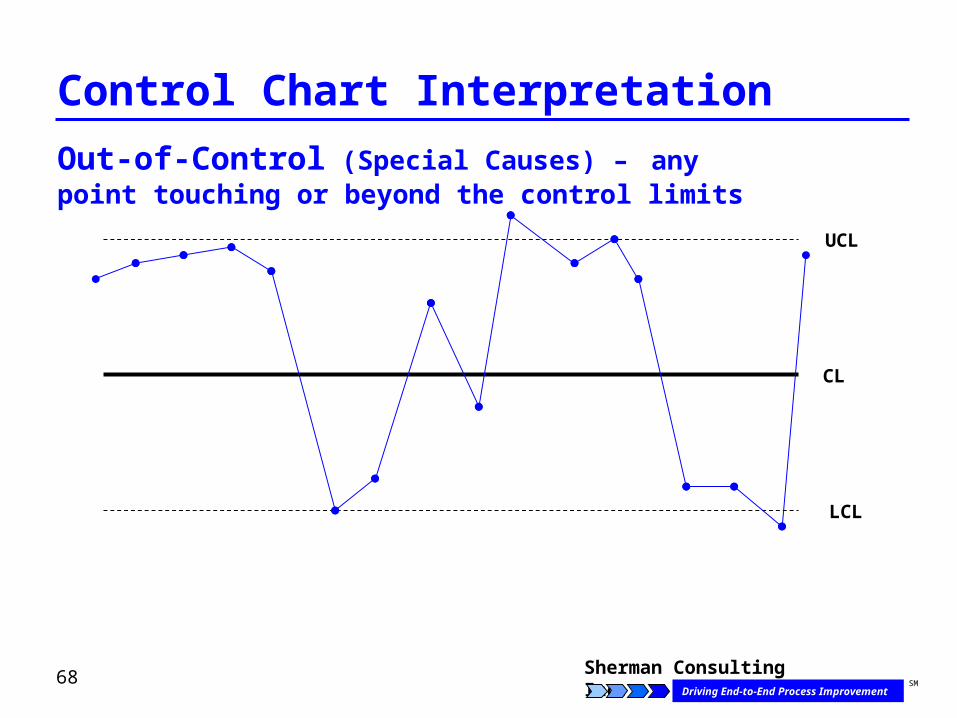
Control Chart Interpretation
UCL
LCL
Out-of-Control (Special Causes) – any point touching or beyond the control limits
CL
69 Sherman Consulting Inc.Driving End-to-End Process Improvement
SM
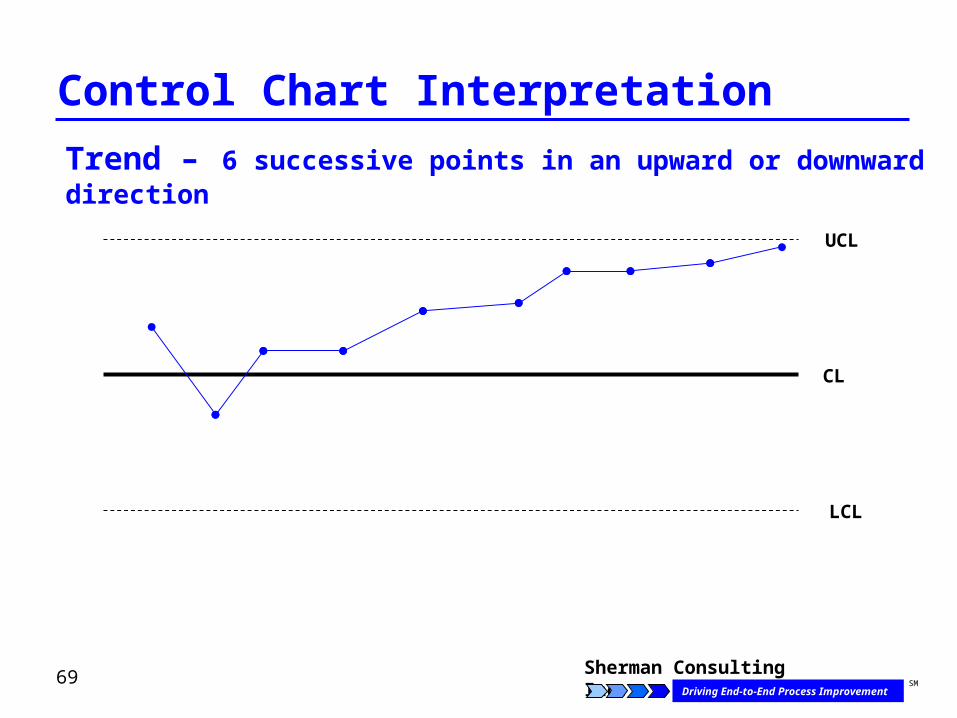
Control Chart Interpretation
Trend – 6 successive points in an upward or downward direction
UCL
LCL
CL
70 Sherman Consulting Inc.Driving End-to-End Process Improvement
SM
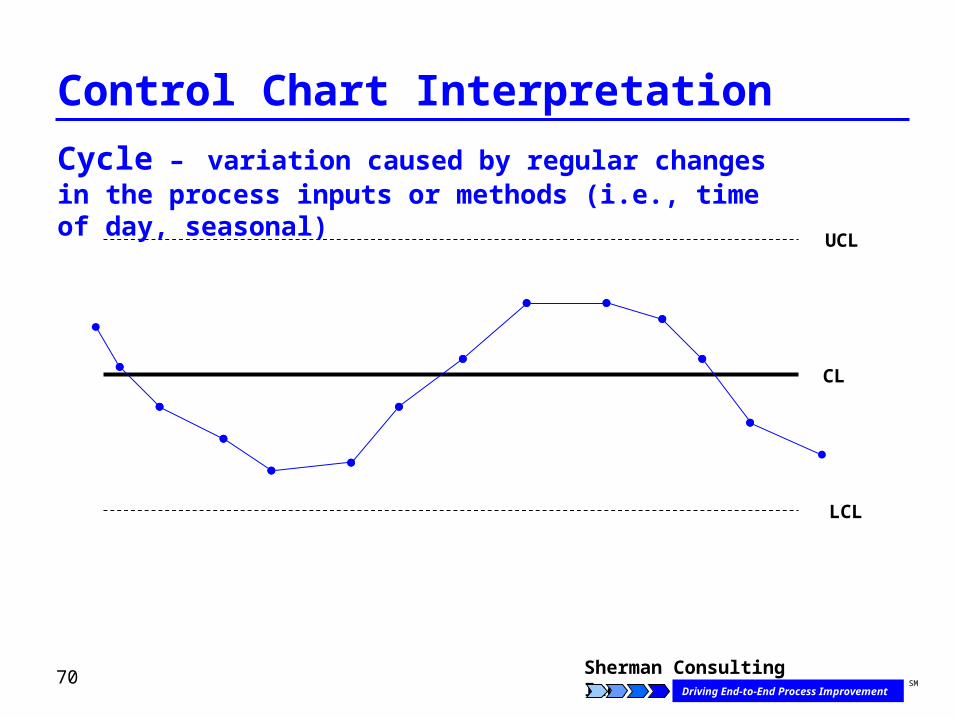
Control Chart Interpretation
UCL
LCL
Cycle – variation caused by regular changes in the process inputs or methods (i.e., time of day, seasonal)
CL
71 Sherman Consulting Inc.Driving End-to-End Process Improvement
SM
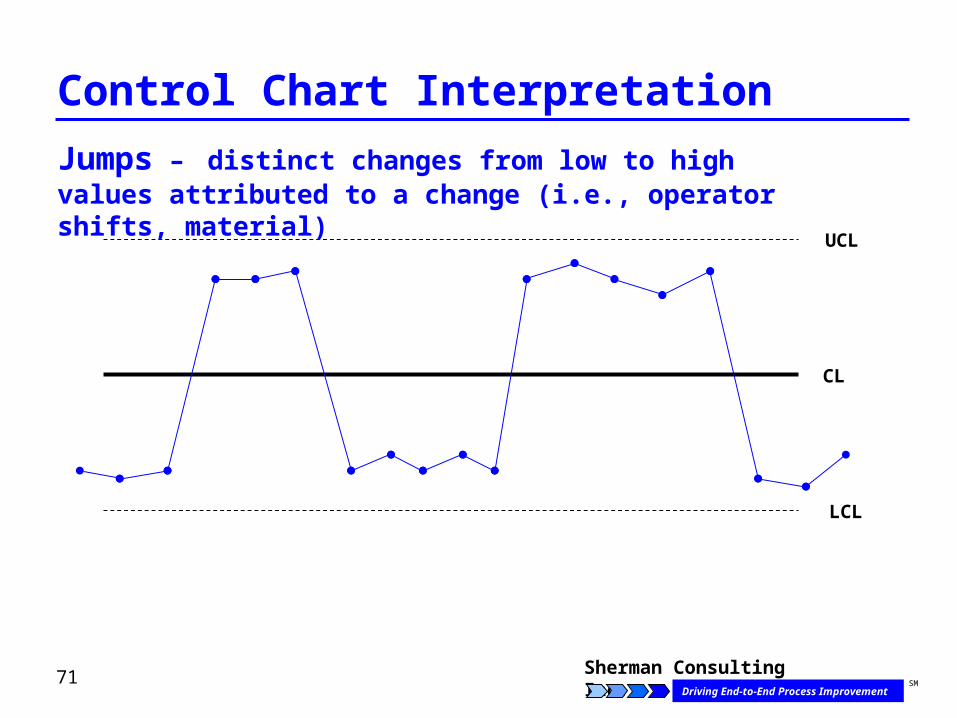
Control Chart Interpretation
UCL
LCL
Jumps – distinct changes from low to high values attributed to a change (i.e., operator shifts, material)
CL
72 Sherman Consulting Inc.Driving End-to-End Process Improvement
SM
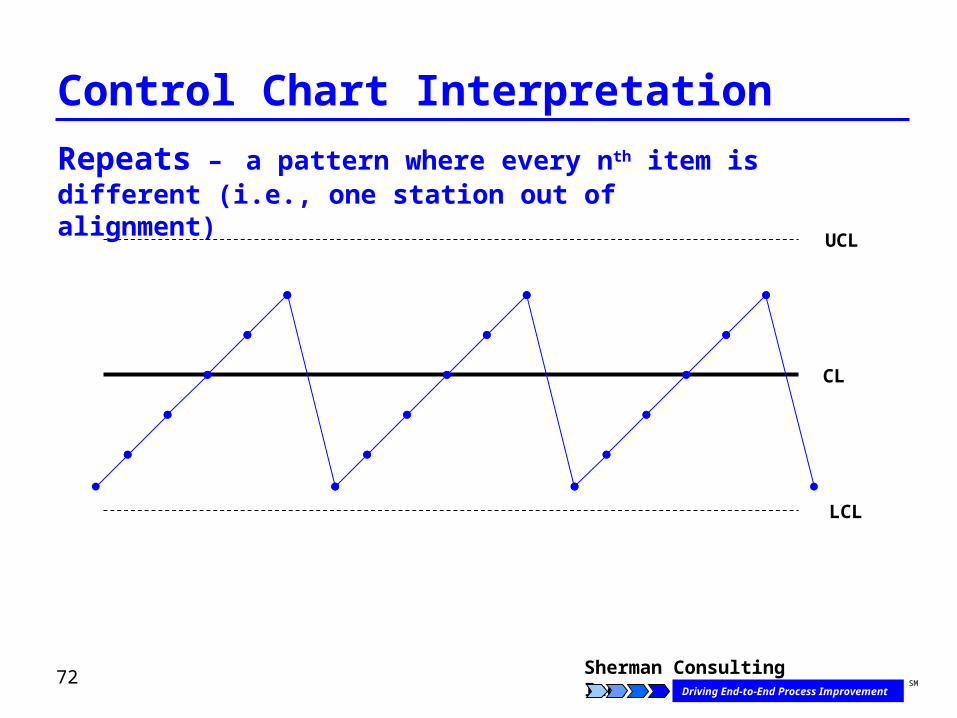
Control Chart Interpretation
UCL
LCL
Repeats – a pattern where every nth item is different (i.e., one station out of alignment)
CL
73 Sherman Consulting Inc.Driving End-to-End Process Improvement
SM
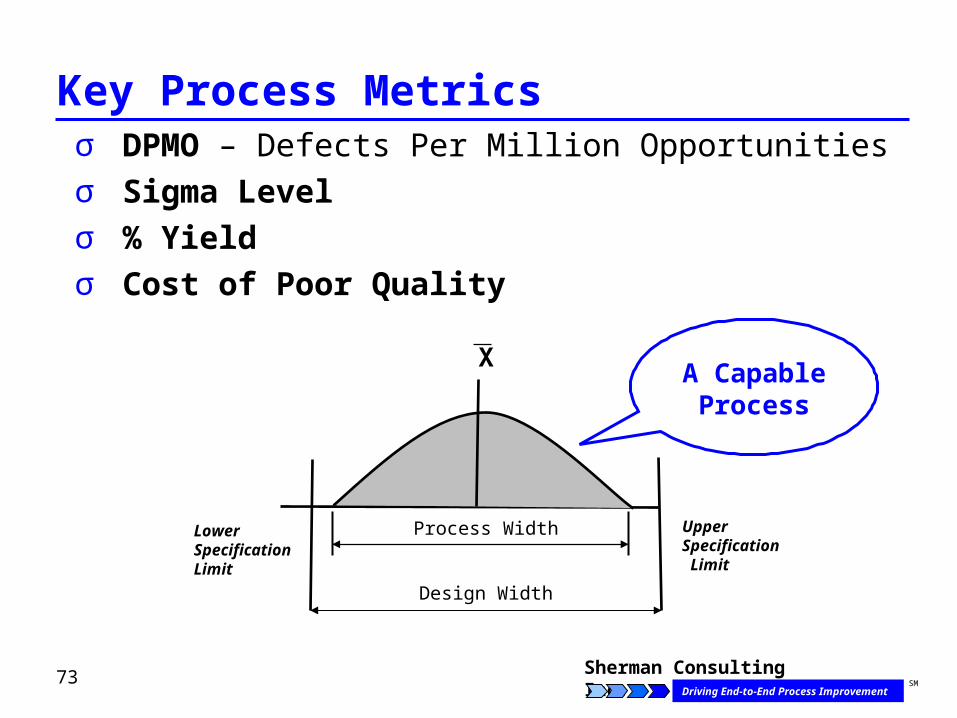
Key Process Metricsσ DPMO – Defects Per Million Opportunitiesσ Sigma Level σ % Yield σ Cost of Poor Quality
Upper Specification Limit
Lower Specification Limit
X
Design Width
Process Width
A Capable Process
74 Sherman Consulting Inc.Driving End-to-End Process Improvement
SM
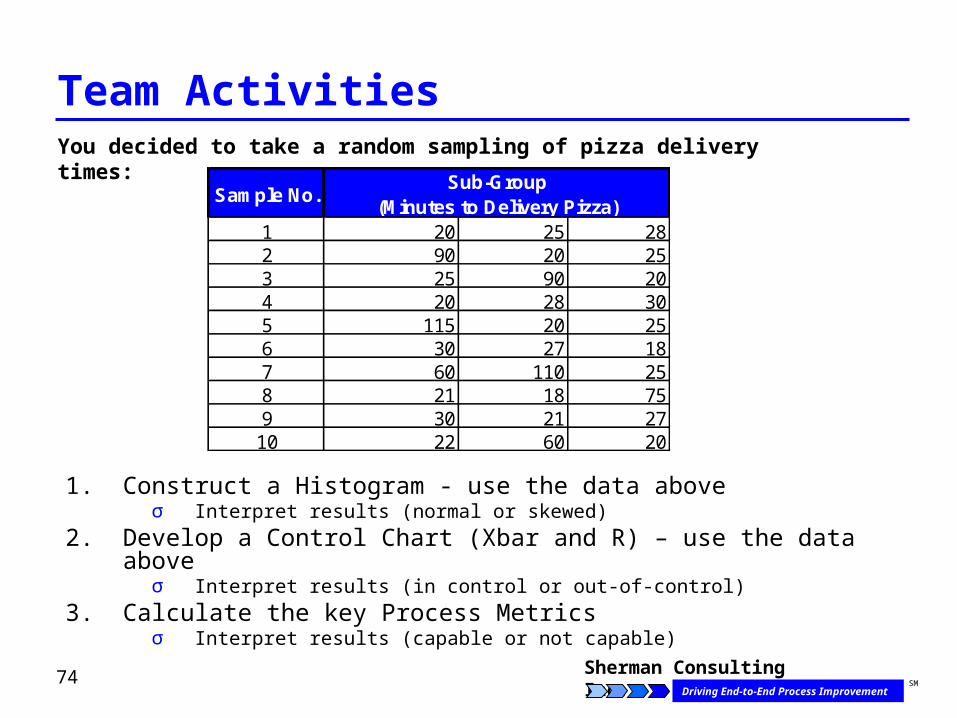
Team Activities
1. Construct a Histogram - use the data aboveσ Interpret results (normal or skewed)
2. Develop a Control Chart (Xbar and R) – use the data aboveσ Interpret results (in control or out-of-control)
3. Calculate the key Process Metricsσ Interpret results (capable or not capable)
Sample No.
1 20 25 282 90 20 253 25 90 204 20 28 305 115 20 256 30 27 187 60 110 258 21 18 759 30 21 27
10 22 60 20
Sub-Group (Minutes to Delivery Pizza)
You decided to take a random sampling of pizza delivery times:
75 Sherman Consulting Inc.Driving End-to-End Process Improvement
SM
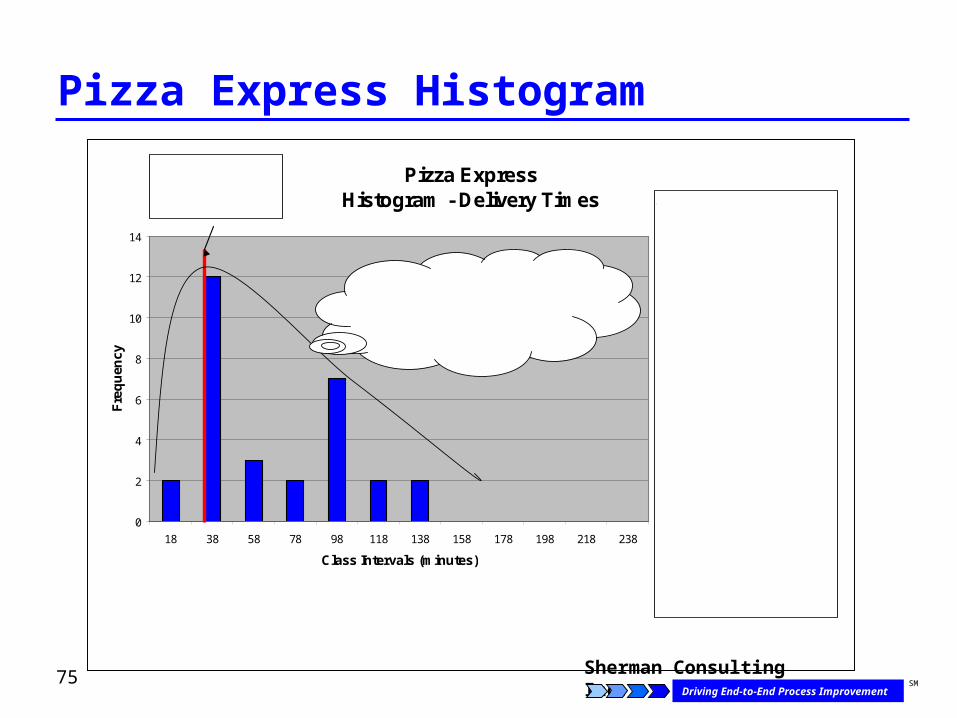
Pizza Express Histogram
Pizza ExpressHistogram - Delivery Times
0
2
4
6
8
10
12
14
18 38 58 78 98 118 138 158 178 198 218 238
Class Intervals (minutes)
Fre
qu
ency
Interpretation of Chart:
Shape: Ideally, the histogram should be bell-shaped, symetrical and unimodal (single peak) to indicate the data is normally distributed.
Histograms that are skewed to the left or right or have multiple peaks indicate the data is not normally distributed. This could mean the presence of Special Causes (unusual changes) or possibly the data is coming from 2 or more sources (i.e., shifts, people, machines, suppliers).
Process Cabability: A histogram wiithin LSL and USL indicates the process is capble of meeting Customer Requirements.
If bordering / exceeding the LSL or USL, the process is too variable and not capable of meeting customer requirements. The process must be improved.
Upper Specification Limit. Customer
Requirements (within 30 minutes)
Data skewed to the right beyond the red bar (30 min.
Upper Spec. Limit)…indicating process is not capable.
76 Sherman Consulting Inc.Driving End-to-End Process Improvement
SM
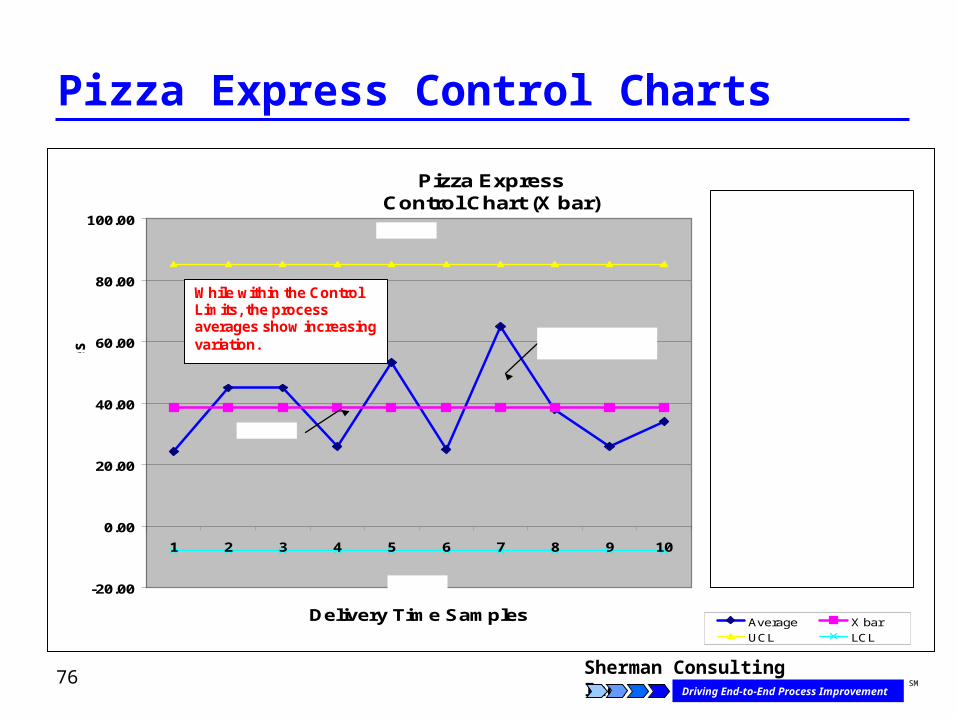
Pizza Express Control Charts
Pizza Express Control Chart (X bar)
-20.00
0.00
20.00
40.00
60.00
80.00
100.00
1 2 3 4 5 6 7 8 9 10
Delivery Time SamplesAverage X bar
UCL LCL
Interpreting the Chart
If the Averages Line (blue line) is within the Upper Control Limit and Lower Control Limit…..the process is IN CONTROL. While good, there is still an opportunity to improve the process. .
If the Averages Line (blue line) is touching or outside of the UCL or LCL…….the process is NOT IN CONTROL. Special Causes exist (i.e., a new vendor is added, a new employee has not been fully trained) and must be addressed before attempting to improve the process.
Min
ute
s
X Bar
Averages Line of each Sample
UCL
LCL
While within the Control Limits, the process averages show increasing variation.
77 Sherman Consulting Inc.Driving End-to-End Process Improvement
SM
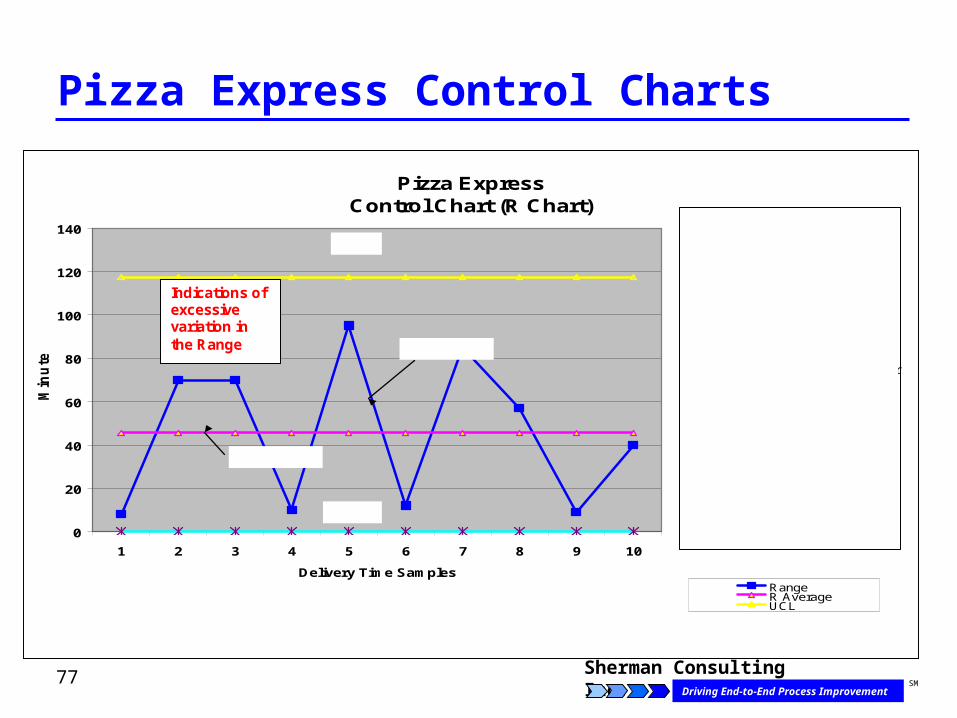
Pizza Express Control Charts
Pizza Express
Control Chart (R Chart)
0
20
40
60
80
100
120
140
1 2 3 4 5 6 7 8 9 10
Delivery Time Samples
Min
ute
s
RangeR AverageUCLLCL
Interpreting the Chart
If the Range line (blue) is within the Upper Control Limit and Lower Control Limit…..the process is IN CONTROL. While good, there is still an opportunity to improve the process. .
If the Range Line (blue) is touching or outside of the UCL or LCL…….the process is NOT IN CONTROL. Special Causes exist (i.e., a new vendor is added, a new employee has not been fully trained) and must be addressed before attempting to improve the process.
Range Line
LCL
R Average
UCL
Indications of excessive variation in the Range
78 Sherman Consulting Inc.Driving End-to-End Process Improvement
SM
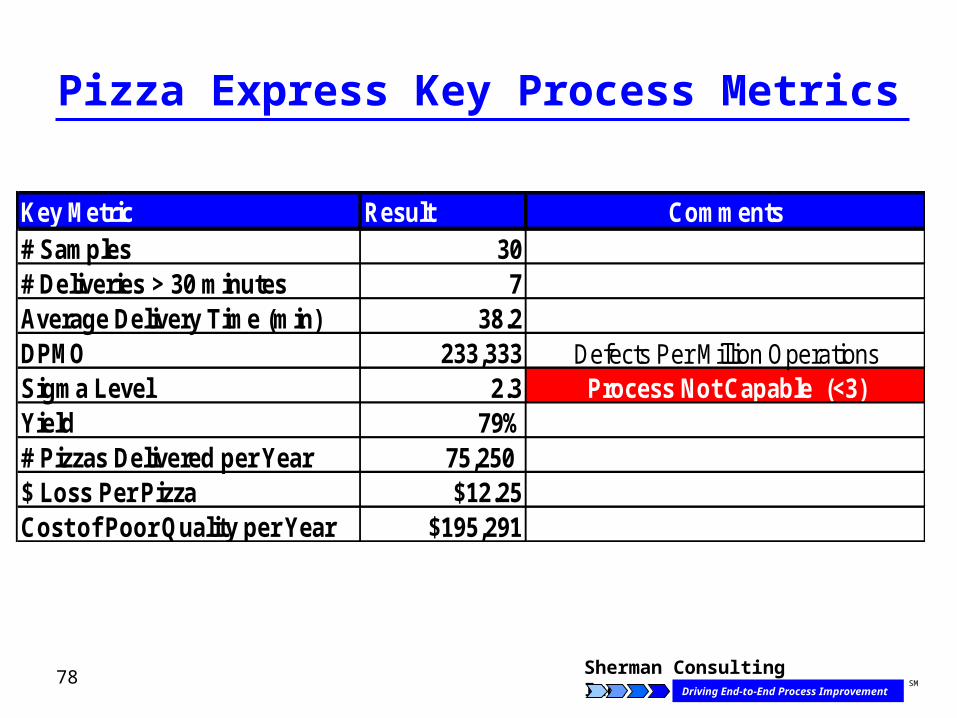
Pizza Express Key Process Metrics
Key Metric Result Comments# Samples 30# Deliveries > 30 minutes 7Average Delivery Time (min) 38.2DPMO 233,333 Defects Per Million OperationsSigma Level 2.3 Process Not Capable (<3)Yield 79%# Pizzas Delivered per Year 75,250 $ Loss Per Pizza $12.25Cost of Poor Quality per Year $195,291
79 Sherman Consulting Inc.Driving End-to-End Process Improvement
SM
MEASURE THE CURRENT PERFORMANCE
DEFINE THE OPPORTUNITY
IMPROVE PROCESS EFFICIENCY
ANALYZE THE CURRENT PROCESSES
CONTROL AND ADJUST NEW PROCESSES
IMPLEMENT IMPROVEMENTS
Customer FocusedData Driven
ROI Oriented
MEASURE THE CURRENT PERFORMANCE
DEFINE THE OPPORTUNITY
IMPROVE PROCESS EFFICIENCY
ANALYZE THE CURRENT PROCESSES
CONTROL AND ADJUST NEW PROCESSES
IMPLEMENT IMPROVEMENTS
Customer FocusedData Driven
ROI Oriented
Courtesy IIE and Aft Systems © 2007
Analyze
80 Sherman Consulting Inc.Driving End-to-End Process Improvement
SM
The primary purpose of the Analyze stage is to:σ Make sense out of the data σ Identify root causes of the problem.
Define Analyze Measure Improve Implement Control
81 Sherman Consulting Inc.Driving End-to-End Process Improvement
SM
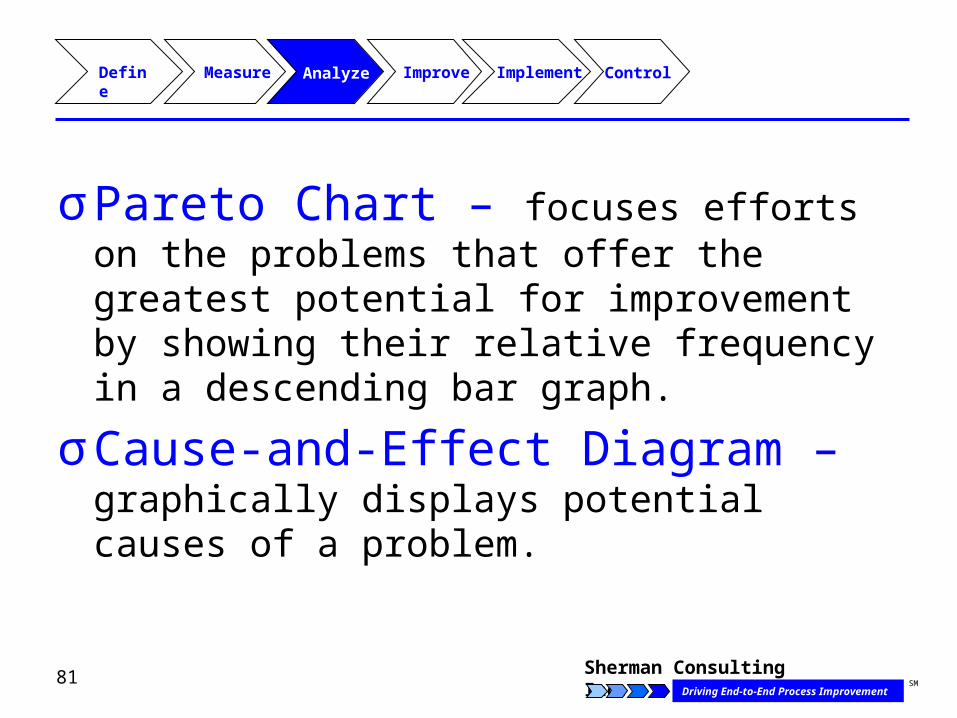
σPareto Chart – focuses efforts on the problems that offer the greatest potential for improvement by showing their relative frequency in a descending bar graph.
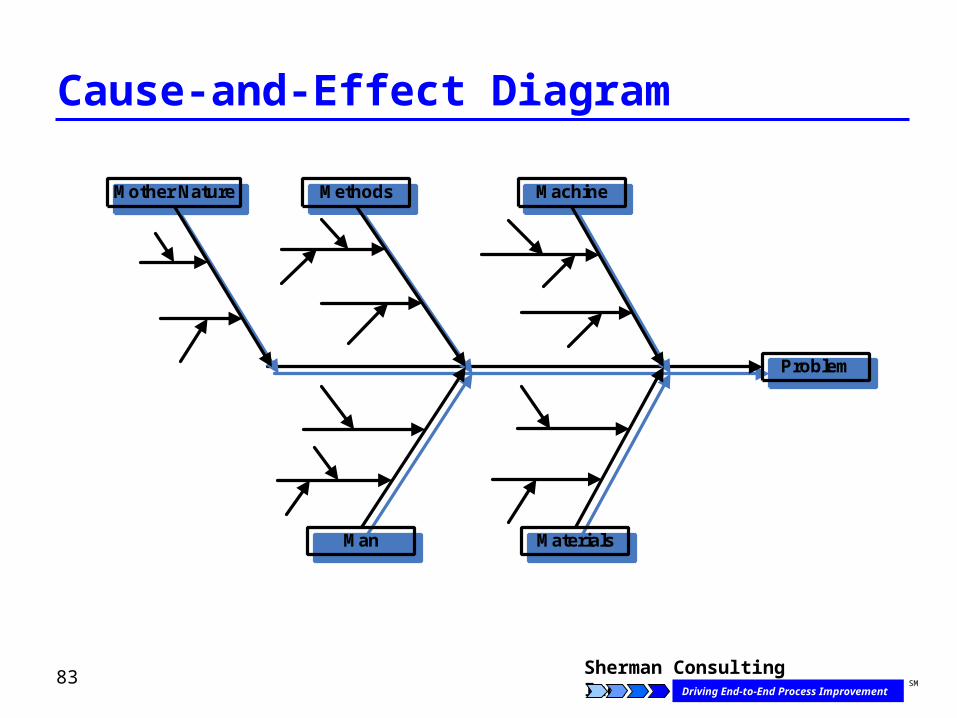
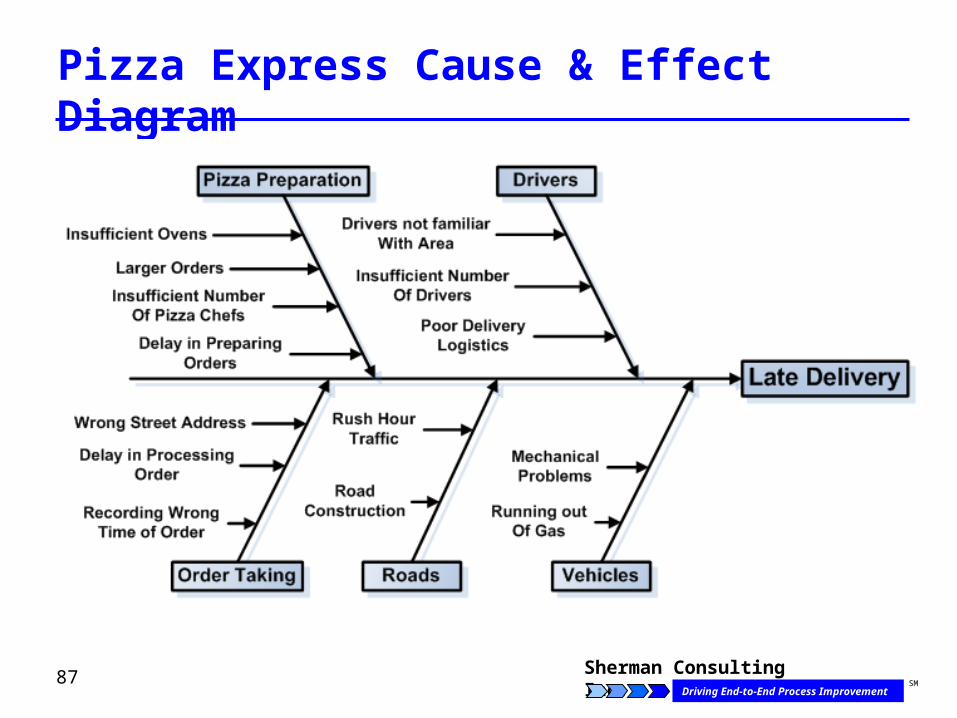
σCause-and-Effect Diagram – graphically displays potential causes of a problem.
Define Analyze Measure Improve Implement Control
82 Sherman Consulting Inc.Driving End-to-End Process Improvement
SM
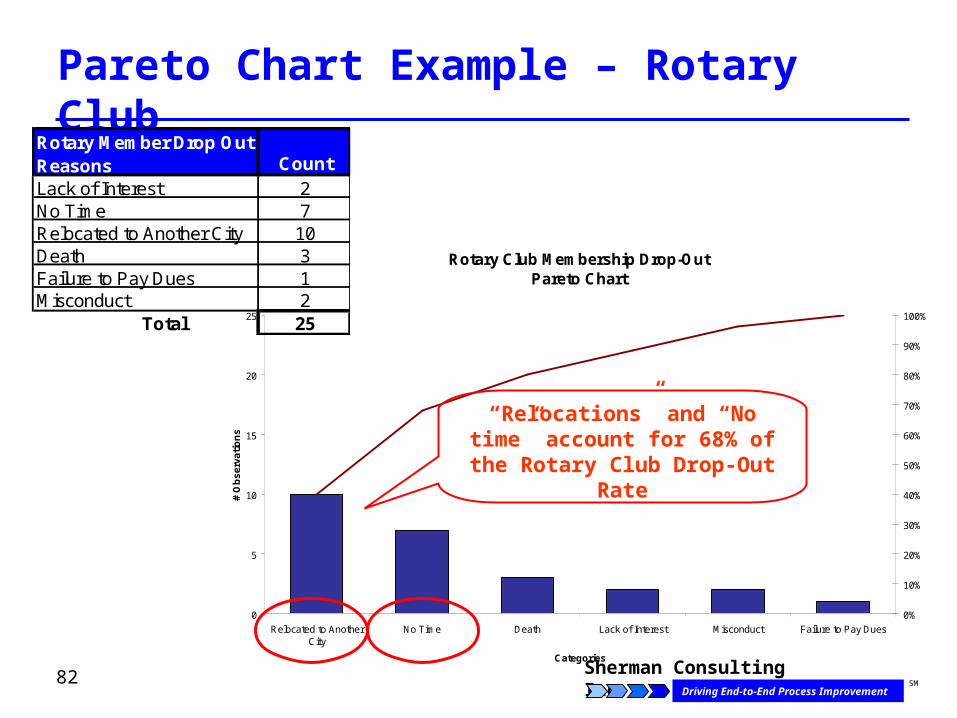
Pareto Chart Example – Rotary ClubRotary Member Drop Out Reasons CountLack of Interest 2No Time 7Relocated to Another City 10Death 3Failure to Pay Dues 1Misconduct 2
Total 25
Rotary Club Membership Drop-Out Pareto Chart
0
5
10
15
20
25
Relocated to AnotherCity
No Time Death Lack of Interest Misconduct Failure to Pay Dues
Categories
# O
bse
rvat
ion
s
0%
10%
20%
30%
40%
50%
60%
70%
80%
90%
100%
“Relocations” and “No time” account for 68% of the Rotary
Club Drop-Out Rate
83 Sherman Consulting Inc.Driving End-to-End Process Improvement
SM
Cause-and-Effect Diagram
Problem
Methods Machine
Man Materials
Mother Nature
84 Sherman Consulting Inc.Driving End-to-End Process Improvement
SM
Root Cause Exercise
σ What do you think caused the Titanic to sink?
85 Sherman Consulting Inc.Driving End-to-End Process Improvement
SM
Team Activities
1. Develop a Pareto Chart σ Interpret the results
2. Develop a Cause-and-Effect diagram σ Interpret the results
86 Sherman Consulting Inc.Driving End-to-End Process Improvement
SM
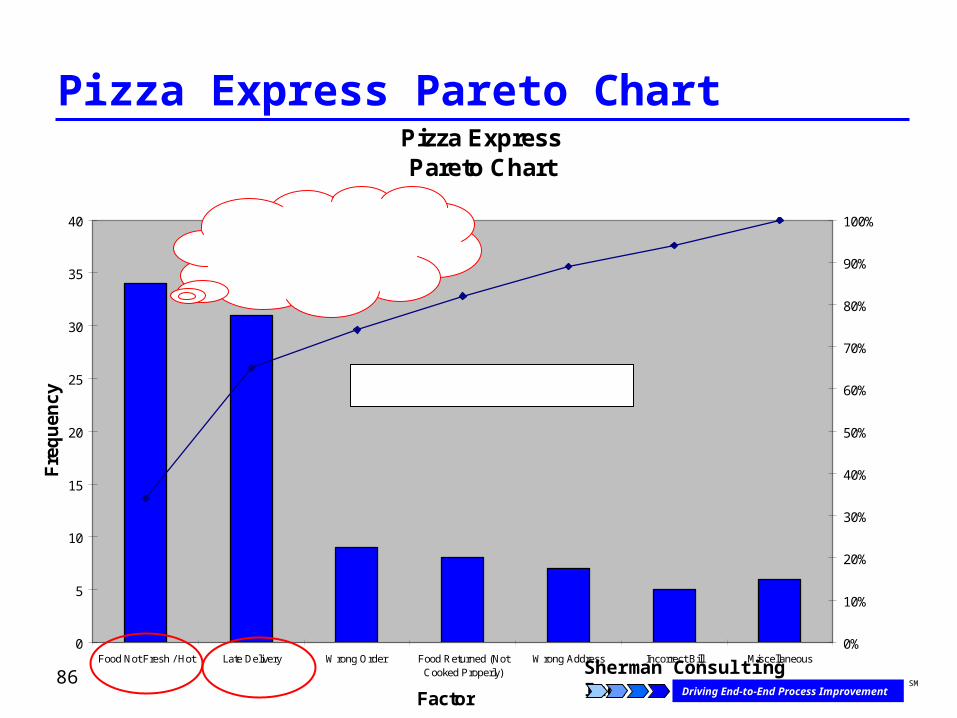
Pizza Express Pareto ChartPizza ExpressPareto Chart
0
5
10
15
20
25
30
35
40
Food Not Fresh / Hot Late Delivery Wrong Order Food Returned (NotCooked Properly)
Wrong Address Incorrect Bill Miscellaneous
Factor
Fre
qu
ency
0%
10%
20%
30%
40%
50%
60%
70%
80%
90%
100%65% of the complaints consist of Food Not Fresh / Hot and Late
Deliveries
Late Delivery appears positively correlated with Food Not Fresh / Hot
87 Sherman Consulting Inc.Driving End-to-End Process Improvement
SM
Pizza Express Cause & Effect Diagram
88 Sherman Consulting Inc.Driving End-to-End Process Improvement
SM
MEASURE THE CURRENT PERFORMANCE
DEFINE THE OPPORTUNITY
IMPROVE PROCESS EFFICIENCY
ANALYZE THE CURRENT PROCESSES
CONTROL AND ADJUST NEW PROCESSES
IMPLEMENT IMPROVEMENTS
Customer FocusedData Driven
ROI Oriented
MEASURE THE CURRENT PERFORMANCE
DEFINE THE OPPORTUNITY
IMPROVE PROCESS EFFICIENCY
ANALYZE THE CURRENT PROCESSES
CONTROL AND ADJUST NEW PROCESSES
IMPLEMENT IMPROVEMENTS
Customer FocusedData Driven
ROI Oriented
Courtesy IIE and Aft Systems © 2007
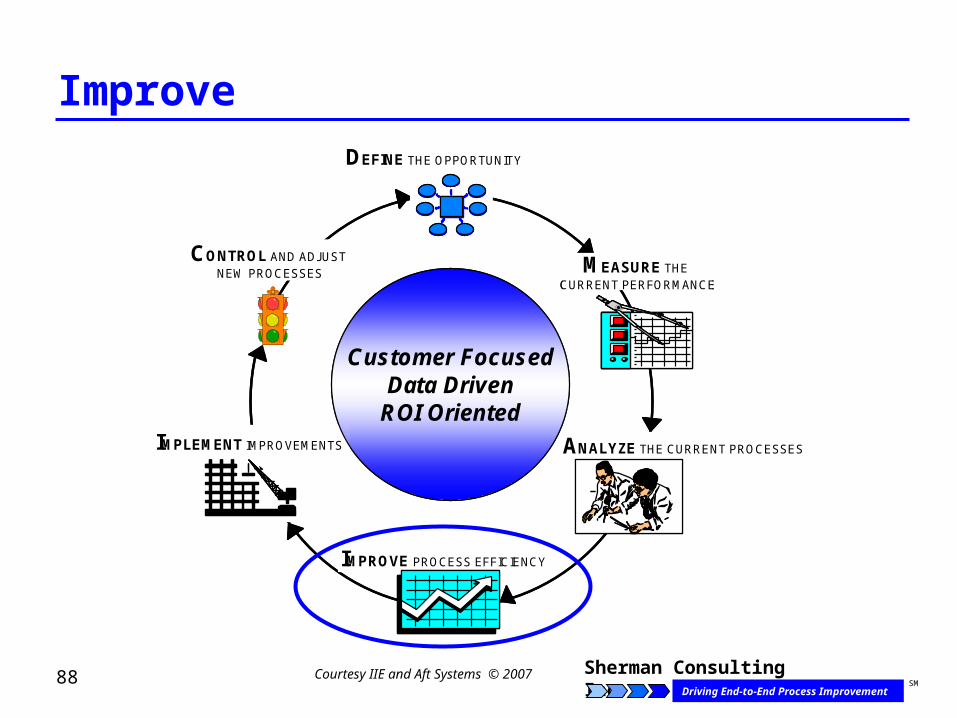
Improve
89 Sherman Consulting Inc.Driving End-to-End Process Improvement
SM
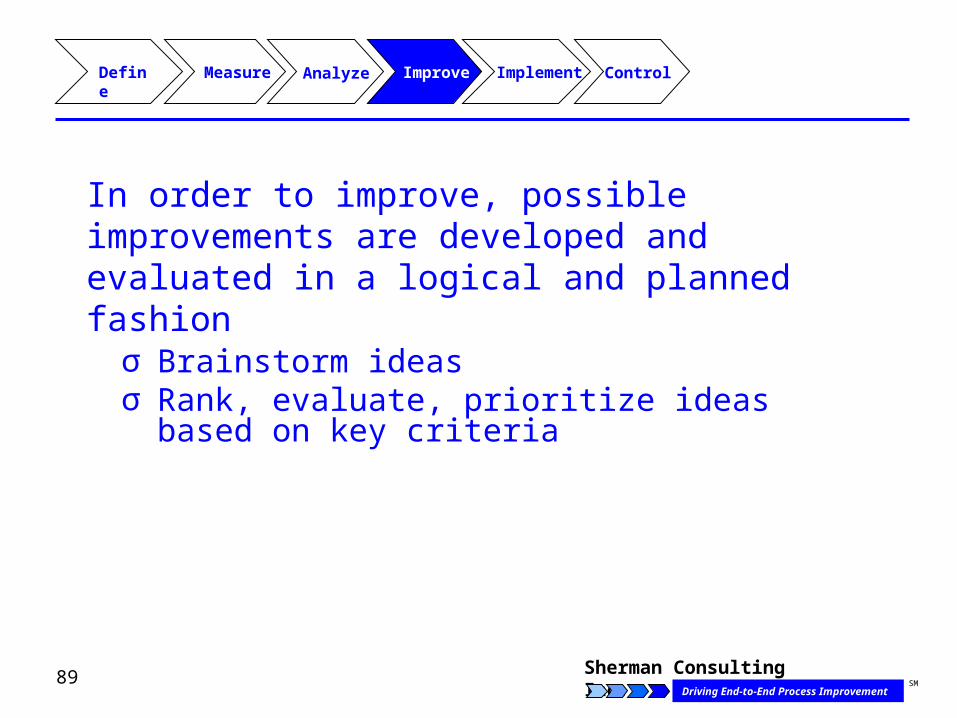
In order to improve, possible improvements are developed and evaluated in a logical and planned fashion
Define Analyze Measure Improve Implement Control
σ Brainstorm ideasσ Rank, evaluate, prioritize ideas based on key
criteria
90 Sherman Consulting Inc.Driving End-to-End Process Improvement
SM
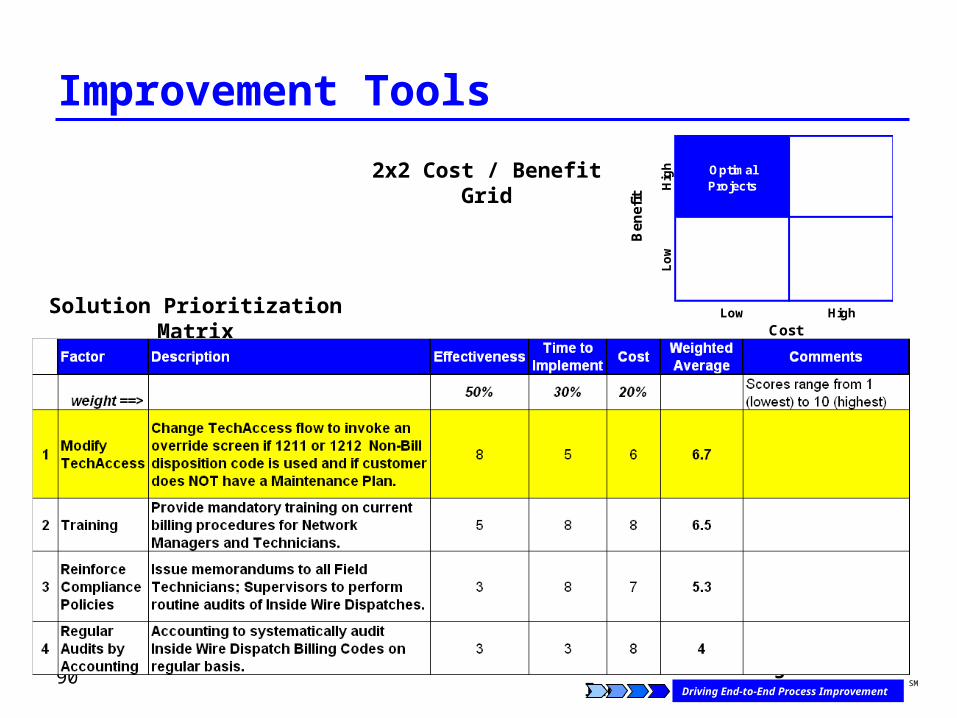
Hig
h Optimal Projects
Lo
w
Low High
Ben
efit
CostSolution Prioritization Matrix
2x2 Cost / Benefit Grid
Improvement Tools
91 Sherman Consulting Inc.Driving End-to-End Process Improvement
SM
Team Activities
1. Brainstorm ideas for improvement
2. Rank and evaluate σ Solution Prioritization Matrix (modify criteria /
adjust weights)
3. Select your improvement idea and present rationale
92 Sherman Consulting Inc.Driving End-to-End Process Improvement
SM
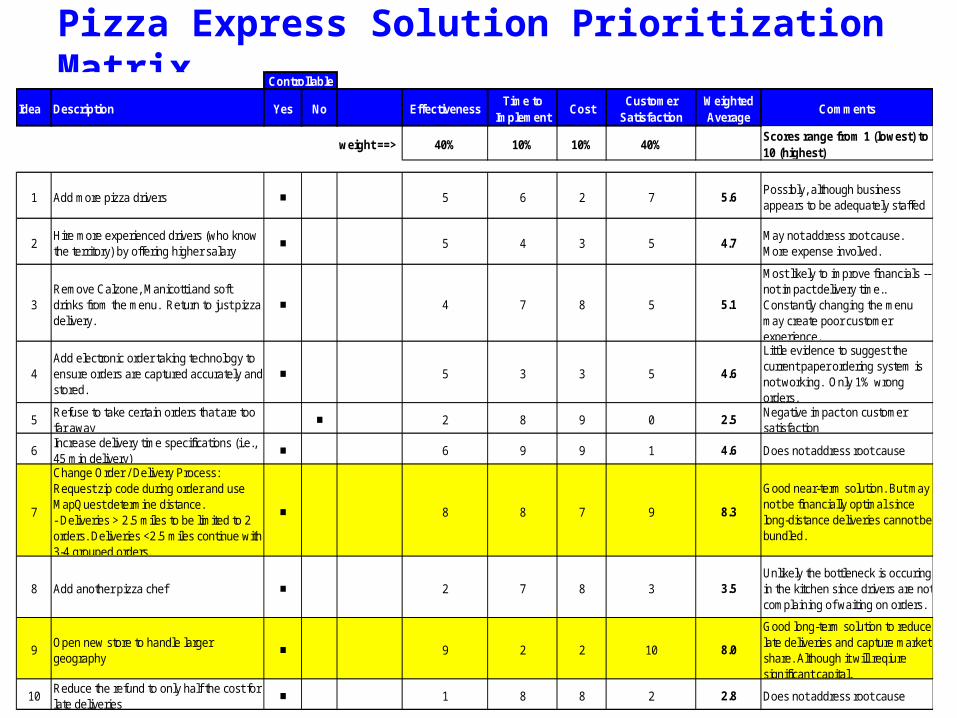
Pizza Express Solution Prioritization Matrix
Idea Description Yes No EffectivenessTime to
ImplementCost
Customer Satisfaction
Weighted Average
Comments
weight ==> 40% 10% 10% 40%Scores range from 1 (lowest) to 10 (highest)
1 Add more pizza drivers ■ 5 6 2 7 5.6Possibly, although business appears to be adequately staffed
2Hire more experienced drivers (who know the territory) by offering higher salary
■ 5 4 3 5 4.7May not address root cause. More expense involved.
3Remove Calzone, Manicotti and soft drinks from the menu. Return to just pizza delivery.
■ 4 7 8 5 5.1
Most likely to improve financials -- not impact delivery time.. Constantly changing the menu may create poor customer experience.
4Add electronic order taking technology to ensure orders are captured accurately and stored.
■ 5 3 3 5 4.6
Little evidence to suggest the current paper ordering system is not working. Only 1% wrong orders.
5Refuse to take certain orders that are too far away
■ 2 8 9 0 2.5Negative impact on customer satisfaction
6Increase delivery time specifications (i.e., 45 min delivery)
■ 6 9 9 1 4.6 Does not address root cause
7
Change Order / Delivery Process: - Request zip code during order and use MapQuest determine distance. - Deliveries > 2.5 miles to be limited to 2 orders. Deliveries <2.5 miles continue with 3-4 grouped orders.
■ 8 8 7 9 8.3
Good near-term solution. But may not be financially optimal since long-distance deliveries cannot be bundled.
8 Add another pizza chef ■ 2 7 8 3 3.5Unlikely the bottleneck is occuring in the kitchen since drivers are not complaining of waiting on orders.
9Open new store to handle larger geography
■ 9 2 2 10 8.0
Good long-term solution to reduce late deliveries and capture market share. Although it will reqiure significant capital.
10Reduce the refund to only half the cost for late deliveries
■ 1 8 8 2 2.8 Does not address root cause
Controllable
93 Sherman Consulting Inc.Driving End-to-End Process Improvement
SM
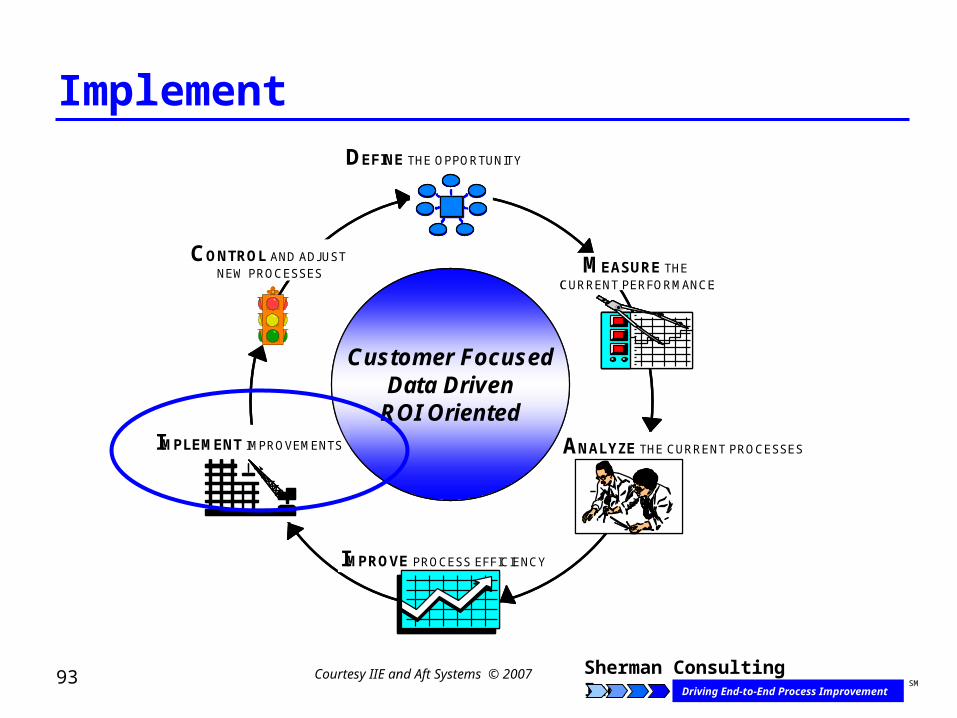
MEASURE THE CURRENT PERFORMANCE
DEFINE THE OPPORTUNITY
IMPROVE PROCESS EFFICIENCY
ANALYZE THE CURRENT PROCESSES
CONTROL AND ADJUST NEW PROCESSES
IMPLEMENT IMPROVEMENTS
Customer FocusedData Driven
ROI Oriented
MEASURE THE CURRENT PERFORMANCE
DEFINE THE OPPORTUNITY
IMPROVE PROCESS EFFICIENCY
ANALYZE THE CURRENT PROCESSES
CONTROL AND ADJUST NEW PROCESSES
IMPLEMENT IMPROVEMENTS
Customer FocusedData Driven
ROI Oriented
Courtesy IIE and Aft Systems © 2007
Implement
94 Sherman Consulting Inc.Driving End-to-End Process Improvement
SM
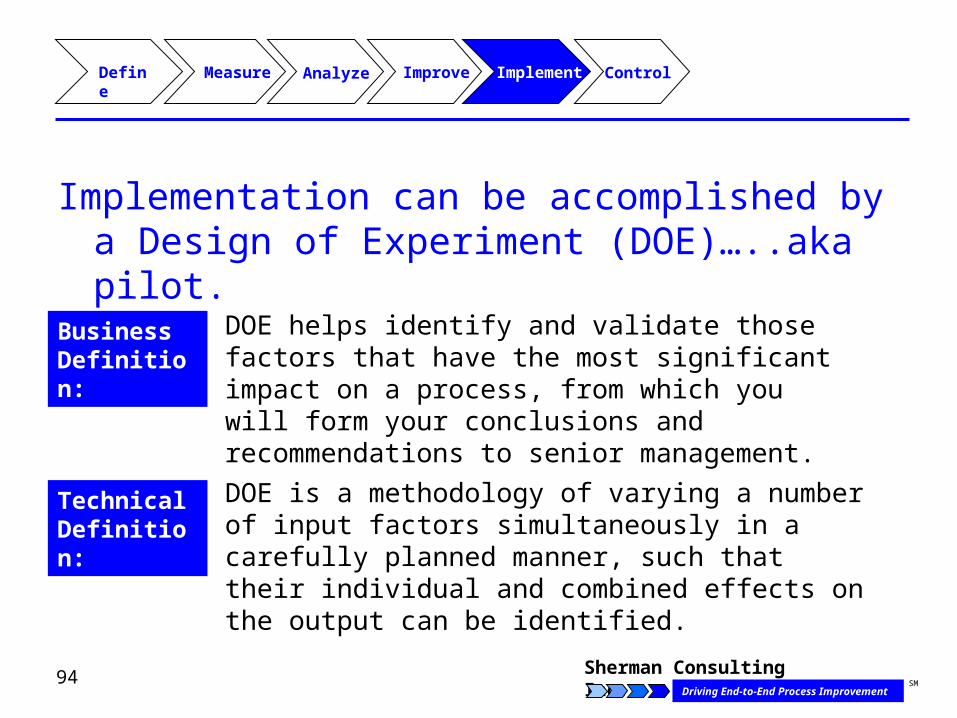
Implementation can be accomplished by a Design of Experiment (DOE)…..aka pilot.
Define Analyze Measure Improve Implement Control
DOE is a methodology of varying a number of input factors simultaneously in a carefully planned manner, such that their individual and combined effects on the output can be identified.
Technical Definition:
Business Definition:
DOE helps identify and validate those factors that have the most significant impact on a process, from which you will form your conclusions and recommendations to senior management.
95 Sherman Consulting Inc.Driving End-to-End Process Improvement
SM
DOE - Advantages
σ Allows you to identify the critical factor(s)
σ Allows many factors to be evaluated simultaneously
σ Economical and less disruptive to normal operations
σ Provides a fact-based approach to making conclusions in confidence
96 Sherman Consulting Inc.Driving End-to-End Process Improvement
SM
MEASURE THE CURRENT PERFORMANCE
DEFINE THE OPPORTUNITY
IMPROVE PROCESS EFFICIENCY
ANALYZE THE CURRENT PROCESSES
CONTROL AND ADJUST NEW PROCESSES
IMPLEMENT IMPROVEMENTS
Customer FocusedData Driven
ROI Oriented
MEASURE THE CURRENT PERFORMANCE
DEFINE THE OPPORTUNITY
IMPROVE PROCESS EFFICIENCY
ANALYZE THE CURRENT PROCESSES
CONTROL AND ADJUST NEW PROCESSES
IMPLEMENT IMPROVEMENTS
Customer FocusedData Driven
ROI Oriented
Courtesy IIE and Aft Systems © 2007
Control
97 Sherman Consulting Inc.Driving End-to-End Process Improvement
SM
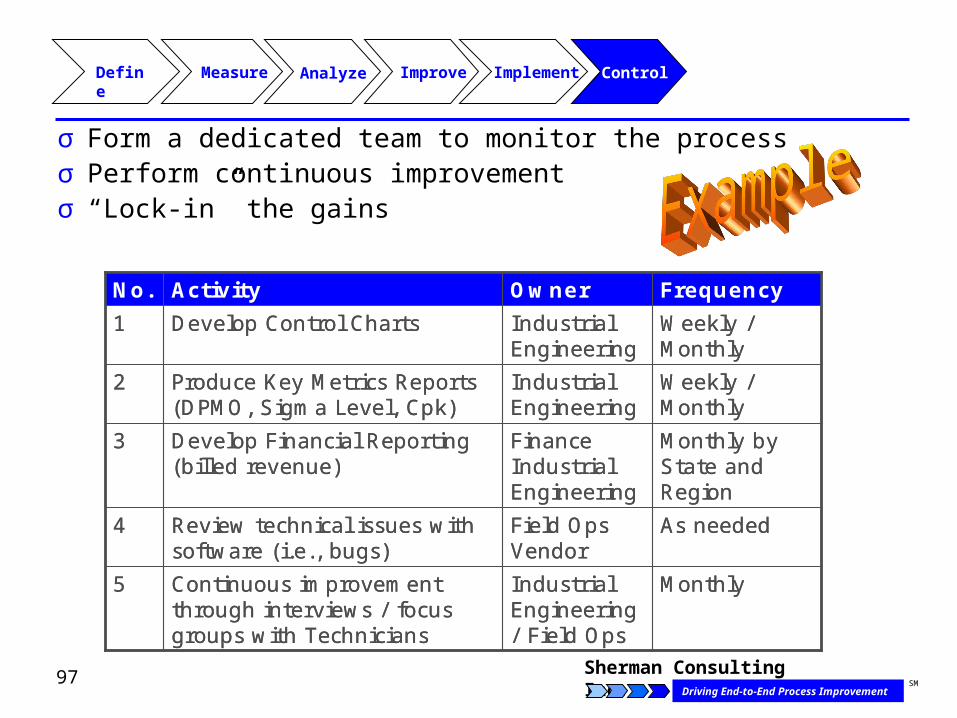
σ Form a dedicated team to monitor the processσ Perform continuous improvementσ “Lock-in” the gains
Define Analyze Measure Improve Implement Control
MonthlyIndustrial Engineering / Field Ops
Continuous improvement through interviews / focus groups with Technicians
5
As neededField Ops Vendor
Review technical issues with software (i.e., bugs)
4
Monthly by State and Region
Finance Industrial Engineering
Develop Financial Reporting (billed revenue)
3
Weekly / Monthly
Industrial Engineering
Produce Key Metrics Reports (DPMO, Sigma Level, Cpk)
2
Weekly / Monthly
Industrial Engineering
Develop Control Charts1
FrequencyOwnerActivityNo.
98 Sherman Consulting Inc.Driving End-to-End Process Improvement
SM
Team Activity
σ Develop a control plan for your project
99 Sherman Consulting Inc.Driving End-to-End Process Improvement
SM
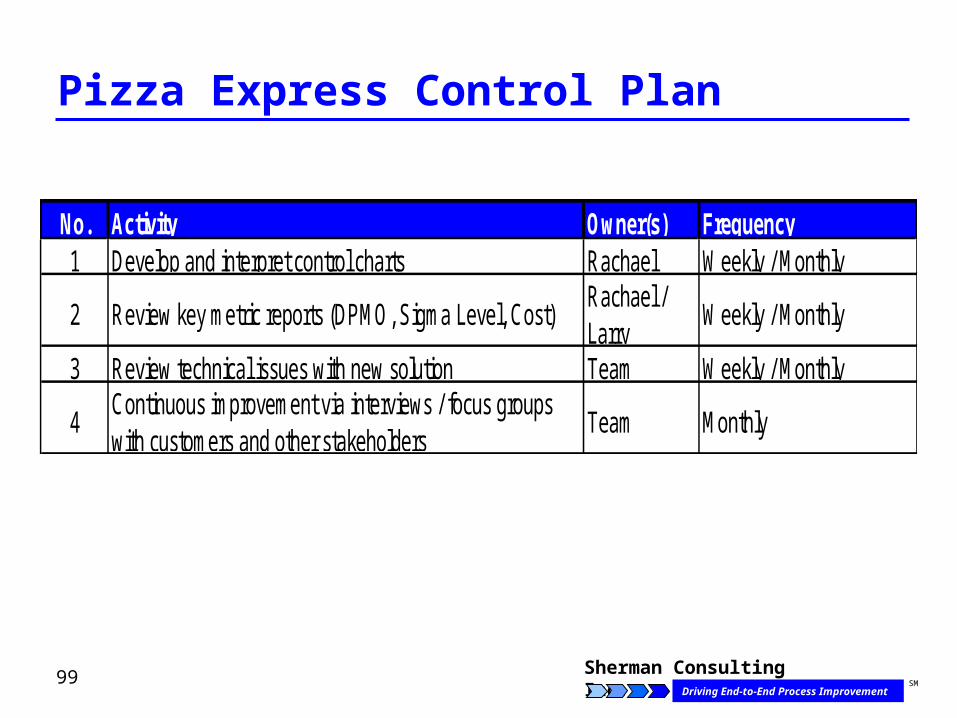
Pizza Express Control Plan
No. Activity Owner(s) Frequency1 Develop and interpret control charts Rachael Weekly / Monthly
2 Review key metric reports (DPMO, Sigma Level, Cost)Rachael / Larry
Weekly / Monthly
3 Review technical issues with new solution Team Weekly / Monthly
4Continuous improvement via interviews / focus groups with customers and other stakeholders
Team Monthly
100 Sherman Consulting Inc.Driving End-to-End Process Improvement
SM
Six Sigma Action Plan
101 Sherman Consulting Inc.Driving End-to-End Process Improvement
SM
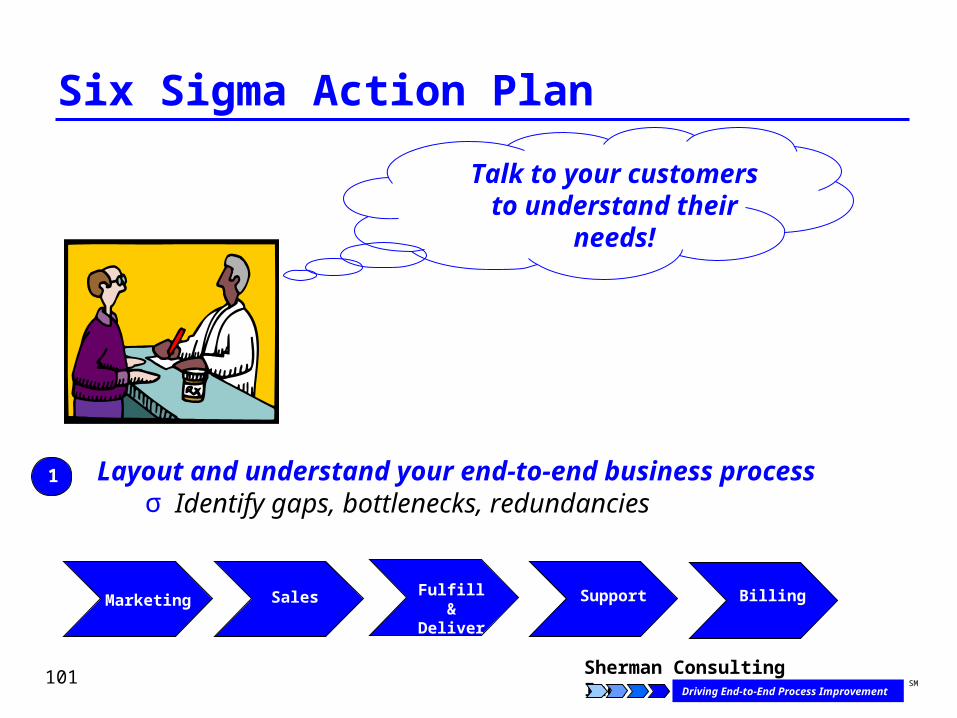
Six Sigma Action Plan
Layout and understand your end-to-end business processσ Identify gaps, bottlenecks, redundancies
MarketingFulfill & Deliver
Sales Support Billing
1
Talk to your customers to understand their
needs!
102 Sherman Consulting Inc.Driving End-to-End Process Improvement
SM
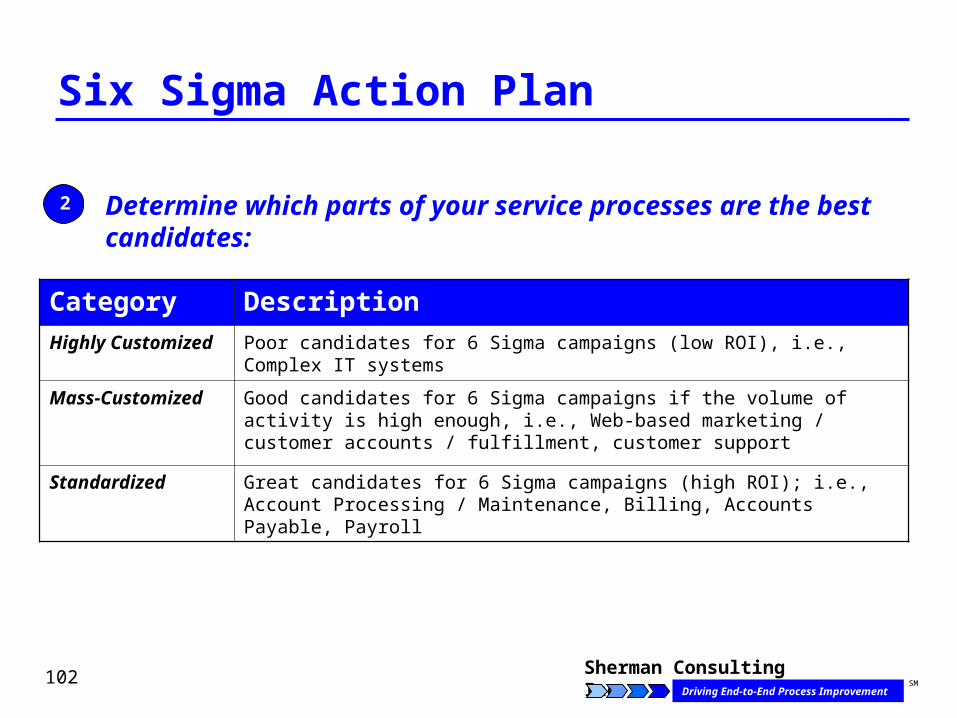
Six Sigma Action Plan
2
Category Description
Highly Customized Poor candidates for 6 Sigma campaigns (low ROI), i.e., Complex IT systems
Mass-Customized Good candidates for 6 Sigma campaigns if the volume of activity is high enough, i.e., Web-based marketing / customer accounts / fulfillment, customer support
Standardized Great candidates for 6 Sigma campaigns (high ROI); i.e., Account Processing / Maintenance, Billing, Accounts Payable, Payroll
Determine which parts of your service processes are the best candidates:
103 Sherman Consulting Inc.Driving End-to-End Process Improvement
SM
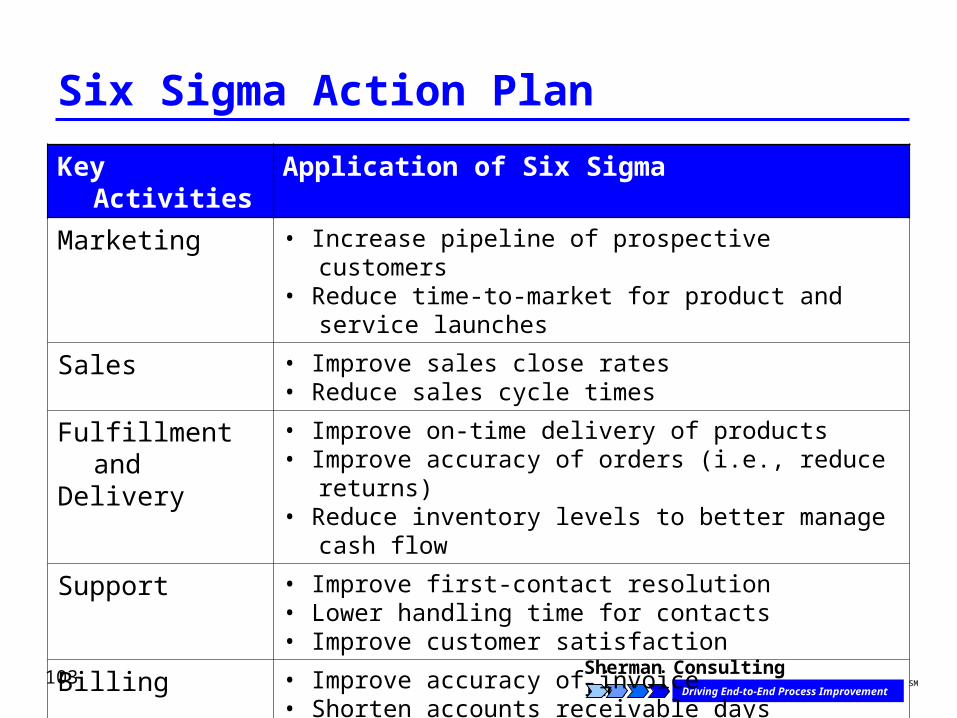
Six Sigma Action Plan
Key Activities Application of Six Sigma
Marketing • Increase pipeline of prospective customers • Reduce time-to-market for product and service launches
Sales • Improve sales close rates• Reduce sales cycle times
Fulfillment and Delivery
• Improve on-time delivery of products• Improve accuracy of orders (i.e., reduce returns)• Reduce inventory levels to better manage cash flow
Support • Improve first-contact resolution• Lower handling time for contacts• Improve customer satisfaction
Billing • Improve accuracy of invoice• Shorten accounts receivable days outstanding
104 Sherman Consulting Inc.Driving End-to-End Process Improvement
SM
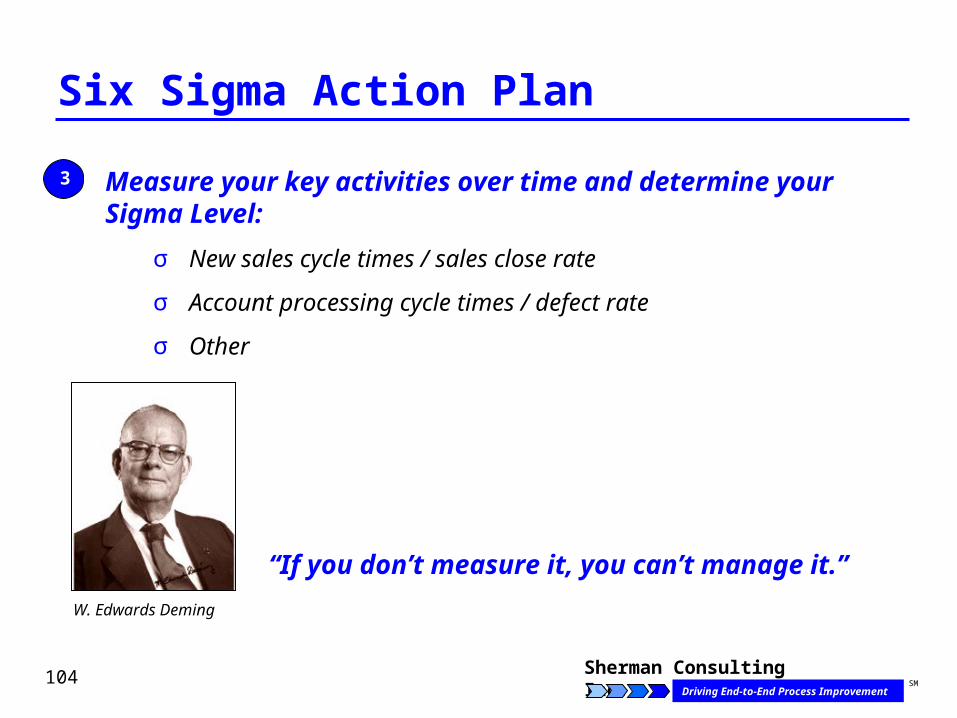
Six Sigma Action Plan
Measure your key activities over time and determine your Sigma Level:
σ New sales cycle times / sales close rate
σ Account processing cycle times / defect rate
σ Other
3
W. Edwards Deming
“If you don’t measure it, you can’t manage it.”
105 Sherman Consulting Inc.Driving End-to-End Process Improvement
SM
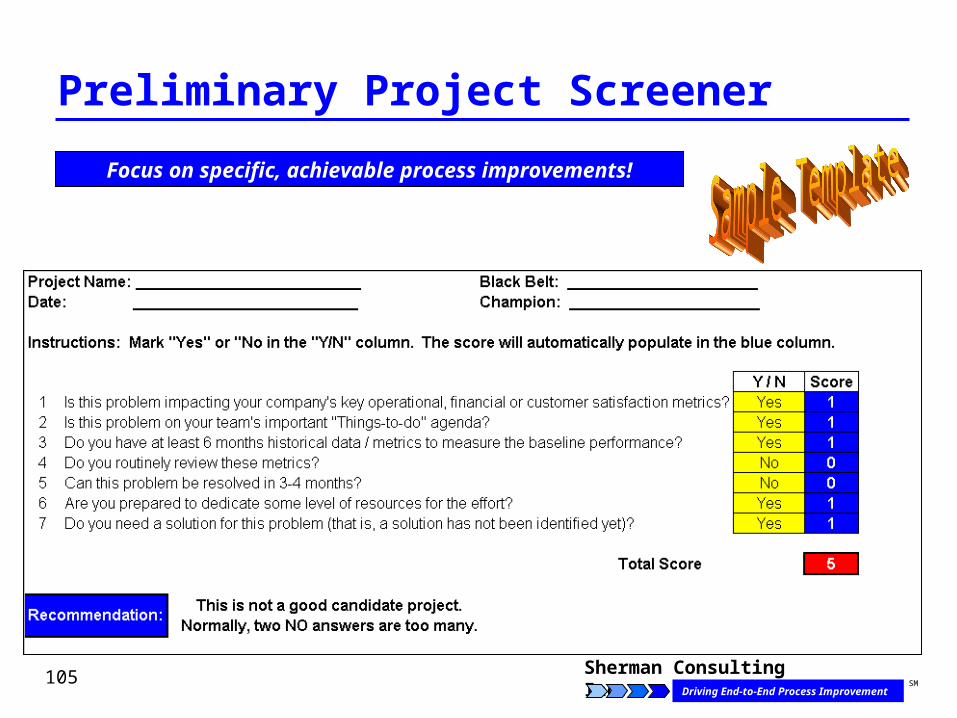
Preliminary Project Screener
Focus on specific, achievable process improvements!
106 Sherman Consulting Inc.Driving End-to-End Process Improvement
SM
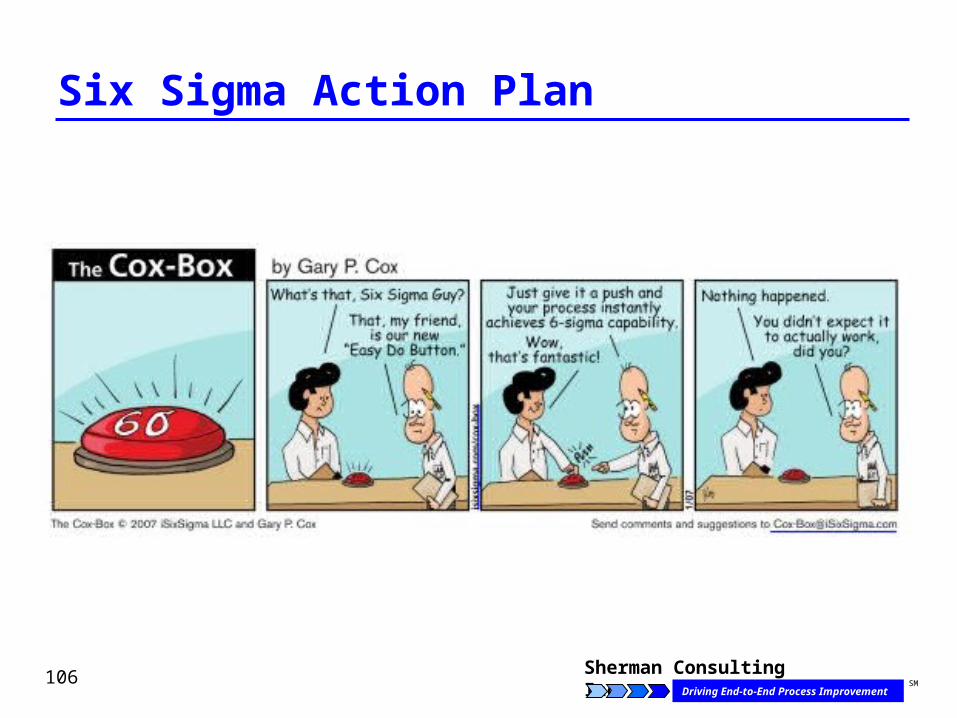
Six Sigma Action Plan
107 Sherman Consulting Inc.Driving End-to-End Process Improvement
SM
Wrap Up
σ Q & A
σ Tools: www.sherman6sigma.com
σ Resources (next page)
108 Sherman Consulting Inc.Driving End-to-End Process Improvement
SM
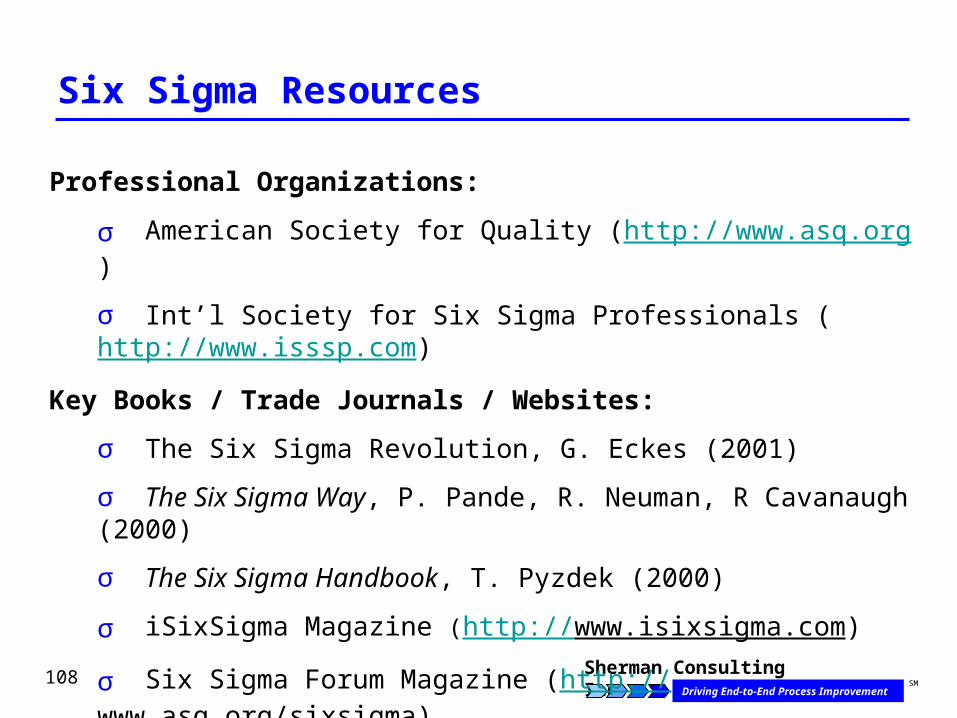
Six Sigma Resources
Professional Organizations:
σ American Society for Quality (http://www.asq.org)
σ Int’l Society for Six Sigma Professionals (http://www.isssp.com)
Key Books / Trade Journals / Websites:
σ The Six Sigma Revolution, G. Eckes (2001)
σ The Six Sigma Way, P. Pande, R. Neuman, R Cavanaugh (2000)
σ The Six Sigma Handbook, T. Pyzdek (2000)
σ iSixSigma Magazine (http://www.isixsigma.com)
σ Six Sigma Forum Magazine (http://www.asq.org/sixsigma)
σ General Electric (www.ge.com/sixsigma)
109 Sherman Consulting Inc.Driving End-to-End Process Improvement
SM