γλώσσες
Σελίδες
Νομικός

Supplemental data
Desmoglein 3-specific CD4+ T cells induce pemphigus vulgaris and
interface dermatitis in mice
Hayato Takahashi, Michiyoshi Kouno, Keisuke Nagao, Naoko Wada,
Tsuyoshi Hata, Shuhei Nishimoto, Yoichiro Iwakura, Akihiko Yoshimura,
Taketo Yamada, Masataka Kuwana, Hideki Fujii, Shigeo Koyasu,
and Masayuki Amagai
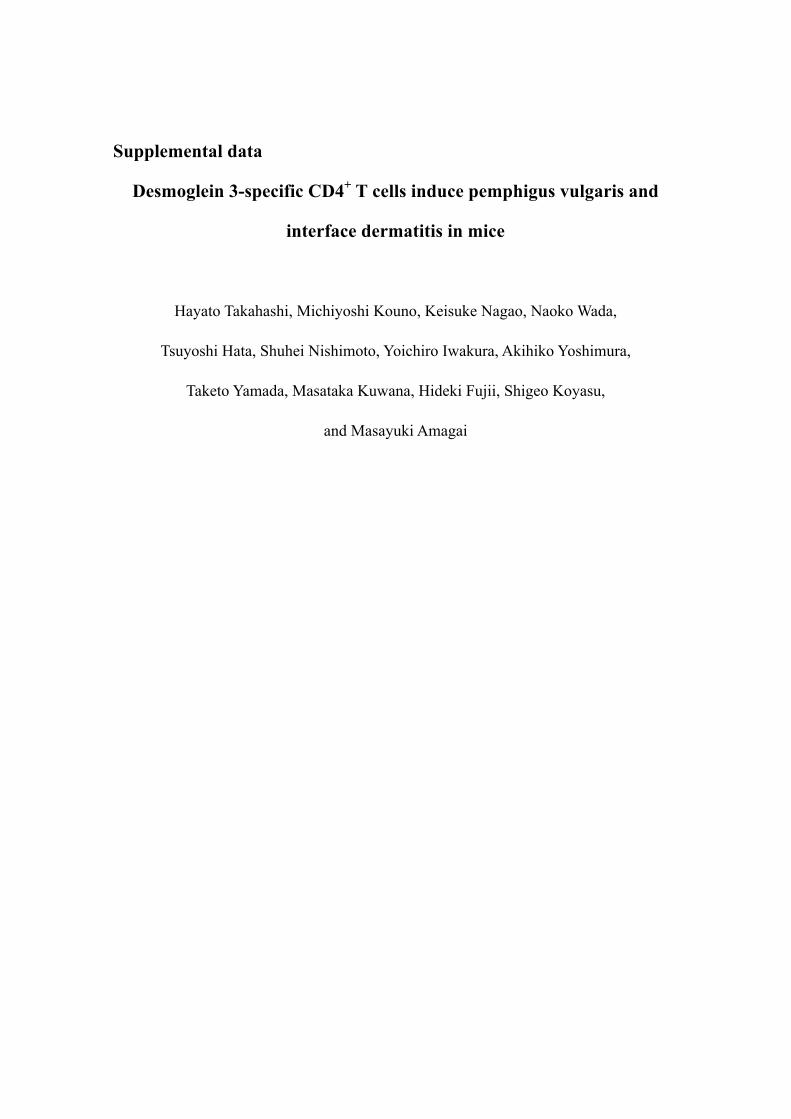
Supplemental Figure 1Dsg3H TCR α-chain from T cell clone, 140#27
XmaI
SacII
Leader
FR1
CDR1
FR2
CDR2
FR3
CDR3
AV8S13
J21 intron
J21 exon AV8S13
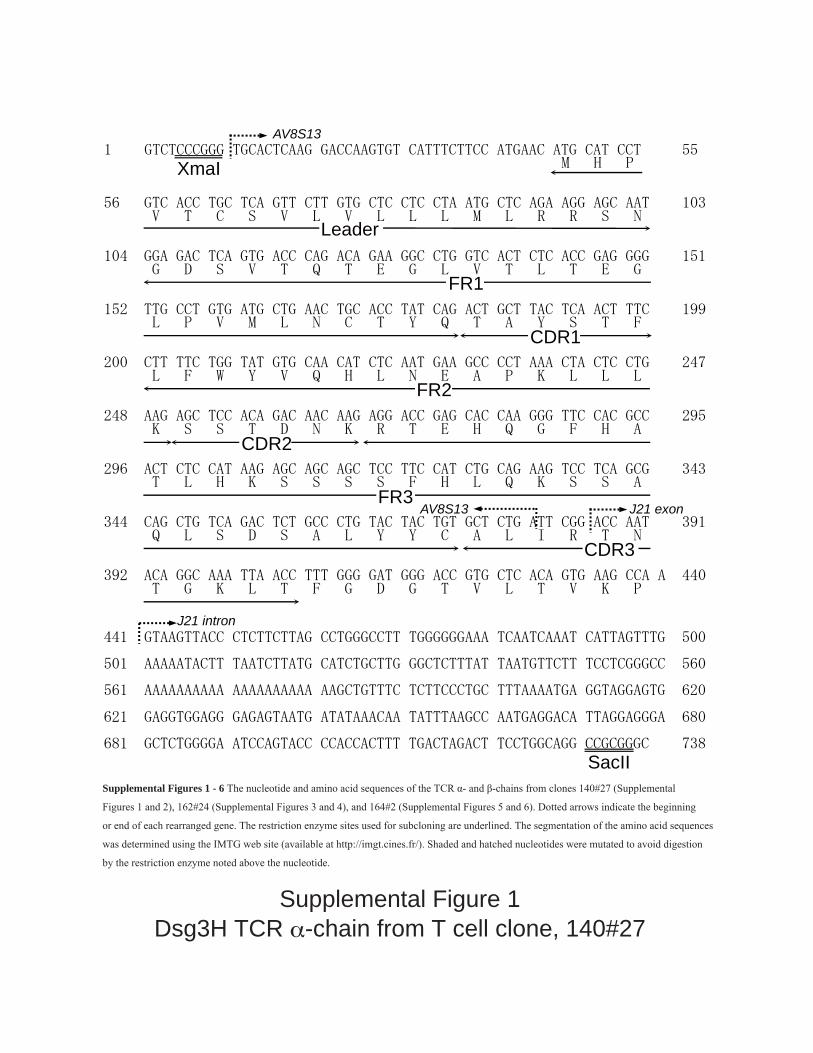
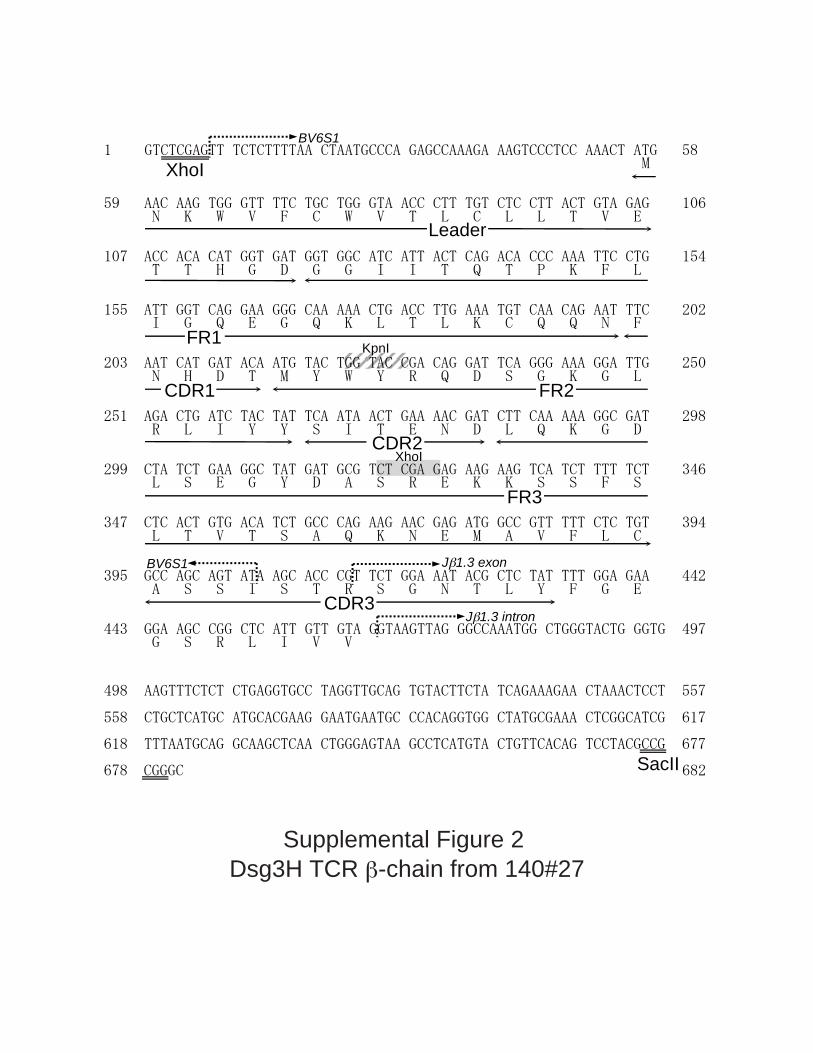
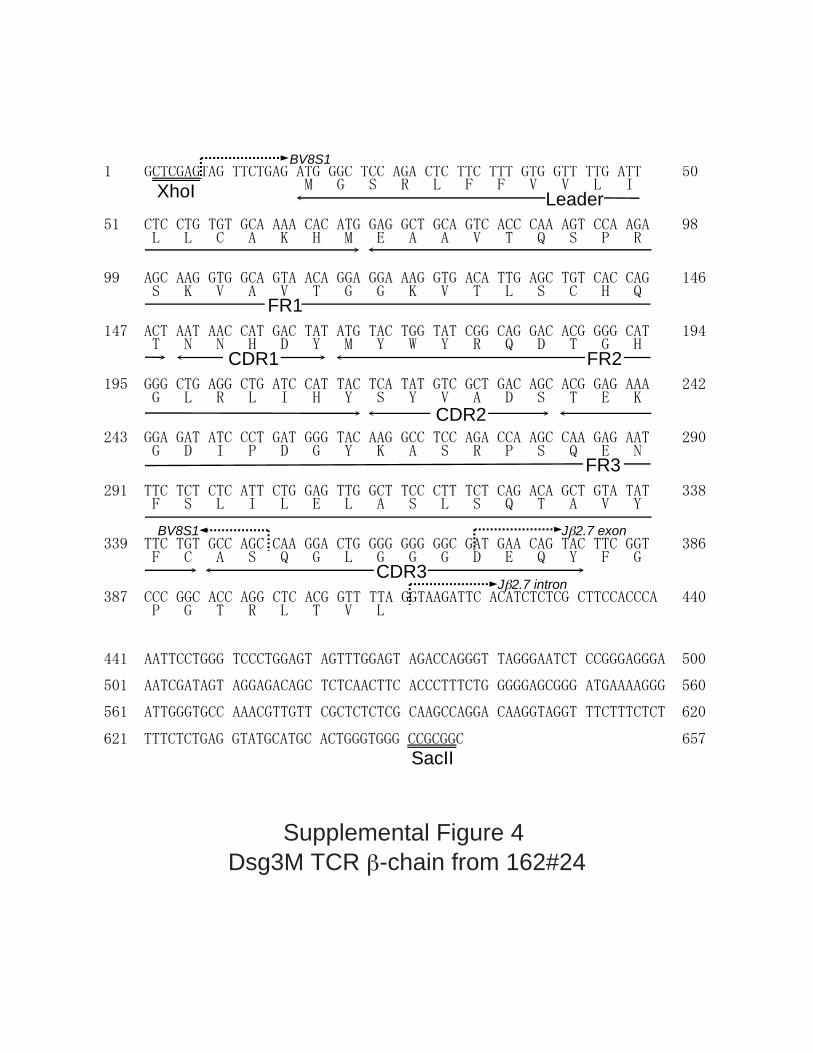
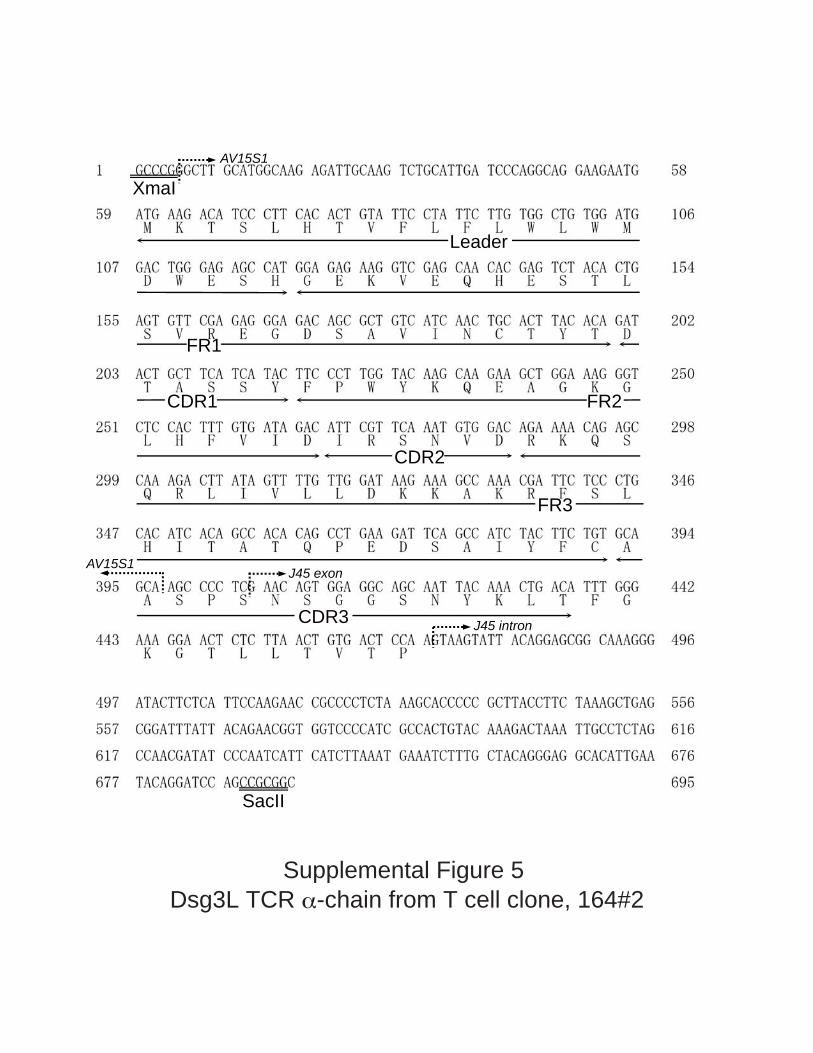
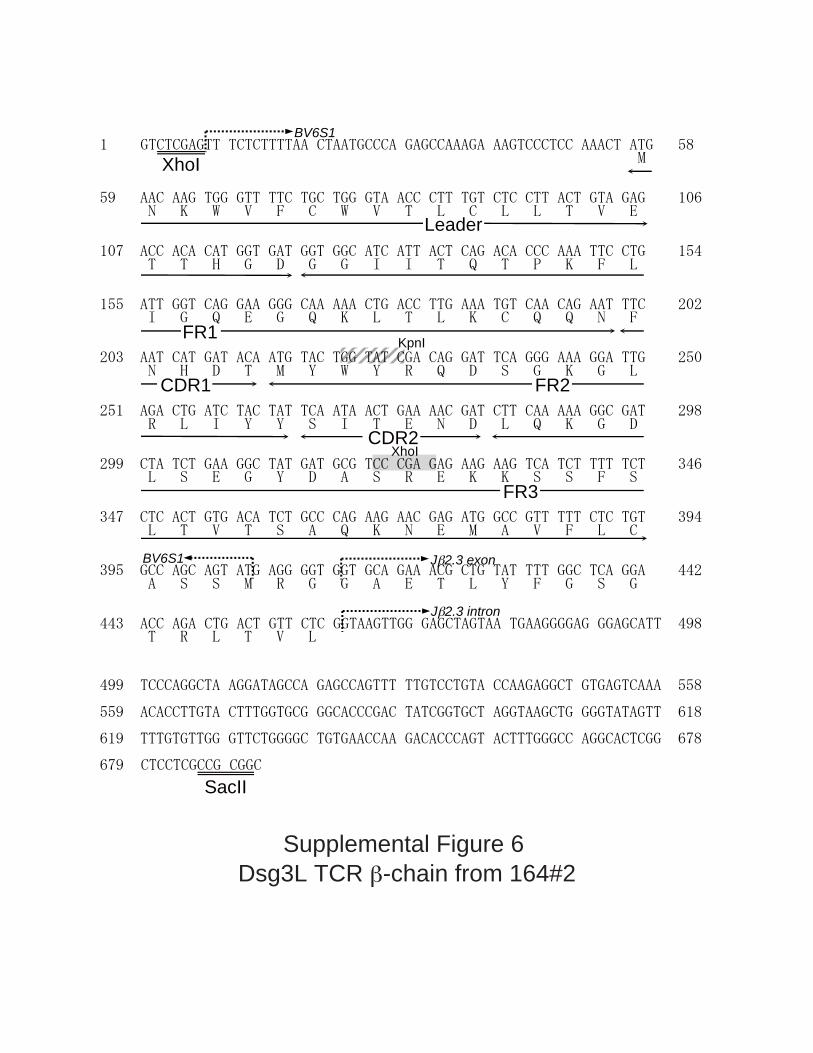
Supplemental Figures 1 - 6 The nucleotide and amino acid sequences of the TCR α- and β-chains from clones 140#27 (Supplemental
Figures 1 and 2), 162#24 (Supplemental Figures 3 and 4), and 164#2 (Supplemental Figures 5 and 6). Dotted arrows indicate the beginning
or end of each rearranged gene. The restriction enzyme sites used for subcloning are underlined. The segmentation of the amino acid sequences
was determined using the IMTG web site (available at http://imgt.cines.fr/). Shaded and hatched nucleotides were mutated to avoid digestion
by the restriction enzyme noted above the nucleotide.
Supplemental Figure 2 Dsg3H TCR β-chain from 140#27
XhoI
SacII
Leader
FR1
CDR1 FR2
FR3
CDR2
CDR3
J 1.3 exon BV6S1
J 1.3 intron
BV6S1
KpnI
XhoI
XmaI
Leader
FR1
AV20S1
CDR1 FR2
CDR2
FR3
CDR3
SacII
J39 exon
J39 intron
Supplemental Figure 3 Dsg3M TCR α-chain from T cell clone, 162#24
XhoI
BV8S1
Leader
FR1
CDR1 FR2
CDR2
FR3
CDR3
BV8S1 J 2.7 exon
J 2.7 intron
SacII
Supplemental Figure 4 Dsg3M TCR β-chain from 162#24
XmaI
AV15S1
Leader
FR1
CDR1 FR2
CDR2
FR3
CDR3
AV15S1 J45 exon
J45 intron
SacII
Supplemental Figure 5 Dsg3L TCR α-chain from T cell clone, 164#2
J 2.3 exon
XhoI
BV6S1
Leader
FR1
CDR1 FR2
FR3
CDR2
KpnI
XhoI
BV6S1
J 2.3 intron
SacII
Supplemental Figure 6 Dsg3L TCR β-chain from 164#2
0 103 104 105
0
103
104
105
44.4 14.7
2.9922.6
DN2
DN3DN40 103 104 105
Vb6
0
1
2
3
# Ce
lls
0.6
0 103 104 105Vb6
0
5
10
15
# Ce
lls
0.32
0 103 104 105Vb6
0
20
40
60
# Ce
lls
54.5
Line A(Dsg3H1)
Line B
Line C
DN2 DN3 DN4CD4-CD8-
0 103 104 105
0
103
104
105
88.5 0.98
0.534.01
DN2
DN3DN40 103 104 105
0
2
4
6
8
# Ce
lls
92.4
0 103 104 105Vb6
0
5
10
15
20
# Ce
lls
100
0 103 104 105Vb6
0
500
1000
1500
2000
# Ce
lls
99.5
0 103 104 105
0
103
104
105
61.2 0.28
0.3725
0 103 104 1050
0.5
1
1.5
2
# Ce
lls
0.54
0 103 104 1050
0.5
1
1.5
2
# Ce
lls
0
0 103 104 1050
100
200
300
400
# Ce
lls
0.15DN2
DN3DN4
CD25
CD
44
Vβ6
Supplemental Figure 7
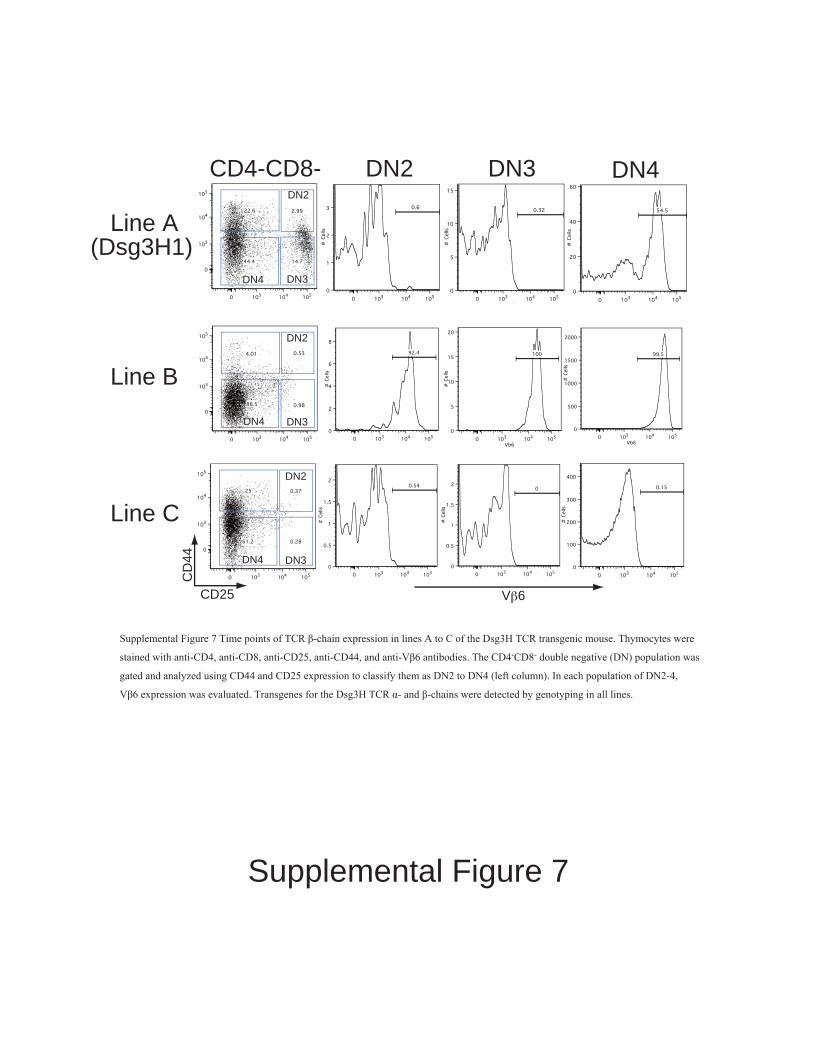
Supplemental Figure 7 Time points of TCR β-chain expression in lines A to C of the Dsg3H TCR transgenic mouse. Thymocytes were
stained with anti-CD4, anti-CD8, anti-CD25, anti-CD44, and anti-Vβ6 antibodies. The CD4-CD8- double negative (DN) population was
gated and analyzed using CD44 and CD25 expression to classify them as DN2 to DN4 (left column). In each population of DN2-4,
Vβ6 expression was evaluated. Transgenes for the Dsg3H TCR α- and β-chains were detected by genotyping in all lines.
Non-transgenic CD4+ T cell
Transgenic CD4+ T cellBone marrow
Adoptive transferDsg3-/- B cell
Supplemental Figure 8
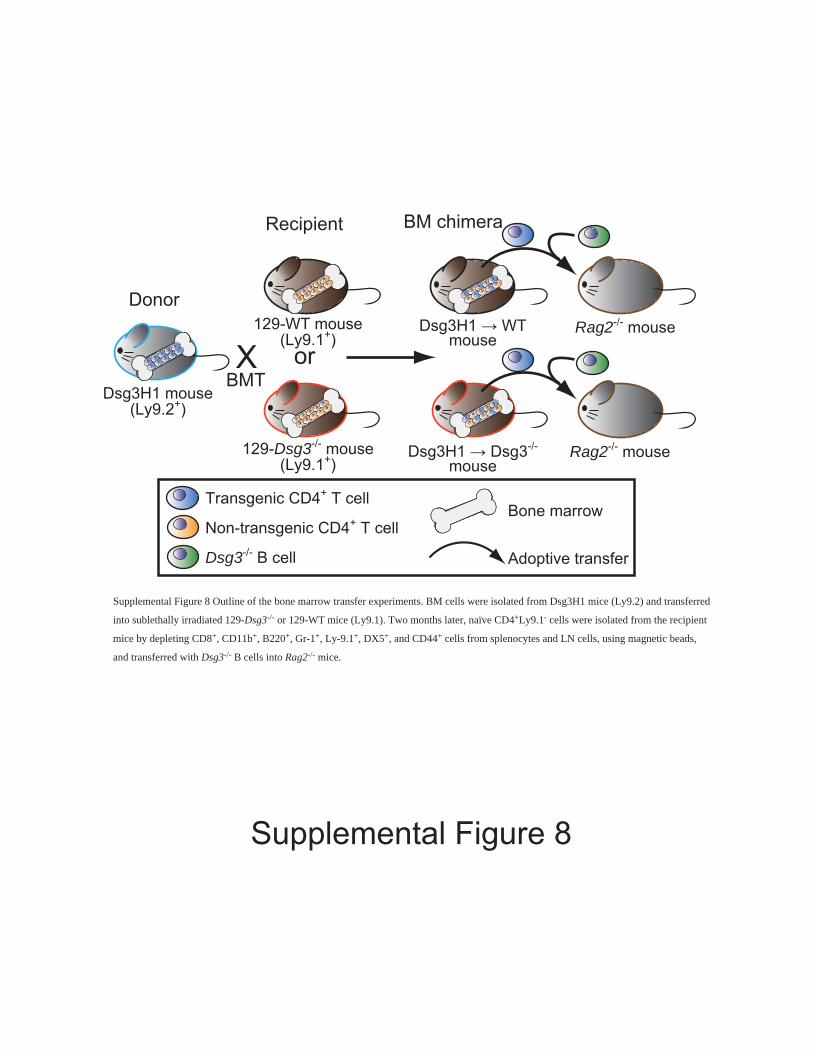
Supplemental Figure 8 Outline of the bone marrow transfer experiments. BM cells were isolated from Dsg3H1 mice (Ly9.2) and transferred
into sublethally irradiated 129-Dsg3-/- or 129-WT mice (Ly9.1). Two months later, naïve CD4+Ly9.1- cells were isolated from the recipient
mice by depleting CD8+, CD11b+, B220+, Gr-1+, Ly-9.1+, DX5+, and CD44+ cells from splenocytes and LN cells, using magnetic beads,
and transferred with Dsg3-/- B cells into Rag2-/- mice.
or Dsg3H1 mouse
(Ly9.2+)
129-WT mouse(Ly9.1+)
129-Dsg3-/- mouse(Ly9.1+)
X BMT
BM chimera
Dsg3H1 → Dsg3-/-
mouse
Dsg3H1 → WTmouse
Rag2-/- mouse
Rag2-/- mouse
Recipient
Donor
0 103 104 1050
20
40
60
# Ce
lls
0.9
A
0 103 104 1050
5
10
15
# Ce
lls
30
0 103 104 1050
5
10
15
# Ce
lls
0Isolated CD44- cellsB
CD44 (gated in CD4+Vβ6+Ly9.1-7-AAD- population)
Dsg3H1 → Dsg3-/- Dsg3H1 → WTBMT
0 103 104 1050
5
10
15
# Ce
lls
17
0 103 104 1050
10
20
30
40
# Ce
lls
96
Supplemental Figure 9
Vβ6
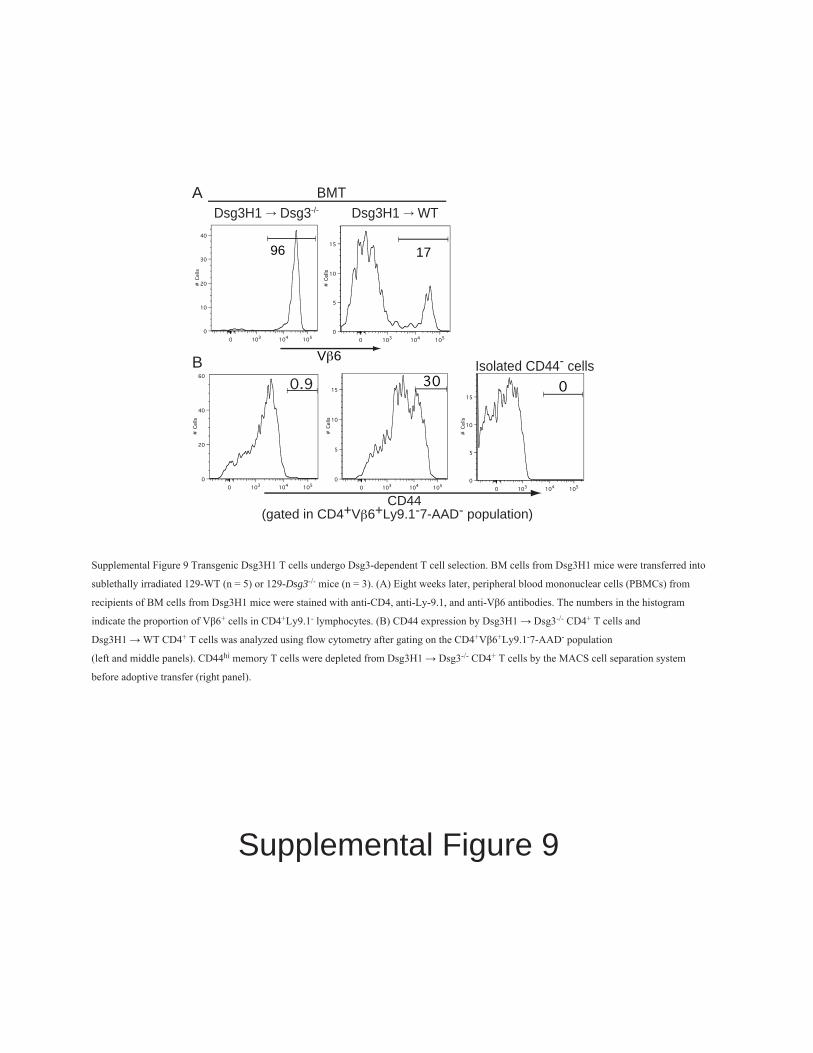
Supplemental Figure 9 Transgenic Dsg3H1 T cells undergo Dsg3-dependent T cell selection. BM cells from Dsg3H1 mice were transferred into
sublethally irradiated 129-WT (n = 5) or 129-Dsg3-/- mice (n = 3). (A) Eight weeks later, peripheral blood mononuclear cells (PBMCs) from
recipients of BM cells from Dsg3H1 mice were stained with anti-CD4, anti-Ly-9.1, and anti-Vβ6 antibodies. The numbers in the histogram
indicate the proportion of Vβ6+ cells in CD4+Ly9.1- lymphocytes. (B) CD44 expression by Dsg3H1 → Dsg3-/- CD4+ T cells and
Dsg3H1 → WT CD4+ T cells was analyzed using flow cytometry after gating on the CD4+Vβ6+Ly9.1-7-AAD- population
(left and middle panels). CD44hi memory T cells were depleted from Dsg3H1 → Dsg3-/- CD4+ T cells by the MACS cell separation system
before adoptive transfer (right panel).
Supplemental Figure 10
A B
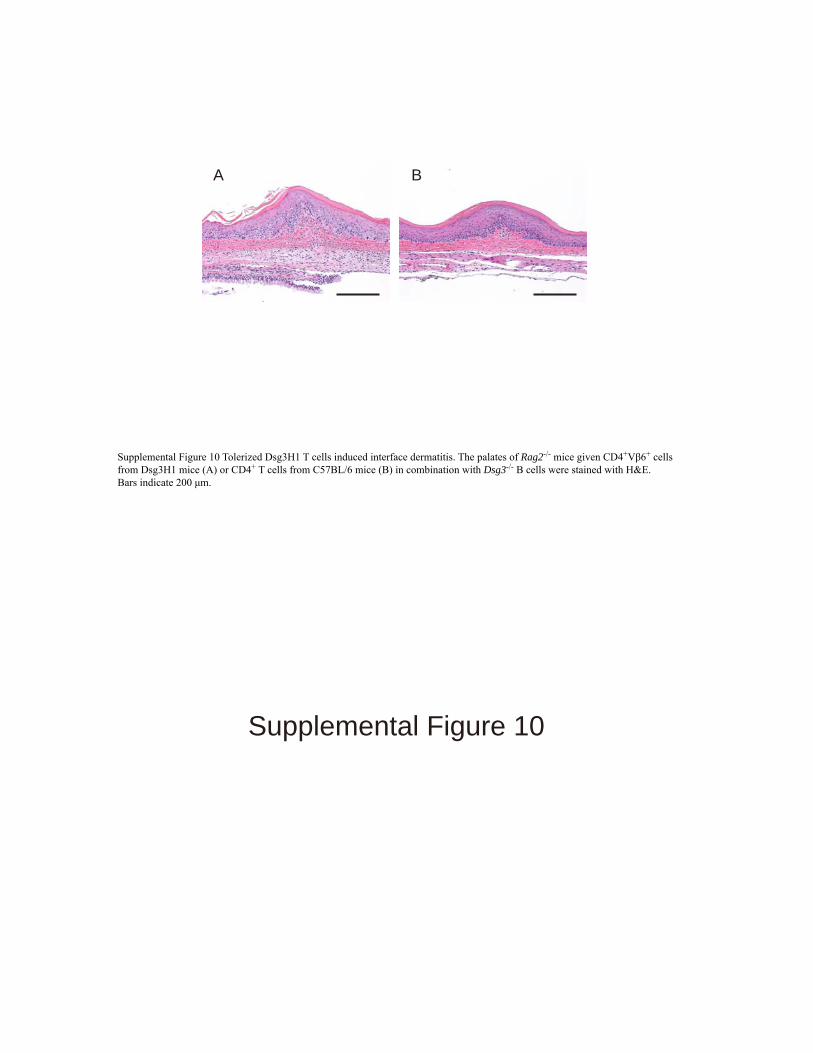
Supplemental Figure 10 Tolerized Dsg3H1 T cells induced interface dermatitis. The palates of Rag2-/- mice given CD4+Vβ6+ cells from Dsg3H1 mice (A) or CD4+ T cells from C57BL/6 mice (B) in combination with Dsg3-/- B cells were stained with H&E. Bars indicate 200 μm.
Supplemental Figure11
Dsg3(1
-15)
Dsg3(3
01-31
5)
IL-2
pro
duct
ion
(pg/
ml)
(1-15
)31
5)
IL2
prod
uctio
n (p
g/m
l)
0
100
200
300
400 rvDsg3H
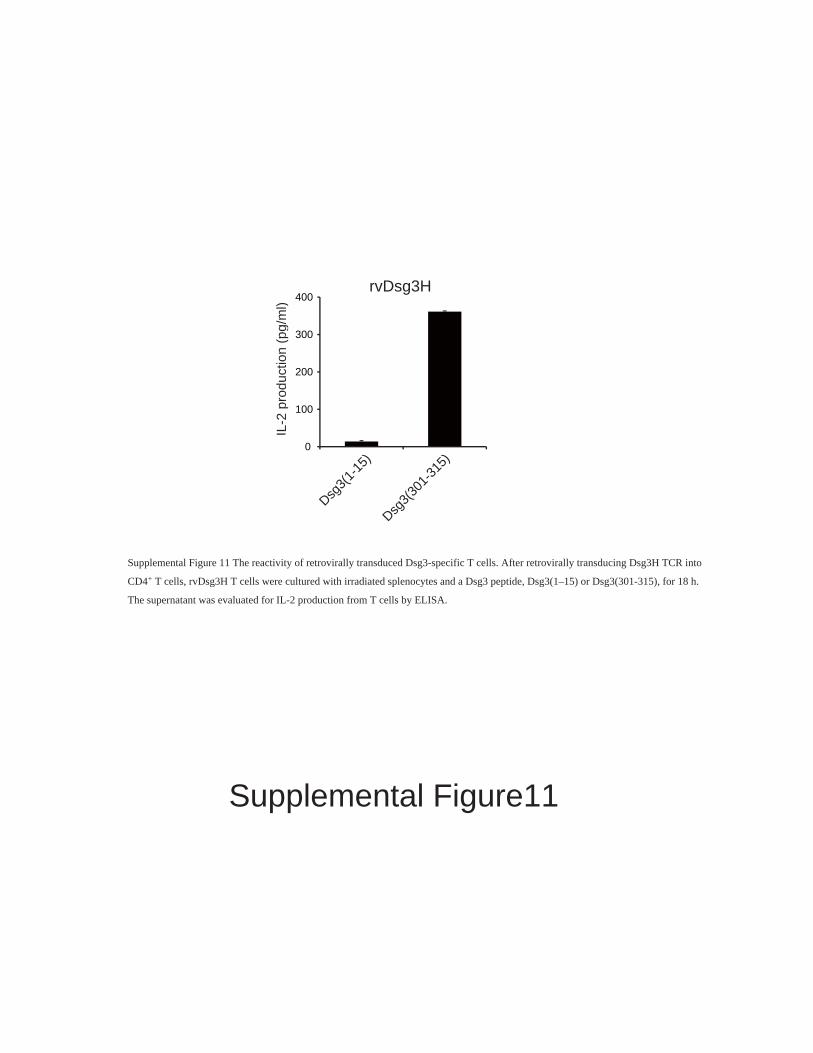
Supplemental Figure 11 The reactivity of retrovirally transduced Dsg3-specific T cells. After retrovirally transducing Dsg3H TCR into
CD4+ T cells, rvDsg3H T cells were cultured with irradiated splenocytes and a Dsg3 peptide, Dsg3(1–15) or Dsg3(301-315), for 18 h.
The supernatant was evaluated for IL-2 production from T cells by ELISA.
rvDsg3H rvDsg3M rvDsg3L rvGFP
Liver
Largeintestine
Smallintestine
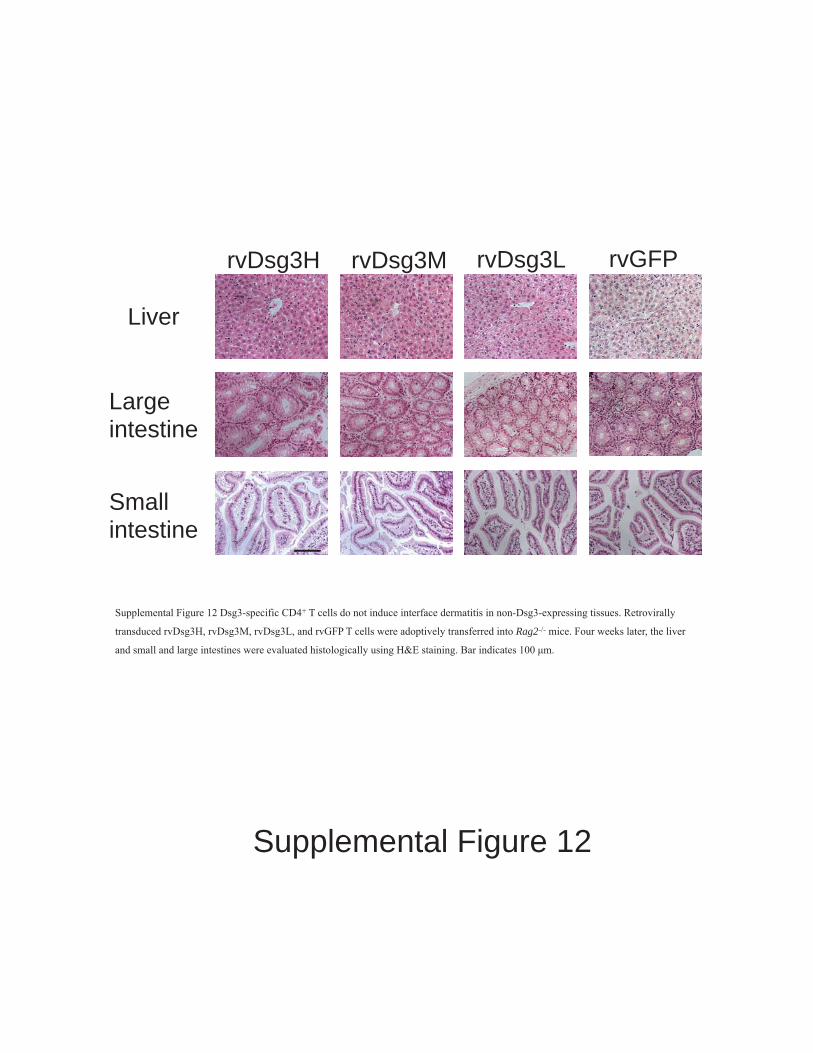
Supplemental Figure 12 Dsg3-specific CD4+ T cells do not induce interface dermatitis in non-Dsg3-expressing tissues. Retrovirally
transduced rvDsg3H, rvDsg3M, rvDsg3L, and rvGFP T cells were adoptively transferred into Rag2-/- mice. Four weeks later, the liver
and small and large intestines were evaluated histologically using H&E staining. Bar indicates 100 μm.
Supplemental Figure 12
Supplemental Figure 13
Anti-
Dsg
3 Ig
G ti
ter
(inde
x)
days after transfer0
40
80
7 14 21 28
120
160
rvGFP T cells + B cellsDsg3-/- T cells + B cells
rvDsg3H T cells + B cells
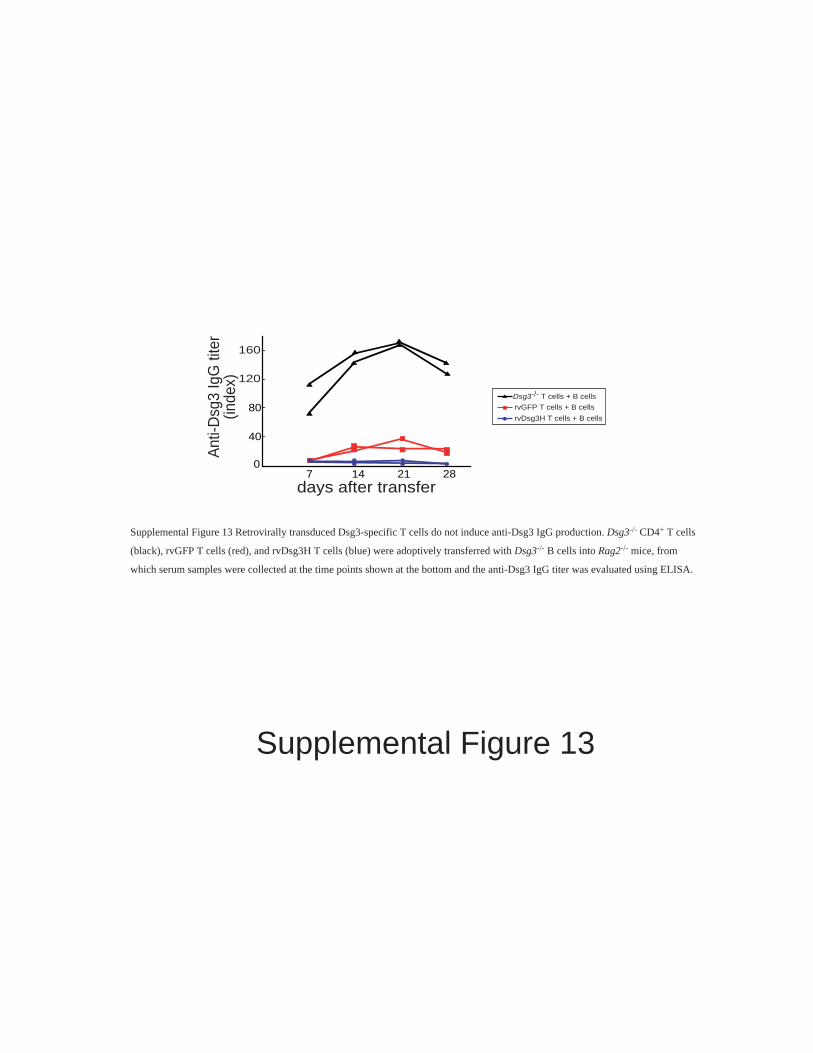
Supplemental Figure 13 Retrovirally transduced Dsg3-specific T cells do not induce anti-Dsg3 IgG production. Dsg3-/- CD4+ T cells
(black), rvGFP T cells (red), and rvDsg3H T cells (blue) were adoptively transferred with Dsg3-/- B cells into Rag2-/- mice, from
which serum samples were collected at the time points shown at the bottom and the anti-Dsg3 IgG titer was evaluated using ELISA.
Supplemental Figure 14
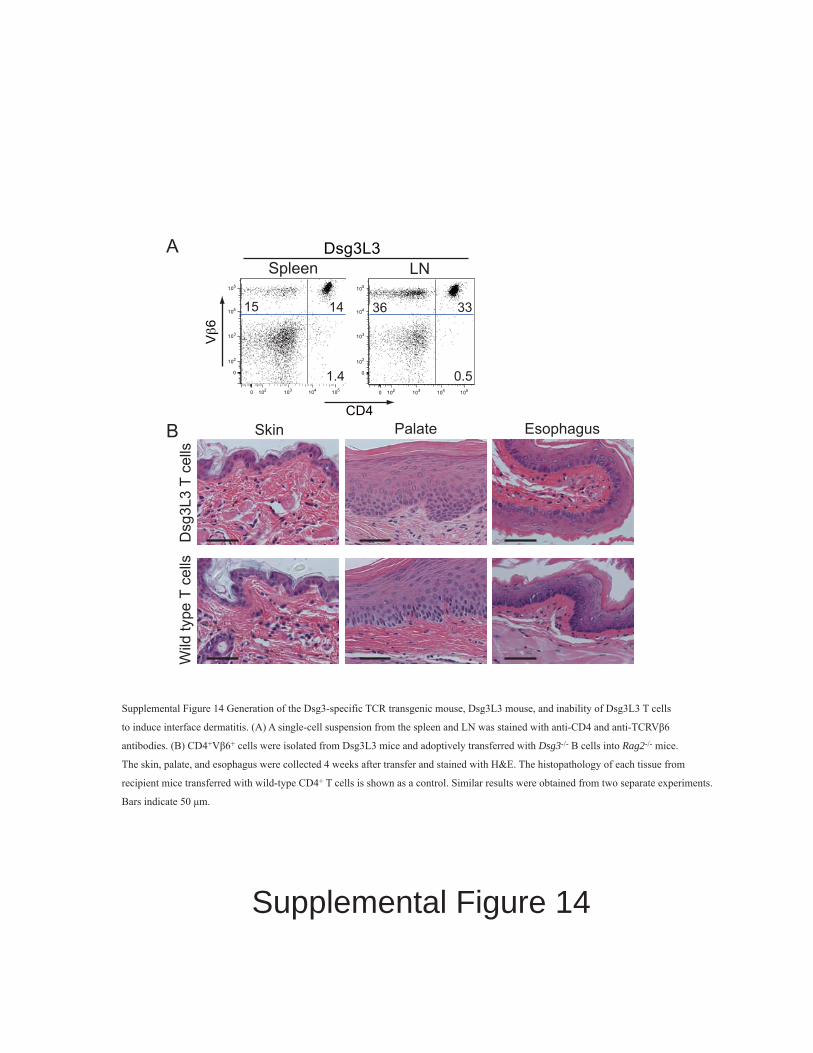
Supplemental Figure 14 Generation of the Dsg3-specific TCR transgenic mouse, Dsg3L3 mouse, and inability of Dsg3L3 T cells
to induce interface dermatitis. (A) A single-cell suspension from the spleen and LN was stained with anti-CD4 and anti-TCRVβ6
antibodies. (B) CD4+Vβ6+ cells were isolated from Dsg3L3 mice and adoptively transferred with Dsg3-/- B cells into Rag2-/- mice.
The skin, palate, and esophagus were collected 4 weeks after transfer and stained with H&E. The histopathology of each tissue from
recipient mice transferred with wild-type CD4+ T cells is shown as a control. Similar results were obtained from two separate experiments.
Bars indicate 50 μm.
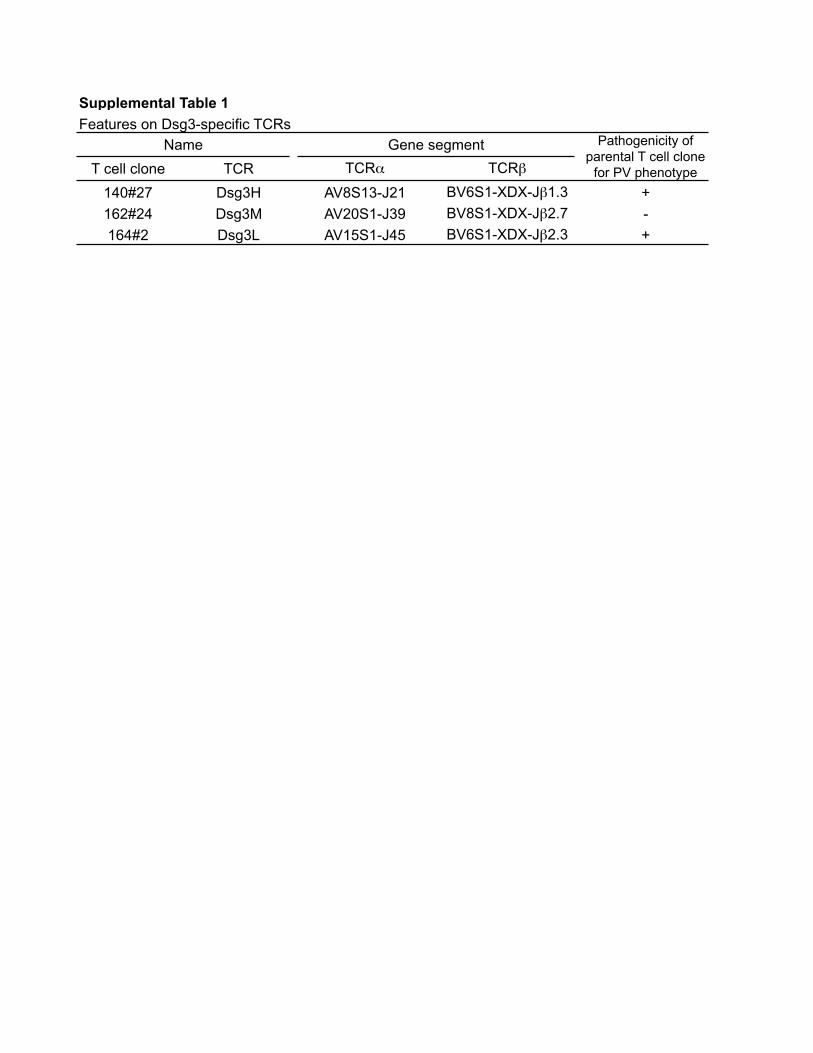
T cell clone TCR TCRα TCRβ
140#27 Dsg3H AV8S13-J21 BV6S1-XDX-Jβ1.3 +162#24 Dsg3M AV20S1-J39 BV8S1-XDX-Jβ2.7 -164#2 Dsg3L AV15S1-J45 BV6S1-XDX-Jβ2.3 +
Gene segmentName Pathogenicity ofparental T cell clone
for PV phenotype
Features on Dsg3-specific TCRs Supplemental Table 1
Top Related