SUPPLEMENTARY INFORMATION Supplemental Figure Legend · 2011-09-12 · SUPPLEMENTARY INFORMATION...
14
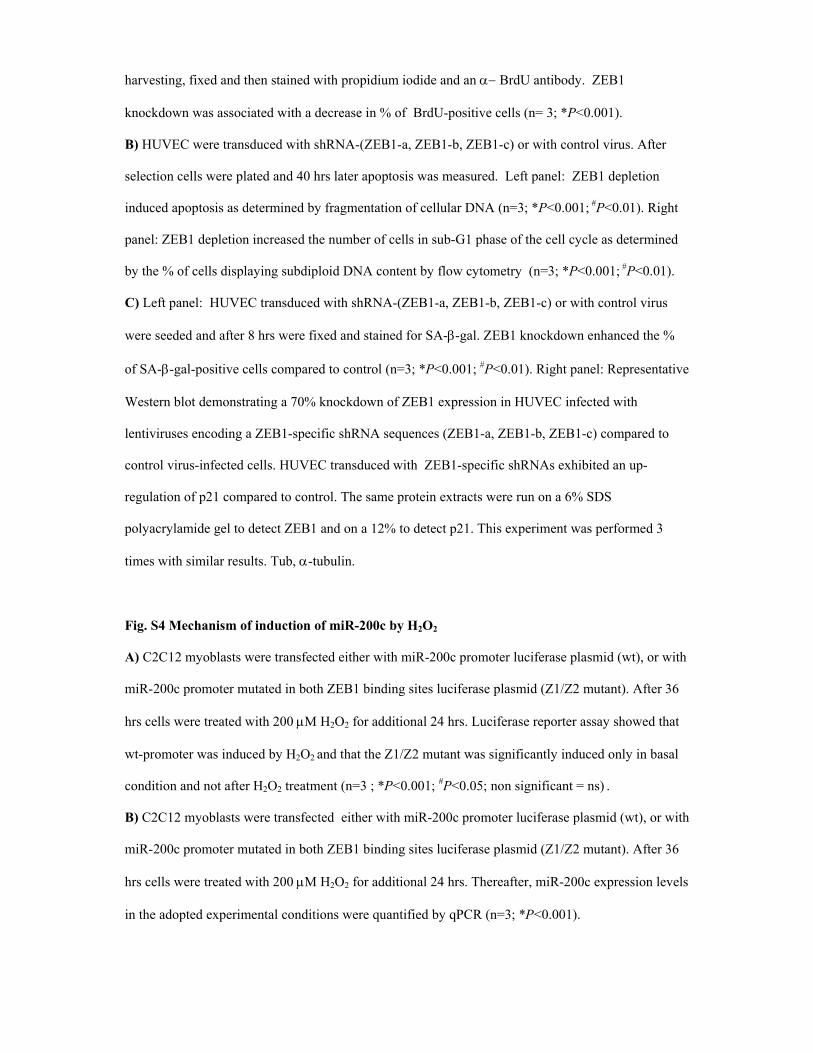
SUPPLEMENTARY INFORMATION Supplemental Figure Legend Fig. S1 miR-200c expression is induced by oxidative stress in human fibroblasts Two independent preparations of normal foreskin fibroblasts were treated with 25 μM and 200 μM H 2 O 2 for 1 hr and 16 hrs. There was no significant effect of upon 25 μM H 2 O 2 on miR-200c, in contrast 200 μM H 2 O 2 enhanced miR-200c both 1hr and16 hrs after treatment (n=3; *P <0.001; # P<0.01). Fig. S2 Oxidative stress down-modulates ZEB1 A) HUVEC were either preincubated with 10 mM NAC or sham-treated for 30 min prior to exposure to 0.25 mM BCNU for 2 hrs. Expression levels of ZEB1 protein were evaluated by densitometric analysis and normalized by α-tubulin protein levels (n=3 ; *P<0.001; # P<0.05). B) HUVEC were treated with 200 μΜ H 2 O 2 for 2–24 hr and ZEB2 mRNA was quantified by qPCR. ZEB2 expression exhibited a statistically significant decrease from control only at the 2 hr time point (n=4 at each time point; *P <0.001). C) HUVEC were infected with a lentiviral vector encoding either miR-200c or miR-scramble. After 24 hrs cells were selected with puromycin and ZEB2 mRNAs was quantified by qPCR; miR-200c over-expression had no significant effect on ZEB2 mRNA (n=3; *P <0.001). Fig. S3 Functional effects of ZEB1 knockdown in EC A) Left panel: HUVEC were infected either with 3 different lentiviruses carrying ZEB1-specific shRNA (ZEB1-a, ZEB1-b, ZEB1-c) or with the control virus. After 24 hrs cells were selected with puromycin and plated. ZEB1 knockdown inhibited cell proliferation compared to control (n=3; *P <0.001; # P<0.05). Right panel: HUVEC were transduced with shRNA-ZEB1 or with control virus. After selection cells were plated and 40 hrs later were pulse labelled with BrdU for 30 minutes before
Transcript of SUPPLEMENTARY INFORMATION Supplemental Figure Legend · 2011-09-12 · SUPPLEMENTARY INFORMATION...
SUPPLEMENTARY INFORMATION
Supplemental Figure Legend
Fig. S1 miR-200c expression is induced by oxidative stress in human fibroblasts
Two independent preparations of normal foreskin fibroblasts were treated with 25 μM and 200 μM
H2O2 for 1 hr and 16 hrs. There was no significant effect of upon 25 μM H2O2 on miR-200c, in
contrast 200 μM H2O2 enhanced miR-200c both 1hr and16 hrs after treatment (n=3; *P <0.001;
#P<0.01).
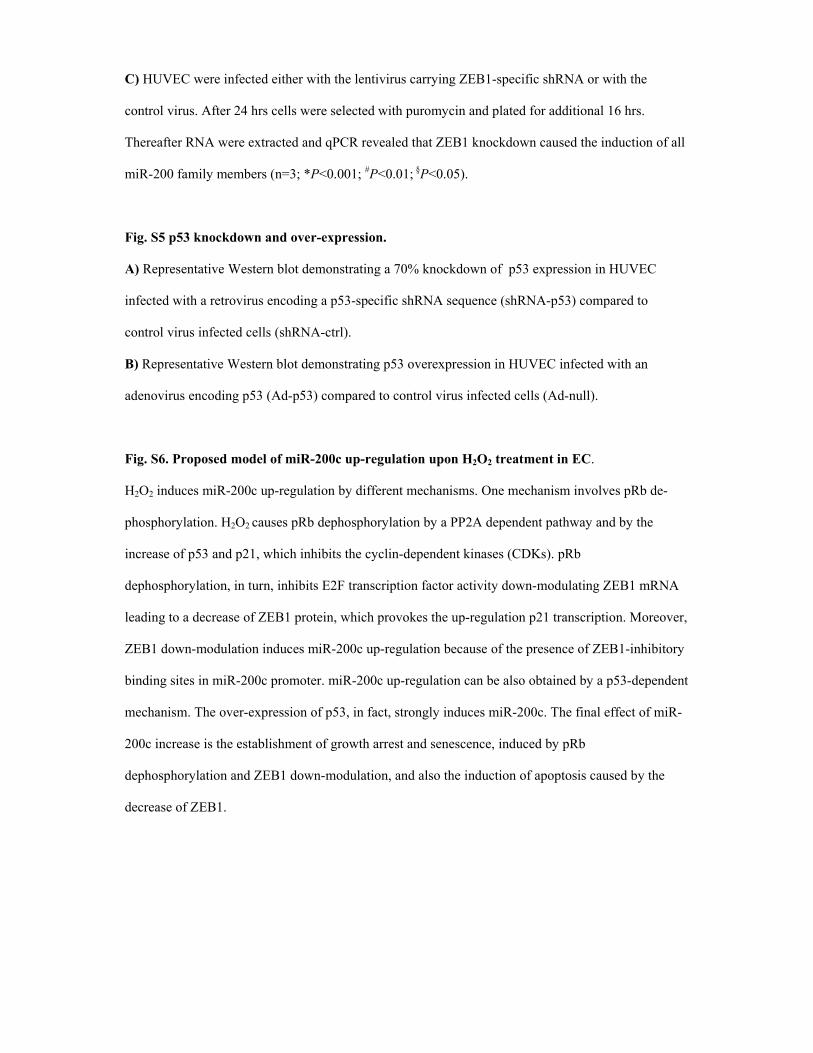
Fig. S2 Oxidative stress down-modulates ZEB1
A) HUVEC were either preincubated with 10 mM NAC or sham-treated for 30 min prior to exposure
to 0.25 mM BCNU for 2 hrs. Expression levels of ZEB1 protein were evaluated by densitometric
analysis and normalized by α-tubulin protein levels (n=3 ; *P<0.001; #P<0.05).
B) HUVEC were treated with 200 μΜ H2O2 for 2–24 hr and ZEB2 mRNA was quantified by qPCR.
ZEB2 expression exhibited a statistically significant decrease from control only at the 2 hr time point
(n=4 at each time point; *P <0.001).
C) HUVEC were infected with a lentiviral vector encoding either miR-200c or miR-scramble. After
24 hrs cells were selected with puromycin and ZEB2 mRNAs was quantified by qPCR; miR-200c
over-expression had no significant effect on ZEB2 mRNA (n=3; *P <0.001).
Fig. S3 Functional effects of ZEB1 knockdown in EC
A) Left panel: HUVEC were infected either with 3 different lentiviruses carrying ZEB1-specific
shRNA (ZEB1-a, ZEB1-b, ZEB1-c) or with the control virus. After 24 hrs cells were selected with
puromycin and plated. ZEB1 knockdown inhibited cell proliferation compared to control (n=3; *P
<0.001; #P<0.05). Right panel: HUVEC were transduced with shRNA-ZEB1 or with control virus.
After selection cells were plated and 40 hrs later were pulse labelled with BrdU for 30 minutes before
harvesting, fixed and then stained with propidium iodide and an α− BrdU antibody. ZEB1
knockdown was associated with a decrease in % of BrdU-positive cells (n= 3; *P<0.001).
B) HUVEC were transduced with shRNA-(ZEB1-a, ZEB1-b, ZEB1-c) or with control virus. After
selection cells were plated and 40 hrs later apoptosis was measured. Left panel: ZEB1 depletion
induced apoptosis as determined by fragmentation of cellular DNA (n=3; *P<0.001; #P<0.01). Right
panel: ZEB1 depletion increased the number of cells in sub-G1 phase of the cell cycle as determined
by the % of cells displaying subdiploid DNA content by flow cytometry (n=3; *P<0.001; #P<0.01).
C) Left panel: HUVEC transduced with shRNA-(ZEB1-a, ZEB1-b, ZEB1-c) or with control virus
were seeded and after 8 hrs were fixed and stained for SA-β-gal. ZEB1 knockdown enhanced the %
of SA-β-gal-positive cells compared to control (n=3; *P<0.001; #P<0.01). Right panel: Representative
Western blot demonstrating a 70% knockdown of ZEB1 expression in HUVEC infected with
lentiviruses encoding a ZEB1-specific shRNA sequences (ZEB1-a, ZEB1-b, ZEB1-c) compared to
control virus-infected cells. HUVEC transduced with ZEB1-specific shRNAs exhibited an up-
regulation of p21 compared to control. The same protein extracts were run on a 6% SDS
polyacrylamide gel to detect ZEB1 and on a 12% to detect p21. This experiment was performed 3
times with similar results. Tub, α-tubulin.
Fig. S4 Mechanism of induction of miR-200c by H2O2
A) C2C12 myoblasts were transfected either with miR-200c promoter luciferase plasmid (wt), or with
miR-200c promoter mutated in both ZEB1 binding sites luciferase plasmid (Z1/Z2 mutant). After 36
hrs cells were treated with 200 μM H2O2 for additional 24 hrs. Luciferase reporter assay showed that
wt-promoter was induced by H2O2 and that the Z1/Z2 mutant was significantly induced only in basal
condition and not after H2O2 treatment (n=3 ; *P<0.001; #P<0.05; non significant = ns) .
B) C2C12 myoblasts were transfected either with miR-200c promoter luciferase plasmid (wt), or with
miR-200c promoter mutated in both ZEB1 binding sites luciferase plasmid (Z1/Z2 mutant). After 36
hrs cells were treated with 200 μM H2O2 for additional 24 hrs. Thereafter, miR-200c expression levels
in the adopted experimental conditions were quantified by qPCR (n=3; *P<0.001).
C) HUVEC were infected either with the lentivirus carrying ZEB1-specific shRNA or with the
control virus. After 24 hrs cells were selected with puromycin and plated for additional 16 hrs.
Thereafter RNA were extracted and qPCR revealed that ZEB1 knockdown caused the induction of all
miR-200 family members (n=3; *P<0.001; #P<0.01; §P<0.05).
Fig. S5 p53 knockdown and over-expression.
A) Representative Western blot demonstrating a 70% knockdown of p53 expression in HUVEC
infected with a retrovirus encoding a p53-specific shRNA sequence (shRNA-p53) compared to
control virus infected cells (shRNA-ctrl).
B) Representative Western blot demonstrating p53 overexpression in HUVEC infected with an
adenovirus encoding p53 (Ad-p53) compared to control virus infected cells (Ad-null).
Fig. S6. Proposed model of miR-200c up-regulation upon H2O2 treatment in EC.
H2O2 induces miR-200c up-regulation by different mechanisms. One mechanism involves pRb de-
phosphorylation. H2O2 causes pRb dephosphorylation by a PP2A dependent pathway and by the
increase of p53 and p21, which inhibits the cyclin-dependent kinases (CDKs). pRb
dephosphorylation, in turn, inhibits E2F transcription factor activity down-modulating ZEB1 mRNA
leading to a decrease of ZEB1 protein, which provokes the up-regulation p21 transcription. Moreover,
ZEB1 down-modulation induces miR-200c up-regulation because of the presence of ZEB1-inhibitory
binding sites in miR-200c promoter. miR-200c up-regulation can be also obtained by a p53-dependent
mechanism. The over-expression of p53, in fact, strongly induces miR-200c. The final effect of miR-
200c increase is the establishment of growth arrest and senescence, induced by pRb
dephosphorylation and ZEB1 down-modulation, and also the induction of apoptosis caused by the
decrease of ZEB1.
FIGURE S1
FIGURE S2
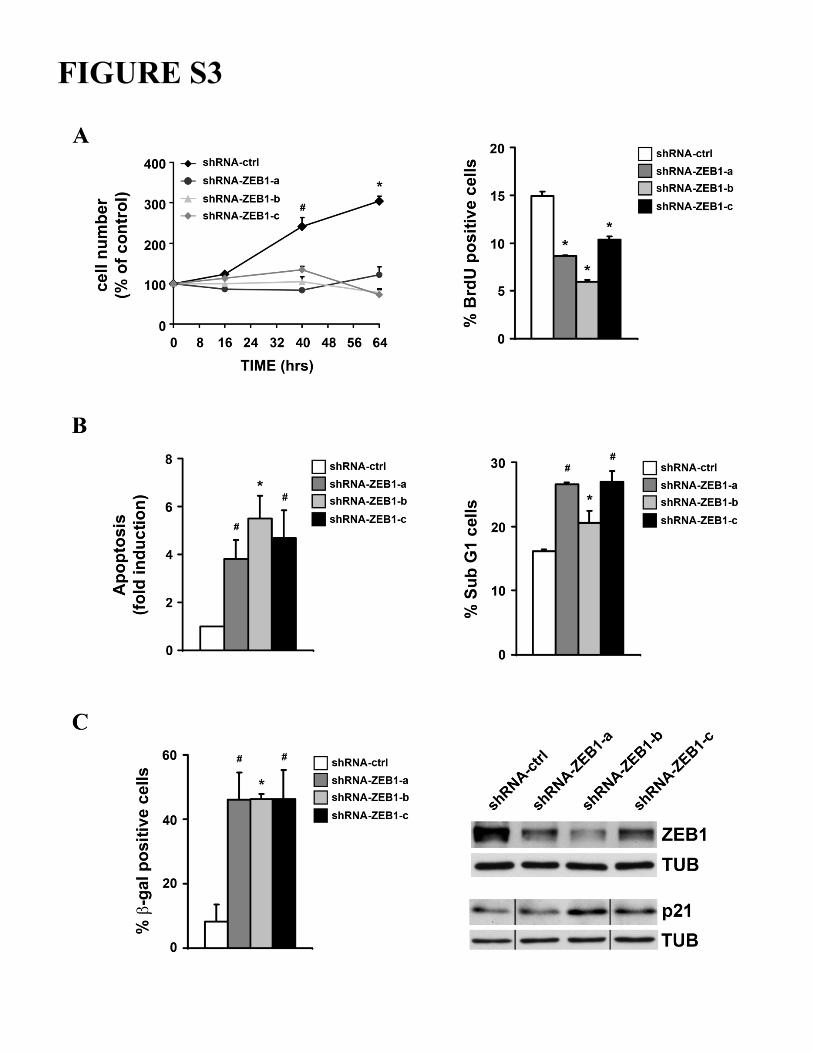
FIGURE S3
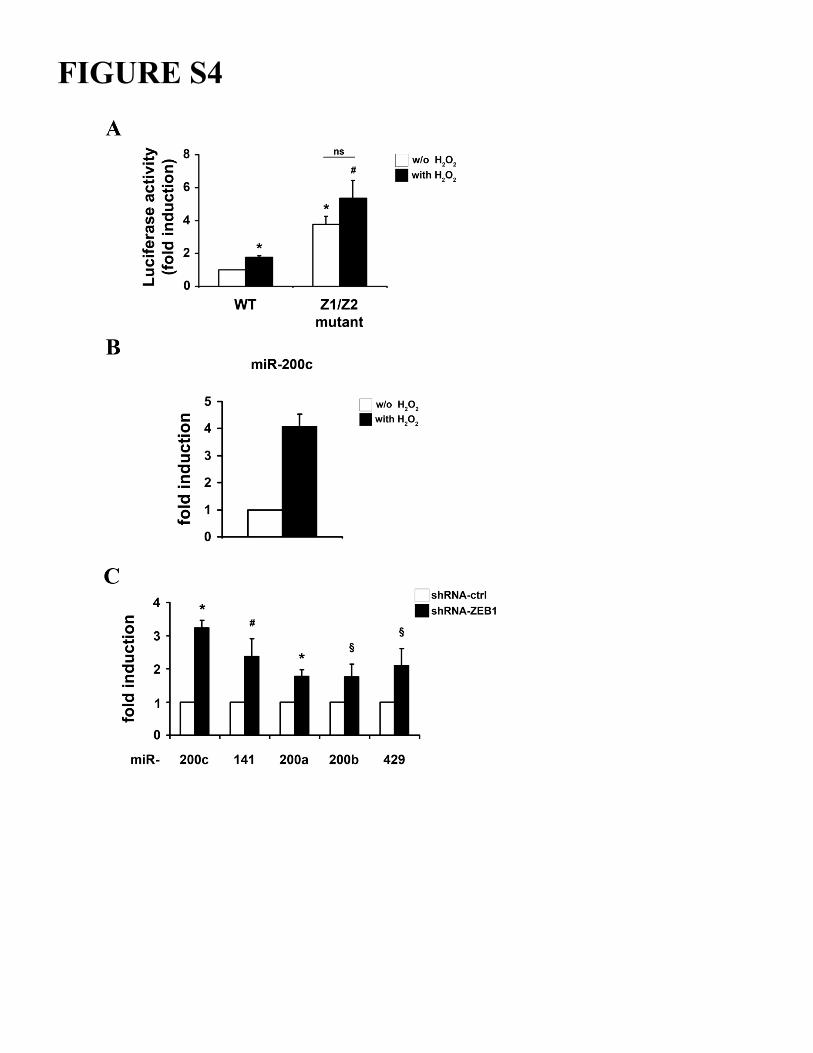
FIGURE S4
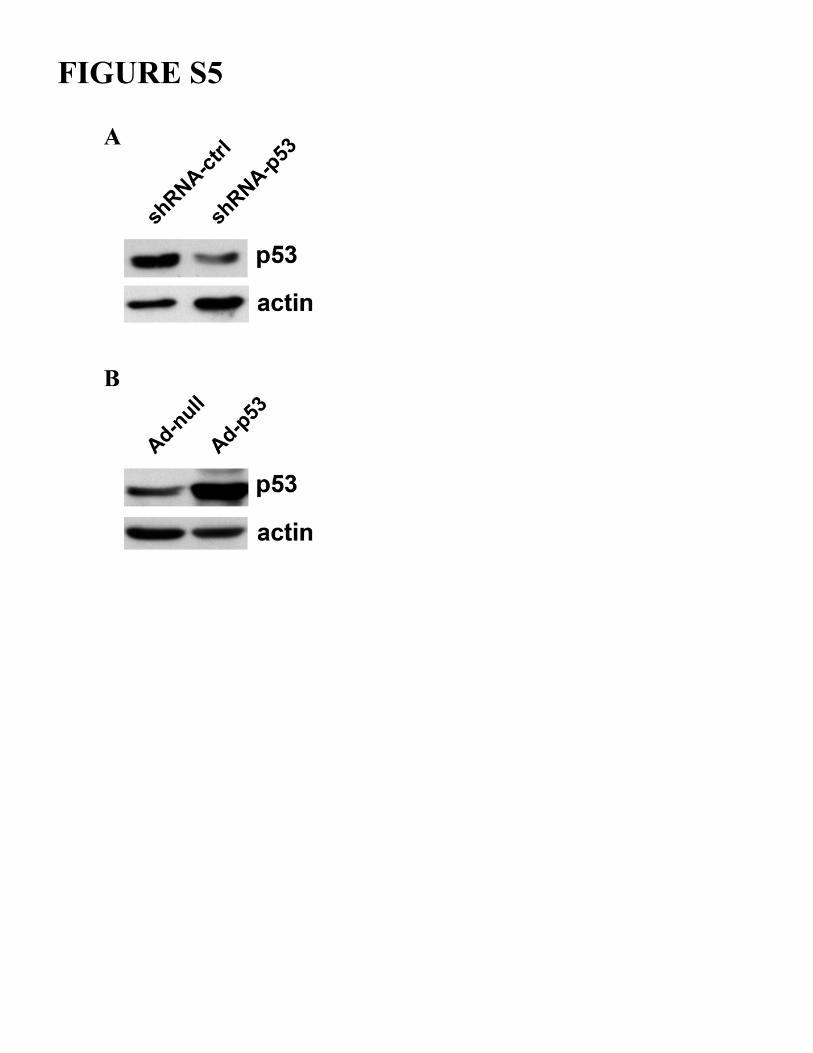
FIGURE S5
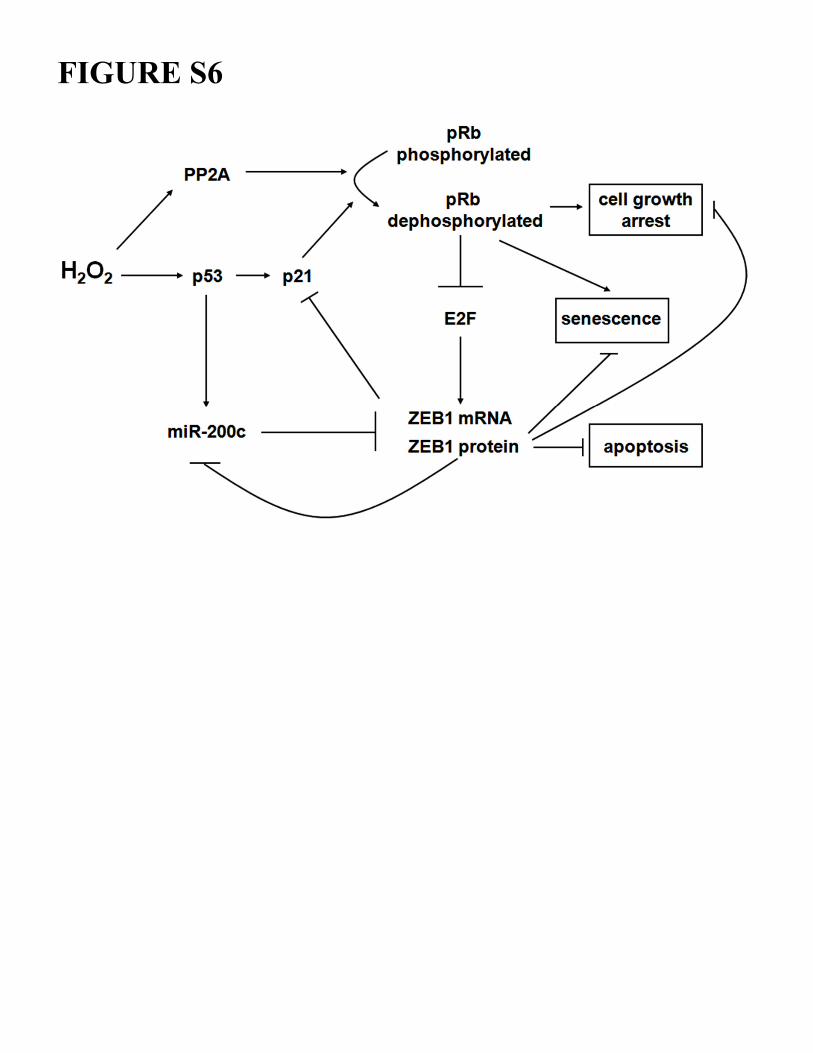
FIGURE S6
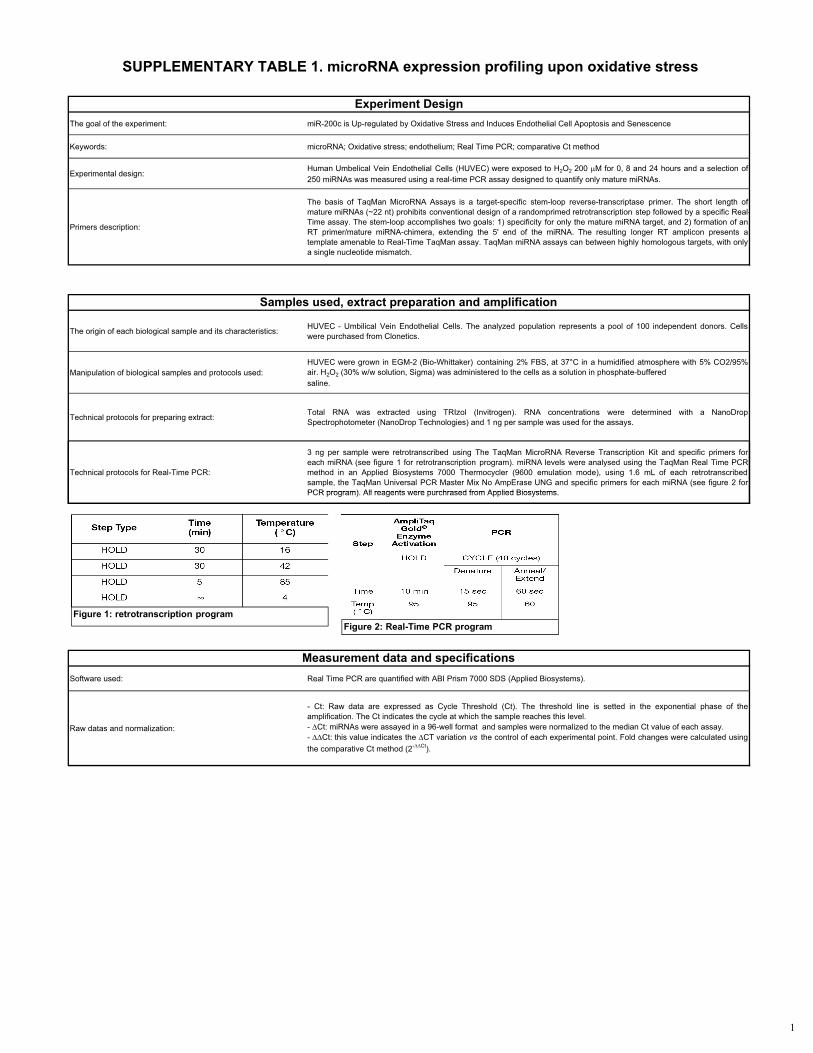
The goal of the experiment: miR-200c is Up-regulated by Oxidative Stress and Induces Endothelial Cell Apoptosis and Senescence
Keywords: microRNA; Oxidative stress; endothelium; Real Time PCR; comparative Ct method
Experimental design: Human Umbelical Vein Endothelial Cells (HUVEC) were exposed to H2O2 200 �M for 0, 8 and 24 hours and a selection of250 miRNAs was measured using a real-time PCR assay designed to quantify only mature miRNAs.
Primers description:
The basis of TaqMan MicroRNA Assays is a target-specific stem-loop reverse-transcriptase primer. The short length ofmature miRNAs (~22 nt) prohibits conventional design of a randomprimed retrotranscription step followed by a specific Real-Time assay. The stem-loop accomplishes two goals: 1) specificity for only the mature miRNA target, and 2) formation of anRT primer/mature miRNA-chimera, extending the 5' end of the miRNA. The resulting longer RT amplicon presents atemplate amenable to Real-Time TaqMan assay. TaqMan miRNA assays can between highly homologous targets, with onlya single nucleotide mismatch.
The origin of each biological sample and its characteristics: HUVEC - Umbilical Vein Endothelial Cells. The analyzed population represents a pool of 100 independent donors. Cellswere purchased from Clonetics.
Manipulation of biological samples and protocols used:HUVEC were grown in EGM-2 (Bio-Whittaker) containing 2% FBS, at 37°C in a humidified atmosphere with 5% CO2/95%air. H2O2 (30% w/w solution, Sigma) was administered to the cells as a solution in phosphate-bufferedsaline.
Technical protocols for preparing extract: Total RNA was extracted using TRIzol (Invitrogen). RNA concentrations were determined with a NanoDropSpectrophotometer (NanoDrop Technologies) and 1 ng per sample was used for the assays.
Technical protocols for Real-Time PCR:
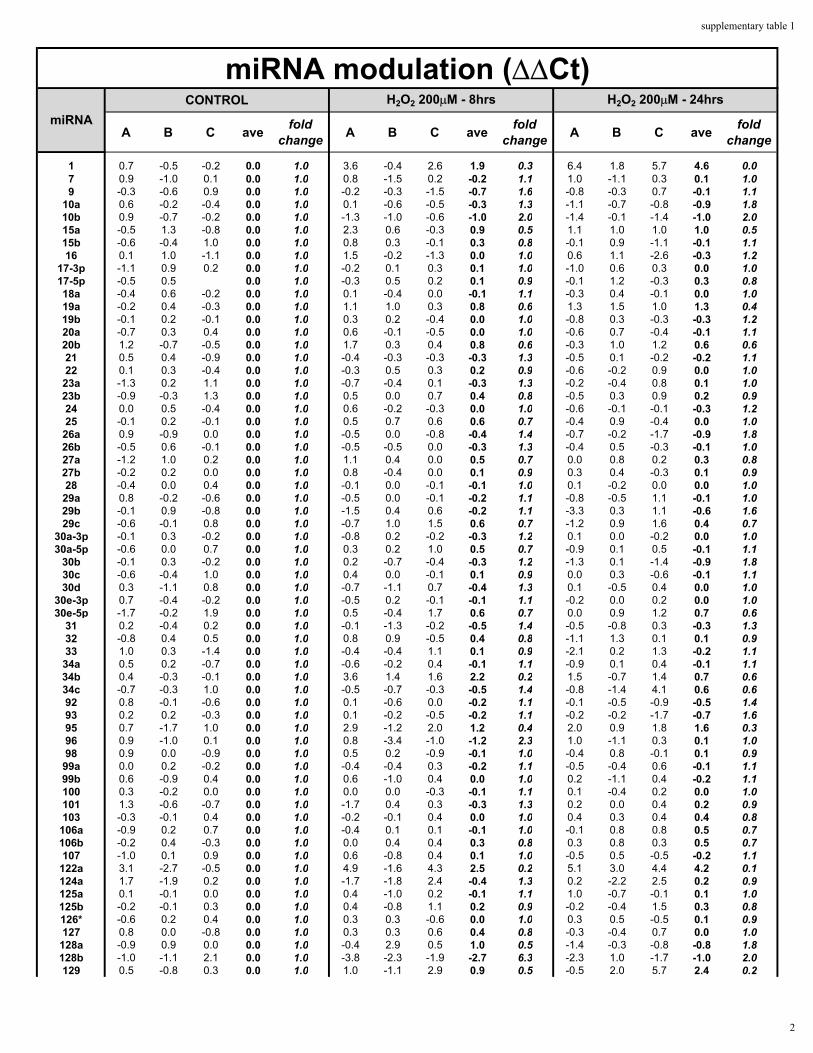
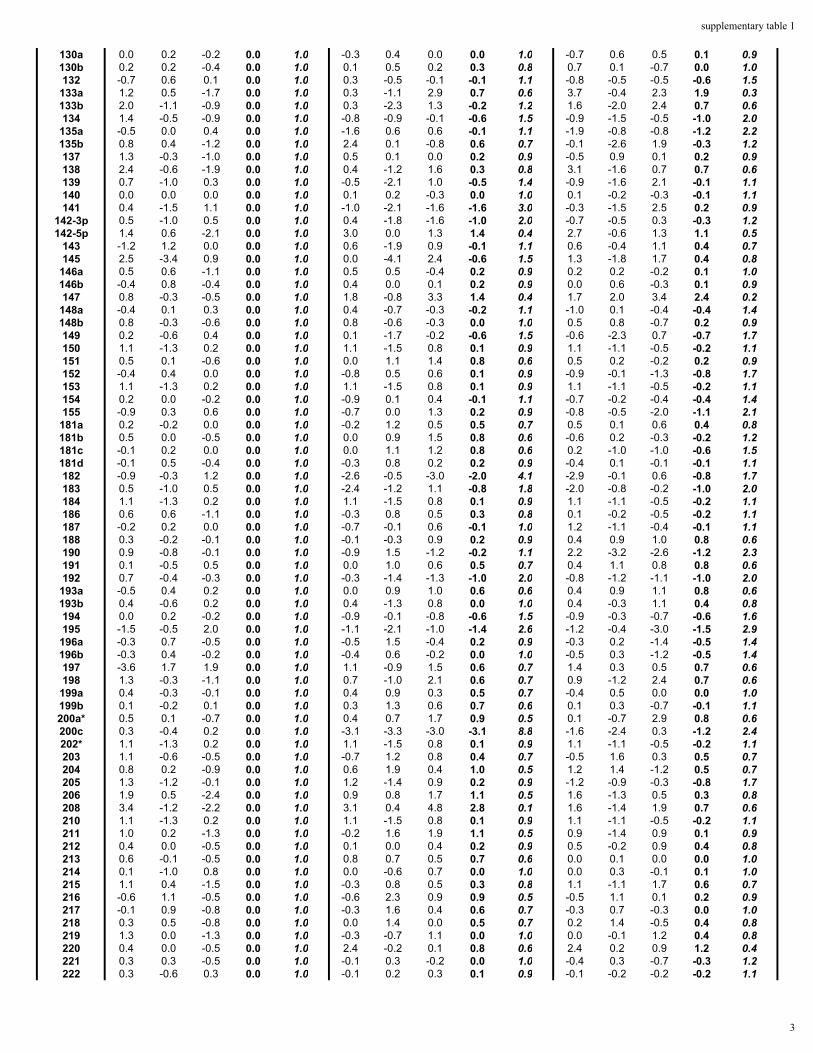
3 ng per sample were retrotranscribed using The TaqMan MicroRNA Reverse Transcription Kit and specific primers foreach miRNA (see figure 1 for retrotranscription program). miRNA levels were analysed using the TaqMan Real Time PCRmethod in an Applied Biosystems 7000 Thermocycler (9600 emulation mode), using 1.6 mL of each retrotranscribedsample, the TaqMan Universal PCR Master Mix No AmpErase UNG and specific primers for each miRNA (see figure 2 forPCR program) All reagents were purchrased from Applied Biosystems
Experiment Design
Samples used, extract preparation and amplification
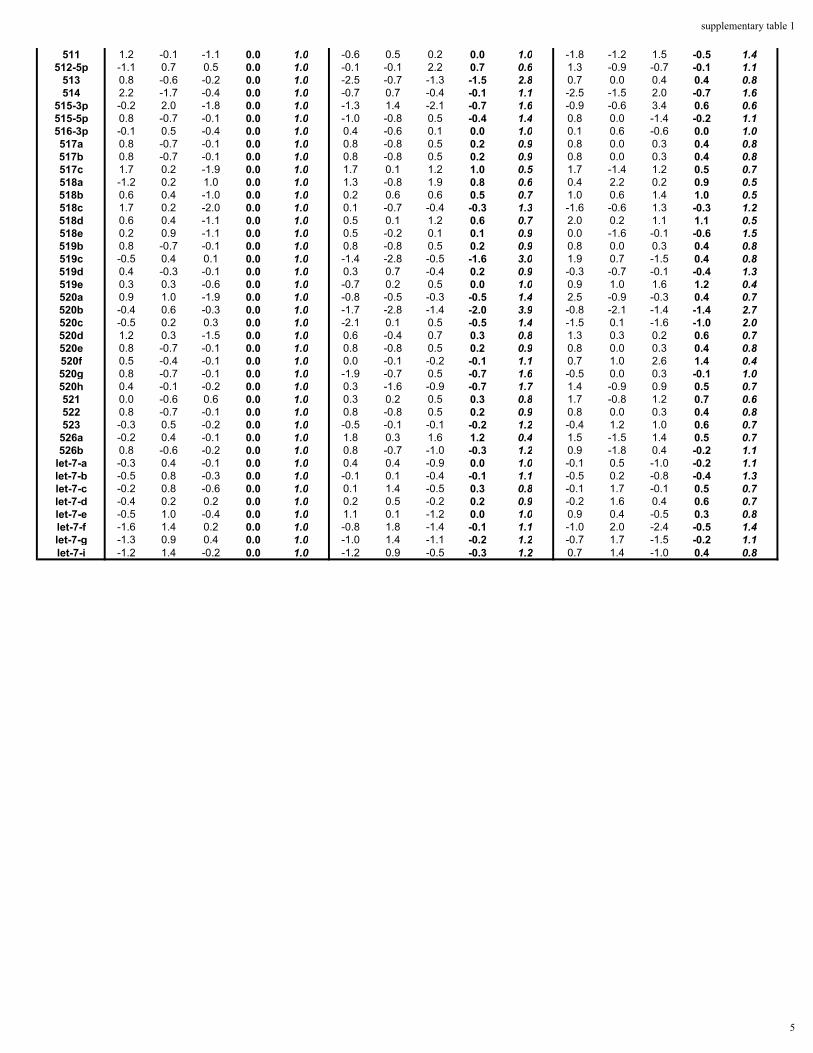
SUPPLEMENTARY TABLE 1. microRNA expression profiling upon oxidative stress
PCR program). All reagents were purchrased from Applied Biosystems.
Software used: Real Time PCR are quantified with ABI Prism 7000 SDS (Applied Biosystems).
Raw datas and normalization:
- Ct: Raw data are expressed as Cycle Threshold (Ct). The threshold line is setted in the exponential phase of theamplification. The Ct indicates the cycle at which the sample reaches this level.- �Ct: miRNAs were assayed in a 96-well format and samples were normalized to the median Ct value of each assay.- ��Ct: this value indicates the �CT variation vs the control of each experimental point. Fold changes were calculated usingthe comparative Ct method (2-��Ct).
Measurement data and specifications
Figure 1: retrotranscription programFigure 2: Real-Time PCR program
1
A B C ave foldchange A B C ave fold
change A B C ave foldchange
1 0.7 -0.5 -0.2 0.0 1.0 3.6 -0.4 2.6 1.9 0.3 6.4 1.8 5.7 4.6 0.07 0.9 -1.0 0.1 0.0 1.0 0.8 -1.5 0.2 -0.2 1.1 1.0 -1.1 0.3 0.1 1.09 -0.3 -0.6 0.9 0.0 1.0 -0.2 -0.3 -1.5 -0.7 1.6 -0.8 -0.3 0.7 -0.1 1.1
10a 0.6 -0.2 -0.4 0.0 1.0 0.1 -0.6 -0.5 -0.3 1.3 -1.1 -0.7 -0.8 -0.9 1.810b 0.9 -0.7 -0.2 0.0 1.0 -1.3 -1.0 -0.6 -1.0 2.0 -1.4 -0.1 -1.4 -1.0 2.015a -0.5 1.3 -0.8 0.0 1.0 2.3 0.6 -0.3 0.9 0.5 1.1 1.0 1.0 1.0 0.515b -0.6 -0.4 1.0 0.0 1.0 0.8 0.3 -0.1 0.3 0.8 -0.1 0.9 -1.1 -0.1 1.116 0.1 1.0 -1.1 0.0 1.0 1.5 -0.2 -1.3 0.0 1.0 0.6 1.1 -2.6 -0.3 1.2
17-3p -1.1 0.9 0.2 0.0 1.0 -0.2 0.1 0.3 0.1 1.0 -1.0 0.6 0.3 0.0 1.017-5p -0.5 0.5 0.0 1.0 -0.3 0.5 0.2 0.1 0.9 -0.1 1.2 -0.3 0.3 0.818a -0.4 0.6 -0.2 0.0 1.0 0.1 -0.4 0.0 -0.1 1.1 -0.3 0.4 -0.1 0.0 1.019a -0.2 0.4 -0.3 0.0 1.0 1.1 1.0 0.3 0.8 0.6 1.3 1.5 1.0 1.3 0.419b -0.1 0.2 -0.1 0.0 1.0 0.3 0.2 -0.4 0.0 1.0 -0.8 0.3 -0.3 -0.3 1.220a -0.7 0.3 0.4 0.0 1.0 0.6 -0.1 -0.5 0.0 1.0 -0.6 0.7 -0.4 -0.1 1.120b 1.2 -0.7 -0.5 0.0 1.0 1.7 0.3 0.4 0.8 0.6 -0.3 1.0 1.2 0.6 0.621 0.5 0.4 -0.9 0.0 1.0 -0.4 -0.3 -0.3 -0.3 1.3 -0.5 0.1 -0.2 -0.2 1.122 0.1 0.3 -0.4 0.0 1.0 -0.3 0.5 0.3 0.2 0.9 -0.6 -0.2 0.9 0.0 1.023a -1.3 0.2 1.1 0.0 1.0 -0.7 -0.4 0.1 -0.3 1.3 -0.2 -0.4 0.8 0.1 1.023b -0.9 -0.3 1.3 0.0 1.0 0.5 0.0 0.7 0.4 0.8 -0.5 0.3 0.9 0.2 0.924 0.0 0.5 -0.4 0.0 1.0 0.6 -0.2 -0.3 0.0 1.0 -0.6 -0.1 -0.1 -0.3 1.225 -0.1 0.2 -0.1 0.0 1.0 0.5 0.7 0.6 0.6 0.7 -0.4 0.9 -0.4 0.0 1.026a 0.9 -0.9 0.0 0.0 1.0 -0.5 0.0 -0.8 -0.4 1.4 -0.7 -0.2 -1.7 -0.9 1.826b -0.5 0.6 -0.1 0.0 1.0 -0.5 -0.5 0.0 -0.3 1.3 -0.4 0.5 -0.3 -0.1 1.027a -1.2 1.0 0.2 0.0 1.0 1.1 0.4 0.0 0.5 0.7 0.0 0.8 0.2 0.3 0.827b -0.2 0.2 0.0 0.0 1.0 0.8 -0.4 0.0 0.1 0.9 0.3 0.4 -0.3 0.1 0.928 -0.4 0.0 0.4 0.0 1.0 -0.1 0.0 -0.1 -0.1 1.0 0.1 -0.2 0.0 0.0 1.029a 0.8 -0.2 -0.6 0.0 1.0 -0.5 0.0 -0.1 -0.2 1.1 -0.8 -0.5 1.1 -0.1 1.029b -0.1 0.9 -0.8 0.0 1.0 -1.5 0.4 0.6 -0.2 1.1 -3.3 0.3 1.1 -0.6 1.629c -0.6 -0.1 0.8 0.0 1.0 -0.7 1.0 1.5 0.6 0.7 -1.2 0.9 1.6 0.4 0.7
30a-3p -0.1 0.3 -0.2 0.0 1.0 -0.8 0.2 -0.2 -0.3 1.2 0.1 0.0 -0.2 0.0 1.030a-5p -0.6 0.0 0.7 0.0 1.0 0.3 0.2 1.0 0.5 0.7 -0.9 0.1 0.5 -0.1 1.1
30b -0.1 0.3 -0.2 0.0 1.0 0.2 -0.7 -0.4 -0.3 1.2 -1.3 0.1 -1.4 -0.9 1.830c -0.6 -0.4 1.0 0.0 1.0 0.4 0.0 -0.1 0.1 0.9 0.0 0.3 -0.6 -0.1 1.130d 0.3 -1.1 0.8 0.0 1.0 -0.7 -1.1 0.7 -0.4 1.3 0.1 -0.5 0.4 0.0 1.0
30e-3p 0.7 -0.4 -0.2 0.0 1.0 -0.5 0.2 -0.1 -0.1 1.1 -0.2 0.0 0.2 0.0 1.030e-5p -1.7 -0.2 1.9 0.0 1.0 0.5 -0.4 1.7 0.6 0.7 0.0 0.9 1.2 0.7 0.6
31 0.2 -0.4 0.2 0.0 1.0 -0.1 -1.3 -0.2 -0.5 1.4 -0.5 -0.8 0.3 -0.3 1.332 -0.8 0.4 0.5 0.0 1.0 0.8 0.9 -0.5 0.4 0.8 -1.1 1.3 0.1 0.1 0.933 1.0 0.3 -1.4 0.0 1.0 -0.4 -0.4 1.1 0.1 0.9 -2.1 0.2 1.3 -0.2 1.134a 0.5 0.2 -0.7 0.0 1.0 -0.6 -0.2 0.4 -0.1 1.1 -0.9 0.1 0.4 -0.1 1.134b 0.4 -0.3 -0.1 0.0 1.0 3.6 1.4 1.6 2.2 0.2 1.5 -0.7 1.4 0.7 0.634c -0.7 -0.3 1.0 0.0 1.0 -0.5 -0.7 -0.3 -0.5 1.4 -0.8 -1.4 4.1 0.6 0.692 0.8 -0.1 -0.6 0.0 1.0 0.1 -0.6 0.0 -0.2 1.1 -0.1 -0.5 -0.9 -0.5 1.493 0.2 0.2 -0.3 0.0 1.0 0.1 -0.2 -0.5 -0.2 1.1 -0.2 -0.2 -1.7 -0.7 1.695 0.7 -1.7 1.0 0.0 1.0 2.9 -1.2 2.0 1.2 0.4 2.0 0.9 1.8 1.6 0.396 0.9 -1.0 0.1 0.0 1.0 0.8 -3.4 -1.0 -1.2 2.3 1.0 -1.1 0.3 0.1 1.098 0.9 0.0 -0.9 0.0 1.0 0.5 0.2 -0.9 -0.1 1.0 -0.4 0.8 -0.1 0.1 0.999a 0.0 0.2 -0.2 0.0 1.0 -0.4 -0.4 0.3 -0.2 1.1 -0.5 -0.4 0.6 -0.1 1.199b 0.6 -0.9 0.4 0.0 1.0 0.6 -1.0 0.4 0.0 1.0 0.2 -1.1 0.4 -0.2 1.1100 0.3 -0.2 0.0 0.0 1.0 0.0 0.0 -0.3 -0.1 1.1 0.1 -0.4 0.2 0.0 1.0101 1.3 -0.6 -0.7 0.0 1.0 -1.7 0.4 0.3 -0.3 1.3 0.2 0.0 0.4 0.2 0.9103 -0.3 -0.1 0.4 0.0 1.0 -0.2 -0.1 0.4 0.0 1.0 0.4 0.3 0.4 0.4 0.8
106a -0.9 0.2 0.7 0.0 1.0 -0.4 0.1 0.1 -0.1 1.0 -0.1 0.8 0.8 0.5 0.7106b -0.2 0.4 -0.3 0.0 1.0 0.0 0.4 0.4 0.3 0.8 0.3 0.8 0.3 0.5 0.7107 -1.0 0.1 0.9 0.0 1.0 0.6 -0.8 0.4 0.1 1.0 -0.5 0.5 -0.5 -0.2 1.1
122a 3.1 -2.7 -0.5 0.0 1.0 4.9 -1.6 4.3 2.5 0.2 5.1 3.0 4.4 4.2 0.1124a 1.7 -1.9 0.2 0.0 1.0 -1.7 -1.8 2.4 -0.4 1.3 0.2 -2.2 2.5 0.2 0.9125a 0.1 -0.1 0.0 0.0 1.0 0.4 -1.0 0.2 -0.1 1.1 1.0 -0.7 -0.1 0.1 1.0125b -0.2 -0.1 0.3 0.0 1.0 0.4 -0.8 1.1 0.2 0.9 -0.2 -0.4 1.5 0.3 0.8126* -0.6 0.2 0.4 0.0 1.0 0.3 0.3 -0.6 0.0 1.0 0.3 0.5 -0.5 0.1 0.9127 0.8 0.0 -0.8 0.0 1.0 0.3 0.3 0.6 0.4 0.8 -0.3 -0.4 0.7 0.0 1.0
128a -0.9 0.9 0.0 0.0 1.0 -0.4 2.9 0.5 1.0 0.5 -1.4 -0.3 -0.8 -0.8 1.8128b -1.0 -1.1 2.1 0.0 1.0 -3.8 -2.3 -1.9 -2.7 6.3 -2.3 1.0 -1.7 -1.0 2.0129 0.5 -0.8 0.3 0.0 1.0 1.0 -1.1 2.9 0.9 0.5 -0.5 2.0 5.7 2.4 0.2
miRNA modulation (��Ct)miRNA
CONTROL H2O2 200�M - 8hrs H2O2 200�M - 24hrs
supplementary table 1
2
130a 0.0 0.2 -0.2 0.0 1.0 -0.3 0.4 0.0 0.0 1.0 -0.7 0.6 0.5 0.1 0.9130b 0.2 0.2 -0.4 0.0 1.0 0.1 0.5 0.2 0.3 0.8 0.7 0.1 -0.7 0.0 1.0132 -0.7 0.6 0.1 0.0 1.0 0.3 -0.5 -0.1 -0.1 1.1 -0.8 -0.5 -0.5 -0.6 1.5
133a 1.2 0.5 -1.7 0.0 1.0 0.3 -1.1 2.9 0.7 0.6 3.7 -0.4 2.3 1.9 0.3133b 2.0 -1.1 -0.9 0.0 1.0 0.3 -2.3 1.3 -0.2 1.2 1.6 -2.0 2.4 0.7 0.6134 1.4 -0.5 -0.9 0.0 1.0 -0.8 -0.9 -0.1 -0.6 1.5 -0.9 -1.5 -0.5 -1.0 2.0
135a -0.5 0.0 0.4 0.0 1.0 -1.6 0.6 0.6 -0.1 1.1 -1.9 -0.8 -0.8 -1.2 2.2135b 0.8 0.4 -1.2 0.0 1.0 2.4 0.1 -0.8 0.6 0.7 -0.1 -2.6 1.9 -0.3 1.2137 1.3 -0.3 -1.0 0.0 1.0 0.5 0.1 0.0 0.2 0.9 -0.5 0.9 0.1 0.2 0.9138 2.4 -0.6 -1.9 0.0 1.0 0.4 -1.2 1.6 0.3 0.8 3.1 -1.6 0.7 0.7 0.6139 0.7 -1.0 0.3 0.0 1.0 -0.5 -2.1 1.0 -0.5 1.4 -0.9 -1.6 2.1 -0.1 1.1140 0.0 0.0 0.0 0.0 1.0 0.1 0.2 -0.3 0.0 1.0 0.1 -0.2 -0.3 -0.1 1.1141 0.4 -1.5 1.1 0.0 1.0 -1.0 -2.1 -1.6 -1.6 3.0 -0.3 -1.5 2.5 0.2 0.9
142-3p 0.5 -1.0 0.5 0.0 1.0 0.4 -1.8 -1.6 -1.0 2.0 -0.7 -0.5 0.3 -0.3 1.2142-5p 1.4 0.6 -2.1 0.0 1.0 3.0 0.0 1.3 1.4 0.4 2.7 -0.6 1.3 1.1 0.5
143 -1.2 1.2 0.0 0.0 1.0 0.6 -1.9 0.9 -0.1 1.1 0.6 -0.4 1.1 0.4 0.7145 2.5 -3.4 0.9 0.0 1.0 0.0 -4.1 2.4 -0.6 1.5 1.3 -1.8 1.7 0.4 0.8
146a 0.5 0.6 -1.1 0.0 1.0 0.5 0.5 -0.4 0.2 0.9 0.2 0.2 -0.2 0.1 1.0146b -0.4 0.8 -0.4 0.0 1.0 0.4 0.0 0.1 0.2 0.9 0.0 0.6 -0.3 0.1 0.9147 0.8 -0.3 -0.5 0.0 1.0 1.8 -0.8 3.3 1.4 0.4 1.7 2.0 3.4 2.4 0.2
148a -0.4 0.1 0.3 0.0 1.0 0.4 -0.7 -0.3 -0.2 1.1 -1.0 0.1 -0.4 -0.4 1.4148b 0.8 -0.3 -0.6 0.0 1.0 0.8 -0.6 -0.3 0.0 1.0 0.5 0.8 -0.7 0.2 0.9149 0.2 -0.6 0.4 0.0 1.0 0.1 -1.7 -0.2 -0.6 1.5 -0.6 -2.3 0.7 -0.7 1.7150 1.1 -1.3 0.2 0.0 1.0 1.1 -1.5 0.8 0.1 0.9 1.1 -1.1 -0.5 -0.2 1.1151 0.5 0.1 -0.6 0.0 1.0 0.0 1.1 1.4 0.8 0.6 0.5 0.2 -0.2 0.2 0.9152 -0.4 0.4 0.0 0.0 1.0 -0.8 0.5 0.6 0.1 0.9 -0.9 -0.1 -1.3 -0.8 1.7153 1.1 -1.3 0.2 0.0 1.0 1.1 -1.5 0.8 0.1 0.9 1.1 -1.1 -0.5 -0.2 1.1154 0.2 0.0 -0.2 0.0 1.0 -0.9 0.1 0.4 -0.1 1.1 -0.7 -0.2 -0.4 -0.4 1.4155 -0.9 0.3 0.6 0.0 1.0 -0.7 0.0 1.3 0.2 0.9 -0.8 -0.5 -2.0 -1.1 2.1
181a 0.2 -0.2 0.0 0.0 1.0 -0.2 1.2 0.5 0.5 0.7 0.5 0.1 0.6 0.4 0.8181b 0.5 0.0 -0.5 0.0 1.0 0.0 0.9 1.5 0.8 0.6 -0.6 0.2 -0.3 -0.2 1.2181c -0.1 0.2 0.0 0.0 1.0 0.0 1.1 1.2 0.8 0.6 0.2 -1.0 -1.0 -0.6 1.5181d -0.1 0.5 -0.4 0.0 1.0 -0.3 0.8 0.2 0.2 0.9 -0.4 0.1 -0.1 -0.1 1.1182 -0.9 -0.3 1.2 0.0 1.0 -2.6 -0.5 -3.0 -2.0 4.1 -2.9 -0.1 0.6 -0.8 1.7183 0.5 -1.0 0.5 0.0 1.0 -2.4 -1.2 1.1 -0.8 1.8 -2.0 -0.8 -0.2 -1.0 2.0184 1.1 -1.3 0.2 0.0 1.0 1.1 -1.5 0.8 0.1 0.9 1.1 -1.1 -0.5 -0.2 1.1186 0.6 0.6 -1.1 0.0 1.0 -0.3 0.8 0.5 0.3 0.8 0.1 -0.2 -0.5 -0.2 1.1187 -0.2 0.2 0.0 0.0 1.0 -0.7 -0.1 0.6 -0.1 1.0 1.2 -1.1 -0.4 -0.1 1.1188 0.3 -0.2 -0.1 0.0 1.0 -0.1 -0.3 0.9 0.2 0.9 0.4 0.9 1.0 0.8 0.6190 0.9 -0.8 -0.1 0.0 1.0 -0.9 1.5 -1.2 -0.2 1.1 2.2 -3.2 -2.6 -1.2 2.3191 0.1 -0.5 0.5 0.0 1.0 0.0 1.0 0.6 0.5 0.7 0.4 1.1 0.8 0.8 0.6192 0.7 -0.4 -0.3 0.0 1.0 -0.3 -1.4 -1.3 -1.0 2.0 -0.8 -1.2 -1.1 -1.0 2.0
193a -0.5 0.4 0.2 0.0 1.0 0.0 0.9 1.0 0.6 0.6 0.4 0.9 1.1 0.8 0.6193b 0.4 -0.6 0.2 0.0 1.0 0.4 -1.3 0.8 0.0 1.0 0.4 -0.3 1.1 0.4 0.8194 0.0 0.2 -0.2 0.0 1.0 -0.9 -0.1 -0.8 -0.6 1.5 -0.9 -0.3 -0.7 -0.6 1.6195 -1.5 -0.5 2.0 0.0 1.0 -1.1 -2.1 -1.0 -1.4 2.6 -1.2 -0.4 -3.0 -1.5 2.9
196a -0.3 0.7 -0.5 0.0 1.0 -0.5 1.5 -0.4 0.2 0.9 -0.3 0.2 -1.4 -0.5 1.4196b -0.3 0.4 -0.2 0.0 1.0 -0.4 0.6 -0.2 0.0 1.0 -0.5 0.3 -1.2 -0.5 1.4197 -3.6 1.7 1.9 0.0 1.0 1.1 -0.9 1.5 0.6 0.7 1.4 0.3 0.5 0.7 0.6198 1.3 -0.3 -1.1 0.0 1.0 0.7 -1.0 2.1 0.6 0.7 0.9 -1.2 2.4 0.7 0.6
199a 0.4 -0.3 -0.1 0.0 1.0 0.4 0.9 0.3 0.5 0.7 -0.4 0.5 0.0 0.0 1.0199b 0.1 -0.2 0.1 0.0 1.0 0.3 1.3 0.6 0.7 0.6 0.1 0.3 -0.7 -0.1 1.1200a* 0.5 0.1 -0.7 0.0 1.0 0.4 0.7 1.7 0.9 0.5 0.1 -0.7 2.9 0.8 0.6200c 0.3 -0.4 0.2 0.0 1.0 -3.1 -3.3 -3.0 -3.1 8.8 -1.6 -2.4 0.3 -1.2 2.4202* 1.1 -1.3 0.2 0.0 1.0 1.1 -1.5 0.8 0.1 0.9 1.1 -1.1 -0.5 -0.2 1.1203 1.1 -0.6 -0.5 0.0 1.0 -0.7 1.2 0.8 0.4 0.7 -0.5 1.6 0.3 0.5 0.7204 0.8 0.2 -0.9 0.0 1.0 0.6 1.9 0.4 1.0 0.5 1.2 1.4 -1.2 0.5 0.7205 1.3 -1.2 -0.1 0.0 1.0 1.2 -1.4 0.9 0.2 0.9 -1.2 -0.9 -0.3 -0.8 1.7206 1.9 0.5 -2.4 0.0 1.0 0.9 0.8 1.7 1.1 0.5 1.6 -1.3 0.5 0.3 0.8208 3.4 -1.2 -2.2 0.0 1.0 3.1 0.4 4.8 2.8 0.1 1.6 -1.4 1.9 0.7 0.6210 1.1 -1.3 0.2 0.0 1.0 1.1 -1.5 0.8 0.1 0.9 1.1 -1.1 -0.5 -0.2 1.1211 1.0 0.2 -1.3 0.0 1.0 -0.2 1.6 1.9 1.1 0.5 0.9 -1.4 0.9 0.1 0.9212 0.4 0.0 -0.5 0.0 1.0 0.1 0.0 0.4 0.2 0.9 0.5 -0.2 0.9 0.4 0.8213 0.6 -0.1 -0.5 0.0 1.0 0.8 0.7 0.5 0.7 0.6 0.0 0.1 0.0 0.0 1.0214 0.1 -1.0 0.8 0.0 1.0 0.0 -0.6 0.7 0.0 1.0 0.0 0.3 -0.1 0.1 1.0215 1.1 0.4 -1.5 0.0 1.0 -0.3 0.8 0.5 0.3 0.8 1.1 -1.1 1.7 0.6 0.7216 -0.6 1.1 -0.5 0.0 1.0 -0.6 2.3 0.9 0.9 0.5 -0.5 1.1 0.1 0.2 0.9217 -0.1 0.9 -0.8 0.0 1.0 -0.3 1.6 0.4 0.6 0.7 -0.3 0.7 -0.3 0.0 1.0218 0.3 0.5 -0.8 0.0 1.0 0.0 1.4 0.0 0.5 0.7 0.2 1.4 -0.5 0.4 0.8219 1.3 0.0 -1.3 0.0 1.0 -0.3 -0.7 1.1 0.0 1.0 0.0 -0.1 1.2 0.4 0.8220 0.4 0.0 -0.5 0.0 1.0 2.4 -0.2 0.1 0.8 0.6 2.4 0.2 0.9 1.2 0.4221 0.3 0.3 -0.5 0.0 1.0 -0.1 0.3 -0.2 0.0 1.0 -0.4 0.3 -0.7 -0.3 1.2222 0.3 -0.6 0.3 0.0 1.0 -0.1 0.2 0.3 0.1 0.9 -0.1 -0.2 -0.2 -0.2 1.1
supplementary table 1
3
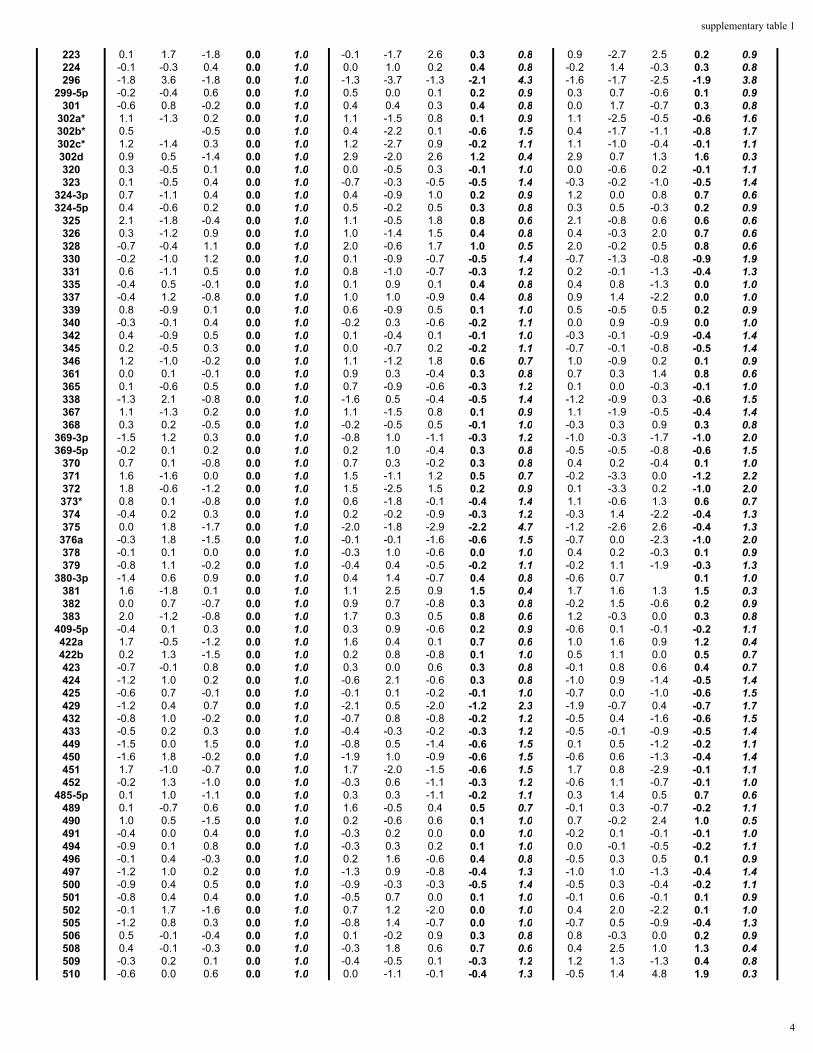
223 0.1 1.7 -1.8 0.0 1.0 -0.1 -1.7 2.6 0.3 0.8 0.9 -2.7 2.5 0.2 0.9224 -0.1 -0.3 0.4 0.0 1.0 0.0 1.0 0.2 0.4 0.8 -0.2 1.4 -0.3 0.3 0.8296 -1.8 3.6 -1.8 0.0 1.0 -1.3 -3.7 -1.3 -2.1 4.3 -1.6 -1.7 -2.5 -1.9 3.8
299-5p -0.2 -0.4 0.6 0.0 1.0 0.5 0.0 0.1 0.2 0.9 0.3 0.7 -0.6 0.1 0.9301 -0.6 0.8 -0.2 0.0 1.0 0.4 0.4 0.3 0.4 0.8 0.0 1.7 -0.7 0.3 0.8
302a* 1.1 -1.3 0.2 0.0 1.0 1.1 -1.5 0.8 0.1 0.9 1.1 -2.5 -0.5 -0.6 1.6302b* 0.5 -0.5 0.0 1.0 0.4 -2.2 0.1 -0.6 1.5 0.4 -1.7 -1.1 -0.8 1.7302c* 1.2 -1.4 0.3 0.0 1.0 1.2 -2.7 0.9 -0.2 1.1 1.1 -1.0 -0.4 -0.1 1.1302d 0.9 0.5 -1.4 0.0 1.0 2.9 -2.0 2.6 1.2 0.4 2.9 0.7 1.3 1.6 0.3320 0.3 -0.5 0.1 0.0 1.0 0.0 -0.5 0.3 -0.1 1.0 0.0 -0.6 0.2 -0.1 1.1323 0.1 -0.5 0.4 0.0 1.0 -0.7 -0.3 -0.5 -0.5 1.4 -0.3 -0.2 -1.0 -0.5 1.4
324-3p 0.7 -1.1 0.4 0.0 1.0 0.4 -0.9 1.0 0.2 0.9 1.2 0.0 0.8 0.7 0.6324-5p 0.4 -0.6 0.2 0.0 1.0 0.5 -0.2 0.5 0.3 0.8 0.3 0.5 -0.3 0.2 0.9
325 2.1 -1.8 -0.4 0.0 1.0 1.1 -0.5 1.8 0.8 0.6 2.1 -0.8 0.6 0.6 0.6326 0.3 -1.2 0.9 0.0 1.0 1.0 -1.4 1.5 0.4 0.8 0.4 -0.3 2.0 0.7 0.6328 -0.7 -0.4 1.1 0.0 1.0 2.0 -0.6 1.7 1.0 0.5 2.0 -0.2 0.5 0.8 0.6330 -0.2 -1.0 1.2 0.0 1.0 0.1 -0.9 -0.7 -0.5 1.4 -0.7 -1.3 -0.8 -0.9 1.9331 0.6 -1.1 0.5 0.0 1.0 0.8 -1.0 -0.7 -0.3 1.2 0.2 -0.1 -1.3 -0.4 1.3335 -0.4 0.5 -0.1 0.0 1.0 0.1 0.9 0.1 0.4 0.8 0.4 0.8 -1.3 0.0 1.0337 -0.4 1.2 -0.8 0.0 1.0 1.0 1.0 -0.9 0.4 0.8 0.9 1.4 -2.2 0.0 1.0339 0.8 -0.9 0.1 0.0 1.0 0.6 -0.9 0.5 0.1 1.0 0.5 -0.5 0.5 0.2 0.9340 -0.3 -0.1 0.4 0.0 1.0 -0.2 0.3 -0.6 -0.2 1.1 0.0 0.9 -0.9 0.0 1.0342 0.4 -0.9 0.5 0.0 1.0 0.1 -0.4 0.1 -0.1 1.0 -0.3 -0.1 -0.9 -0.4 1.4345 0.2 -0.5 0.3 0.0 1.0 0.0 -0.7 0.2 -0.2 1.1 -0.7 -0.1 -0.8 -0.5 1.4346 1.2 -1.0 -0.2 0.0 1.0 1.1 -1.2 1.8 0.6 0.7 1.0 -0.9 0.2 0.1 0.9361 0.0 0.1 -0.1 0.0 1.0 0.9 0.3 -0.4 0.3 0.8 0.7 0.3 1.4 0.8 0.6365 0.1 -0.6 0.5 0.0 1.0 0.7 -0.9 -0.6 -0.3 1.2 0.1 0.0 -0.3 -0.1 1.0338 -1.3 2.1 -0.8 0.0 1.0 -1.6 0.5 -0.4 -0.5 1.4 -1.2 -0.9 0.3 -0.6 1.5367 1.1 -1.3 0.2 0.0 1.0 1.1 -1.5 0.8 0.1 0.9 1.1 -1.9 -0.5 -0.4 1.4368 0.3 0.2 -0.5 0.0 1.0 -0.2 -0.5 0.5 -0.1 1.0 -0.3 0.3 0.9 0.3 0.8
369-3p -1.5 1.2 0.3 0.0 1.0 -0.8 1.0 -1.1 -0.3 1.2 -1.0 -0.3 -1.7 -1.0 2.0369-5p -0.2 0.1 0.2 0.0 1.0 0.2 1.0 -0.4 0.3 0.8 -0.5 -0.5 -0.8 -0.6 1.5
370 0.7 0.1 -0.8 0.0 1.0 0.7 0.3 -0.2 0.3 0.8 0.4 0.2 -0.4 0.1 1.0371 1.6 -1.6 0.0 0.0 1.0 1.5 -1.1 1.2 0.5 0.7 -0.2 -3.3 0.0 -1.2 2.2372 1.8 -0.6 -1.2 0.0 1.0 1.5 -2.5 1.5 0.2 0.9 0.1 -3.3 0.2 -1.0 2.0373* 0.8 0.1 -0.8 0.0 1.0 0.6 -1.8 -0.1 -0.4 1.4 1.1 -0.6 1.3 0.6 0.7374 -0.4 0.2 0.3 0.0 1.0 0.2 -0.2 -0.9 -0.3 1.2 -0.3 1.4 -2.2 -0.4 1.3375 0.0 1.8 -1.7 0.0 1.0 -2.0 -1.8 -2.9 -2.2 4.7 -1.2 -2.6 2.6 -0.4 1.3
376a -0.3 1.8 -1.5 0.0 1.0 -0.1 -0.1 -1.6 -0.6 1.5 -0.7 0.0 -2.3 -1.0 2.0378 -0.1 0.1 0.0 0.0 1.0 -0.3 1.0 -0.6 0.0 1.0 0.4 0.2 -0.3 0.1 0.9379 -0.8 1.1 -0.2 0.0 1.0 -0.4 0.4 -0.5 -0.2 1.1 -0.2 1.1 -1.9 -0.3 1.3
380-3p -1.4 0.6 0.9 0.0 1.0 0.4 1.4 -0.7 0.4 0.8 -0.6 0.7 0.1 1.0381 1.6 -1.8 0.1 0.0 1.0 1.1 2.5 0.9 1.5 0.4 1.7 1.6 1.3 1.5 0.3382 0.0 0.7 -0.7 0.0 1.0 0.9 0.7 -0.8 0.3 0.8 -0.2 1.5 -0.6 0.2 0.9383 2.0 -1.2 -0.8 0.0 1.0 1.7 0.3 0.5 0.8 0.6 1.2 -0.3 0.0 0.3 0.8
409-5p -0.4 0.1 0.3 0.0 1.0 0.3 0.9 -0.6 0.2 0.9 -0.6 0.1 -0.1 -0.2 1.1422a 1.7 -0.5 -1.2 0.0 1.0 1.6 0.4 0.1 0.7 0.6 1.0 1.6 0.9 1.2 0.4422b 0.2 1.3 -1.5 0.0 1.0 0.2 0.8 -0.8 0.1 1.0 0.5 1.1 0.0 0.5 0.7423 -0.7 -0.1 0.8 0.0 1.0 0.3 0.0 0.6 0.3 0.8 -0.1 0.8 0.6 0.4 0.7424 -1.2 1.0 0.2 0.0 1.0 -0.6 2.1 -0.6 0.3 0.8 -1.0 0.9 -1.4 -0.5 1.4425 -0.6 0.7 -0.1 0.0 1.0 -0.1 0.1 -0.2 -0.1 1.0 -0.7 0.0 -1.0 -0.6 1.5429 -1.2 0.4 0.7 0.0 1.0 -2.1 0.5 -2.0 -1.2 2.3 -1.9 -0.7 0.4 -0.7 1.7432 -0.8 1.0 -0.2 0.0 1.0 -0.7 0.8 -0.8 -0.2 1.2 -0.5 0.4 -1.6 -0.6 1.5433 -0.5 0.2 0.3 0.0 1.0 -0.4 -0.3 -0.2 -0.3 1.2 -0.5 -0.1 -0.9 -0.5 1.4449 -1.5 0.0 1.5 0.0 1.0 -0.8 0.5 -1.4 -0.6 1.5 0.1 0.5 -1.2 -0.2 1.1450 -1.6 1.8 -0.2 0.0 1.0 -1.9 1.0 -0.9 -0.6 1.5 -0.6 0.6 -1.3 -0.4 1.4451 1.7 -1.0 -0.7 0.0 1.0 1.7 -2.0 -1.5 -0.6 1.5 1.7 0.8 -2.9 -0.1 1.1452 -0.2 1.3 -1.0 0.0 1.0 -0.3 0.6 -1.1 -0.3 1.2 -0.6 1.1 -0.7 -0.1 1.0
485-5p 0.1 1.0 -1.1 0.0 1.0 0.3 0.3 -1.1 -0.2 1.1 0.3 1.4 0.5 0.7 0.6489 0.1 -0.7 0.6 0.0 1.0 1.6 -0.5 0.4 0.5 0.7 -0.1 0.3 -0.7 -0.2 1.1490 1.0 0.5 -1.5 0.0 1.0 0.2 -0.6 0.6 0.1 1.0 0.7 -0.2 2.4 1.0 0.5491 -0.4 0.0 0.4 0.0 1.0 -0.3 0.2 0.0 0.0 1.0 -0.2 0.1 -0.1 -0.1 1.0494 -0.9 0.1 0.8 0.0 1.0 -0.3 0.3 0.2 0.1 1.0 0.0 -0.1 -0.5 -0.2 1.1496 -0.1 0.4 -0.3 0.0 1.0 0.2 1.6 -0.6 0.4 0.8 -0.5 0.3 0.5 0.1 0.9497 -1.2 1.0 0.2 0.0 1.0 -1.3 0.9 -0.8 -0.4 1.3 -1.0 1.0 -1.3 -0.4 1.4500 -0.9 0.4 0.5 0.0 1.0 -0.9 -0.3 -0.3 -0.5 1.4 -0.5 0.3 -0.4 -0.2 1.1501 -0.8 0.4 0.4 0.0 1.0 -0.5 0.7 0.0 0.1 1.0 -0.1 0.6 -0.1 0.1 0.9502 -0.1 1.7 -1.6 0.0 1.0 0.7 1.2 -2.0 0.0 1.0 0.4 2.0 -2.2 0.1 1.0505 -1.2 0.8 0.3 0.0 1.0 -0.8 1.4 -0.7 0.0 1.0 -0.7 0.5 -0.9 -0.4 1.3506 0.5 -0.1 -0.4 0.0 1.0 0.1 -0.2 0.9 0.3 0.8 0.8 -0.3 0.0 0.2 0.9508 0.4 -0.1 -0.3 0.0 1.0 -0.3 1.8 0.6 0.7 0.6 0.4 2.5 1.0 1.3 0.4509 -0.3 0.2 0.1 0.0 1.0 -0.4 -0.5 0.1 -0.3 1.2 1.2 1.3 -1.3 0.4 0.8510 -0.6 0.0 0.6 0.0 1.0 0.0 -1.1 -0.1 -0.4 1.3 -0.5 1.4 4.8 1.9 0.3
supplementary table 1
4
511 1.2 -0.1 -1.1 0.0 1.0 -0.6 0.5 0.2 0.0 1.0 -1.8 -1.2 1.5 -0.5 1.4512-5p -1.1 0.7 0.5 0.0 1.0 -0.1 -0.1 2.2 0.7 0.6 1.3 -0.9 -0.7 -0.1 1.1
513 0.8 -0.6 -0.2 0.0 1.0 -2.5 -0.7 -1.3 -1.5 2.8 0.7 0.0 0.4 0.4 0.8514 2.2 -1.7 -0.4 0.0 1.0 -0.7 0.7 -0.4 -0.1 1.1 -2.5 -1.5 2.0 -0.7 1.6
515-3p -0.2 2.0 -1.8 0.0 1.0 -1.3 1.4 -2.1 -0.7 1.6 -0.9 -0.6 3.4 0.6 0.6515-5p 0.8 -0.7 -0.1 0.0 1.0 -1.0 -0.8 0.5 -0.4 1.4 0.8 0.0 -1.4 -0.2 1.1516-3p -0.1 0.5 -0.4 0.0 1.0 0.4 -0.6 0.1 0.0 1.0 0.1 0.6 -0.6 0.0 1.0517a 0.8 -0.7 -0.1 0.0 1.0 0.8 -0.8 0.5 0.2 0.9 0.8 0.0 0.3 0.4 0.8517b 0.8 -0.7 -0.1 0.0 1.0 0.8 -0.8 0.5 0.2 0.9 0.8 0.0 0.3 0.4 0.8517c 1.7 0.2 -1.9 0.0 1.0 1.7 0.1 1.2 1.0 0.5 1.7 -1.4 1.2 0.5 0.7518a -1.2 0.2 1.0 0.0 1.0 1.3 -0.8 1.9 0.8 0.6 0.4 2.2 0.2 0.9 0.5518b 0.6 0.4 -1.0 0.0 1.0 0.2 0.6 0.6 0.5 0.7 1.0 0.6 1.4 1.0 0.5518c 1.7 0.2 -2.0 0.0 1.0 0.1 -0.7 -0.4 -0.3 1.3 -1.6 -0.6 1.3 -0.3 1.2518d 0.6 0.4 -1.1 0.0 1.0 0.5 0.1 1.2 0.6 0.7 2.0 0.2 1.1 1.1 0.5518e 0.2 0.9 -1.1 0.0 1.0 0.5 -0.2 0.1 0.1 0.9 0.0 -1.6 -0.1 -0.6 1.5519b 0.8 -0.7 -0.1 0.0 1.0 0.8 -0.8 0.5 0.2 0.9 0.8 0.0 0.3 0.4 0.8519c -0.5 0.4 0.1 0.0 1.0 -1.4 -2.8 -0.5 -1.6 3.0 1.9 0.7 -1.5 0.4 0.8519d 0.4 -0.3 -0.1 0.0 1.0 0.3 0.7 -0.4 0.2 0.9 -0.3 -0.7 -0.1 -0.4 1.3519e 0.3 0.3 -0.6 0.0 1.0 -0.7 0.2 0.5 0.0 1.0 0.9 1.0 1.6 1.2 0.4520a 0.9 1.0 -1.9 0.0 1.0 -0.8 -0.5 -0.3 -0.5 1.4 2.5 -0.9 -0.3 0.4 0.7520b -0.4 0.6 -0.3 0.0 1.0 -1.7 -2.8 -1.4 -2.0 3.9 -0.8 -2.1 -1.4 -1.4 2.7520c -0.5 0.2 0.3 0.0 1.0 -2.1 0.1 0.5 -0.5 1.4 -1.5 0.1 -1.6 -1.0 2.0520d 1.2 0.3 -1.5 0.0 1.0 0.6 -0.4 0.7 0.3 0.8 1.3 0.3 0.2 0.6 0.7520e 0.8 -0.7 -0.1 0.0 1.0 0.8 -0.8 0.5 0.2 0.9 0.8 0.0 0.3 0.4 0.8520f 0.5 -0.4 -0.1 0.0 1.0 0.0 -0.1 -0.2 -0.1 1.1 0.7 1.0 2.6 1.4 0.4520g 0.8 -0.7 -0.1 0.0 1.0 -1.9 -0.7 0.5 -0.7 1.6 -0.5 0.0 0.3 -0.1 1.0520h 0.4 -0.1 -0.2 0.0 1.0 0.3 -1.6 -0.9 -0.7 1.7 1.4 -0.9 0.9 0.5 0.7521 0.0 -0.6 0.6 0.0 1.0 0.3 0.2 0.5 0.3 0.8 1.7 -0.8 1.2 0.7 0.6522 0.8 -0.7 -0.1 0.0 1.0 0.8 -0.8 0.5 0.2 0.9 0.8 0.0 0.3 0.4 0.8523 -0.3 0.5 -0.2 0.0 1.0 -0.5 -0.1 -0.1 -0.2 1.2 -0.4 1.2 1.0 0.6 0.7
526a -0.2 0.4 -0.1 0.0 1.0 1.8 0.3 1.6 1.2 0.4 1.5 -1.5 1.4 0.5 0.7526b 0.8 -0.6 -0.2 0.0 1.0 0.8 -0.7 -1.0 -0.3 1.2 0.9 -1.8 0.4 -0.2 1.1
let-7-a -0.3 0.4 -0.1 0.0 1.0 0.4 0.4 -0.9 0.0 1.0 -0.1 0.5 -1.0 -0.2 1.1let-7-b -0.5 0.8 -0.3 0.0 1.0 -0.1 0.1 -0.4 -0.1 1.1 -0.5 0.2 -0.8 -0.4 1.3let-7-c -0.2 0.8 -0.6 0.0 1.0 0.1 1.4 -0.5 0.3 0.8 -0.1 1.7 -0.1 0.5 0.7let-7-d -0.4 0.2 0.2 0.0 1.0 0.2 0.5 -0.2 0.2 0.9 -0.2 1.6 0.4 0.6 0.7let-7-e -0.5 1.0 -0.4 0.0 1.0 1.1 0.1 -1.2 0.0 1.0 0.9 0.4 -0.5 0.3 0.8let-7-f -1.6 1.4 0.2 0.0 1.0 -0.8 1.8 -1.4 -0.1 1.1 -1.0 2.0 -2.4 -0.5 1.4let-7-g -1.3 0.9 0.4 0.0 1.0 -1.0 1.4 -1.1 -0.2 1.2 -0.7 1.7 -1.5 -0.2 1.1let-7-i -1.2 1.4 -0.2 0.0 1.0 -1.2 0.9 -0.5 -0.3 1.2 0.7 1.4 -1.0 0.4 0.8
supplementary table 1
5