What is Lean Six Sigma - ADDVALUE - Nilesh Arora
29
Best Performing Consulting Organization by “Six Sigma (6σ)” Adding Value In Totality !!
-
Upload
nilesh-arora -
Category
Documents
-
view
19 -
download
7
description
Know the history of lean six sigma by Nilesh Arora, a founder of AddValue Consulting Inc. He explained What is six sigma and how six sigma process follows?
Transcript of What is Lean Six Sigma - ADDVALUE - Nilesh Arora
Best Performing Consulting Organization
by
“Six Sigma (6σ)”
Adding Value In Totality !!
History of Six Sigma (6σ)
• In 1986 Bill smith, Seniors Engineer and scientist introduces concept of Six Sigma
• Bill smith Known as “ Father of Six Sigma”
• In 1995, Jack Welch introduced Six Sigma at GE
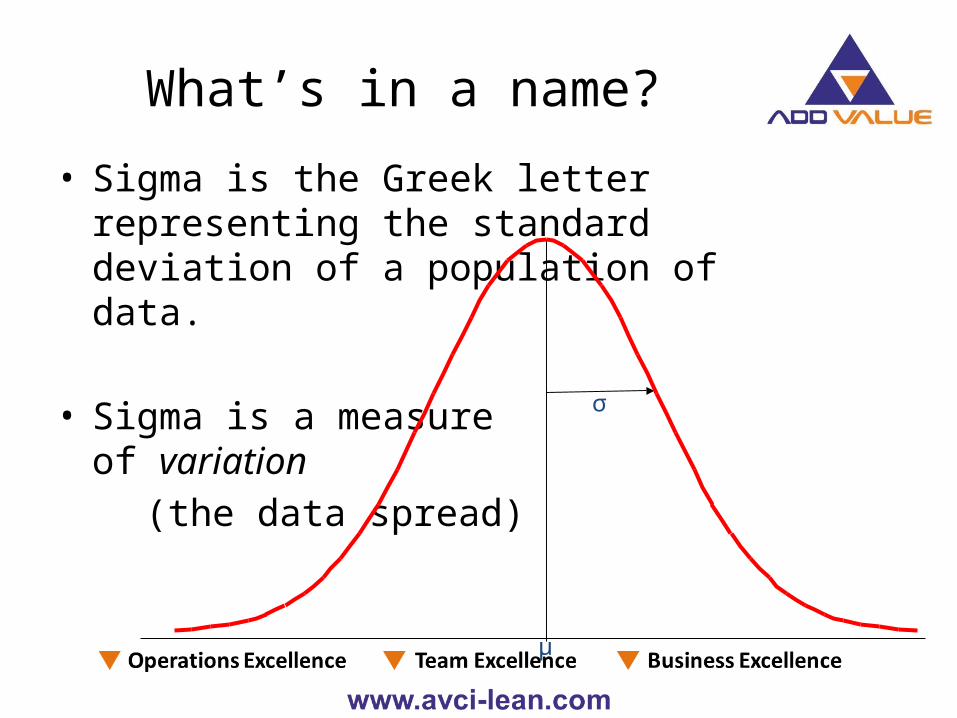
μ
σ
What’s in a name?
• Sigma is the Greek letter representing the standard deviation of a population of data.
• Sigma is a measureof variation
(the data spread)
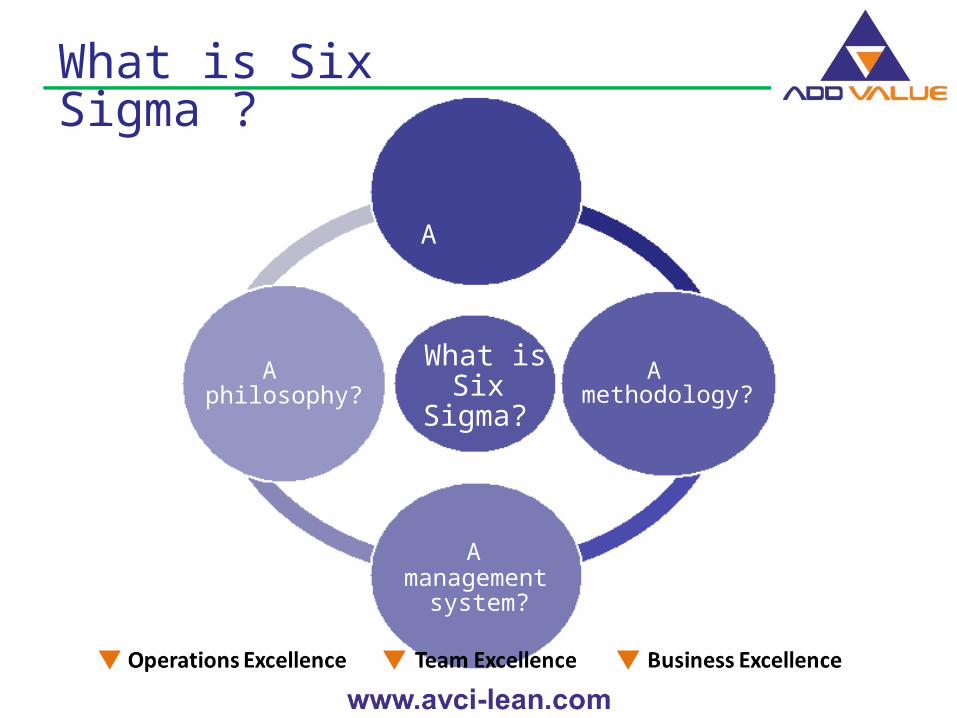
What is Six Sigma ?
A metric?
Amethodology?
What isSix
Sigma?
Amanagement
system?
Aphilosophy?
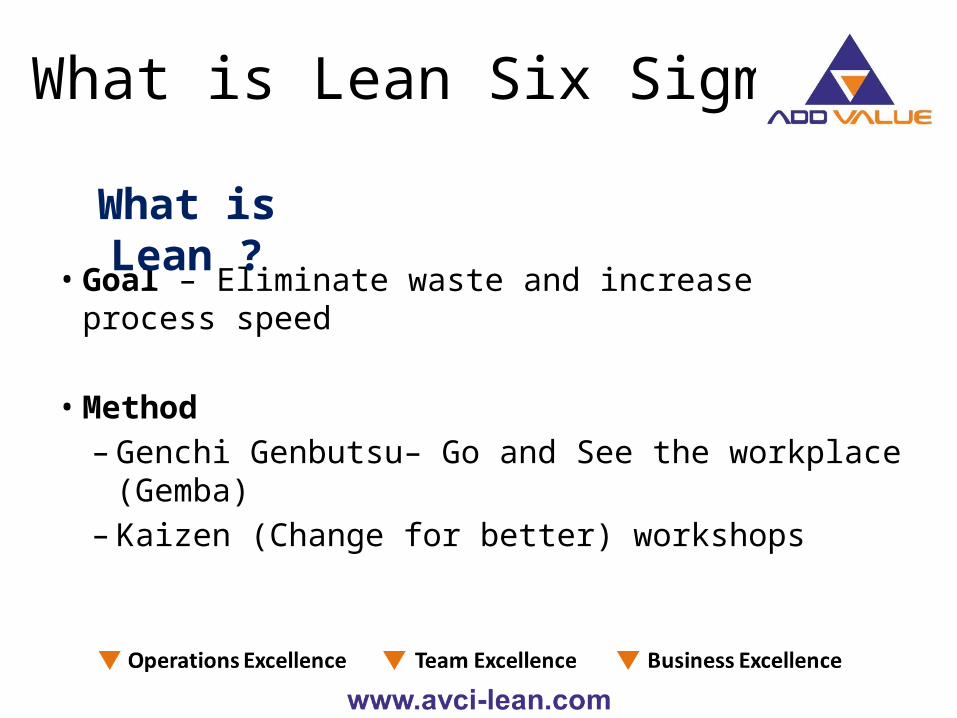
What is Lean Six Sigma?
• Goal – Eliminate waste and increase process speed
• Method – Genchi Genbutsu– Go and See the workplace (Gemba)– Kaizen (Change for better) workshops
What is Lean ?
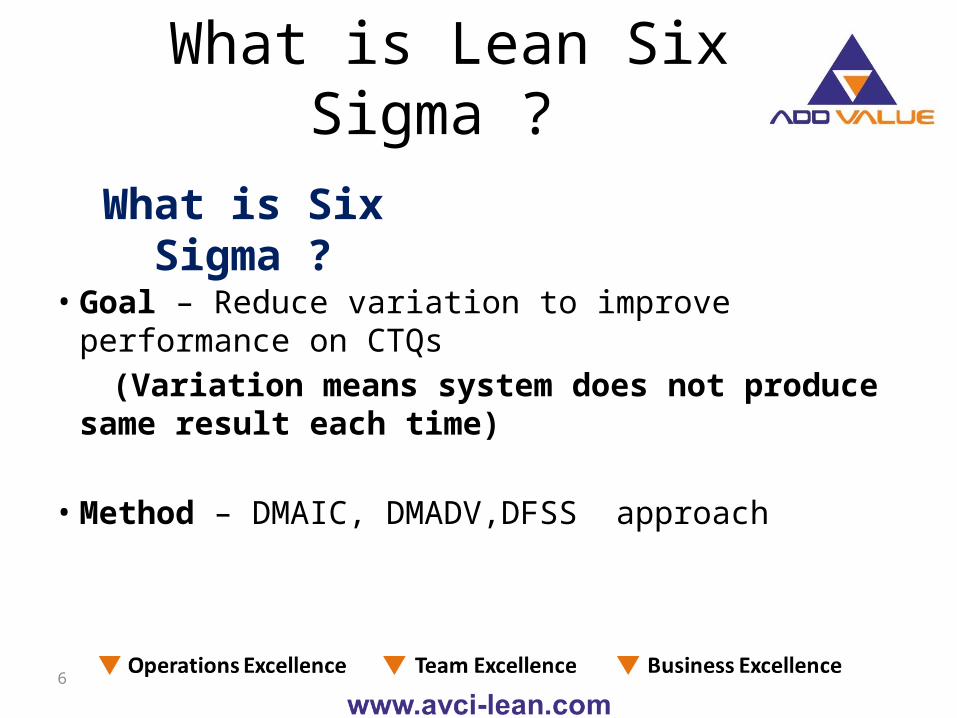
What is Lean Six Sigma ?
• Goal – Reduce variation to improve performance on CTQs (Variation means system does not produce same result each
time)
• Method – DMAIC, DMADV,DFSS approach
6
What is Six Sigma ?
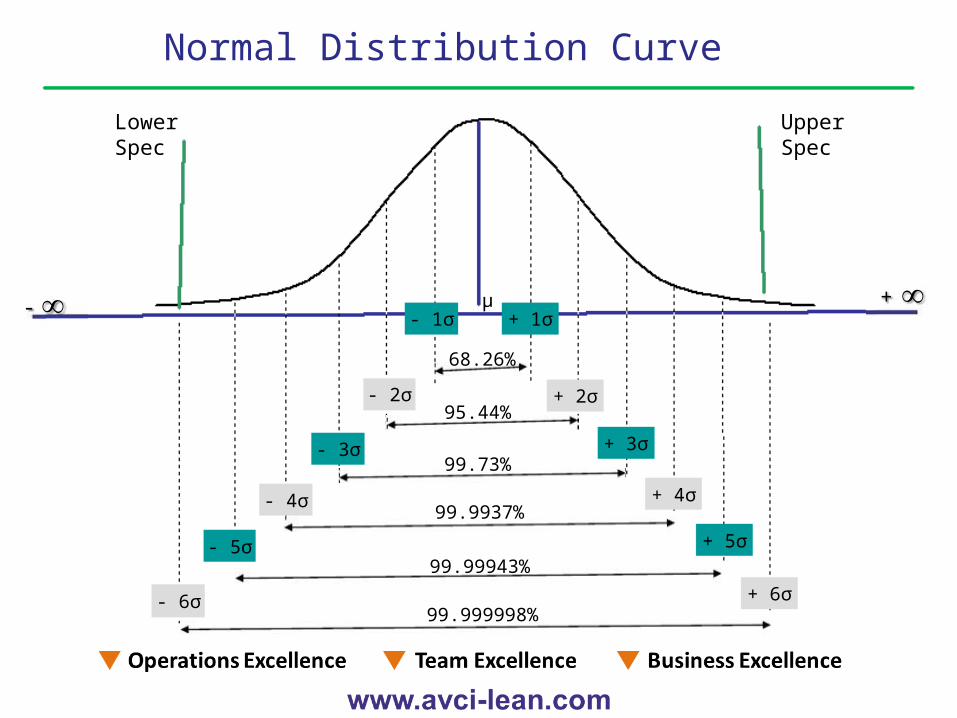
Normal Distribution Curve
µ + - - 1σ + 1σ
- 2σ + 2σ
68.26%
- 3σ + 3σ
+ 4σ
- 5σ
95.44%
99.73%
99.9937%
99.99943%+ 5σ
- 6σ + 6σ99.999998%
- 4σ
LowerSpec
UpperSpec
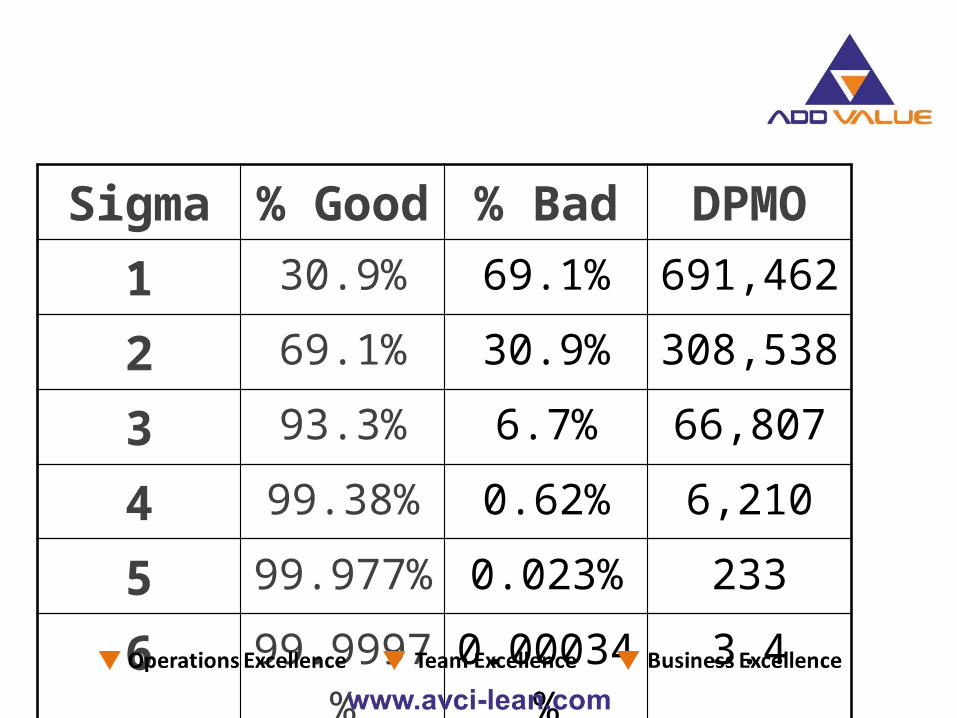
Sigma % Good % Bad DPMO1 30.9% 69.1% 691,462
2 69.1% 30.9% 308,538
3 93.3% 6.7% 66,807
4 99.38% 0.62% 6,210
5 99.977% 0.023% 233
6 99.9997% 0.00034% 3.4
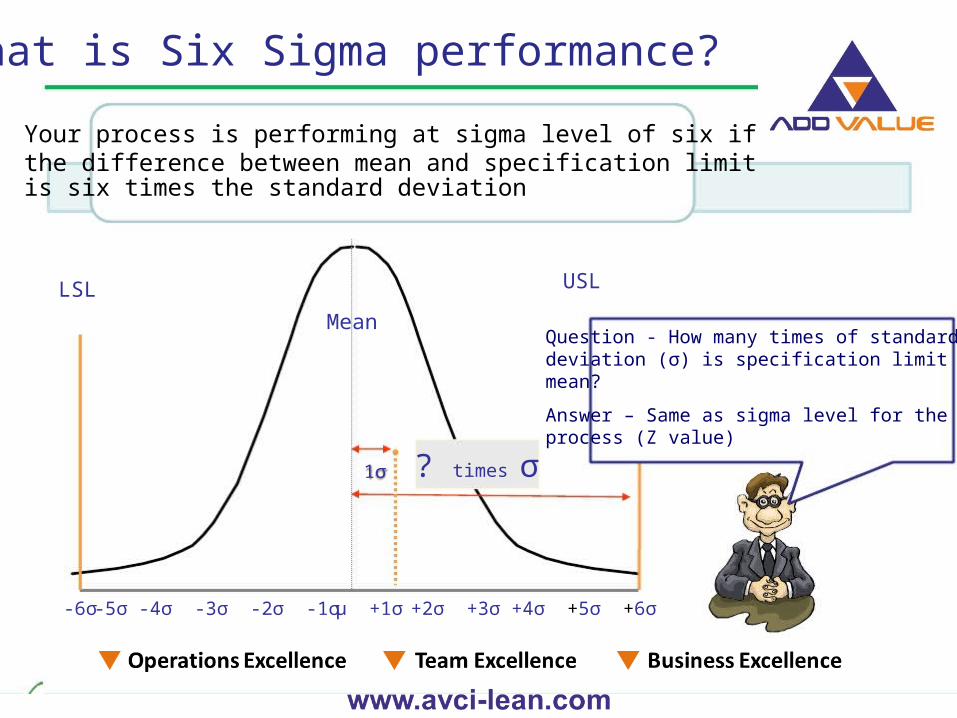
-6σ -5σ -4σ -3σ -2σ -1σ μ +1σ +2σ +3σ +4σ +5σ +6σ
? times σ
LSL
Mean
1σ
USL
Question - How many times of standarddeviation (σ) is specification limit tomean?
Answer – Same as sigma level for theprocess (Z value)
What is Six Sigma performance?
Your process is performing at sigma level of six ifthe difference between mean and specification limitis six times the standard deviation
Is it feasible to eliminate the inspection of Y, if X’s are controlled well?
•
•
•
•
•
•
•
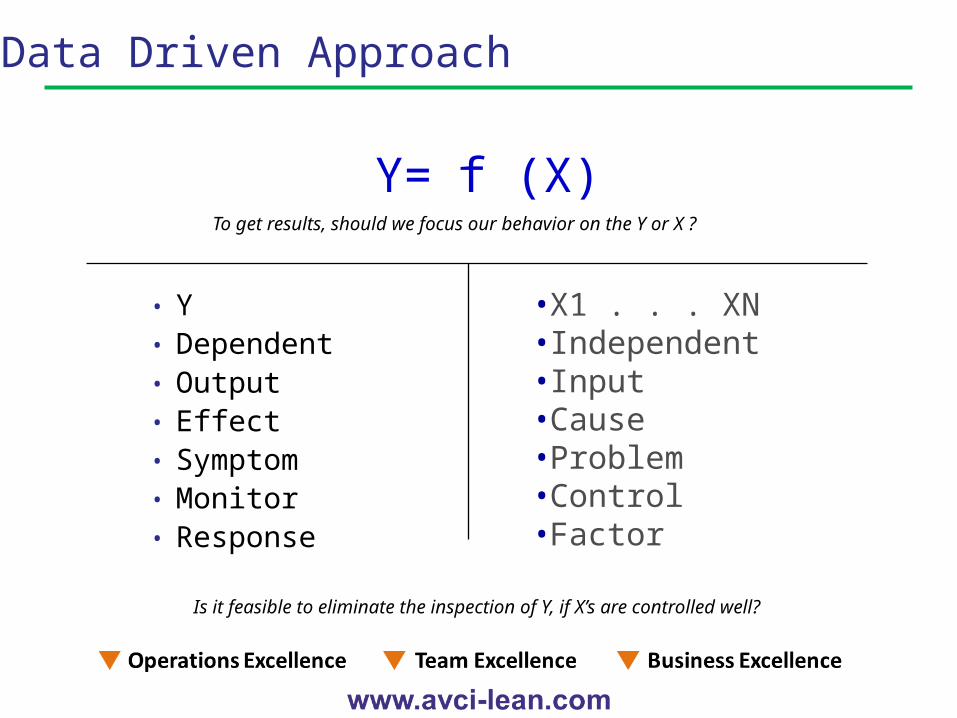
YDependentOutputEffectSymptomMonitorResponse
•••••••
X1 . . . XNIndependentInputCauseProblemControlFactor
To get results, should we focus our behavior on the Y or X ?
f (X)Y=
Data Driven Approach
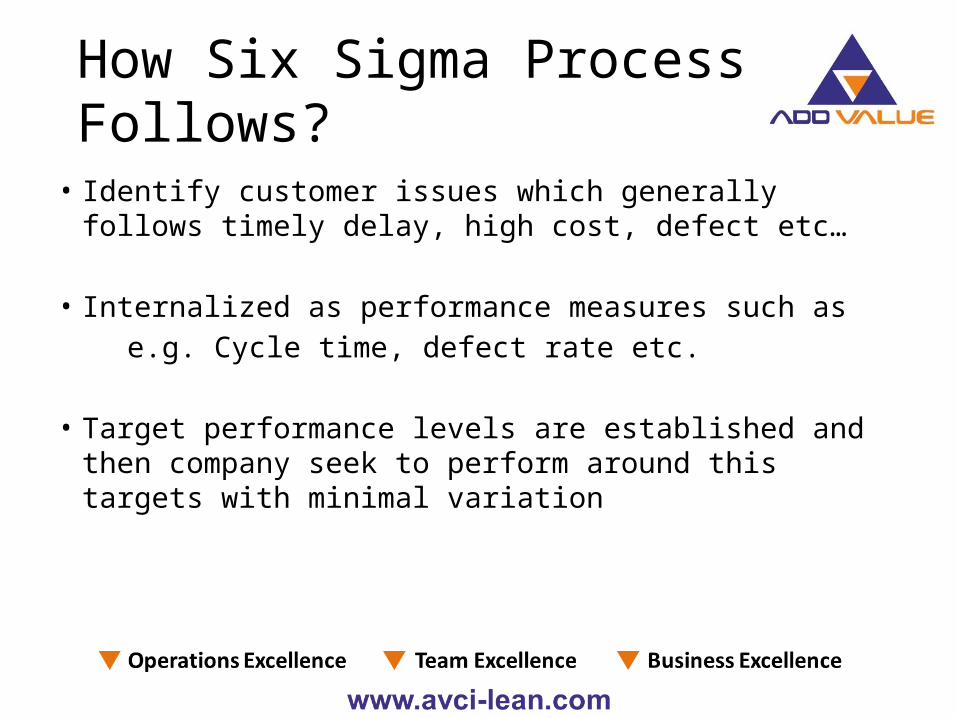
How Six Sigma Process Follows?
• Identify customer issues which generally follows timely delay, high cost, defect etc…
• Internalized as performance measures such as e.g. Cycle time, defect rate etc.
• Target performance levels are established and then company seek to perform around this targets with minimal variation
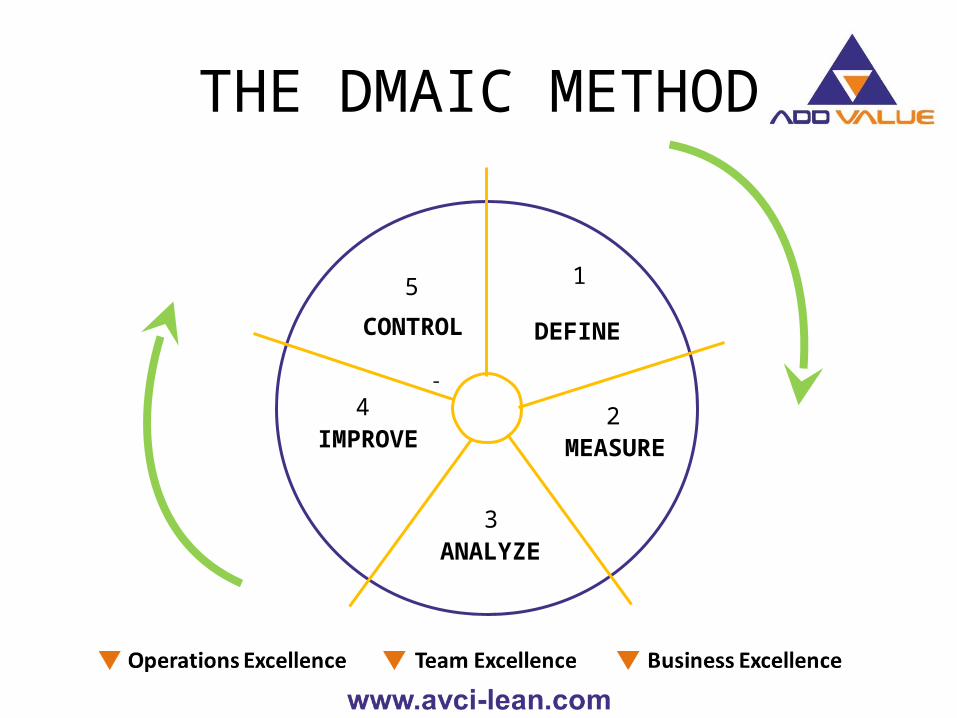
THE DMAIC METHOD
IMPROVE
CONTROL
MEASURE
ANALYZE
5
2
3
4
DEFINE
1
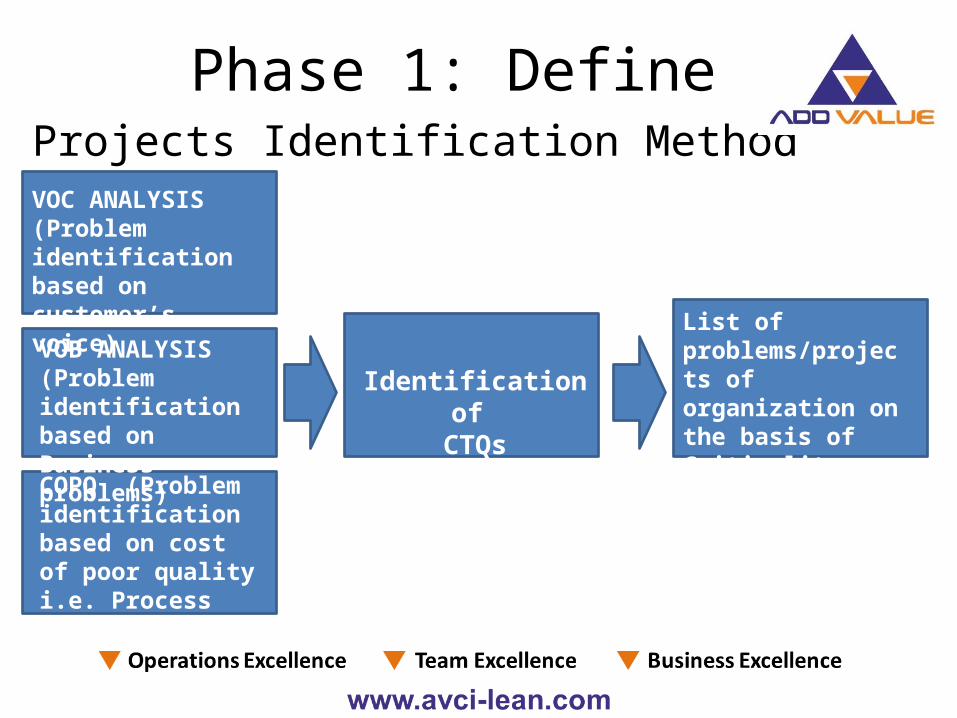
Projects Identification MethodVOC ANALYSIS (Problem identification based on customer’s voice)
VOB ANALYSIS (Problem identification based on Business problems)
COPQ (Problem identification based on cost of poor quality i.e. Process Defects )
Identification of CTQs
List of problems/projects of organization on the basis of Criticality, Out come , Time line
Phase 1: Define
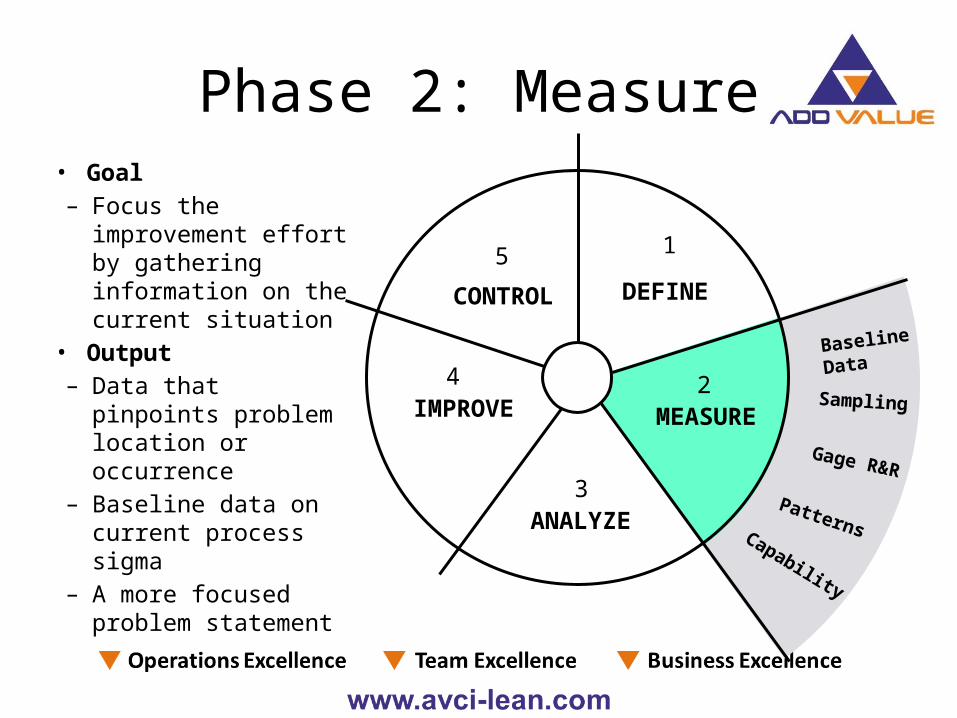
Phase 2: Measure• Goal– Focus the
improvement effort by gathering information on the current situation
• Output– Data that pinpoints
problem location or occurrence
– Baseline data on current process sigma
– A more focused problem statement
Baseline
Data
Sampling
Gage R&R
PatternsCapability
IMPROVE
CONTROL
ANALYZE
5
3
4
DEFINE
1
MEASURE2
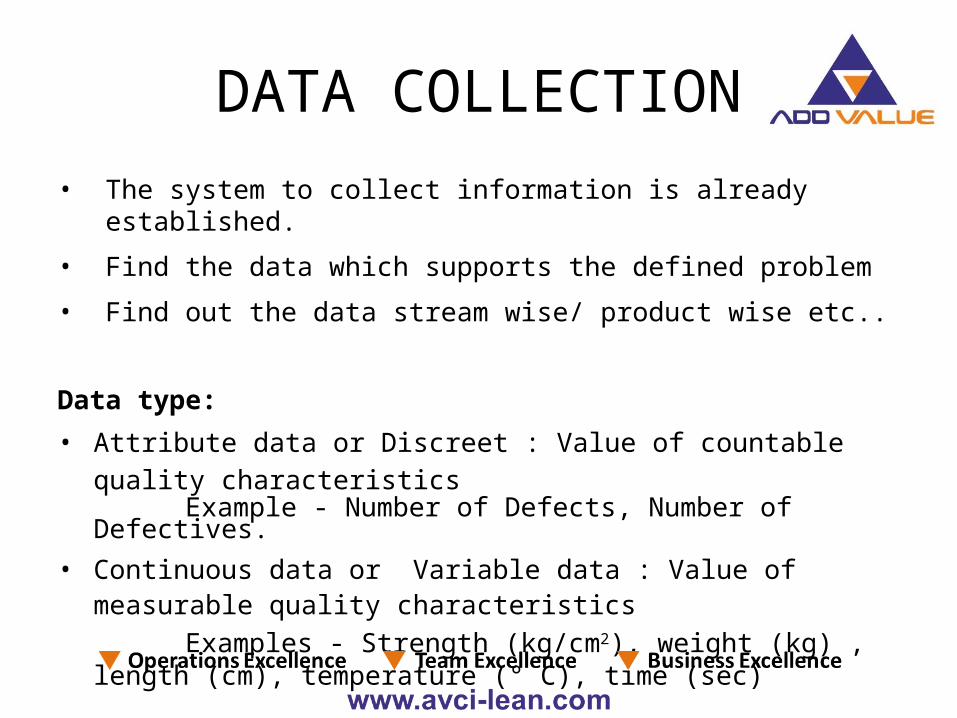
DATA COLLECTION• The system to collect information is already established.
• Find the data which supports the defined problem
• Find out the data stream wise/ product wise etc..
Data type:
• Attribute data or Discreet : Value of countable quality characteristics Example - Number of Defects, Number of Defectives.• Continuous data or Variable data : Value of measurable quality
characteristics Examples - Strength (kg/cm2), weight (kg) , length (cm), temperature (° C),
time (sec)
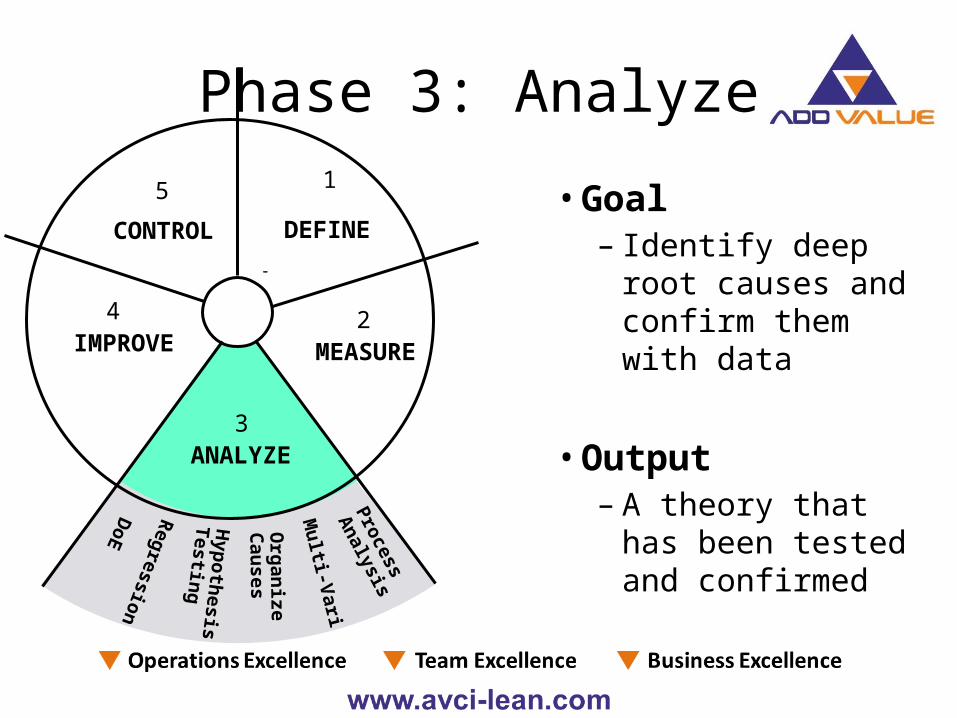
Phase 3: Analyze
IMPROVE
CONTROL
MEASURE
ANALYZE
5
2
3
4
DEFINE
1
Process
Analysis
Multi-Vari
Organize
Causes
Hypothesis
Testing
RegressionDoE
• Goal– Identify deep root
causes and confirm them with data
• Output– A theory that has
been tested and confirmed
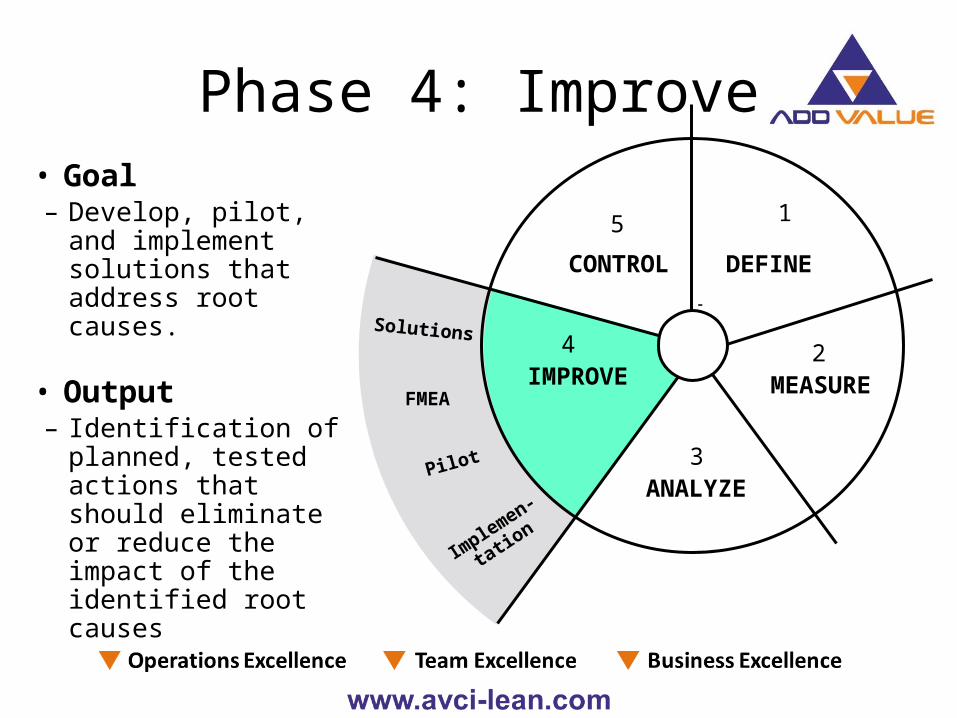
Phase 4: Improve• Goal– Develop, pilot, and
implement solutions that address root causes.
• Output– Identification of
planned, tested actions that should eliminate or reduce the impact of the identified root causes
CONTROL
MEASURE
ANALYZE
5
2
3
DEFINE
1
Solutions
FMEA
Pilot
Implemen-
tation
IMPROVE4
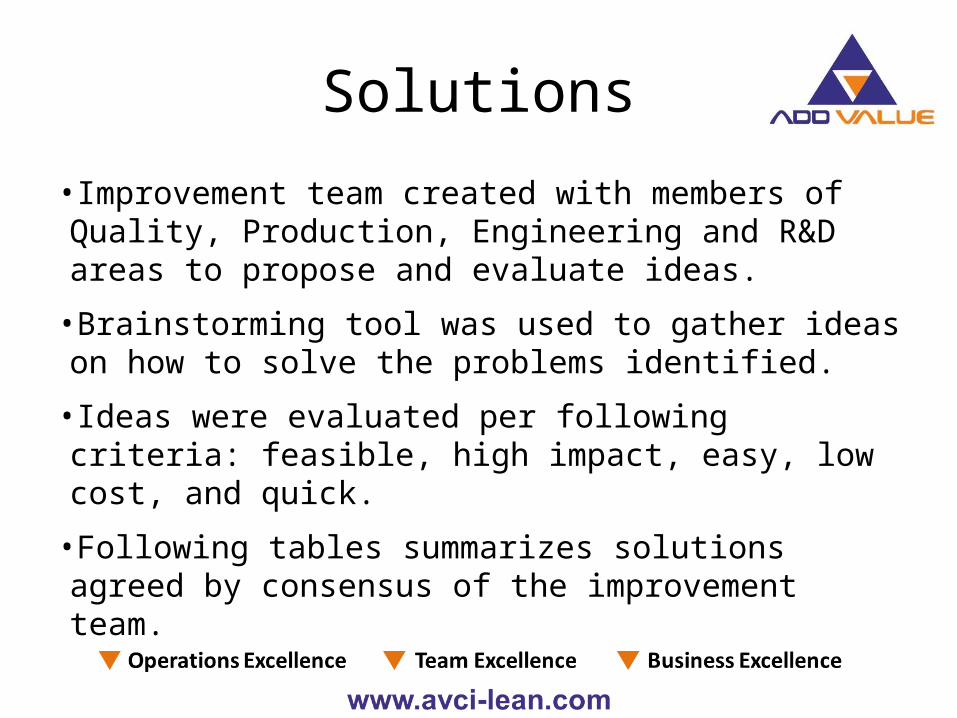
Solutions
•Improvement team created with members of Quality, Production, Engineering and R&D areas to propose and evaluate ideas.
•Brainstorming tool was used to gather ideas on how to solve the problems identified.
•Ideas were evaluated per following criteria: feasible, high impact, easy, low cost, and quick.
•Following tables summarizes solutions agreed by consensus of the improvement team.
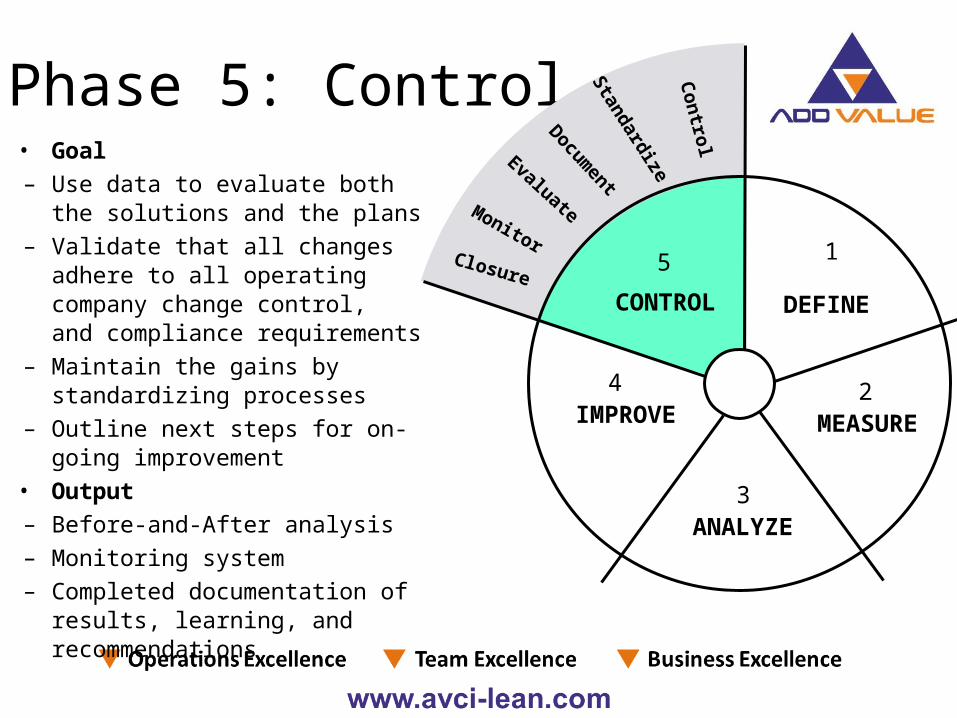
Phase 5: Control• Goal– Use data to evaluate both the
solutions and the plans– Validate that all changes adhere to all
operating company change control, and compliance requirements
– Maintain the gains by standardizing processes
– Outline next steps for on-going improvement
• Output– Before-and-After analysis– Monitoring system– Completed documentation of results,
learning, and recommendations
IMPROVE
CONTROL
MEASURE
ANALYZE
5
2
3
4
DEFINE
1Control
Standardize
Document
Monitor
Evaluate
Closure
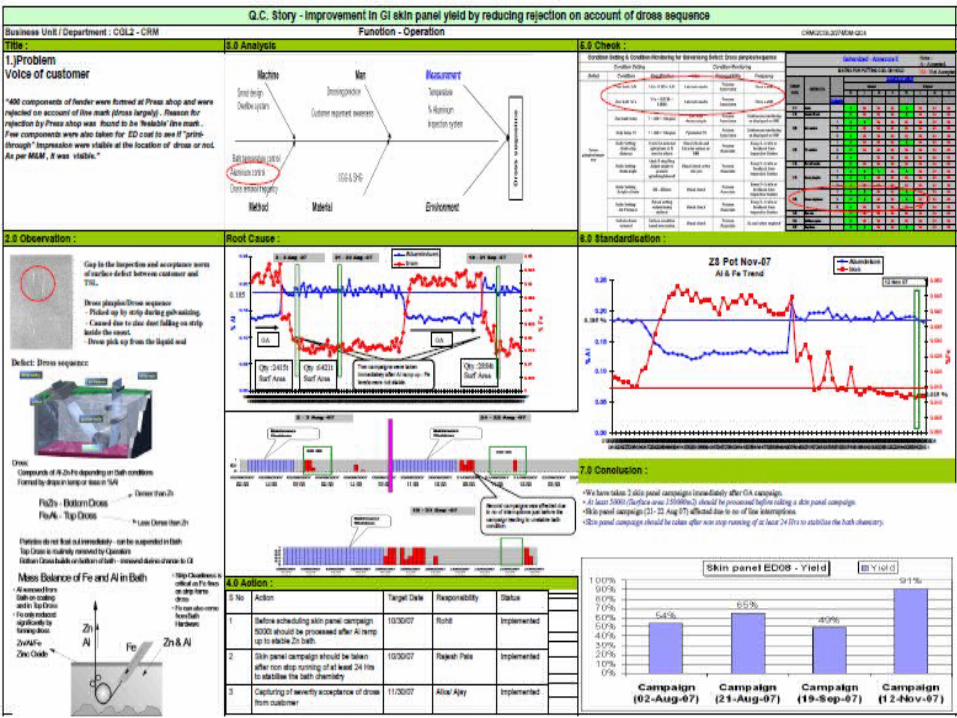
Q.C STORY BOARD
• Q.C Story board is representation of all steps taken from identification to solution and reviewable of taken probable solutions
• Clear problem identification is the most imp part of Q.C Story Board
• Different dept people needs to be involved in a whole process to have fresh ideas
PARETO ANALYSIS
• Known as 80-20 Rule • Used for identification of Major problems• To find out 20% problems which causes 80%
rejection
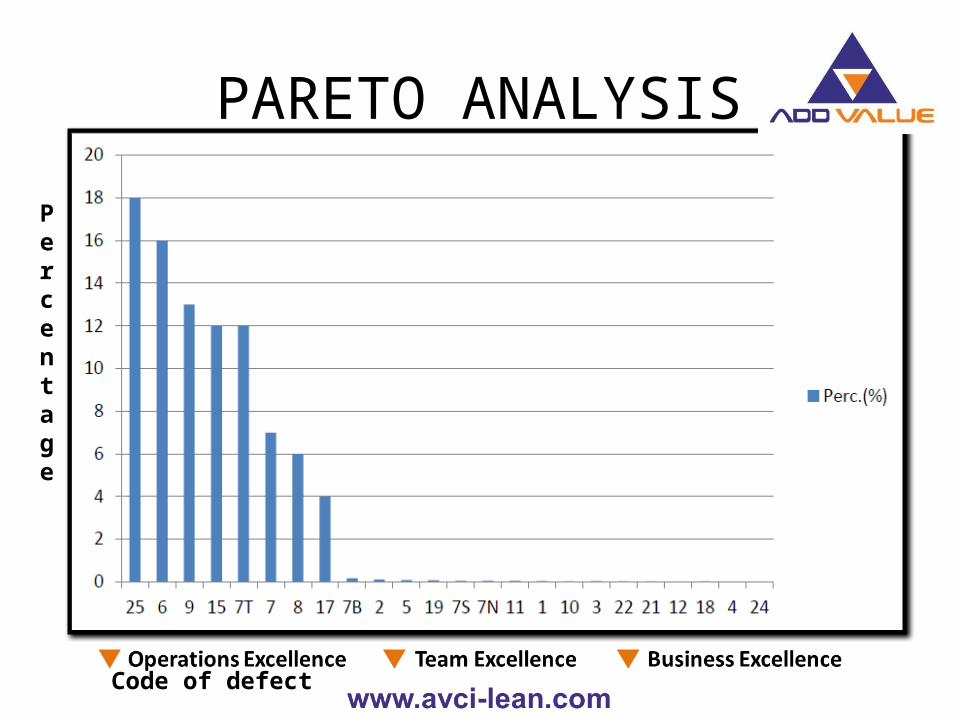
PARETO ANALYSIS
Code of defect
Percentage
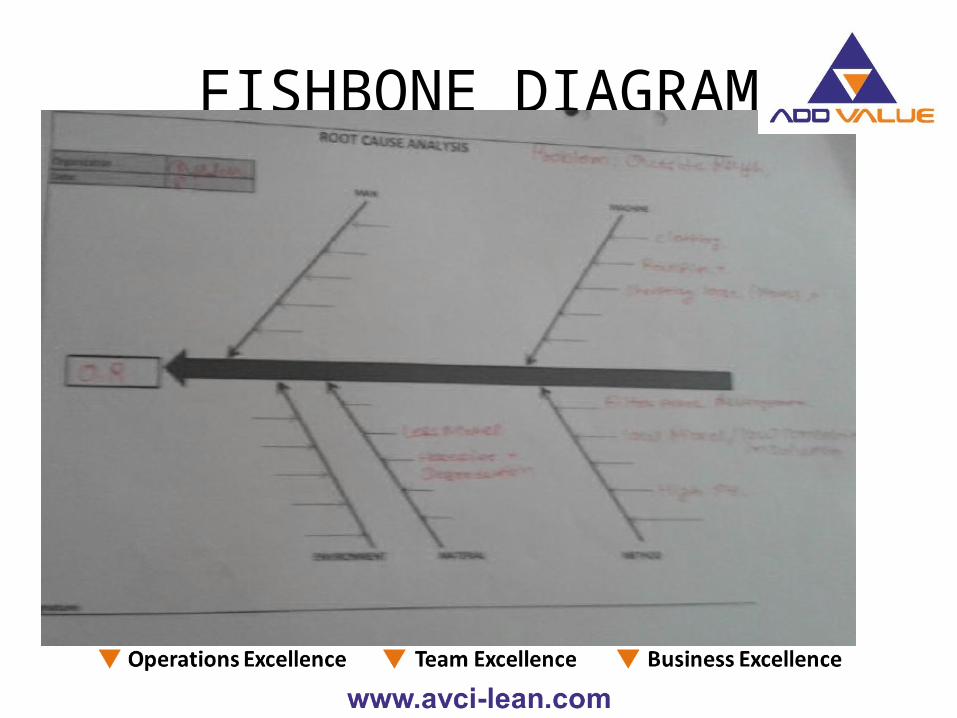
FISHBONE DIAGRAM
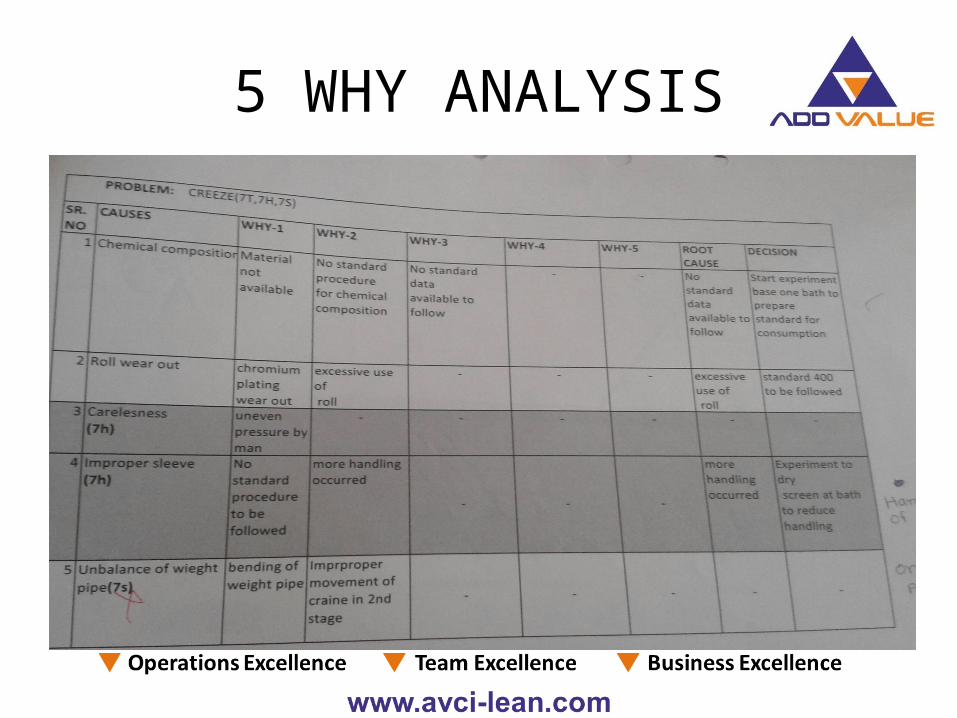
5 WHY ANALYSIS
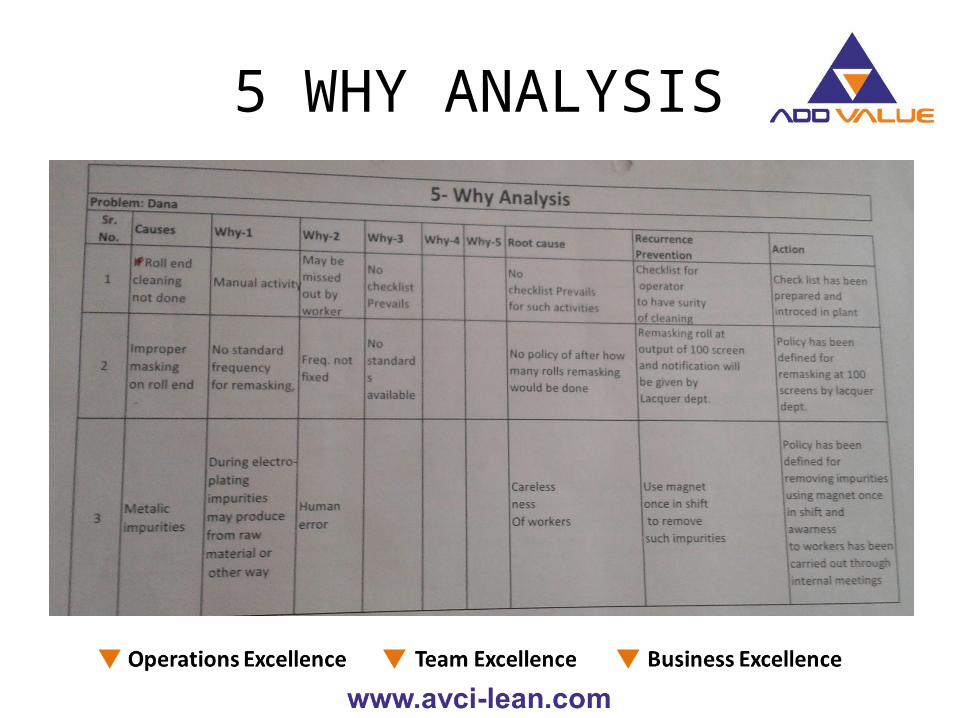
5 WHY ANALYSIS
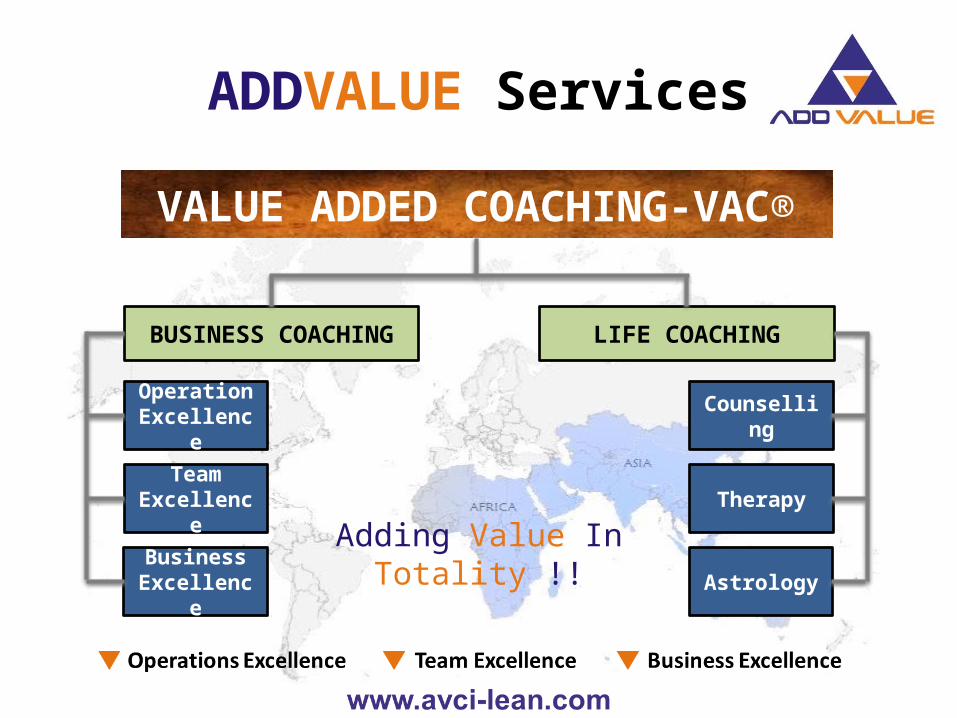
ADDVALUE Services
VALUE ADDED COACHING-VAC®
BUSINESS COACHING
LIFE COACHING
OperationExcellenc
e
TeamExcellenc
e
BusinessExcellenc
e
Counselling
Therapy
Astrology
Adding Value In Totality !!
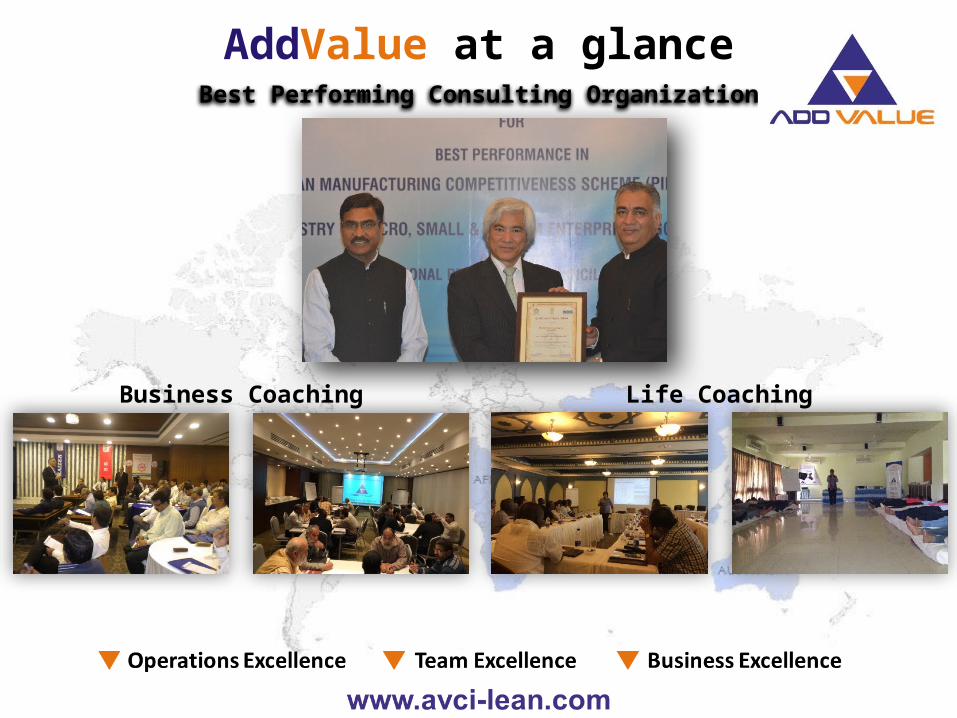
Best Performing Consulting Organization
AddValue at a glance
Business Coaching Life Coaching
Thank You