Lean Systems and Six-Sigma Quality - Αρχικήmba.teipir.gr/files/Chapter_10.pdf · •...
55
Chapter 10 Lean Systems and Six-Sigma Quality 10-1
-
Upload
duongquynh -
Category
Documents
-
view
218 -
download
5
Transcript of Lean Systems and Six-Sigma Quality - Αρχικήmba.teipir.gr/files/Chapter_10.pdf · •...
Chapter 10
Lean Systems andLean Systems and
Six-Sigma Quality
10-1

Lecture Outline
• What is Lean?
• Lean Production
• Respect for People
10-2
• Respect for People
• Total Quality Management (TQM)
• Statistical Quality Control (SQC)
• Six-Sigma Quality
• Lean Six-Sigma Supply Chain

What is Lean?
Lean is a management approach forcreating value for the end customerthrough the most efficient utilizationresources possible
10-3
•Standard in many industries
•Often results in:
– large cost reductions
– improved quality
– increased customer service
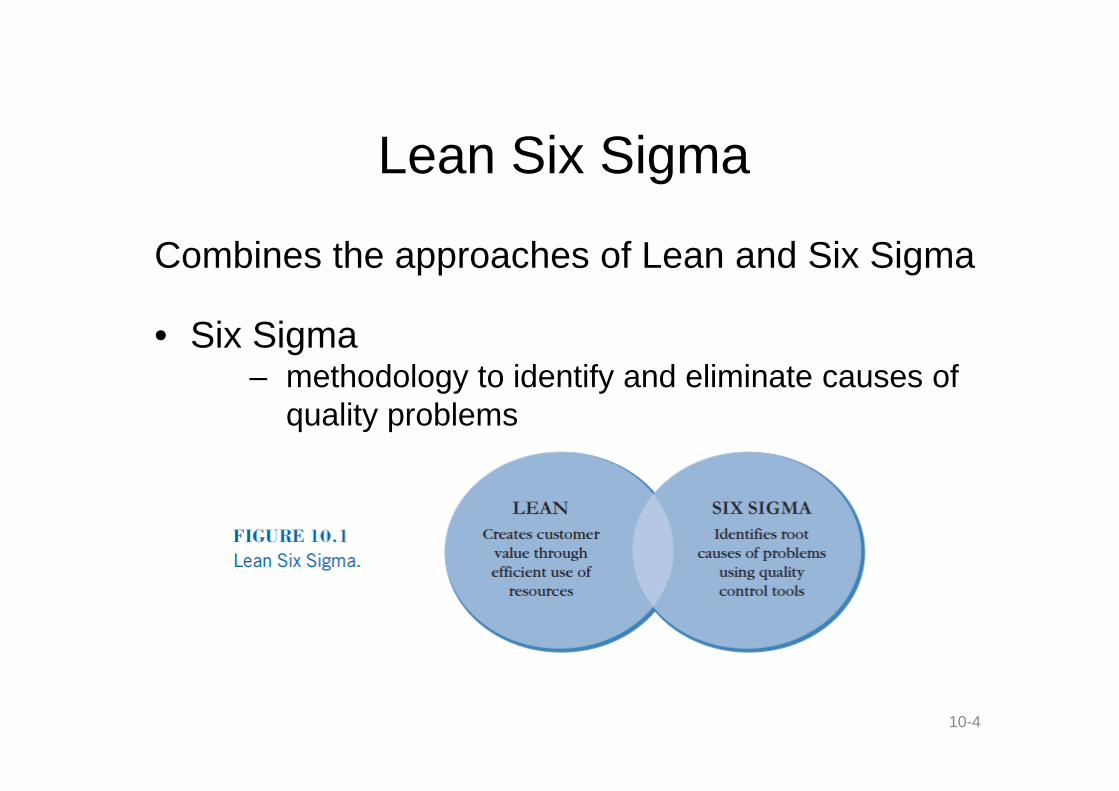
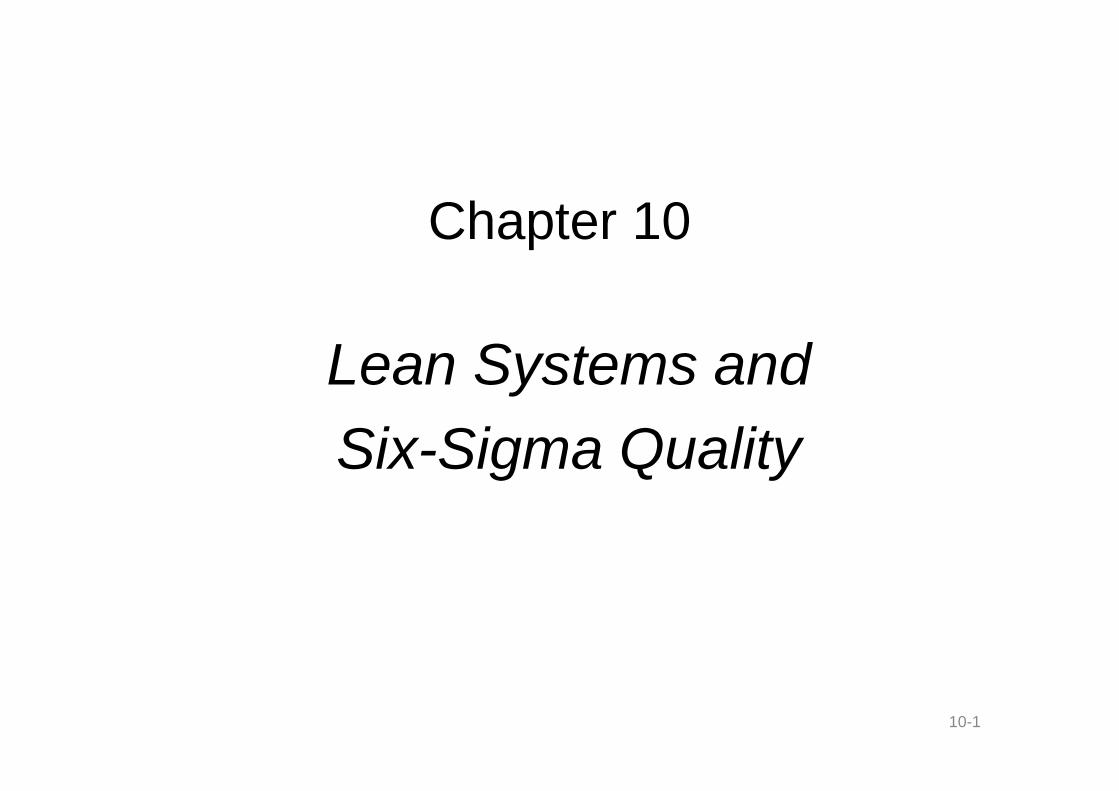
Lean Six Sigma
Combines the approaches of Lean and Six Sigma
• Six Sigma– methodology to identify and eliminate causes of
quality problems
10-4
Tenets of Lean
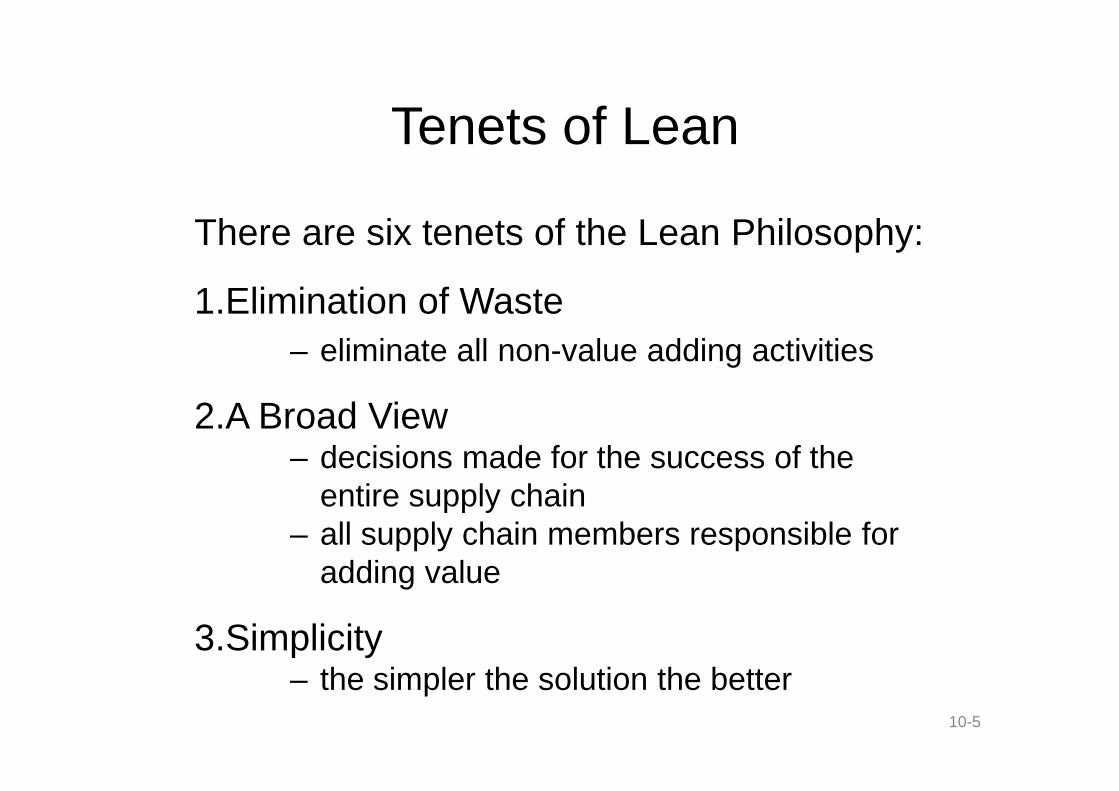
There are six tenets of the Lean Philosophy:
1.Elimination of Waste
– eliminate all non-value adding activities
2.A Broad View2.A Broad View– decisions made for the success of the
entire supply chain– all supply chain members responsible for
adding value
3.Simplicity– the simpler the solution the better
10-5
Tenets of Lean Continued
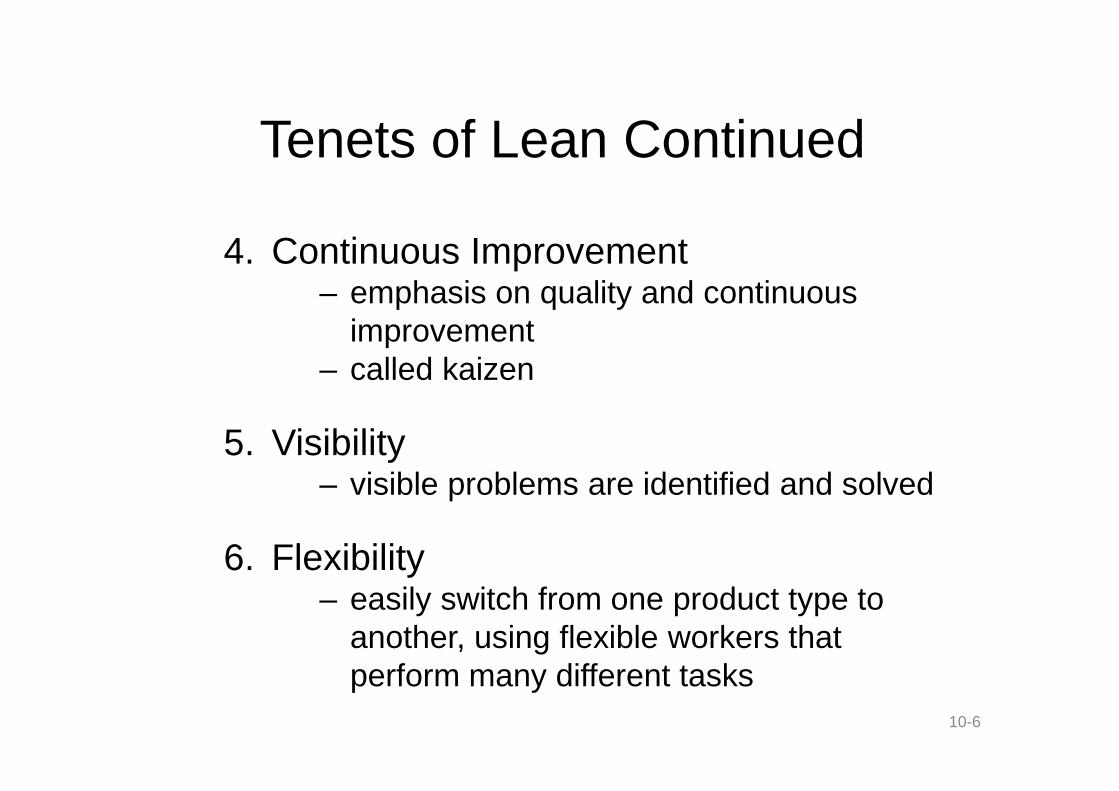
4. Continuous Improvement– emphasis on quality and continuous
improvement– called kaizen
5. Visibility– visible problems are identified and solved
6. Flexibility– easily switch from one product type to
another, using flexible workers thatperform many different tasks
10-6

Elements of Lean
Lean is composed of three elements thatwork in unison:
•Lean Production
•Total Quality Management (TQM)
•Respect for People
10-7

Elements of Lean
10-8
Lean Production
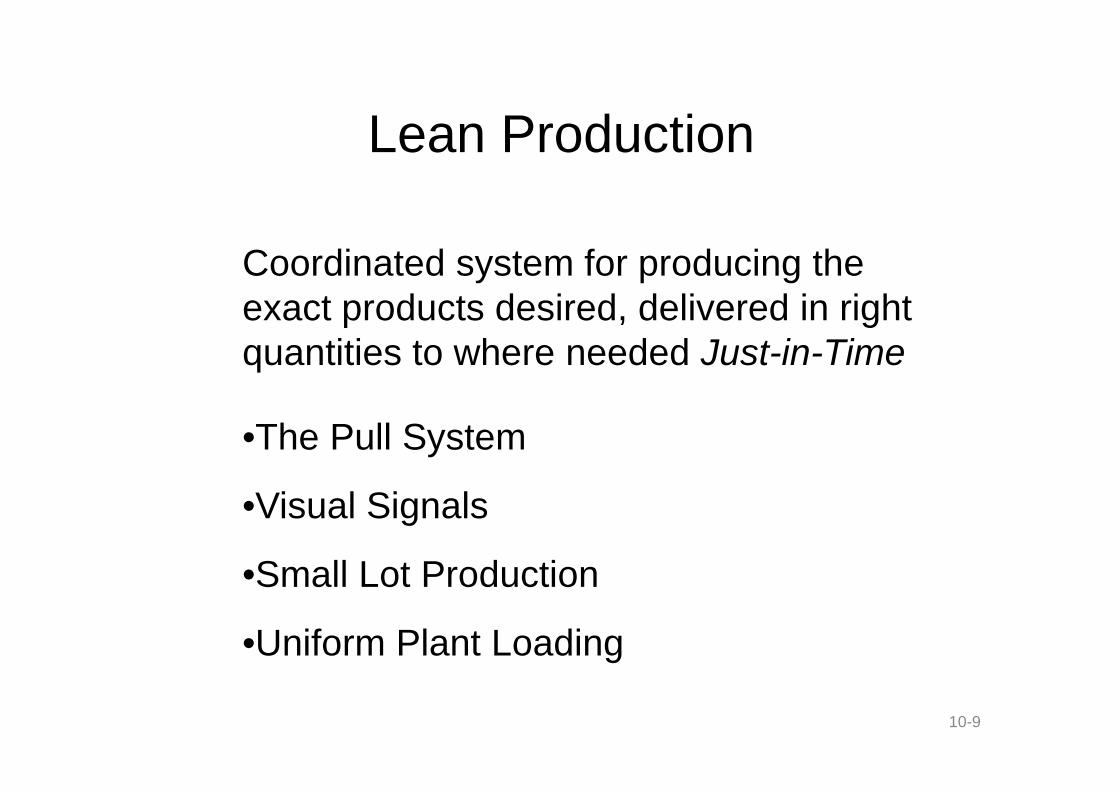
Coordinated system for producing theexact products desired, delivered in rightquantities to where needed Just-in-Time
•The Pull System
•Visual Signals
•Small Lot Production
•Uniform Plant Loading
10-9
The Pull System
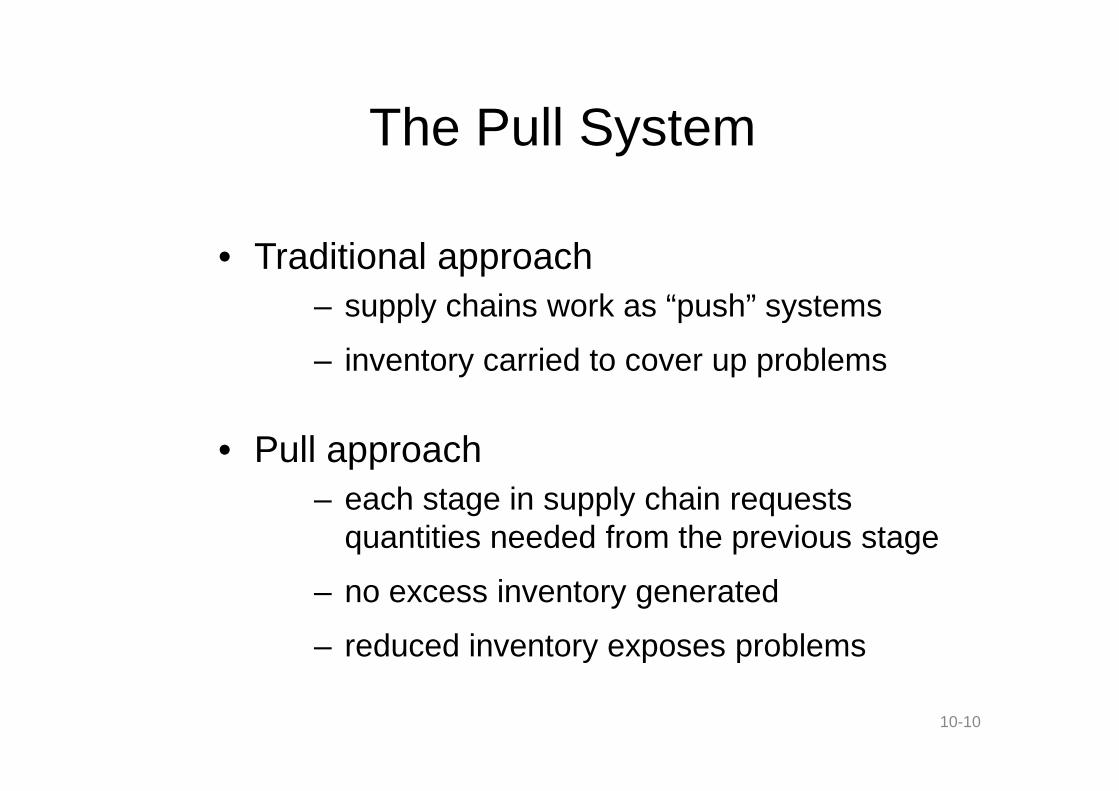
• Traditional approach
– supply chains work as “push” systems
– inventory carried to cover up problems
• Pull approach
– each stage in supply chain requestsquantities needed from the previous stage
– no excess inventory generated
– reduced inventory exposes problems
10-10
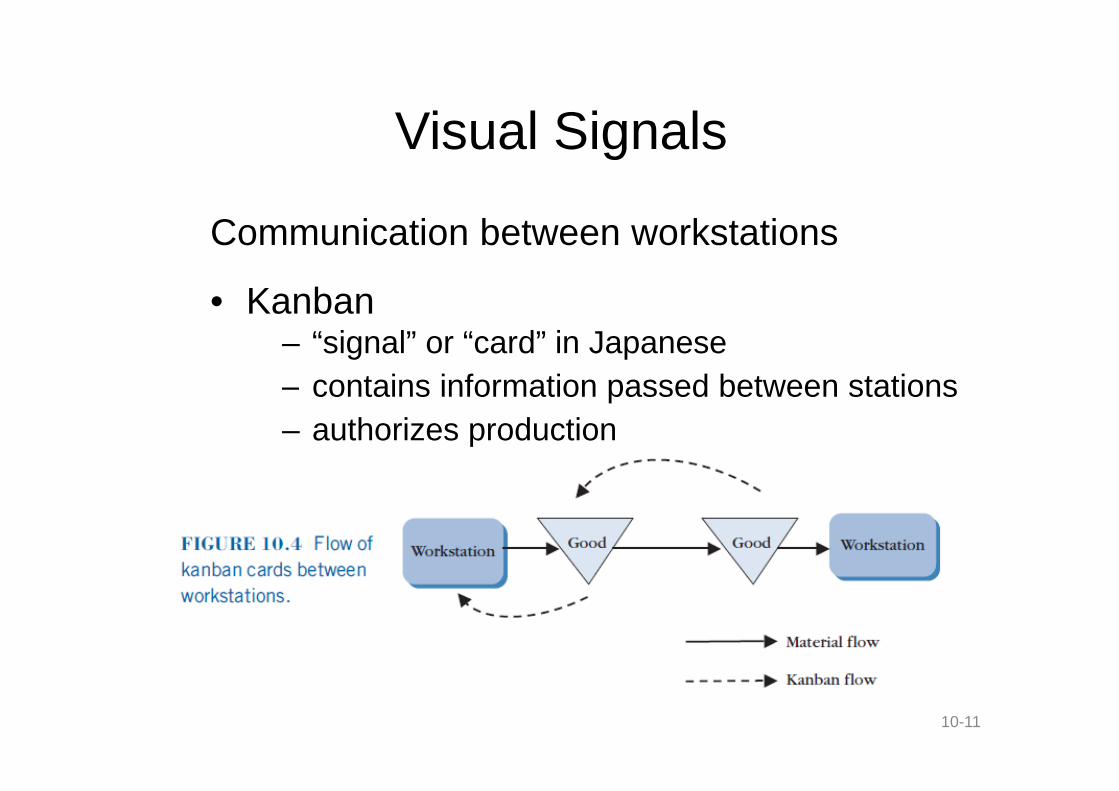
Visual Signals
Communication between workstations
• Kanban– “signal” or “card” in Japanese
– contains information passed between stations– contains information passed between stations
– authorizes production
10-11

Visual Signals
10-12
Small Lot Production
The amount of products produced at anyone time is small
– reduces inventory and excess processing– reduces inventory and excess processing
– increases flexibility
– shortens manufacturing lead time
– responds to customer demands morequickly
– setup time must be low
10-13
Uniform Plant Loading
• Problem
– demand changes are magnified throughout thesupply chain
– contributes to inefficiency and waste
• Uniform Plant Loading
– production schedule is frozen for the month
– also called “leveling”
– helps suppliers better plan own production
10-14
Respect for People
Respect for all people must exist for anorganization to be its best
–flatter hierarchy than traditional organizations
–ordinary workers given great responsibility–ordinary workers given great responsibility
–supply chain members work together in crossfunctional teams
• Look at Role of:–workers, management, and suppliers
10-15
Role of Workers
Workers have the ability to perform manydifferent tasks and are actively engaged inpursuing company goals
•Worker Duties•Worker Duties
– improve production process
– monitor quality
– correct quality problems
•Work in Teams
– quality circles
10-16
Role of Management
Create the cultural change in theorganization needed for Lean to succeed
– provide atmosphere of cooperation– provide atmosphere of cooperation
– Empower workers to take action based ontheir ideas
– develop incentive system for lean behaviors
10-17
Role of Suppliers
Lean builds long-term supplier relationships
– companies partner with suppliers
– improve process quality
– information sharing
– goal to have single-source suppliers
10-18
Total Quality Management (TQM)
TQM is an integrated organizational effortdesigned to improve quality at every level
Look at:•Quality Gurus•Quality Gurus
•Voice of the Customer
•Costs of Quality
•Quality Tools
•ISO 9000
10-19

Quality Gurus
10-20

Voice of the Customer
Quality is defined as meeting or exceedingcustomer expectations
• Determine customer wants:• Determine customer wants:
– focus groups
– market surveys
– customer interviews
10-21

Costs of Quality
10-22

Quality Tools
Lean requires workers to identify andcorrect quality problems
• Seven Tools of Quality Control:
– Cause and Effect Diagrams– Cause and Effect Diagrams
– Flowcharts
– Checklists
– Control Charts
– Scatter Diagrams
– Pareto Analysis
– Histograms
10-23
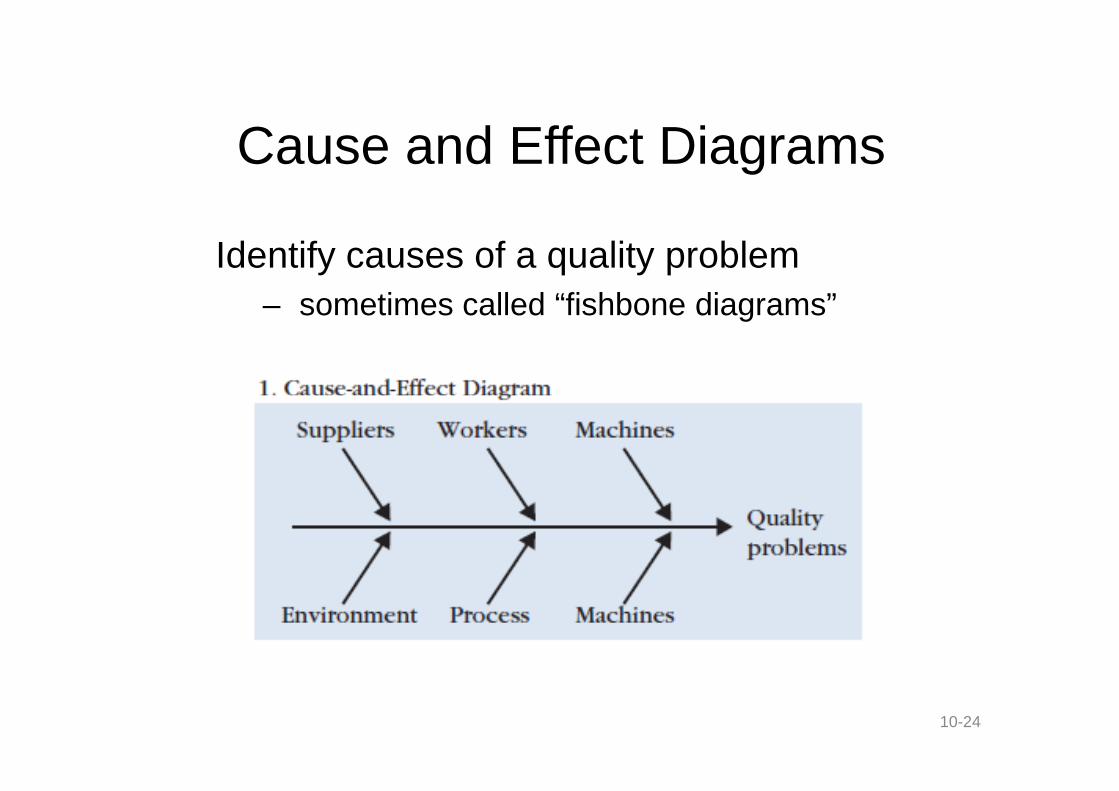
Cause and Effect Diagrams
Identify causes of a quality problem
– sometimes called “fishbone diagrams”
10-24

Flowchart
Diagrams the sequence of steps in anoperation or process
10-25
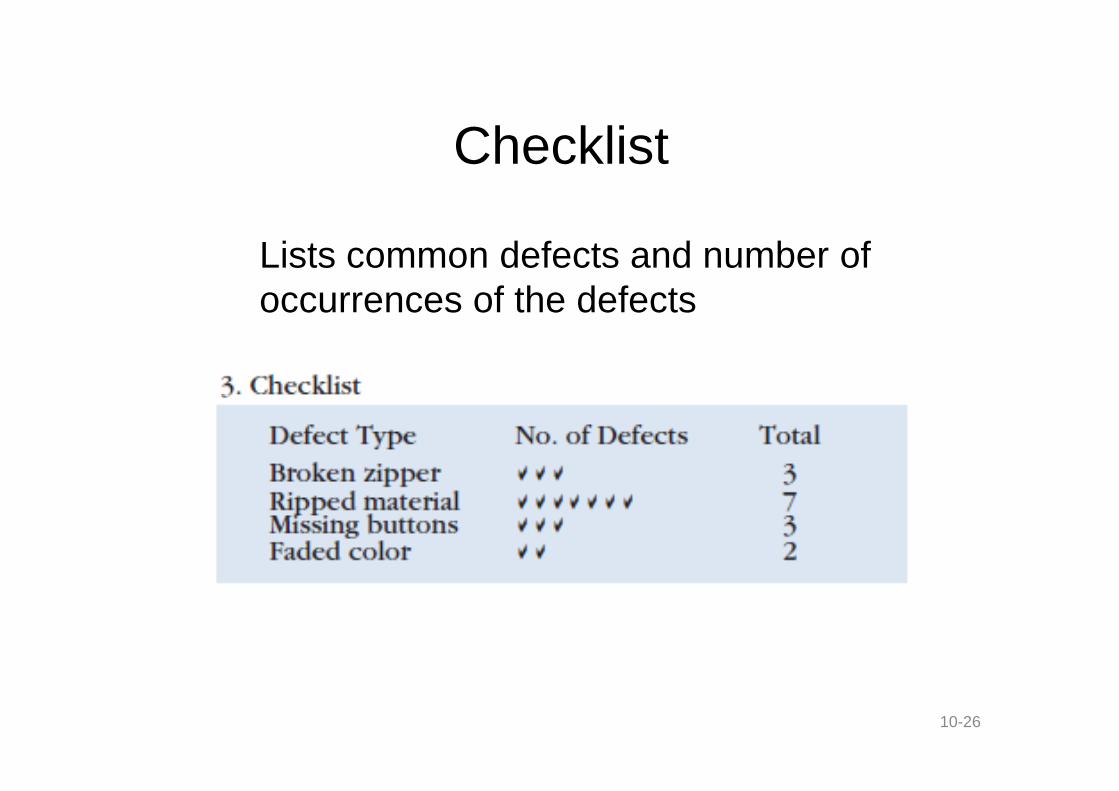
Checklist
Lists common defects and number ofoccurrences of the defects
10-26
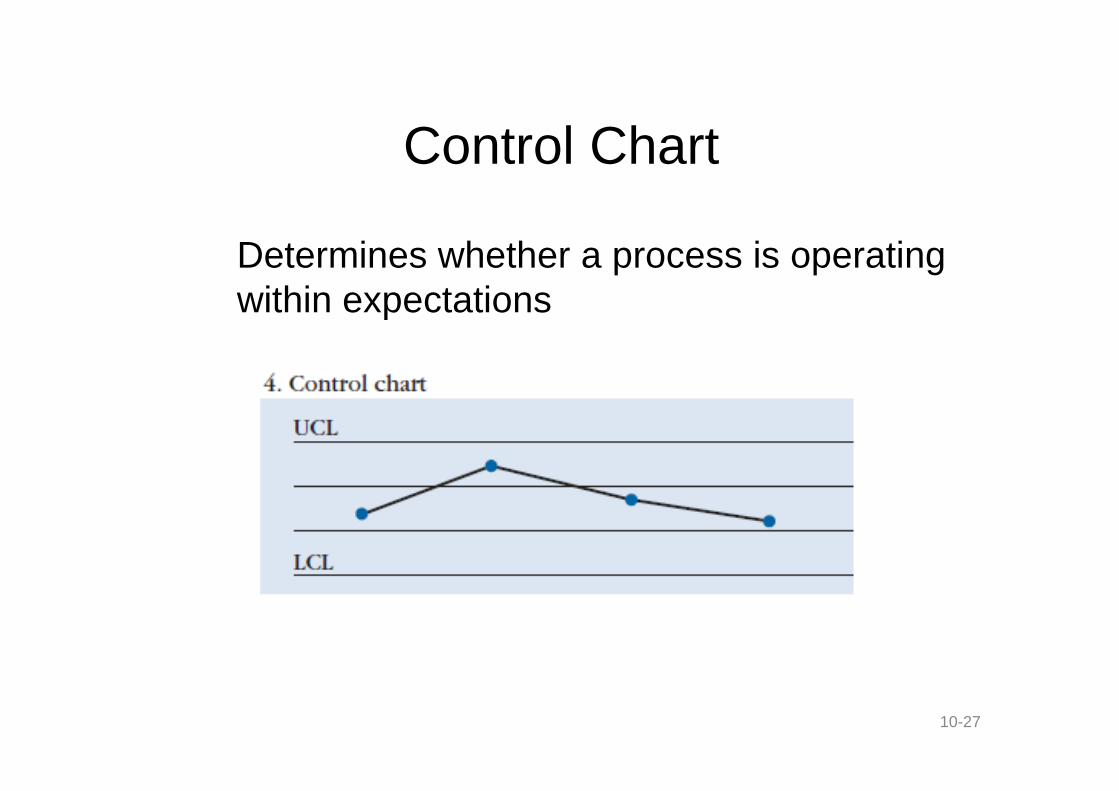
Control Chart
Determines whether a process is operatingwithin expectations
10-27
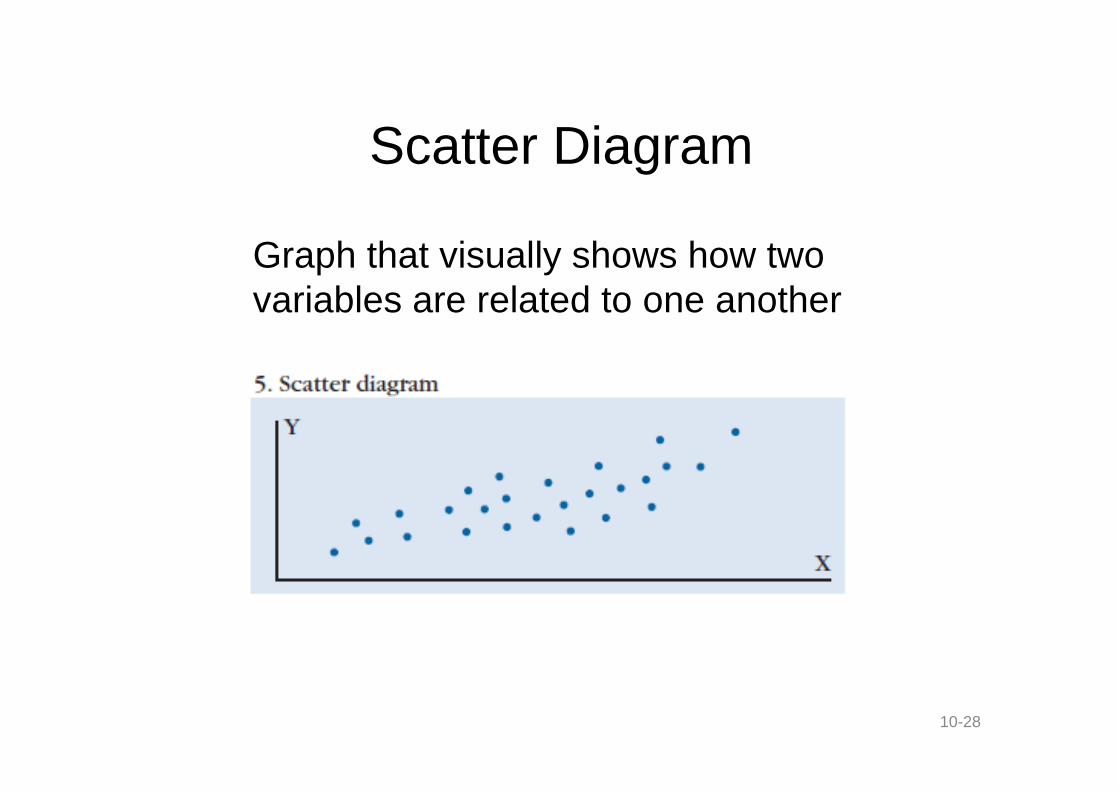
Scatter Diagram
Graph that visually shows how twovariables are related to one another
10-28
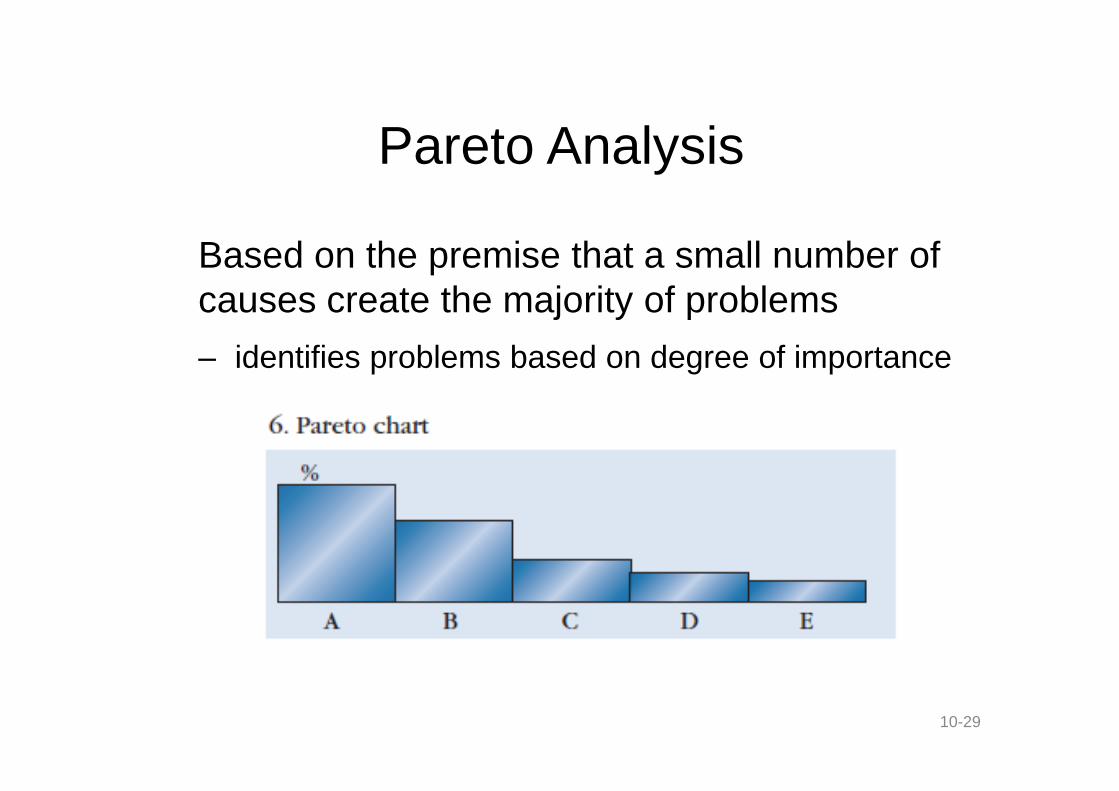
Pareto Analysis
Based on the premise that a small number ofcauses create the majority of problems
– identifies problems based on degree of importance
10-29
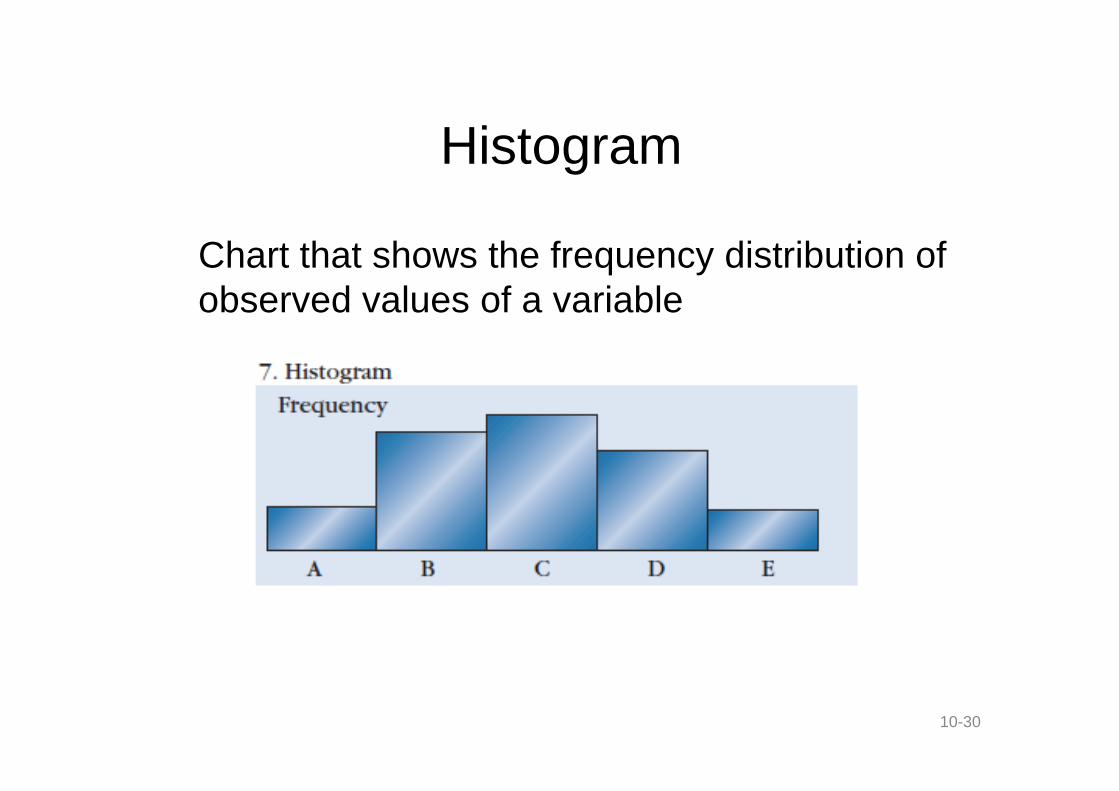
Histogram
Chart that shows the frequency distribution ofobserved values of a variable
10-30
ISO 9000
“Family” of standards for quality management
– increased international trade developed a need
– published by International Organization for Standards(ISO) in 1987
– concerns measuring and documenting the qualityprocess
– ISO provides a certification process
• ISO 14000– standards for environmental management
10-31
Statistical Quality Control (SQC)
SQC is the use of statistical tools to measureproduct and process quality
Three categories:
•Descriptive Statistics•Descriptive Statistics– describe quality characteristics
•Statistical Process Control (SPC)– a random sample of output is used to
determine if characteristics are acceptable
•Acceptance Sampling– sample determines if whole batch is acceptable
10-32
Sources of Variation
All processes have variation
•Assignable Variation
– caused by factors that can be clearly– caused by factors that can be clearlyidentified and managed
•Common Variation
– inherent in the process
– also called random variation
10-33
Process Capability
Process Capability evaluates the variation ofthe process relative to product specifications
•Product Specifications
– ranges of acceptable quality characteristics– ranges of acceptable quality characteristics
– also called tolerances
•Process Variation
– all processes have natural variation
– defects are produced when variation exceedsproduct specifications
10-34

Process Variation Equal toSpecification Range
10-35
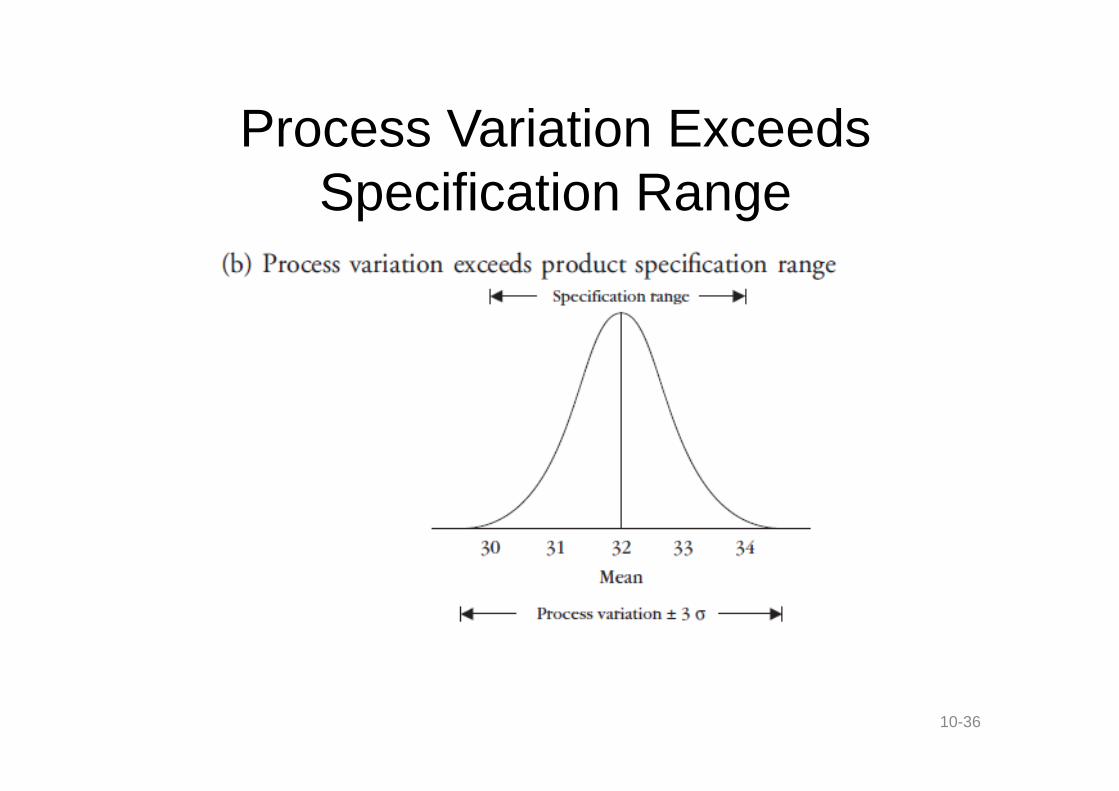
Process Variation ExceedsSpecification Range
10-36
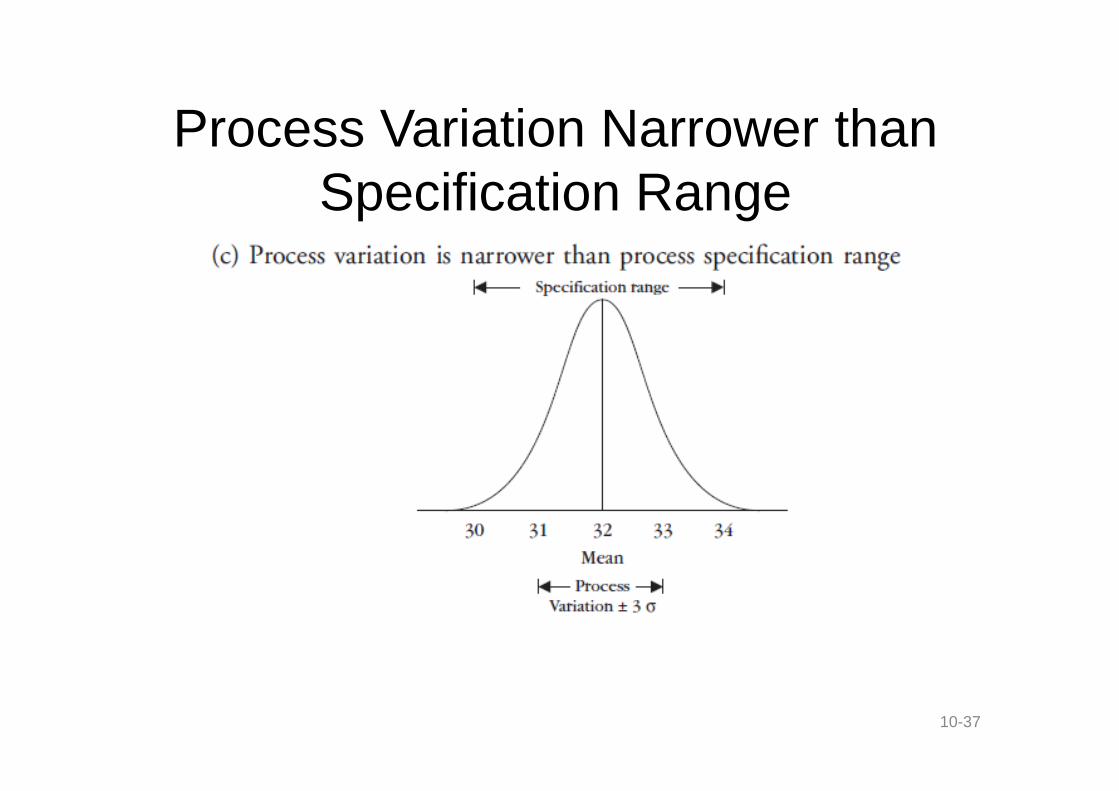
Process Variation Narrower thanSpecification Range
10-37

Process Capability Index
where: USL = upper specification limit
6
LSLUSL
rangeiationvarprocess
rangeionspecificatproductCp
LSL = lower specification limit
• Cp Values:
– Cp = 1: process is minimally capable
– Cp ≤ 1: process is not capable of producingproducts within specification
– Cp ≥ 1: process exceeds minimum capability10-38
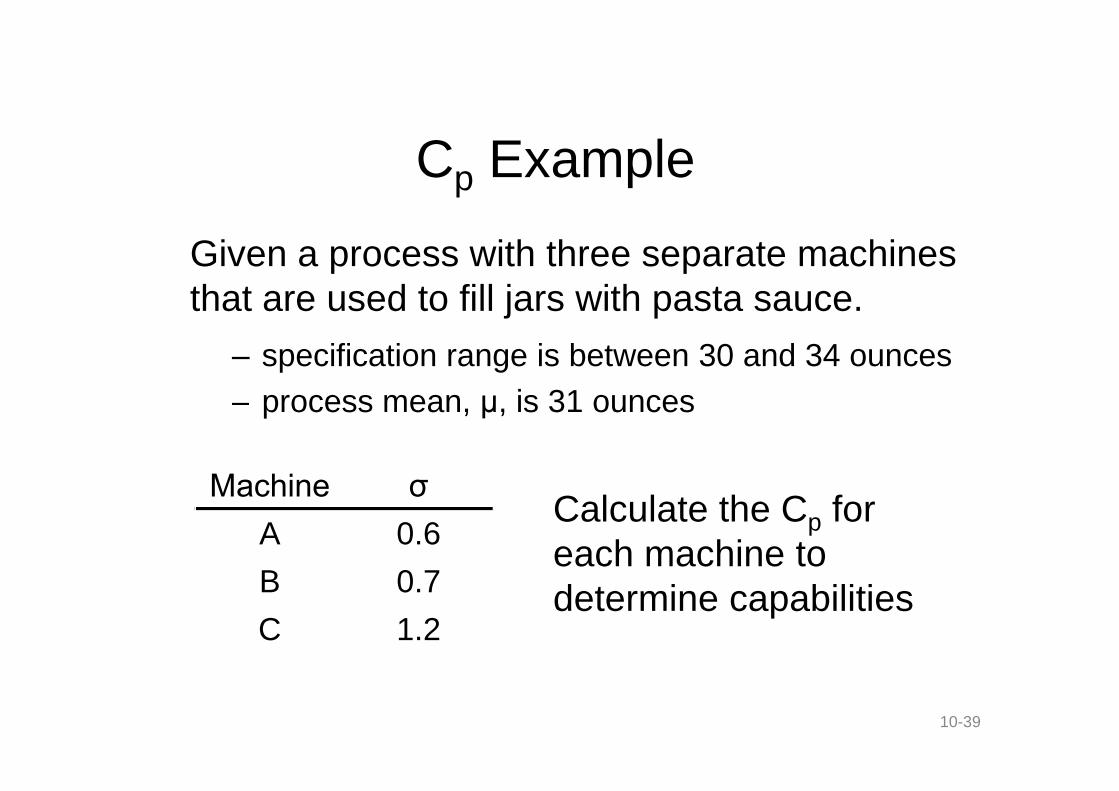
Cp Example
Given a process with three separate machinesthat are used to fill jars with pasta sauce.
– specification range is between 30 and 34 ounces
– process mean, μ, is 31 ounces– process mean, μ, is 31 ounces
10-39
Machine σ
A 0.6
B 0.7
C 1.2
Calculate the Cp foreach machine todetermine capabilities

Cp Example Continued
• A:
6
LSLUSLCp
11.1)6.0(6
3034Cp
Machine A has a• A:
• B:
• C:
10-40
11.1)6.0(6
Cp
95.0)7.0(6
3034Cp
55.0)2.1(6
3034Cp
Machine A has aCp > 1, howeverthe process meanis not centered
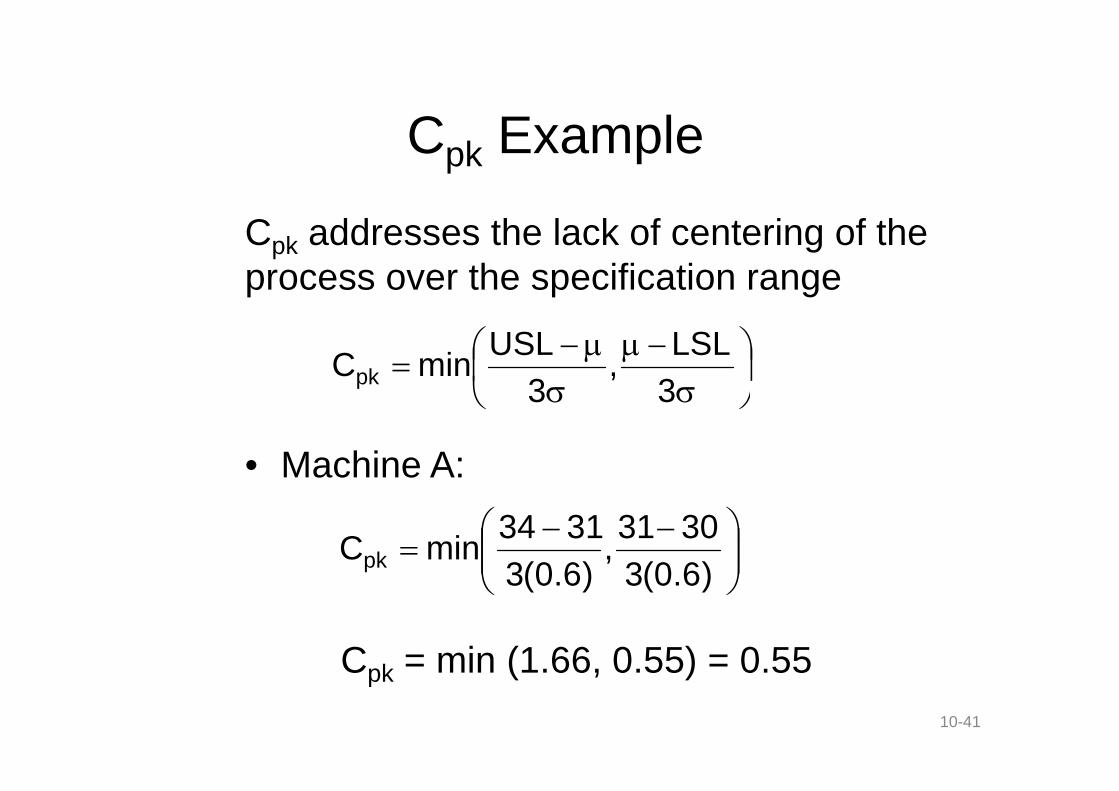
Cpk Example
Cpk addresses the lack of centering of theprocess over the specification range
3
LSL,
3
USLminCpk
• Machine A:
Cpk = min (1.66, 0.55) = 0.55
10-41
33
)6.0(3
3031,
)6.0(3
3134minCpk
Process Control Charts
Graph that shows whether a sample of datafalls within the common range of variation
1.sample process output
2.plot result on the control chart2.plot result on the control chart
3.use to determine if process is in control
•can monitor:– variables
• characteristics that can be measured
– attributes• characteristics that can be counted
10-42

Process Control Charts
10-43

Control Charts for Attributes
A p-chart monitors the proportion of defectiveitems in a sample
• centerline: average value of p across all samples, p
• UCL = p + z sp• UCL = p + z sp
• LCL = p – z sp
where: z = standard normal variablep = sample proportion defective
sp = = standard deviation of
10-44
n
)p1(p
avg. proportion defective
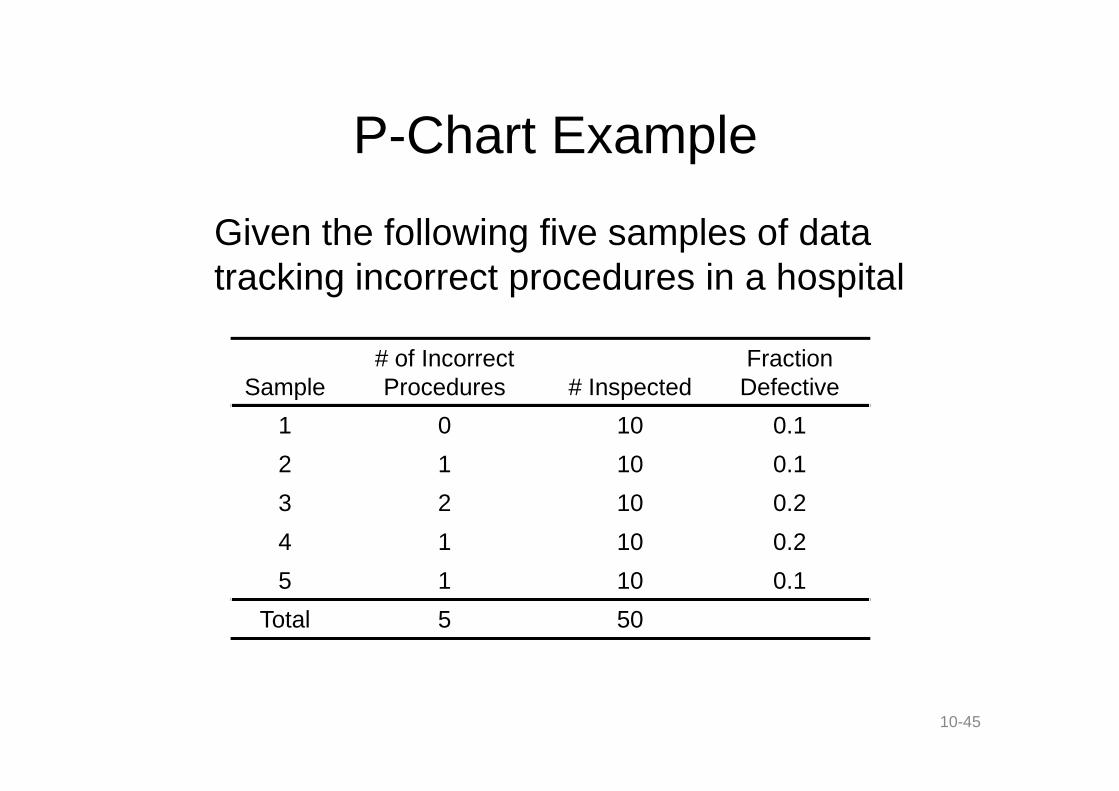
P-Chart Example
Given the following five samples of datatracking incorrect procedures in a hospital
Sample# of IncorrectProcedures # Inspected
FractionDefective
10-45
Sample Procedures # Inspected Defective
1 0 10 0.1
2 1 10 0.1
3 2 10 0.2
4 1 10 0.2
5 1 10 0.1
Total 5 50
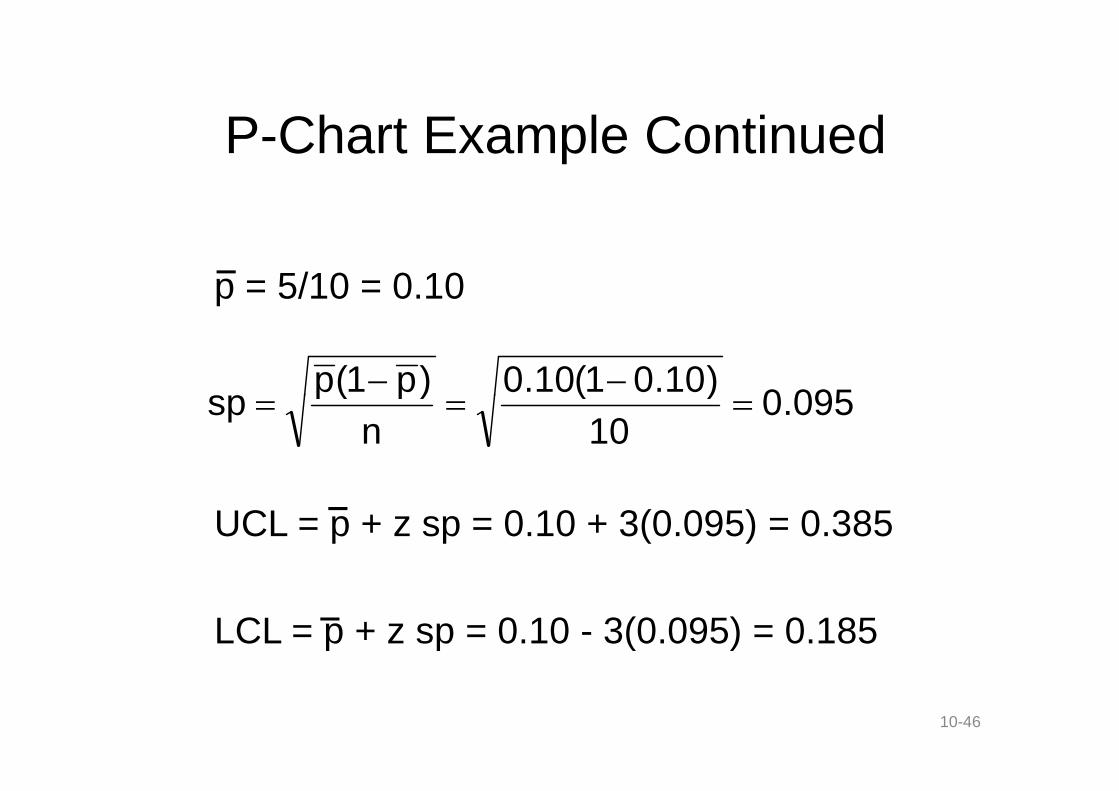
P-Chart Example Continued
p = 5/10 = 0.10
095.0)10.01(10.0)p1(p
sp
UCL = p + z sp = 0.10 + 3(0.095) = 0.385
LCL = p + z sp = 0.10 - 3(0.095) = 0.185
10-46
095.010
)10.01(10.0
n
)p1(psp
What is Six Sigma?
Six Sigma is a quality management processthat uses measurement to reduce processvariation and eliminate defects
– no more than 3.4 parts per million defective
– sigma stands for # standard deviations of theprocess
– originated at Motorola in 1970s
– “zero defects”
10-47
Six Sigma Methodology
Two Aspects:
•Use of technical tools
– statistical quality control– statistical quality control
– seven tools of quality
•People involvement
– all employees responsible for rooting outquality problems
– all employees trained to use technical tools
10-48
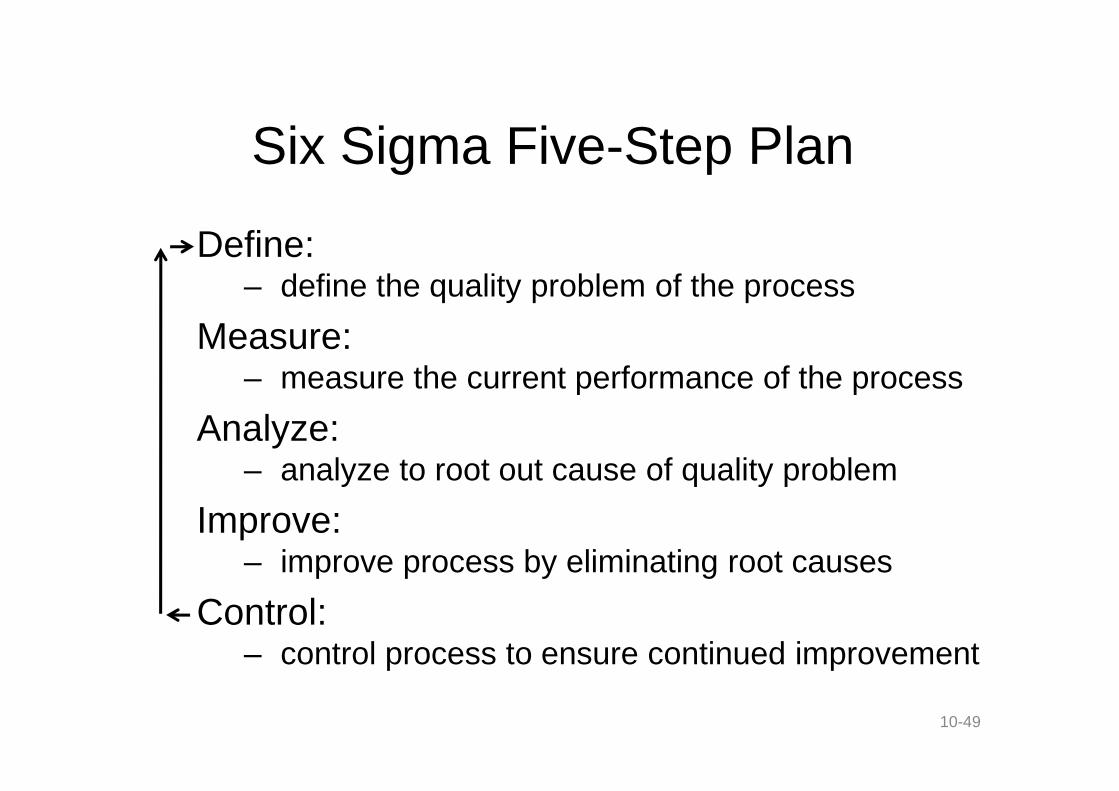
Six Sigma Five-Step Plan
Define:– define the quality problem of the process
Measure:– measure the current performance of the process
Analyze:– analyze to root out cause of quality problem
Improve:– improve process by eliminating root causes
Control:– control process to ensure continued improvement
10-49
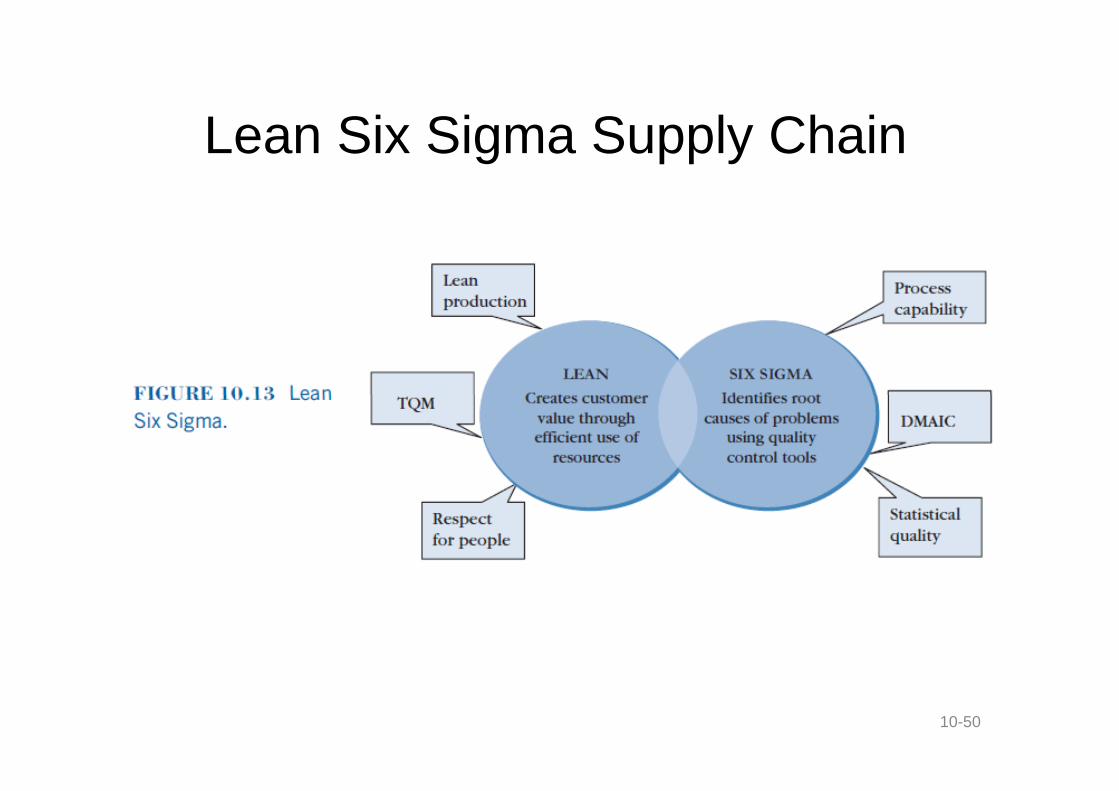
Lean Six Sigma Supply Chain
10-50
Developing a Lean Six Sigma SupplyChain
Steps:
1. Jointly Define Value
2. Conduct Supply Chain Capability Analysis
3. Develop Key Financial & Operational Metrics
4. Identify & Implement System Improvements
– Value Stream Mapping (VSM)
10-51
Impact on Supply Chain Activities
• Suppliers– lower costs due to efficient systems– shorter lead times– lower safety stock
• Operations• Operations– proper cycle time calculation ensures production
according to customer demand– uniform work flow– pull production
• Logistics– optimization models to select routes– warehouse design changes reduce waste
10-52
Review
1. Lean management approach concerns themost efficient use of resources possible. Themost important tenet is eliminating waste.
2. Lean consists of 3 elements: Lean Production,2. Lean consists of 3 elements: Lean Production,Total Quality Management, Respect for people.
3. Lean relies on visual signals to pull productsthrough the system.
4. Jidoka is the authority of every worker to stopthe production process.
10-53
Review Continued
5. The “seven tools of quality control” include cause-and-effect diagrams, flowcharts, checklists,control charts, scatter diagrams, Pareto analysis,and histograms.
6. ISO 9000 standards address quality6. ISO 9000 standards address qualitymanagement. ISO 14000 standards addressenvironmental management.
7. SQC measures and identifies quality problems inboth the product and process. 3 categories:descriptive statistics, SPC, acceptance sampling.
10-54
Review Continued
8. All processes have variation. Assignablevariation can be identified and managed.Common variation is inherent in the process.
9. Process capability evaluates the processes9. Process capability evaluates the processesability to meet product specifications.
10.Process control charts ensure that theprocess is “in a state of control.”
11.Six Sigma uses measurement to reduceprocess variation and eliminate defects.
10-55