Wall Modeling & Behavior - 100th Anniversary 1906 San …€¦ · · 2013-08-20Shear Design Wall...
71
Wall Modeling & Behavior John Wallace University of California, Los Angeles with contributions from Mr. Leonardo Massone & Dr. Kutay Orakcal University of California, Los Angeles
Transcript of Wall Modeling & Behavior - 100th Anniversary 1906 San …€¦ · · 2013-08-20Shear Design Wall...
Wall Modeling & Behavior
John WallaceUniversity of California, Los Angeles
with contributions fromMr. Leonardo Massone & Dr. Kutay OrakcalUniversity of California, Los Angeles

2
Presentation Overview
Flexure
Shear
P-M-V Interaction & Modeling
Preliminary Test Results
3
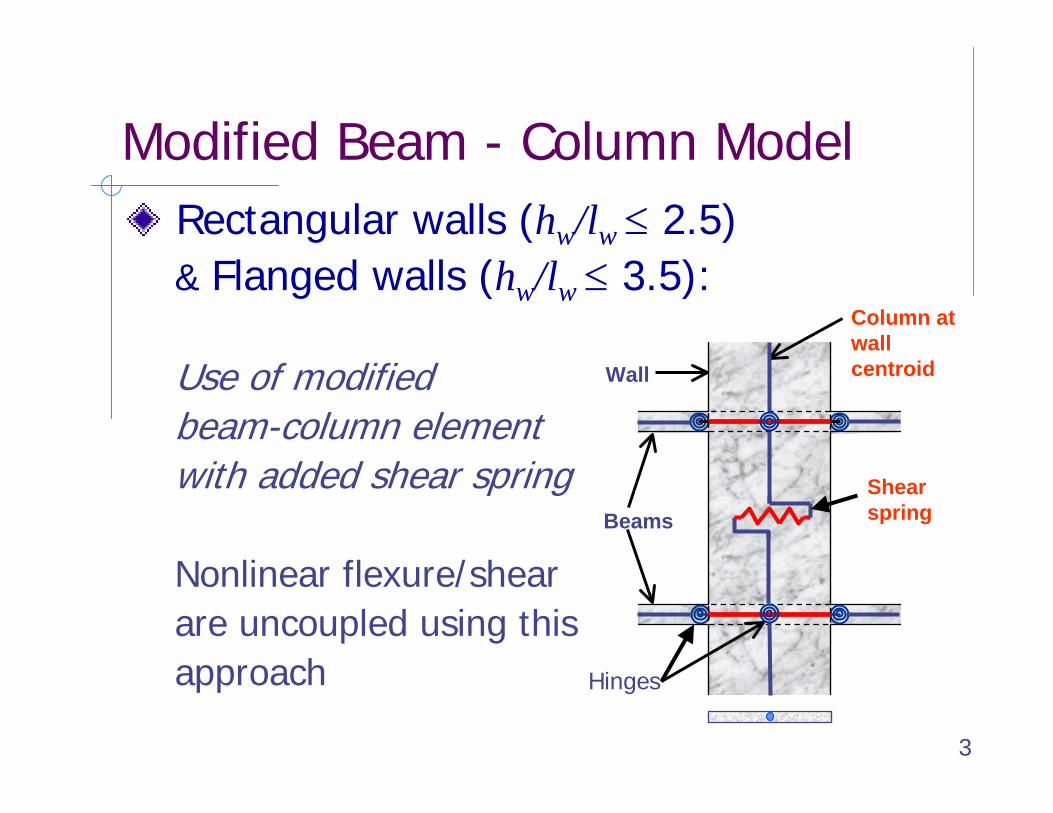
Modified Beam - Column ModelRectangular walls (hw/lw ≤ 2.5)& Flanged walls (hw/lw ≤ 3.5):
Use of modified beam-column elementwith added shear spring
Nonlinear flexure/shearare uncoupled using thisapproach
Beams
Wall
Shear spring
Column at wall centroid
Hinges
4
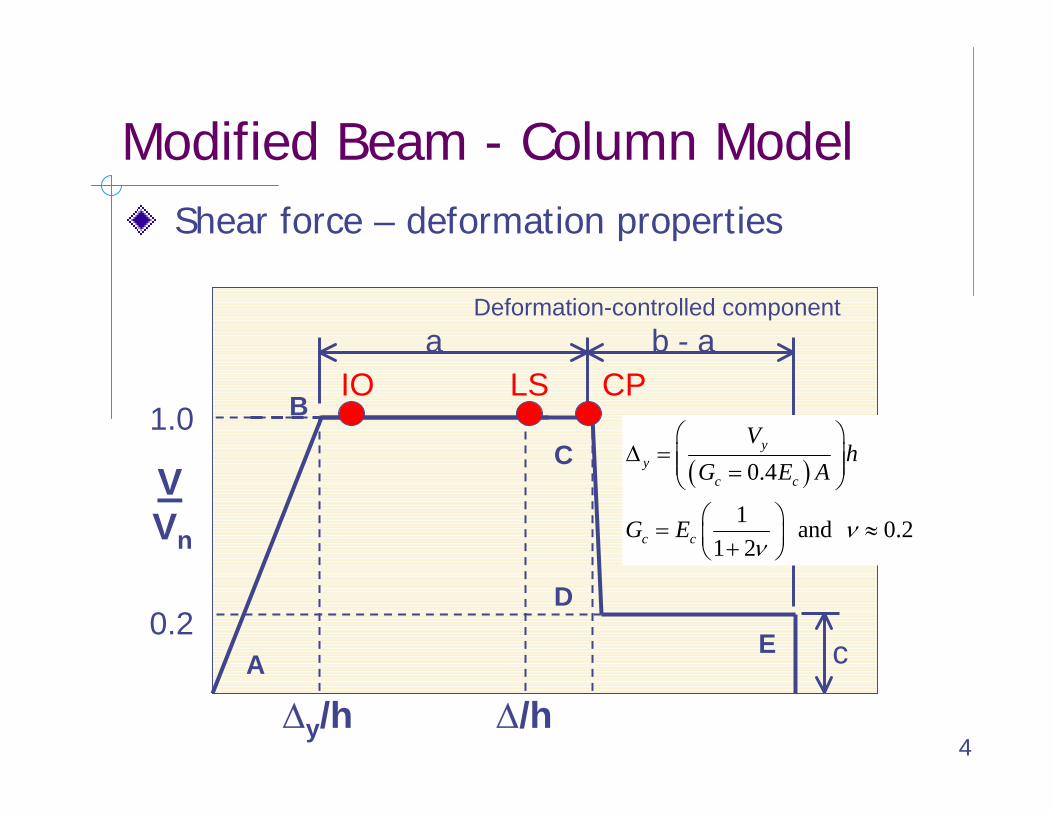
Modified Beam - Column ModelShear force – deformation properties
A
B
C
D
E
∆/h
V Vn
1.0
0.2
CPLSIO
Deformation-controlled componenta b - a
c
( )
0.4
1 and 0.21 2
yy
c c
c c
Vh
G E A
G E νν
⎛ ⎞∆ = ⎜ ⎟⎜ ⎟=⎝ ⎠
⎛ ⎞= ≈⎜ ⎟+⎝ ⎠
∆y/h
5
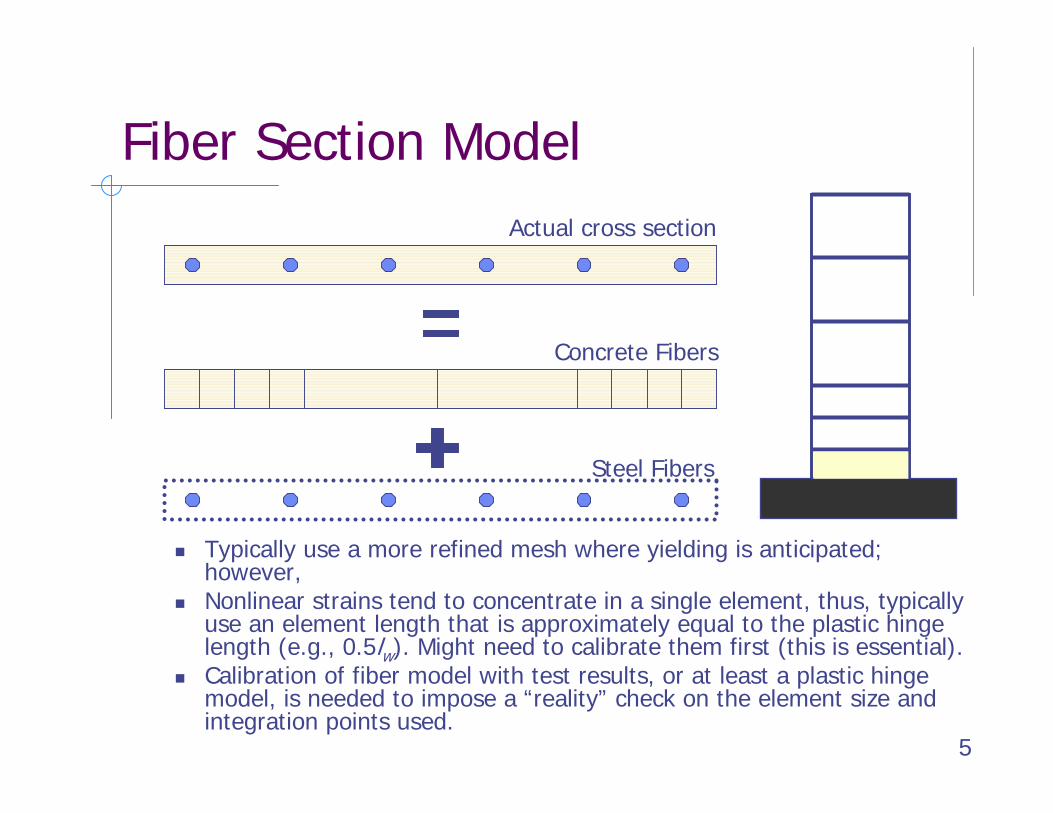
Fiber Section Model
Typically use a more refined mesh where yielding is anticipated;however, Nonlinear strains tend to concentrate in a single element, thus, typically use an element length that is approximately equal to the plastic hinge length (e.g., 0.5lw). Might need to calibrate them first (this is essential).Calibration of fiber model with test results, or at least a plastic hinge model, is needed to impose a “reality” check on the element size and integration points used.
Actual cross section
Concrete Fibers
Steel Fibers
6
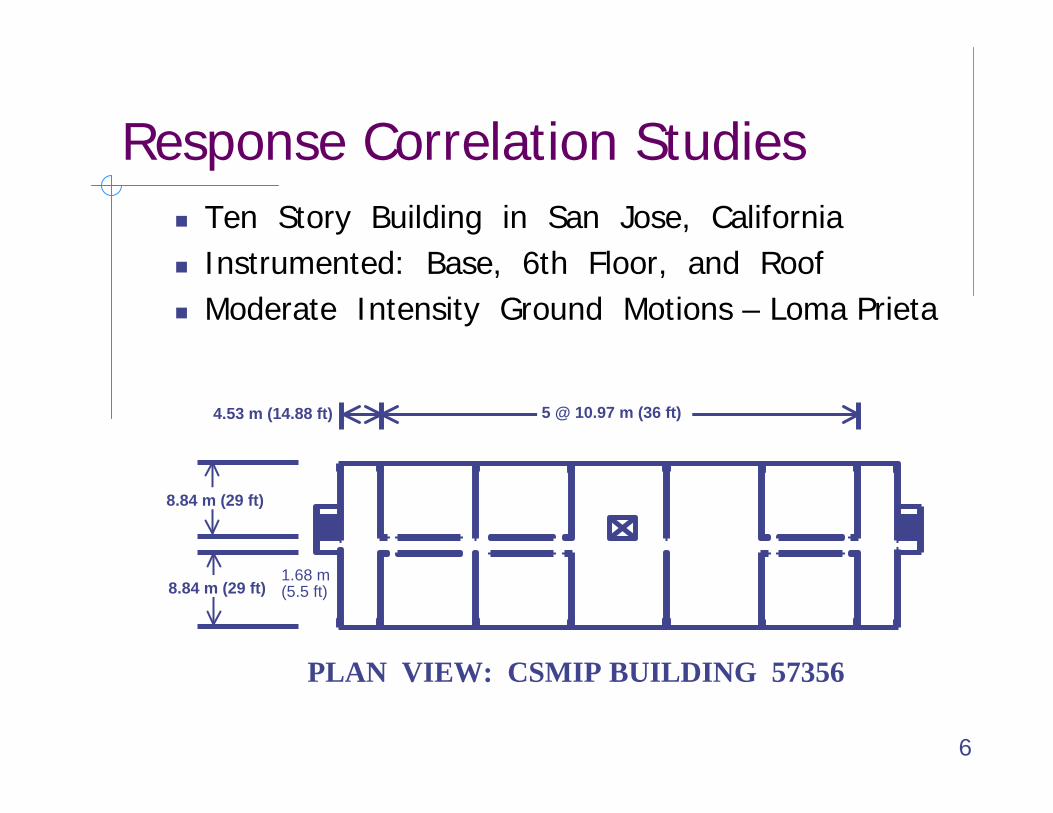
Response Correlation StudiesTen Story Building in San Jose, CaliforniaInstrumented: Base, 6th Floor, and RoofModerate Intensity Ground Motions – Loma Prieta
4.53 m (14.88 ft)
1.68 m(5.5 ft)
PLAN VIEW: CSMIP BUILDING 57356
8.84 m (29 ft)
8.84 m (29 ft)
5 @ 10.97 m (36 ft)
7
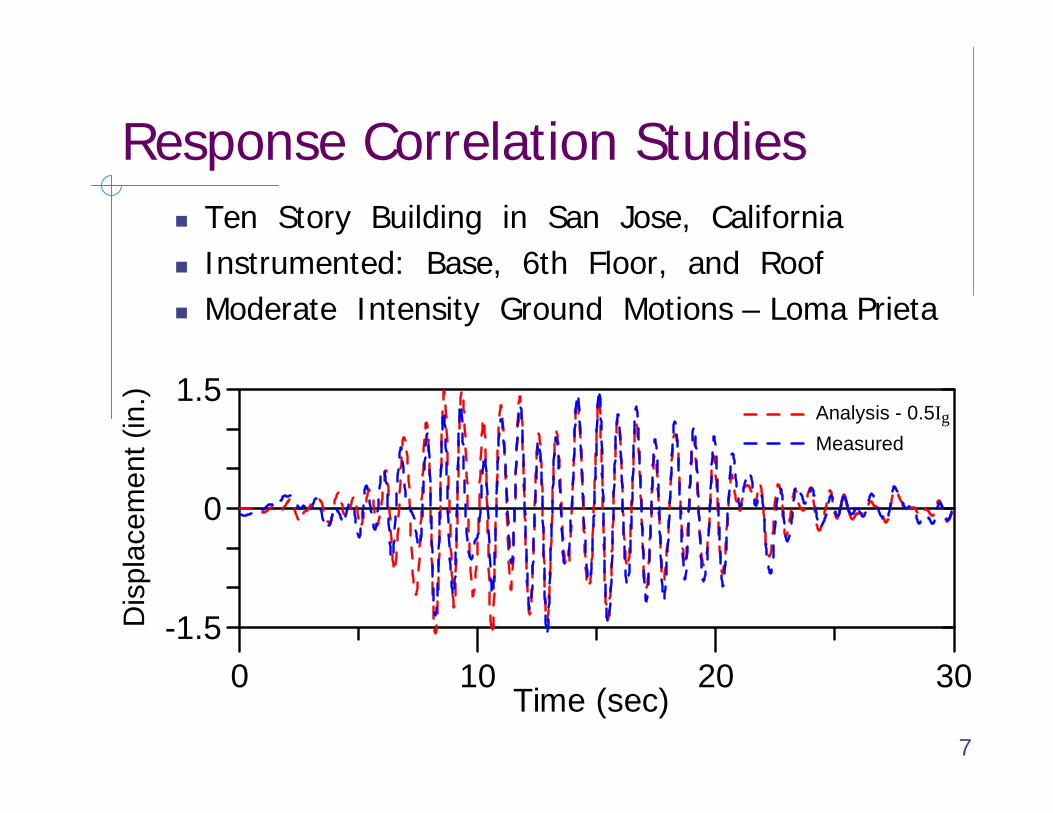
Response Correlation StudiesTen Story Building in San Jose, CaliforniaInstrumented: Base, 6th Floor, and RoofModerate Intensity Ground Motions – Loma Prieta
0 10 20 30Time (sec)
-1.5
0
1.5
Dis
plac
emen
t (in
.)
Analysis - 0.5Ig
Measured
8
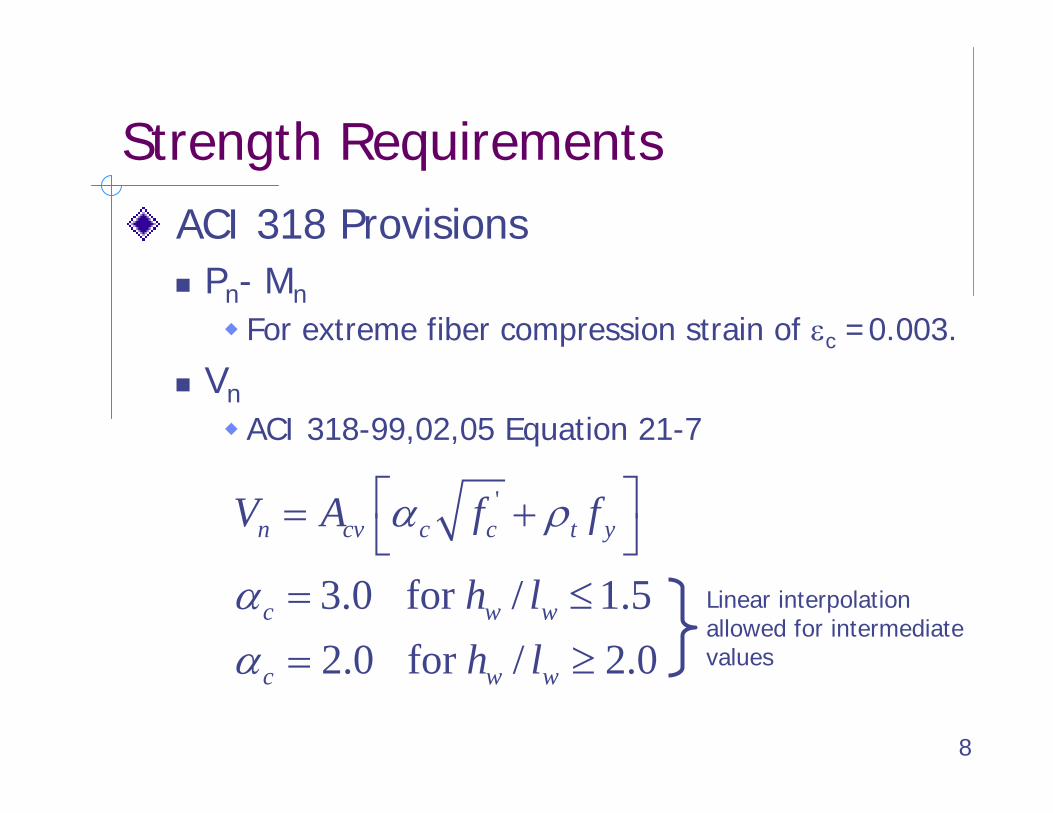
Strength RequirementsACI 318 Provisions
Pn- MnFor extreme fiber compression strain of εc =0.003.
VnACI 318-99,02,05 Equation 21-7
'
3.0 for / 1.52.0 for / 2.0
n cv c c t y
c w w
c w w
V A f f
h lh l
α ρ
αα
⎡ ⎤= +⎣ ⎦= ≤
= ≥
Linear interpolationallowed for intermediatevalues
9
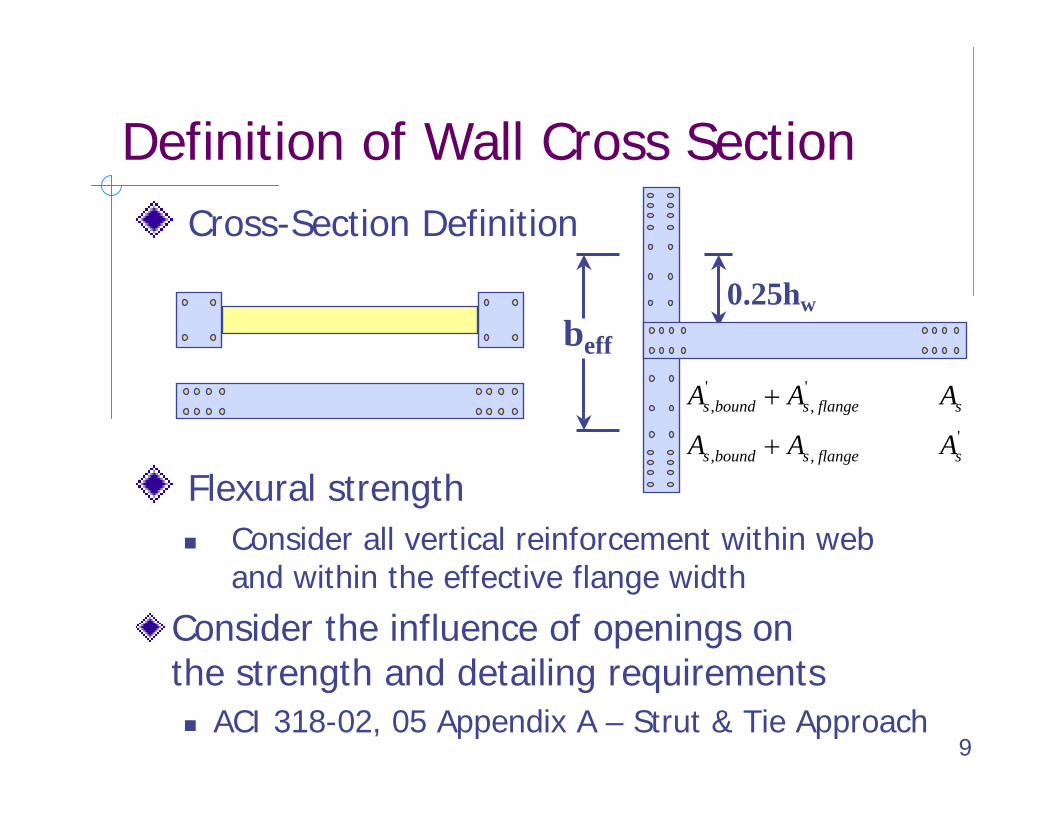
Definition of Wall Cross Section
Flexural strengthConsider all vertical reinforcement within web and within the effective flange width
Consider the influence of openings on the strength and detailing requirements
ACI 318-02, 05 Appendix A – Strut & Tie Approach
Cross-Section Definition
beff
0.25hw
' ', ,
', ,
s bound s flange s
s bound s flange s
A A A
A A A
+
+
10
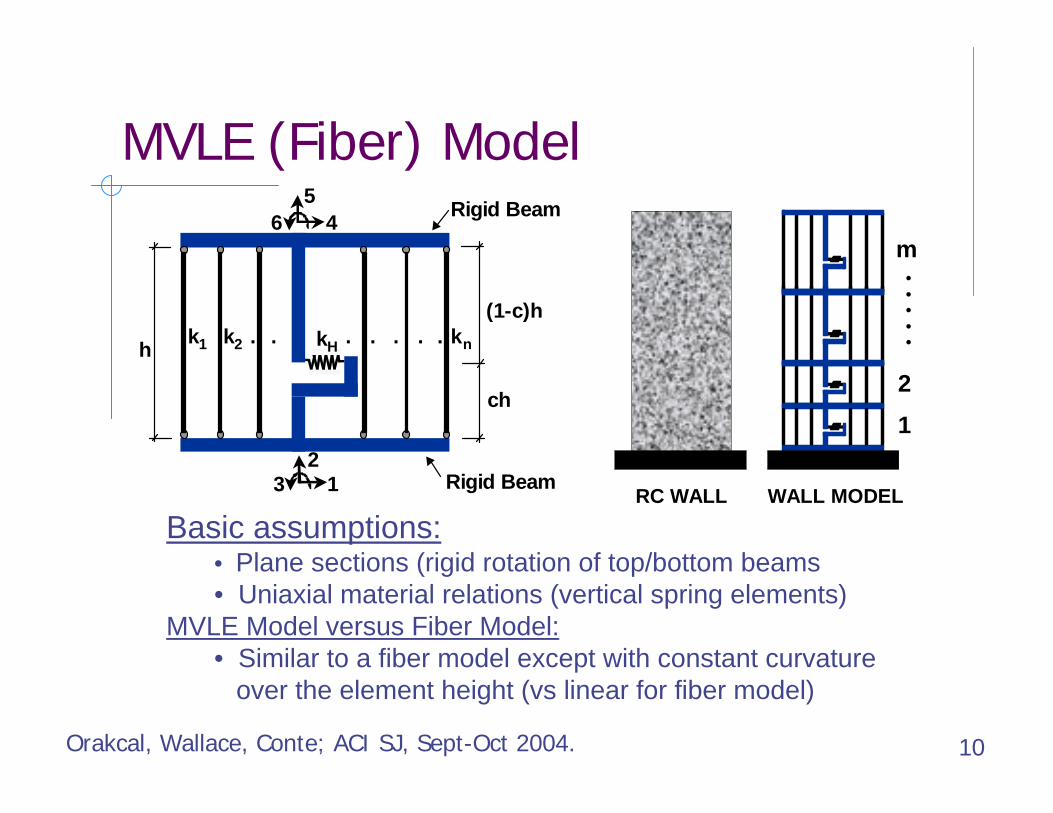
MVLE (Fiber) Model
h
(1-c)h
ch
12
3
45
6 Rigid Beam
Rigid Beam
k 1 k 2 knkH. . . . . . .
m
RC WALL WALL MODEL
1
2
. . . . .
Basic assumptions: • Plane sections (rigid rotation of top/bottom beams• Uniaxial material relations (vertical spring elements)
MVLE Model versus Fiber Model:• Similar to a fiber model except with constant curvature
over the element height (vs linear for fiber model)
Orakcal, Wallace, Conte; ACI SJ, Sept-Oct 2004.
11
Strain, ε
O
TensionNot to scale
Compression
( εc ' , f c
' )
(ε0, 0)
(ε0+ εt , ft)
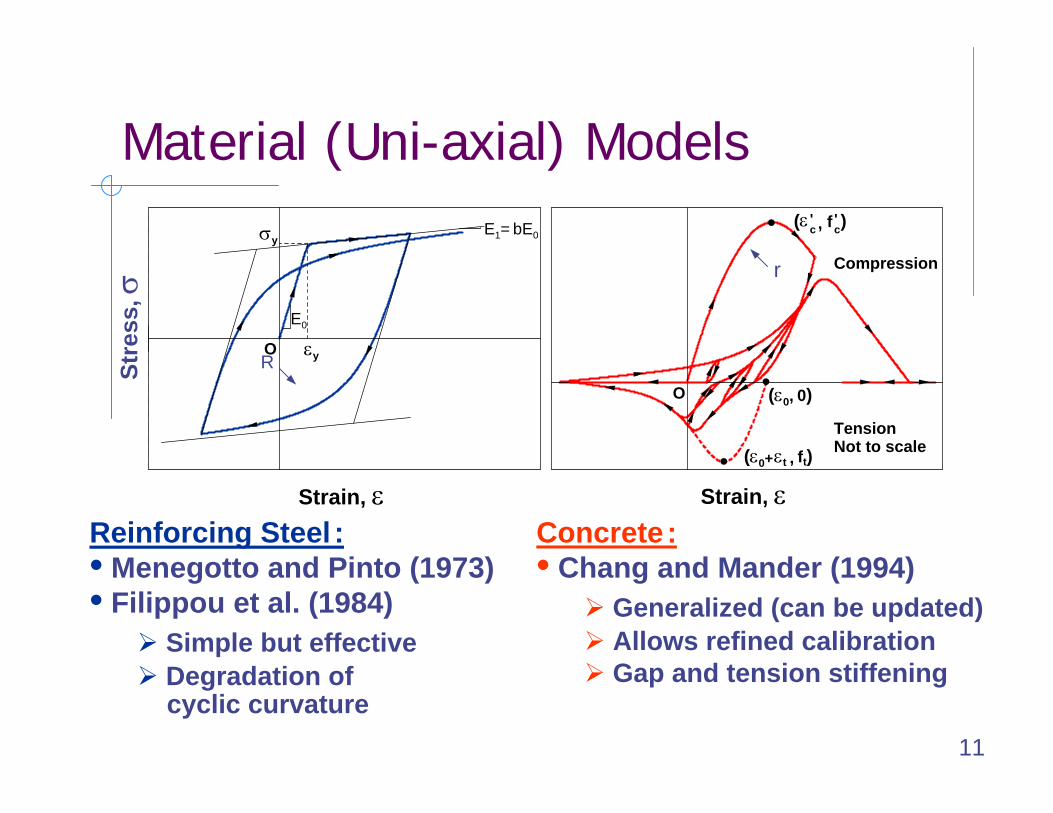
Material (Uni-axial) Models
Strain, ε
εy
E0
E1= bE0σy
OR
Concrete:• Chang and Mander (1994)
Generalized (can be updated)Allows refined calibrationGap and tension stiffening
Reinforcing Steel :• Menegotto and Pinto (1973)• Filippou et al. (1984)
Simple but effectiveDegradation of cyclic curvature
r
Stre
ss, σ
12
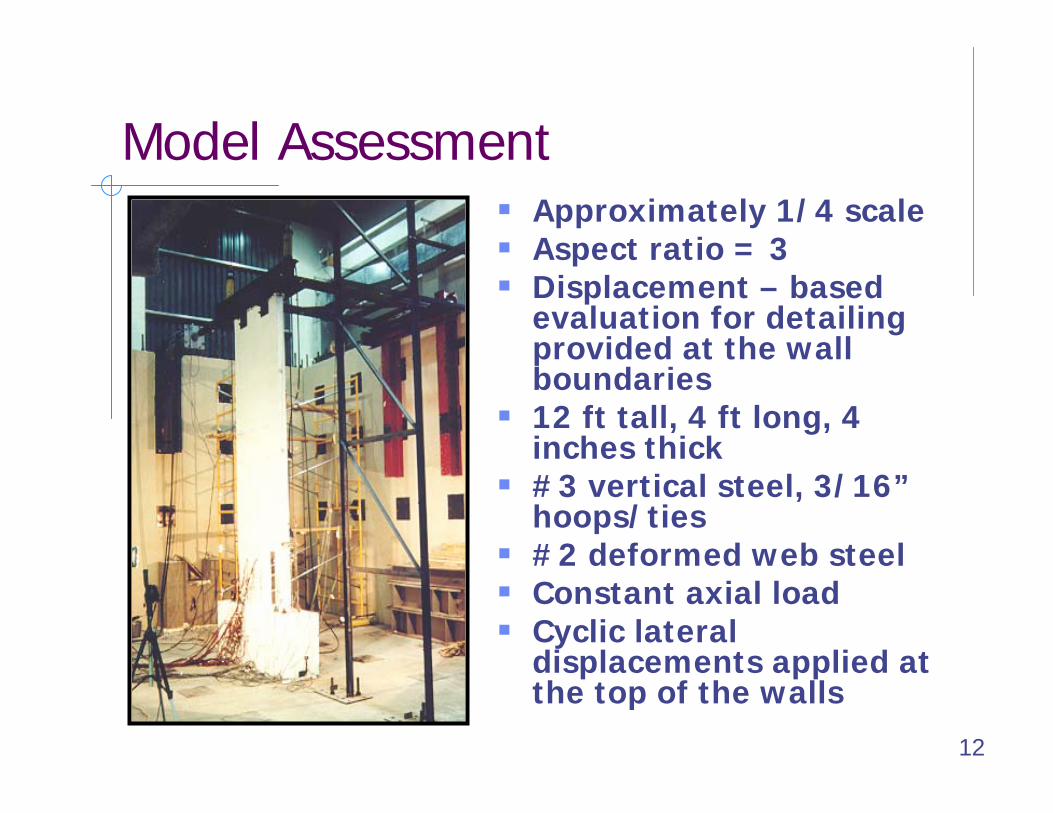
Model AssessmentApproximately 1/4 scaleAspect ratio = 3Displacement – based evaluation for detailing provided at the wall boundaries12 ft tall, 4 ft long, 4 inches thick#3 vertical steel, 3/16” hoops/ties#2 deformed web steelConstant axial loadCyclic lateral displacements applied at the top of the walls
13
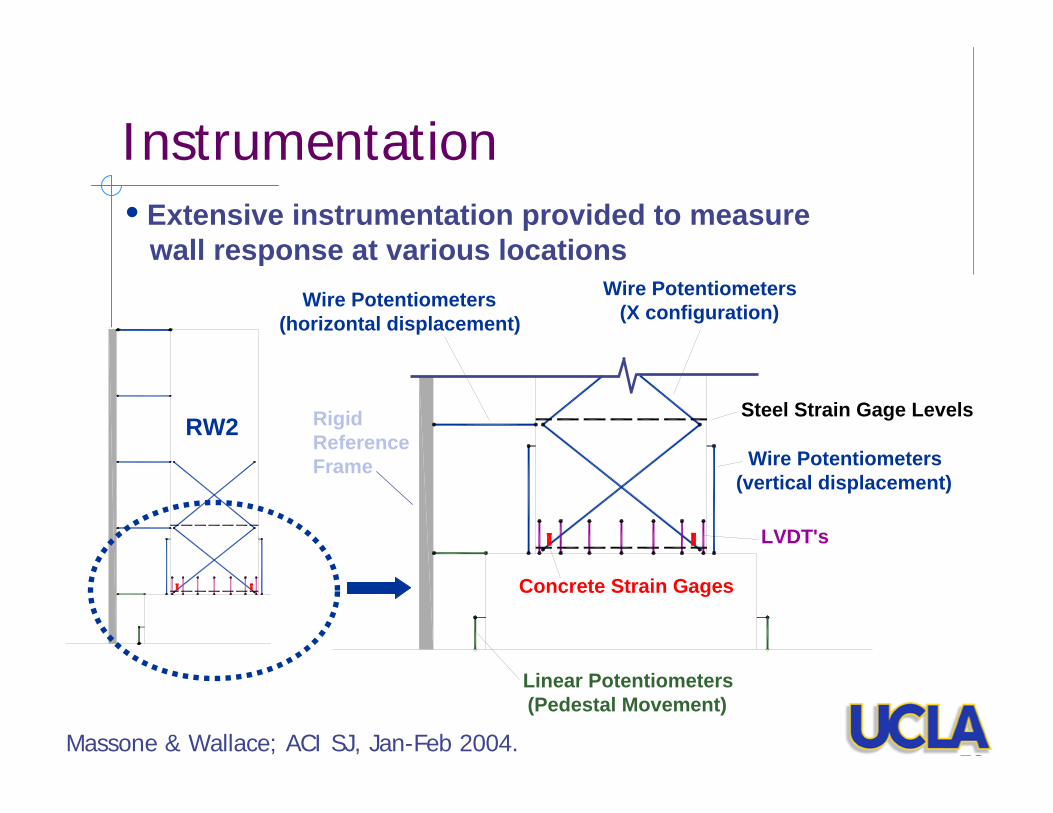
Instrumentation
Wire Potentiometers(horizontal displacement)
Wire Potentiometers (X configuration)
Steel Strain Gage Levels
Wire Potentiometers(vertical displacement)
LVDT's
Concrete Strain Gages
Linear Potentiometers (Pedestal Movement)
Rigid Reference Frame
RW2
• Extensive instrumentation provided to measure wall response at various locations
Massone & Wallace; ACI SJ, Jan-Feb 2004.
14
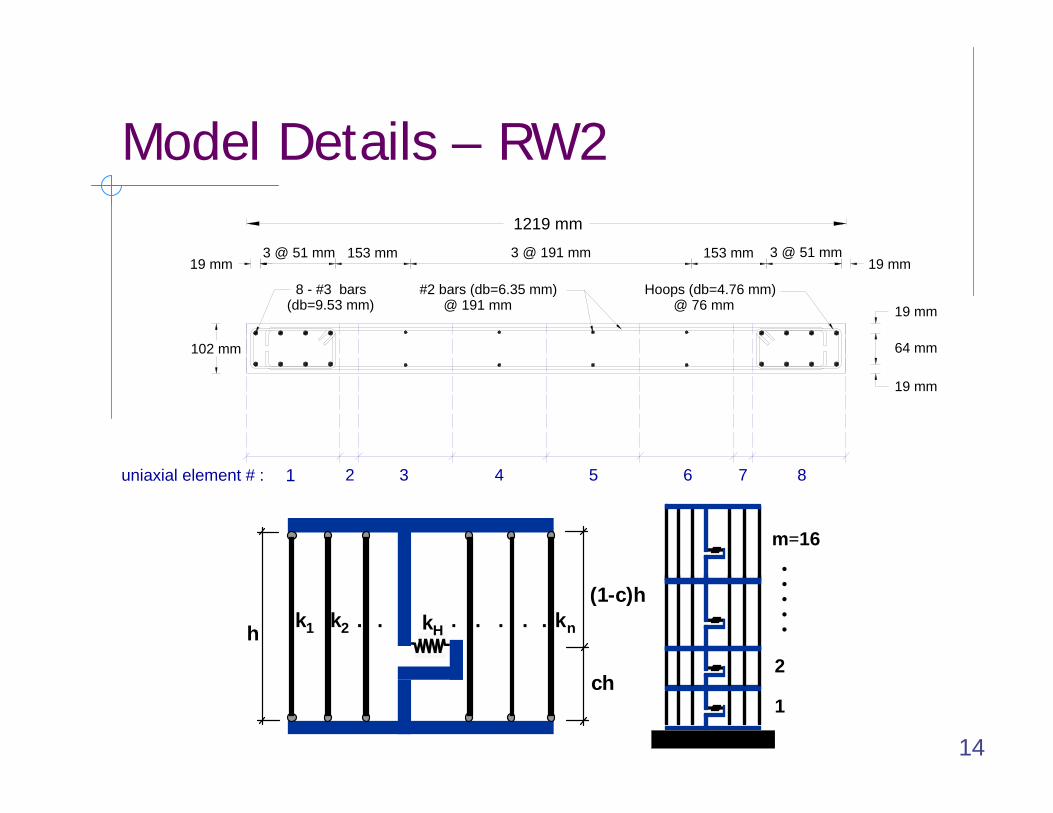
Model Details – RW2 1219 mm
19 mm 19 mm3 @ 51 mm 153 mm 3 @ 191 mm 153 mm 3 @ 51 mm
64 mm
19 mm
19 mm
102 mm
#2 bars (db=6.35 mm) Hoops (db=4.76 mm)8 - #3 bars
1 2 3 4 5 6 7 8uniaxial element # :
(db=9.53 mm) @ 191 mm @ 76 mm
m=16
1
2
. . . . .h
(1-c)h
ch
k 1 k2 knkH . . . . . . .
15
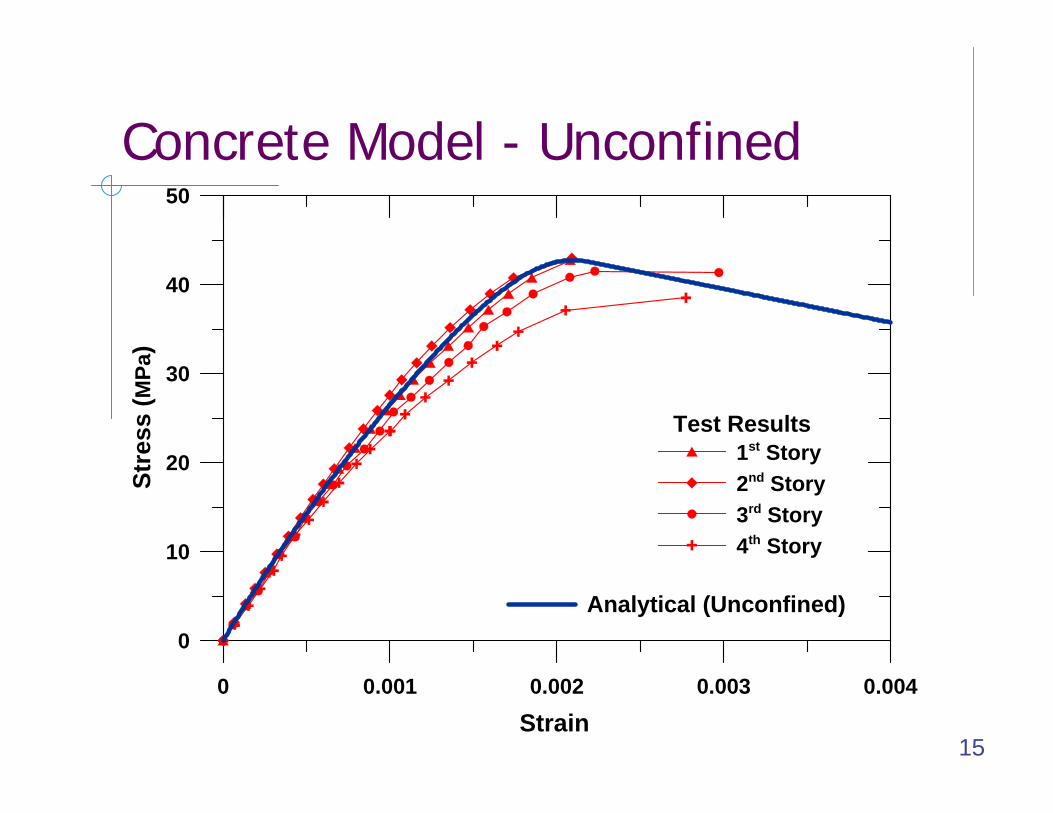
Concrete Model - Unconfined
0 0.001 0.002 0.003 0.004
Strain
0
10
20
30
40
50
Stre
ss (M
Pa)
Test Results1st Story2nd Story3rd Story4th Story
Analytical (Unconfined)
16
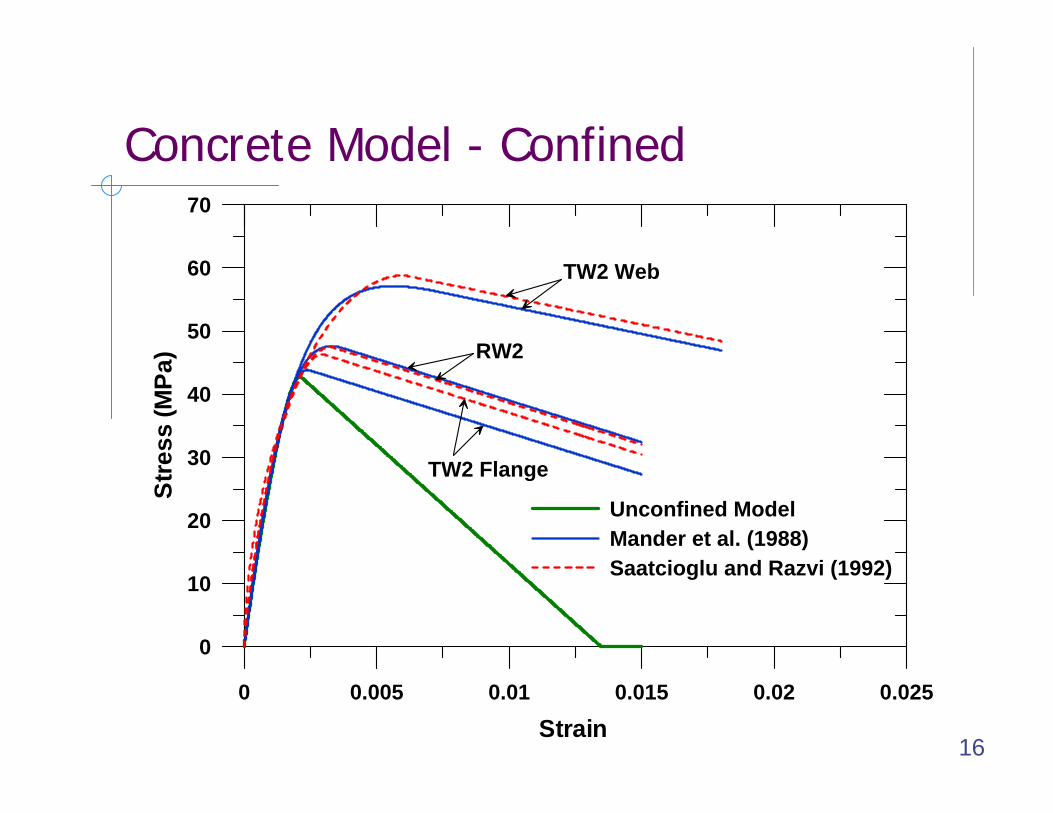
Concrete Model - Confined
0 0.005 0.01 0.015 0.02 0.025
Strain
0
10
20
30
40
50
60
70
Stre
ss (M
Pa)
Unconfined ModelMander et al. (1988)Saatcioglu and Razvi (1992)
RW2
TW2 Flange
TW2 Web
17
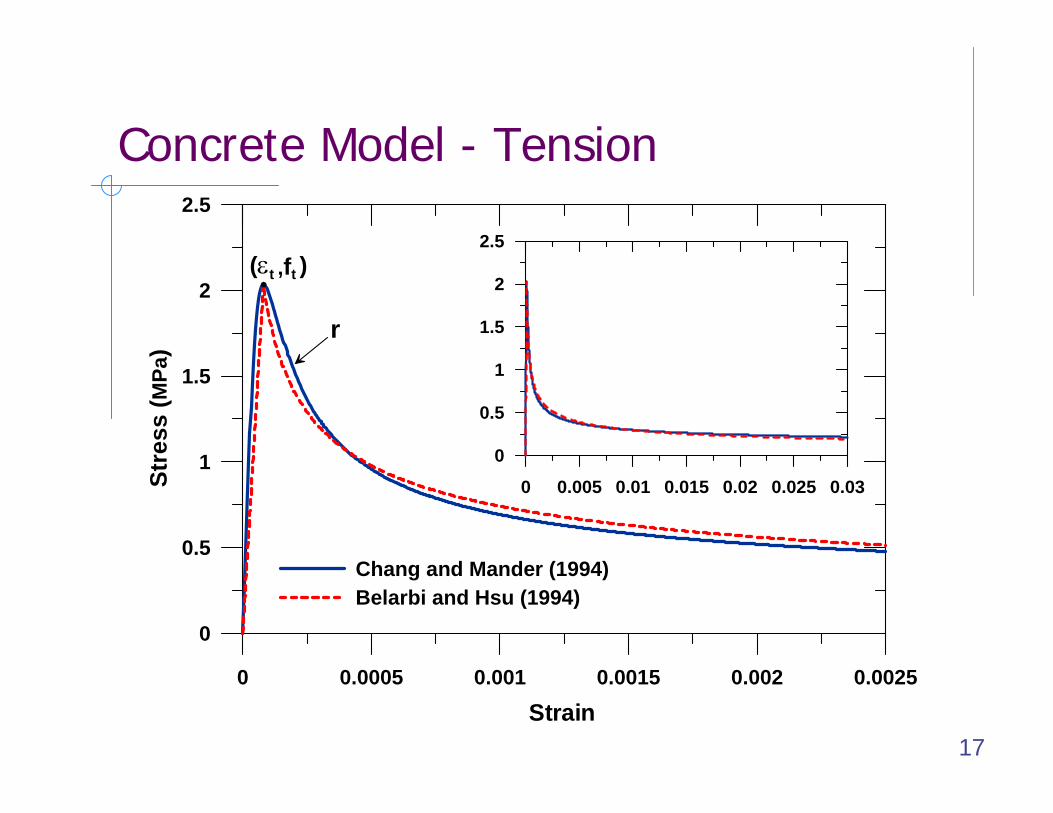
Concrete Model - Tension
0 0.0005 0.001 0.0015 0.002 0.0025
Strain
0
0.5
1
1.5
2
2.5
Stre
ss (M
Pa)
Chang and Mander (1994)Belarbi and Hsu (1994)
0 0.005 0.01 0.015 0.02 0.025 0.03
0
0.5
1
1.5
2
2.5(εt ,ft )
r
18
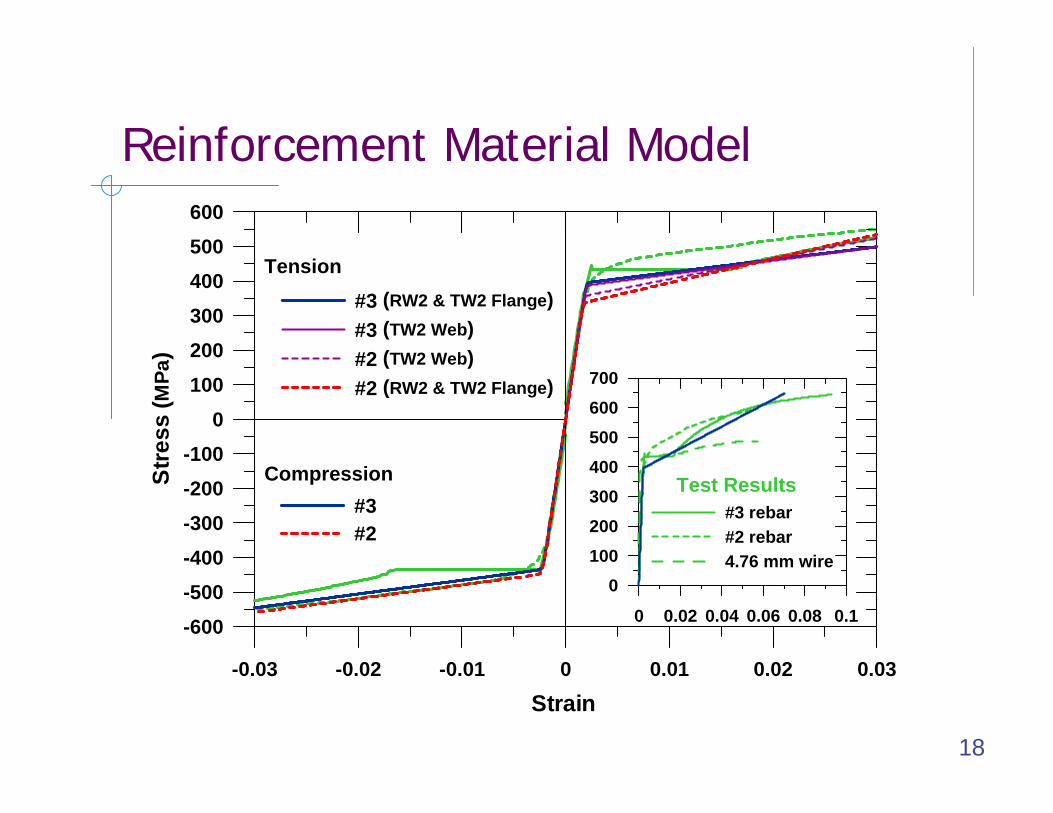
Reinforcement Material Model
-0.03 -0.02 -0.01 0 0.01 0.02 0.03
Strain
-600-500-400-300-200-100
0100200300400500600
Stre
ss (M
Pa)
#3 (RW2 & TW2 Flange)#3 (TW2 Web)#2 (TW2 Web)#2 (RW2 & TW2 Flange)
#3#2
0 0.02 0.04 0.06 0.08 0.1
0100200300400500600700
#3 rebar#2 rebar4.76 mm wire
Tension
Compression Test Results
19
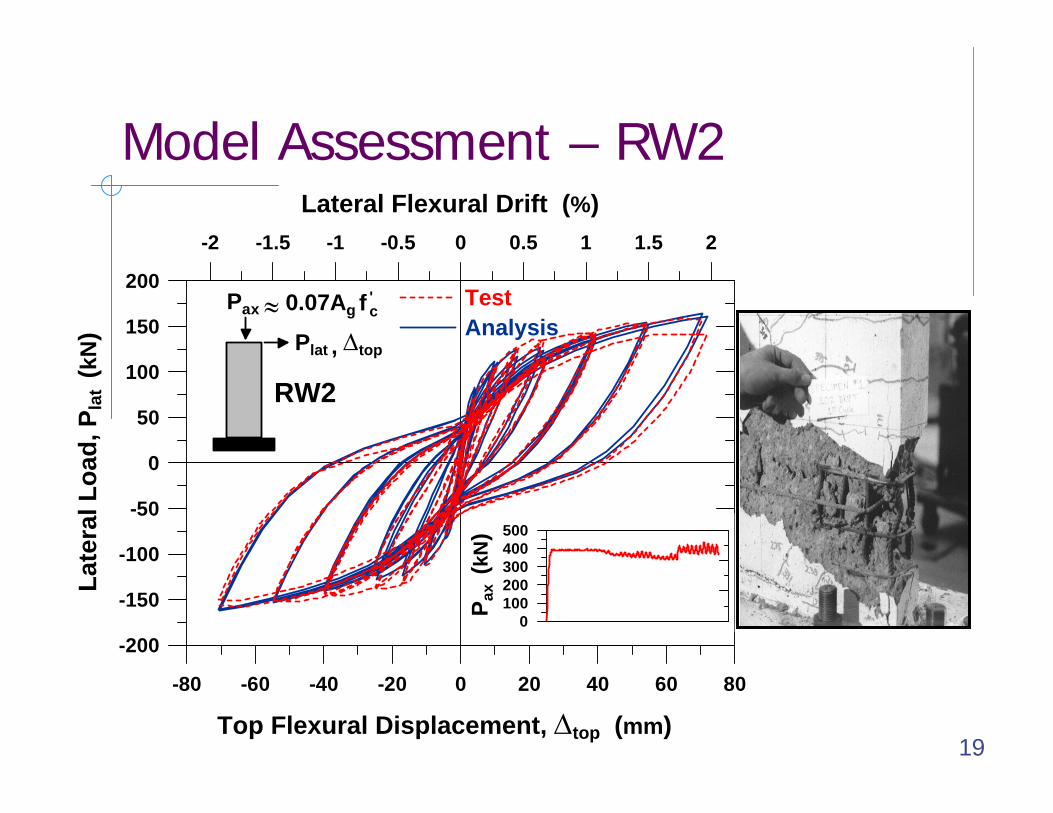
Model Assessment – RW2
-80 -60 -40 -20 0 20 40 60 80
Top Flexural Displacement, ∆top (mm)
-200
-150
-100
-50
0
50
100
150
200
Late
ral L
oad,
Pla
t (k
N)
-2 -1.5 -1 -0.5 0 0.5 1 1.5 2
Lateral Flexural Drift (%)
TestAnalysis
≈Pax 0.07Ag f c'
Plat , ∆top
0100200300400500
P ax
(kN
)
RW2
20
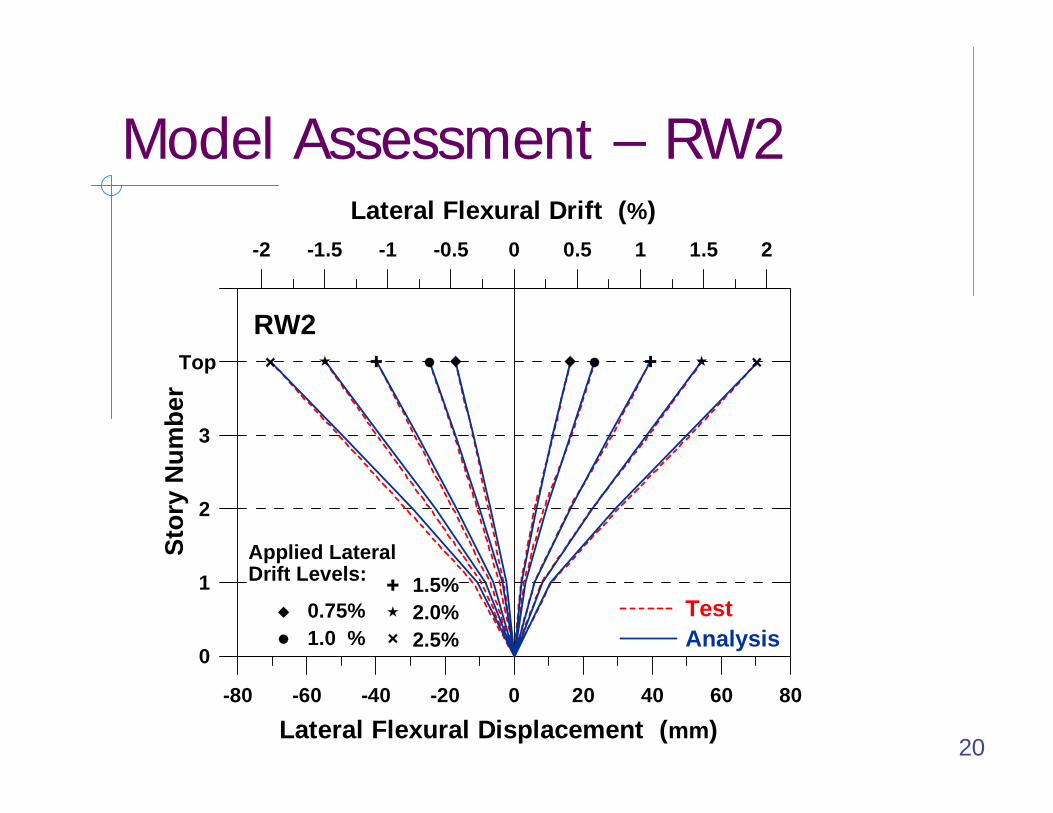
Model Assessment – RW2
-80 -60 -40 -20 0 20 40 60 80
Lateral Flexural Displacement (mm)
0
1
2
3
4
5
Stor
y N
umbe
r
-2 -1.5 -1 -0.5 0 0.5 1 1.5 2
Lateral Flexural Drift (%)
TestAnalysis
1.5%2.0%2.5%
0.75%1.0 %
RW2
Applied LateralDrift Levels:
Top
21
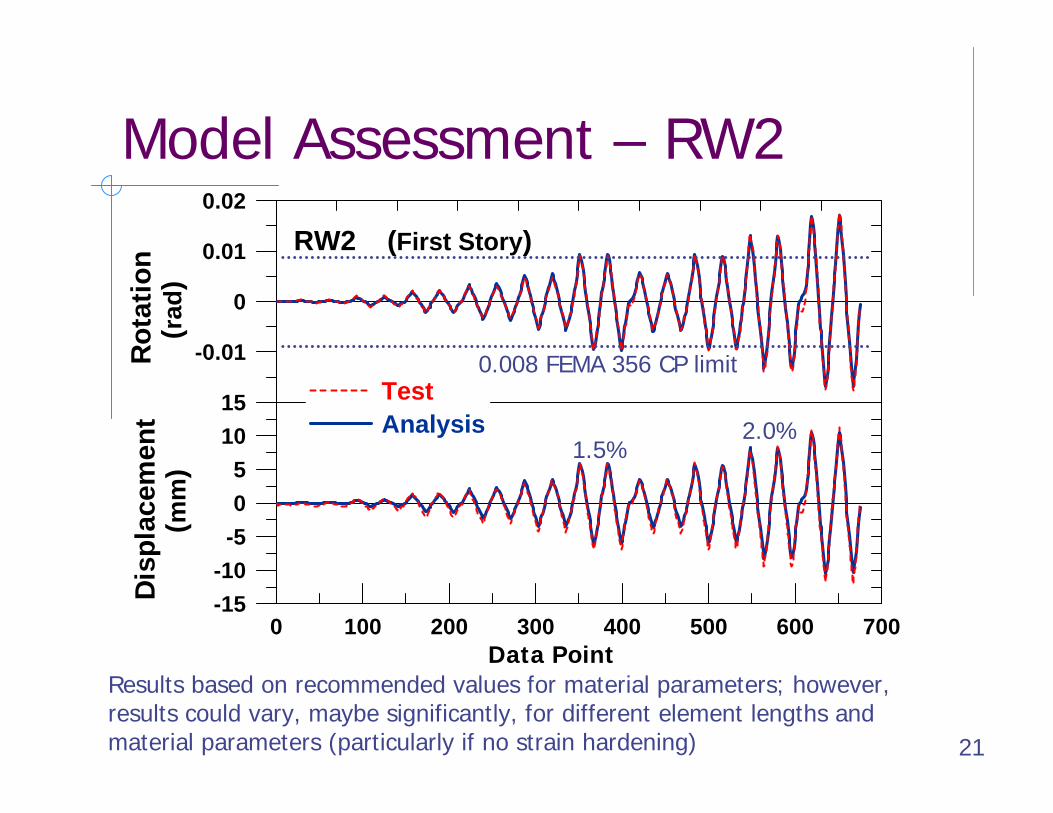
Model Assessment – RW2
-0.01
0
0.01
0.02
Rot
atio
n
( r
ad)
0 100 200 300 400 500 600 700-15-10
-505
1015
Dis
plac
emen
t
(
mm
)
TestAnalysis
RW2 (First Story)
Results based on recommended values for material parameters; however, results could vary, maybe significantly, for different element lengths and material parameters (particularly if no strain hardening)
1.5%2.0%
Data Point
0.008 FEMA 356 CP limit
22
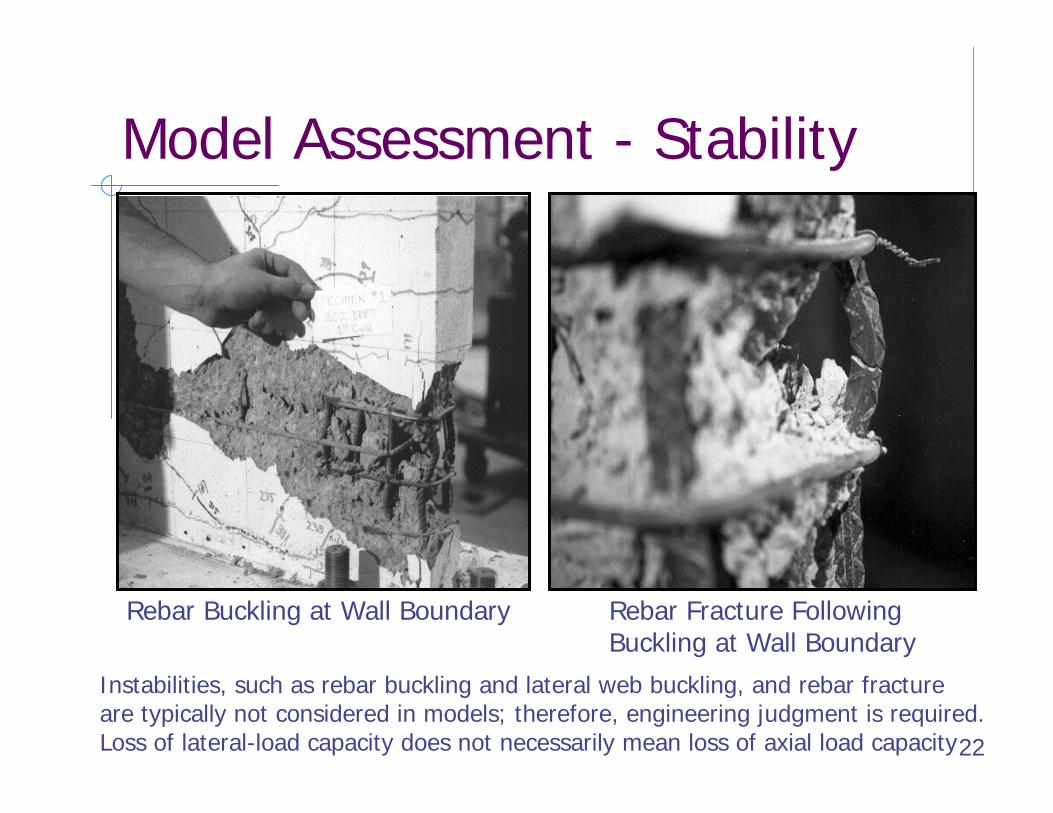
Model Assessment - Stability
Rebar Buckling at Wall Boundary Rebar Fracture Following Buckling at Wall Boundary
Instabilities, such as rebar buckling and lateral web buckling, and rebar fractureare typically not considered in models; therefore, engineering judgment is required. Loss of lateral-load capacity does not necessarily mean loss of axial load capacity
23
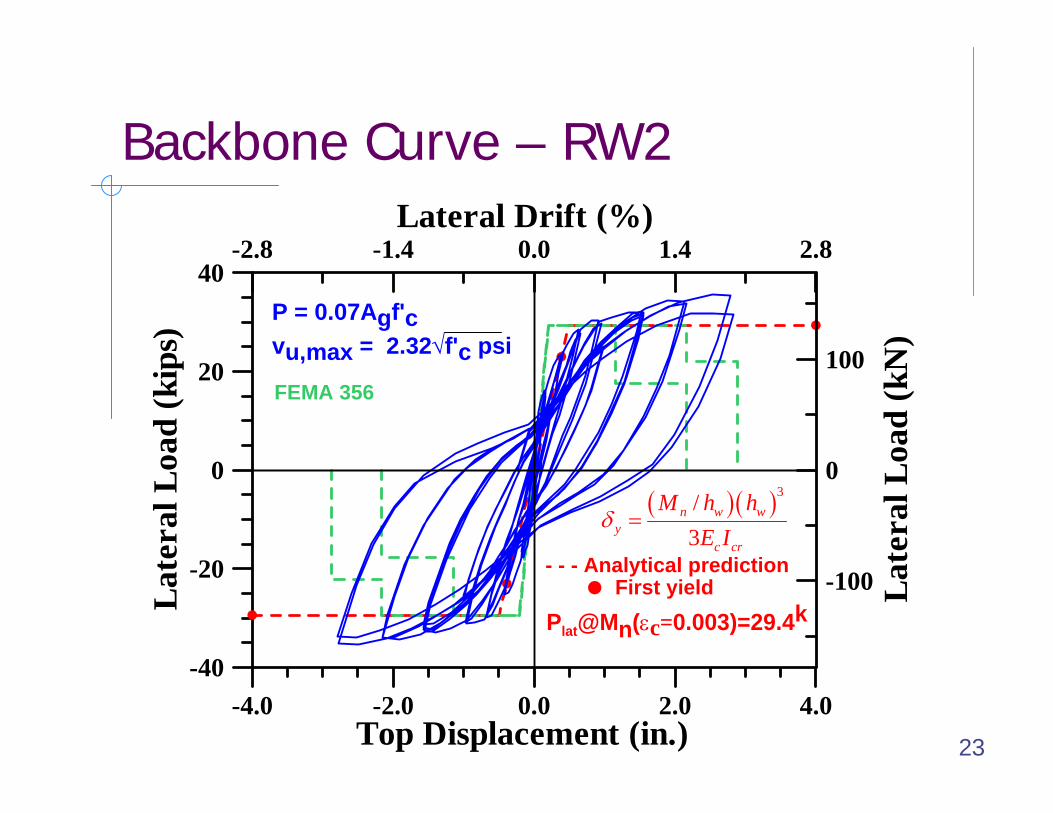
Backbone Curve – RW2
( )( )3/3
n w wy
c cr
M h hE I
δ =
P = 0.07Agf'cvu,max = 2.32√f'c psi
-4.0 -2.0 0.0 2.0 4.0Top Displacement (in.)
-40
-20
0
20
40
Late
ral L
oad
(kip
s)
-2.8 -1.4 0.0 1.4 2.8Lateral Drift (%)
Plat@Mn(εc=0.003)=29.4k-100
0
100
Late
ral L
oad
(kN
)
- - - Analytical prediction , First yield
FEMA 356
24
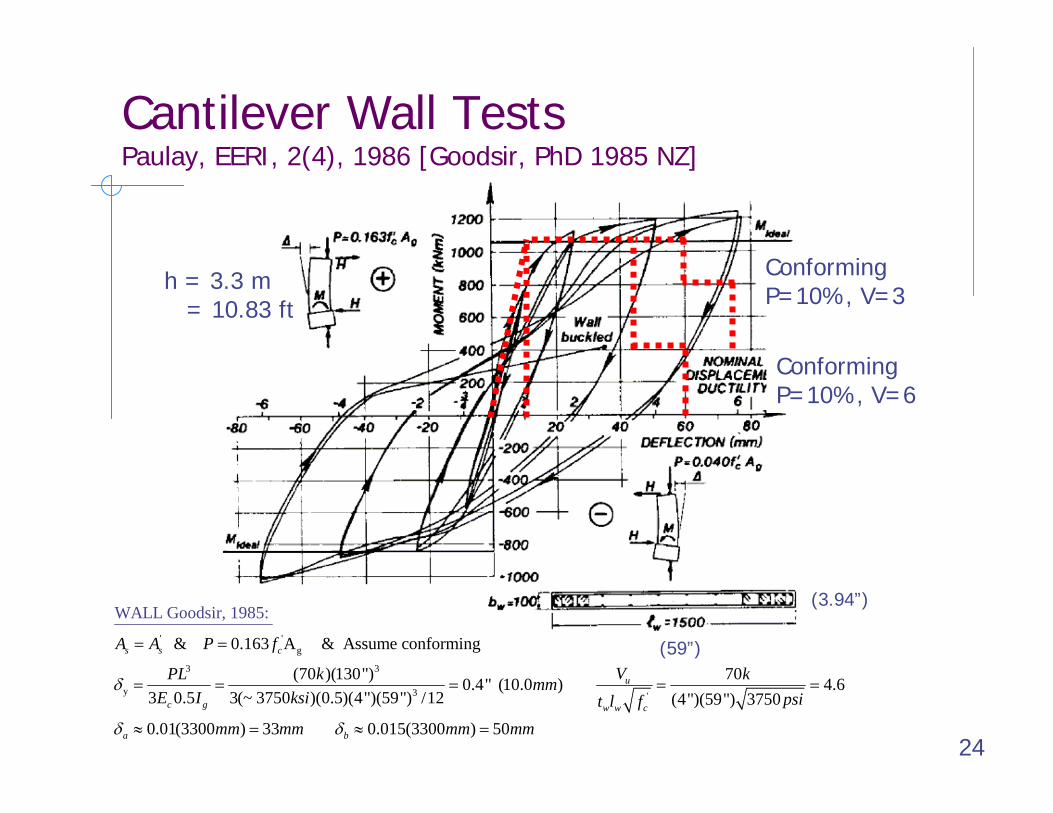
Cantilever Wall TestsPaulay, EERI, 2(4), 1986 [Goodsir, PhD 1985 NZ]
h = 3.3 m= 10.83 ft
(3.94”)
' 'g
3 3
y 3 '
& 0.163 A & Assume conforming
(70 )(130") 700.4" (10.0 ) 4.63 0.5 3(~
WALL Goodsir
3750 )(0.5)(4")(59") /12 (4")(59") 3750
0.01(33
, 1985:
00 ) 33
s s c
u
c g w w c
a
A A P f
VPL k kmmE I ksi psit l f
mm m
δ
δ
= =
= = = = =
≈ = 0.015(3300 ) 50bm mm mmδ ≈ =
(59”)
ConformingP=10%, V=3
ConformingP=10%, V=6
25
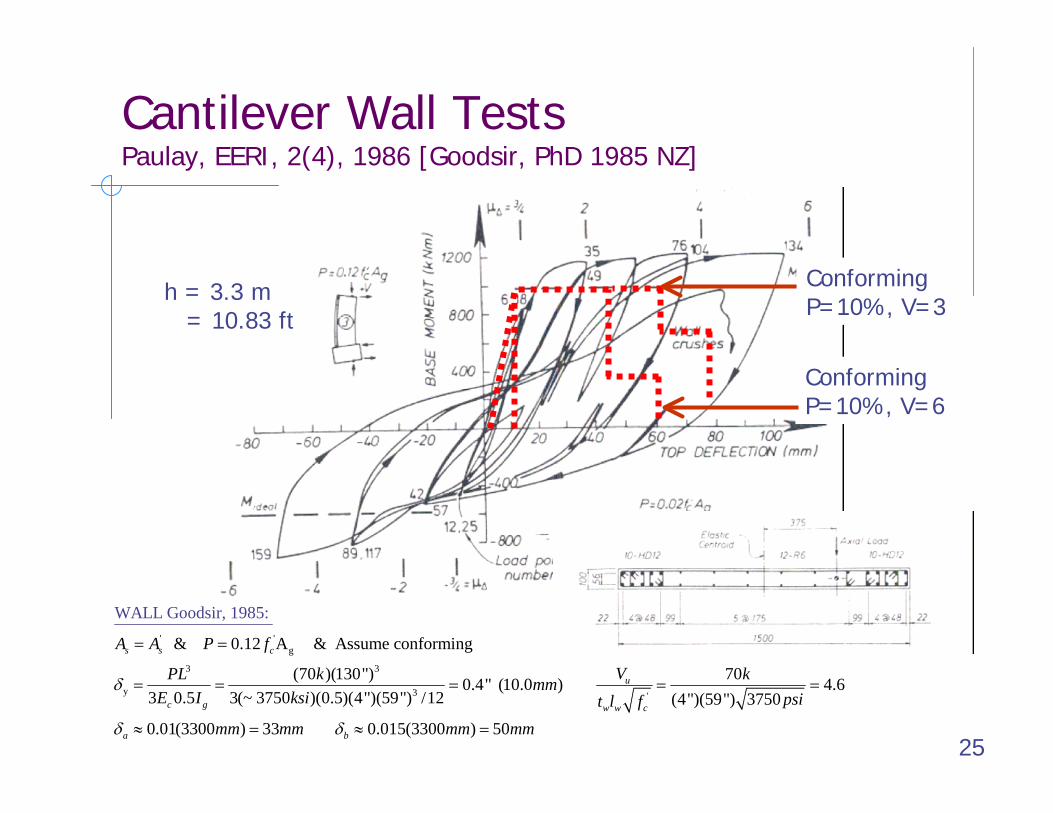
Cantilever Wall TestsPaulay, EERI, 2(4), 1986 [Goodsir, PhD 1985 NZ]
h = 3.3 m= 10.83 ft
' 'g
3 3
y 3 '
& 0.12 A & Assume conforming
(70 )(130") 700.4" (10.0 ) 4.63 0.5 3(~ 3
WALL Goodsir,
750 )(0.5)(4")(59") /12 (4")(59") 3750
0.01(330
1
0
8
)
5
3
:
3
9
s s c
u
c g w w c
a
A A P f
VPL k kmmE I ksi psit l f
mm mm
δ
δ
= =
= = = = =
≈ = 0.015(3300 ) 50b mm mmδ ≈ =
ConformingP=10%, V=3
ConformingP=10%, V=6
26
SummaryFEMA 356 Backbone Curves
In general, quite conservativeThis appears to be especially true for cases where moderate detailing is provided around boundary barsPossible reformat
Compute neutral axis depthIf s <12db over c/2, then modest ductility If s < 8db and transverse steel ratio is ~1/2 of ACI 318-05, then moderate ductility If s < 8db and transverse steel ratio is > 3/4 of ACI 318-05, then high ductility Do not reduce deformation capacity for shear stress below 5 roots f’c
27
Presentation Overview
Flexure
Shear
P-M-V Interaction & Modeling
Preliminary Test Results
28
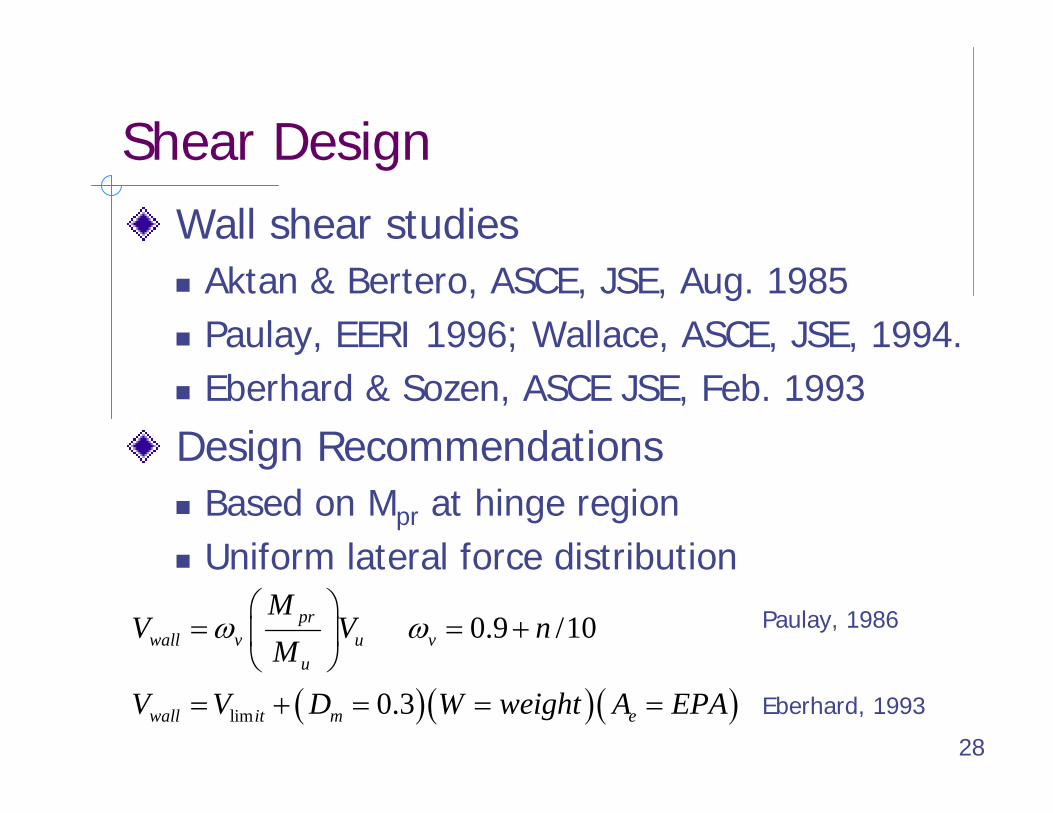
Shear DesignWall shear studies
Aktan & Bertero, ASCE, JSE, Aug. 1985Paulay, EERI 1996; Wallace, ASCE, JSE, 1994.Eberhard & Sozen, ASCE JSE, Feb. 1993
Design RecommendationsBased on Mpr at hinge regionUniform lateral force distribution
( )( )( )lim
0.9 /10
0.3
prwall v u v
u
wall it m e
MV V n
M
V V D W weight A EPA
ω ω⎛ ⎞
= = +⎜ ⎟⎝ ⎠
= + = = =
Paulay, 1986
Eberhard, 1993
29
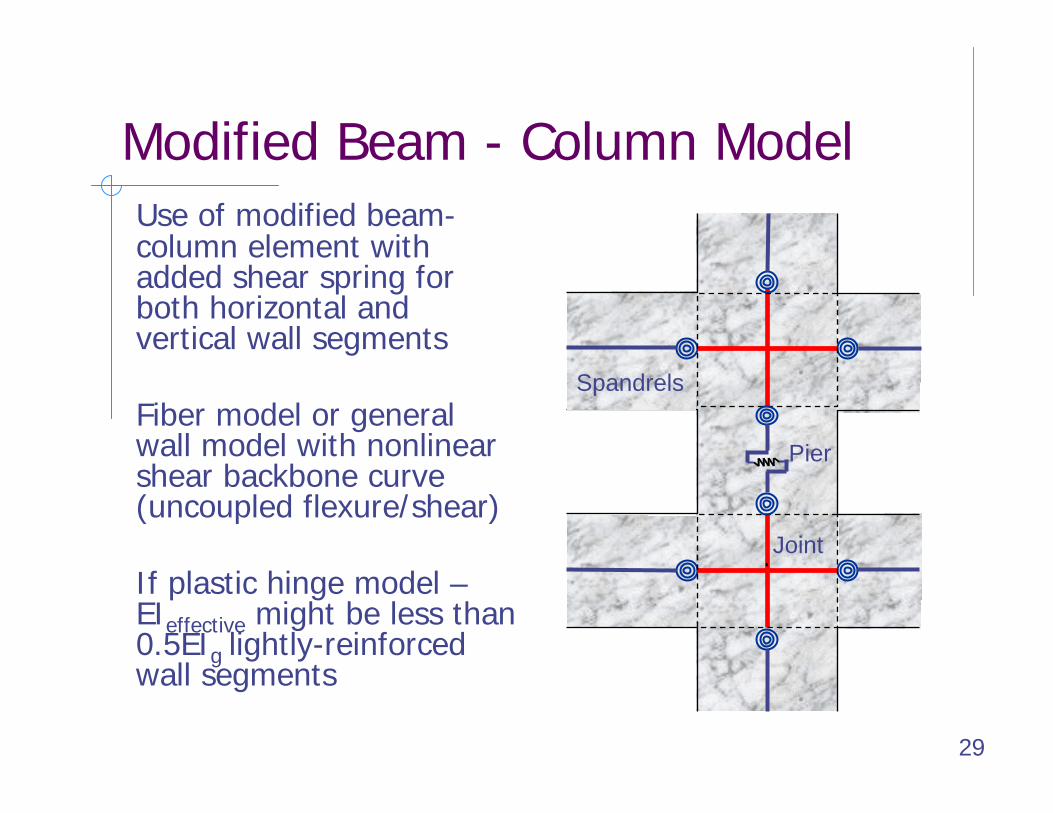
Modified Beam - Column ModelUse of modified beam-column element with added shear spring for both horizontal and vertical wall segments
Fiber model or general wall model with nonlinear shear backbone curve (uncoupled flexure/shear)
If plastic hinge model –EIeffective might be less than 0.5EIg lightly-reinforced wall segments
Spandrels
Pier
Joint
30
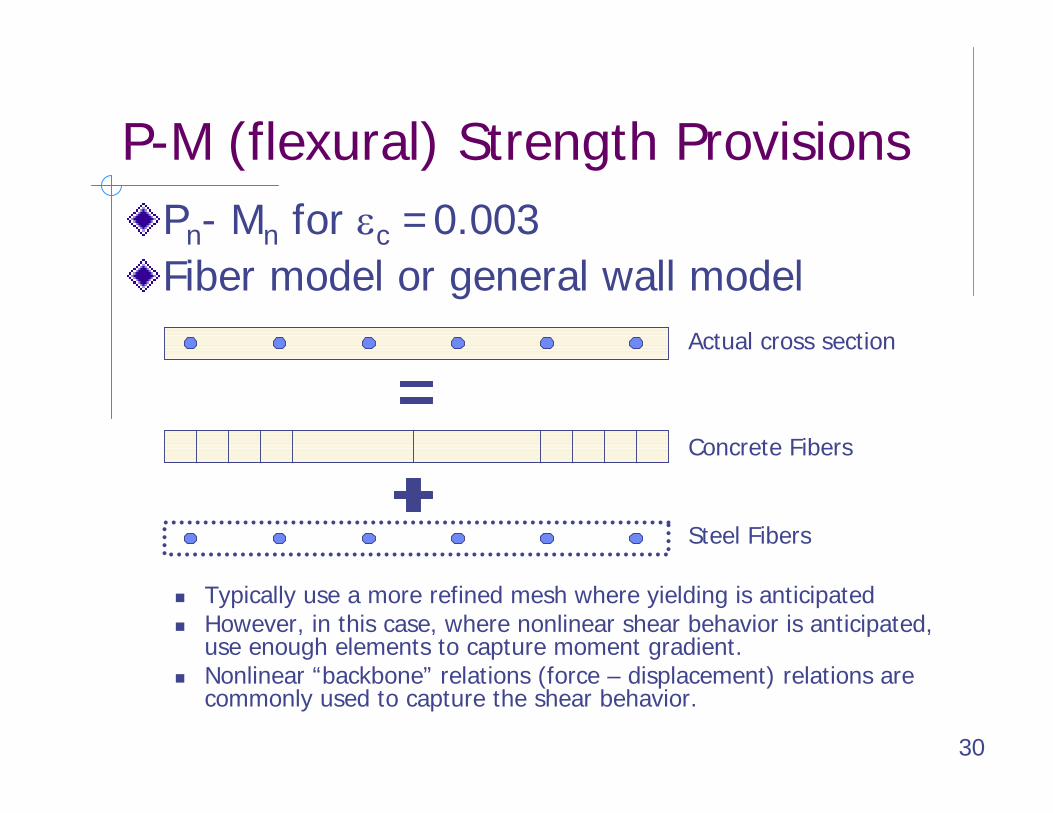
P-M (flexural) Strength ProvisionsPn- Mn for εc =0.003Fiber model or general wall model
Typically use a more refined mesh where yielding is anticipated However, in this case, where nonlinear shear behavior is anticipated, use enough elements to capture moment gradient. Nonlinear “backbone” relations (force – displacement) relations are commonly used to capture the shear behavior.
Actual cross section
Concrete Fibers
Steel Fibers
31
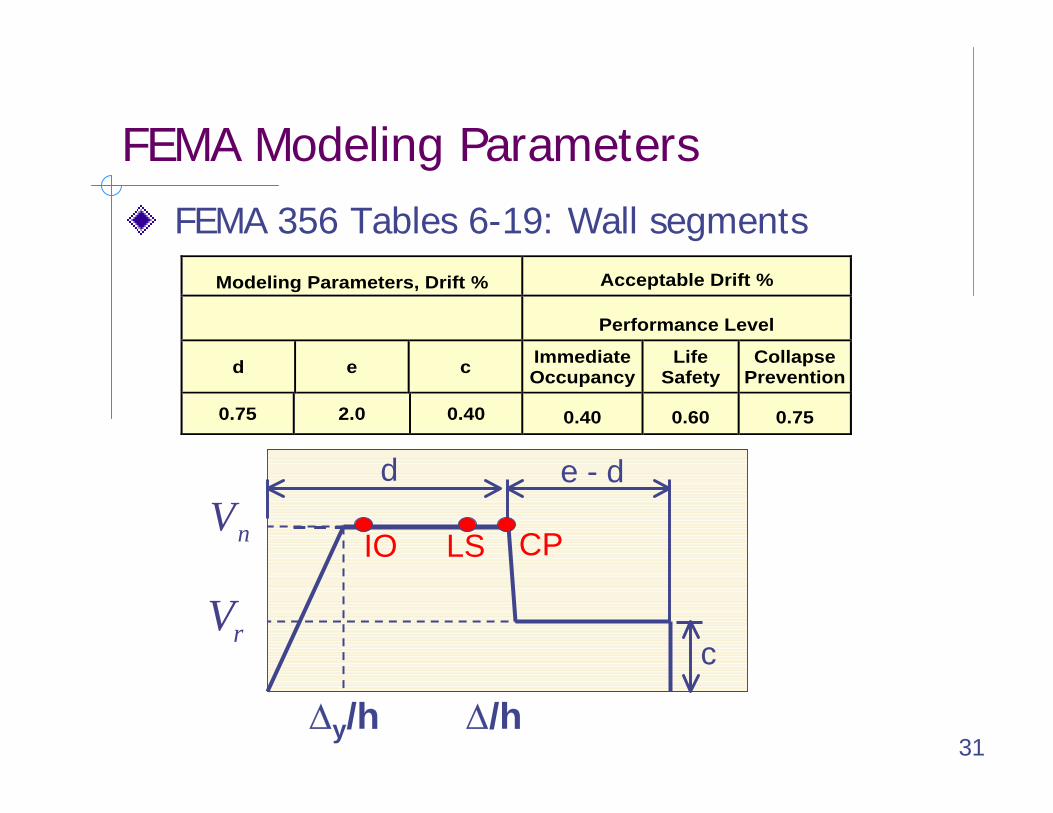
FEMA Modeling ParametersFEMA 356 Tables 6-19: Wall segments
Modeling Parameters, Drift % Acceptable Drift %
Performance Level
d e c Immediate Occupancy
Life Safety
Collapse Prevention
0.75 2.0 0.40 0.40 0.60 0.75
∆/h
CPLSIO
d e - d
c
∆y/h
nV
rV
32
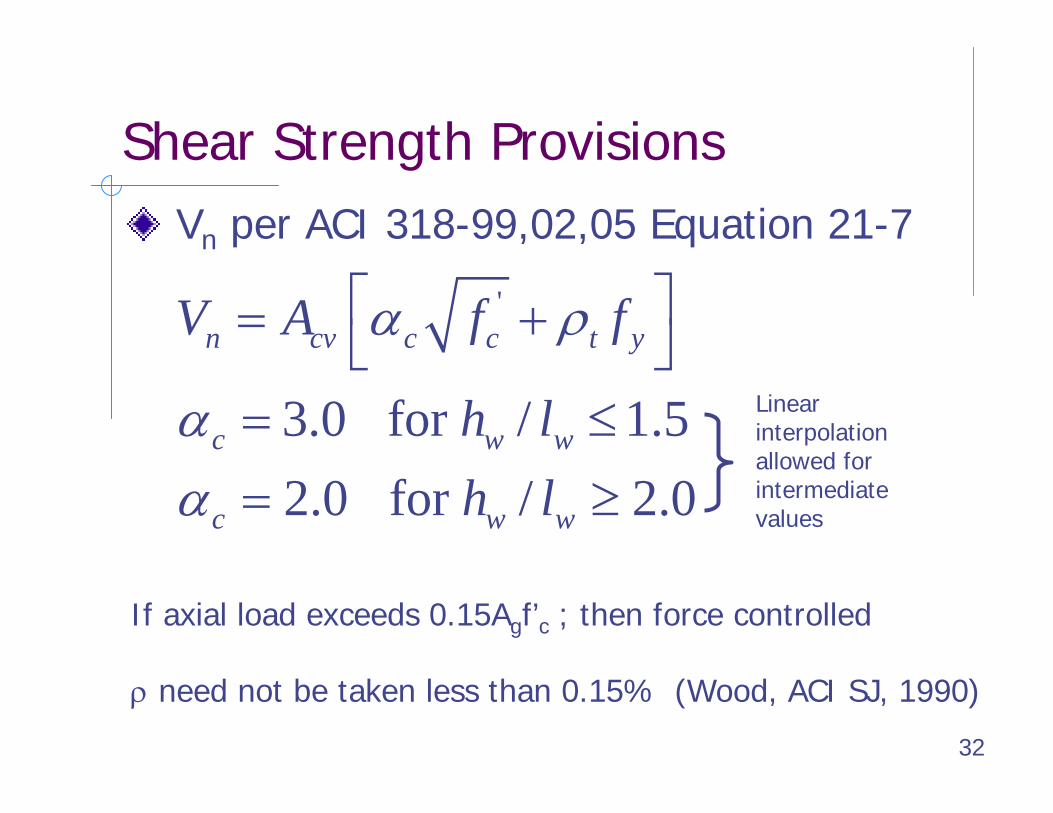
Shear Strength ProvisionsVn per ACI 318-99,02,05 Equation 21-7
'
3.0 for / 1.52.0 for / 2.0
n cv c c t y
c w w
c w w
V A f f
h lh l
α ρ
αα
⎡ ⎤= +⎣ ⎦= ≤
= ≥
Linear interpolationallowed for intermediatevalues
If axial load exceeds 0.15Agf’c ; then force controlled
ρ need not be taken less than 0.15% (Wood, ACI SJ, 1990)
33
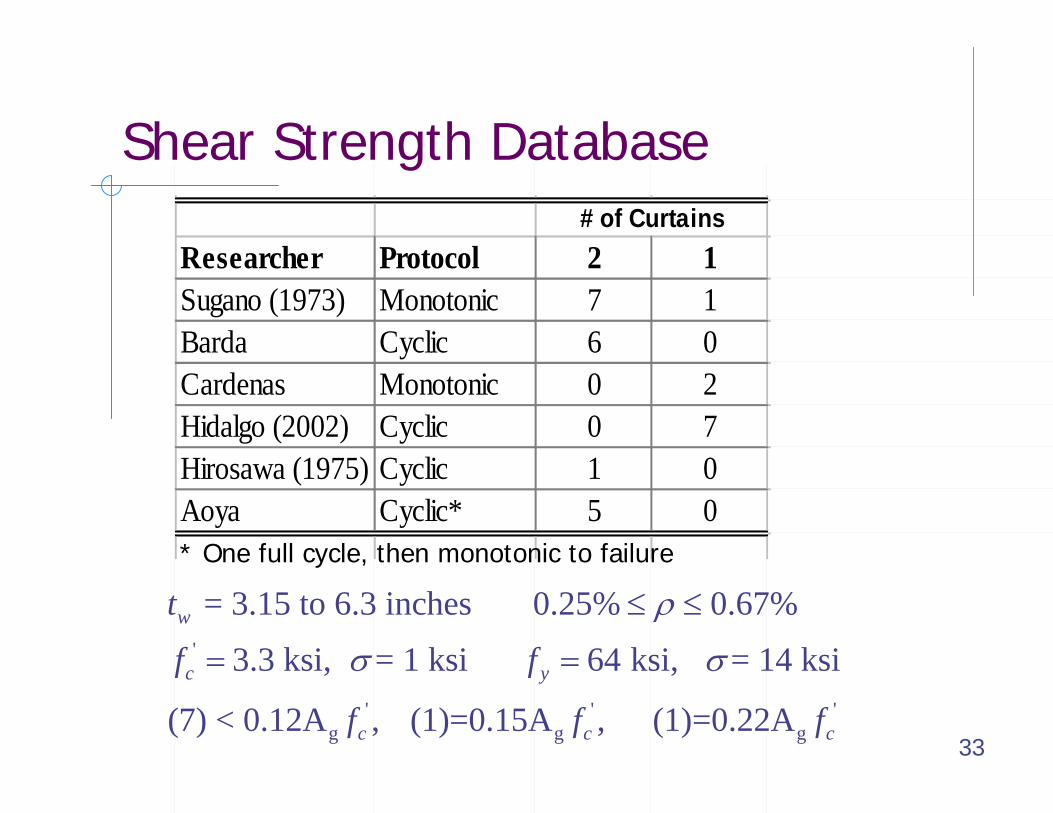
Shear Strength Database# of Curtains
Researcher Protocol 2 1Sugano (1973) Monotonic 7 1Barda Cyclic 6 0Cardenas Monotonic 0 2Hidalgo (2002) Cyclic 0 7Hirosawa (1975) Cyclic 1 0Aoya Cyclic* 5 0* One full cycle, then monotonic to failure
'
' ' 'g g g
= 3.15 to 6.3 inches 0.25% 0.67%
3.3 ksi, = 1 ksi 64 ksi, = 14 ksi
(7) < 0.12A , (1)=0.15A , (1)=0.22A
w
c y
c c c
t
f f
f f f
ρ
σ σ
≤ ≤
= =
34
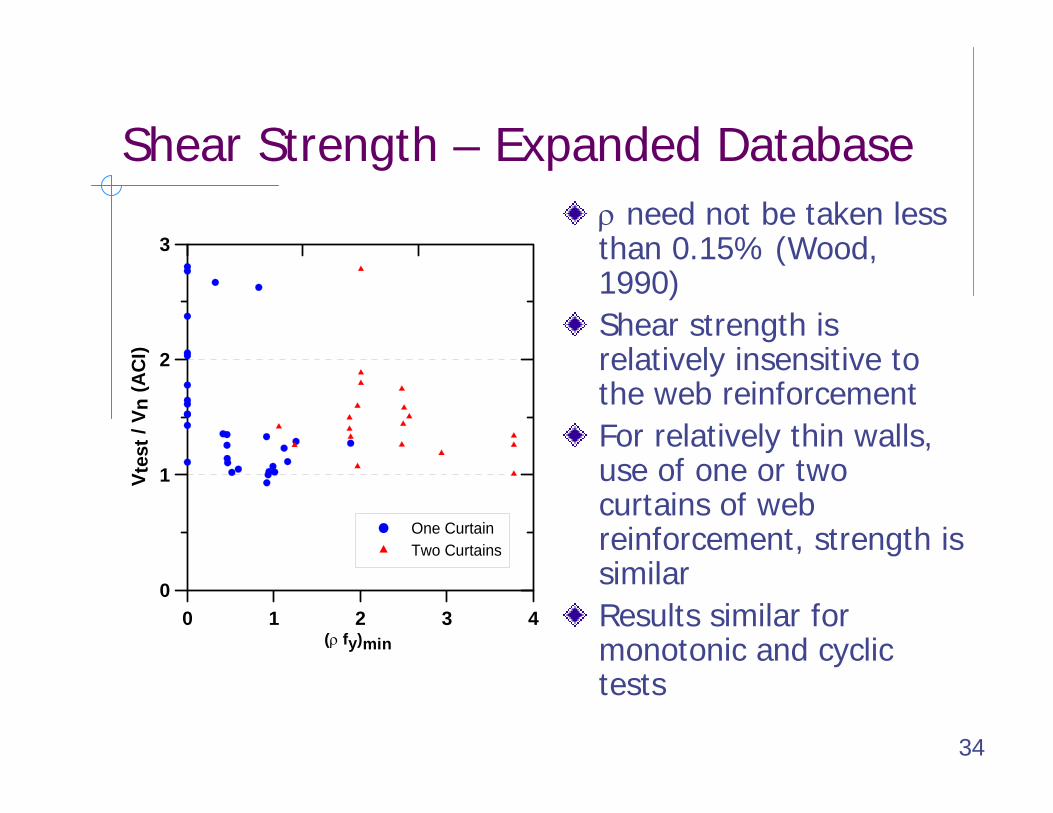
Shear Strength – Expanded Databaseρ need not be taken less than 0.15% (Wood, 1990)Shear strength is relatively insensitive to the web reinforcementFor relatively thin walls, use of one or two curtains of web reinforcement, strength is similarResults similar for monotonic and cyclic tests
0 1 2 3 4(ρ fy)min
0
1
2
3
V tes
t / V
n (A
CI)
One CurtainTwo Curtains
35
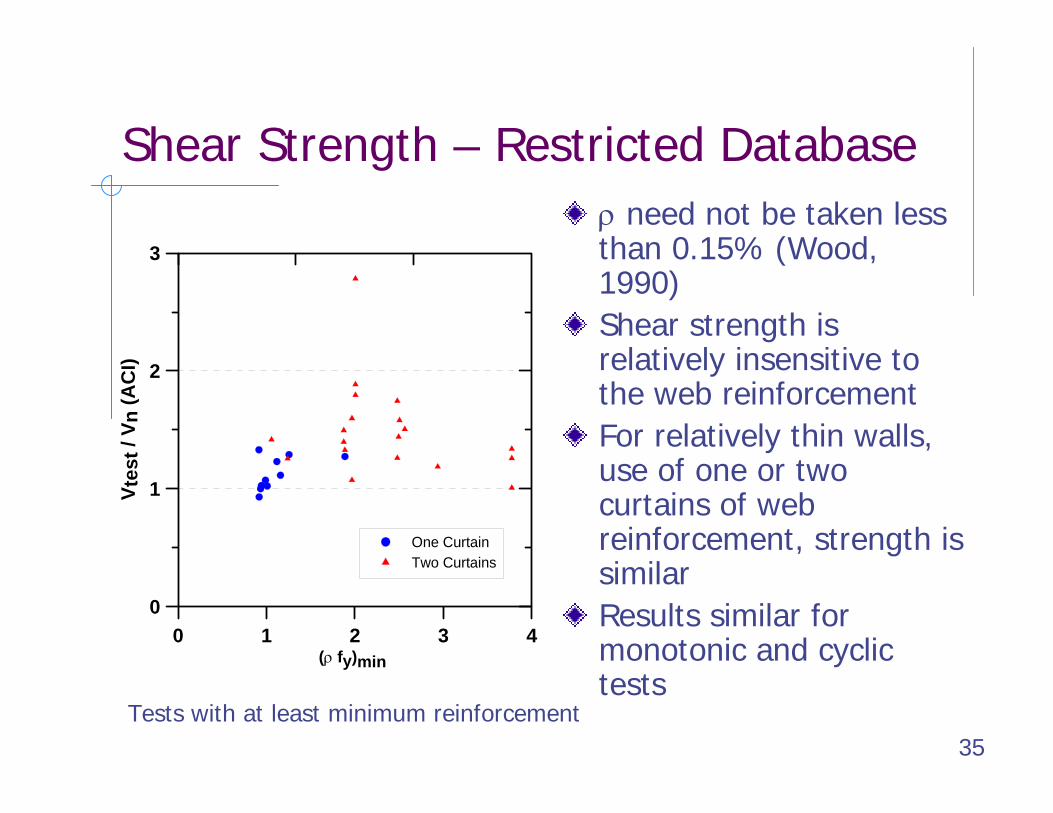
Shear Strength – Restricted Databaseρ need not be taken less than 0.15% (Wood, 1990)Shear strength is relatively insensitive to the web reinforcementFor relatively thin walls, use of one or two curtains of web reinforcement, strength is similarResults similar for monotonic and cyclic tests
0 1 2 3 4(ρ fy)min
0
1
2
3
V tes
t / V
n (A
CI)
One CurtainTwo Curtains
Tests with at least minimum reinforcement

36
FEMA Modeling ParametersFEMA 356 Tables 6-19: Wall segments
Modeling Parameters, Drift % Acceptable Drift %
Performance Level
d e c Immediate Occupancy
Life Safety
Collapse Prevention
0.75 2.0 0.40 0.40 0.60 0.75
∆/h
CPLSIO
d e - d
c
∆y/h
nV
rV
37
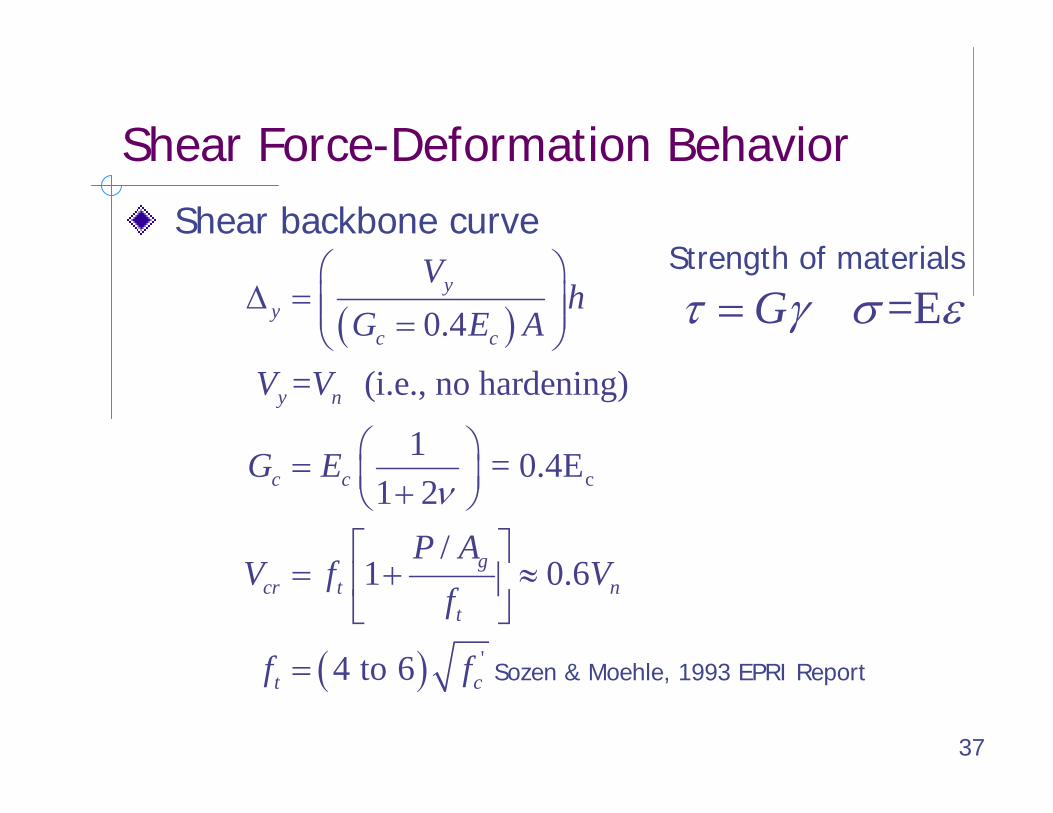
Shear Force-Deformation BehaviorShear backbone curve
( )
( )
c
'
0.4
= (i.e., no hardening)
1 = 0.4E1 2
/1 0.6
4 to 6
yy
c c
y n
c c
gcr t n
t
t c
Vh
G E A
V V
G E
P AV f V
f
f f
ν
⎛ ⎞∆ = ⎜ ⎟⎜ ⎟=⎝ ⎠
⎛ ⎞= ⎜ ⎟+⎝ ⎠⎡ ⎤
= + ≈⎢ ⎥⎣ ⎦
= Sozen & Moehle, 1993 EPRI Report
Strength of materials
=EGτ γ σ ε=
38
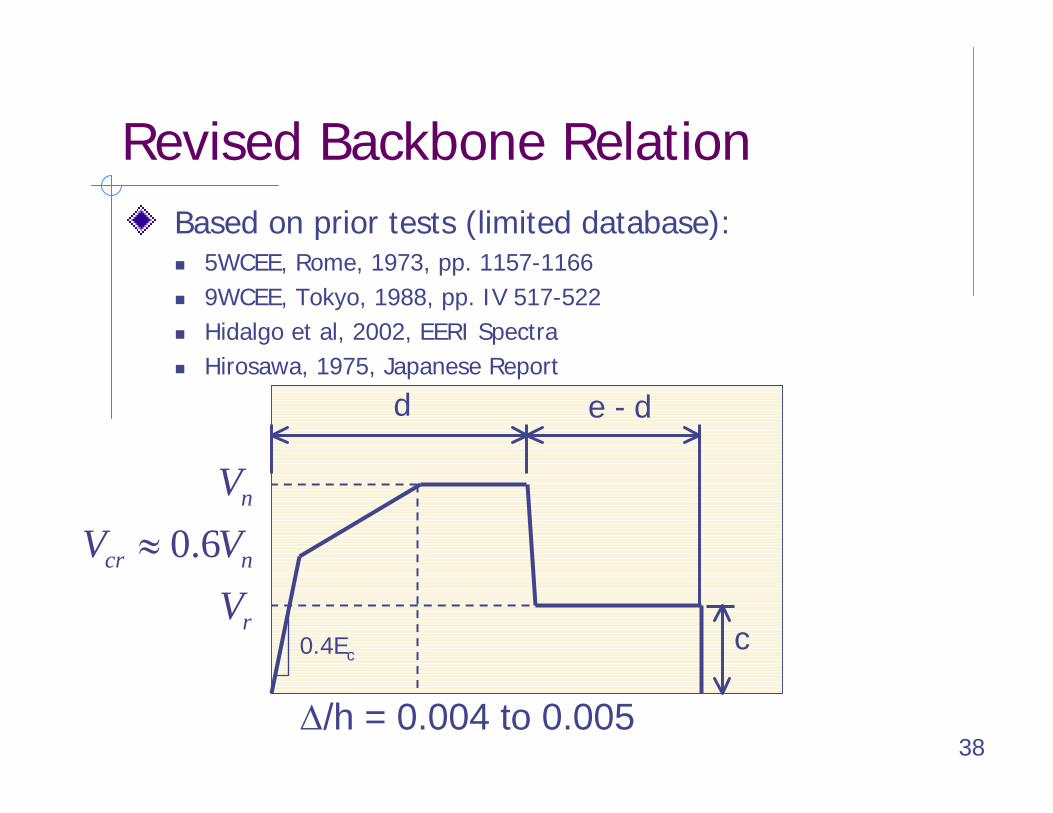
Revised Backbone RelationBased on prior tests (limited database):
5WCEE, Rome, 1973, pp. 1157-11669WCEE, Tokyo, 1988, pp. IV 517-522Hidalgo et al, 2002, EERI SpectraHirosawa, 1975, Japanese Report
d e - d
c
0.6n
cr n
r
VV V
V≈
∆/h = 0.004 to 0.005
0.4Ec
39
ObservationsLimited test data
Stiffness and Deformation capacity –specimens tend to be stiff and strong, test control is challenging and reported stiffness and deformation values may be suspectResidual strength – most tests not continued beyond modest strength degradation (~20%)One row in FEMA table 6-19
Nominal StrengthTest results indicated nominal strength in the range of 100 to 200% of the ACI value
40
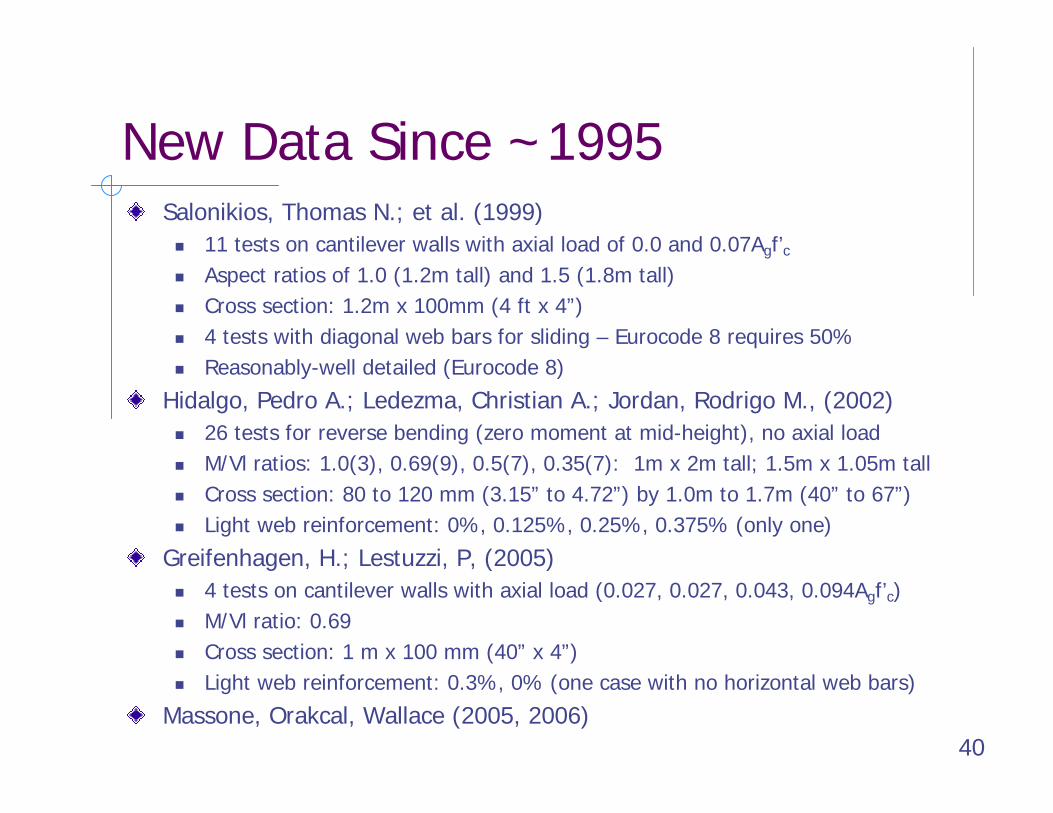
New Data Since ~1995Salonikios, Thomas N.; et al. (1999)
11 tests on cantilever walls with axial load of 0.0 and 0.07Agf’cAspect ratios of 1.0 (1.2m tall) and 1.5 (1.8m tall)Cross section: 1.2m x 100mm (4 ft x 4”)4 tests with diagonal web bars for sliding – Eurocode 8 requires 50% Reasonably-well detailed (Eurocode 8)
Hidalgo, Pedro A.; Ledezma, Christian A.; Jordan, Rodrigo M., (2002)26 tests for reverse bending (zero moment at mid-height), no axial loadM/Vl ratios: 1.0(3), 0.69(9), 0.5(7), 0.35(7): 1m x 2m tall; 1.5m x 1.05m tallCross section: 80 to 120 mm (3.15” to 4.72”) by 1.0m to 1.7m (40” to 67”) Light web reinforcement: 0%, 0.125%, 0.25%, 0.375% (only one)
Greifenhagen, H.; Lestuzzi, P, (2005) 4 tests on cantilever walls with axial load (0.027, 0.027, 0.043, 0.094Agf’c)M/Vl ratio: 0.69Cross section: 1 m x 100 mm (40” x 4”)Light web reinforcement: 0.3%, 0% (one case with no horizontal web bars)
Massone, Orakcal, Wallace (2005, 2006)
41
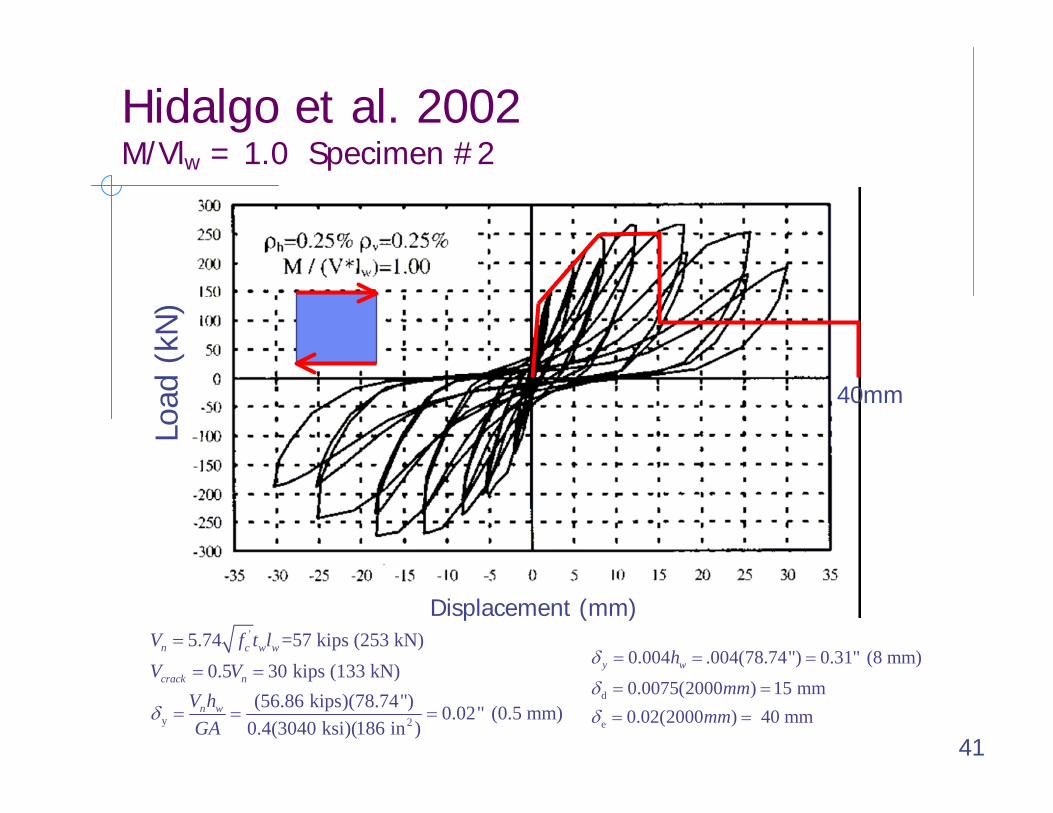
Hidalgo et al. 2002M/Vlw = 1.0 Specimen #2
d
e
0.004 .004(78.74") 0.31" (8 mm)
0.0075(2000 ) 15 mm0.02(2000 ) 40 mm
y wh
mmmm
δ
δδ
= = =
= == =
'
y 2
5.74 =57 kips (253 kN) 0.5 30 kips (133 kN)
(56.86 kips)(78.74") 0.02" (0.5 mm)0.4(3040 ksi)(186 in )
n c w w
crack n
n w
V f t lV V
V hGA
δ
=
= =
= = =
40mm
Displacement (mm)
Load
(kN
)
42
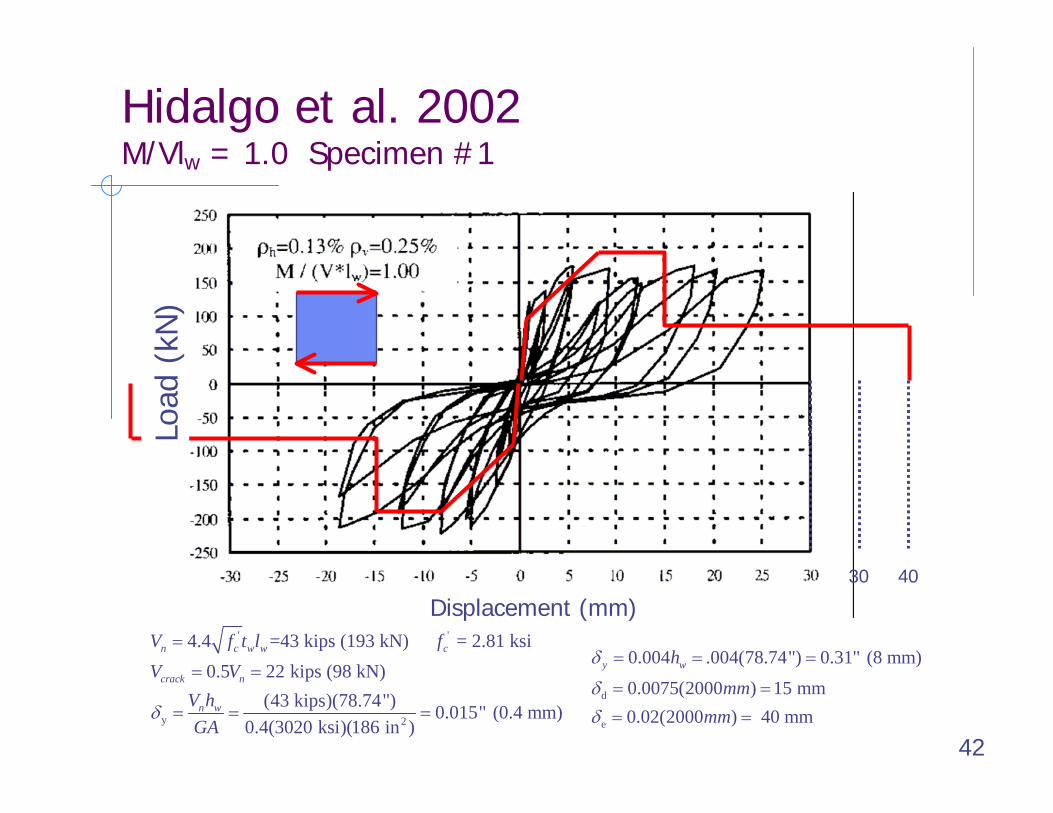
Hidalgo et al. 2002M/Vlw = 1.0 Specimen #1
d
e
0.004 .004(78.74") 0.31" (8 mm)
0.0075(2000 ) 15 mm0.02(2000 ) 40 mm
y wh
mmmm
δ
δδ
= = =
= == =
' '
y 2
4.4 =43 kips (193 kN) = 2.81 ksi0.5 22 kips (98 kN)
(43 kips)(78.74") 0.015" (0.4 mm)0.4(3020 ksi)(186 in )
n c w w c
crack n
n w
V f t l fV V
V hGA
δ
=
= =
= = =
30 40
Displacement (mm)
Load
(kN
)
43
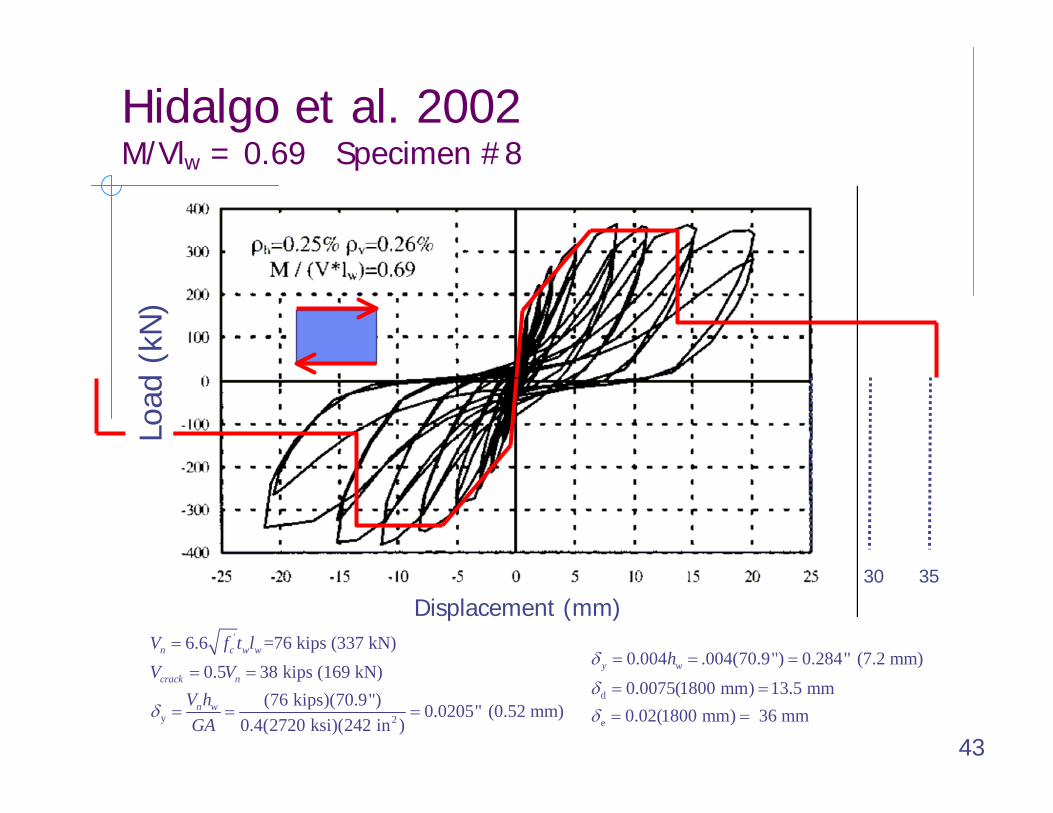
Hidalgo et al. 2002M/Vlw = 0.69 Specimen #8
d
e
0.004 .004(70.9") 0.284" (7.2 mm)
0.0075(1800 mm) 13.5 mm0.02(1800 mm) 36 mm
y whδ
δδ
= = =
= =
= =
'
y 2
6.6 =76 kips (337 kN) 0.5 38 kips (169 kN)
(76 kips)(70.9") 0.0205" (0.52 mm)0.4(2720 ksi)(242 in )
n c w w
crack n
n w
V f t lV V
V hGA
δ
=
= =
= = =
Displacement (mm)30 35
Load
(kN
)

44
Presentation Overview
Flexure
Shear
P-M-V Interaction & Modeling
Preliminary Test Results
45
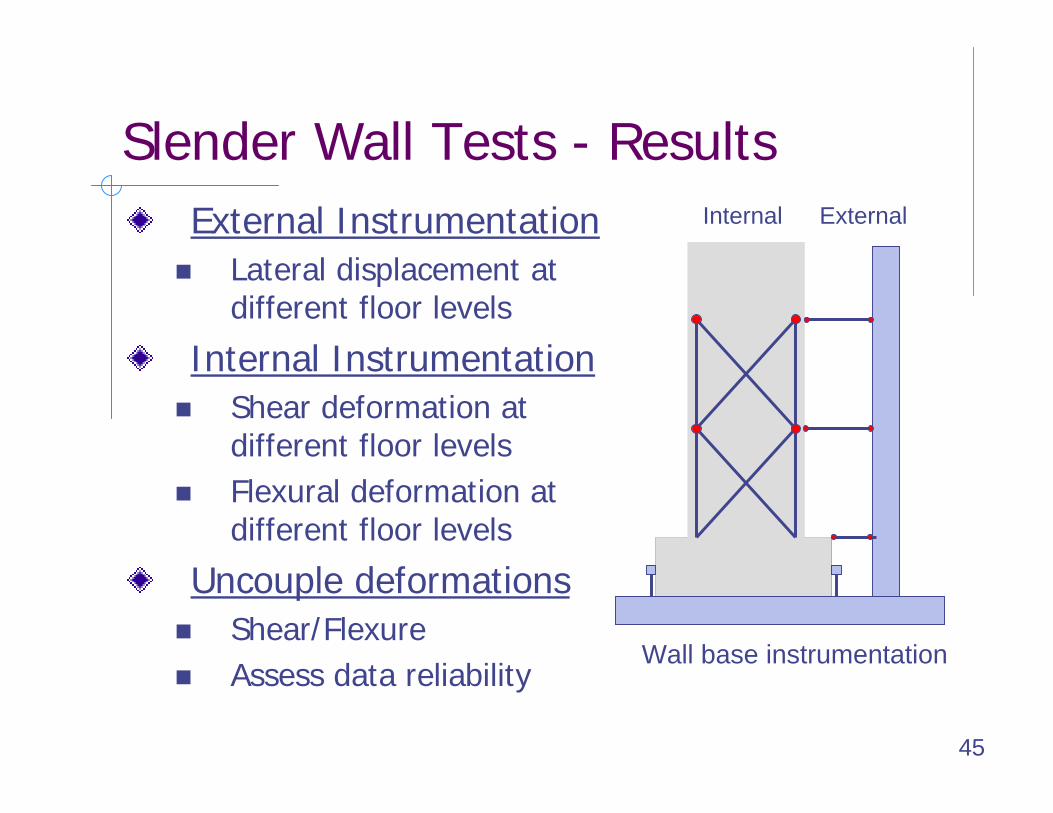
Slender Wall Tests - ResultsExternal Instrumentation
Lateral displacement at different floor levels
Internal InstrumentationShear deformation at different floor levelsFlexural deformation at different floor levels
Uncouple deformationsShear/FlexureAssess data reliability
Wall base instrumentation
Internal External
46
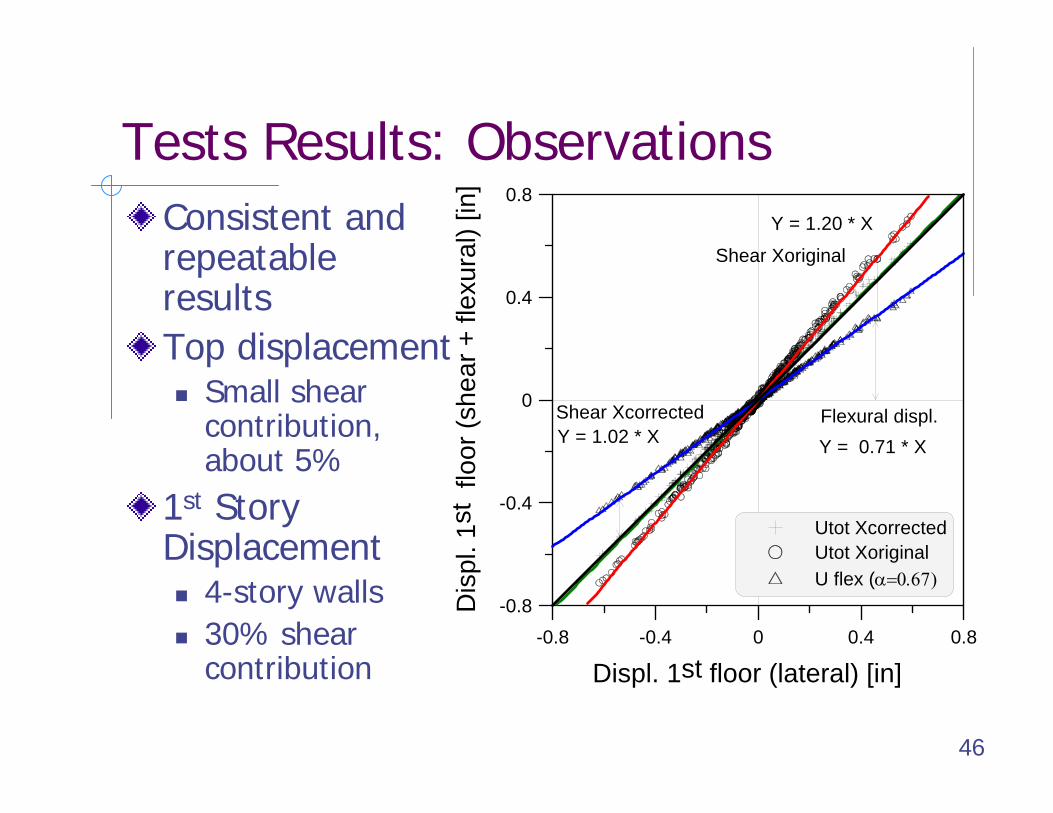
Tests Results: Observations
-0.8 -0.4 0 0.4 0.8
Displ. 1st floor (lateral) [in]
-0.8
-0.4
0
0.4
0.8
Dis
pl. 1
st f
loor
(she
ar +
flex
ural
) [in
]
Utot XcorrectedUtot XoriginalU flex (α=0.67)
Y = 1.02 * X
Y = 1.20 * X
Flexural displ.Shear Xcorrected
Shear Xoriginal
Y = 0.71 * X
Consistent and repeatable resultsTop displacement
Small shear contribution, about 5%
1st Story Displacement
4-story walls30% shear contribution
47
Uf
αh θ
Uf
h
Us
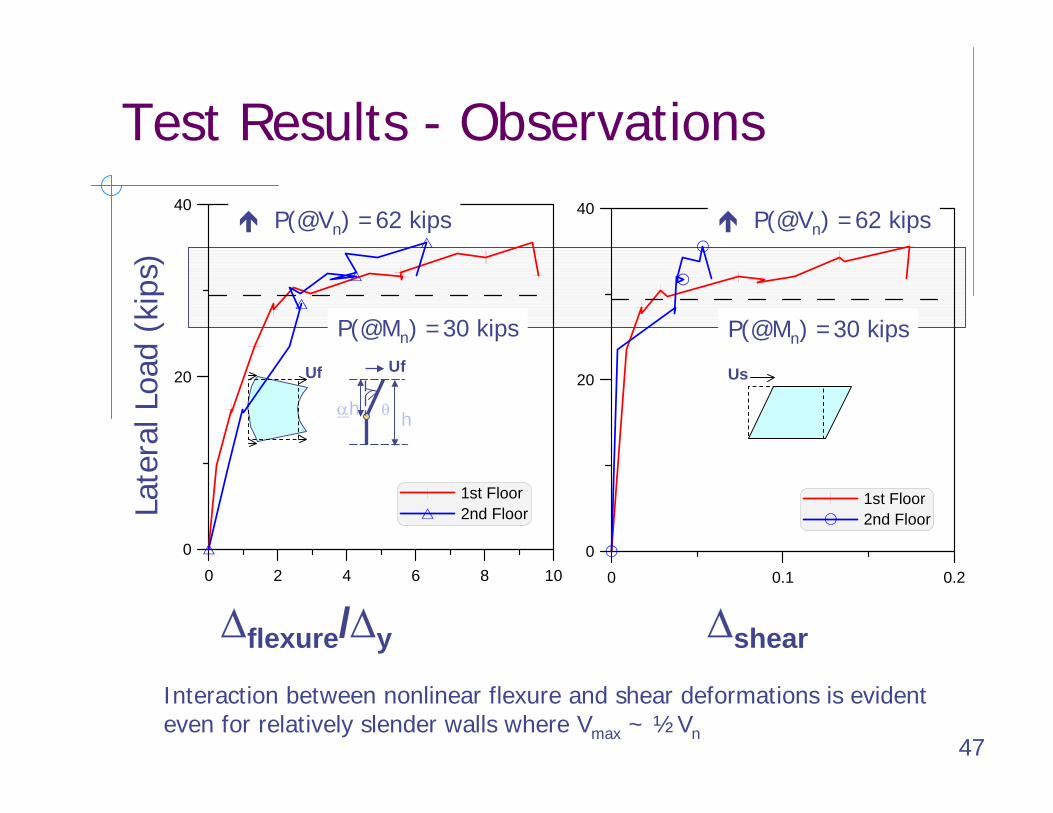
Test Results - Observations
0 0.1 0.2
Shear displacement [in]
0
20
40
1st Floor2nd Floor
P(@Vn) = 62 [kips]
P(@Mn) = 29.4 [kips]
0 2 4 6 8 10
Flexural displacement [in/in]
0
20
40
1st Floor2nd Floor
P(@Vn) = 62 [kips]
P(@Mn) = 29.4 [kips]
∆flexure/∆y ∆shear
Late
ral L
oad
(kip
s)
P(@Vn) =62 kips P(@Vn) =62 kips
P(@Mn) =30 kips P(@Mn) =30 kips
Interaction between nonlinear flexure and shear deformations is evident even for relatively slender walls where Vmax ~ ½Vn
48
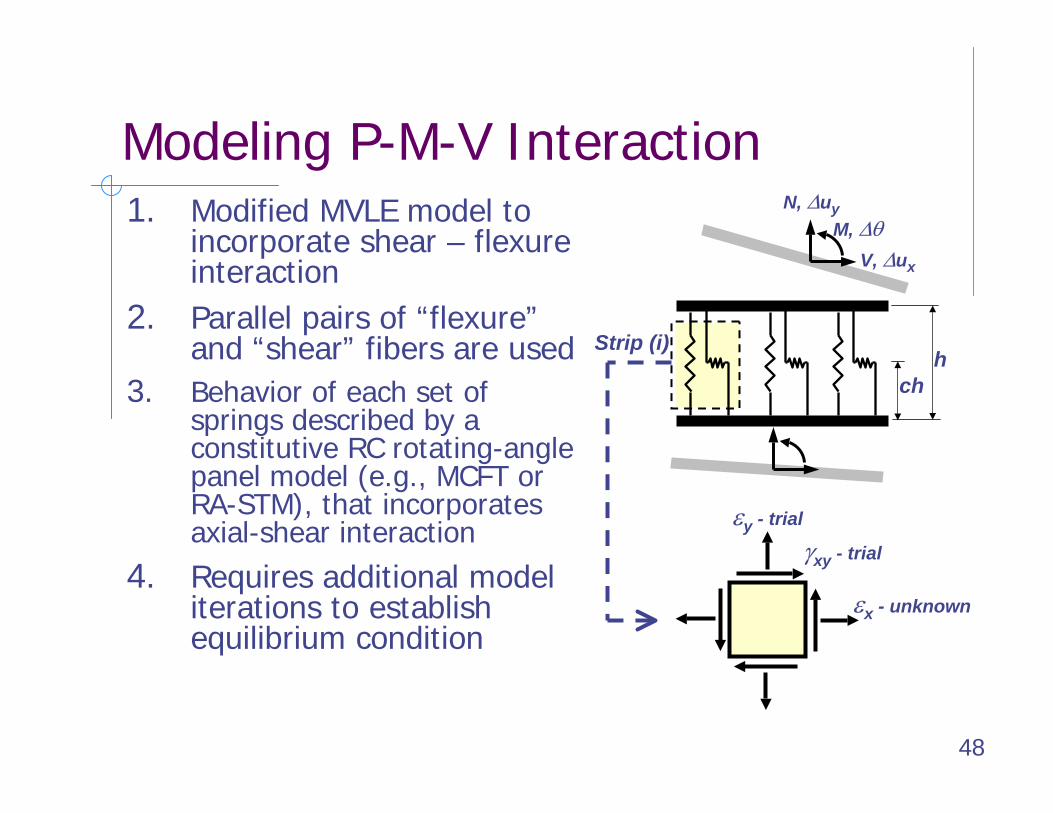
Modeling P-M-V Interaction1. Modified MVLE model to
incorporate shear – flexure interaction
2. Parallel pairs of “flexure” and “shear” fibers are used
3. Behavior of each set of springs described by a constitutive RC rotating-angle panel model (e.g., MCFT or RA-STM), that incorporates axial-shear interaction
4. Requires additional model iterations to establish equilibrium condition
Strip (i)
chh
N, ∆uy
V, ∆ux
M, ∆θ
εx - unknown
γxy - trial
εy - trial
49
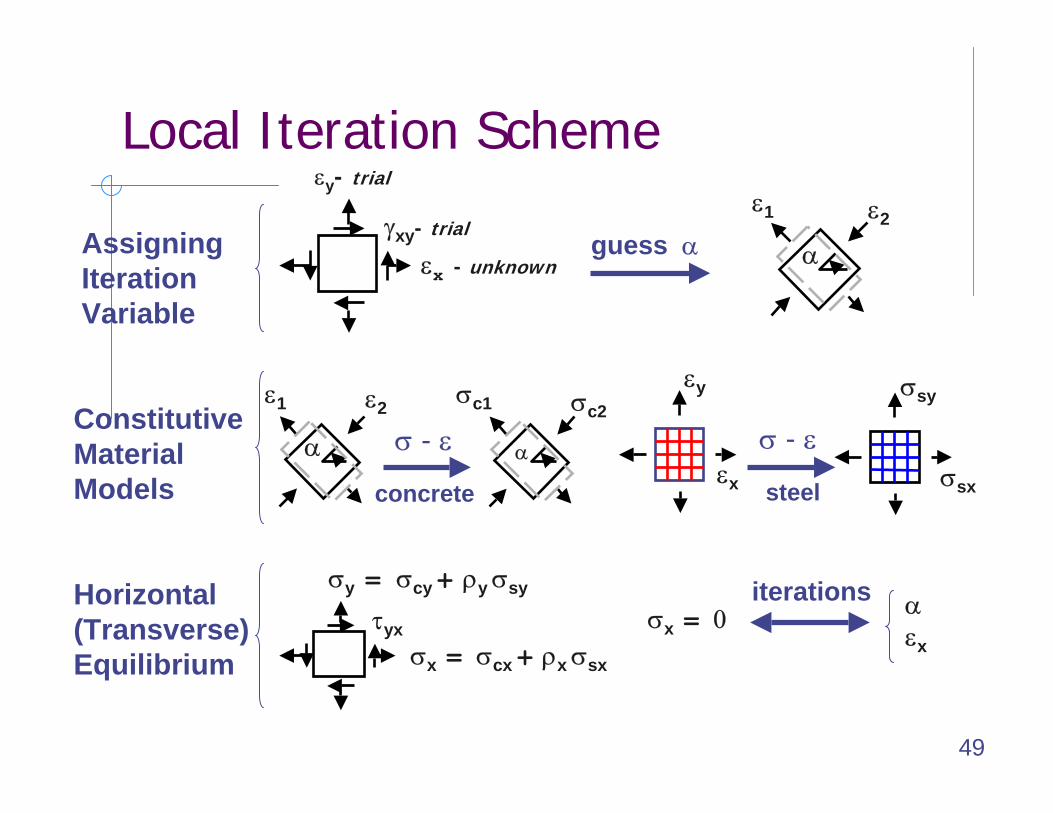
AssigningIteration Variable
ConstitutiveMaterial Models
Horizontal (Transverse) Equilibrium
ε2ε1
α
εy- trial
εx - unknown
γxy- trialguess α
σc2σc1
α
ε2ε1
α
εy
εx
σsy
σsx
σy = σcy+ ρy σsy
σx = σcx + ρx σsx
τyx
Local Iteration Scheme
σ - ε
concrete
σ - ε
steel
σx = 0iterations α
εx
50
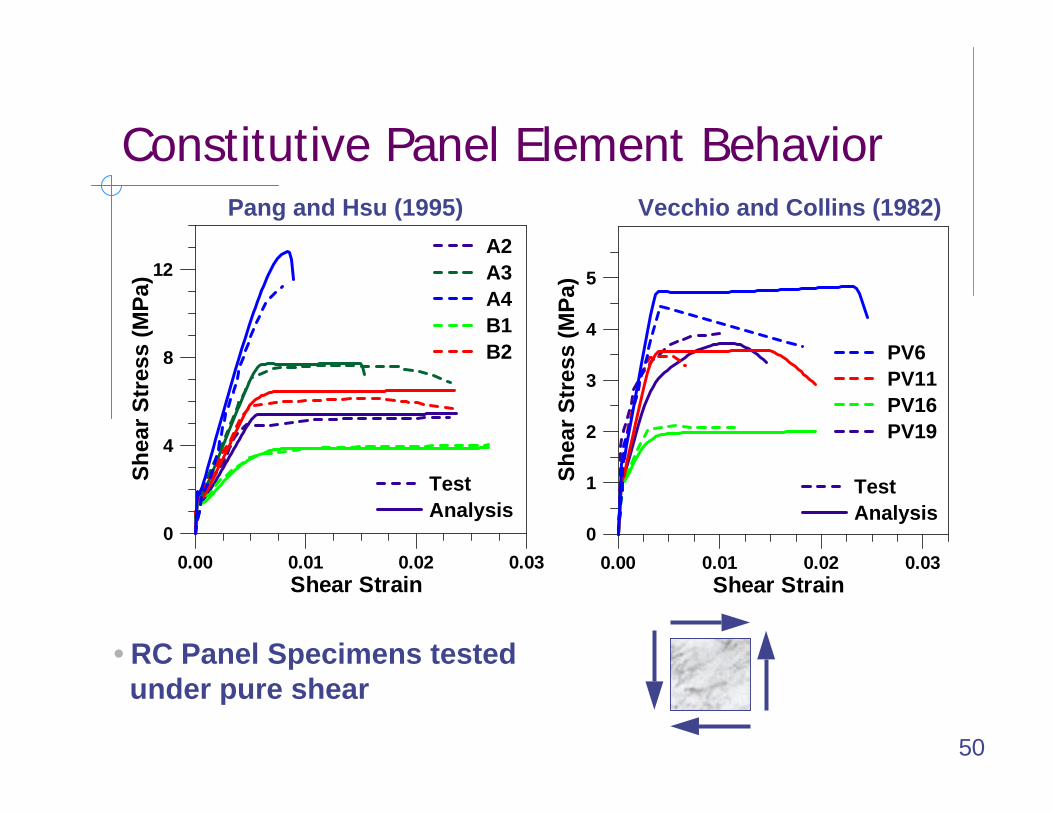
Constitutive Panel Element Behavior
0.00 0.01 0.02 0.03Shear Strain
0
4
8
12
Shea
r Str
ess
(MPa
)
A2A3A4B1B2
TestAnalysis
0.00 0.01 0.02 0.03Shear Strain
0
1
2
3
4
5
Shea
r Str
ess
(MPa
)
PV6PV11PV16PV19
TestAnalysis
Pang and Hsu (1995) Vecchio and Collins (1982)
• RC Panel Specimens tested under pure shear
51
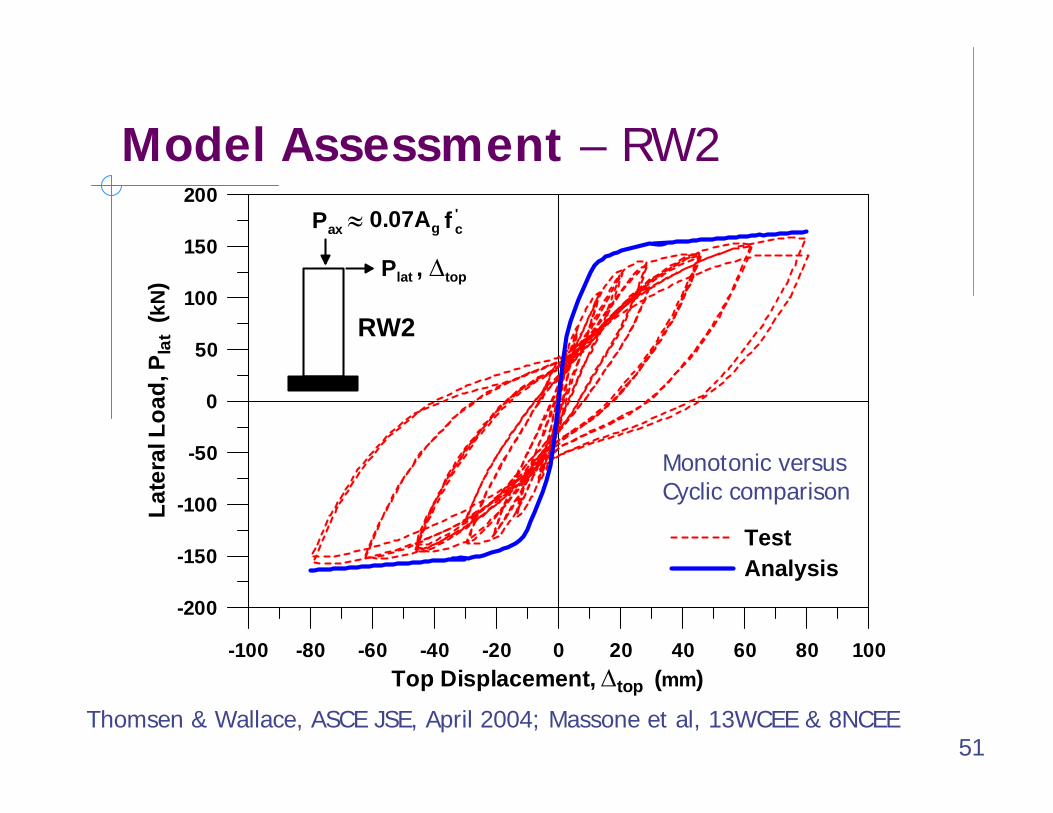
Model Assessment – RW2
-100 -80 -60 -40 -20 0 20 40 60 80 100Top Displacement, ∆top (mm)
-200
-150
-100
-50
0
50
100
150
200
Late
ral L
oad,
Pla
t (k
N)
TestAnalysis
≈Pax 0.07Ag f c'
Plat , ∆top
RW2
Thomsen & Wallace, ASCE JSE, April 2004; Massone et al, 13WCEE & 8NCEE
Monotonic versusCyclic comparison
52
-6 -4 -2 0 2 4 6Lateral Shear Displacement (mm)
-200
-150
-100
-50
0
50
100
150
200
()
TestAnalysis
-20 -15 -10 -5 0 5 10 15 20Lateral Flexural Displacement (mm)
-200
-150
-100
-50
0
50
100
150
200
Late
ral L
oad
(kN
)
TestAnalysis
Uf
P P Us
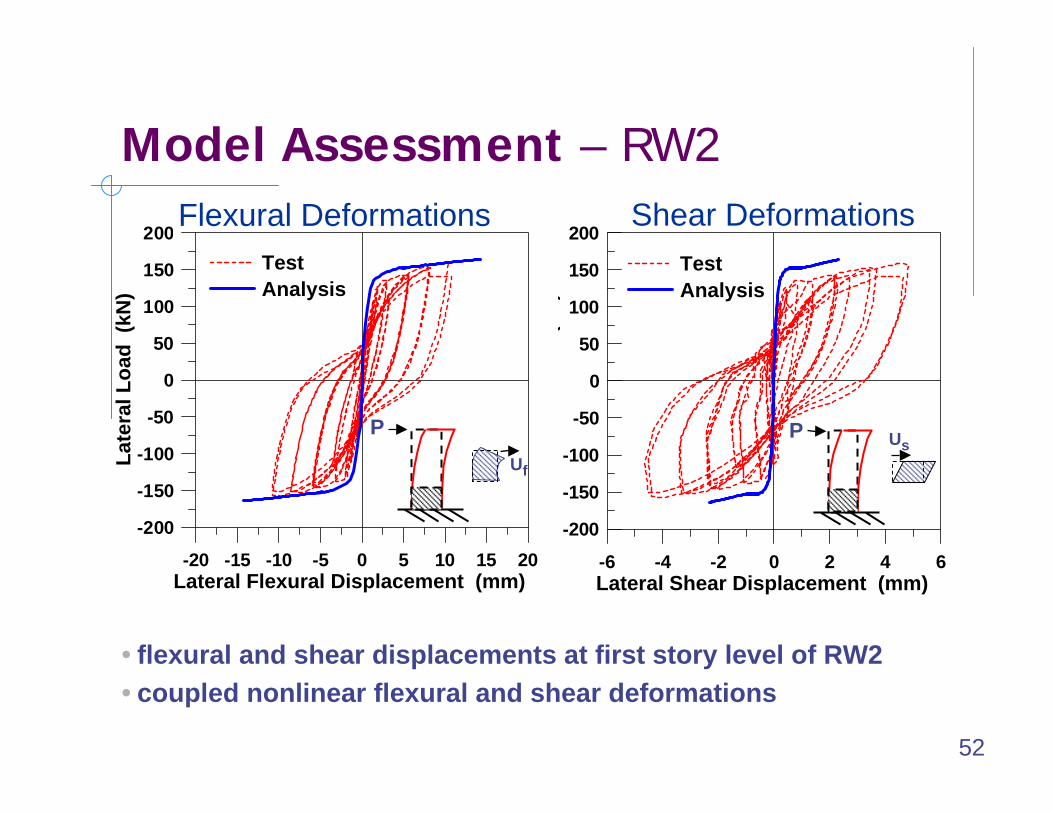
• flexural and shear displacements at first story level of RW2• coupled nonlinear flexural and shear deformations
Model Assessment – RW2Flexural Deformations Shear Deformations
53
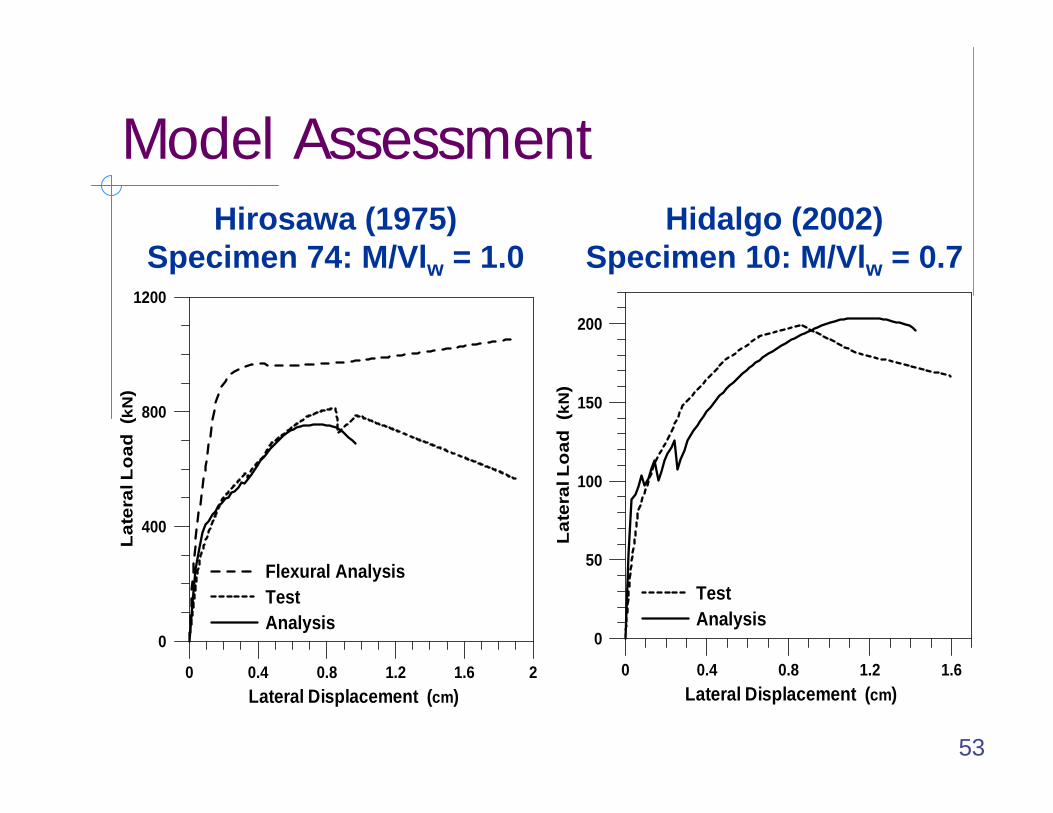
Model Assessment
0 0.4 0.8 1.2 1.6 2Lateral Displacement (cm)
0
400
800
1200
Lat
eral
Lo
ad (
kN)
Flexural AnalysisTestAnalysis
Hirosawa (1975)Specimen 74: M/Vlw = 1.0
0 0.4 0.8 1.2 1.6Lateral Displacement (cm)
0
50
100
150
200
Lat
eral
Lo
ad (
kN)
TestAnalysis
Hidalgo (2002)Specimen 10: M/Vlw = 0.7

54
Presentation Overview
Flexure
Shear
P-M-V Interaction & Modeling
Preliminary Test Results
55
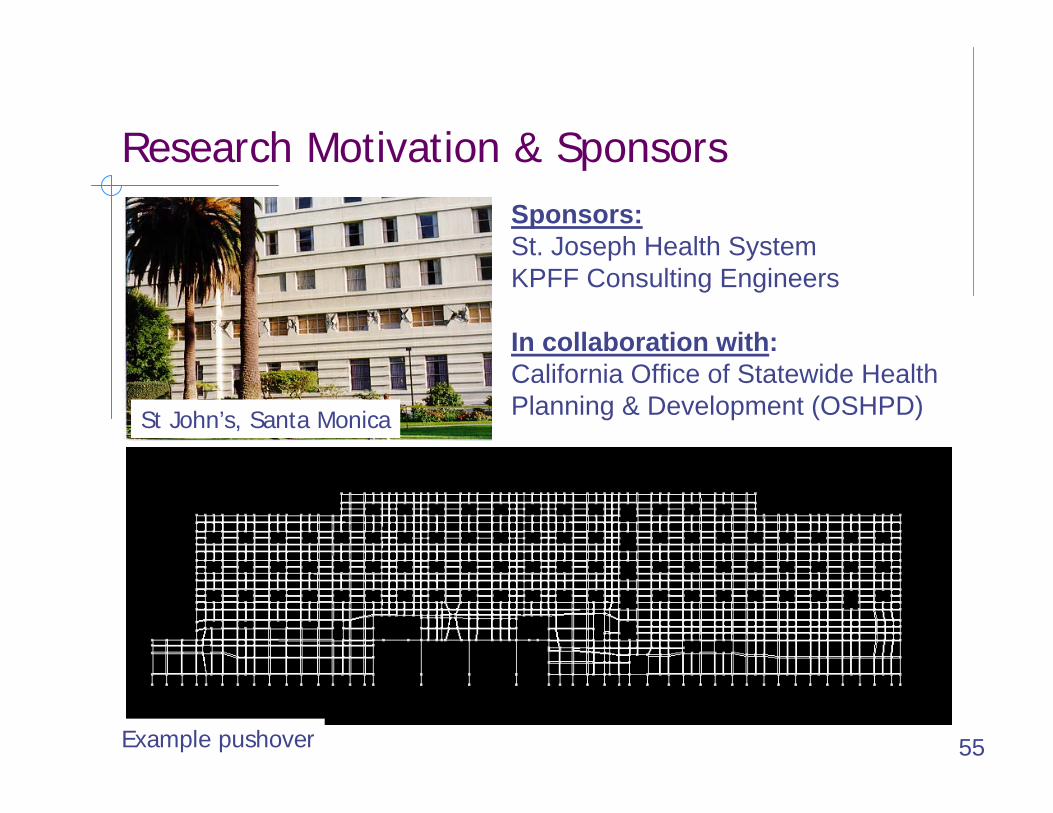
Research Motivation & Sponsors
St John’s, Santa Monica
Example pushover
Sponsors:St. Joseph Health SystemKPFF Consulting Engineers
In collaboration with:California Office of Statewide Health Planning & Development (OSHPD)
56
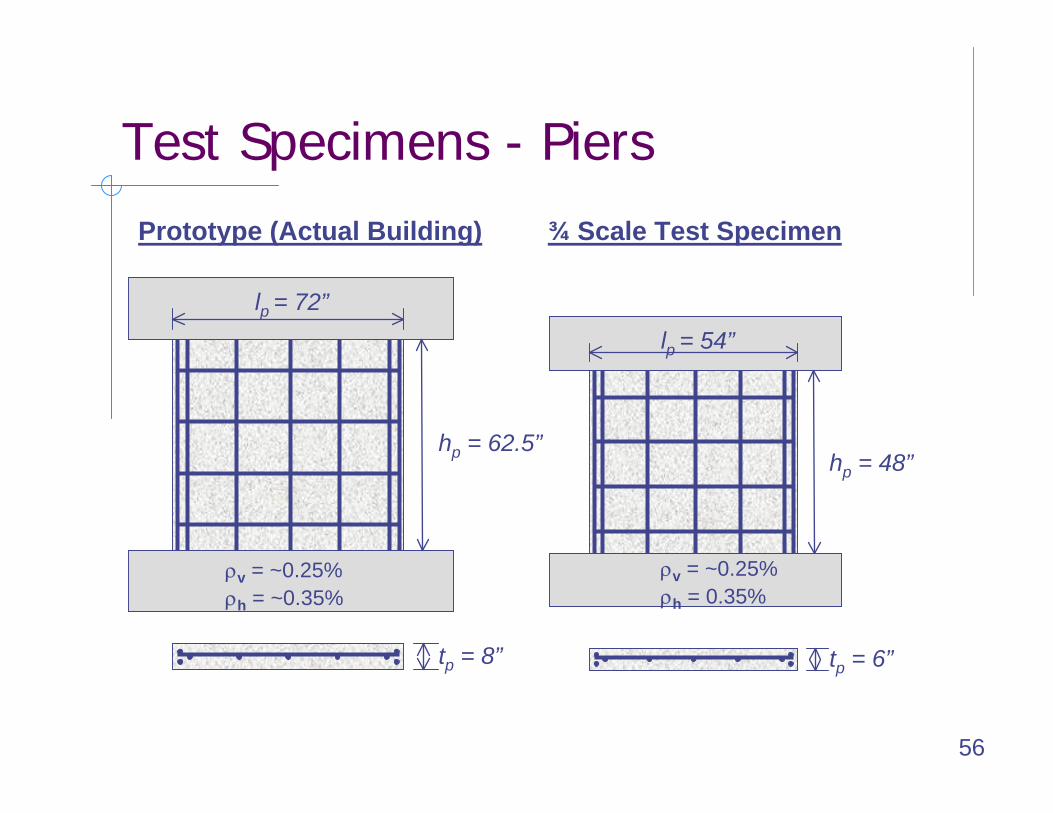
Test Specimens - Piers
hp = 62.5”
lp = 72”
tp = 8”
ρv = ~0.25%ρh = ~0.35%
Prototype (Actual Building)
hp = 48”
lp = 54”
tp = 6”
ρv = ~0.25%ρh = 0.35%
¾ Scale Test Specimen
57
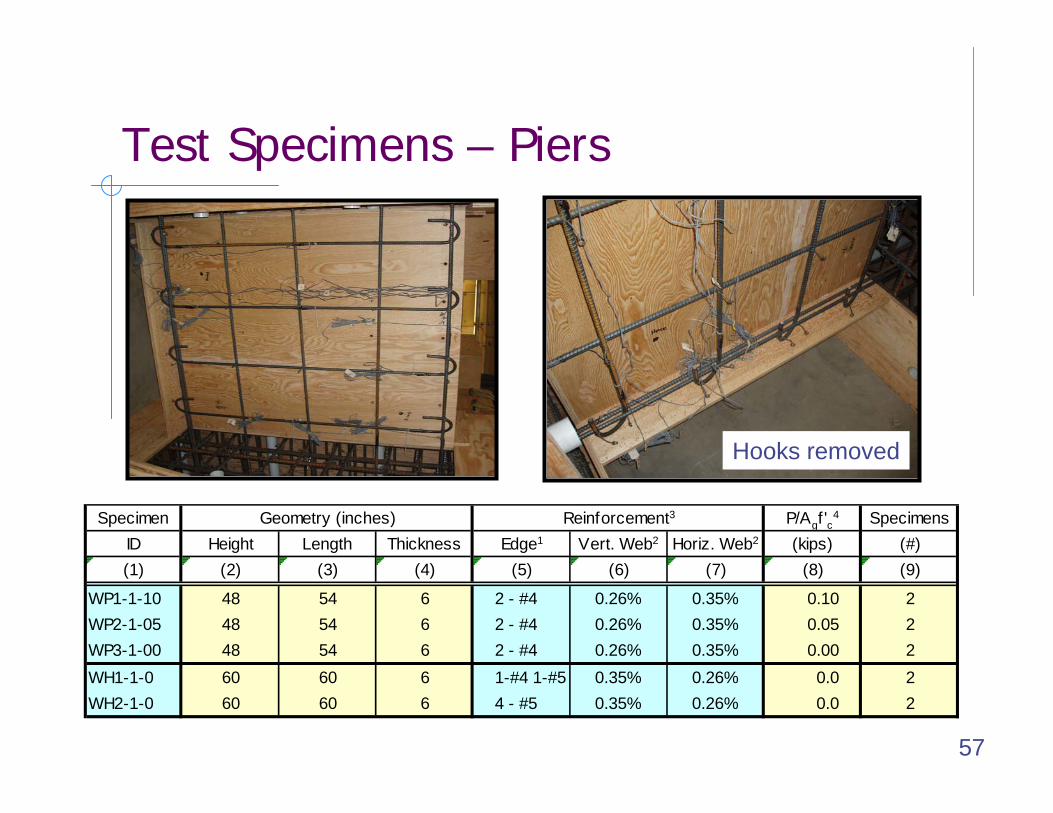
Test Specimens – Piers
Specimen Geometry (inches) Reinforcement3 P/Agf 'c4 SpecimensID Height Length Thickness Edge1 Vert. Web2 Horiz. Web2 (kips) (#)(1) (2) (3) (4) (5) (6) (7) (8) (9)
WP1-1-10 48 54 6 2 - #4 0.26% 0.35% 0.10 2WP2-1-05 48 54 6 2 - #4 0.26% 0.35% 0.05 2WP3-1-00 48 54 6 2 - #4 0.26% 0.35% 0.00 2WH1-1-0 60 60 6 1-#4 1-#5 0.35% 0.26% 0.0 2WH2-1-0 60 60 6 4 - #5 0.35% 0.26% 0.0 2
Hooks removed
58
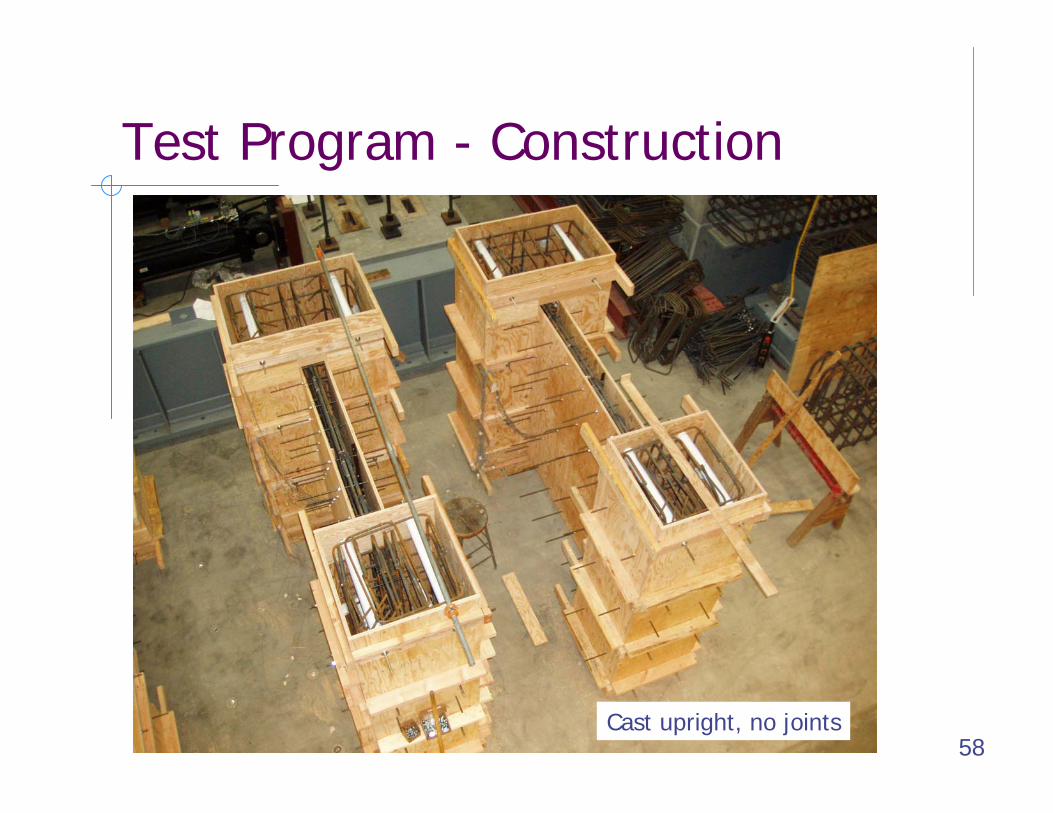
Test Program - Construction
Cast upright, no joints
59
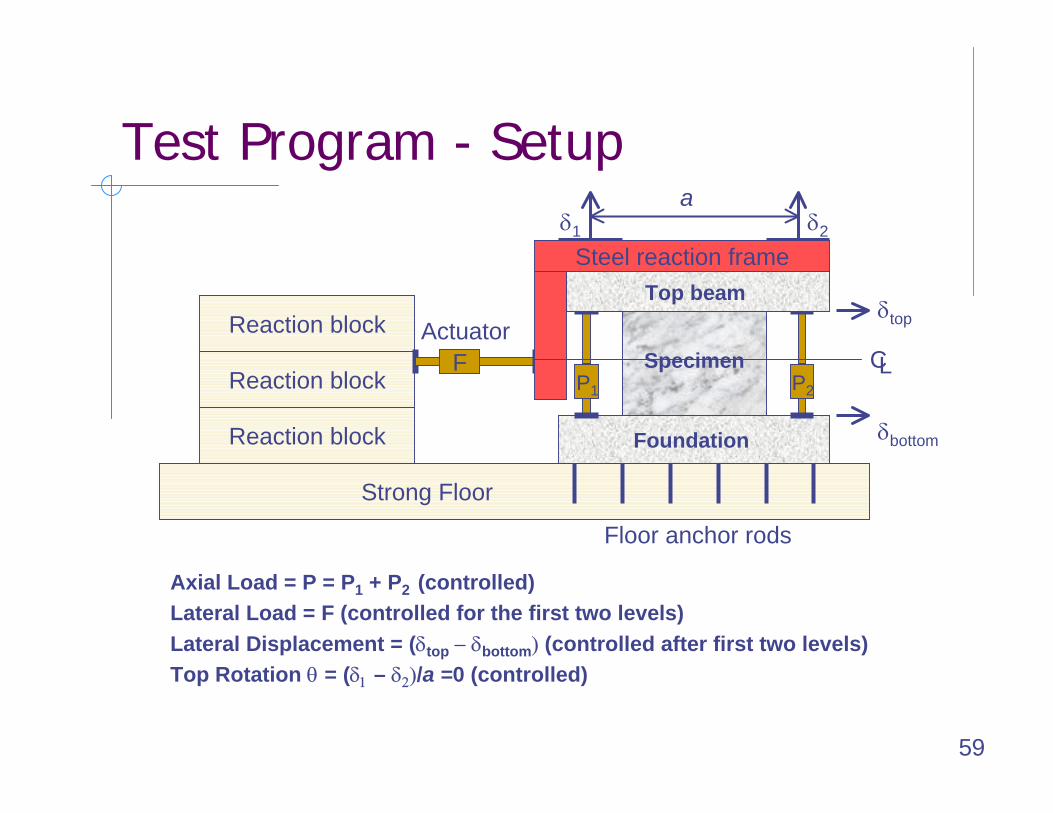
Test Program - Setup
Axial Load = P = P1 + P2 (controlled)Lateral Load = F (controlled for the first two levels)Lateral Displacement = (δtop − δbottom) (controlled after first two levels)Top Rotation θ = (δ1 – δ2)/a =0 (controlled)
Strong Floor
Reaction block
Reaction block
Reaction blockSpecimen
Foundation
Floor anchor rods
Steel reaction frame
FActuator
P1 P2
CL
δtopTop beam
δ1 δ2
a
δbottom
60
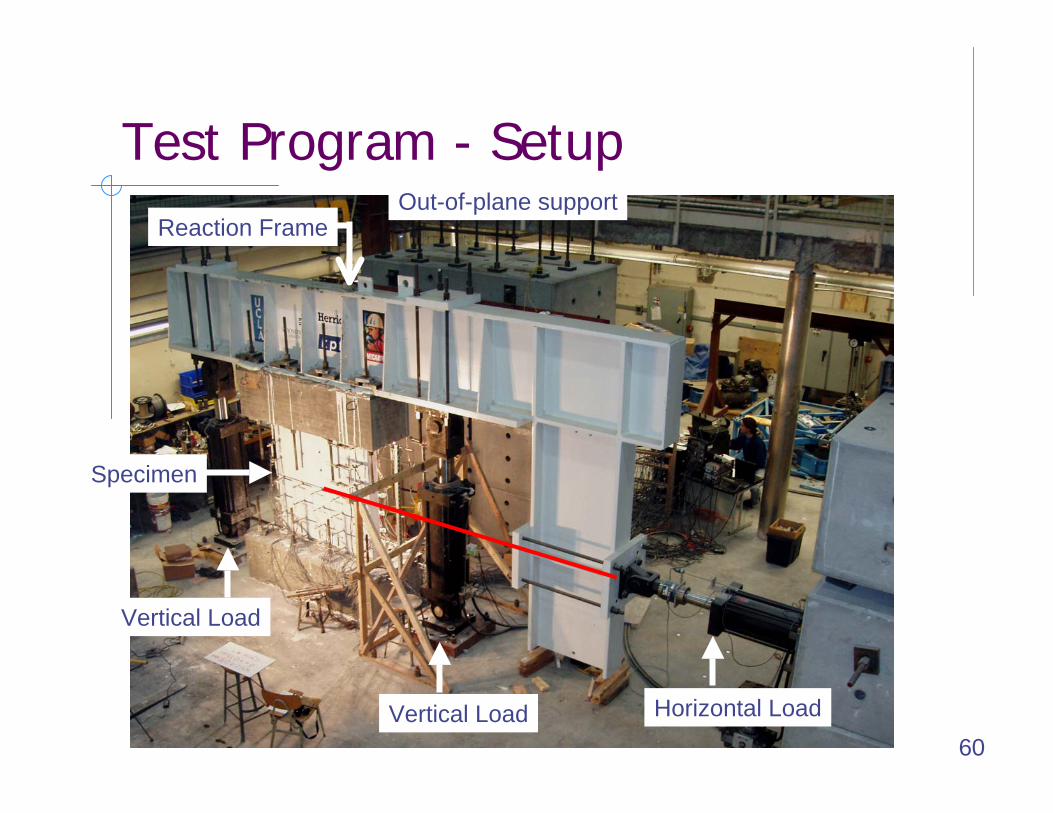
Test Program - Setup
Horizontal LoadVertical Load
Vertical Load
Reaction FrameOut-of-plane support
Specimen
61
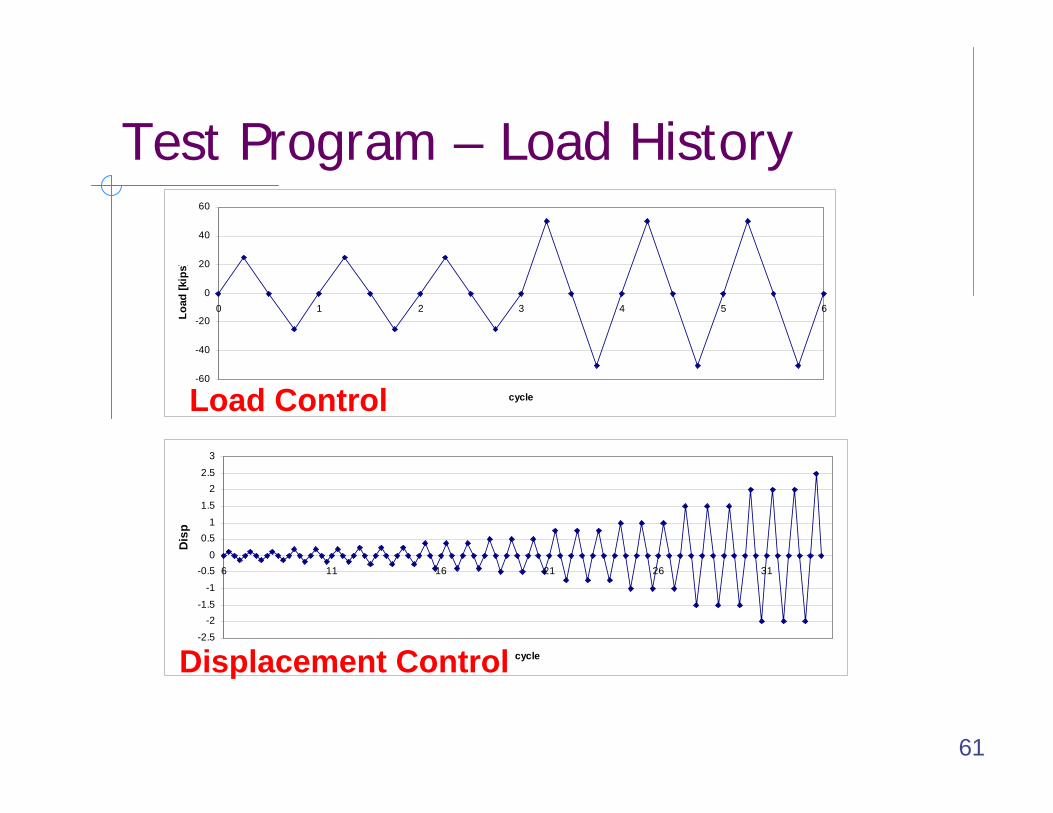
Test Program – Load History
-60
-40
-20
0
20
40
60
0 1 2 3 4 5 6
cycle
Load
[kip
s]
-2.5-2
-1.5-1
-0.50
0.51
1.52
2.5
3
6 11 16 21 26 31
cycle
Dis
p
Load Control
Displacement Control
62
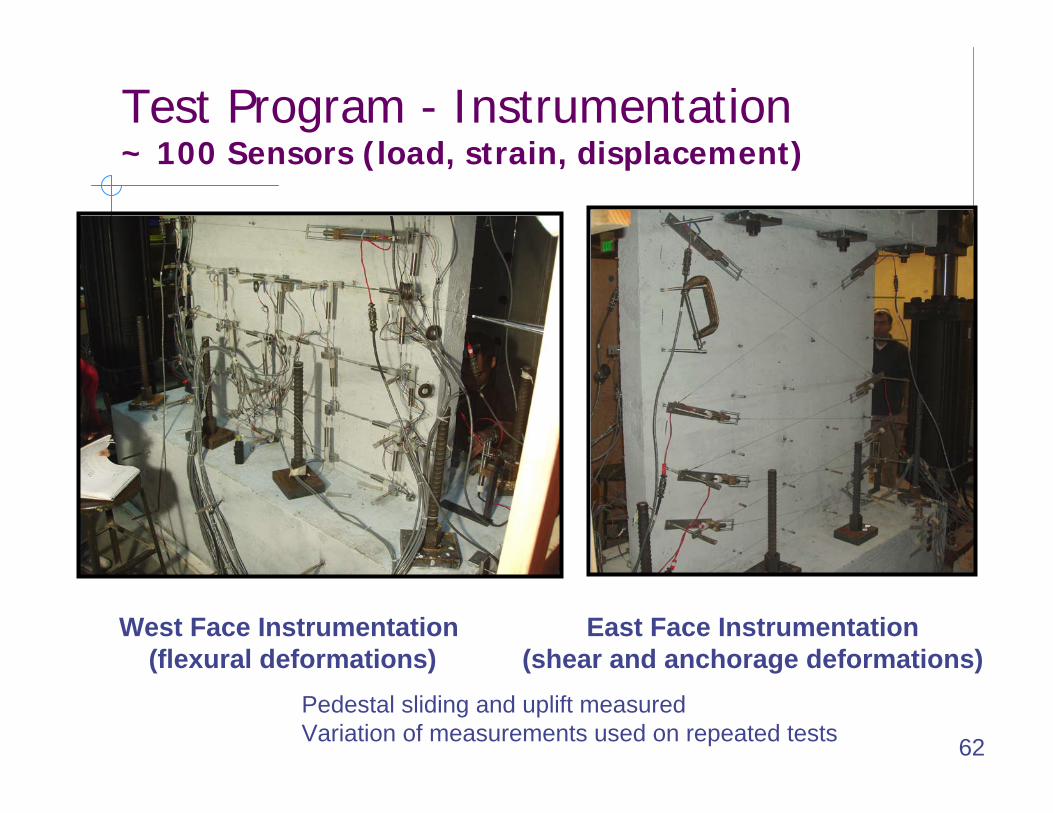
Test Program - Instrumentation~ 100 Sensors (load, strain, displacement)
West Face Instrumentation (flexural deformations)
East Face Instrumentation(shear and anchorage deformations)
Pedestal sliding and uplift measuredVariation of measurements used on repeated tests
63
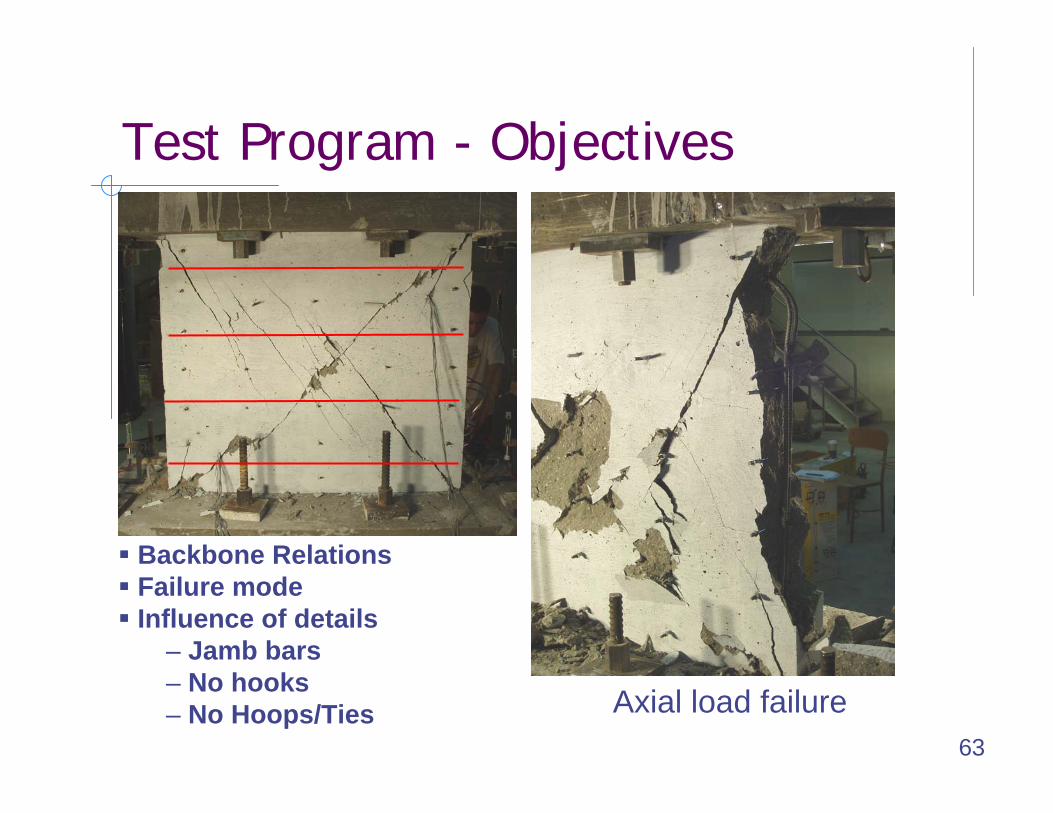
Test Program - Objectives
Backbone RelationsFailure modeInfluence of details
– Jamb bars– No hooks– No Hoops/Ties Axial load failure
64
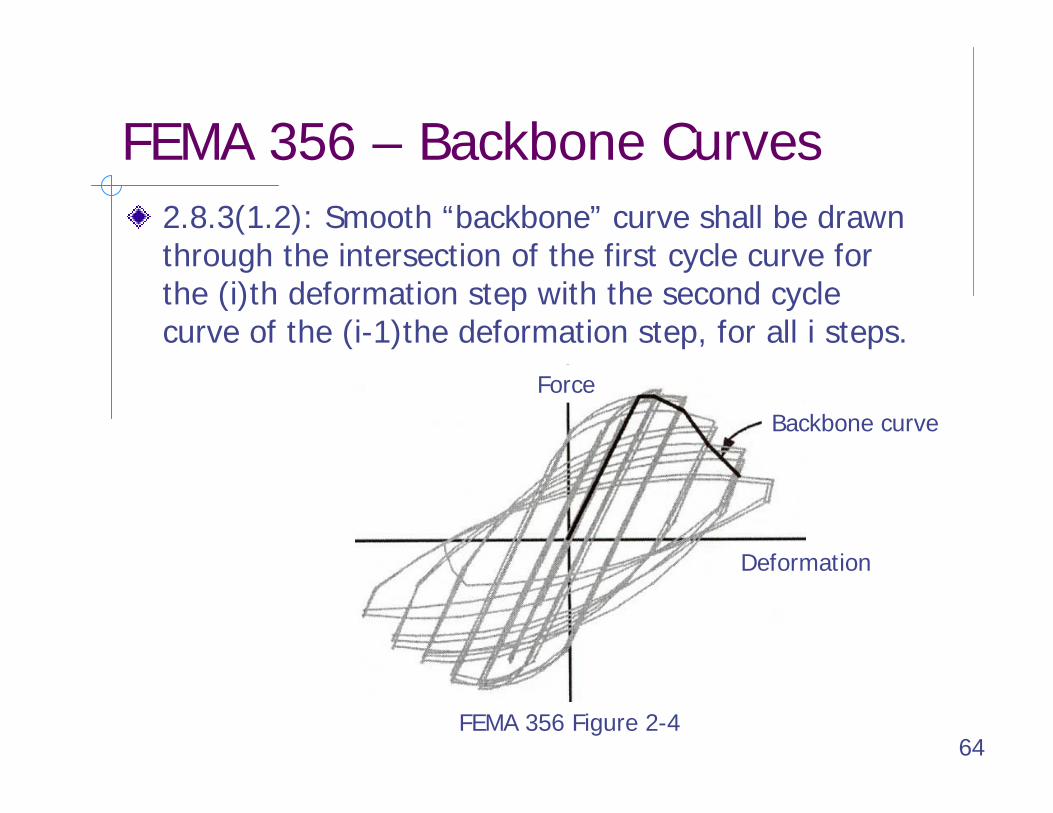
FEMA 356 – Backbone Curves2.8.3(1.2): Smooth “backbone” curve shall be drawn through the intersection of the first cycle curve for the (i)th deformation step with the second cycle curve of the (i-1)the deformation step, for all i steps.
Force
Deformation
Backbone curve
FEMA 356 Figure 2-4
65
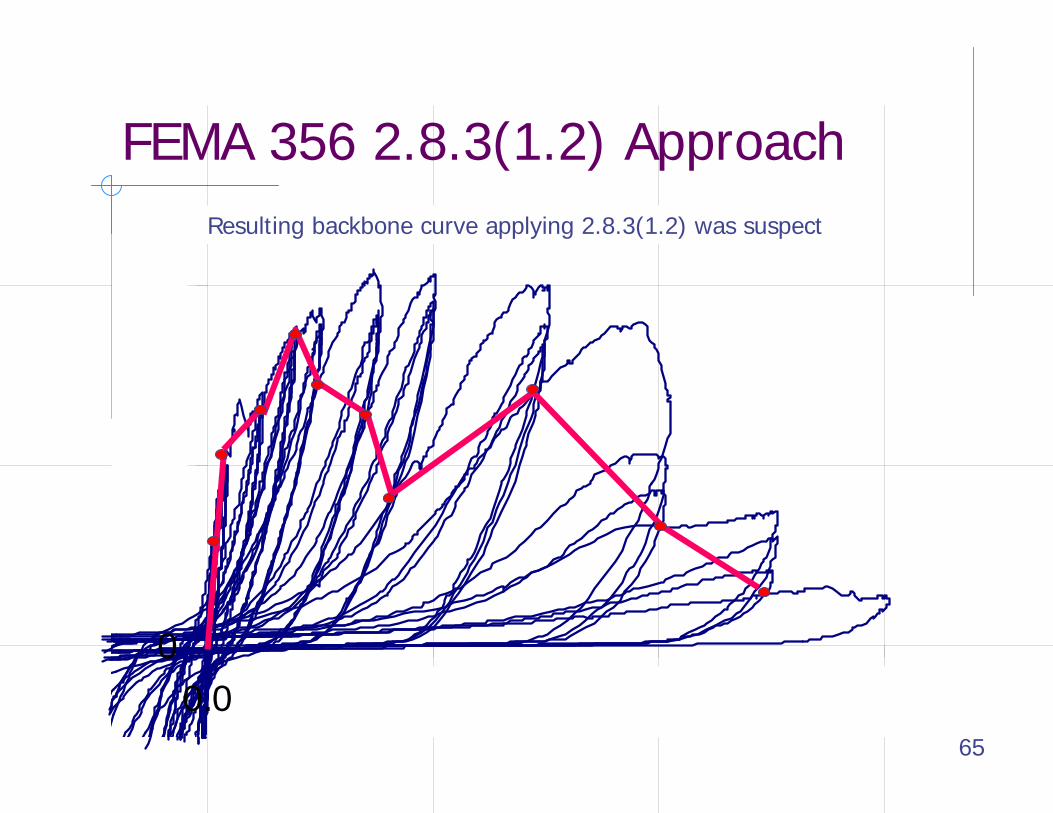
FEMA 356 2.8.3(1.2) Approach
0
50
100
0.0 0.5 1.0 1.5
Resulting backbone curve applying 2.8.3(1.2) was suspect
66
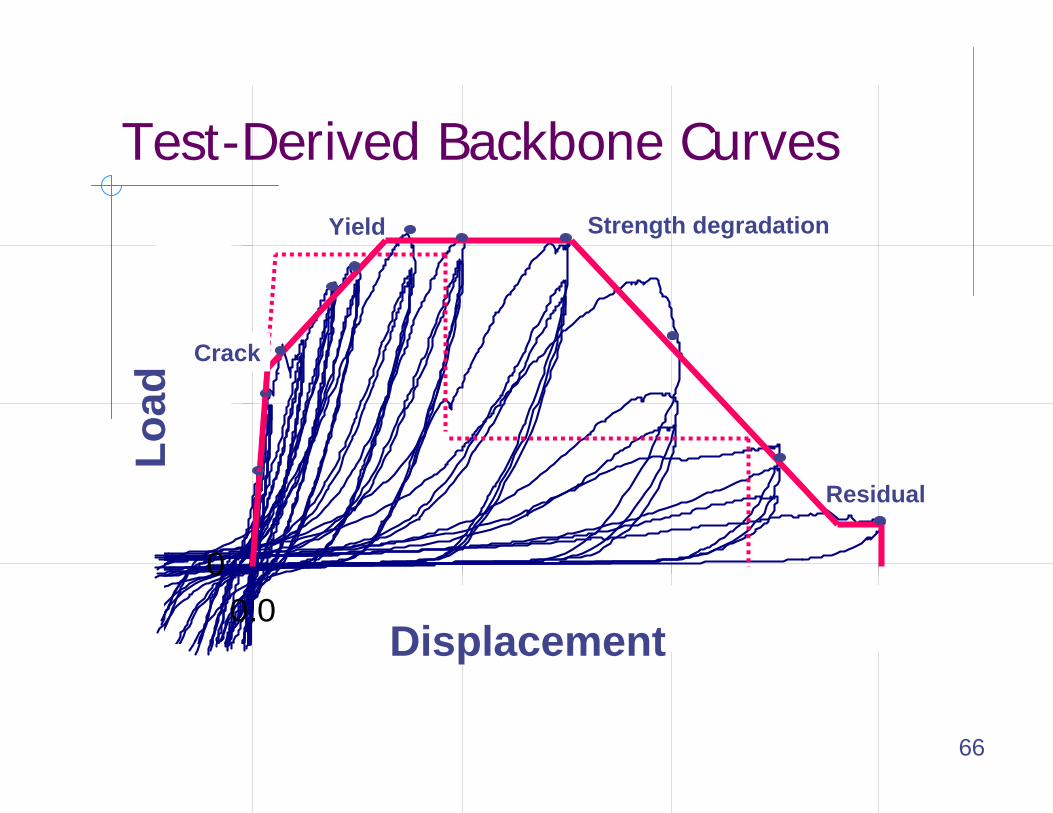
Test-Derived Backbone Curves
0
50
100
0.0 0.5 1.0 1.5
Yield Strength degradation
Residual
Crack
Load
Displacement
67
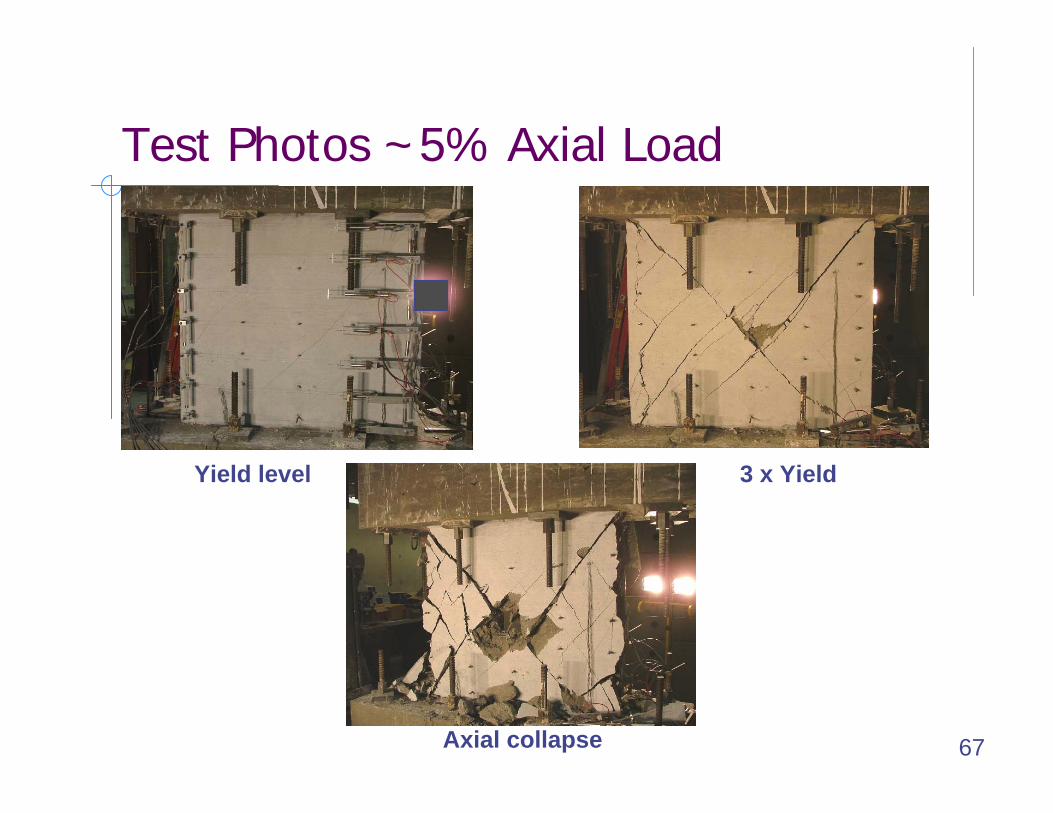
Test Photos ~5% Axial Load
Axial collapse
Yield level 3 x Yield
68
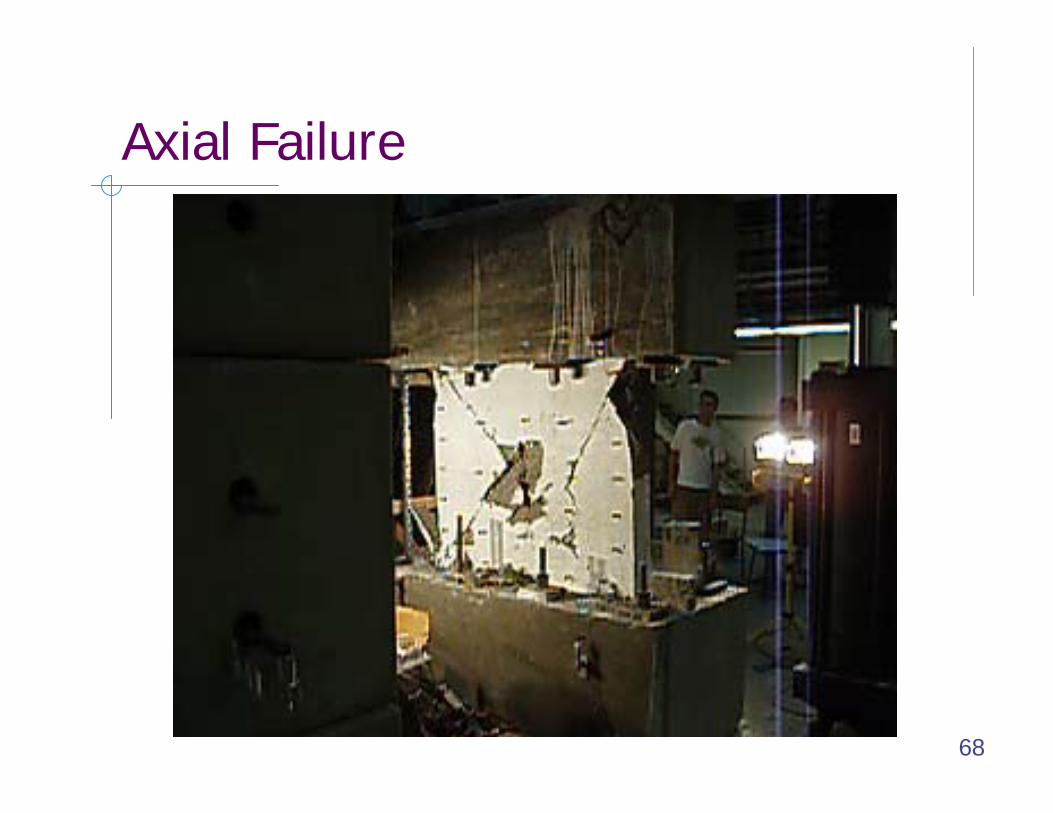
Axial Failure
69
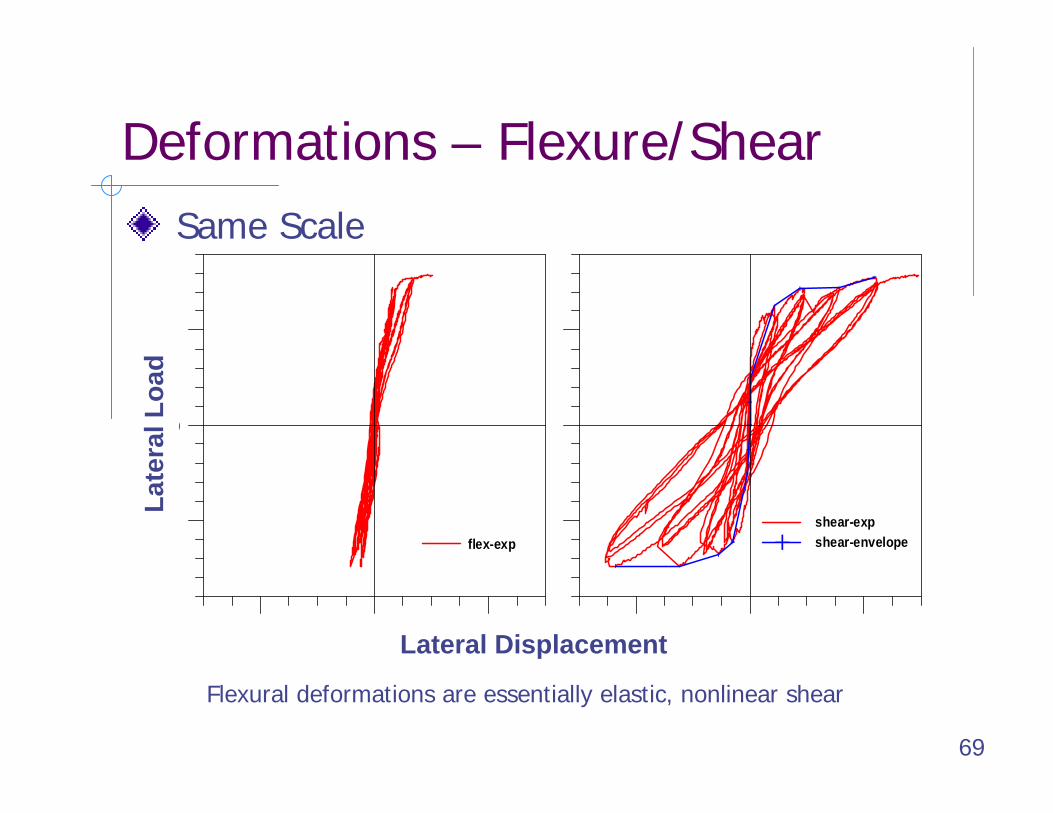
Deformations – Flexure/ShearSame Scale
0
0
0
flex-expshear-expshear-envelope
Late
ral L
oad
Lateral Displacement
Flexural deformations are essentially elastic, nonlinear shear
70
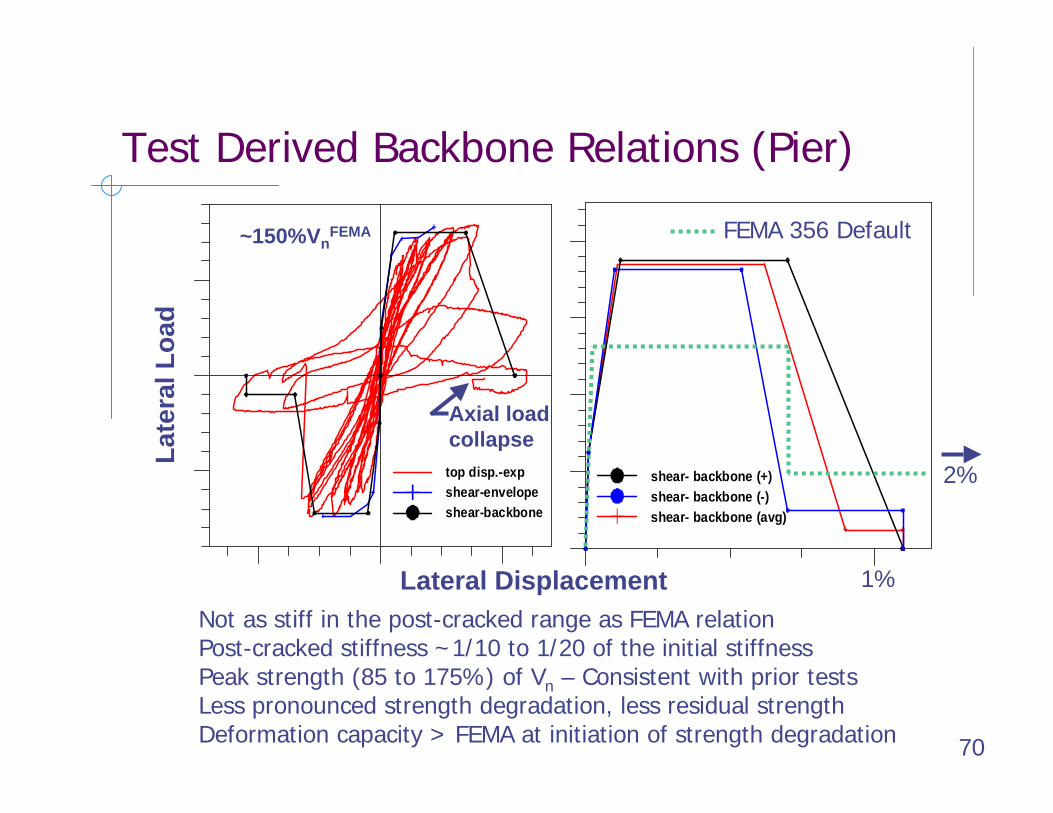
Test Derived Backbone Relations (Pier)
top disp.-expshear-envelope shear-backbone
shear- backbone (+) shear- backbone (-) shear- backbone (avg)
~150%VnFEMA
Late
ral L
oad
Lateral Displacement 1%
2%
FEMA 356 Default
Not as stiff in the post-cracked range as FEMA relationPost-cracked stiffness ~1/10 to 1/20 of the initial stiffnessPeak strength (85 to 175%) of Vn – Consistent with prior testsLess pronounced strength degradation, less residual strengthDeformation capacity > FEMA at initiation of strength degradation
Axial loadcollapse
71
Additional ReferencesGreifenhagen, H.; Lestuzzi, P, “Static cyclic tests on lightly reinforced concrete shear walls”, Engineering Structures, vol. 27, pp. 1703-1712, Sept. 2005Palermo, D.; Vecchio, F.J. , ”Compression field modeling of reinforced concrete subjected to reversed loading: verification,” ACI Structural Journal. Vol. 101, no. 2, pp. 155-164. Mar.-Apr. 2004.Hidalgo, Pedro A.; Ledezma, Christian A.; Jordan, Rodrigo M., “Seismic behavior of squat reinforced concrete shear walls ,” Earthquake Spectra. Vol. 18, no. 2, pp. 287-308. May 2002.Hwang, Shyh-Jiann; et al., “Analytical model for predicting shear strength of squat walls,” Journal of Structural Engineering. Vol. 127, no. 1, pp. 43-50. Jan. 2001.Petrangeli, Marco, “Fiber element for cyclic bending and shear of RC structures, II: Verification,” Journal of Engineering Mechanics. Vol. 125, no. 9, pp. 1002-1009., Sept. 1999.Salonikios, Thomas N.; et al., “Cyclic load behavior of low-slenderness reinforced concrete walls: Design basis and test results,” ACI Structural Journal. Vol. 96, no. 4, pp. 649-660. July-Aug. 1999.Salonikios, Thomas N.; et al., “Cyclic load behavior of low-slenderness reinforced concrete walls: Failure Modes, Strength and Deformation Analysis, and design Implications,” ACI Structural Journal. Vol. 97, no. 1 , pp. 132-142. Jan.-Feb. 2000.Kappos, A. J.; Salonikios, T. N., “Premature sliding shear failure in squat shear walls: fact or myth?” Proceedings of the Second Japan-UK Workshop on Implications of Recent, Earthquakes on Seismic Risk; pp. 169-180. 1998.Saatcioglu, M.; Wiradinata, S., “The effect of aspect ratio on seismic resistance of squat shear walls,” Proceedings of the 8th European Conference on Earthquake Engineering; pp. 7.3/17-23. 1986.Wiradinata, Sanusi, “Behaviour of squat walls subjected to load reversals,” Dept. of Civil Engineering, University of Toronto, 1985. 171 pp.Paulay, T.; Priestley, M. J. N.; Synge, A. J., “Ductility in earthquake resisting squat shearwalls,” Journal of the American Concrete Institute. Vol. 79, no. 4, pp. 257-269. July-Aug. 1982Lefas, et al., “Behavior of RC Structural Walls: Strength, Deformation Characteristics, and Failure Mechanism, ACI Structural Journal, 87(1), pp. 23 – 31, Jan – Feb 1990. Saatcioglu, M., “Hysteretic Shear Response of Low-Rise Walls,” Concrete Shear in Earthquake, Elsevier Applied Science, New York, New York, pp. 105-114.
Bold, underlined: Test results presented